Embed Size (px)
Citation preview

INSTITUTIONEN FÖR BIOLOGI OCH MILJÖVETENSKAP
THE CONTEXTUAL IMPORTANCE FOR ECOSYSTEM SERVICES AND ITS CONTRIBUTIONS TO WELLBEING A case study of urbanising coastal areas in Karnataka, India
Linnéa Bergdahl Uppsats för avläggande av naturvetenskaplig masterexamen med huvudområdet miljövetenskap 2016, 30 hp Avancerad nivå


Table of Contents Summary .................................................................................................................................... 3
Sammanfattning ......................................................................................................................... 4
1 Introduction ......................................................................................................................... 5
1.1 Aims, objectives and limitations ................................................................................. 6
2. Theoretical framework ........................................................................................................ 7
2.1 The place-based approach ........................................................................................... 7
2.2 The cascade model ...................................................................................................... 8
2.3 Wellbeing ..................................................................................................................... 9
2.4 Classification of ecosystem services ......................................................................... 10
3. Material and methods ........................................................................................................ 12
3.1 Study site description ................................................................................................. 12
3.2 Selection of study sites .............................................................................................. 15
3.3 Considerations of ethics and biases ........................................................................... 15
3.4 Data collection ........................................................................................................... 16
3.4.1 Direct observations ............................................................................................. 16
3.4.2 Focus group discussions ..................................................................................... 16
3.4.3 Interviews ........................................................................................................... 17
3.4.4 Structured household interviews ........................................................................ 17
3.5 Data analysis .............................................................................................................. 18
3.6 Development of categories for quantitative data collection ...................................... 19
3.6.1 Connected ecosystem services ........................................................................... 19
3.6.2 Constituents of wellbeing ................................................................................... 20
4. Results ............................................................................................................................... 22
4.1 Identification and description of connected ecosystem services ............................... 22
4.2 Use of ecosystem services ......................................................................................... 26
4.3 Acts of mobilisation and valuation ............................................................................ 29
4.4 Changes in supply and use of services over time ...................................................... 31
4.5 Importance of services for wellbeing ........................................................................ 33
4.6 Contributions to the constituents of wellbeing .......................................................... 35

2
5. Discussion ......................................................................................................................... 39
6. Conclusions ....................................................................................................................... 45
Acknowledgement .................................................................................................................... 46
References ................................................................................................................................ 47
Appendix A .............................................................................................................................. 52
Appendix B .............................................................................................................................. 53
Appendix C .............................................................................................................................. 54
Appendix D .............................................................................................................................. 57
Appendix E ............................................................................................................................... 59
3
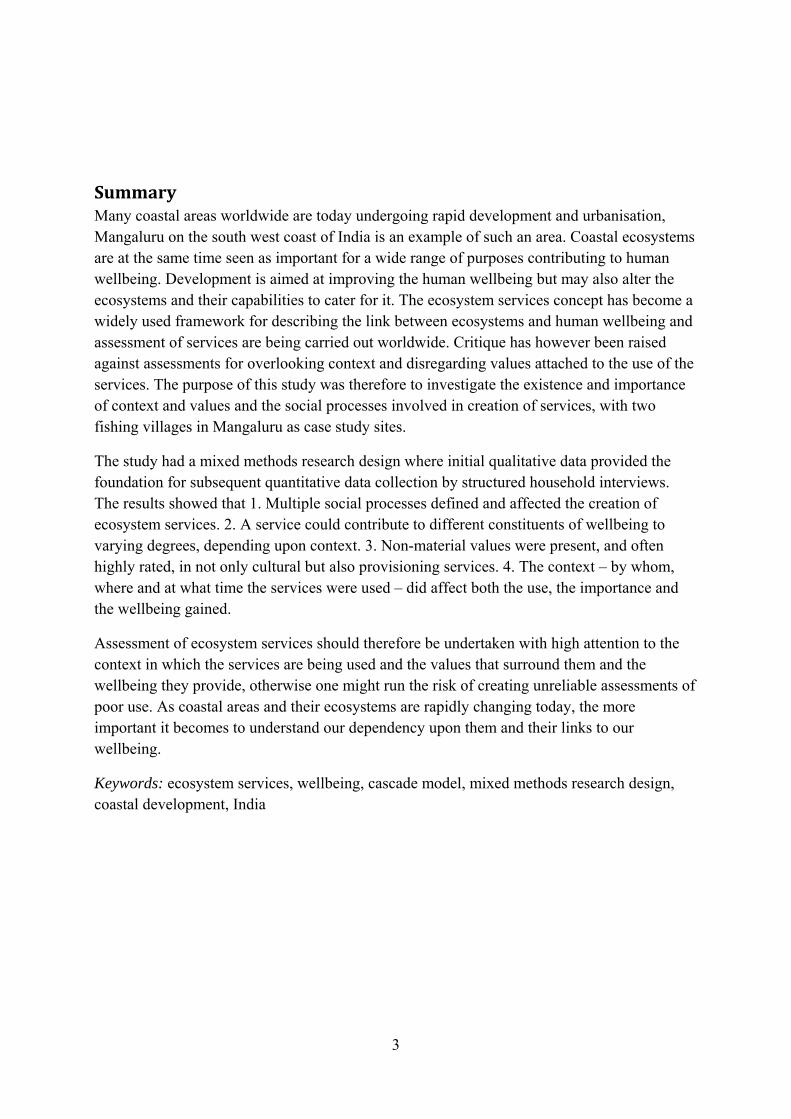
Summary Many coastal areas worldwide are today undergoing rapid development and urbanisation, Mangaluru on the south west coast of India is an example of such an area. Coastal ecosystems are at the same time seen as important for a wide range of purposes contributing to human wellbeing. Development is aimed at improving the human wellbeing but may also alter the ecosystems and their capabilities to cater for it. The ecosystem services concept has become a widely used framework for describing the link between ecosystems and human wellbeing and assessment of services are being carried out worldwide. Critique has however been raised against assessments for overlooking context and disregarding values attached to the use of the services. The purpose of this study was therefore to investigate the existence and importance of context and values and the social processes involved in creation of services, with two fishing villages in Mangaluru as case study sites.
The study had a mixed methods research design where initial qualitative data provided the foundation for subsequent quantitative data collection by structured household interviews. The results showed that 1. Multiple social processes defined and affected the creation of ecosystem services. 2. A service could contribute to different constituents of wellbeing to varying degrees, depending upon context. 3. Non-material values were present, and often highly rated, in not only cultural but also provisioning services. 4. The context – by whom, where and at what time the services were used – did affect both the use, the importance and the wellbeing gained.
Assessment of ecosystem services should therefore be undertaken with high attention to the context in which the services are being used and the values that surround them and the wellbeing they provide, otherwise one might run the risk of creating unreliable assessments of poor use. As coastal areas and their ecosystems are rapidly changing today, the more important it becomes to understand our dependency upon them and their links to our wellbeing.
Keywords: ecosystem services, wellbeing, cascade model, mixed methods research design, coastal development, India

4
Sammanfattning Många kustområden runt om i världen genomgår idag snabba förändringar vad gäller utveckling och urbanisering. Mangaluru på Indiens sydvästkust är ett exempel på ett sådant område. De kustnära ekosystemen ses samtidigt fylla en rad viktiga funktioner när gäller att bidra till det mänskliga välbefinnandet. Målsättningen med utveckling är förbättra välmåendet för människor, men den kan också förändra ekosystemen och deras förmåga att tillgodose välmåendet. Ekosystemtjänster har blivit ett populärt koncept för att beskriva kopplingen mellan ekosystemen och det mänskliga välmåendet, och idag utförs ekosystemtjänstanalyser världen över. Dock har en viss kritik lyfts fram mot att analyserna förbiser kontexten samt de värden som är knutna till användningen av tjänsterna. Syftet med denna rapport var därför att undersöka förekomsten och vikten av kontexten, värderingar samt de sociala processerna som finns med när ekosystemtjänster skapas. Till detta syfte användes två fiskebyar i Mangaluru som studieplatser.
Studien bygger på en så kallad “mixed methods research” där kvalitativ data först samlades in och analyserades för att sedan utgöra grunden till den efterföljande kvntitativa datainsamlingen genom intervjuenkäter. Resultaten visade att 1. Multipla social processer definerar och påverkar skapandet av ekosystemtjänster. 2. En tjänst kan bidra till olika komponenter av välmåendet, i varierad utsträckning, och beror av kontexten. 4. Kontexten – av vem, var samt vid vilken tidspunkt – påverkade både användningen, vikten samt välmåendet som tjänsterna bidrog till.
Analys och utvärdering av ekosystemtjänster bör därför göras med största möjliga uppmärksamhet på kontexten inom vilken tjänsterna används samt påde värderingarna som omger dem.Sker inte detta löper man risken att analyserna blir otillförlitliga och undermåliga. Eftersom kustområdena och deras ekosystem står under snabb förändring idag har det blivit extra viktigt att vi förstår vårt beroende av dem samt deras effekt på vårt välmående.

5
1 Introduction The development and utilization of coastal zones has increased substantially within recent decades. Today approximately half of the world’s population lives within 60 km of the sea and three out of four of all large cities are coastal (United Nations Environment Programme, 2016). Asia has some of the fastest growing urban areas today and will in the coming decades be the primary place for urban growth (Seto, et al., 2013). An example of a rapidly developing coastal area is the south west coast of India and the coastal city of Mangaluru. Mangaluru has experienced a rapid growth in population within recent years, with some of its villages increasing their population by over 100% within the last decade (Government of India, 2011). The city has today developed into an important port and industrial city harbouring several larger industries and one of the major ports of the country (Kuntoji & Rao, 2015). The area has a tradition of small-scale fishing and after substantial changes in the sector within the last half century it is today a major industry for the coastal districts (Gunakar, 2012). The Arabian Sea in the west and the mountains of the Western Ghats in the east frame the coastal area (Environmental Management & Policy Research Institute, 2012). Around Mangaluru the coastline is characterised by long, open sandy beaches, sand spits, rivers and estuaries (Kumar et al. 2010) lined by coconut gardens (Thukaram et al. 2014). The coastal zones of India are said to be of importance because of the high productivity of its ecosystems and the source of natural resources, but also as population and industrial centre, recreational spot and for remediation of waste and sewage effluents (Space Applications Centre (ISRO), 2012). Development is aimed at improving human wellbeing but may also alter the ecosystems so their capabilities to provide benefits for humans are changed (Ranganathan, et al., 2008). As the coastal landscape is continuously changing, due to both natural and anthropogenic forces, the conditions for using the ecosystems are also changed. We don’t know exactly how this change is going to affect the ecosystems and how this in turn will affect human wellbeing. An approach to highlight the importance of ecosystems for human wellbeing is the concept of ecosystem services. In the year of 2005 the Millennium Ecosystem Assessment (Millennium Ecosystem Assessment, 2005) was released and made ecosystem services a widely known concept. The report provided a typology for classification of ecosystem services, but is not the only report written on ecosystem services. Earlier publications include for example the works by Daily (1997), Costanza et al. (1997) and Groot et al. (2002), along with the more recent study on The Economics of Ecosystems and Biodiversity (TEEB, 2010). Within the last decade the number of publications on ecosystem services has increased exponentially (Fisher et al. 2009; Liquete, et al., 2013; Potschin & Haines-Young, 2011) and in 2012 the UN Intergovernmental Science-Policy Platform on Biodiversity and Ecosystem Services (IPBES) was established (IPBES, 2016). In the European Union member states are required to assess their ecosystem services in accordance to the Action 5 of the Biodiversity Strategy (European Commission, 2014). The ecosystem services concept has been used with the intention to provide support in development of policies and land, resource or conservation management (Seppelt et al. 2011) but also for communication, awareness raising and education (Luck et al. 2012). It has also enabled nature to be valued in monetary terms and thereby included within the commercial market to allow its services to be recognised and fully accounted for (Costanza et al. 1997). Overall, the ecosystem services concept can be said to have contributed to a wider acknowledgement of ecological concerns in planning and management. The key message, that nature has a value, is something that can be easily understood by the general public and the concept has therefore been possible to apply and used in a wide range of contexts (Portman, 2013).

6
The acknowledgment of nature having a value for our human wellbeing is relatively well agreed upon, but exactly how nature’s values and services are to be defined, assessed and measured is still in debate today (Braat & Groot, 2012). The Millennium Ecosystem Assessment report provided a classification framework, which was followed by an academic discussion on how services should be defined (see for example Boyd & Banzhaf, 2007; Fisher et al. 2009; Fisher & Turner, 2008). The discussions have led to the development of many different frameworks (Lamarque et al. 2011), of which the cascade model of ecosystem service generation is one of the more recent (Haines-Young & Potschin, 2010; Spangenberg et al. 2014b). As of today, there is neither any universal, standardized method for ecosystem service assessment and valuation. Instead varying assessment methods and tools have been developed, from assessments of biophysical supplies to tools for modelling and geographical program applications (Bagstad et al. 2013; Potschin & Haines-Young, 2013). However, some of the critique raised against the assessment of ecosystem services in general is that it often disregards the non-material values (Chan et al. 2012a) assume a direct linear flow of services from ecosystems to beneficiaries (Spangenberg et al. 2014b) along with a poor understanding of the link between services and wellbeing (Abunge et al. 2013; Chan et al. 2012; Daw et al. 2011; Dawson & Martin, 2015) and tends to overlook the context, in which the services are created, used and valued (Potschin & Haines-Young, 2013). Ecosystem services connected to the coast include for example food, recreation, water purification and erosion control (Barbier, et al., 2011; Groot, et al., 2012; Martinez, et al., 2007). Groot, et al. (2012) for example estimated the monetary value of services provided by the coastal systems to be 28917 int.$/ha/year, and according to Martinez, et al. (2007) the monetary value of coastal services constitutes 77% of the world’s total ecosystem services value. Undoubtedly the marine and coastal ecosystems play an important role for the wellbeing of many people (Barbier, et al., 2011), at the same time as the expanding development and population increase continues to put an increased pressure on the coastal ecosystems and demand for its natural resources (Neumann et al. 2015). Agreed by most scientists today, the monetary estimations are not depicting the full value of the ecosystem services either due to the difficulties of capturing linked non-material values of social and cultural character in monetary terms. Research on coastal ecosystem services is more limited in comparison to terrestrial environments and according to the review by Liquete, et al., (2013) most of the, comparatively few, assessments of marine and coastal ecosystem services have been focused on only a few services whereas others have been largely overlooked. Additionally, most case study assessments have been undertaken on the coasts of Europe and North America.
1.1 Aims, objectives and limitations This study aimed to contribute to the on-going development of ecosystem service concepts and assessments with additional knowledge of the value and context dependent processes that surround the creation and use of ecosystem services and its contributions to wellbeing. It also aimed to provide a case-study of two fishing villages of Mangaluru; places located in a lesser studied geographical areas but with high relevance in a future of rapidly urbanising coastal areas. The purpose of the study was therefore to investigate if; 1. There is a non-linear flow from ecosystem functions to beneficiaries, 2. The links between service and wellbeing are multiple, 3. Context is important for ecosystem services and 4. Non-material values exist and matter. The purpose was to be fulfilled by following objectives: 1. Identify connected ecosystem services and constituents of wellbeing

7
2. Quantitatively analyse the differentiated use of services 3. Qualitatively analyse acts of mobilisation and valuation connected to the creation of services 4. Analyse changes in supply and use of services over time 5. Quantitatively analyse the differentiated importance of services for wellbeing 6. Investigate the importance of two services for their contributions to constituents of wellbeing The study was spatially limited to two fishing villages and its respective Mogaveera community (one of the communities inhabiting the coastal villages) These served as case-study sites and study populations. The intention was not to produce an assessment representative of ecosystem service use in the whole of coastal India. The intention was rather to provide a practical example of how, at one place, ecosystem services are created, used and linked to wellbeing. By limiting the case-study to a specific stakeholder group present at two different places, the study was be able to explore the context-specific characteristics in the use of ecosystem services within a group of same kinship, religion and culture, at two geographically closely located places that displays somewhat different biophysical conditions. The study identified connected ecosystem services to the study sites. Due to restrictions in time and resources, regulation services were recognised but not included in further investigations. The next section of the report, Theoretical framework, will provide a more detailed description of the theoretical frameworks that the study have been based upon. This will be followed by Material and methods in which the study site and methods for data collection and analysis are outlined. In the Results section, results corresponding to each objective will be presented. The report will be finalized with a discussion of the results, and a summary of the main findings in the Conclusions section.
2. Theoretical framework This study was based upon four theoretical frameworks. The place-based approach (Potschin & Haines-Young, 2013) provided the overall structure for the development and design of the ecosystem service assessment. Within the assessment the cascade model (Spangenberg et al. 2014b) was used as the framework for understanding the creation of the ecosystem services and identifying its connected processes. The wellbeing concept presented in the Millennium Ecosystem Assessment (2005) was used as a basis for further investigations of the links between services and wellbeing. For definition of ecosystem services and their categories the classification scheme of CICES (Haines-Young & Potschin, 2013) was used.
2.1 The place-based approach Ecosystem service assessment can be made in numerous ways. Potschin & Haines-Young (2013) describe three main approaches to assessments that they have identified in contemporary literature. The habitat-based approach includes assessments that are made mainly with a focus of stocks and supplies of ecosystem components. If the focus instead is set on the processes and functions of the ecosystems, often including some type of modelling tools, they are described as system-based assessments. In general these two approaches are more widely used whereas the third, the place-based approach, tends to be more easily overlooked according to the authors. A point of priority for the place-based approach is that context matters. An ecosystem service assessment with this approach tries to bring an

8
understanding of the context, of people and their values, and how they relate to the ecosystem services used. The advantages of the place-based approach, as stated in Potschin & Haines-Young (2013), are for example that it allows better understanding of local priorities and values and can be useful for investigating adequacy of supply of services. It can also be used in combination with any of the other two approaches. However by adapting the place based approach to an assessment it may be difficult to make measurements of services due to data deficiency at the local scale as well as generalise the results. The interdisciplinary environment of the assessment also pose its challenges and calls for different sets of skills and competences to be combined, which may make it time consuming.
2.2 The cascade model The idea of the service cascade was presented in the article by Haines-Young & Potschin (2010) with the purpose of bringing some clarity to the many ambiguous and sometimes contradictory, typologies and definitions of ecosystem functions, goods and services being used. The key point with the service cascade concept is that there is a cascade of intermediate stages from the ecological structures and processes created within the ecosystems, to the benefits that humans eventually derive from it, and that the two of them should not both be defined as services. Since then the concept has been developed further with an updated model described by Spangenberg et al. (2014b) (Figure 1).
Figure 1. Description of the cascade model, from Spangenberg et al. (2014b, p. 26). The multiple steps involved in the creation of ecosystem services are presented, from the beginning with ecosystem functions to benefits and commercialisation.
According to the cascade model, ecosystem services (ESS) are the outputs of ecosystems that have been recognised and valued as such by humans (Spangenberg et al. 2014). The ecosystem services originate from the ecosystem, within which biological structures and processes make up the ecosystem function (ESF), for example fish production in the sea. One ecosystem function does not automatically create a single, predetermined service, rather it

9
may have several different potentials of what it may be used for, called ecosystem service potentials (ESP). What determines the potentials of an ecosystem function is what the users, humans, find valuable (use value attribution). The service potential, ESP, though is not the same as the service, ESS. Just because fish production in the sea has the potential of fish for food use, it does not directly by itself turn into that ecosystem service. Acts of mobilisation, e.g. fishing and its related activities are needed before the fish can be used as food and thus be called an ecosystem service. Having the service available does not either mean a benefit has been gained unless an investment firstly is made to gain the use right, for example processing or cooking (service appropriation). By then the service can be turned into an ecosystem service benefit (ESB) with a contribution to wellbeing, defined by the values of the user. You might have fish available to eat but if you can’t cook it does not give you any benefits, and if you manage to cook it, the wellbeing gained from it is likely to be greater if you like the taste of fish. The final step of the cascade model is when the ESS is given away in exchange of money, commercialisation, instead of being kept by the appropriator. The service now has a monetary market price, and cash income is a benefit that can be gained from it. Humans can also gain benefits directly from the ecosystems without a need for mobilisation or appropriation. Such services are called public goods and involve for example sunshine. Lastly there are ecosystem functions that humans enjoy and gain benefits from, but not recognize, and those are not termed ecosystem services. In the description of the cascade model Spangenberg et al. (2014b) regard value as subjective, either derived from the individual, depending on time, group, location, or from normative criteria dependent upon culture, time and location. The ecosystem services are made available through acts of use value attribution and mobilisation, which are social processes, and the gained benefit is a result of a subjective value. Therefore, the authors argue, ecosystem services are social constructs, based on the physical ecosystem functions, and may change with time, location and group. The use value attribution which defines the potentials of the ecosystem functions depends upon what the particular individual or group, at the particular location, during certain circumstances finds valuable and useful. Likewise a function of the ecosystem cannot be turned into a service until someone identifies its value of use, even if the biophysical situation remains the same. Mobilisation of the ESP requires resources and/or an economic investment and is often surrounded by formal or informal restrictions. The cascade model was chosen as a framework for this study as it allows the connected processes of use value attribution and mobilisation to be identified, illustrating the non-linear flow from ecosystem functions to beneficiaries during the creation of services.
2.3 Wellbeing The cascade model highlights the social processes surrounding the creation of ecosystem services resulting in a gain of benefits. However it does not provide any further explanation of the term ecosystem service benefits and, more precisely, how the services contribute to wellbeing. One of the objectives with this study was to analyse the connections between services and their importance for wellbeing, which is why the framework of wellbeing (as described in the Millennium Ecosystem Assessment (2005) was being included. By doing so the whole process of ecosystem service, through the cascade, from ecosystem functions through to benefits as well as its contributions to wellbeing, could be studied. Wellbeing is a highly complex concept and the individual perception of it may make it difficult to use as simplifications needs to be made. In the framework of the Millennium Ecosystem Assessment (2005) that illustrates the links between ecosystem services and

10
wellbeing, five constituents of wellbeing are distinguished: security, basic material for good life, health, social relations and freedom of choice and action, which overlays all the others. This framework draws upon the results from the work of Narayan et al. (2000) in the global project Voices of the Poor, where these five constituents of wellbeing were found to be what people from all over the world commonly and repeatedly expressed as aspects of wellbeing. In a wellbeing assessment study of small-scale Kenyan coastal fisheries Abunge et al. (2013) concluded that the framework of Millennium Ecosystem Assessment (2005) corresponded well to the aspects of wellbeing perceived by people of the study. The framework has been used in other studies related to ecosystems and wellbeing, for example by Fisher et al. (2014) and Brown et al. (2008). When an assessment of ecosystem services is made and the services are linked to wellbeing, there are certain aspects to be taken into consideration. Beneficiaries of services needs to be disaggregated as one cannot assume the same wellbeing will be experienced by everyone (Daw et al. 2011; Fisher et al. 2014) and each ecosystem service may contribute to different aspect of wellbeing depending on the values of the user. Assuming that each service provides one kind of benefit is therefore too much of a simplification. The intangible, non-material contributions to wellbeing have had a tendency to be overlooked and ignored in ecosystem assessments, which does not necessarily mean they are less important to the user of the service (Chan et al. 2012a; Daw et al. 2011; Dawson & Martin, 2015). Fishing for example may not only provide a source of food but also have ethical, political and spiritual aspects (Chan et al. 2012a). For some people it contributes to a sense of identity and may give job satisfaction (Pollnac et al. 2001). Likewise, the wellbeing gained from an ecosystem service may also be affected by social, economic and political changes over time, both locally and globally (Dawson & Martin, 2015).
2.4 Classification of ecosystem services In order to categorise the ecosystem services identified within the study the Common International Classification for Ecosystem Services (CICES) was used (Haines-Young & Potschin, 2013). Its framework is based upon the same concept of ecosystem services as the cascade model, which made it possible to combine them within the study. Table 1 outlines the classification scheme of CICES.

11
Table 1. Classification scheme of ecosystem services by the CICES (table from Haines-Young & Potschin, (2013, p. iii)). Services are divided into three categories; provisioning, regulation & maintenance and cultural, on a three level basis (section, division and group).
The three major sections are defined as follows (Haines-Young & Potschin, 2013, p. 18):
Provisioning
All nutritional, material and energetic outputs from living systems. In the proposed structure a distinction is made between provisioning and material outputs arising from biological or organic materials (biomass) and water. Materials can include genetic structures.
Regulating and Maintenance All the ways in which living organisms can mediate or moderate the ambient environment that affects human performance. It therefore covers the degradation of wastes and toxic substances by exploiting living processes.
Cultural
All the non-material, and normally non-consumptive, outputs of ecosystems that affect physical and mental states of people. Cultural services are primarily regarded as the physical settings, locations or situations that give rise to changes in the physical or mental states of people, and whose character are fundamentally dependent on living processes; they can involve individual species, habitats and whole ecosystems. The settings can be semi-natural as well as natural settings (i.e. can include cultural landscapes) providing they are dependent on in situ living processes.
The classification scheme is under constant development and definitions may change in the future. Definitions and classification of cultural services is considered particularly ambiguous. The supporting category of services, present in the classification framework of the Millennium Ecosystem Assessment (2005), is not included in CICES for the reason that they are seen as fundamental processes which all the other services are based hence already included within the account of the final service. Similarly biodiversity is regarded as a basic

12
foundation for the generation of services, not as a service in itself. The CICES primarily only include biotic services, abiotic services, such as sand and minerals, are defined within a separate scheme.
3. Material and methods The study was based upon a mixed method research design. Through an exploratory sequential design (Creswell & Plano Clark, 2011) data collection and analysis was divided into two phases. Phase one consisted of qualitative data collection and analysis and was followed by a second phase where quantitative data was collected from structured household interviews. The results of the analysis of phase one were used to construct the subsequent quantitative data collection, and thereby connected the two phases. In addition, the second phase had a triangulation design where some of the quantitative, close-ended questions of the structured interviews were coupled with open-ended qualitative questions in order to validate and expand the findings. The two data sets of the second phase were analysed separately and merged together during the discussion (section 5). Mixed methods research may be applied when qualitative or quantitative approaches alone cannot provide an answer or a complete picture of the studied phenomenon. The combination of approaches may also add an extra strength that can offset their respective weaknesses (Creswell & Plano Clark, 2011). Using a mixed methods research design was applicable to this study as its purpose contained elements of both quantitative and qualitative character. The qualitative data and its results provided a relevant foundation for subsequent quantitative data collection along with a deeper understanding of how and why the ecosystem services were used. The quantitative data, on the other hand, made it possible to analyse the extent and differentiated use and importance of the services, and generalise the findings. The importance of including qualitative methods in ecosystem services research has been highlighted by for example Chan et al. (2012a) who argue that a qualitative approach may reduce assumptions otherwise often made about values, priorities and related activities of the services, which may increase the validity and legitimacy of the research. Stakeholders may also benefit from extended inclusion within the study and interaction with the researcher as it can help create a better local understanding and appreciation of the research. Several authors have discussed the importance of context consideration and stakeholder involvement in ecosystem service identification and prioritisation process (for example Chan et al. 2012a; Potschin & Haines-Young, 2013). This chapter will provide a description of the study site and rational for its selection. Thereafter follows considerations of ethics and biases along with a description of methods for data collection and analysis. At the end of phase one of the study, qualitative analysis generated context customized categories of ecosystem services and constituents of wellbeing, which were subsequently used in phase two. A description of the category generation will be provided at the very end of the chapter.
3.1 Study site description As the study is based upon a place-based approach to ecosystem service assessment where context plays a vital role, developing an understanding of the study site is crucial before further data collection, analysis and interpretations can be made. The study site description below includes, but is not limited to, some of its characteristics that may be worth considering when assessing and analysing its connected ecosystem services. The description is a compilation of information collected from published literature, statistical databases, direct observations and interviews conducted during the course of the study.

13
The study sites chosen for this study were the two fishing villages of Panamburu and Ullal. Panamburu lies within Mangaluru city, located approximately fifteen kilometres north of the city centre. Ullal is both the name of the fishing village and the municipality town which it is part of. Ullal fishing village lies approximately ten kilometres south of Mangaluru city centre (see maps over the area in Figure 2). The study sites did not include the whole villages but were defined as the area of respective village inhabited by the Mogaveera fishing community, called Mogaveera patna. Mangaluru is situated in between the outlet of two rivers; Gurupura in the north and Netravathy in the south. Panamburu lies on the northern side of Gurupua river and Ullal right on the southern bank of Netravathy river. The coastline consists of straight, open sandy beaches with an estuary at the outlet of the rivers, and is described as a typical high energy coast. Along the coastline south of Netravathy outlet erosion is present and beaches are receding whereas north of the river outlets sediment accretion causes a net gain of beaches and sand spits (Kumar et al. 2010). The area has a tropical monsoon climate with heavy rainfall during the south west monsoon between June and September. The rest of the year receives less rainfall, with the summer season from March to May being the hottest (Dwarakish, et al., 2009). During the rainy season the winds are in general strong and west to south-westerly whereas the rest of the year brings calmer weather (Kumar et al. 2010). The major agricultural crops grown are rice, coconut, cashew nut, arecanut, rubber and vegetables (Thukaram et al. 2014). Mangaluru is the administrative headquarter of the district Dakshina Kannada, a district ranked with the second highest HDI (Human Development Index) in Karnataka, only proceeded by Bangalore (Government of Karnataka, 2006). Mangaluru has experienced a rapid urbanization and development of an industrial sector including chemical and fertilizer industries, information technology, food processing and fishing. The city harbours one of India’s thirteen major ports; the New Mangalore Port (NMP), located north of the river outlets, next to Panamburu village. The area around the port is today an industrial area home to companies such as Mangalore Refineries and Petrochemical Ltd. (MRPL), Mangalore Chemicals and Fertilizers (MCF) and BASF India Ltd. (Shirodkar, et al., 2009). In Ullal factories producing fish meal and fish oil are located. Between the years of 2006 and 2010 the agricultural plantation and crop land areas of Mangaluru had decreased by 9 and 21% respectively in favour for residential/flats built up, commercial built up and industrial built up areas, which in turn had increased by around 10% each and together constituted over half of the land area in 2010 (Thukaram et al. 2014). The fishing sector of Karnataka is relatively large with a marine fish production in 2014-15 estimated to a value of approximately 26.5 billion rupees, involving nearly 19 000 registered fishing vessel and engaging a fishermen population of around 300 000 people (Directorate of Fisheries, 2015). Before the late 1950s fishing operations had mainly been of a traditional, non-mechanised, small-scale and subsistence character. It had been the occupation of particular communities of fisherfolk and was organized on a largely cooperative basis where men were fishing and women took care of the post-harvest activities involving retail sales of the fish. In the late 1950’s a major development of the fishing sector started which introduction of mechanized boats, new gear and techniques and expanded post-harvest facilities, which started an increasing trend in fish production. In 1976/77 the catch of non-mechanised boats (traditional boats) contributed to 59% of the total marine fish production of the state. In 2008/09 their share had decreased to merely 6% (Gunakar, 2012).Today mechanized trawlers and purse-seine boats bring the largest share of landings. From the year

14
of 2009-10 to 2012-13 the total yearly marine fish production of Karnataka had increased by 44% in quantity and by 124% in value (Directorate of Fisheries, 2013). Some studies though indicate the Indian marine fish production has reached an unsustainable level with a decreasing trend in mean trophic level of catches (Bhathal & Pauly, 2008). Along the coast of Mangaluru there are 17 fishing villages harbouring a fisherfolk population of around 27 000 people, which make up 16% of the state’s total fisherfolk population. Hindus, Muslims, Christians and scheduled caste/scheduled tribes are represented amongst the fisherfolk communities. In the village of Panamburu 98% of fishing families are Hindus and 2% Christians. In Ullal 50% are Hindus, 44% Muslims and 6% Christians (Central Marine Fisheries Research Institute, 2010). The Mogaveera community focused upon in this study are Hindus. The Mogaveeras are believed to have lived in coastal Karnataka since around thousand years ago where they adopted fishing as a main occupation and lived mainly from the resources of the sea (Uchila, 2016d). The Mogaveera communities are part of a traditional and well-structured organisation administrating community affairs such as fishing, religious practices and ceremonies, solving disputes and in some cases managing schools (Uchila, 2016a). The worship of nature is part of the religious practices along with worship of Vedic and Dravidian Gods and the divinities of daivas (Uchila, 2016b). The coconut tree for example gains a special reverence. “The coconut is precious. The coconut has been used for prayers of god, for every prayer the coconut is necessary” (Interview 2016-03-28). “People believe if you see the tree in the morning when you wake up you know the day will be a good day, it will go well.” (Interview 2016-03-25). Temples are present within each village of Mogaveeras along with Bhajana Mandiras, which are a type of collective prayer halls where communal prayers are held (Interview 2016-02-13). The native language of Mogaveeras is Tulu. Approximately 1500 people live in the Mogaveera patna of Panamburu (Interview 2016-03-28). Today around half of the households are involved in fishing, it used to be all of the households but many have instead increased their level of education and gone for other work. Twenty two traditional boats (increased to 70 in rainy season) and two purse-seine boats are owned by members of the community (Interview 2016-03-28). Most of the houses within the village have their own well (ibid.). The Mangalore City Corporation provides water through a pipeline system with taps available along the street and sometimes at house level. The water is withdrawn from a dam upstream in the Netravathy river. Household sewage is taken care of by septic tanks or soak pits and a daily solid waste pick up service facilitates the village (Interview 2016-03-30). According to the President, development during the last past ten years has rapidly increased (Interview 2016-03-28). The place used to be called the “hundred houses village” but now have 434 houses. Statistical data tells the same story. Between 2001 and 2010 the total population of Panamburu increased by 121%, the literacy rate by 110% and number of people in employment by 147% (Government of India, 2011). Ullal Mogaveera patna has a population of approximately 5000 people. It has a larger proportion of fishing households than Panamburu, around 90% of households are involved in fishing. An estimated number of 250 traditional boats and seven purse-seine boats belong to members of the community. The purse-seine boats require a crew of 30-35 fishermen (Interview 2016-03-25). Water for the village is taken either from open wells or bore wells outside houses, or supplied through the municipality pipeline system, which originates from

15
the same source as the pipeline water in Panamburu. Likewise in Panamburu, the household sewage is taken care of at household level and a solid waste management system provide pick up services of rubbish (Interview 2016-04-01). What the place looked like 30 years ago is described as follows, “There were much less houses and more space. Even the sea was 1 km further away from here. Since 10 years ago it looks almost the same. Maybe only 5% difference within the last past 10 years.” (Interview 2016-30-25). Ullal increased its population earlier than Panamburu and during the last past ten years had a more stable population with an increase of only 8%. No change in employment has occurred since ten years back and the literacy rate increased by a modest 18%, in comparison to Panamburu’s rapid change (Government of India, 2011). Within both of the villages, gas for cooking has been installed in households and gas tanks can be refilled through an online/mobile phone booking system (Interview 2016-03-28, Interview 2016-03-25).
Figure 2. Left map shows India with Mangaluru marked with a black star. Right map shows the area around Mangaluru with the location of Panamburu and Ullal study sites at the black boxes. Note the two rivers; Gurupura in the north of the city and Netravathy in the south.
3.2 Selection of study sites Study sites were chosen firstly based upon the criteria of being places located on the coast in direct connection to the sea, inhabited by an active fishing community, and undergoing change in terms of population increase and urbanisation. Secondly they had to be accessible, not only enabling a daily commute from central Mangaluru, but also in regards to the possibility of establishing contact and building a network for field surveys. Panamburu and Ullal both met these requirements. The scope of the study was set to focus on one fishing community, and the Mogaveera was chosen because they formed reasonably large communities in both of the villages.
3.3 Considerations of ethics and biases The ecosystem service concept includes not only biophysical elements but also human needs, interests and values, and as such becomes a value-laden concept with subsequent ethical questions of concern (Jax et al. 2013). Prior to any interview or focus group discussion the

16
purpose and background of the study was explained along with an explanation of their anonymous participation. Participation in the study was voluntarily and only those interested in partaking were interviewed (which in turn may have caused a bias in the results). Values of ecosystem services and perceptions of wellbeing captured within this study is, and will always be, a subjective interpretation, in this case from the perspective of an academically educated female researcher from a middle-class background in a western country. However, the choice of research design and data collection methods was made with the intention of reducing the effects of biases as much as possible.
3.4 Data collection Collection of data was made by applying four different methods; direct observations, focus group discussions and interviews formed the qualitative data of phase one and structured interviews provided quantitative, and some qualitative, data during the second phase. The particular methods and the combination of them were chosen in order to provide the most inclusive assessment as possible. Data was collected during the months of February and March 2016, the very beginning of the hot summer season. All data collection was undertaken with the assistance of a female interpreter, resident of the city of Mangaluru. Tulu, Kannada (the official language of the state Karnataka) and English were spoken alternately during data collection.
3.4.1 Direct observations Direct observations are in general used when the focus is set to collect non-verbal data, i.e. what people do, in opposition to what they say, which is investigated in interviews. The character of the observation may vary depending upon the degree of e.g. participation, length of interaction and the subject’s awareness of the purpose. A situation when observations are suitable to use are for example when things studied are so obvious or natural to people that they won’t think talking about them in interview (Esaiasson et al. 2012). Direct observations were chosen as method for the first phase of the study for two reasons. Firstly it provided an opportunity to familiarize with the study sites, physically and socially, creating opportunities for continuing data collection. Secondly, ”ecosystem service” can be an abstract term making it difficult for people to grasp its full meaning, and the use of services from nature may not be thought of or recognised as something “special” as it might just be part of everyday life, and therefore run the risk of going unmentioned within an interview. Direct observations at the study sites were undertaken by accompanying local field enumerators performing a household survey within the two study site villages. Households were visited on a random number basis and enabled informal conversations to be held on the topic of ecosystem services, how they were used and why. Visual observations were also made within the villages where the use of potential ecosystem services were noted down, sometimes followed up by questions to village members to extend the understanding of the observation. In addition direct observations were made at related sites, not to identify ecosystem services but to increase the general understanding of the local context in which the services were created and used. During the observations notes, written and mental, were taken and was at the end of the day documented in text. For details of observations see Table A1 in Appendix A.
3.4.2 Focus group discussions Focus group discussions are conversations around a certain topic by a consciously selected group of people led by a moderator. They are usually used to collect data on how a group of

17
people together think about a phenomenon, and can be used to generate ideas and supporting material for questionnaires (Esaiasson et al. 2012) for which purposes they were used in this study. The selection process of participants is important as it frames the outcome of the discussion (Esaiasson et al. 2012). During the observations a division had been observed between ecosystem services related to fishing and those originated on land, e.g. the use of plants. It was therefore decide to host a group discussion with fishermen in each study site village to discuss the fishing related ecosystem services in particular. By the assistance of a local contact within each village, groups of fishermen were gathered (see details in Table A2, Appendix A). The same guide with topics for discuss was used for both groups but variations in outcome occurred due to development and orientation of the individual discussions. Discussions took place at the participants chosen location. The discussions were moderated by the researcher, continuously translated by the interpreter, and audio recorded. Afterwards the audio recordings were listened through and notes taken during the discussion were complemented. The recordings were later transcribed in full by the interpreter.
3.4.3 Interviews Interviews can be used in research for example to explore a new field and gain insights for further data collection, for developing theories or to understand other people’s perceptions (Esaiasson et al. 2012). Two interviews, one in each village, were conducted with women to identify ecosystem services used on land and the social processes related to the use of them. An interview guide, with similar structure of topics as in the focus group discussions, was used (Table A3, Appendix A). The interviews were of informant character, but contained some follow up questions in the end of a respondent nature to capture a more personal point of view. Selection of interviewees was, in both villages, based on “snowball” sampling (Esaiasson et al. 2012) where participants of the focus group discussions made the introduction to potential candidates. As the topic of the interviews was of a general character, which assumedly almost anyone could have answered to, the selection process was found to be sufficient for the situation. Both of the interviews took place at the women’s own houses, with relatives and/or neighbours present, and lasted between 45 min to 1.5 hours. Five interviews of informant character were conducted in order to collect village and community related information. The questions were quite specific in character and therefore the selection of informants was made with care to ensure validity of data collected. The interview guides can be found in Appendix. An additional interview was made with an informant from Ullal to complement quantitative findings of the structured interviews with explanatory qualitative data. The interview with the president of Panamburu, the environmental engineer at MCC and the engineer at Ullal Town were conducted in English. All other interviews were conducted in Tulu and/or Kannada. Notes were taken during the interviews and they were all audio recorded. Recordings were listened through afterwards to complete notes taken. The recordings were transcribed in full by the interpreter.
3.4.4 Structured household interviews The structured interview is a research method where the same standardized set of questions is verbally communicated to each respondent and answers are written down by the interviewer, in comparison to questionnaires where the respondent read and write the answers by him/herself (Esaiasson et al. 2012) Due to the relative complexity of the questions and their
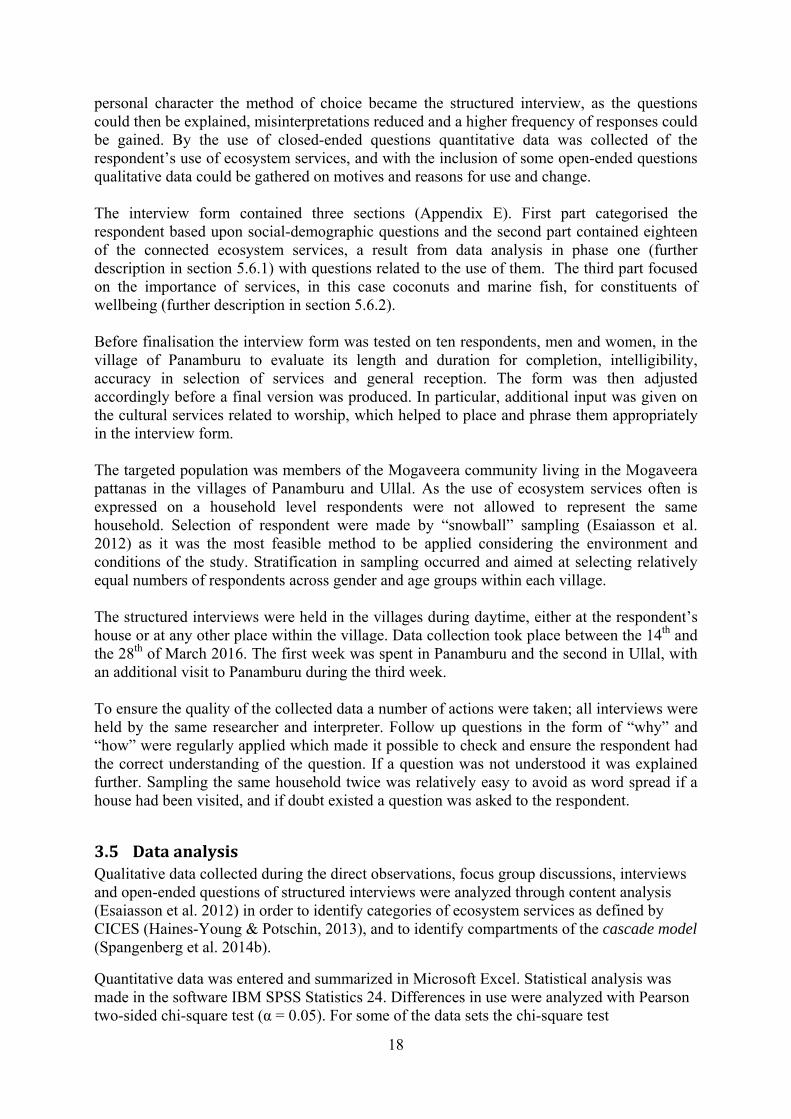
18
personal character the method of choice became the structured interview, as the questions could then be explained, misinterpretations reduced and a higher frequency of responses could be gained. By the use of closed-ended questions quantitative data was collected of the respondent’s use of ecosystem services, and with the inclusion of some open-ended questions qualitative data could be gathered on motives and reasons for use and change. The interview form contained three sections (Appendix E). First part categorised the respondent based upon social-demographic questions and the second part contained eighteen of the connected ecosystem services, a result from data analysis in phase one (further description in section 5.6.1) with questions related to the use of them. The third part focused on the importance of services, in this case coconuts and marine fish, for constituents of wellbeing (further description in section 5.6.2). Before finalisation the interview form was tested on ten respondents, men and women, in the village of Panamburu to evaluate its length and duration for completion, intelligibility, accuracy in selection of services and general reception. The form was then adjusted accordingly before a final version was produced. In particular, additional input was given on the cultural services related to worship, which helped to place and phrase them appropriately in the interview form. The targeted population was members of the Mogaveera community living in the Mogaveera pattanas in the villages of Panamburu and Ullal. As the use of ecosystem services often is expressed on a household level respondents were not allowed to represent the same household. Selection of respondent were made by “snowball” sampling (Esaiasson et al. 2012) as it was the most feasible method to be applied considering the environment and conditions of the study. Stratification in sampling occurred and aimed at selecting relatively equal numbers of respondents across gender and age groups within each village. The structured interviews were held in the villages during daytime, either at the respondent’s house or at any other place within the village. Data collection took place between the 14th and the 28th of March 2016. The first week was spent in Panamburu and the second in Ullal, with an additional visit to Panamburu during the third week. To ensure the quality of the collected data a number of actions were taken; all interviews were held by the same researcher and interpreter. Follow up questions in the form of “why” and “how” were regularly applied which made it possible to check and ensure the respondent had the correct understanding of the question. If a question was not understood it was explained further. Sampling the same household twice was relatively easy to avoid as word spread if a house had been visited, and if doubt existed a question was asked to the respondent.
3.5 Data analysis Qualitative data collected during the direct observations, focus group discussions, interviews and open-ended questions of structured interviews were analyzed through content analysis (Esaiasson et al. 2012) in order to identify categories of ecosystem services as defined by CICES (Haines-Young & Potschin, 2013), and to identify compartments of the cascade model (Spangenberg et al. 2014b).
Quantitative data was entered and summarized in Microsoft Excel. Statistical analysis was made in the software IBM SPSS Statistics 24. Differences in use were analyzed with Pearson two-sided chi-square test (α = 0.05). For some of the data sets the chi-square test

19
qualifications could not be met, as a problem with small expected values occurred. In those cases the Exact Test (IBM SPSS Statistics, 2016) was used instead. Differences in importance were analyzed with Mann-Whitney U test and Kruskal Wallis test (α = 0.05). All graphs presented were made in IBM SPSS Statistics 24 except the radar charts in section 6.6 which were made in Microsoft Excel.
3.6 Development of categories for quantitative data collection In line with the mixed methods research design, the results of qualitative data analysis of phase one were used in construction of the quantitative data collection tool, in this case the structured interview form and its context customized categories of ecosystem services and wellbeing. The results from direct observations, focus group discussions, and interviews were used for this purpose.
3.6.1 Connected ecosystem services A first compilation of potential ecosystem services yielded a list of 67 services. The study was limited to investigate ecosystem services connected to the study sites, which here was defined as services originating from within the place of the study sites. Due to the lack of distinct physical boundaries of the sea and rivers, all aquatic biomass services used by people within the study sites were considered, regardless of where e.g. the fish had been landed, caught or bought from. As a result, services not considered as connected to the place were excluded from the list. Further exclusion of services was made based on them being identified as used to a very low degree, or sometimes not at all. Cows, for example, were observed walking around within the study sites and noted down as a potential ecosystem service. However, in subsequent interviews chickens, but not cows, were mentioned as animals that were kept, with the motivation “Mogaveeras don’t keep cows” (Interview 2016-03-04). Therefore cows and their outputs were excluded from the list. Several of the services were identified and distinguished down to species level. They were compiled into broader categories on class level to make assessment of them possible. The different species of fruits identified were compiled into the category “edible fruits/nuts/parts from trees” and the collection of identified medicinal plants was likewise summed into the service category “medicinal plants”. Services generated from the sea and river included a diversity of species of fish, crustaceans and bivalves, with fish species more commonly caught and used than crustaceans and bivalves. During the focus group discussion, the fishermen talked about the sea and the river as two distinctly different areas for fishing. Fishermen from Panamburu said the river was not particularly used by them, whereas fishermen from Ullal turned to catch fish in the river instead of the sea during rainy season (Focus group discussion, 2016-03-04). Hence categorisation of aquatic services was based upon habitat; marine and freshwater. Fish and seafood was not always used for nutrition, some species were mentioned to be sold as fish meal at certain times, but since the majority was used and sold as food most of the time, they were considered as provisioning nutrition services. The seasonal use of services was also explored during group discussions and interviews. Fishing activities and catches had a seasonal pattern depending upon the monsoon (Focus group discussion 2016-02-24), but to keep the structured interviews within a reasonable extent, use of services was recorded on a yearly basis, not separated by season. Further

20
investigations in seasonal use and importance of services may however lead to an even more in-depth understanding and detailed description of differentiated ecosystem service use. Cultural services may be ambiguous to classify as all services have potentially a cultural component, more or less pronounced (Haines-Young & Potschin, 2013). In this study services categorised as cultural are those which have been identified as having a primary cultural purpose of use. Coconuts and fish for food have been classified as provisioning, however they also have cultural aspects in terms of the benefits they provide, which are further investigated in section 6.6. This categorisation should however not be taken as universal. In another place, at another time, the categorisation might be done differently. The regulation and maintenance services were not explicitly mentioned to be used, not surprisingly due to the abstract nature of them. Instead these services were identified and recognised as being in use when the absence of them was notified and implications of absence expressed. By use value attribution the ecosystem functions had thus been turned into services, in accordance with Spangenberg et al. (2014b) A meaningful investigation of the regulation and maintenance services called for other types of methods to be used than a structured interview, and was therefore not taken further than the recognition in Table 3. The service “shade provided by trees” did not fit entirely into any of the classes of CICES, but was placed under “Maintenance of physical, chemical, biological conditions” on the division level in the regulation and maintenance section. In Table 3 the final output of identification and prioritisation of services can be seen. The provisioning and cultural services, plus “shade provided by trees” of the table (a total of 18 services) were subsequently included in the structured interviews.
3.6.2 Constituents of wellbeing The five constituents of wellbeing described in the Millennium Ecosystem Assessment (2005) may be perceived as somewhat abstract and general in character, so in order to make them applicable in the context of this study they had to be expressed in more concrete terms. The qualitative data collection of phase one and subsequent content analysis resulted in thirteen context customized sub-categories of the five wellbeing constituents, seen in Table 2.

21
Table 2. The left hand column shows the context customized categories of wellbeing developed from the collected qualitative data of phase one of the study. The right hand column gives a description of respective category.
Context customized wellbeing categories Description Physical safety Ability to keep physical assets, in particular the house
safe, ensuring it will remain and be possible to live in Income stability Possibility to have a continuous income, knowing
there will be an income not only for the day Cash income Money that can be used to obtain other benefits Labour Opportunity to have a job to generate an income but
also has a social and mental purpose for the individual Good food Eating food not only for its nutritional value but
because it tastes good Nice house Maintaining the house so one feel happy and proud
over it Comfortable living Making the everyday tasks of life easy and
comfortable to perform Physical health Health status concerning the physical body Mental health Health concerning the wellbeing of mind and feelings Good social relations with family Relations with family or closer friends Good social relations with community Relations concerning the whole community Continuing tradition of ancestors Continuing traditions and customs that are considered
part of the culture of one’s community Freedom to do and chose what I want Opportunity for an individual to make decisions and
do what one wants to do The constituent security was expressed as physical safety and income stability. Concerns regarding the safety of the house during monsoon season had been raised, as described by a woman in a house by the sea front in Ullal, when asked about what happens in monsoon season when winds are strong and the sea rough: “Until here the water will come (pointing to her house), That time we should leave our house”... “That time we are going to a rented house” (Interview 2016-03-04) Fishermen in both villages (Focus group discussion 2016-02-24 and 2016-03-04) talked about the problems of the fluctuating sizes of catches and never knowing how much income will be earned from day to day, raising the concerns and worries over unstable income. Cash income, labour, good food, nice house and comfortable living together formed the wellbeing constituent basic material for good life. Cash income was stated by the fishermen as a benefit of fishing, as well as the opportunity for a job. “But the people not have education and no other job so they need to go fishing to get some income.” (Focus group discussion 2016-02-24). A source of food to use for preparing different dishes , the possibility to cook the food, to have a plate to eat on and keep the house and clothes clean, was other benefits people said they gained from using the ecosystem services. Another constituent of wellbeing is health, which was expressed and divided into physical health and mental health. “Good for the health”, “good for the skin” were some of the related benefits mentioned (Interview 2016-02-25). The leaves of the tulsi plant was used as a medicine, but the observed presence of a purposely built and decorated tulsi katte (translated

22
tulsi house) outside nearly every house witnessed about other potential aspects of health that could be fulfilled by the plant (Observation 2016-02-06). Good social relations as a constituent of wellbeing gained from using ecosystem services can be exemplified by the following statement about fish: “And it also provides the livelihood and protection of some disabled people. Because when the, in the sense of, for example if the fishes availability in their village, handicapped people will come to the landing centre and they use to give some portions for the widows and deprived. If they don’t have an earning member, male earning member, they will have some sort of consideration.” (Interview 2016-02-13). Good social relations was also expressed within the closer circle of family/friends, as for example visiting/spending time on the beach was said to be an opportunity to be together and enjoy time with the family/friends (Interview 2016-03-04). The tradition of ancestors was in this study depicted as a constituent of wellbeing on its own. It was frequently mentioned in interviews and focus group discussions as a reason for why it felt important for them to use a particular ecosystem service. “It is our community, come from our ancestors”, the fishermen for example said about using the fish (Focus group discussion 2016-03-04). Freedom to do and choose what I want was also added to the group of context customized sub-categories of wellbeing as it constitute the component of freedom of choice for the individual. The wellbeing categories of Table 2 were subsequently used in the structured interviews for investigation of ecosystem service’s importance for wellbeing. The importance for constituents of wellbeing was investigated for fish and coconuts. These two services were found to be widely used on a relatively frequent basis, which meant a large proportion of respondents would be available. A selection of two ecosystem services had to be made as collecting data for all the eighteen connected services would have resulted in a too long structured interview.
4. Results The sub-sections of this chapter relate to each of the objectives presented in the introduction. Firstly the results of the identification of connected ecosystem services will be presented along with a description of them. Secondly the results of the quantitative analysis of the differentiated use of services are presented, followed by the results of the qualitative analysis of service creation. Lastly the chapter provides presentations describing the findings of changes over time in supply and use, the differentiated importance and lastly the importance for the constituents of wellbeing.
4.1 Identification and description of connected ecosystem services In Table 3 the connected services identified within phase one of the study are presented. The middle column of the table provides the names of the ecosystem services as used within the study, the left column shows the corresponding category of CICES and the right hand side

23
column provides a short description of the services and/or examples of species included within. Table 3. Presentation of the results from the identification of connected ecosystem services (middle column) with corresponding CICES class (left hand column) and description (right hand column).
CICES class Ecosystem service Description/examples of species Provisioning – Nutrition Cultivated crops Edible fruits/nuts/parts from trees Papaya (Carica papaya), banana (Musa spp.), mango
(Mangifera spp.). Manilkara zapota, Pisidium guajava, Annona reticulate, Anacardium occidentale, Solena amplexicaulis, Artocarpus heterophyllus
Coconuts Cocos nucifera Vegetables Drumstick (Moringa oleifera), manoli/ivy gourd
(Coccinia grandis), bhindi/lady fingers (Abelmoschusesculentus),
Reared animals and their outputs
Reared animals and their outputs Eggs from chickens
Wild animals and their output
Marine fish and sea food Species of fish, crustaceans and molluscs
Freshwater fish and sea food Species of fish, crustaceans and molluscs Ground water for drinking Ground water for drinking Taken from open well or bore well, for drinking and
cooking Provisioning - Material Fibres and other materials from plants, algae and animals for direct use or processing
Medicinal plants Tulsi (Ocimum tenuiflorum), tumbe (Leucas aspera, L. cephalotes). Azadirachta indica, Plectranthus amboinicus, Tinospora cordifolia, Phyllanthus niruri
Plants for material purposes (building, decoration etc.)
Banana leaves, used as plates Mango leaves, for decoration at festivals/functions
Ground water for non-drinking purposes
Ground water for non-drinking purposes
Water from open well or bore well, for washing, cleaning, watering plants etc.
Provisioning - Energy Plant-based resources Firewood Collected from dead wood, fallen branches/leaves of
various trees Regulation & maintenance - Mediation of waste, toxics and other nuisances Treatment of wastewater from
households By soak pits and similar, at household level
Treatment of industrial effluents From surrounding industries’ wastewater Regulation & maintenance - Mediation of flows Storm protection Storm protection By trees, during monsoon season Hydrological cycle and water flow maintenance
Water supply recharge Of ground water, to maintain water level in wells
Buffering and attenuation of mass flows
Sand/sediment transport and storage
To maintain the amount of sand on the beaches
Mass stabilisation and control of erosion rate
Erosion control Reducing erosion on the beaches
Regulation & maintenance - Maintenance of physical, chemical, biological conditions Shade provided by trees By various species of trees Cultural – Physical and intellectual interactions with biota, ecosystems, and land-/seascapes Recreation/time pass on the beach Spending time to relax, socialize etc. Cultural - Spiritual, symbolic and other interactions with biota, ecosystems, and land-/seascapes Sacred and/or religious Performance of samudra snana Ritual bath in the sea Worship of Nagabana Holy place of Naga, the god of the land Worship of Ganga Maatha Yearly ritual for Ganga Maatha, the god of the sea Worship of ashwatha tree Holy tree (Ficus religiosa), found outside temples Worship of tulsi katte Tulsi (Ocimum tenuiflorum) placed in a construction
outside the house (katte = house).

24
In Table 3, note that for example coconuts could have been placed under “edible fruits/nuts/parts from trees” but due to its common and extensive use it was set to form its own category. As one woman expressed the use of coconuts: “Daily we need minimum one coconut. Depends on number of persons in the house. Use coconut every day, for breakfast, lunch and dinner.” (Interview 2016-02-25) Within the ecosystem services of marine and freshwater fish and sea food, a rather extensive list of examples of species is included. During the focus group discussions with fishermen over fifty different species of fish, crustaceans and molluscs were noted as being fished within the area. Species of mackerel (Rastrelliger spp.) and sardine (Sardinella spp.) were two of the most common fishes to be caught. Other examples of species caught were seer fish (Scomberomorus spp.), pomfrets (Pampus spp.) and croakers (family Sciaenidae). Examples of crustaceans caught were species of crabs (Portunus spp) and shrimps and prawns, including both marine and freshwater species. Clams, for example Meretrix meretrix, were mentioned as a species found mainly in the rivers, but did not seem to be used to any larger extent. The size of catches and composition of species varied throughout the year. During rainy season it was easier to find fish and the fish caught were of larger size. In January throughout May it was more difficult and the fish were smaller, came in less quantity and less variety of species (Focus group discussion 2016-02-24 and 2016-03-05). The use of groundwater from open wells or bore wells was not applied at every household. The water in the wells could become salty, more frequently occurring during the dry season, hence people did not use it at all, or only used it for washing and cleaning and not for drinking. When the groundwater from the wells was not used water provided through the municipality pipeline system was used instead. Two women describe their use of water: “Pipeline is there but we only use well. It’s good enough. Some wells have too salty water and then they have to use the pipeline. Before everyone used the well water but now it’s salty so they have to use pipeline.” (Interview 2016-02-25) “Yes, for all [purposes] we are using pipeline water only. It is there in the morning from 7 a.m. to 10 a.m. and in the evening 4 p.m. to 7 p.m. If pipeline water is not there, then simply we have to sit.” (Interview 2016-03-04) The ecosystem service “plants for material purposes”, include the use of banana leaves as plates and mango leaves for decoration, for which a woman described the usage as follows: “...[we use] leaves for decoration. Traditional for welcoming, to put around doors or similar. If there is a function we put the leaves, it’s a tradition.” (Interview 2016-02-25) Even though the assessment of regulation and maintenance services was not the focus of this study and were not included within the structured interviews, they were still present within the study areas. Especially in Ullal the erosion of the beach was a distinct feature of the landscape, an area where the ecosystem services “erosion control” and “sand/sediment transport and storage” could not provide what people needed anymore. A fisherman in Ullal shares his view of the situation: “Because of the breakwaters at Ullal and Bengre we now have erosion. In Netravathy near Bolar they also have put one breakwater.15 years ago the beach was 1 km out. In rainy season the sea is very rough, nothing can really protect us from that. Nothing can control that. Ullal is very deep compared to Panambur. Get deep suddenly. Problem is definitely there. That’s why they put the stones there. It’s ok now. The stones have been put there 8 times because they keep on falling in to the sea. People have to move to temporarily houses.

25
They also stay in the schools in rainy season. Ullal schools are closed, have holidays during rainy season. (Focus group discussion 2016-03-04) In Panamburu on the other hand, erosion was not experienced within the village, only mentioned as something that happened in some other places. The ecosystem services within the category of cultural services and the class of “sacred and/or religious services” should be seen as examples, not a complete list, of possible cultural services connected to the study sites. Samudra snana translates to “a bath in the sea” and is a traditional ritual that involves entering the sea from the beach for a bath on certain auspicious days of the month. The President of Panamburu (Interview 2016-03-28) described it as a tradition that came from the ancestors with the benefit of bringing good health for the performer, like a medical treatment. Naga, the snake god, is highly revered and worshipped and believed to be residing within the land. Nagabanas are sacred places of the Naga where once a month ritual offerings will be made. “Naga is lord of the land. This land belongs to Naga deivata. In Dakshina Kannada every land belongs to Naga. If you build a house you have to pray to Naga to ask to leave some space for us. Otherwise this land belongs to Naga. By worshipping we’ll get… health and wealth.” (Interview 2016-03-28) The sea is considered as a god, Ganga Matha, by Mogaveeras. At the end of the monsoon, usually in the month of August or September, people of the community gather on an auspicious day to make offerings for the sea and pray for it to allow them to use and travel upon it (Uchila, 2016). Many hindus revere trees and other plants as they are seen as the foundation for life. The ashwatha tree (Ficus religiosa) is one of the more significant ones, considered as a divine tree, and will often be found outside temples. Making offerings for the tree, praying and walking around it is part of the worship (Bhalla, 2014). The tulsi (Ocimum tenuiflorum) is another plant considered as sacred in hindu beliefs. Its leaves can be used as medicine but the plant itself is also worshipped for numerous reasons. Ancient hindu beliefs states that a tulsi plant is essential for every house (Bhalla, 2014). “Today every house have a tulsi katte. We pray every day, all members of the family. Starting from women, they mainly believe. Put the water to the tree. Then take a round, three, nine or twelve rounds and pray. The leaves are healthy. If you take two leaves daily no need for a doctor. Have antiseptic power. Tulsi is good for house. Every house must have. You can’t put anywhere, must be on a special place. In front of main door, south side of main door. Seven to nine footsteps minimum” (Interview 2016-03-28) However, not every house has a tulsi katte. “Don’t have at this house. He [husband] doesn’t believe in that things” a woman explains the lack of a tulsi katte at her house (Interview 2016-02-25).

26
4.2 Use of ecosystem services A total of 85 structured household interviews were held, 44 in Panamburu and 41 in Ullal. Representation of respondents across gender was almost equal (50% females in Panamburu, 43% in Ullal), and relatively even across age groups in Panamburu (34% 10 – 30 year olds, 34% 31 – 50 year olds and 32% > 50 years) whereas in Ullal a majority of the respondents (58%) belonged to the youngest age group (followed by 22% 31 – 50 year olds and 20% > 50 years). In both villages a majority of respondents had education up to primary and secondary school (68% respectively 66% in Panamburu and Ullal), only one in each village stated to be illiterate and the rest had education above secondary school. In Panamburu/Ullal 23/39% were working as fishermen, 18/27% were employed (in a non-fishing related business), 18/17% were housewives and 16/10% were retired. A couple of respondents worked with fish trading and in Panamburu five respondents had their own business. A majority (95% respectively 90% in Panamburu and Ullal) owned the house they lived in whereas the rest lived in rented houses. Most households in Panamburu (50%) and in Ullal (66%) contained four to six members. Households within which someone was either working as fisherman or with fish trading were classified as fishing households. In Panamburu 73% of respondents came from a fishing household, in Ullal 98%. Table B1 in Appendix B provides a full compilation of the population characteristics derived from the structured household interviews.
Within the structured household interviews, respondents from Panamburu and Ullal study sites were asked the question if they used the connected ecosystem services, and if so, how often they did used it. In Figure 2 the number of users per service can be seen, divided into categories of frequency of use. For some of the services the frequency of use was not applicable and those were only recorded on a use/no-use basis. Freshwater fish was only used in rainy season; the stated frequency applies to how often it is used during those months of the year. Use of “coconuts” includes only those plucking it from within the village, not buying it from outside of the village. Marine fish was used by everyone and almost entirely on a daily basis. Coconuts and ground water for drinking and non-drinking were also services used on a daily basis, but not by everyone. Firewood was used by only about a fifth of the respondents but amongst them most used it every day. The remaining provisioning services were used on a less frequent basis, with vegetables being used by only a few and reared animals hardly at all. Cultural services were overall used by a relatively large proportion of the respondents as well as the regulation and maintenance service “shade by trees”.

27
Figure 3. The frequency of use (daily/once per week/once per month/3-6 times per year/1-2 times per year) shown per number of users for each ecosystem service. For services where the frequency of use was not applicable (”shade by trees”, ”worship of ashwatha tree” and ”worship of tulsi katte”), the total number of users is shown instead.
However, the ecosystem services were not used uniformly by all 85 respondents. In Figure 3 the differences in use between villages can be seen and in Figure 4 the differences in use between gender. The chi-square test showed that between Panamburu (n = 44) and Ullal (n= 41) there was a significant difference in the use of ”edible fruits/nuts” (df = 1, P = 0.004), ”coconuts” (df = 1, P = 0.024), ”vegetables” (df = 1, P = 0.016), ”freshwater fish” (df = 1, P = 0.000), ”plants for material use” (df = 1, P = 0.000), ”ground water for non-drinking” (df = 1, P = 0.000), ”firewood ” (df = 1, P = 0.000) , ”worship of Ganga Maatha” (Exact test, df = 1, P = 0.006) and ”worship of tulsi katte” (df = 1, P = 0.000). Overall, the frequency of users of ecosystem services seemed to be higher in Panamburu than in Ullal. The provisioning services were used to a higher degree in Panamburu than in Ullal, apart from ”freshwater fish” which were used by a larger part of respondents in Ullal. The cultural services were used relatively equal in both villages, however the worship of Ganga Maatha was more prominent in Ullal whereas the worship of tulsi katte was more frequent in Panamburu. Between males (n = 45) and females (n = 40) the chi-square test showed significant differences in the use of ”coconuts” (df = 1, P = 0.015), ”freshwater fish” (df = 1, P = 0.036), ”ground water for drinking” (df = 1, P = 0.021), ”medicinal plants” (df = 1, P = 0.046),

28
”recreation on the beach” (df = 1, P = 0.000), ”performance of samudra snana” (df = 1, P = 0.002) and ”worship of ashwatha tree” (df = 1, P = 0.000). In general, men were more frequent as users of the ecosystem services than women, but not for all services. ”Vegetables” and ”marine fish” were used equally as frequent .
Figure 4. The percentage of users of ecosystem services shown for the two villages Panamburu and Ullal.
Figure 5. The percentage of users of ecosystem services shown for men and women.

29
The use of the ecosystem services also differentiated between age groups of the respondents. The chi-square test revealed significant differences in the performance of samudra snana (Exact test, df = 2, P = 0.000) and the worship of Nagabana (Exact test, df = 2, P = 0.016), Ganga Maatha (Exact test, df = 2, P = 0.011) and tulsi katte (Exact test, df = 2, P = 0.010). Performing the smaudra snana was done to the least extent by respondents above 50 years of age, as well as worshipping Nagabana and Ganga Maatha. The group above 50 years of age was the most frequent users of the tulsi katte. Note that the use between villages and gender differed significantly for quite a few of the ecosystem services. The provisioning services were used to a greater extent in Panamburu and services were overall used more by men than women.
4.3 Acts of mobilisation and valuation According to the cascade model, use value attribution and acts of mobilisation need to be applied before an ecosystem function can be turned into an ecosystem service (Spangenberg, Haaren & Settele, 2014). The open-ended question “Why?” was added to respondents of the structured household interview who stated they did not use a service. There may be an endless number of different mobilisation acts the respondents use and need in order to get their services. Their replies to why they did not use a service do not give a complete list of all potential acts, but it provides an insight into some of the types of resources that might be needed in order to use a particular service. Table 4 presents a compilation with examples of acts of mobilisation that could be needed, i.e. those that had restricted the respondents in using the services. Sometimes the service was not used, not because it could not be mobilised, but because the respondent did not want to use it i.e. lack of use value attribution. Examples of such cases, when not enough value was found in using the services, are given in the column on the right. For some services no one stated lack of use value attribution and those boxes are left empty.

30
Table 4. Compilation of examples of acts of mobilisation and lack of use value attribution stated by respondents of the structured household interviews as reasons to why not using a service (examples for “marine fish” and “freshwater fish” from focus group discussions 2016-02-24 and 2016-03-04).
Ecosystem service Acts of mobilisation Lack of use value attribution
Edible fruits/nuts Space/place for a tree Access to suitable soil/weather conditions Allowance from land owner
No interest in keeping fruit trees Can buy instead
Coconuts Space/place for a tree Allowance from land owner
Vegetables
Space/place for a plot Access to suitable soil/weather conditions Protection from cows/chickens/goats Allowance from land owner
No interest in gardening Can buy instead
Reared animals Space/place Time/resources to look after them Protection from dogs/wild animals
No interest in taking care of animals
Marine fish
Money to buy or a family member catching and providing or; Boat, equipment and crew Landing /storage site for boat Knowledge of fishing
Freshwater fish Same as for marine fish, and; Access to a river in close proximity
No habit/tradition of freshwater fishing
Ground water for drinking
Access to a well Access to a well with adequate water quality
More easy to use pipeline water from the tap
Medicinal plants Space/place for plants Knowledge to prepare
No need for them, use ready-made medicines instead
Plants for material use Space/place for trees Access to suitable soil/weather conditions
Ground water for non-drinking
Access to a well More easy to use pipeline water from the tap
Firewood Access to trees Allowance to pick and use
More easy to use gas Don’t like the smoke from the fire
Shade by trees Space/place for trees
Recreation on the beach Time Adequate physical health
No interest in the beach, have other places to go to
Performance of samudra snana
Adequate physical health
No interest
Worship of Nagabana Adequate physical health Only seen as a formality without any greater importance
Worship of Ganga Maatha
Adequate physical health No interest
Worship of ashwatha tree
Time
No habit or tradition
Worship of tulsi katte Space/place outside the house The biophysical conditions of a place affect the ecosystem functions, which provide the supply of potential ecosystem services. Having access to places with suitable soil and weather conditions was required to mobilise some of the provisioning services, e.g. “edible fruits/nuts” and “vegetables”. The close proximity to the sea of some of the households gave them unsuitable conditions for cultivation of plants with strong winds, salty water and a soil consisting of mainly sand.

31
Having a space/place available was another act of mobilisation needed for using several of the services. “Less space for trees”, “no place” and “no space to grow” were replies commonly given to why not using a service. It was not only the provisioning services that required space available. Worship of the tulsi katte, a cultural service with a high number of users, did however require some space outside the house to be placed at. If the house of the respondent stood too close to the neighbour’s it was not possible to set up a tulsi katte, and they were unable to use that service.
Even if you had space available around your house to grow vegetables, plant trees or set up a tulsi katte etc. it did not automatically mean you could utilise the potential services provided. As some reported, they had to have allowance from the land owner to use the land outside the house. This was particularly common amongst respondents that lived in a rented house. Being able to protect, either your chickens, vegetables or newly planted trees, from dogs, cows or other animals roaming the village also determined whether they could be turned into useful ecosystem services.
Acts of mobilisation did not only have to relate to access to physical and material resources. Respondents that did not use the cultural services, e.g. worshipped Nagabana or performed the samudra snana quite often said they were too old or did not have the physical health required. Having the knowledge is another act of mobilisation required for some of the services. “I don't know how to prepare herbals” was an answer given to why medicinal plants were not used. Similarly, catching fish would not be possible without a certain level of knowledge. An ecosystem function won’t be mobilised and turned into a service unless a use value attribution has taken place (Spangenberg et al. 2014b). Some respondents said they had no interest in mobilising and using certain services from within the village. If they wanted e.g. fruits or vegetables they would instead go and buy them from outside of the village, at a market or similar place. Others found no value in using water from the well when they could more easily get water provided by the municipality pipeline. For some respondents, using firewood for cooking was valued and they would collect wood from the trees to mobilise the service. The food will taste better if cooked on firewood, a person in Panamburu argued. Others saw no value in the firewood as they found their gas more easy and convenient to use. The use of cultural services of sacred/spiritual origin also required a use value attribution. Without an interest, trust and belief in the ceremony and tradition of worship, the elements of nature were no longer regarded as services. To summarize, the results above show that both use value attribution and acts of mobilisation are needed in order to acquire a service, and also determines the use or non-use of them. The value of usage placed, or not placed, upon the ecosystem function is of a highly personal character. The acts of mobilisation relates to questions of access to land and resources, which may be influenced by biophysical, institutional and/or social conditions. In the case of the services coconuts, marine fish, plants for material use, shade by trees and worship of tulsi katte none of the respondents stated lack of use value attribution as a reason to not using the service. In other words, everyone wanted to use them but was limited by the acts of mobilisation.
4.4 Changes in supply and use of services over time In the description of the cascade model (section 4.2) it was stated that the use value attribution and the acts of mobilisation connected to the ecosystem services may change depending upon

32
place, group or time (Spangenberg et al. 2014b). As a long-term study to monitor changes over time was not suitable for this study, changes in the use of ecosystem services over time were instead recorded in the structured household interviews by asking respondents of their experience of change. Users of the provisioning services and “shade by trees” were asked “For you, using [the service] has it become: more easy, same or more difficult?” The results are presented in Figure 5, where the percentage of users per response category are shown for each one of the services; “edible fruits/nuts” (N = 47), “coconuts” (N = 52), “vegetables” (N = 15), “reared animals” (N = 5), “ground water for drinking” (N = 41), “medicinal plants” (N = 52), “plants for material use” (N = 38), “ground water for non-drinking” (N = 56), “firewood” (N = 19) and “shade by trees” (N = 54). Around 20 to 40% of the users per service said they had become more difficult to use. Only a relatively small fraction of users had found the services to be more easy to use. The rest of the respondents had found it the same, neither more easy nor more difficult, to use the services. In other words, the use of services had changed over time and was not perceived to be in a constant, static condition.
Figure 6. The percentage of users stating the change (more easy/same/more difficult) they have experienced in using the provisioning services and ”shade by trees”. Recorded in the structured household interviews.
The respondents were also asked the question of why the situation had changed. The replies given can be grouped into three broad categories related to changes in weather/climate, changes in availability of trees and changes in personal situation e.g. time available. ”More windy”, ”More hot and less rain”, ” Temperature is higher and rain varies more now. It is unpredictable” were some of the reasons given by them who found the changed weather/climate had made it more difficult for them to use the services. For the services related to trees e.g. edible fruits/nuts, firewood and shade by trees, the availability of them
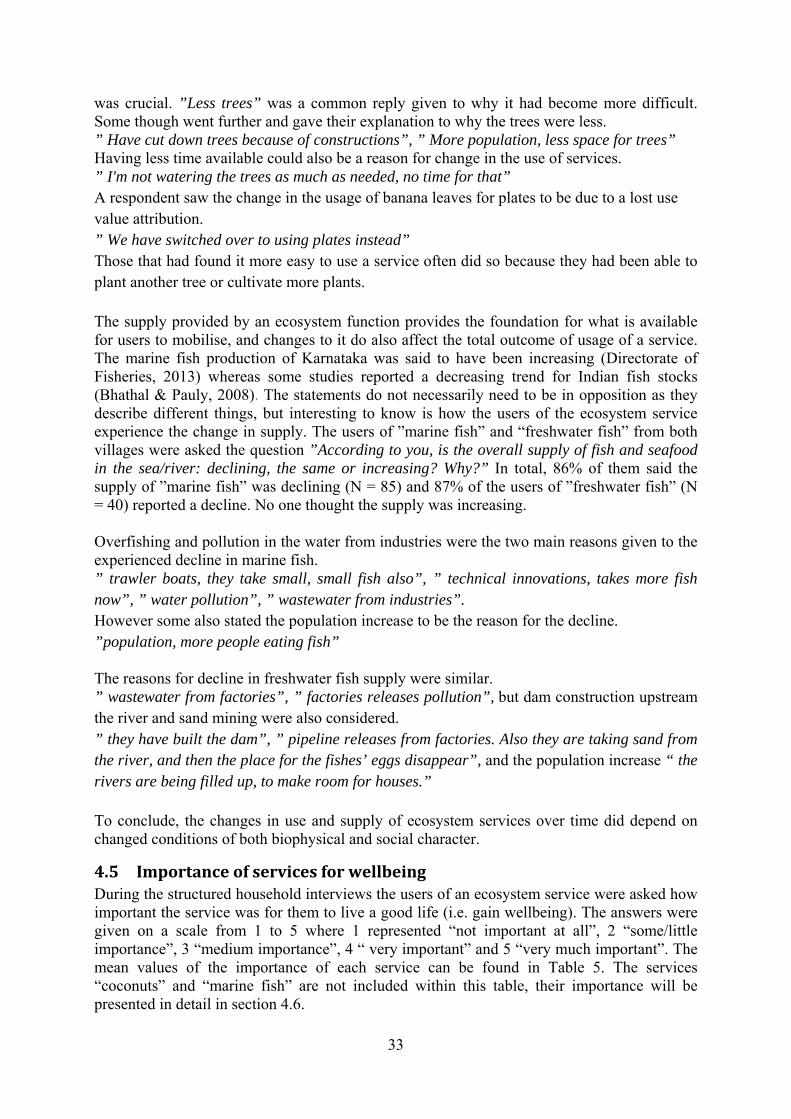
33
was crucial. ”Less trees” was a common reply given to why it had become more difficult. Some though went further and gave their explanation to why the trees were less. ” Have cut down trees because of constructions”, ” More population, less space for trees” Having less time available could also be a reason for change in the use of services. ” I'm not watering the trees as much as needed, no time for that” A respondent saw the change in the usage of banana leaves for plates to be due to a lost use value attribution. ” We have switched over to using plates instead” Those that had found it more easy to use a service often did so because they had been able to plant another tree or cultivate more plants. The supply provided by an ecosystem function provides the foundation for what is available for users to mobilise, and changes to it do also affect the total outcome of usage of a service. The marine fish production of Karnataka was said to have been increasing (Directorate of Fisheries, 2013) whereas some studies reported a decreasing trend for Indian fish stocks (Bhathal & Pauly, 2008). The statements do not necessarily need to be in opposition as they describe different things, but interesting to know is how the users of the ecosystem service experience the change in supply. The users of ”marine fish” and “freshwater fish” from both villages were asked the question ”According to you, is the overall supply of fish and seafood in the sea/river: declining, the same or increasing? Why?” In total, 86% of them said the supply of ”marine fish” was declining (N = 85) and 87% of the users of ”freshwater fish” (N = 40) reported a decline. No one thought the supply was increasing. Overfishing and pollution in the water from industries were the two main reasons given to the experienced decline in marine fish. ” trawler boats, they take small, small fish also”, ” technical innovations, takes more fish now”, ” water pollution”, ” wastewater from industries”. However some also stated the population increase to be the reason for the decline. ”population, more people eating fish” The reasons for decline in freshwater fish supply were similar. ” wastewater from factories”, ” factories releases pollution”, but dam construction upstream the river and sand mining were also considered. ” they have built the dam”, ” pipeline releases from factories. Also they are taking sand from the river, and then the place for the fishes’ eggs disappear”, and the population increase “ the rivers are being filled up, to make room for houses.” To conclude, the changes in use and supply of ecosystem services over time did depend on changed conditions of both biophysical and social character.
4.5 Importance of services for wellbeing During the structured household interviews the users of an ecosystem service were asked how important the service was for them to live a good life (i.e. gain wellbeing). The answers were given on a scale from 1 to 5 where 1 represented “not important at all”, 2 “some/little importance”, 3 “medium importance”, 4 “ very important” and 5 “very much important”. The mean values of the importance of each service can be found in Table 5. The services “coconuts” and “marine fish” are not included within this table, their importance will be presented in detail in section 4.6.

34
Table 5. The mean value with standard error (mean ± SE) and number of samples (N) for the rated importance for wellbeing of respective ecosystem service. Recorded in the structured household interviews. Listed in descending order.
Ecosystem service Importance, mean ± SE N
Worship of tulsi katte 4.90 ± 0.040 73
Ground water for drinking 4.83 ± 0.085 41
Ground water for non-drinking 4.79 ± 0.071 56
Worship of Ganga Maatha 4.74 ± 0.088 77
Worship of Nagabana 4.63 ± 0.089 82
Shadeby trees 4.59 ± 0.097 54
Freshwater fish 4.45 ± 0.124 40
Worship of ashwatha tree 4.44 ± 0.103 57
Worship of samudra snana 4.29 ± 0.136 69
Recreation on the beach 4.27 ± 0.104 71
Medicinal plants 4.25 ± 0.125 52
Firewood 3.89 ± 0.241 19
Edible fruits/nuts 3.85 ± 0.158 47
Plants for material use 3.47 ± 0.206 38
Vegetables 3.33 ± 0.333 15
Reared animals 3.00 ± 0.894 5
All of the services ranked a higher mean importance than 3. ”Worship of tulsi katte” had the overall highest mean value (4.90) and animals the lowest (3.00). The cultural services received overall higher mean values of importance than the provisioning services. The cultural services had mean values in the span of 4.27 to 4.90 whereas a majority of the provisioning services were found in the span between 3.00 to 4.00. Note the mean values of some services are based on relatively small sample sizes. Like the use of services, the mean importance of ecosystem services also varied between villages, gender and age groups. There was a significant difference between the importance of “freshwater fish” in Panamburu and Ullal (Mann-Whitney U test: U = 51. 5, n1 = 7, n2 = 33, P = 0.009). The importance of “recreation on the beach” (U = 362, n1 = 34, n2 = 37, P = 0.001), “performance of samudra snana” (U = 382.5, n1 = 33, n2 = 36, P = 0.003), “worship of ashwatha tree” (U = 289, n1 = 26, n2 = 31, P = 0.037) and “worship of tulsi” (U = 551, n1 = 44, n2 = 29, P = 0.039) between the two villages was also significantly different. Between men and women, the importance of “medicinal plants” (U = 183, n1 = 32, n2 = 20, P = 0.005) and “worship of Nagabana” (U = 653, n1 = 44, n2 = 38, P = 0.019) was significantly different. Between age groups differences in importance of services were also found. The Kruskal-Wallis test showed different importance of “ground water for drinking” (df = 2, P = 0.029), “firewood” (df = 2, P = 0.049), “ground water for non-drinking” (df = 2, P = 0.022), “shade by trees” (df = 2, P = 0.028) and “recreation on the beach” (df = 2, P = 0.031).

35
4.6 Contributions to the constituents of wellbeing The term wellbeing do however include a number of different constituents, and a single ecosystem service may contribute to several wellbeing constituents, both of material and non-material character several researcher have argued (for example Chan et al. 2012a; Daw et al. 2011; Dawson & Martin, 2015). During the structured household interview, respondents were therefore asked to rate on a scale from one to five (as described in section 4.5) the importance of “coconuts” and “marine fish” for each of the context customized categories of wellbeing (that had been developed from analysis of the qualitative data collection of phase one of the study). The results present examples of the multiple links existing between ecosystem services and constituents of wellbeing. The radar charts in Figure 6 - 13 constitute of 13 spokes, each one representing the context customized constituents of wellbeing. The spokes are graded from zero at the centre to five at the end, and each spoke will be crossed by the line at the mean value of importance received by respective constituent of wellbeing. The greater importance for wellbeing the further out in the chart the line will be found. In Figure 6 the overall mean importance of “coconuts” (N = 52) and “marine fish” (N = 85) are shown for each one of the thirteen context customized constituents of wellbeing. Note that the services contributed to not only one constituent of wellbeing but several, and to a variable degree of importance. Wellbeing constituents located at the top- right of the chart (income stability, cash income and labour, i.e. mainly material aspects) overall received lower values of importance, which indicate that the services contributed less to those parts of wellbeing. The contribution to wellbeing was also different between the two services. “Marine fish” had been given a higher importance for e.g. good social relations, freedom of choice and action and physical safety than “coconuts”.
Figure 7. The mean importance of “marine fish” (blue line, N = 85) and “coconuts” (red line, N = 52) for the context customized constituents of wellbeing. Recorded in the structured household interview where importance was rated on a scale from 1 (not important at all) to 5 (very much important).
Depending upon in which village the service was used or if it was used by a man or a woman, its contribution to wellbeing could become different. Users of “marine fish” in Ullal (N = 41) considered it to have an overall higher importance to wellbeing than what users in Panambur
0
1
2
3
4
5Physical safety
Income stability
Cash income
Labour
Good food
Nice house
Comfortable livingPhysical health
Mental health
Good social relations w/family
Good social relations w/community
Continuing tradition ofancestors
Freedom
Importance for constituents of wellbeing - type of service
Fish
Coconuts

36
did (N = 44) (Figure 7). The importance of coconuts was rated relatively equal by users in Panamburu (N = 32) and Ullal (N = 20) (Figure 8).
Figure 8. The mean importance of “marine fish” for the context customized constituents of wellbeing rated by users in Panamburu (blue line, N = 44) and Ullal (red line, N = 41). Recorded in the structured household interview with importance rated on a scale from 1 (not important at all) to 5 (very much important).
Figure 9. The mean importance of “coconuts” for the context customized constituents of wellbeing rated by users in Panamburu (blue line, N = 44) and Ullal (red line, N = 41). Recorded in the structured household interview with importance rated on a scale from 1 (not important at all) to 5 (very much important).
Men (N = 45) gave fish a higher rating of importance for income stability, cash income and labour, than what women did (N = 40) (Figure 9), which may be due to a higher percentage of men having an occupation related to fishing than women. The importance of “coconuts” on the other hand, was rated relatively similar by men (N = 33) and women (N = 19) (Figure 10).
012345
Physical safety
Income stability
Cash income
Labour
Good food
Nice house
Comfortable livingPhysical health
Mental health
Good social relations w/family
Good social relations w/community
Continuing tradition ofancestors
Freedom
Importance of fish for constituents of wellbeing - per village
Panamburu
Ullal
012345
Physical safety
Income stability
Cash income
Labour
Good food
Nice house
Comfortable livingPhysical health
Mental health
Good social relations w/family
Good social relations w/community
Continuing tradition ofancestors
Freedom
Importance of coconuts for constituent of wellbeing - per village
Panamburu
Ullal

37
Figure 10. The mean importance of “marine fish” for the context customized constituents of wellbeing rated by female (blue line, N = 40) and male (red line, N = 45) users. Recorded in the structured household interview with importance rated on a scale from 1 (not important at all) to 5 (very much important).
Figure 11. The mean importance of “coconuts” for the context customized constituents of wellbeing rated by female (blue line, N = 19) and male (red line, N = 33) users. Recorded in the structured household interview with importance rated on a scale from 1 (not important at all) to 5 (very much important).
The acts of mobilisation applied in order to access the ecosystem service did influence the extent and type of wellbeing gained. Respondents that mobilised “marine fish” by catching it by themselves (N = 29) reported fish to more important, to extent and range of constituents of wellbeing, than those that had a member in their household fishing (N = 35), and those that bought it (N = 21) (Figure 11). Worth noting is that fish was rated close to or above 4 in importance for good food, mental/physical health, good social relations with
012345
Physical safety
Income stability
Cash income
Labour
Good food
Nice house
Comfortable livingPhysical health
Mental health
Good social relations w/family
Good social relations w/community
Continuing tradition ofancestors
Freedom
Importance of fish for constituents of wellbeing - per gender
Female
Male
012345
Physical safety
Income stability
Cash income
Labour
Good food
Nice house
Comfortable livingPhysical health
Mental health
Good social relations w/family
Good social relations w/community
Continuing tradition ofancestors
Freedom
Importance of coconuts for constituents of wellbeing - per gender
Female
Male

38
family/community and continuing the tradition of ancestors, no matter if it had been mobilised through buying, catching or having a household member catching it.
Figure 12. The mean importance of “marine fish” for the context customized constituents of wellbeing rated by users who either bought the fish (blue line, N = 21), caught it themselves (red line, N =29) or had a member in their household who brought it home (green line, N = 35). Recorded in the structured household interview with importance rated on a scale from 1 (not important at all) to 5 (very much important).
Respondents that had a tree outside their house and plucked their own coconuts from it (N = 52) reported a considerably higher importance of coconuts for good social relations with family/community, nice house and comfortable living than what respondents without a tree, who instead bought their coconuts from outside, did (N = 33) (Figure 12).
Figure 13. The mean importance of “coconuts” for the context customized constituents of wellbeing rated by users who either bought their coconuts (blue line, N = 33) or had a tree at home to pluck them from (red line, N = 52), Recorded in the structured household interview with importance rated on a scale from 1 (not important at all) to 5 (very much important).
0
1
2
3
4
5Physical safety
Income stability
Cash income
Labour
Good food
Nice house
Comfortable livingPhysical health
Mental health
Good social relations w/family
Good social relations w/community
Continuing tradition ofancestors
Freedom
Importance of fish for constituents of wellbeing - type of mobilisation
Buy
Catch by oneself
Member inhousehold catch
012345
Physical safety
Income stability
Cash income
Labour
Good food
Nice house
Comfortable livingPhysical health
Mental health
Good social relations w/family
Good social relations w/community
Continuing tradition ofancestors
Freedom
Importance of coconuts for constituents of wellbeing - type of mobilisation
Buy
Have a tree athome

39
According to the cascade model once an ecosystem service has been mobilised and appropriated it can be commercialised (Spangenberg et al. 2014). “Marine fish” was an ecosystem service which was commercialised by fishermen and those who traded fish (fishing related occupation) but only used at household level by respondents with occupations not related to fishing (all other occupation categories). Respondents who used fish commercially (N = 31) reported a higher importance for - maybe not surprisingly - income stability, cash income, labour and the freedom to do and choose, than the household users (N = 54) (Figure 13). Interestingly though is that even if you did not use your fish commercially, its importance for the remaining constituents of wellbeing was rated almost equally the same.
Figure 14. The mean importance of “marine fish” for the context customized constituents of wellbeing rated by users who had a fishing related occupation (blue line, N = 31) and users with non-fishing related occupations (red line, N = 54). Recorded in the structured household interview with importance rated on a scale from 1 (not important at all) to 5 (very much important).
Worth noting is that no matter from what village or gender the user came from, how the service had been mobilised or if it was commercialised or not, coconuts and marine fish were always considered to be of high importance for providing good food, physical/ mental health and continuing the tradition of ancestors. The importance for good social relations was also an aspect acknowledged in almost all cases. The two services were classified as provisioning - nutrition (Table 3), but contributed to wellbeing by providing more than food. They were also important for keeping the body healthy, the mind happy and as part of a culture of long traditions.
5. Discussion The ecosystem service assessment of this study involved members of two Mogaveera communities and the ecosystem services connected to their respective neighbourhood within the two study site villages. Throughout the assessment a total of 24 ecosystem services were identified as being used by the members. The number is a relatively high considering only the services immediately connected to the study site area were included; an area which at a first glance might be seen as consisting of only the sea, sandy beaches and built up residential areas. Out of all services, 18 were investigated further and analysis of the quantitative data (Figure 2) showed for example that marine fish and the cultural services were widely used
012345
Physical safety
Income stability
Cash income
Labour
Good food
Nice house
Comfortable livingPhysical health
Mental health
Good social relations w/family
Good social relations w/community
Continuing tradition ofancestors
Freedom
Importance of fish for constituents of wellbeing - influence of commercialisation
Occupationfishingrelated
Occupationnot fishingrelated

40
whereas reared animals and vegetables were used only by a few. Water for drinking and non-drinking purposes were most often used on a daily basis as well as coconuts, firewood and recreation on the beach. The average importance of the services was rated on the upper half of the scale for all of the services (a score from three to five). The cultural services received the overall highest scores whereas reared animals received the lowest (3.00) together with some of the other provisioning services. For provision of the daily consumptive goods, the ecosystem services were maybe not the most important, apart from the fish and coconuts, but in terms of cultural services the place provided several services of highly rated importance. This information may provide some insight into the use of coastal ecosystems services, however the picture is quite generalised as the concept of ecosystem services may include more than just quantitative numbers of users. Critique has been raised against ecosystem service assessments for lacking or neglecting certain aspects, and this is what the purpose of this study was, to investigate the many more layers of values and processes that are involved in ecosystem service creation and use. In following section the previous presented empirical results will be discussed and brought together to conclude the purposes of the study. A discussion of how a changing environment may affect the ecosystem services and its implications for assessment will also be held. In the end a reflection upon biases and potential sources of errors is presented along with some suggestions for further research. There is a non-linear flow from ecosystem functions to beneficiaries The cascade model was used as a theoretical framework in this study to help identify processes connected to the creation of ecosystem service and highlight the non-linear flow from ecosystem functions to beneficiaries. Applying a use value on the ecosystem function is the first step in turning it into a service. Respondents who lacked interest or belief for a particular ecosystem function simply had no reason for using it, or they would substitute it by something else that provided the functionality but were of higher preference. The ecosystem service concept thus had become a social construct, as Spangenberg et al. (2014b) pointed out. Fruits and vegetables could for example be bought from markets, which some respondents rather did as they found that option more easy and convenient and thus had no interest in cultivating plants (see Table 4). Taking water from the pipeline system was also preferred by some as they had found that more convenient than using the well. To note though is that the provisioning service of food and water did not go completely unused on a wider scale; the locally produced service had just been substituted by import from somewhere else. The demand for the service still remained but it was extracted from an ecosystem outside of the village. The spatial relationships existing between service production areas and benefit areas constitute another aspect of the ecosystem service concept, an aspect that is particularly important to consider in landscape management across scales (Fisher et al. 2009). The situation with for example the use of water raises questions of distribution management and its related concerns of equity and sustainability. The lack of use value attribution may also imply a complete non-use of the service, as in the case of the use of firewood. The availability of gas had made firewood unnecessary for some users, which might be seen as a lucky occurrence as those who wanted to use firewood reported difficulties in mobilising the services due to fewer trees available in the villages (Table 4). Fisher et al. (2014) argues that wellbeing is not always and/or entirely achieved by the use of ecosystem services. The direct use of ecosystem services may be substituted by technological solutions, with wellbeing retained or even extended. Important to keep in mind though is that in this study not everyone wanted to gas. Several respondents preferred using firewood and for them their wellbeing had probably not been the same if substitution to gas

41
had occurred. Exactly why these people preferred firewood remains unclear; did they all like the taste of food cooked on firewood better, or was the gas too costly? The replies may be found decisive for management actions and planning. Acts of mobilisation required to obtain a service may be multiple and depend on a variation of conditions of for example social, institutional and biophysical origin. As seen in Table 4 in the results, the fish might be there in the sea and the climate for fruit trees might be perfect, but unless you have availability of resources to access those ecosystem functions you are never the less able to use them. In the case of fish (marine and freshwater) the acts of mobilisation required were probably amongst the most complex ones. Modern fishing requires advanced technology and financial resources along with some sort of education in how a fishing boat is operated. Fishermen using traditional boats (a relatively common practice within the two study villages) are also dependent upon availability of space; for landing and storing the boats, for net repairs as well as for fishing grounds at sea. Population increases, coastal developments and expansions of the fishing sector all have the potentials to change the space availability. The provision of ecosystem services is determined by human agency and not by the ecosystem function, (Spangenberg et al. 2014a) argues, which is a valid statement in the discussion of this study. The ecosystem functions are not automatically turned into pre-determined services available for beneficiaries to use, multiple inputs of varying character are required creating the non-linear, indirect flow from ecosystems to humans. The links between service and wellbeing are multiple Once ecosystem services have been made available for use they may contribute to the wellbeing of the user. That the ecosystem services were important for wellbeing was fairly evident, as seen in Table 5 where all the services on average were rated with scores on the upper half of the scale. However, similarly to the creation of services, the links between a service and the wellbeing it brings are multiple and diverse, as discussed by for example Dawson & Martin, (2015), Chan et al. (2012a) and Daw et al. (2011). The disaggregation of wellbeing constituents into thirteen context customized sub-categories therefore provided a more precise study of the relationship between a service and its contributions to wellbeing. Marine fish and coconuts were not only considered important for one constituent of wellbeing alone but for more or less all of them (Figure 6), and each of the services displayed their own unique pattern of wellbeing contributions. The type and extent of rating the constituents of wellbeing received also depended upon the user group of the service. Respondents from Ullal (Figure 7) and respondents who were men (Figure 9) tended to rate a higher importance of nearly all constituents of wellbeing of fish than what respondents from Panamburu and women did. The mode of mobilisation also affected the wellbeing gained from the services. People who caught the fish themselves thought it brought a greater importance for wellbeing than what those that bought their fish did (Figure 11). The motives and reasons behind these differences in importance of ecosystem services between user groups may be several and complex. Differences in proportion of people involved in fishing across villages and gender might be an explanation. Respondents that had their own coconut tree found them brining some extra wellbeing that the coconuts that were bought did not. Considering the revered status of the coconut tree, it is understandably that having a tree by your house contributes to more aspects of wellbeing than just providing something to eat. Important to note though is that sometimes the importance for wellbeing is considered fairly the same by everyone. As in the case of coconuts where it did not matter what village (Figure 8) or what gender (Figure 10) the user had, the coconuts were considered to contribute to almost the same constituents

42
of wellbeing. The model of the relationship between ecosystem services and wellbeing presented in the Millennium Ecosystem Assessment (2005, p. 6) may be useful and illustrative. However it depicts the linking arrows between services and constituents of wellbeing on a pre-defined scale of intensity of relation. Provisioning services are for example said to have a strong link to basic material for good life and health whereas the link to good social relations is weak. The results of this study has in contrary shown that these linkages are highly variable and context dependent, which leads me to argue that the MEA-model depicts a situation that is too much simplified and generalised. Context is important for ecosystem services Because of the non-linear flow from ecosystem functions to beneficiaries and the multiple links between services and wellbeing, the context comes to play a vital part in determining which ecosystem services are used and how they are valued. By analysing the quantitative data, significant differences could be found between groups of users, in both the use of services (Figure 3 and 4) and the mean rating of its importance (section 6.5), which shows that context matters. Even though the two villages were located geographically close to each other with relatively similar landscape profile, their respective inhabitants did not use and value the ecosystems services the same. If you were a man or a woman did also matter, and to some extent your age as well, and if further studies had been done other user groups could probably have been distinguished. The results confirm the argument put forward by Daw, et al. (2011) and Fisher et al. (2014), that analysis of ecosystem services and wellbeing needs to disaggregate and differentiate beneficiary groups, an act becoming more important the greater the inequalities amongst users are. The use of services was also found to be different across time (Figure 5). Explanations to why the situation looks like that may only be found through qualitative studies. In this case the results gathered by analysing qualitative data through the cascade model framework did provide one set of potential explanations. The results of the quantitative analysis showed for example that provisioning services, especially those of cultivated origin were used to a greater extent in Panamburu than in Ullal. Space and place for a tree/a plot and access to suitable soil/weather conditions were two acts of mobilisations mentioned as needed in order to use several of the provisioning services. As described in the study site description, Ullal is a village more exposed to erosion and rough weather and hosts a larger population than what Panamburu does, which possibly makes that place less favourable for cultivation and causes its inhabitants to use less of ecosystem services related to that. The statements given by users of why they had experience a change in use or change in supply of the service provide insights into how the services are used and what affects them, which may provide valuable guidance for potential management interventions.
Panamburu and Ullal may at first sight look like very similar places and the Mogaveera community may be considered as a “homogenous” group. However, the results show that several differences in how they use and value the ecosystem services exist. If an ecosystem service assessment was to be undertaken in a larger spatial area and/or including more than one stakeholder groups, the complexity would certainly increase substantially. Simplifications and generalisations might follow as a consequence, risking the assessments to be inaccurate or irrelevant.
Non-material values exist and matter The cultural services were the ones used by most people (Figure 2) and they received an overall higher rating of importance than the other services (Table 5). The more ”materialistic” constituents of wellbeing – physical safety, income stability, cash income, and labour – were
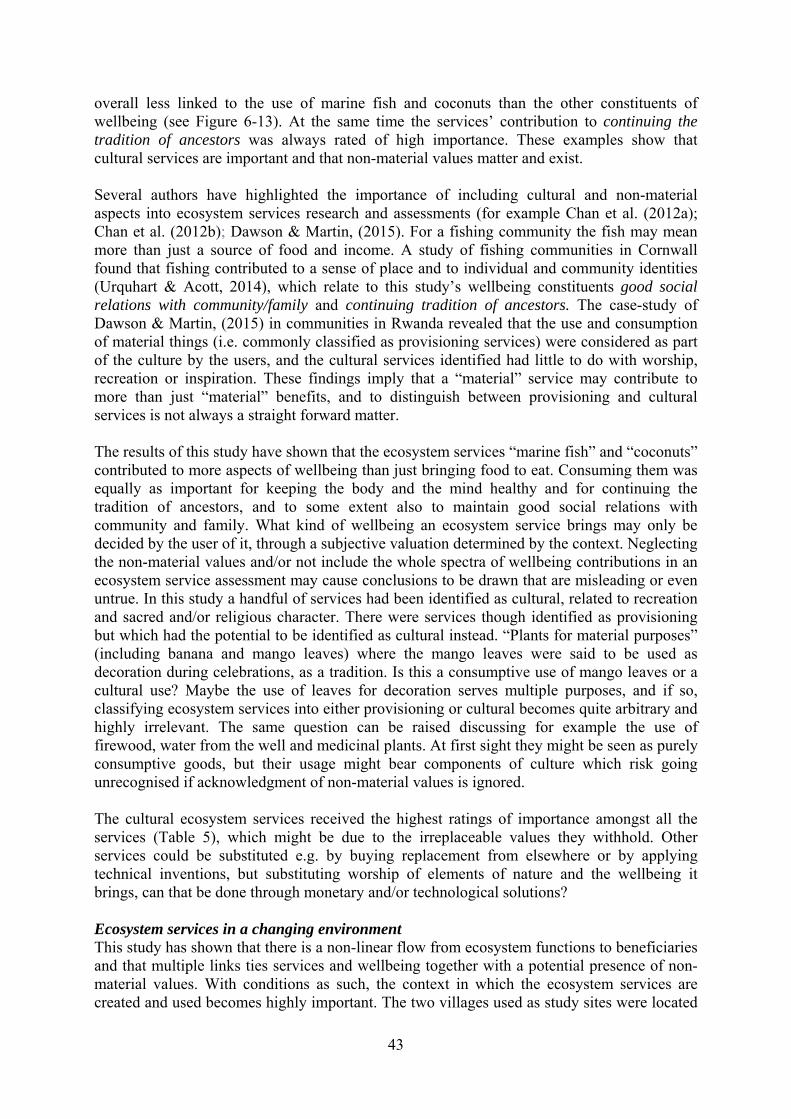
43
overall less linked to the use of marine fish and coconuts than the other constituents of wellbeing (see Figure 6-13). At the same time the services’ contribution to continuing the tradition of ancestors was always rated of high importance. These examples show that cultural services are important and that non-material values matter and exist. Several authors have highlighted the importance of including cultural and non-material aspects into ecosystem services research and assessments (for example Chan et al. (2012a); Chan et al. (2012b); Dawson & Martin, (2015). For a fishing community the fish may mean more than just a source of food and income. A study of fishing communities in Cornwall found that fishing contributed to a sense of place and to individual and community identities (Urquhart & Acott, 2014), which relate to this study’s wellbeing constituents good social relations with community/family and continuing tradition of ancestors. The case-study of Dawson & Martin, (2015) in communities in Rwanda revealed that the use and consumption of material things (i.e. commonly classified as provisioning services) were considered as part of the culture by the users, and the cultural services identified had little to do with worship, recreation or inspiration. These findings imply that a “material” service may contribute to more than just “material” benefits, and to distinguish between provisioning and cultural services is not always a straight forward matter. The results of this study have shown that the ecosystem services “marine fish” and “coconuts” contributed to more aspects of wellbeing than just bringing food to eat. Consuming them was equally as important for keeping the body and the mind healthy and for continuing the tradition of ancestors, and to some extent also to maintain good social relations with community and family. What kind of wellbeing an ecosystem service brings may only be decided by the user of it, through a subjective valuation determined by the context. Neglecting the non-material values and/or not include the whole spectra of wellbeing contributions in an ecosystem service assessment may cause conclusions to be drawn that are misleading or even untrue. In this study a handful of services had been identified as cultural, related to recreation and sacred and/or religious character. There were services though identified as provisioning but which had the potential to be identified as cultural instead. “Plants for material purposes” (including banana and mango leaves) where the mango leaves were said to be used as decoration during celebrations, as a tradition. Is this a consumptive use of mango leaves or a cultural use? Maybe the use of leaves for decoration serves multiple purposes, and if so, classifying ecosystem services into either provisioning or cultural becomes quite arbitrary and highly irrelevant. The same question can be raised discussing for example the use of firewood, water from the well and medicinal plants. At first sight they might be seen as purely consumptive goods, but their usage might bear components of culture which risk going unrecognised if acknowledgment of non-material values is ignored. The cultural ecosystem services received the highest ratings of importance amongst all the services (Table 5), which might be due to the irreplaceable values they withhold. Other services could be substituted e.g. by buying replacement from elsewhere or by applying technical inventions, but substituting worship of elements of nature and the wellbeing it brings, can that be done through monetary and/or technological solutions? Ecosystem services in a changing environment This study has shown that there is a non-linear flow from ecosystem functions to beneficiaries and that multiple links ties services and wellbeing together with a potential presence of non-material values. With conditions as such, the context in which the ecosystem services are created and used becomes highly important. The two villages used as study sites were located

44
in a coastal urban environment that had undergone, and still is, rapid changes in demographic and socio-economic structure, which may cause the context for ecosystem services to change as well. The value applied to using a certain service might change easily and/or quickly over time. Some respondents said they had no interest in using medicinal plants as they rather used “ready-made” medicine from the pharmacy. With changed preferences over time, those species of plants might not be considered as ecosystem services in the future. Both of the villages displayed a trend of increasing literacy rates, a factor that has the potential to change the socio-economic situation of individuals and thereby also possibilities for mobilisation of ecosystem services. The wellbeing gained from using a service is dependent upon the values of the user, which changes with context and over time. The fish might be found as important for certain aspects of wellbeing today, but in a future where maybe the income is secured by other another job and the lifestyle of the fishing community looks different, then the fish might contribute to a different type of wellbeing. Important to keep in mind is, as said before, wellbeing doesn’t necessarily have to be achieved by the use of ecosystem services. A decreased use of a service is not necessarily synonymous with lowered wellbeing. Sometimes the situation can be rather the opposite; movement away from the direct use of ecosystem services happens when a certain level of socio-economic standard has been reached and substitutes become available. Even though substitutes for ecosystem services can be made by technical inventions, certain characters, especially those tied to cultural and non-material values may be more difficult to replace. This is another reason to why it is important to include qualitative aspects when analysing data on changes in use of ecosystem services. One needs to know why the change is taking place otherwise wrongfully conclusions might be drawn. Implications for assessment The contextual importance of ecosystem services in combination with rapidly changing environments across time and space, demand for certain care to be taken when assessing, researching and/or valuating them. An ecosystem service assessment undertaken in a coastal fishing community in Sweden had probably identified and valued services differently than what was done in this study. The environmental conditions may be different but also the values that shape and create the services. Models and routines for ecosystem service assessments developed in a western context may therefore not automatically be suitable for every other country and location, and vice versa. As ecosystem service assessments have been, and are, used for development of policies and in land, resource and conservation management the accuracy of them is highly important as decisions based upon them may cause noticeable effects on human wellbeing and the environment. Context and non-material values need to be investigated in order to fully understand the importance of ecosystem services and its links to wellbeing at the place of study, which is done thorough qualitative studies. Several studies have highlighted a need for inclusion of qualitative methods, social science and/or interdisciplinary research to study ecosystem services (e.g. Chan et al. 2012a; Chan et al. 2012b; Dawson & Martin, 2015; Jax et al. 2013; Luck et al. 2012; Potschin & Haines-Young, 2013). Applying the place-based approach along with the cascade model was found to be effective tools in order to achieve this. The mixed methods research design in turn facilitated the inclusion of these frameworks and allowed both quantitatively and qualitatively measures and analysis to take place. It enforced the build of context understanding, enabled the objectives to be met and the purposes of the study

45
fulfilled. It did demand a broader set of research skills though and due to the multiple types of data collections and analysis it also required more time. However, as seen in this study, merging qualitative data with quantitative was crucial in order to achieve the quality and the depth of the study.
Reflection upon biases and potential sources of errors As a researcher from a western context conducting studies in Indian coastal communities, the results and conclusion taken within this study will always remain a subjective interpretation and I do by no means claim to give a complete or correct account of ecosystem services and their importance within the place. Misinterpretations of data and biases of results and may exist. As a non-local person it might be difficult to fully understand the context and intangible cultural values, which were plentiful. In a western culture, in general, spiritual/religious values attached to ecosystem services might not be as present and plentiful as within this study. The unfamiliarity with such values might obstruct the identification of them and bias the results, a situation that might be a source of error for any person assessing ecosystem services within a different context. Measures were however taken in order to prevent and minimise the biases and subjectivity of the study. By a careful choice of research design and methods and a thorough and complementing set of data, the results of the study are considered to be as objective and free from biases as the circumstances would allow. Suggestions for further research With the expanding interest and application and use of ecosystem services around the world the importance for well researched models, methods and routines for assessment grows. As seen in this study, assessing ecosystem services is complex and understanding them requires a highly local perspective, which may make it difficult to generalise across spatial or temporal scales. Would it be possible to develop models that could be applicable in any context with the qualities described in this study retained? We humans are surrounded, depend and interact constantly with the environment around us, but what it means to us and our wellbeing can be explore further. With changing environment and ecosystems that are disappearing this becomes even more urgent, we hardly know what we are about loose and never the less how it might affect our wellbeing.
6. Conclusions Ecosystem service concepts and assessments have been criticised for lacking or neglecting certain aspects, especially those related to the social dimensions of usage. A case study was set up to assess the ecosystem services of two coastal fishing villages undergoing rapid changes in urbanisation. By the use of a mixed methods research design qualitative and quantitative data were collected, and from the results of the empirical data the study can conclude that; 1. There is a non-linear flow from ecosystem functions to beneficiaries, 2. The links between service and wellbeing are multiple, 3. Context is important for ecosystem services and 4. Non-material values exist and matter. When assessment of ecosystem services are to be made, it is of great help to use the cascade model for identification of connected acts of mobilisation and values that influence the creation of services. Identifying these processes facilitates the understanding of why certain services are used and why the use of them may differ depending upon context. Values determines which ecosystem functions that are to be turned into services and used, and when ecosystem services are to be identified at a place it is crucial to recognise the existence

46
values and their contextual variability, otherwise the list of identified services might be completely irrelevant. When measuring use and importance of ecosystem services, context should also be taken into consideration. Different groups of people may use and value the services differently. To avoid generalisations and the risk of excluding the needs of particular groups a disaggregation is necessary. The use of ecosystem services can contribute to our wellbeing. How the services link to our wellbeing is however relatively complex, the links are multiple and one service may contribute to several constituents of wellbeing at varying degree. The links are contextually determined and may involve intangible, non-material values. Such values may be difficult to identify and even more difficult to measure. Care should therefore be taken when ecosystem services are evaluated; they may withhold invaluable values for the user that are invisible and/or hard to understand for someone from the outside. The mixed methods research design applied in this study was crucial to facilitate collection and analysis of the multiple types of data the study required. The design allowed qualitative and quantitative data to complement each other and thus reduce biases. For ecosystem service assessments of interdisciplinary character it therefore fit very well. Mangaluru is only one of many other coastal cities in the world currently undergoing rapid changes of urbanisation and development. The coastal intensification may change the ecosystems from which wellbeing is derived, but exactly how we don’t know yet. Understanding the use of ecosystem services and how we depend upon them therefore becomes even more and more urgent. Having ecosystem service concepts and methods for assessments that include and not exclude people’s need and that consider and not oversee people’s values are important.
Acknowledgement I would like to thank my supervisors, Prof. Em. Göran Dave and Dr. Per Knutsson, at the University of Gothenburg for their guidance throughout the project. A special thanks goes to Prof. Em. Ramachandra Bhatta for invaluable support. I would also like to express my deepest gratitude towards my interpreter and friends around Mangaluru for your assistance and good company as well as to all the participants of the study for sharing your thoughts. To those of you who have read the drafts, provided comments, ideas and new perspectives of the thesis I am also highly thankful. This master thesis was conducted by the support of Nitte University, Mangaluru, and the University of Gothenburg through a collaborative research project. It was founded by the Minor Field Study scholarship provided by the Swedish International Development Cooperation Agency (SIDA).

47
References Abunge, C., Coulthard, S. & Daw, T. M., 2013. Connecting marine ecosystem services to human well-being: insights from participatory well-being assessment in Kenya. AMBIO, Volume 42, pp. 1010-1021.
Bagstad, K. J., Semmens, D. J., Waage, S. & Winthrop, R., 2013. A comparative assessment of decision-support tools for ecosystem services quantification and valuation. Ecosystem Services, Volume 5, pp. e27-e39.
Barbier, E. B., Hacker, S. D., Kennedy, C., Koch, E., Stier, A. C., Silliman, B. R, 2 011. The value of estuarine and coastal ecosystem services. Ecological Monographs, 81(2), pp. 169-193.
Bhalla, P. P., 2014. Hindu rites, rituals, customs & traditions. New Delhi: Hindoology Books.
Bhathal, B. & Pauly, D., 2008. 'Fishing down marine food webs' and spatial expansion of coastal fisheries in India, 1950-2000. Fisheries Research, Volume 91, pp. 26-34.
Boyd, J. & Banzhaf, S., 2007. Waht are ecosystem services? The need for standardized environmental accounting units. Ecological Economics, Volume 63, pp. 616-626.
Braat, L. C. & Groot, R. de., 2012. The ecosystem services agenda: bridging the worlds of natural science and economics, conservation and development, and public and private policy. Ecosystem Services, Volume 1, pp. 4-15.
Brown, K., Daw, T., Rosendo, S., Bunce, M., Cherrett, N., 2008. Ecosystem services for poverty alleviation: Marine and coastal situational analysis. Synthesis Report, s.l.: ESPA.
Central Marine Fisheries Research Institute, 2010. Marine Fisheries Census 2010 Karnataka, Kochi: Central Marine Fisheries Research Institute.
Chan, K. M. A., Guerry, A. D., Balvanera, P., Klain, S., Satterfield, T., Basurto, X., Bostrom, A., Chuenpagdee, R., Gould, R., Halpern, B. S., Hannahs, N., Levine, J., Norton, B., Ruckelshaus, M., Russell, R., Tam, J., Woodside, U., 2012a. Where are cultural and social in ecosystem services? A framework for constructive engagement. BioScience, Volume 62, pp. 744-756.
Chan, K. M. A., Satterfield, T. & Goldstein, J., 2012b. Rethinking ecosystem services to better address and navigate cultural values. Ecological Economics, Volume 74, pp. 8-18.
Costanza, R., d'Arge, R., Groot, R. de., Farber, S., Grasso, M., Hannon, B., Limburg, K., Naeem, S., O'Neil, R. V., Paruelo, J., Raskin, R. G., Sutton, P., Belt, M. van den.,1997. The value of the world's ecosystem services and natural capital. Nature, Volume 387, pp. 253-387.
Creswell, J. W. & Plano Clark, V. L., 2011. Designing and conducting mixed methods research. 2nd ed. Los Angeles: Sage Publications, Inc.

48
Daily, G. C. ed., 1997. Nature's serivces: Societal dependance on natural ecosystems. Washington DC: Island Press.
Dawson, N. & Martin, A., 2015. Assessing the contribution of ecosystem services to human wellbeing: A disaggregated study in western Rwanda. Ecological Economics, Volume 117, pp. 62-72.
Daw, T., Brown, K., Rosendo, S. & Pomeroy, R., 2011. Applying the ecosystem services concept to poverty alleviation: the need to disaggregate human well-being. Environmental conservation, 68(4), pp. 370-379.
Directorate of Fisheries, 2013. Statistical Bulletin of Fisheries, Bangalore: Government of Karnataka, Department of Fisheries.
Directorate of Fisheries, 2015. Karnataka fisheries at a glance 2014-15, Bangalore: Government of Karnataka Department of Fisheries.
Dwarakish, G. S., Vinay, S. A., Natesan, U., Asano, T., Kakinuma, T., Venkataramana, K., Pai, J. B., Babita, M. K., 2009. Coastal vulnerability assessment of the future sea level rise in Udupi coastal zone of Karnataka state, west coast of India. Ocean & Coastal Management, Volume 52, pp. 467-478.
Environmental Management & Policy Research Institute, 2012. State of Environment Report Karnataka, Bangalore: Environmental Management & Policy Research Institute.
Esaiasson, P., Gilljam, M., Oscarsson, H. & Wängnerud, L., 2012. Metodpraktikan: Konsten att studera samhälle, individ och marknad. 4th ed. Stockholm: Norstedts.
European Commission, 2014. Mapping and assessment of ecosystems and their services: Indicators for ecosystem assessments under Action 5 of the EU Biodiversity Strategy to 2020. Technical Report 2014-080 , s.l.: European Union.
Fisher, J. A., Patenaude, G., Giri, K., Lewis, K., Meir, P., Pinho, P., Rounsevell, M. D. A., Williams, M., 2014. Understanding the relationships between ecosystem services and poverty alleviation: A conceptual framework. Ecosystem Services, Volume 7, pp. 34-45.
Fisher, B. & Turner, K. R., 2008. Ecosystem services: Classification for valuation. Biological Conservation, Volume 141, pp. 1167-1169.
Fisher, B., Turner, K. R. & Morling, P., 2009. Defining and classifying ecosystem services for decision making. Ecological Economics, Volume 68, pp. 643-653.
Government of India, 2011. National Census of India, New Delhi: The Registrar General & Census Commissioner.
Government of Karnataka, 2006. Karnataka Human Development Report 2005, Bangalore: Planning and Statistics Department, Government of Karnataka.

49
Groot, R. de., Brander, L., Ploeg, S. van der., Costanza, R., Bernard, F., Braat, L., Christie, M., Crossman, N., Ghermandie, A., Hein, L., Hussain, S., Kumar, P., McVittie, A., Portela, R., Rodriguez, L. C., Brink, P. ten., Beukering, P. van., 2012. Global estimates of the value of ecosystems and thier services in monetary units. Ecosystem services, Volume 1, pp. 50-61.
Groot, R. de., Wilson, M. A. & Boumans, R. M. J., 2002. A typology for the classification, description and valuation of ecosystem functions, goods and services. Ecological Economics, Volume 41, pp. 393-408.
Gunakar, S., 2012. Role of economic and socila institutions in the fisheries post-harvest sector of coastal Karnataka, Ph. D. Thesis, Mangalagangotri: Mangalore University.
Haines-Young, R. & Potschin, M., 2010. The links between biodiversity, ecosystem services and human well-being. In: D. G. Raffaelli & C. L. J. Frid, eds. Ecosystem Ecology: A New Synthesis. s.l.:Cambridge University Press, pp. 110-139.
Haines-Young, R. & Potschin, M., 2013. Common International Classification of Ecosystem Services (CICES): Consultation on version 4, August-December 2012. EEA Framework Contract No EEA/IEA/09/003. [Online] [Accessed 2016-02-01].
IBM SPSS Statistics, 2016. Help-Exact Tests. [Online] Available at: http://127.0.0.1:50640/help/index.jsp?topic=%2Fcom.ibm.spss.statistics.help%2Fspss%2Fbase%2Fovervw_auto_0.htm [Accessed 2016-04-20].
IPBES, 2016. About IPBES. [Online] Available at: http://www.ipbes.net/about-us [Accessed 2016-07-30].
Jax, K., Barton, D. N., Chan, K. M. A.,Groot, R. de., Doyle, U., Eser, U., Görg, C., Gómez-Baggethun, E., Griewald, Y., Haber, W., Haines-Young, R., Heink, U., Jahn, T., Joosten, H., Kerschbaumer, L., Korn, H., Luck, G. W., Matzdorf, B., Muraca, B., Nesbhöver, C., Norton, B., Ott, K., Potschin, M., Rauschmayer, F., Haaren, C. von., Wichmann, S., 2013. Ecosystem services and ethics. Ecological Economics, Volume 93, pp. 260-268.
Kumar, A., Narayana, A. C. & Jayappa, K. S., 2010. Shoreline changes and morphology of spits along southern Karnataka, west coast of India: A remote sensing and statistics-based approach. Geomorphology, Volume 120, pp. 133-152.
Kuntoji, G. & Rao, S., 2015. A review on development of minor ports to improve the economy of developing countries. Aquatic Proceedia, Volume 4, pp. 256-263.
Lamarque, P., Quétier, F. & Lavorel, S., 2011. The diversity of ecosystem services concept and its implications for their assessment and management. Comptes Rendus Biologies, Volume 334, pp. 441-449.

50
Liquete, C., Piroddi, C., Drakou, E. G., Gurney, L., Katsanevakis, S., Charef, A., Egoh, B., 2013. Current status and future prospects for the assessment of marine and coastal ecosystem services: A systematic review. PLoS One, 8(7), p. e67737.
Luck, G. W., Chan, K. M. A., Eser, U., Gómez-Baggethun, E., Matzdorf, B., Norton, B., Potschin, M. B., 2012. Ethical considerations in on-ground applications of the ecosystem services concept. BioScience, 62(12), pp. 1020-1029.
Martinez, M. L., Intralawan, A., Vázquez, G., Pérez-Maqueo, O., Sutton, P., Landgrave, R., 2007. The coasts of our world: Ecological, economic and social importance. Ecological Economics, Volume 63, pp. 254-272.
Millennium Ecosystem Assessment, 2005. Ecosystems and human well-being: Synthesis, Washington DC: Island Press.
Narayan, D., Chambers, R., Shah, M. K. & Petesch, P., 2000. Voices of the poor: Crying out for change. New York: Oxford University Press.
Neumann, B., Vafeidis, A. T., Zimmermann, J. & Nicholls, R. J., 2015. Future coastal population growth and exposure to sea-level rise and coastal flooding: A global assessment. PLoS One, 10(3), p. e0118571.
Pollnac, R. B., Pomeroy, R. S. & Harkes, I. H. T., 2001. Fishery policy and job satisfaction in three southeast Asian fisheries. Ocean & Coastal Management, Volume 44, pp. 531-544.
Portman, M. E., 2013. Ecosystem services in practice: Challenges to real world implementation of ecosystem services across multiple landscapes - a critical review. Applied Geography, Volume 45, pp. 185-192.
Potschin, M. B. & Haines-Young, R. H., 2011. Ecosystem services: Exploring a geographical perspective. Progress in Physical Geography, 35(5), pp. 575-594.
Potschin, M. & Haines-Young, R., 2013. Landscapes, sustainability and the place-based analysis of ecosystem services. Landscape Ecology, Volume 28, pp. 1053-1065.
Ranganathan, J., Raudsepp-Hearne, C., Lucas, N., Irwin, F., Zurek, M., Bennett, K., Ash, N., West, P., 2008. Ecosystem services: A guide for decision makers, s.l.: World Resource Institute.
Seppelt, R, Dormann, C. F., Eppink, F. V., Lautenbach, S., Schmidt, S., 2011. A quantitative review of ecosystem service studies: approaches, shortcomings and the road ahead. Journal of Applied Ecology, Volume 48, pp. 630-636.
Seto, K. C., Parnell, S. & Elmqvist, T., 2013. A global outlook on urbanization. In: Elmqvist, T., et al. eds. Urbanization, Biodiversity and Ecosystem Services: Challenges and Opportunities. Dordrecht Heidelberg New York London: Springer.
51
Shirodkar, P. V., Mesquita, A., Pradhan, U. K., Verlekar, U. K., Babu, M. T., Vethamony, P., 2009. Factors controlling physico-chemical characteristics in the coastal waters off Mangalore: A multivariate approach. Environmental Research, Volume 109, pp. 245-257.
Space Applications Centre (ISRO), 2012. Coastal zones of India, Ahmedabad: Space Applications Centre (ISRO).
Spangenberg, J. H., Görg, C., Truong, D. T., Tekken, V., Bustamante, J. V., Settele, J., 2014a. Provision of ecosystem services is determined by human agency, not ecosystem functions. Four case studies. International Journal of Biodiversity Science, 10(1), pp. 40-53.
Spangenberg, J. H., Haaren, C. von. & Settele, J., 2014b. The ecosystem service cascade: Further developing the metaphor. Integrating societal processes to accomodate social processes and planning, and the case of bioenergy. Ecological Economics, Volume 104, pp. 22-32.
TEEB, 2010. Mainstreaming the economics of nature: A synthesis of the approach, conclusions and recommendations of TEEB, s.l.: TEEB.
Thukaram, U. D., Chadaga, M. D. & Naveenchandra, B. D., 2014. An integrated approach of satellite remote sensing technology and geographical information system for the land use cover change detection studies for urban planning of Mnagalore taluk of Karnataka State, India. International Journal of Scientific and Research Publications, 4(5), pp. 2250-3153.
Uchila, S. K., 2016a. Mogaveera Organizations. [Online] Available at: http://www.mogaveeracommunity.com/mogaveera-organizations.html [Accessed 2016-07-31].
Uchila, S. K., 2016b. Mogaveera Religious Practices. [Online] Available at: http://www.mogaveeracommunity.com/mogaveera-religious-practices.html [Accessed 2016-07-31].
Uchila, S. K., 2016c. Occupations of Mogaveeras. [Online] Available at: http://www.mogaveeracommunity.com/occupations-mogaveeras.html [Accessed 2016-07-31].
Uchila, S. K., 2016d. Origin of Mogaveeras. [Online] Available at: http://www.mogaveeracommunity.com/origin-mogaveeras.html [Accessed 2016-07-31].
United Nations Environment Programme, 2016. Cities and Coastal Areas. [Online] Available at: http://www.unep.org/urban_environment/issues/coastal_zones.asp [Accessed 2016-07-30].
Urquhart, J. & Acott, T., 2014. A sense of place in cultural ecosystem services: the case of Cornish fishing communities. Society & Natural Resources, Volume 27, pp. 3-19.

52
Appendix A
Table A1. Direct observations conducted during the study. Listed along with date and duration, location and description.
Date/duration Location Description 2016-02-06, 7 hours Panamburu village (study site) In company with field enumerators 2016-02-15, 7 hours Ullal village (study site) In company with field enumerators
2016-02-07, 2 hours Panamburu Beach (tourist and recreational location)
Beach south of the village. Turned into a popular recreational site offering beach sports activities and food and beverages.
2016-02-09, 2 hours Bunder fish landing site Located at the river mouth of central town. Harbour and main landing and auction site for fish in town.
2016-02-20, 3 hours Chithrapura (village & beach) Neighbouring village north of Panamburu
2016-02-11, 4 hours Ullal (beach) Beach located south of study site. Used as parking site for traditional fishing boats. Erosion mediation work in progress
2016-02-22, 3 hours Ullal and Someshwara villages and beach
Drove south along the coast from Ullal to neighbouring Someshwara.
Table A2. Focus group discussions conducted during the study. Listed along with date, participants and duration. Note: Number of participants are approximate and varied as some joined during the course of the discussion. The discussions were held in open areas surrounded by an additional number of fishermen forming an audience.
Date Participants/number of Duration 2016-02-24 Panamburu fishermen/app. 6-8 2 hours 2016-03-04 Ullal fishermen/app. 5-7 1 hour 17 minutes Table A3. Interview conducted during the study. Listed along with date, participants and topics included within the interview.
Date Participant Topics (including, not limited to)
2016-02-13 PhD. scholar and member of the Mogaveera community
History of fishing communities and fishing sector, Mogaveera traditions
2016-02-25 Woman of household in Panamburu
Use of ecosystem services and related social processes, similar outline to focus group discussions
2016-03-04 Woman of household in Ullal Use of ecosystem services and related social processes, similar outline to focus group discussions
2016-03-28 President of the community in Panamburu
Population statistics, history of village, environmental issues
2016-03-25 Member (man) of Mogaveera community in Ullal
Population statistics, history of village, environmental issues
2016-03-30 Environmental engineer at Mangaluru City Corporation
Water provisioning, solid waste management, sewage treatment
2016-04-01 Engineer at Ullal Town Office Water provisioning, solid waste management, sewage treatment
2016-03-25 Member (woman)of Mogaveera community in Ullal
The use and benefits of firewood and coconuts

53
Appendix B
Table B1. Compilation of population characteristics of the structured household interviews.
Number of respondents
Panamburu (n = 44) Ullal (n = 41)
Gender Female 22 18
Male 22 23
Age groups (years of age) 10-30 15 24
31-50 15 9
>50 14 8
Education Illiterate 1 1
Primary & secondary school 30 27
Technical training 9 6
Bachelor's degree 4 6
Main occupation Fishing1 10 16
Fish trading2 3 2
Employed3 8 11
Self-employed4 5 0
Student 3 1
Retired 7 4
Housewife 8 7
House Own 42 37
Rented 2 4
Type of household Fishing5 32 40
Non-fishing 12 1 Size of household (number of members)
1-3 15 6
4-6 22 27
>6 7 8
1 Fishing either by own boat or as crew on someone else’s boat. 2 Buying and selling fish. 3 In an office, factory or any other business than fishing. 4Owning a business, any other than a fishing boat or fish trading. 5 A household within which someone either works as fisherman or with fish trading.

54
Appendix C Focus group discussion guide – fishermen in Panamburu and Ullal Introduction My name is Linnea Bergdahl and with me is Anusha, translator. I come from Sweden, from the University of Gothenburg. I’m doing my master’s in environmental science and for my project I’m part of a research project, collaboration between Gothenburg University, College of Fisheries and Nitte University. In the research project they are looking at the human health and wellbeing effects in relation to seafood consumption and how that might be changing with climate change and urbanization. In my project I’m looking at ecosystem services – what we use from the nature and what benefits we get from it. I’m interested to hear and learn what you use from the nature, when you are fishing and in your daily life around the village, as you are part of the fishing community living in this village. The results from the study will be help us understand what is important in the area around here and what is needed for people living here. There are no right or wrong answers, you don’t have to agree, and there is no must to answer questions if you don’t feel for it. I will take your names now, but no names will appear in the final report, all your answers will be anonymous. We plan to spend maybe an hour, an hour and a half, together. Fishing related activities
1. Which areas do you fish in? - North to south? - How far out? - River? - In September? - In March? - Where do you not fish?
Restricted areas around sunken ships, pipelines and SPM. Show on map! Other restricted areas?
2. What boats do you use? - Make a list!
3. What nets do you use?
- Make a list! - Operated where? Surface, mid-water, bottom? - In what fishing areas is each net used?
4. Where is your boat landing sites? Point out on map!
- In September? - In March? - How is the access to these places? Any problems?
5. Where are the places where you? Point out on map!

55
During monsoon season a. Store the boats b. Store the nets c. Repair the nets - Any difficulties storing the boats?
6. In fishing season
a. Parking of boats b. Keep the nets - Any difficulties parking the boats?
7. Any other facilities/things you need to fish?
8. Any other facilities/things you need to take care of the catch – ice?
9. How do you know and decide at which place, with what net etc to fish?
10. List of species:
- Any other species caught apart from these? - Sold to (fresh fish market/dry fish market/fish meal companies/freezing
companies) 11. What benefits do you get from fishing?
- Food? - Cash income for your family? - Cash income for the community? - Employment - Others? - Is it different depending on time of the year?
12. How do you feel when fishing? Why is fishing important to you?
- Good feeling, being together with family/community? - Tradition of our ancestors? - Helping/supporting the community?
13. Why are some people not fishing anymore?
Other services and related activities (only if time available)
14. Do you grow vegetables in the village? - What? - Where? - What do you need to grow it – good soil? Land? Tools? Water? - What do you do with the vegetables – Sell? Household use? - What benefits/good things do you get from the crops you grow?
15. Do you keep any animals? Chickens? Cows? Goats?
- How do you take care of them? - What do you use from them? - What benefits/good things do you get from them?
56
16. Do you use sand taken from within the village?
- How you use it? - For what purpose?
17. Do you take/use any other things from the nature, to use in your daily life?
- Dry wood/leaves/branches as firewood? - Building material? - Medicine? - Other?
18. How do you get your water?
- From where? - What purpose is it used for?
19. How is your wastewater (water from toilets/washroom) taken care of?
20. How is your rubbish/waste taken care of? (point on map!)
21. How do you feel about protection from erosion?
- What protects you? - Why is it happening?
22. How do you feel about protection from storms?
- What protects you?
23. How do you feel about protection from flooding? - What protects you?
24. How do you feel about shade?
- How is it important to you? - What gives you shade?
25. How has the development, the industries, the buildings, the port, around here affected
you? - Affects on the sea water? - Affects on the fish? - Affects on your drinking water? - Affects on the safety of your house? - Affects on your personal health? - Available space for my activities? - Other affects?

57
Appendix D Interview guide – household interviews with women in Panamburu and Ullal Introduction My name is Linnea Bergdahl and with me is Anusha, translator. I come from Sweden, from the University of Gothenburg. I’m doing my master’s in environmental science and for my project I’m part of a research project, collaboration between Gothenburg University, College of Fisheries and Nitte University. In the research project they are looking at the human health and wellbeing effects in relation to seafood consumption and how that might be changing with climate change and urbanization. In my project I’m looking at ecosystem services – what we use from the nature and what benefits we get from it. I’m interested to hear and learn what you use from the nature, when you are fishing and in your daily life around the village, as you are part of the fishing community living in this village. The results from the study will be help us understand what is important in the area around here and what is needed for people living here. There are no right or wrong answers, you don’t have to agree, and there is no must to answer questions if you don’t feel for it. I will take your names now, but no names will appear in the final report, all your answers will be anonymous. We plan to spend maybe an hour, an hour and a half, together.
1. Do you grow vegetables in the village? - What? - Where? - What do you need to grow it – good soil? Land? Tools? Water? - What do you do with the vegetables – Sell? Household use? - What benefits/good things do you get from the crops you grow?
2. Do you keep any animals? Chickens? Cows? Goats?
- How do you take care of them? - What do you use from them? - What benefits/good things do you get from them?
3. Do you use sand taken from within the village?
- How you use it? - For what purpose?
4. Do you take/use any other things from the nature, to use in your daily life?
- Dry wood/leaves/branches as firewood? - Building material? - Medicine? - Other?
5. How do you get your water?
- From where? - What purpose is it used for?

58
6. How is your wastewater (water from toilets/washroom) taken care of?
7. How is your rubbish/waste taken care of? (point on map!)
8. How do you feel about protection from erosion?
- What protects you? - Why is it happening?
9. How do you feel about protection from storms?
- What protects you?
10. How do you feel about protection from flooding? - What protects you?
11. How do you feel about shade?
- How is it important to you? - What gives you shade?
12. How has the development, the industries, the buildings, the port, around here affected
you? - Affects on the sea water? - Affects on the fish? - Affects on your drinking water? - Affects on the safety of your house? - Affects on your personal health? - Available space for my activities? - Other affects?

59
Appendix E Structured household interview form
Coastal ecosystem services - use and contributions to wellbeing in a fishing community
This study is part of a master's project in environmental science and a collaboration between the Fisheries College, Mangalore, and the University of Gothenburg, Sweden.
Thank you for agreeing to participate in this survey and the information obtained from individual responses is only for the academic research work. Your responses will remain confidential and your credentials with
this survey will not be publicised. For any questions, please contact: Linnea Bergdahl, ph: 7348853710, [email protected]
Village Panambur Ullal
Name
Gender Female Male
Age 10 - 30 years 30 - 50 years > 50 years
Head of household yes no
Number of people in household 1- 3 4-6 > 7
fishing household
non-fishing household
Main language tulu kannada other
Education illiterate primary & secondary
technical training
bachelor's master's PhD
Main occupation fishing active non-active
fish trading self-employed
employed
unemployed student retired housewife other:
Second occupation fishing active non-active
fish trading self-employed
employed
unemployed student retired housewife other:
If fisherman, what boat are you fishing with?
traditional boat own | others
purse-seine boat own | others
trawler boat own | others other:
House own rented

60
Do you use fruits/nuts to eat from trees around here? Yes No I buy from other place I'm not eating these fruits/nuts at all
Why? How often? 1-2 times/year 3-6 times/year 1/month 1/week daily How important are these fruits/nuts for you to live a good life? 1= not at all important 2= some/little important 3= medium important 4= very
important 5= very much important
For you, using these fruits/nuts, has it become: more easy same more difficult Why?
Do you use plants from around here for medicine/health treatment? Yes No I buy from other place I'm not using these medicinal plants at all
Why? How often? 1-2 times/year 3-6 times/year 1/month 1/week daily How important are these fruits/nuts for you to live a good life? 1= not at all important 2= some/little important 3= medium important 4= very
important 5= very much important
For you, using these medicinal plants, has it become:
more easy same more difficult Why?
Do you grow vegetables? Yes No I buy from other place I'm not eating vegetables at all
Why? How often do you harvest and use? 1-2 times/year 3-6 times/year 1/month 1/week daily How important are these vegetables for you to live a good life? 1= not at all important 2= some/little important 3= medium important 4= very
important 5= very much important
For you, growing vegetables, has it become: more easy same more difficult Why?
Do you keep animals for using their products? Yes No I buy from other place I'm not using these products
Why? How often do you use their products? 1-2 times/year 3-6 times/year 1/month 1/week daily How important are these animals and their products for you to live a good life?
1= not at all important 2= some/little important 3= medium important 4= very important
5= very much important
For you, using the animals, has it become: more easy same more difficult Why?
Do you use firewood, taken from around here, at your house for heating/cooking? Yes No I buy from other place I'm not using firewood at all - gas
Why? How often? 1-2 times/year 3-6 times/year 1/month 1/week daily How important is the firewood for you to live a good life? 1= not at all important 2= some/little important 3= medium important 4= very
important 5= very much important
For you, using firewood taken from around here, has it become: more easy same more difficult Why?
Do you use plants, leaves, wood, sand etc from around here as material for building, decoration etc?

61
Yes No I buy from other place I'm not using these materials Why?
How often? 1-2 times/year 3-6 times/year 1/month 1/week daily How important are these materials for you to live a good life? 1= not at all important 2= some/little important 3= medium important 4= very
important 5= very much important
For you, using materials taken from around here, has it become: more easy same more difficult Why?
Do you use water from the well for drinking and cooking? Yes No I use pipeline
Why? How often? 1-2 times/year 3-6 times/year 1/month 1/week daily How important is this drinking and cooking water for you to live a good life?
1= not at all important 2= some/little important 3= medium important
4= very important
5= very much important
For you, using the well water for drinking and cooking, has it become: more easy same more difficult Why?
Do you use water from the well for bathing, cleaning, watering trees etc? Yes No I use pipeline
Why? How often? 1-2 times/year 3-6 times/year 1/month 1/week daily How important is this bathing/cleaning water for you to live a good life? 1= not at all important 2= some/little important 3= medium
important 4= very important
5= very much important
For you, using the well water for bathing and cleaning, has it become: more easy same more difficult Why?
Do you keep trees around your house for shade/cooling? Yes No I want to but can't Other things gives me shade Don't need shade
Why? How important are these trees for you to live a good life? 1= not at all important 2= some/little important 3= medium
important 4= very important
5= very much important
For you, keeping the trees around the house, has it become: more easy same more difficult Why?
Do you go for recreation/time pass/exercise at the sea shore? Yes No Want to but can't Don't want
Why? How often? 1-2 times/year 3-6 times/year 1/month 1/week daily How important is this activity for you to live a good life? 1= not at all important 2= some/little important 3= medium
important 4= very important
5= very much important
Do you go for "no-moon swim" in the sea? Yes No Want to but can't Don't want
Why? How often? 1-2 times/year 3-6 times/year 1/month 1/week daily How important is this activity for you to live a good life?

62
1= not at all important 2= some/little important 3= medium important
4= very important
5= very much important
Do you visit Nagabana? Yes No Want to but can't Don't want
Why? How often? 1-2 times/year 3-6 times/year 1/month 1/week daily How important is the visit to the Nagabana for you to live a good life? 1= not at all important 2= some/little important 3= medium
important 4= very important
5= very much important
Do you worship Ashwatta or other holy/sacred trees? Yes No Want to but can't Don't want
Why? How important are the sacred trees for you to live a good life? 1= not at all important 2= some/little important 3= medium
important 4= very important
5= very much important
Do you worship the sea/sea god? Yes No Want to but can't Don't want
Why? How important is the sea god for you to live a good life? 1= not at all important 2= some/little important 3= medium
important 4= very important
5= very much important
Do you have a tulsi katte at your house? Yes No Want to but can't Don't want
Why? How important is the tulsi katte for you to live a good life? 1= not at all important
2= some/little important
3= medium important
4= very important
5= very much important
Do you use fish and sea food from the river? Do you: catch yourself family member
brings buy not using at all
Why? How often do you catch/use? 1-2 times/year 3-6 times/year 1/month 1/week daily How important is the fish and sea food from the river for you to live a good life? 1= not at all important
2= some/little important
3= medium important
4= very important
5= very much important
According to you, is the overall supply of fish and sea food in the river:
declining the same increasing Why? For you, using fish from the river, has it become:
more easy same more difficult Why?
Fish and sea food from the sea Do you: catch yourself family member
brings buy not using at all
Why? How often do you catch/use? 1-2 times/year 3-6 times/year 1/month 1/week daily According to you, is the overall supply of fish/crabs/shrimps: declining the same increasing Why? How important is the fish and sea food for you to give you? 1= not at all important 2= some/little important 3= medium important 4= very important 5= very much important

63
Good food Nice house Comfortable living Physical health Mental health Physical safety Cash income Income stability Labour Good social relations w/ family Good social relations w/ community Continuing tradition of ancestors Freedom to do and choose what I want
Coconuts Do you use coconuts from trees around your house? Yes No I buy from other
place I'm not using coconuts
Why? How often? 1-2 times/year 3-6 times/year 1/month 1/week daily For you, using the coconuts, has it become: more easy same more difficult Why? How important are the coconuts for you to give you? Good food Nice house Comfortable living Physical health Mental health Physical safety Cash income Income stability Labour Good social relations w/ family Good social relations w/ community Continuing tradition of ancestors Freedom to do and choose what I want