Embed Size (px)
Citation preview
MAATALOUDEN TALOUDELLISEN TUTKIMUSLAITOKSEN JULKAISUTA N:o 47 PUBLICATIONS OF THE AGRICULTURAL ECONOMICS RESEARCH
INSTITUTE FINLAND, No. 47
THE ECONOMY OF CROP PRODUCTION
THE FIFTH FINNISH-HUNGARIAN-POLISH SEMINAR ON AGRICULTURAL ECONOMICS
FINLAND, JUNE 13-16, 1983
HELSINKI 1983
MAATALOUDEN TALOUDELLISEN TUTKIMUSLAITOKSEN-'JULKAISUJA N:o 47
PUBLICATIONS OF THE AGRICULTURAL ECONOMICS RESEARCH INSTITUTE,
FINLAND, No 47
THE ECONOMY OF CROP PRODUCTION
THE FIFTH FINNISH-HUNGARIAN-POLISH
SEMINAR ON AGRICULTURAL ECONOMICS,
FINLAND, JUNE 13,-17,1983
HELSINKI 1983

ISBN-951-9202-03-X
Helsinki 1983. Government Printing Centre
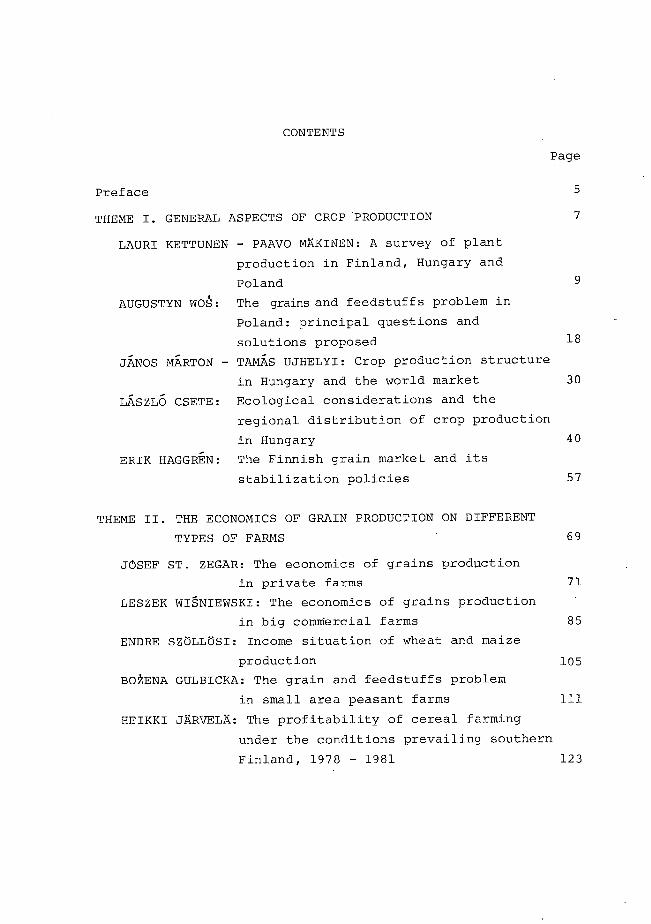
CONTENTS
Page
Preface 5
THEME I. GENERAL ASPECTS OF CROP PRODUCTION
7
LAURI KETTUNEN - PAAVO MÄKINEN: A survey of plant
production in Finland, Hungary and
Poland
9
AUGUSTYN WOå: The grains and feedstuffs problem in
Poland: principal questions and
solutions proposed
18
J'ANOS MÄRTON - TAMÅS UJHELYI: Crop production structure
in Hungary and the world market
30
LÄSZLÖ CSETE: Ecological considerations and the
regional distribution of crop production
in Hungary 40
ERIK HAGGREN: The Finnish grain market and its
stabilization policies 57
THEME II. THE ECONOMICS OF GRAIN PRODUCTION ON DIFFERENT
TYPES OF FARMS
69
JöSEF ST. ZEGAR: The economics of grains production
in private farms 71
LESZEK WI-SSIEWSKI: The economics of grains production
in big comMercial farms
85
ENDRE SZÖLLÖSI: Income situation of wheat and maize
production 105
BOENA GULBICKA: The grain and feedstuffs problem
in small area peasant farms
111
HEIKKI JÄRVELÄ: The profitability of cereal farming
under the conditions prevailing southern
Finland, 1978 - 1981
123
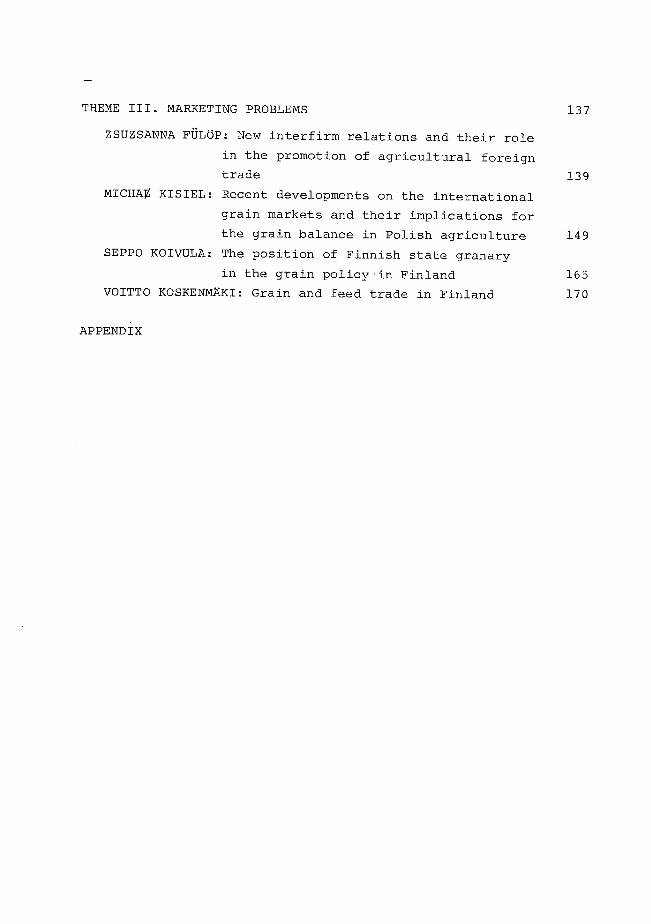
THEME III. MARKETING PROBLEMS 137
ZSUZSANNA FULÖP: New interfirm relations and their role
in the promotion of agricultural foreign
trade 139
MICHAZ KISIEL: Recent developments on the international
grain markets and their implications for
the grain balance in Polish agriculture 149
SEPPO KOIVULA: The position of Finnish state granary
in the grain policy in Finland 165
VOITTO KOSKENMÄKI: Grain and feed trade in Finland 170
APPENDIX
- 5 -
PREFACE
The Agricultural Economics Research Institutes of Finland,
Hungary and Poland have had cooperation during a period of the
last several years. The cooperation has been realized in a form
of exchange program of the research staff and younger scientists.
Besides this, common seminars have been organized in each
country.
The theme of the recent seminar, which was held in Ruissalo,
Turku in June, 13-16. 1983,was the economy of crop production.
There were 14 papers presented in the seminar which was taken
part by 20 participants, mainly research workers but also
representatives of administration and organizations concerned
with the grain industry.
Agricultural Economics Research Institute of Finland wants to
thank the Polish and Hungarian economists as well as the Finnish
participants for their efforts making the seminar succesful. This
fifth seminar proved once again to be particularly fruitful and
worthwhile. The cooperation between the institutes will be carried
on. lienext seminar is going to take place in Poland in 1985.
This publication includes the papers presented in the seminar.
Organizers thank the Ministry of Agriculture and Forestry,
The Commission of Agriculture and Forestry of Finland Academy,
the Finnish State Granary and Raisio Factories for their support
and financial aid for the seminar.
The programme and the list of participants are presented in the
appendix.
Helsinki in June 1983
Matias Torvela
Director of the institute
- 7 -
THEME I .
GENERAL ASPECTS OF CROP PRODUCTION
- 9 -
Lauri Kettunen and Paavo Mäkinen
AGRICULTURAL ECONOMICS RESEARCH INSTITUTE
A SURVEY OF PLANT PRODUCTION IN FINLAND, HUNGARY AND POLAND
Introduction
Agriculture was still the most important sector of the economy in
Finland some 20-30 years ago. The same was probably true in
Hungary and Poland. But those times have gone, and economic
development has been much swifter in other sectors. Even though
agriculture has grown, too, its proportion has declined in ali three
countries. Industry held first place for many years, but nowadays the
services seem to have overtaken industry as the main sector of the
economy.
Even though the relative importance of agriculture has decreased,
agriculture is still an important and visible part of society. From the
Finnish point of view, Hungary and Poland are still .agricultural
countries, because much of their land is cultivated. Natural conditions
seem to be much better in those countries than in Finland, even
though there are some good farming areas in Finland, too.
Since the purpose of our seminar is to consider the many angles of
plant production, we feel that a short comparision af- plant production
in the three countries concerned is called for. We shall start by
reviewing the natural conditions, then use of input and, .finally, the
structure and yields of plant production.
Soil and climate
2.1. Finland
Finland is a rather flat country. South of the line Oulu - Kajaani -
Kuhmo, where most of the cereal production is concentrated, the land
seldon rises over 200 m above sea level. Despite the low-lying
terrain, fields are poorly situated, being divided into small plots by
hills, lakes, swamps and forests. Efficient cultivation is therefore
difficult, even on large farms. The situation is a little better in
southwestern Finland.
- 10 -
Soil types are unevenly distributed throughout Finland. Heavy clay
soils predominate in southwestern Finland and light sandy soils in
central Finland. The north of the country is covered largely by
organic marsh soils, and the eastern parts by stoney moraine.
Climate, however, has the greatest impact on the regional distribution
of crops. The growing season, when the •average temperature is above
5°C, is 170-180 days on the south coast. In the northern parts of the
country, it is but only 110-120 days. The sum of efficient temperature
is correspondingly 1,2000-1,4000C in southern Finland and 1,0000-1,200 °C in central Finland but only 5000-600°C in northern Finland.
The average rainfall in Finland, is 590 mm, but this, too, is
unevenly distributed. Especially in southwestern Finland, which is the
main cereal cultivation area, rainfall is low at the beginning of the
growing season, but heavy rains often lower the crop quality during
harvest time.
Some fields are irrigated during dry summers, but no statistics are
available. It may account for no more than a few percentage points of
the total acreage.
2.2. Hungary
Hungary has a high proportion (57 per cent) of arable land. Gardens,
orchards and vineyards comprise 7 per cent of the land. Only one
fifth of the agricultural area is forested. The land is mostly flat, but
there is some rolling country and a few fairly high. mountains. Two
thirds of the land area are less than 200 metres above sea level, the
lowest point being 78 metres above sea level. The flatness of the land
makes organization into large holdings and mechanized farming easy.
There is a great variation in soils. One quarter of the land is steppe
soil with a good humus level and a favourable water economy, the pH
being 7.0. One quarter is alluvial soil, which has good agricultural
value. Forty per cent of the soils were formed under the forest and
therefore have many unfavourable characteristics, e.g. leaching,
acidity and poor water economy. Six per cent of the soils are very
bad saline soils.
The climate is temperate. The location of the country at the
boundar ies of continental , Atlantic and Mediterranean climate zones
causes a high degree of instability with great interseasonal and
annual variation . The long , warm continental summer and autumn ,
with maximum precipitation in the summer months , and the mild
winters are ideal for agriculture (but ali the se could turn out just
the opposite as well . )
The average temperature is 11.3° C and from April to September
inclusive it is 17.7° C. The annual rainfall on the great plains is
450 mm, in Transdanubia and on the northern hill slopes 600-700 mm,
and in the west of the country near the Alps 700-800 mm. The sun
shines for 2,050-2,100 hours annually except in the western frontier
zone , where it shines for only 1,800 hours .
2.3. Poland
The climate in Poland is typical of temperate zones . There are
considerable differences in the length of the growing season between
the northern part of the country ( some 180 days ) and the southern
part ( about 200 days ) . Likewi se , the mean temperatures of the
vegetation period are higher ( 7,9 - 8,3 °C) in the southern and
western regions of the country ( Krakbw , Opole , Wroclaw ) and lower
(6 - 7.4 °C ) in the northern and eastern regions (Suwalki , Olsztyn ,
Bialystok , Lublin ) . The temperatures and precipitation ( average
rainfall 600 mm: lowland regions 450-600 mm, mountain areas 900-1200
mm) permit the cultivation of most temperate zone crops throughout the
country ( except maize for grain and soy beans ) .
The soils are not too fertile and require concentrated fertilization and
careful treatment . Some 60 % of the arable land consists of light
sandy soils which tend to be unsuitable for the more demanding crops
such as wheat, barley and sugar beet . This explains the large
proportion of rye , potatoes and oats in the total agricultural area of
the country.

- 12 -
3. Use of inputs
The level of the yield , which is determined chiefly by natural
conditions can be enhanced with the aid of various inputs , especially
fertilizers. Finland and Hungary seem to use about the same amount
of fertilizer, Poland slightly less ( Table 1 ) . Because of the climate
one would expect the fertilizer level in Hungary to be higher than
shown by the figures in Table 1. The fertilizer level in Finland could
also be slightly higher, , at least according to field experiments . But
the farmers have probably learned from expe rience that the present
level is optimal .
Table 1. The use of fertilizers in Finland, Hungary and Poland in
1981, kg/ha . Finland Hungary Poland
NPK fertilizers 205 225 186
of which N 82 85 71
64 61 47
59 79 68
The use of fertilizers hardly explains the differences in yield .
Herbicides are used more or less equally by the three countries , but
comparisions are difficult because of the lack of suitable statistics .
Farming is highly mechanized in Finland and in Hungary, but in
Poland horses are still commonly used . The yields in Poland ( per
hectare ) are therefore lower than in Finland or in Hungary. The
numbers of machines given in Table 2 do not reveal directly the
amount or efficiency of the technology, , they merely illustrate the
degree of mechanization in general .
Table 2. The number of agricultural tractors and combine harvesters
in Finland, Hungary and Poland in 1971 and 1979. Year Finland Hungary Poland
Tractors 1971 155,600 67,000 248,000
1979 204,000 55,000 573,000 Combine harvesters 1971 30,000 12,000 15,700
1979 44,000 14,000 36,000
- 13 -
4. Structure of production
4.1. Ownership
Finnish agriculture is based on family farms. There are about 220,000
farms of over 1 ha, the average size being 12 ha of arable land and
35 hectares of forest.
In Hungary, agriculture is based on the socialist system. In 1980
there were 132 state farms (average size 7,694 ha), 1,320 collective
farms of agricultural producers co-operatives (average size 4,023
ha), about 100 specialized agricultural co-operatives and some 826,000
"auxiliary plots" i.e. gardens, vineyards, allotments, etc. of
non-cooperative members, total 1.5 million small and very small plots.
In Poland there were 2,388 co-operative farms and 2,504 state farms
in 1981, of which 1,047 were state farms under the Ministry of Food
and Agriculture. These state farms account for 95 % of the total
agricultural area under state control. However, of the 14,5 million
hectares of arable land, 11 million ha (80 %) were cultivated by the
private sector, which includes 2.86 million farms of over 0.5 ha and
the household plots. The socialized sector accounted for 3.5 million
hectares.
4.2. The distribution of land
The share of cereals in the total area is largest in Poland and
smallest in Hungary (Table 3). Hotirever, the pasture land included in
the Hungarian statistics makes it difficult to draw comparisions.
Fruit growing is widespread in Hungary, which has an effect on
distribution. A typical feature of Polish agriculture is the large
proportion of potatoes of the total area under cultivation.
- 14 -
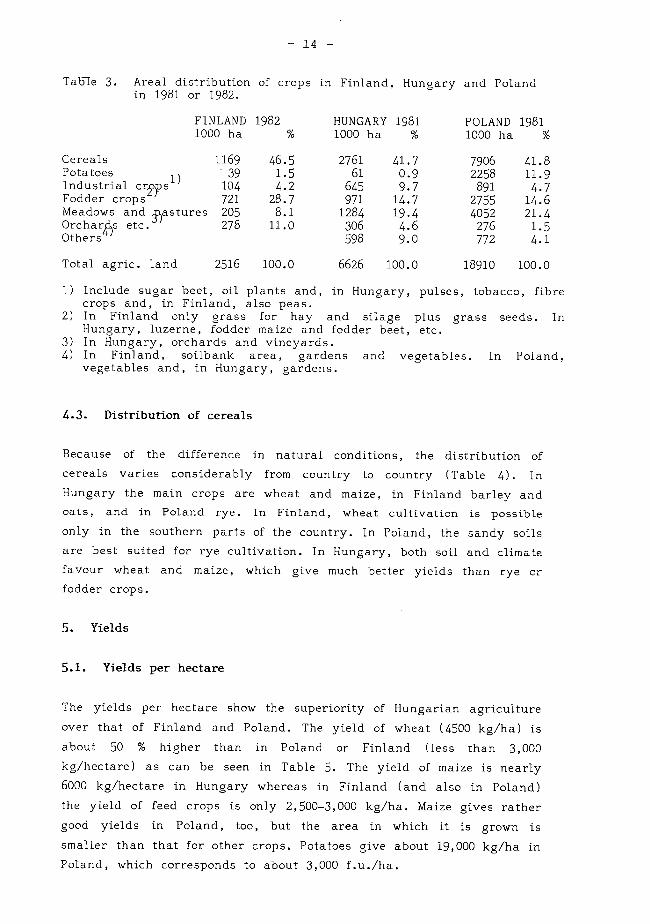
Table 3. Areal distribution of crops in in 1981 or 1982.
FINLAND 1982 1000 ha
Finland, Hungary and Poland
HUNGARY 1981 POLAND 1981 1000 ha % 1000 ha %
Cereals 1169 46.5 2761 41.7 7906 41.8 Potatoes 39 1.5 61 0.9 2258 11.9 Industrial cr2ps1) 104 4.2 645 9.7 891 4.7 Fodder crops 721 28.7 971 14.7 2755 14.6 Meadows and s5astures 205 8.1 1284 19.4 4052 21.4 Orchar s etc. 278 11.0 306 4.6 276 1.5 Others 598 9.0 772 4.1
Total agric. land 2516 100.0 6626 100.0 18910 100.0
Include sugar beet, oil plants and, in Hungary, pulses, tobacco, fibre crops and, in Finland, also peas. In Finland only grass for hay and silage plus grass seeds. In Hungary, luzerne, fodder maize and fodder beet, etc. In Hungary, orchards and vineyards. In Finland, soilbank area, gardens and vegetables. In Poland, vegetables and, in Hungary, gardens.
4.3. Distribution of cereals
Because of the difference in natural conditions, the distribution of
cereals varies considerably from country to country (Table 4). In
Hungary the main crops are wheat and maize, in Finland barley and
oats, and in Poland rye. 1n Finland, wheat cultivation is possible
only in the southern parts of the country. In Poland, the sandy soils
are best suited for rye cultivation. In Hungary, both soil and climate
favour wheat and maize, which give much better yields than rye or
fodder crops.
5. Yields
5.1. Yields per hectare
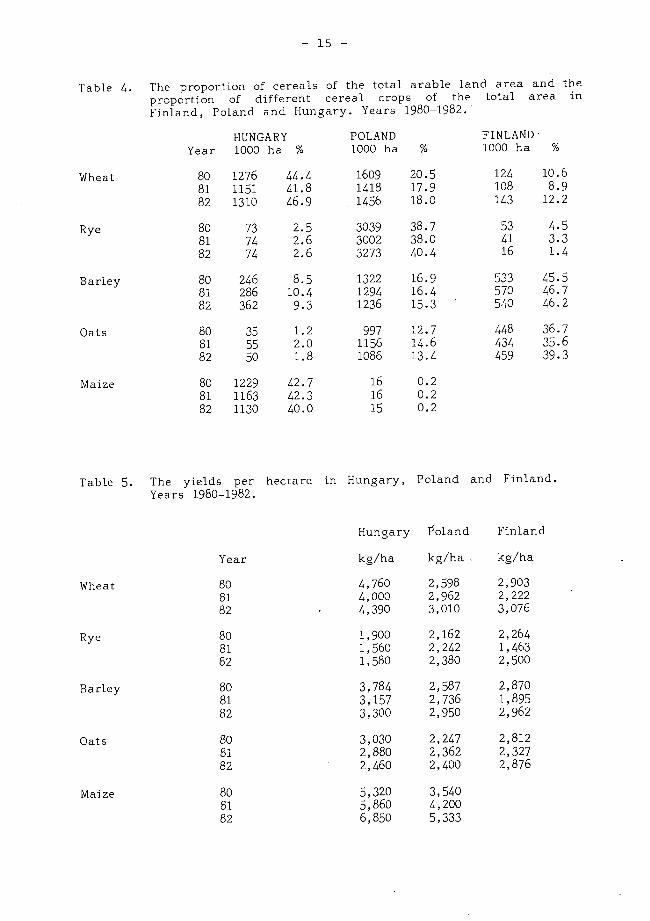
The yields per hectare show the superiority of Hungarian agriculture
over that of Finland and Poland. The yield of wheat (4500 kg/ha) is
about 50 % higher than in Poland or Finland (less than 3,000
kg/hectare) as can be seen in Table 5. The yield of maize is nearly
6000 kg/hectare in Hungary whereas in Finland (and also in Poland)
the yield of feed crops is only 2,500-3,000 kg/ha. Maize gives rather
good yields in Poland, too, but the area in which it is grown is
smaller than that for other crops. Potatoes give about 19,000 kg/ha in
Poland, which corresponds to about 3,000 f.u./ha.
- 15 -
Table 4. The proportion of cereals of the total arable land area and the proportion of different cereal crops of the total area in Finland, Poland and Hungary. Years 1980-1982.
HUNGARY
POLAND FINLAND . Year 1000 ha %
1000 ha % 1000 ha %
Wheat 80 1276 44.4 1609 20.5 124 10.6 81 1151 41.8 1418 17.9 108 8.9 82 1310 46.9 1456 18.0 143 12.2
Rye 80 73 2.5 3039 38.7 53 4.5 81 74 2.6 3002 38.0 41 3.3 82 74 2.6 3273 40.4 16 1.4
Barley 80 246 8.5 1322 16.9 533 45.5 81 286 10.4 1294 16.4 570 46.7 82 362 9.3 1236 15.3 540 46.2
Oats 80 35 1.2 997 12.7 448 36.7 81 55 2.0 1156 14.6 434 35.6 82 50 1.8 1086 13.4 459 39.3
Maize 80 1229 42.7 16 0.2 81 1163 42.3 16 0.2
82 1130 40.0 15 0.2
Table 5. The yields per hectare in Hungary, Poland and Finland. Years 1980-1982.
Hungary Foland Finland
Year kg/ha kg/ha , kg/ha
Wheat 80 4,760 2,598 2,903 81 4,000 2,962 2,222 82 4,390 3,010 3,076
Rye 80 1,900 2,162 2,264 81 1,560 2,242 1,463 82 1,580 2,380 2,500
Barley 80 3,784 2,587 2,870 81 3,157 2,736 1,895 87 3,300 2,950 2,962
Oats 80 3,030 2,247 2,812 81 2,880 2,362 2,327 82 2,460 2,400 2,876
Maize 80 5,320 3,540 81 5,860 4,200 82 6,850 5,333

- 16 -
Yields vary in ali countries but the risk of poor crops is much higher
in Finland than in Poland or Hungary. A good example of a poor year
was 1981, when the average yield was 20 % below normal. 1980 was
more or less normal and 1982 slightly above normal in Finland.
It was not the purpose of this paper to evaluate the profitability of
farming . Nevertheless , we see from the yields per hectare that the
production costs of crops in Finland are twice as high as in Hungary.
Hungary has far better potential than Finland for exporting of
agricultural products .
5.2. Total yields
The total yields of the major crops are given in Table 6, but because
of the differences in acreage they cannot be compared with each
other. . Regarding the self-sufficiency of the countries , Finland has
imported only little grain or feed grain in 1982-83, Hungary has
exported a fair amount of wheat and maize , whereas Poland has
imported both wheat and fodder grains .
Table 6. Total yields of certain cereals in 1982, mill . kg. Finland Hungary Poland
Wheat 440 5747 4416
Rye 40 116 7792
Barley 1600 865 3647
Oats 1320 123 2608
Maize 80 7730
6. Summary
Yiel ds of crops are much higher in Hungary than in Poland or
Finland. For example , the yield of wheat in Hungary ( 4,500 kg/ha) is
about 50 % higher than in the other two countries . Maize gives
6,000-7,000 kg/ha in Hungary, whereas the yields of fodder crops
( barley and oats ) are only 2,500-3,000 kg/ha in Finland and Poland.
These figures reveal clearly the superiority of Hungarian agriculture
over that of Finland and Poland.
- 17 -
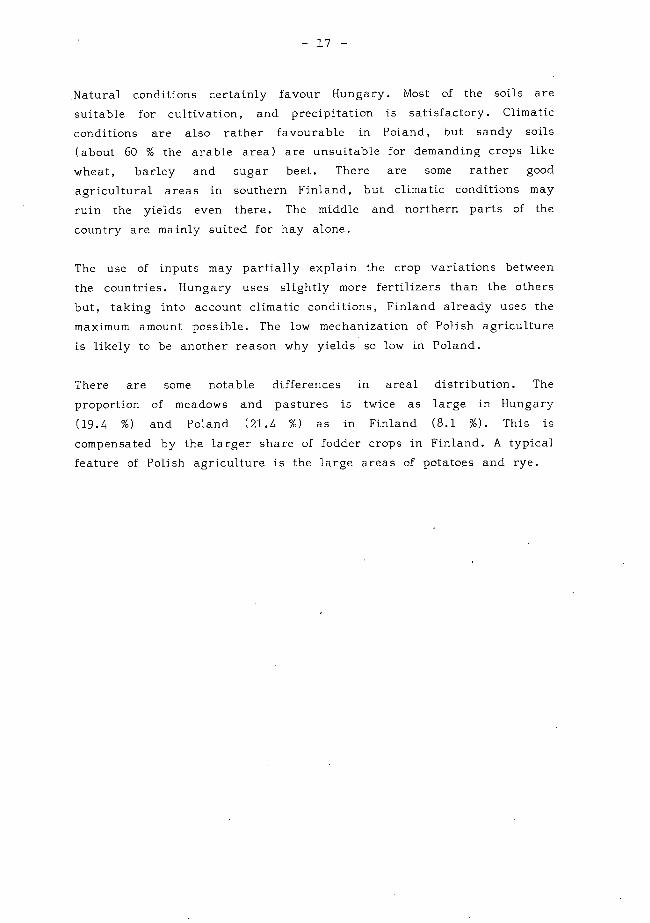
Natural conditions certainly favour Hungary. Most of the soils are
suitable for cultivation, and precipitation is satisfactory. Climatic
conditions are also rather favourable in Poland, but sandy soils
(about 60 % the arable area) are unsuitable for demanding crops itke
wheat, barley and sugar beet. There are some rather good
agricultural areas in southern Finland, but climatic conditions may
ruin the yields even there. The middle and northern parts of the
country are mainly suited for hay alone.
The use of inputs may partially explain the crop variations between
the countries. Hungary uses slightly more fertilizers than the others
but, taking into account climatic conditions, Finland already uses the
maximum amount possible. The low mechanization of Polish agriculture
is likely to be another reason why yields se low in Poland.
Th.ere are some notable differences in areal distribution. The
proportion of meadows and pastures is twice as large in Hungary
(19.4 %Y and Poland (21.4 %) as in Finland (8.1 %). This is
compensated by the larger share of fodder crops in Finland. A typical
feature of Polish agriculture is the large areas of potatoes and rye.
- 18 -
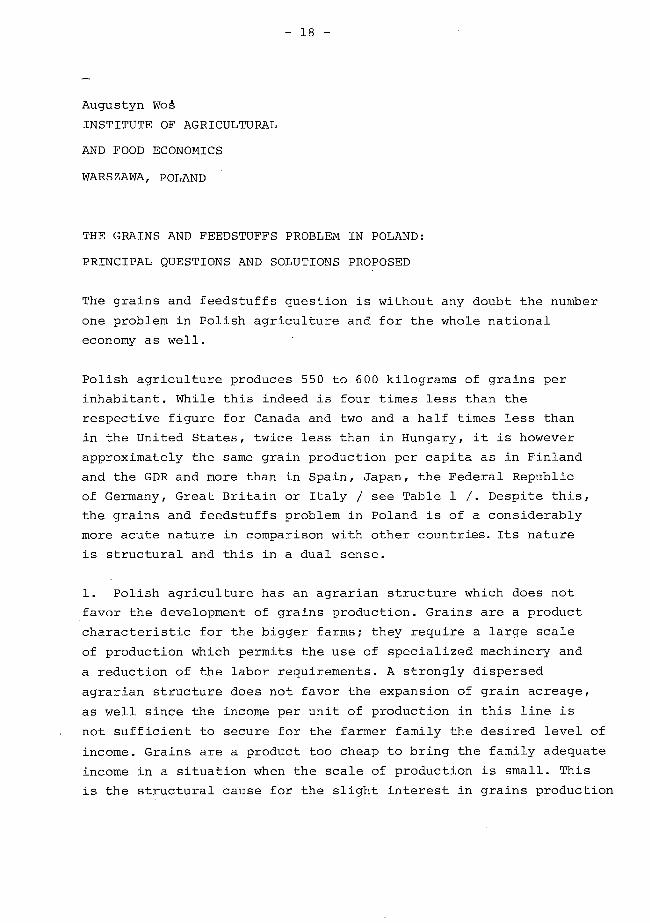
Augustyn WcA
INSTITUTE OF AGRICULTURAL
AND FOOD ECONOMICS
WARSZAWA, POLAND
THE GRAINS AND FEEDSTUFFS PROBLEM IN POLAND:
PRINCIPAL QUESTIONS AND SOLUTIONS PROPOSED
The grains and feedstuffs question is without any doubt the number
one problem in Polish agriculture and for the whole national
economy as well.
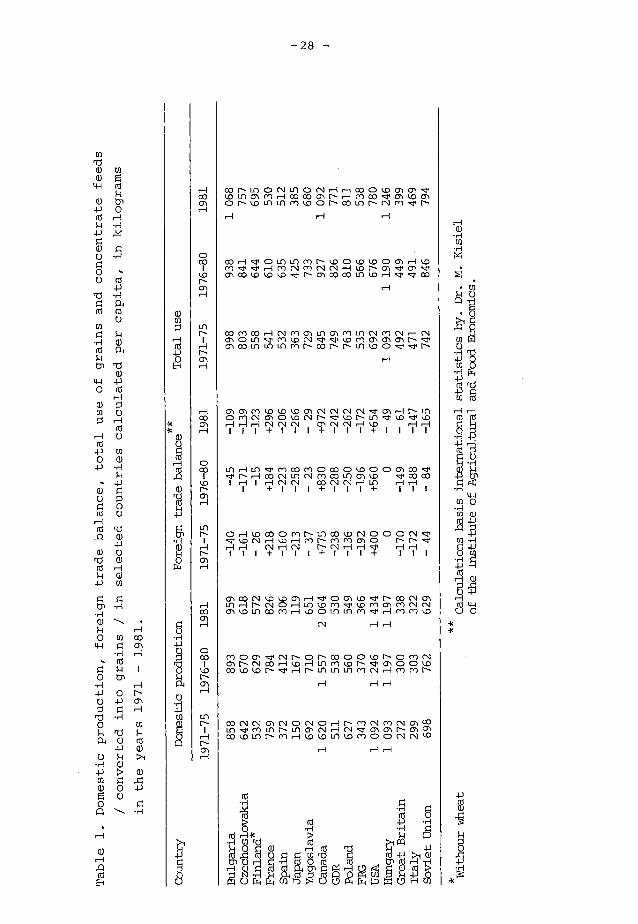
Polish agriculture produces 550 to 600 kilograms of grains per
inhabitant. While this indeed is four times less than the
respective figure for Canada and two and a half times less than
in the United States, twice less than in Hungary, it is however
approximately the same grain production per capita as in Finland
and the GDR and more than in Spain, Japan, the Federal Republic
of Germany, Great Britain or Italy / see Table 1 /. Despite this,
the grains and feedstuffs problem in Poland is of a considerably
more acute nature in comparison with other countries. Its nature
is structural and this in a dual sense.
1. Polish agriculture has an agrarian structure which does not
favor the development of grains production. Grains are a product
characteristic for the bigger farms; they require a large scale
of production which permits the use of specialized machinery and
a reduction of the labor requirements. A strongly dispersed
agrarian structure does not favor the expansion of grain acreage,
as well since the income per unit of production in this line is
not sufficient to secure for the farmer family the desired level of
income. Grains are a product too cheap to bring the family adequate
income in a situation when the scale of production is small. This
is the structural cause for the slight interest in grains production

_ 19 -
intensification in Polish agriculture. Thus the fundamental
solution of the grains problem in Poland will depend on the
improvement of the agrarian structure.
One should stress however that the improvement of the agrarian
structure and a growth of the scale of production is not yet
a sufficient condition for the desired intensification of grains
production in Poland. One ought to remark that there exist
countries with a favorable agrarian structure which however
produce little grains per capita. Among these are such countries
which have chosen this economic model and are importing relatively
large amounts of grains, thus obtaining benefits from the
international division of labor, such as the Federal Republic of
Germany, Denmark and the Netherlands. There are also countries
which having an agrarian structure favoring grains production,
nevertheless produce little grains because of the low yields,
thus having to import considerable quantities of grains. The
difference between imports which are planned from the beginning,
this being an implicit choice of a development strategy, and
imports which are forced upon the economy by the actual situation
is very important. In Poland in the 1970's the first strategy was
to be implemented, i.e. grain and protein imports were increased
considerably in the hope that this would permit a prof itable
export of meat products, which in turn could be Used for the
financing of the feeds imports. As result of the low feed
conversion ratios this effort failed, one of the final effects
of which was a high and growing dependence of agriculture and
what ensued the whole economy on supplies from abroad.
No matter what the point of niew, the achievement of self-suffi-
ciency in the production of grains in Poland is an absolute
necessity. This will not however be an easy task in the short
time horizon, since as I have tried to show, it is among others,
also a problem of the agrarian structures and these change very
slowly.

- 20 -
2. The deficit of grains in Poland has also a structural nature
because of the developed qrains consumption model. In the 1970's
decade Poland has rather rapidly moved towards the relatively
expensive model of consumption based principally on meat. The
goals which have been proposed in this field have quite exceeded
not only the possibilities and potential of agriculture but also
those of the whole national economy as a whole. The condition of
the Polish economy permits a per capita consumption of meat of about
55 to 60 kilograms yearly, this being much lower than the 70 to 72
kilograms figure of the past decade. A meat diet based predomi-
nantly on pork is very grains requiring. Each step in this
direction aggravates the grains deficit since the domestic produc-
tion of grains cannot grow at an identical rate as the expansion
of animal productioni). Numerous factors have contributed to the
fact that the grain requirements of animal production increased
in Polish agriculture at a very high rate. If in 1971 one kilogram
of animal production required the use of 2.09 kilograms of
concentrate feeds, then in 1979 this figure was already 3.24
ki1ograms2). In the next years this ratio decreased somewhat
principally as effect of the difficulties with imports and as
result of specific reduction of animal breeding in the most
expensive farms in terms of feed use. There is however little
probability that the demand for concentrate feeds wi11 drop back
to the low level characteristic for the beginning of the 1970's.
1)During the 1970's decade crop production grew by 9 %, while animal production increased by 28 %. In this period 48 % of the growth of animal production was possible due to increased imports of grains and feedstuffs.
2)Z. Grochowski: Wewntrzne proporcje wzrostu produkcji rolniczej. w: Rolnictwo i polityka rolna lat siedemdziesi4-tych. / The internal structural relations of agricultural production growth; by Z. Grochowski, in: Agriculture and agricultural policy in the 1970's /, PWRiL publishers, Warszawa, 1982, p. 104.
- 21 -
Farmers have found that feeding swine as well as poultry with
concentrate feeds is very productive and at the same time saves
considerable labor input. The traditional technologies of animal
feeding based in Polish agriculture on potatoes are very labor
demanding and troublesome, most of ali they are difficult to
mechanize. The farmers have begun to value more their own labor
and effort and as result they depart from the traditional
technologies. This is an important factor increasing the demand
for grains and aggravating their deficit in the national balance.
In the coming years one may expect a slight drop in the grains
demand in animal production, principally as effect of ration-
alization of animal feeding and the introduction of more effective
technologies, but one should not expect a return to the starting
point. If in the coming years the use of concentrate feeds per
one kilogram of animal production wil1 remain at the 2.6 to 2.7
kilograms level, this may be considered a very good result. The
present crisis situation and the difficulties with concentrate
feeds imports are a strong force towards a drop of grain use in
animal production. This is an important element on the active
side of the grains balance in Polish agriculture.
The deficit of grains in Poland as it appears from
discussion is of a structural nature. Depending on
crops it may vary from 4.5 to 5.5 million tons and
twice the size of what it was ten years ago. As it
in the national grains balance / as shown in Table
of the domestic crop in the total grain supply has
while the share of imports has been increasing, by
the previous
the domestic
presently is
can be seen
2 / the share
been decreasing,
approximately
one per cent point per annum. The share of human consumption is
dropping, while the share of grains used for animal breeding is
growing. These trends have been slightly arrested after 1981
as effect of the general crisis situation.
When evaluating the size of the grains deficit one should take into
consideration the dimensions and composition of imports. This
will explain many questions. We are faced in the situation of
- 22 -
-
Polish agriculture with the so called necessary imports of grains
which are estimated to be approximately 2 million tons. This
is the part of imports which must be maintained regardless of
the size of the domestic production. The traditional Polish feed
grains such as rye, barley and oats are characterized by a low
protein content of about 13 to 16 %, while for effective feeding
of animals required are feeds with an increased content of protein.
Thus the domestically produced feed grains must be supplemented
with the high protein content components, such as soybean, fish
meal, arachis etc. and these must be imported, since their pro-
duction in Poland is extremely expensive1). When using for animal
feeding 12 to 14 million tons of grains, as this is the present
figure, we must add to this approximately 2 million tons of high
protein content components, which will permit obtaining favorable
conversion ratios of feeds in milk and meat production. This group
of imports is economically rational and should be maintained.
An important problem is the balance of imports which is the result
of a chosen strategy of development. Presently it is a matter of
reducing the imports by 2.5 to 3.5 million tons. This is an
important problem as it means an expenditure for the national
economy of 380 to 530 million US dollars per year, which only in
a small degree is compensated by the exports of meat products.
The elimination or at least reduction of these grains imports is
the guide for the way for Polish agriculture to food self-
sufficiency. In fact, the achievement of food self-sufficiency
is first of ali a problem of solving the grains deficit.
Thus Polish agriculture faces an urgent task of increasing
grains production by at least 2.5 to 3.5 million tons. In fact,
this growth must be even bigger since the population is growing
and as effect of this the demand for grains is also growing.
1)Whi1e efforts have been undertaken in Poland to grow soybean, they still remain in field experimental stage.
- 23 -
What then is the recommendation on how to achieve this growth of
grains production, to make up the lacking 2.5 to 3.5 million
tons of grains?
When searching for an answer to this problem one should ask
whether the question is that we produce too little grains or
whether we use too much grains. Both answers are true. The
domestic production is too small considering the factual produc-
tion potential but also the truth is that the use of grains,
especially in animal feeding is not as effective as it should be.
We shall first consider the potential on the side of grains
production growth. It is without any doubt that the greatest reser-
ves are in a potential increase of grains yields. The progress
in this respect has been recently of little significance In the
second half of the 1970's decade we were faced even with a stag-
nation of grain yields. There are four basic factors which determine
the growth of grain yields:
An improvement of the seed material policy, meaning the
constitution in mass production of these genetic characteristics
of new grain varieties which have been obtained in the experimental
breeding stages and the introduction on a large scale of varieties
which react well to increased fertilizer application.
An improvement of fertilizer management aimed at better
coordination of the fertilizer application level with the water
resources available in the soil as well as a better selection of
fertilizer composition adapted to the requirements of the
respective crops.
A significant improvement of the agro-technics, especially
soil preparation and weed protection.

- 24 -
4. Further expansion of agricultural advising and extension
services, especially the popularization of methods of achieving
high yields of grains, since the sphere of know-how has today in
Polish agriculture a much broader importance than it is usually
acknowledged.
While not going into details of these necessary undertakings
presently, it should be stressed that they should be implemented
simultaneously. One of the reasons for the failure of the efforts
in this field so far has been the fact that ali of these factors
aimed at improving grain yields were considered and employed
separately, without giving consideration to their interdependence.
Another way to improve grains production potential could be
a growth of the area planted to grains. In the peasant sector the
reserves in this respect do not appear to be very great.
Approximately 57 % of the area planted is already under grains,
this being near the limit of "grain capacity" of the soils.
The situation is different in the socialized sector of agricul-
ture. Here only 45 % of the area planted is under grains. There
is thus a possibility of increasing the area planted to grains
in this sector by 420 to 450 thousand hectares which could in
effect yield additionally 1.2 million tons of grains. A condition
for this is however a simultaneous increase of the yields of the
non-grains feeds, especially -those of meadow hay,grass and other fodder
crops, which could free land for additional grains production.
There is an opinion that it was these low yields of the n9n-grain
fodder crops which have blocked in a way the expansion, in terms
of the area planted, of grains and have aggravated the grains
deficit in Poland. This latter remark concerns ali of Polish
agriculture, not only the socialized sector of it.
It is believed that the grains balance could be greatly improved
through an increase of the production of high protein content
fodder crops, such as beans, broad bean, sweet lupine and other
coarse grained podded crops. Poland has attractive soil and
- 25 -
climatic conditions for the development of this production. These
high protein content fodders could be an excellent substitute
for grains and in addition to this they could permit a reduction
of the expensive imports of these components. What is required
here is a more intensive economic stimulation, i.e. better price
incentives, accompanied by government assistance in the production
of the necessary seed material. Specialists believe that it is
possible to produce in Poland such a quantity of podded crops which
could be a substitute for 1.5 to 2.0 million tons of grains.
The development of this production requires however an extensive
program of assistance from the agricultural advisory services and
from the whole sphere engaged in providing services for agricul-
ture.
The grains balance in Poland could also be improved through
decreasing the use of grains and feeds per unit of animal produc-
tion. Presently 58 % of the total grains used is earmarked for
animal feeding. This is a very important position and any
improvement, even appearing to be minute, in the conversion rates
of grains and feeds to milk and meat will bring great progress
and savings. The ways to achieve this have been recognized.
A practical realization of these recommendations encounters
however numerous difficulties. The real problems are in the sphere
of know-how.
The Polish farmers have moved in a relatively short time on a mass
scale from the traditional methods of feeding animals to more
modern technologies, based first of ali on feeding grains.
This process has taken place so rapidly that it was not possible
to assist ali farmers with professional advising. Many of them
regrettably do not posses the needed knowledge and these modern
technologies were poorly employed, thus the production effects
are not satisfying. In the 1970's the flow of protein concentrates
feeds to the countryside was greater than the flow of knowledge.
Andthis is the reason why the results are less than what has been
expected.
- 26 -
This view is confirmed by international comparisons. One observes
that there are countries which while having the same per capita
production of grains as in Poland, have at the same time a more
balanced situation in grains and a higher level of food production
per inhabitant. The answer to this can be only one. It must be
the effectiveness of the feeding of animals. And this depends
beside the other factors discussed on the skills and the knowledge
of farmers.
There are of course other reasons for the poor feed conversion
ratios, such as the low quality of the feeds supplied, due to
a lack of some components, changing compensation of the feeds,
broken supply schedules, inadequate veterinary care etc. While
all of these constraints are indeed true, there is sufficient
proof to the fact that good farmers even taking into consideration'
the described above general difficulties with the supply and
quality etc. of feeds, nevertheless achieve high coefficients of
effectiveness of grain feeding. This also means that if all
farmers were to achieve this effectiveness level, a significant
improvement in the national grains balance would appear.
The discussion undertaken in this paixx shows that the deficit
of grains in Poland today is of a structural nature. It is
consequence of the previously selected way of development. But
the disequilibrium in the grains balance today is so great that
it requires a revision of this choice of strategy made formerly.
This process is taking place presently. The ways and means of
activization of the grains balance are well recognized; the
problem is in how to continue on this way. This brings to our
mind and under discussion the matter of economic instruments to be
used, in order to improve the situation. Among these in the first
place should be named a foreseen increase of the government offered
procurement prices for grains. By fall of 1983 the new prices of
grains proposed will be higher compared to the present ones by

- 27 -
approximately 40 %. Traditionally grains have been in Poland the
cheapest agricultural product. Since we face today a new
situation, this arrangement must be changed. The increase in pro-
curement prices of grains alone in itself will not be sufficient.
Other measures will be necessary as well, some of which have been
discussed in this paper. If these efforts will be complete and
coordinated, there then is hope for success.
March 1983, Warszawa
Total use
total use of
Domestic production,
/ converted into
in the years 1971 -
P.,
-28 —
oo r- un CD 0,1 U1 CD N H 0)0 VD 01 CN cr (.0 Ul C51 rl .--I CO CO 01 rs rn OD 'I" 01 VD CN CD r- ID 10 10 nn VD CD r- OD Ul rs nn r-
CO cr CD U1 U1 01 rs VD CD ID VD CD CN r1 rl N rn cy cv rs CN cr on cr on CO VD VD 10 rs 01 00 CO 11 10 cr 00
CO rl CO r-I N rn cn un cn rn un rv nn rv Hry 01 CD Ul cr VD rv ,PIDr1 CN cc cn r- cr on co un un un r1 rs 00 rs rs U1 VD C, cP r-
cc CN 01 VD VD VD C N NCV cr cn r- un CD r1 N 01 CD UD rv r- cr QD rs 10 cP VD cr UD
r-I CV N 01 N VD 1/1+ III +III + I I I I
11 U1 r1 CO rl CD 00 CD VD CD CD 01 00 cr r- OD
10 CV r1 00 U1 01 VD "z1, 00 CO r-I I 1-1 rg EN OD 0,1 1-1
1 +111+111+ I I I
CD VD OD CD rn r- un OD VD EN 000 ENcP .3, kJ) Cs1 Cl r1 CN CD r- r- cr
1-1 r- cv 1-1 H H I I I + I I 1 + I 1 1 + 1 1 I
01 OD EN ID VD CN CD 01 QD cr rs OD 01 Ul r- cv C) U1 ID rn cr QD r1 CN ry cy cn ID Ul OD rl H ID CD ul U1 rl H 01 r1 10
EN H 1-1
0/ CD on cr EN N. CD rs 00 CD CD VD rs CD rl CV 01 rs N CO r-I VD 10(1 VD rs cc CD CD VD CO 1.0 ID r- H r- un un un rn ry H rn rn r-
00 CV (V CN EN CD CV CD rs Cl EN Cl EN CN CO u") i 0.1 11 0- 11 01 CV cr CN 01 rs 01 01 CO t.0 En N Cl ID 1.0 En VD c) /DCVN 10
rö H
H M -I › (ci -,1 .° 0 • /-1
.1-1 CO rij (Ii OCI 4-) ›, a) 4-4 2 °-.} .fl r-I
m rci
' ''1. r• -1 S o ul Å 'IR 9 .i) 41,91
ty, -1 "r1
,,, C) PA 1-,A CD fli PA D W CD H ,u

- 29 -
Table 2. The grains balance in Poland
period and its composition
in the 1970/71 - 1980/81
Specification 1970/71 1975/76 1978/79 1979/80 1980/81
in thousand tons
INCOME 19 096 23 228 26 485 22 199 24 014 Harvest 16 172 19 449 21 360 17 069 18 179 Imports 2 541 3 128 5 045 4 796 5 538 Reserve reduction 383 651 80 334 297
EXPENDITURES 19 096 23 228 26 485 22 199 24 014 Sowing material 1 554 1 461 1 554 1 625 1 638 Animal feeding 9 596 14 386 16 014 12 739 13 951 Human consamption 6 242 5 993 6 248 6 219 6 352 Industrial use 247 428 789 402 573 Losses 672 827 1 552 1 037 993 Eports 180 133 47 107 116 Increase of reserves 605 281 71 391
Composition, in per cent
INCOME 100.0 100.0 100.0 100.0 100.0 Harvest 84.7 83.7 80.6 76.9 75.7 lmports 13.3 13.5 19.0 21.6 23.1 Reserve reduction 2.0 2.8 0.4 1.5 1.2
EXPENDITURE 100.0 100.0 100.0 100.0 100.0 Sowing material 8.1 6.3 5.9 7.3 6.8 Animal feeding 50.2 61.9 60.5 57.4 58.1 Human consumption 32.7 25.8 23.6 28.0 26.4 Industrial use 1.3 1.8 3.0 1.8 2.4 Losses 3.5 3.5 5.8 4.7 4.1 Ekports 0.9 0.7 0.1 0.5 0.5 Increase of reserves 3.3 - 1.1 0.3 1.7
Source: Rocznik Statystyczny1982 (Statistical Yearboök 1982), publiåhed by the Central Ståtistical Office GUS, Warszawa, 1982, p. 254.
- 30 -
Jånos Mårton and Tamås Ujhelyi
RESEARCH INSTITUTE FOR AGRICULTURAL ECONOMICS
BUDAPEST, HUNGARY
CROP PRODUCTION STRUCTURE IN HUNGARY AND THE WORLD MARKET
The total area of the country is 9.3 million hectare of which
productive land / agriculture and woodland / is 8.3 million
/ 89 percent / while built-on area, roads, railways etc. amount
to 1 million hectares / 11 percent /.
The fact, that most of the country is flat with two-thirds
of the territory not exceeding 200 meters above sea level,
and the abundance of good quality soils suitable for a great
variety of crops provide favourable conditions for arable
farming. The high proportion of arable land / 71 percent of
agricultural land and 50 percent of total territory / and a minor
role of grassland and forests is an important characteristic
of Hungarian farming. As relatively little land remains for
grassland and forests, forage has to be produced mostly on
arable land and income earning of the rural population in forestry
is not frequent.
Land used for crop production slowly declines with progressive
of urbanization; loss of land reached 1/4 million hectares,
3.6 percent in the last decade.
Turning grass and woodland to arable farming could be of course,
a way of expanding arable land but as Hungary has very little
such land, 26 hectares of grassland and 32 hectares forests
per 100 hectares arable land ranking second lowest in Europe
after Denmark / 29 hectares /, there is practically no possibility
for the expansion of arable land.
- 31 -
Physical conditions are medium level; the amount of sunshine,
rainfall and the quality of the soils qualify for plentiful
and diverse agricultural production, but a high degree of
uncertainty of the weather; especially drought, late and
early frosts in spring and autumn and cold winters without
snow greatly hamper realization of the benefits of nature.
The supply of water is also a critical factor as it is
a limiting factor of agricultural production on more than
half of the area.
Structure of crop production is traditionally diverse;
because of the great variety of soil types, macro- and
micro- climatic conditions, practically ali crops of the
temperate zone are traditionally produced in some volume.
The first big change of the crop production pattern was
in the 1940's and 1950's when draught-animals were replaced by
tråctors and excess forage and feed producing land led to a
transformation of the crop production structure.
The period 1960 to 1980 was characterized by the stability
of the crop production structure; the unchanging factors,
e.g. natural conditions and long established agrotechnical
practices combined with the enhancement of all-out self suffi-
ciency as a primal goa1 ali contributed in maintaining traditional
crop production pattern. Changes were made only as a result of
developments of yie1ds, which made some substitution possible;
rye and barley were extensively replaced by wheat, clower and
other leguminous forage crops by lucerne and silo maize,
fodder beet and potatoe by sugar-beet.
Adaptation ofmodern production methods and equipment brought
about a revolutionary transformation mainly of maize, wheat
and sunflower-seed production with sharply rising yields and
great reduction of labour. But it must be emphasized that this
- 32 -
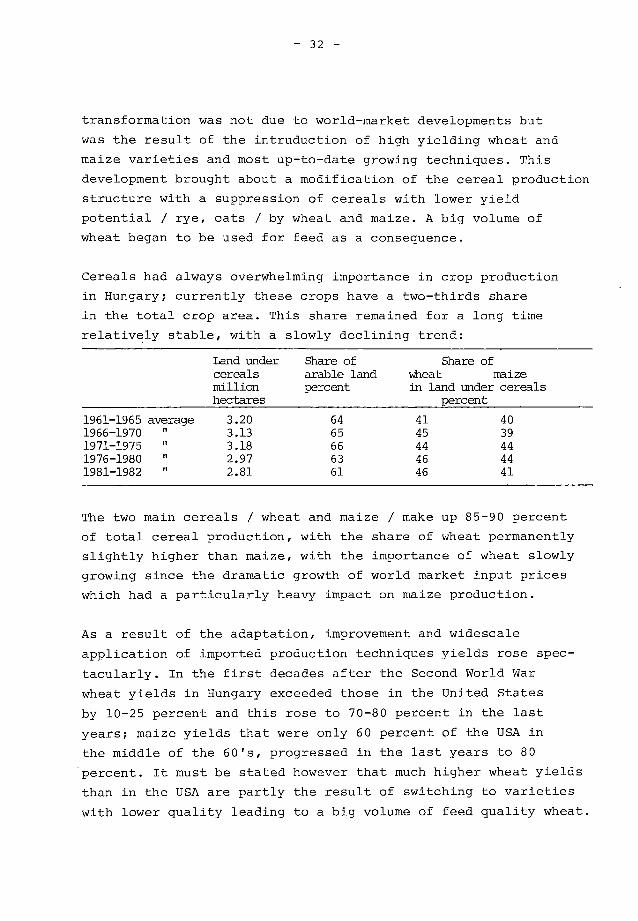
transformation was not due to world-market developments but
was the result of the intruduction of high yielding wheat and
maize varieties and most up-to-date growing techniques. This
development brought about a modification of the cereal production
structure with a suppression of cereals with lower yield
potential / rye, oats / by wheat and maize. A big volume of
wheat began to he used for feed as a consequence.
Cereals had always overwhelming importance in crop production
in Hungary; currently these crops have a two-thirds share
in the total crop area. This share remained for a long time
relatively stable, with a slowly declining trend:
Land under Share of
Share of cereals arable land
wheat maize
million ry.rcent
in land under cereals hectares percent
1961-1965 average 3.20 64 41 40 1966-1970 3.13 65 45 39 1971-1975 " 3.18 66 44 44
II 1976-1980 2.97 63 46 44 1981-1982 2.81 61 46 41
The two main cereals / wheat and maize / make up 85-90 percent
of total cereal production, with the share of wheat permanently
slightly higher than maize, with the importance of wheat slowly
growing since the dramatic growth of world market input prices
which had a particularly heavy impact on maize production.
As a result of the adaptation, improvement and widescale
application of imported production techniques yields rose spec-
tacularly. In the first decades after the Second World War
wheat yields in Hungary exceeded those in the United States
by 10-25 percent and this rose to 70-80 percent in the last
years; maize yields that were only 60 percent of the USA in
the middle of the 60's, progressed in the last years to 80
percent. It must be stated however that much higher wheat yields
than in the USA are partly the result of switching to varieties
with lower quality leading to a big volume of feed quality wheat.
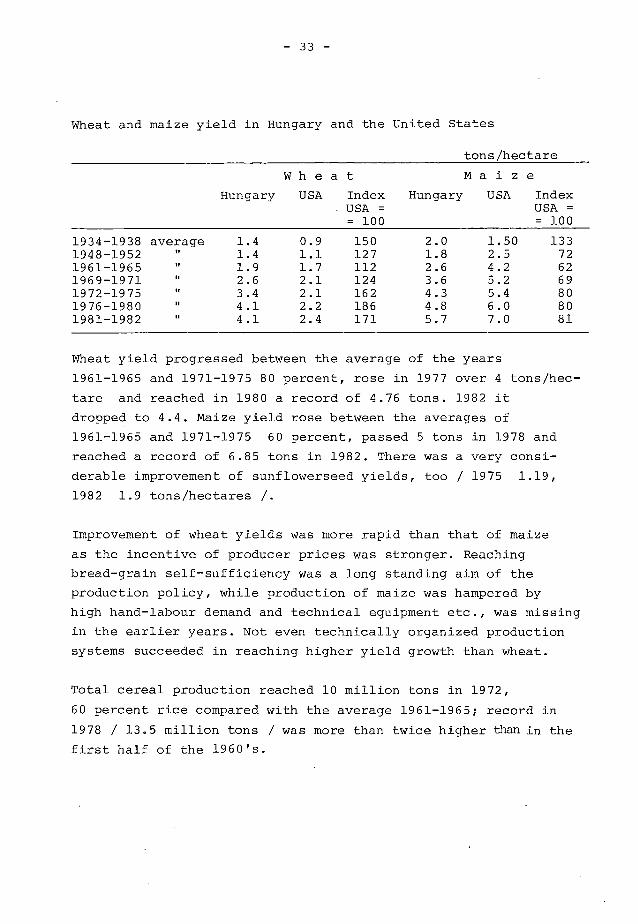
- 33 -
Wheat and maize yield in Hungary and the United States
tons/hectare
Hungary
Wheat
USA Index . USA = = 100
Hungary
Maize
USA Index USA = = 100
1934-1938 average 1948-1952 1961-1965
II 1969-1971 1972-1975
II 1976-1980 II 1981-1982
1.4 1.4 1.9 2.6 3.4 4.1 4.1
0.9 1.1 1.7 2.1 2.1 2.2 2.4
150 127 112 124 162 186 171
2.0 1.8 2.6 3.6 4.3 4.8 5.7
1.50 2.5 4.2 5.2 5.4 6.0 7.0
133 72 62 69 80 80 81
Wheat yield progressed between the average of the years
1961-1965 and 1971-1975 80 percent, rose in 1977 over 4 tons/hec-
tare and reached in 1980 a record of 4.76 tons. 1982 it
dropped to 4.4. Maize yield rose between the averages of
1961-1965 and 1971-1975 60 percent, passed 5 tons in 1978 and
reached a record of 6.85 tons in 1982. There was a very consi-
derable improvement of sunflowerseed yields, too / 1975 1.19, 1982 1.9 tons/hectares /.
Improvement of wheat yields was more rapid than that of maize
as the incentive of producer prices was stronger. Reaching
bread-grain self-sufficiency was a long standing aim of the
production policy, while production of maize was hampered by
high hand-1abour demand and technical equipment etc., was missing
in the earlier years. Not even technically organized production
systems succeeded in reaching higher yield growth than wheat.
Total cereal production reached 10 million tons in 1972,
60 percent rice compared with the average 1961-1965; record in
1978 / 13.5 million tons / was more than twice higher than in the
first half of the 1960's.
- 34 -
At the same time with the considerable improvement of yields
difference between high and low yields diminished. From 1324
wheat producing co-operatives in 1980 847 had yields between
4 and 6 tons and produced three quarters of wheat produced by
co-operatives and more than a quarter was produced by 276 co-
operatives with 5.0-5.5 ton/hectare yields, there were only 20
co-operatives with yields under 2 tons and 18 over 7.5 tons,
supplying 0.3 and 2.1 percent respectively.
The distribution of maize yields is different; from 1253
co-operatives in 1980 167 in the top group of yields exceeding
7 tons produced 28 percent of ali co-operatives.
In the first half of the 19701 s large farms concentrated
their efforts on cereal production, easy to mechanize and causing
little other problems, while yielding good profits. Expansion
of cereal production relied both on the domestic and export
market situation. This situation changed in the second half of
the 1970's.
The most important development of the 1970's was the decline
of cereal and potato area and expansion of industrial crops
and forages as a result of changing price ratios.
The decline of cereal-area was the result of lagginq prices.
Producer prices of cereals hardly changed, thus producers had no
opportunity to keep up with rising production costs and profits
from cereal production declined. For a time the high growth of
yields made up some of the loss of income but this was not
enough. The deterioration of profits from maize production was
especially grave as producers could not make up rising costs by
improving yields. As a consequence maize-area declined every year
in the 1970's. Because of the high costs of production, maize is
profitable only on land where yields reach 4.5-5.0 tons/hectare.
As a consequence maize production started to shift to land with
the higher yields, while on lower quality soils it was replaced
- 35 -
by cereals with lower requirements for soil, climate and agro-
technique. This situation is expected to remain in the future,
too. The contraction of maize land and rising yields are going
to he long term trends.
The incentive of producer prices for the expansion of industrial
crops was very strong in the 1970's as economic policy tried to
raise production with repeated price-rises, to use favourable
export market possibilities. Producers got between 1971 and 1979
82 percent higher prices for sugar-beet and 92 percent higher
for sunflowerseed while cereal prices remained unchanged.
World market price explosion and rising production costs as
a consequence, led to a critical situation of maize production
in the 1980's, though yields were excellent in world comparison.
Production of other cereals on the other hand yielded stable
prof its in good years. Sunflowerseed production acquired an out-
standing position, making up losses on large farms in years with
bad grain harvest. There is a considerable difference of the
rentability of grain production, depending on whether calculation
is made with domestic or world market prices respectively; while
wheat profits considerably declined because of low producer prices
in the last years, production is still very profitable on national
level taking into account world market prices.
Ruman consumption of cereals is stationary while use for feed
is strongly expanding; at the end of the 1960's 60 percent,
actually only 30 percent of production is used for bread etc.
The most important form of cereal consumption / bread / steadily
declines and this is only partly made up by rising consumption of
Line bakery-ware. Use of cereal products as garnishment of meat
became more important in the last years as preparation of potatoes
for cooking is very labour consuming and production lagged behind
demand. Breakfast cereals have not yet found their way to the
- 36 -
Hungarian consumer. Per capita fat consumption roughly corresponds
with developed countries, but only 1/5 of this is of vegetal
origin while it is 40-50 percent in most European countries.
There was an import of cereals in most years until 1972, from
1973 however export became permanent; in the years 1973-1979
a total of 9 million tons, yearly average 1.3 million tons was
exported.
Maize and wheat export for human consumption strongly varies
from year to year and there is a frequent change of markets,
too. Most important importers are the CMEA countries, as neigh-
bourhood is a considerable advantage because of low transport
costs. Export to the Soviet Union is mainly carried out in the
framework of 1ong term contracts, in exhange of fuels and important
raw materials.
Wheat and maize export prices to non-socialist countries are
since 1973 good, while rouble-prices are somewhat lower, but
input / export price relation is still better than the national
average of ali goods. Wheat export has 16, that of maize 24 per-
cent import content, thus maize export is less favourable because
of lower export prices and higher imported material, fuel etc.
content. Both wheat and maize are profitable export products
but expansion of maize production on the expense of wheat is
not justified till there is enough export opportunity for wheat.
The volume of foreign currency earning per hectare is however
higher for vegetable oil, sugar etc.
The augmentation of sunflower-seed production came to a halt
in the first half of the 1970's, but considerable growth started,
in the second half of the decade again. Area under oilseeds
continued to expand every year as a consequence of favourable
export market cond,itions. Average yearly oilseed area was 45
percent higher in 1976-1980, than in the previous five years and
- 37 -
production volume augmented 80 percent. The expansion of produc-
tion as a reaction to favourable conditions however was somewhat
slow, as export began to rise only in the second half of 1976-
1980. Production of the vegetable-oil industry rose in the last
years considerably, as a result of growing raw-material supply;
production development rose fastest in the 1970's from ali
industries processing raw materials of vegetable origin. Despite
this, 100-140 000 tons of unprocessed oilseeds were annually
exported because of a shortage of processing capacity. A high
processing capacity was constructed in 1971-1975 and as a result,
much more of oilseeds are exported in the form of vegetable oil,
with protein-meal remaining for domestic utilization.
Sugar-beet area was 110 000 hectares in the 1960's but as
a consequence of declining world market prices, it fell 30 per-
cent till 1971. Production in 1975 still lagged 30 percent
behind expectations, as area planted with sugar-beet dec1ined
because of low producer prices; obsolete production technique
did not allow compensation of the loss of territory with higher
yields. Processing results were also bad; because of old machi-
nery and equipment processing capacity was not sufficient and 150-
160 dav runs with acorresponding high loss of sugar content
of the beets resulted.
This was avery unfavourable period, when sugar had to he
imported for hard currency from the capitalist market in
considerable quantities. In the second half of the 1970's however
the situation improved; as a result of considerably higher produ-
cer prices and the introduction of prices taking into considera-
tion the sugar content of the beets resulted in higher production.
As a result of a higher sugar content of the beets and the
expansion of the processing capacity import could be stopped,
though production still lagged 16-17 percent behind the pian.
- 38 -
Forage production uses 1/5 / 18-22 percent / of the crop-area;
most of this is lucerne and silo-maize; 45 percent of the forage
demand of the cattle stock is met by silo-maize and 30 percent
by lucerne.
As a result of favourable export outlets for lucerne-meal in the
first years of the 1970's and cheapfuel making dehydration
a favourable proposition, area under lucerne considerably
expanded and yields rose 40 percent in 10 years. In the second
half of the decade however, expansion came to a hait because
of low export prices and rising fuel prices. Silo-maize is
becoming the increasingly important forage-base of the cattle
stock, with growing importance in the crop-area.
The considerable arassland area is also an important asset
of Hungarian farming, though it is only 1/5 of arable land,
much less than in Western-Europe though higher than in most
Scandinavian countries and approximately the same as in Poland
and Sweden. As grass yield is much lower than in regions having
more favourable climate for pasturing, there is an intensive
discussion with conflicting views, about the growth potential
of grass yields. Practical experience cautions against high
expectations, as most of the grassland is on very poor soil
/ alcalicsoils, barren areas etc. /,areas with difficult access
and scattered small plots, where realization of the growth
potentia1 would require heavy investments.
Stab1e, abundant and low-cost protein-feed supply is one of
the main problems of Hungarian agriculture; as a consequense
of the world market changes the problem gained still in impor-
tance. Concentrated feeds are traditionally high in energy and
low in protein in Hungary because of the natural conditions,
enhanced by the production policy. The supply / demand situation
is worsening because of growing protein consumption of intensive
animal production. Growth of protein feed production in the 1970's
fell behind requirements.
- 39 -
Much of the protein feed necessary has to be imported and
foreign currency necessary is met by grain export. Wheat for
human consumption and maize export bring more foreign currency
per hectare than oilseeds; at the end of the 1970's net income
of maize per hectare was despite a considerable input of impor-
ted fuel-oil for drying 36 $ higher than that of sunflowerseed and
173 $ than soybean. The cost of a feed-unit of hot-air process
1ucerne-mea1 was 3 times higher than natural lucerne hay and
10-30 percent higher than imported protein.
The growing protein gap is currently met with excess feed grain,
but this in not an efficient solution. Problems of feeding-economy
are shown by the fact, that while output of animal products per
animal unit rose 30 percent in the 1970's there was no improvement
of feeding efficiency, mainly because nutritive-value of feed
- rnainly lizin - declined as a consequence of spreading dehydration
and technological deficiencies during the drying process etc.
The part of animal protein s declined from 9 to 5 percent and
replacement with amino-asids did not bring results expected.
Expansion of lucerne-meal from 1.8 to 4.7 of the feed-ration
led to a loss in feeding efficiency, as it is not good for every
animal species. Protein demand is enhanced by the fact, that
smallscale pig and poultry farming changes in the direction of
feeding concentrates instead of household by-products.
The key issue of the future production structure of Hungarian
agricultural production is grain production, as this is the most
important part of the whole food economy. Without an expanding
grain production, augmentation of animal production would be
unwise, while it is possible to expand cereal production without
the =mai sector also. The importance of grain production is
justified by relatively low inputs also. Thus resources should
be primarily concentrated on grain production.
Budapest, May, 1983.
- 40 -
Låszlö Csete
RESEARCH INSTITUTE FOR AGRICULTURAL ECONOMICS
BUDAPEST, HUNGARY
E010]=CAL MISIDERATIONS AND THE REGIONAL DISTRIBUTION
OF CROP PRODUCTION IN HUNGARY
The regional distribution of crops is the instrument of the
management of the national economy and the farms, to raise
economic achievements. The target is an efficient production
of good, or excellent quality goods, and the raising the com-
petitiveness of Hungarian food economy.
There is world-wide growing interest in the utilization of natural
resources, particularly the renewables and the same is true in
Hungary also. In Hungary the most important natural resource is
the land and its efficient utilization is decided by the large
farms and the small producers integrated by these.
Reasonable utilization of the land is a complex task. Farms have
to accomplish simultaneously a more profitable utilization of
production sites, a retardation of land-loss, particularly the
conservation of the good sites, raising of productivity mainly
by land reclamation and a saving of inputs and raising their
efficiency.
Distribution of crops is shaped by a greatmany factors and
conditions; differences of natural conditions / soil, climate,
hydrologic conditions, surface, etc./, production traditions,
existing equipment, distance of processing facilities, size,
settlement pattern, infrastructure of consumer agglomerations etc.
Research, state economic management and firms ali have their
opportunities in the exploration and utilization of these factors
and conditions.
- 41 -
1. Role of research in regional distribution
Research has to rely on the profound exploration of the facts,
the uncovering of the basic interrelations and ascertaining
direction and intensity of the effect of difference factors and
conditions. From ali these, input - production site - yield
relations have basic importance as their utilization can bring
permanently additional profits to the firms.
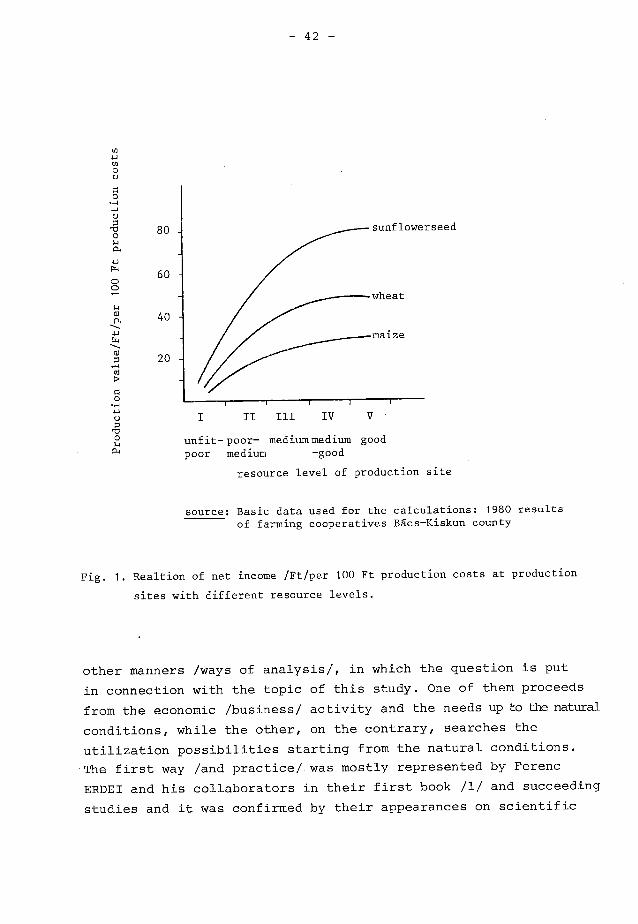
Earlier investigations have already analysed the threefold
interrelation of input - production site - yield; we published
these in foreign languages in our booki). We stated there,
that at favourable production sites yields are higher, efficiency
of inputs better and rentability higher than on production sites
with lower resource level. Additional inputs have - at least
on the Hungarian price relations etc. - often declining efficiency.
Fig. 1. shows rentability as a function of the resource level of
the production sites in our biggest agricultural county.
We would like to present in addition from recent research in
Hungary two new results: analysis and forecast of Hungarian
agro-ecologic potential to the year 2000 /we have investigated
this earlier also/ and county level examinations.
a/ Analysis and forecast of Hungarian agro-ecologic potential
to the year 2000
Concerning the interrelations of the regional and enterprise
division of labour and specialization in the Hungarian agricultural
production and of the natural conditions, along with the other
ways of approach, there are two essentials, differing from each
1)F. Erdei-L.CSETE-J.MÅRTON: Intensity of farming /A mezögazdasåg belterjess6ge/ Közgazdasågi 6s Jogi Könvvkiadö, Budapest, 1963.
sunflowerseed
- 42 -
II III IV V
unfit-poor- mediummedium good poor medium -good
resource level of production site
source: Basic data used for the calculations: 1980 results of farming cooperatives Båcs-Kiskun county
Fig. 1. Realtion of net income /Ft/per 100 Ft production costs at production
sites with different resource levels.
other manners /ways of analysis/, in which the question is put
in connection with the topic of this study. One of them proceeds
from the economic /business/ activity and the needs up -to -the natural
conditions, while the other, on the contrary, searches the
utilization possibilities starting from the natural conditions.
The first way /and practice/ was mostly represented by Ferenc
ERDEI and his collaborators in their first book /1/ and succeeding
studies and it was confirmed by their appearances on scientific
Production value/Ft/per 100 Ft production costs
- 43 -
forums /2./. Two branches of the second approach can be observed
in the domestic practice until now: first, the so-called landscape-
research, which has been, in essence, a discovery of site conditions
and utilization possibilities on municipal level /3/; second,
the investigation of site-input-yield relations /4, 5/ culminating
in the analysis of site conditions differentiating the input
efficiency, in the preparation of marginal analyses and in the
determination of the connected practical lessons.
Nevertheless, the research work, organized in inter-departmental
collaboration and to be reviewed below, for the most part
belonging to the latter ways of analysis, differs from them in
several aspects. These ones are as follow; discovery and forecasting
of the agro-ecological potential for 35 regions and 200 soil
mosaics; dimensions of research; number of collaborating experts
and institutions; rapidity of solution; procedure adopted; joint
adoption of different methods; concrete combination of analysis
and prognosis; determination of different optimalities.
The findings of investigations could be compared with geological
discovery. Namely, geologist discovers the possibilities,
utilization of which is the function of the prevailing economic
/business/ circumstances and decisions.
The findings of this research enterpreneurship were already
reviewed by some scientific sessions. The report /6/ delivered
on the occasion of 1980 General Assembly of Hungarian Academy of
Sciences presented an entire review on work made until that time.
Below, we try to make known the major goals, the findings,
the further possibilities of the utilization and some questions
of the solution, in a short way. Within the limit of this lecture
we pay a relatively greater attention to the latter aspects,
because we have not published them so far, and, the readers can
utilize in many respects this knowledge in their own practice.

- 44 -
On the major goals
We tried to discover, what total crop production will be
possible on the basis of agro-ecological fundamentals to be
expected for the millennium turn, assuming the existence of the
material, technical and economic conditions needed for utilization.
For this reason, in a detalied way we discovered the actual and
the expected methodological, soil, hydrological and melioration
data and the expected changes for 35 physical geographical regions,
adjusted to administrative boundaries, and, for 31 soils within
these regions. After this we calculated the specific yields
expected for the millennium turn of the major arable crops, the
meadow-pasture, the fruits, vegetables and grape, the forests
and the medicinal plants.
Parallelly, different calculations were made for the expected
domestic consumption, the agricultural reconsumption and the
export surpluses around the millennium turn.
Relying upon the available data basis we optimalized the arable
crop production and the total yield according to different
targets, finally we formulated recommendations concerning the
further utilization Iines.
On research findings
The findings of the discovery and the prognosis are manysided,
therefore we can mention only some of them.
It became clear from the investigations, the Hungarian agro-
ecological fundamentals do not hinder the remarkable increase
of the agricultural production. Nevertheless, it is obvious, the
agro-ecological characteristics make possible different develop-
ment by regions, as far as the direction and the extent of this
- 45 -
development is concerned. We can also suspect, the exploitation
of possibilities requires material /financial/ inputs of diffe-
rent size and structure.
It can be ascertained, that up to the millennium turn along
with a yearly grain production of almost 20-22 million tons, the
recent years' production yields of lucern, sunflower, fodder-peas
and soybean can be multiplied, while the domestic needs for
potatoes and sugar-beet can also be satisfied. Present production
yields of the major vegetables can be increased by 50 per cent.
Apple production can be increased by almost 50-80 per cent, while
production of other fruits can be increased by 100-150 per cent.
Present grape average yields can be doubled. About almost 50 per
cent of grass land can be transformed into such an intensive area,
which will provide a doubled production level. In the case of
adequate development of the forestry a further 50 per cent increase
of the present timbering can be realized.
We have to stress, ali these can be realized through the adequate
choose of site, and along with the needed material, technical
and economic conditions through the better exploitation of genetic
potential, the formation of adequate variety proportions, the
development of melioration and irrigation.
It is justified by calculations, the sowing structure adjusting
itself to the ecological fundamentals better than until now -
in addition to the increase of specific yields - can result
a further increase of almost 15-20 per cent in the total production.
However, the limiting factors known today - among others the
different economic /business/ and enterprisal circumstances -
had to be changed in the future for the sake of the cause.
The investigations draw attention to the fact , that at present the
flora of the country absorbs from the air elementary carbon of
35 million tons per year. This amount is greater, than the total
carbon content of consumed goal, crude oil and natural gas of
industrial origin.
- 46 -
Through the better utilization of the domestic agro-ecological
potential remarkable reserves might be put in motion, so we can
surely declare that along with the satisfaction of domestic
needs with adequate quantity and better quality, commodity funds
for exports can be multiplied, thus the Hungarian positions in
the world trade of foodstuffs of strategic importance can be
further improved.
Among the research findings we can also register the procedure
and the adopted methods, as well as those additional studies
which discovered until now to a less extent known areas, estab-
lishing in such a way the more manvsided return and better
prevailing of natural resources utilized in the agriculture.
Of course, natural endowments do not appear automatically.
The growth possibility circumscribed by estimated data and the
long-run, optimal utilization of natural resources presuppose
the advantageous changes in several social and economic factors
- above this investiaation; - these are among others; skilled
labour force, organization, system of economic /business/
interests, adequate infrastructure in agricultural settlements,
development of technical and chemical industrial basis, size of
resources needed for the implementation of melioration and irri-
gation, innovational abilities, etc.
"Utilization possibilities of the research findings
Measuring the agro-ecological potential of the agriculture
indicated such possibilities, utilization of which corresponds to
aggregated interests of the society.
In the course of the measurement not onlv the possibilities were
brought to light, but also those limits, which hinder the prevailing
of the agro-ecoligical potential Both the macro-economic management
and the science have to take part in surmounting this obstacle.

- 47 -
The measurement has not been a long-term pian, however, the
collected data and results can be fairly well utilized in the
social and economic prognosis, in establishing developmental
alternatives, in the formation of ways to look at things which deter-
mine the production and the research, in the establishment of new
research directions and in thapromotion of innovation.
In the exploitation of agro-ecological potential a decisive role
is played by the working people. The precondition of the
scientifically founded production has been the labour force with
adequate professional skill and innovational abilities.
Continuous production on a high level cannot be imagined without
adequate distribution concerned systems. Therefore, in the
course of the elaboration of the production development conceptions,
one has to take care with the determination of an adequate system
of economic /business/ concerns, and parallelly, with the
aim-oriented alteration of production and management organizations.
The possibilities implied in the agriculture can be realized only
in that case, in which this is provided by the property /ownership/
and distribution relations, the professional and the cultural
skill of labourers, the inter-enterprise ties, the elasticity of
macro-economic management and its regulators' system. For this
reason, while developing the latter aspects the findings of
measuring the agro-ecological potential have also to be taken into
consideration.
The prognosis for the millennium turn wants to promote the
improvement of the equilibrium position of the national economy,
the more "healthy" economic development, the social progress.
In such a way, it provides possibility- anacountry level and
by regions and even within the regions - for the alternative for-
mulation of industrial - in some cases foreign trade - and service
sector conditions, which establish and promote the utilization,
as well as for the economic efficiency investigations of develop-
mental variants which follow from the combination of these
- 48 -
conditions. The prognosis work can also promote more rational
development and organization of the domestic and export transpor-
tations, the storage and transport activities.
In the future, the producible biomass can be increased remarkably,
and it is not inconceivable, that - above the present forestry
cultures - crop production will be carried out definitely for
energy obtaining purposes /energy cropping/ in Hungary.
The data basis established in the course of the discovery provides
a firm ground for numerous further surveys, new researches, new
calculations adjusted to the changing circumstances. The investi-
cations are continued in the field of possible utilization Iines
of biomass, mostly concentrating on the determination of two
aspects; how the domestic fodder-protein needs can be satisfied
and what role might be played by bioenergy as an alternative
energy-resource in the long-term energy supply of Hungary. Along
with these basic important questions, several other problems
can be defined, such as, for instance, the analysis and the
description by function of interrelations between the agro-
ecological factors and the production results. Relying upon the
research findings we can investigate the utilization issues
- on enterprise or plant level - of site endowments, that is we can
turn to plant - or field-level analyses from the soil-mosaics
investigations.
The model describing the arable crop production- concerning its
method - can also be further developed through the enlargement of
the circle of factors involved in the investigation and the precision
of description of interrelations among the parameters.
The development of modelling for the fruit and grape production,
as well as for the animal husbandry sets still a lot of tasks
before us. It is especially a great problem to investigate in
one system the crop production and the animal husbandry, as well as,
to elaborate an optimal harmony of the agriculture, the forestry
and the processing activities.
- 49 -
b/ County forecasts for 2000
After the quantification of the basic ecologic characteristics,
optimal regional distribution and utilization of crop production
/arable crops, vegetables, fruit, grapes, woodland/ is elaborated
for ali mini-regions with in the county /the mini-regions were
outlined by us/ using four target-functions:
1/ maximization of production,
2/ maximization of profits,
3/ maximization of export expressed in dollars,
4/ maximization of export expressed in roubles.
By using different equilibrium and limiting assumptions the result
of the reallocation of crop production in mini-regions can be very
well evaluated.
2. Tasks for economic management
Improvement of the regional location of crops is guided by the
state with economic instruments; prices have in this a prime
importance but credits, subsidies and tax-refunding are used also.
When fixing price levels and price relations, the effect of the
production site on income differences, volume of production and
the form of reproduction /simple, increasing or decreasing scale/
have to be taken into account simultaneously. An outline model
meeting ali these simultaneously is illustrated in Figure 2.
Thus the improvement of the regional cropping pattern is steadily
and gradually shaped by the state, based on the interest of the
producers. Previously mentioned research results and the price
formation model elaborated in our institute /Fig.2/, can be used
for this purpose.
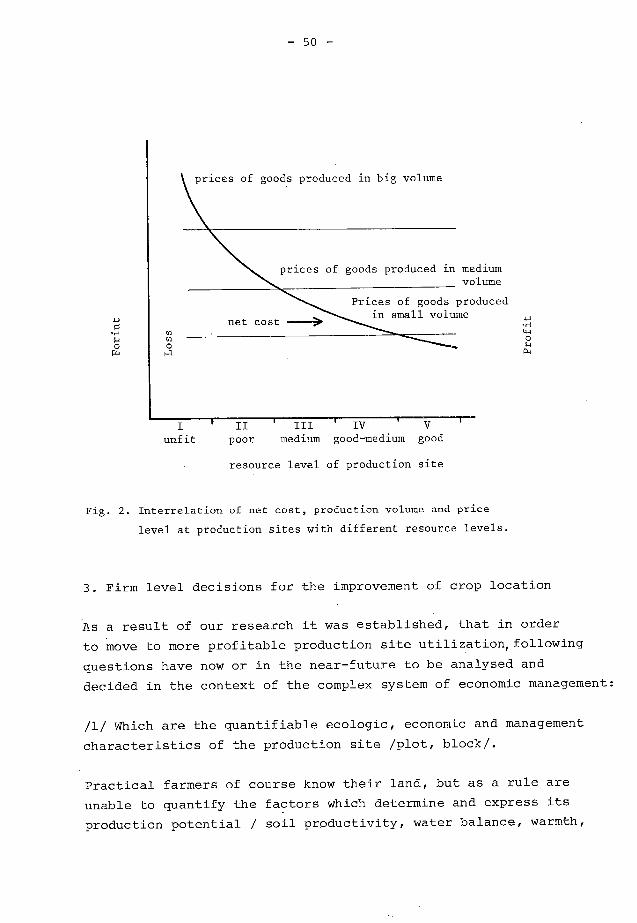
0
0 Fx+
0
prices of goods produced in big volume
prices of goods produced in medium volume
net cost -->
Prices of goods produced in small volume
- 50 -
IV V unfit poor medium good-medium good
resource level of production site
Fig. 2. Interrelation of net cost, production volume and price
level at production sites with different resource levels.
3. Firm level decisions for the improvement of crop location
As a result of our research it was established, that in order
to move to more prof itable production site utilization,following
questions have now or in the near-future to he analysed and
decided in the context of the complex system of economic management:
/1/ Which are the quantifiable ecologic, economic and management
characteristics of the production site »olot, block/.
Practical farmers of course know their land, but as a rule are
unable to quantify the factors which determine and express its
production potential / soil productivity, water balance, warmth,

- 51 -
precipation, relief /though depth of the ground water-table or
frequency of climatic anomalies can have a decisive effect on the
security of production and considerably increase risks.
With the help of quantified data it is easy to rank the production
sites /plots, blocks/ and those with equal or near-equal resource-
levels can be aggregated in to three or five groups.
On farms, where simple or more sophisticated field registries are
carefully kept and farm statistical data duly recorded, demarcation
of plots is comparatively easy and on such farms here is no
difficulty to put down the functional relations in tables and
figures and make calculations on these. Horticulture and forestry
have long experience with registries. Today it is,of course,not
enough anymore to register only ecologic data, but it is very
important to know, how these are utilized.
The netlxpd employed and the cost and p=ibility to explore and eliminate
factors that limit a greater effect have particular importance.
A way to do this is land reclamation.
/2/ What can be produced on a particular production site
it is advisable when finding out how a particular production site
can be utilized to consider local practice, explore the production
site characteristics and use new scientific and technical
achievements.
Exploration and effective utilization of the resource level of
the production site has a determining importance in the interre-
lations shown in the model on Fig. 3.
/3/ What is the yield, input and prof it level where it is expedient
to produce a particular products; at which point does additional
income upset additional costs?
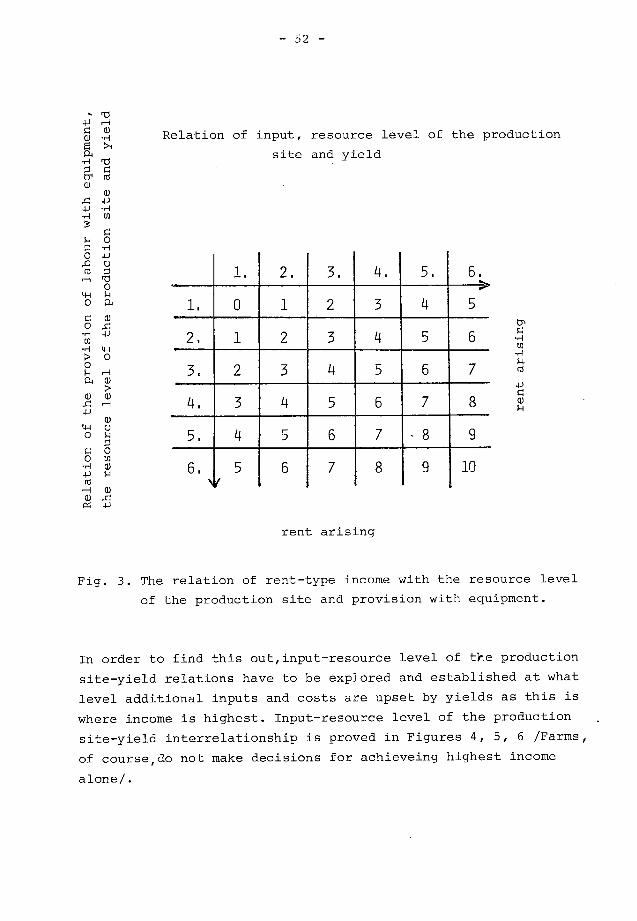
of labour with equipment,
production site and yield
Relat
ion of the
resource level
- 52 -
Relation of input, resource level of the production
site and yield
1. 2. 3. 4. 5. 6. >
1. 0 1 2 3 4 5
2. 1 2 3 4 5 6
3. 2 3 4 5 6 7
4. 3 4 5 6 7 8
5. 4 5 6 7 -8 9
6. 5 6 7 8 9 10 Ni
rent arising
Fig. 3. The relation of rent-type income with the resource level
of the production site and provision with equipment.
In order to find this out,input-resource level of tkte production
site-yield relations have to be explored and established at what
level additional inputs and costs are upset by yields as this is
where income is highest. Input-resource level of the production
site-yield interrelationship is proved in Figures 4, 5, 6 /Farms,
of course,do not make decisions for achieveing highest income
alone/.
rent arisinq

- 53 -
Ft/h
14 000
12 000
10 000
8 00
6 00
4 000-
2 000-
1 II III V Resource level of production site
0 production costs
nj net income
Fig. 4. Profitability of crop production in Båcs-Kiskun county
cooperative farms /1981/.
It should be examined how efficiency can be raised by the
modification of volume and structure of inputs /utilization of
biologic and genetic resources, by-products and wastes etc./
Thus crops can be selected with the anticipation to bring prof its
at a particular production site.

.1-1 • fl) 4-1 0 • o r-4
(11 r-T-1
9,00
8,00
7,00
6,00
poor
3,00
2,00 p,
w-- u w 1,00 .H
ro c(1 0,00
production site ilk yield liter/cow
- 54 -
/4/ What size crops should farms have in order
to be profitable?
To ascertain this, the next step is roughly to establish the size
of production on a particular farm on the basis of the net costs.
Net costs are decisive when selecting a reasonable production
volume on a farm, but of course other factors have to he considered
for practical purposesalso. Solution of the problem is illustrated
in Fig. 7. The lowest production volume of the farm is situated
around the lower limit of rentability, where decline of the net
costs slows down.
The greatest farm production volume is situated around the upper
limit of profitability, where net cost of the particular product
starts to rise abruptly. Optimal production volume of a particular
farm is where net cost is lowest.
poor
medium
good
Fig. 5. Relation of net cost, milk yield and resource level
of the production site.

400-
4_1 300_
w 200
100_
IT\ minimum net cost
/price Ft/100kg/
average net cost /Ft/100 kg/
/t/RA/ 3,0 3,5 4,0 4,5 5,0 5,5 6,0 6,5 7,0
2,00
w 4-, 1,00 w
Loss
3 1 2
- 55 -
additional costs / Ft/100 kg/
/ limit of profitable pro- Maximum of net income / duction per hectare attained,,
Max imum of net income per hectare attained
Figure 6. Profitability of maize production on a cooperative farm.
700-
600-
500-
NPt
COSt
Solling price
SIZE OF FARM
1 = minimal farm size 2,- optimal farm size 3 = maximum farm size
Figure 7. Relation of farm size and net cost

- 56 -
/5/ What is a good combination of the selected products and
what is a reasonable production structure to achieve stability
of income?
In order to ascertain this, the next step is the combination of
the previously selected crops and volumes into production structure
alternatives.
/6/ How can the production sites be improved and what is the
effect of this on inputs, yields and their structure.
Conservation and improvement of soil productivity gain is impor-
tance in future agriculture in the interest of the conservation of
environment and to meet food demand. Land reclamation has an
important role in this, and it is therefore reasonable for state
and cooperative farms to prepare with foresight for the task of
country and water planning, land reclamation and conservation.
Comparatively little imported goods and equipment are necessary
for land reclamation and labour and technical requisites are
available also; calculation can show what is the economic advantage
of the investments to be made. Land reclamation is a possibility
to interfere with the declining efficiency of inputs to modify
these in a positive direction.
Direct economic advantages of land reclamation /modification of
the size and structure of inputs, raising of yields, changes in
the crops grown and the structure of production/ have growing
importance, as they improve rentability.
Most important of ali the results of land reclamation is probably
yield improvement as a result of the elilrWl-tion of losses and
the raising of land productivity but a considerable cost redution
and production structure modification is important in some cases
also.
— 57 —
Erik Haggr&I, Pellervo Economic Research Institute
THE FINNISH GRAIN MARKET AND ITS STABILIZATION POLICIES
I Introduction
The objectives of this paper are twofold. In the first part the main developments on the Finnish grain market will be described since the beginning of the agricultural target price system in 1956. In the second part alternative stabilization schemes for the Finnish grain market are analyzed more in detail.
Target prices have been the main control instrument in the Finnish agricultural price system which has been officially stated in the subsequent Agricultural Income Acts. This system insulates the domestic market and prices from the world market developments. Under these acts it has been up to the government to secure the achievement of target prices. The means to accomplish this goal include regulation of foreign trade with export and import licenses as well as export subsidies and variable levies.
Within the target price system the relative prices of the main agricultural products become the most important single determinant of the composition of the final output in the agricultural sector. As can be seen in Figure 1, these price ratios have fluctuated slowly but widely in the long run.
Right now Finland is experiencing the results of the price policies followed from the late 1960s until 1977. Relative prices of agricultural products as compared to feed grain prices were increased successively under one decade. Under the same period the relative prices of bread grain declined even more than the feed grain prices. This development resulted in a
shift in input use in favor of animal production sector. Although the price
ratios have been adjusted since then (Figure 1), corresponding input adjustments take place very slowly. Consequently, this year Finland is experiencing a record level excess production of animal products and at the same time both feed and bread grain acreages fall short of the self-sufficiency level.
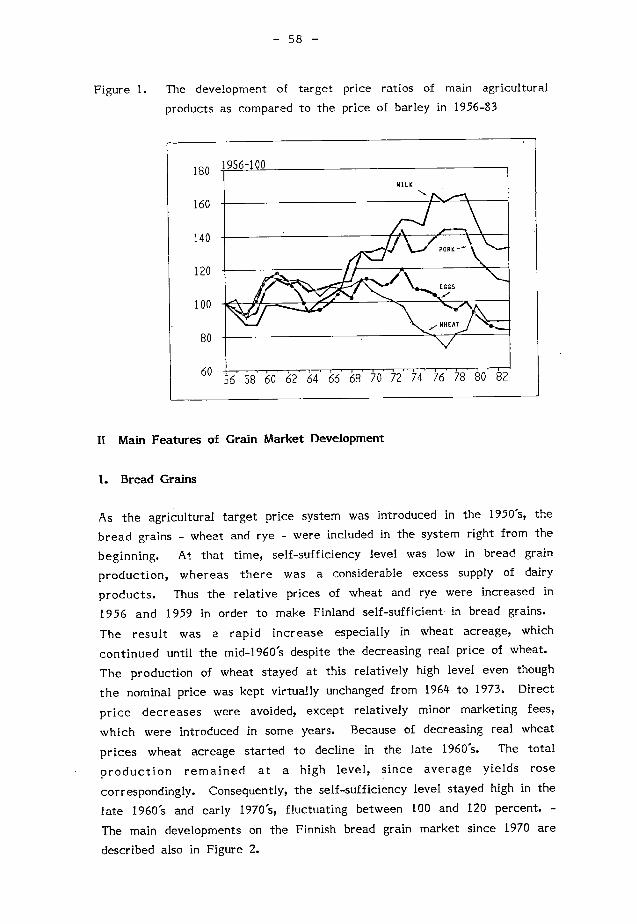
1956-100 M1LK
/
\.../..,•-••-•
Ey. 5
.....WHEAT ..-,
180
160
140
120
100
80
60
- 58 -
Figure 1. The deyelopment of target price ratios of main agricultural products as compared to the price of barley in 1956-83
II Main Features of Grain Market Development
1. Bread Grains
As the agricultural target price system was introduced in the 1950s, the bread grains - wheat and rye - were included in the system right from the
beginning. At that time, self-sufficiency level was low in bread grain production, whereas there was a considerable excess supply of dairy products. Thus the relative prices of wheat and rye were increased in 1956 and 1959 in order to make Finland self-sufficient in bread grains. The result was a rapid increase especially in wheat acreage, which continued until the mid-1960's despite the decreasing real price of wheat. The production of wheat stayed at this relatively high level even though the nominal price was kept virtually unchanged from 1964 to 1973. Direct price decreases were avoided, except relatively minor marketing fees, which were introduced in some years. Because of decreasing real wheat
prices wheat acreage started to decline in the late 1960s.- The total
production remained at a high level, since average yields rose
correspondingly. Consequently, the self-sufficiency level stayed high in the late 1960's and early 1970s, fluctuating between 100 and 120 percent. -
The main developments on the Finnish bread grain market since 1970 are
described also in Figure 2.
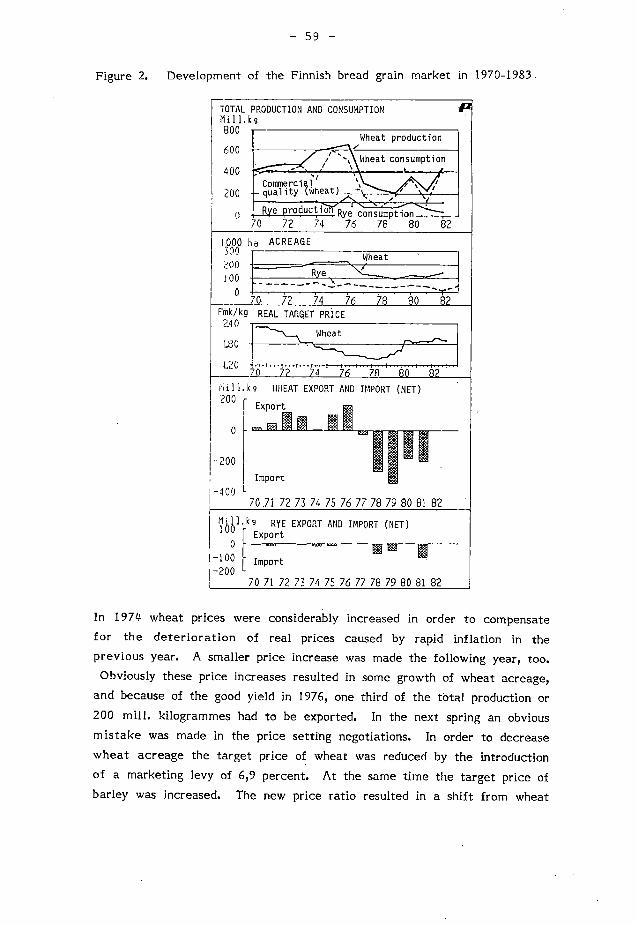
— 59 —
Figure 2. Development of the Finnish bread grain market in 1970-1983
TOTAL PRODUCTION AND CONSUMPTION Mill.kg 800
600
Wheat production r
400
Wheat consumption
200 Commercial
.,
(wheat) — quality
R e producti°Rye consumption 70 72 74 76 78 80 82
1000 ha 300
ACREAGE
Wheat 200
100 -----R— ------------‘ 1 0
„r- 0 72 74 76 7R 80 R2
Fmk/k9 REAL TARGET PRICE 240
L80 Wheat
---- —/P 120_..t
7.0 72 74 76 7A 80 82
Mill.kg
200 WHEAT EXPORT AND
Export
0
IMPORT (NET)
—400
-200
Import
70.71 72 73 74 75 76 77 78
....
......
79
ffi
80 81 82
Nl
' 0
kg RyE EXPORT AND IMPORT (NET) Export
' -100 —200
M m E Import
70 71 72 73 74 75 76 77 78 79 80 81 82
In 1974 wheat prices were considerably increased in order to compensate for the deterioration of real prices caused by rapid inflation in the previous year. A smaller price increase was made the following year, too. Obviously these price increases resulted in some growth of wheat acreage,
and because of the good yield in 1976, one third of the total production or 200 mill. kilogrammes had to be exported. In the next spring an obvious mistake was made in the price setting negotiations. In order to decrease wheat acreage the target price of wheat was reduced by the introduction of a marketing levy of 6,9 percent. At the same time the target price of barley was increased. The new price ratio resulted in a shift from wheat

- 60 -
to barley. In 1977 also the weather conditions were exceptionally unfavorable and yields were accordingly very low. Consequently, a considerable amount of wheat had to be imported. Later on the marketing levy had to be paid back to the producers.
In the following year, wheat production decreased further to an ali time low since the introduction of the target price system in the 1950's, resulting in the self-sufficiency level of about 40 percent. In order to encourage wheat production again, a special payment was offered to farmers on per hectare basis for the acreage they allocated for wheat in 1979.
Wheat price was increased in real terms also in 1980, and in 1982 a similar special payment as in 1979 was offered again. Consequently, the prof itability of wheat production has become better and a slow increase in wheat acreage has taken place. Anyhow, today's acreage falls short of the self-sufficiency level corresponding average yield and quality.
The exogeneous price setting system has led to relatively large fluctuations in wheat hectarage in the past. Obviously the main reasons behind the fact that no equilibrium has been attained have been the difficulties to evaluate the long run impacts of price changes and the political problems connected with nominal price reductions. Actually wheat prices have been adjusted upwards only at two phases and the downward adjustments have been caused by inflation. Thus it seems to be extremely important that the initial price increases are moderate and, if a rapid adjustment is desired, they can be accompanied by temporary premiums or fees.
Rye production has not experienced as strong fluctuations as wheat production since the target price increases in the late 1950's were made to increase bread grain production. This is obviously mainly due to the special role of rye in the cultivation cycle. In most areas of the country rye is the only grain that can be sown in the fall after fallowing. Only in
the southern part of Finland winter wheat is competing with rye. An important factor changing rye acreage is the weather in August. In some years too much rain has made it impossible to sow the planned acreage. - Anyhow, the target price setting for rye has met with the same kinds of problems as discussed above in the case of wheat, even if on a smaller
scale.

- 61 -
Consumption patterns of both bread grains have been changing slowly since 1950. Rye consumption has been declining during ali that period. In the 1950's the rate of decline was relatively fast because rye was partly substituted by wheat in the Finnish diet. In the last years the consumption per capita seems to have reached a bottom - ceteris paribus - of about 20 kilogrammes, because the annual changes have been minor. Wheat consumption increased somewhat in the 1950's but since then it has been decreasing, too. The rate of the decline has slowed down and in recent years the annual consumption has been about 50 kilogrammes per capita. - At the present income level both bread grains seem to be slightly inferior goods or neutral with respect to income changes, i.e. the income effect is near zero.
The population growth has been small since the early 1950's and is approaching zero. Thus demand has not shifted significantly by population changes, especially not in the 1970s.-
2. Feed Grains
The marketed amounts of feed grains - barley and oats - remained relatively small until the late 1960's. Since then feed grains have been the most important group of cash crops. At the same time feed grains were included in the target price system. Previously the feed grain was produced mainly to be used directly on the farms, and domestic supply and demand were largely balanced at the farm level. On some occasions feed grain had to be imported because of low yields.
When feed grains were included in the target price system, the price uncertainty was eliminated. This may have been one reason for the increased commercial supply, but it should be noted here, too, that better varieties were introduced at the same time and the relative prices of feed
grains compared to wheat were slightly increased. - The main developments on the Finnish feed grain market since 1970 are described also in Figure 3.
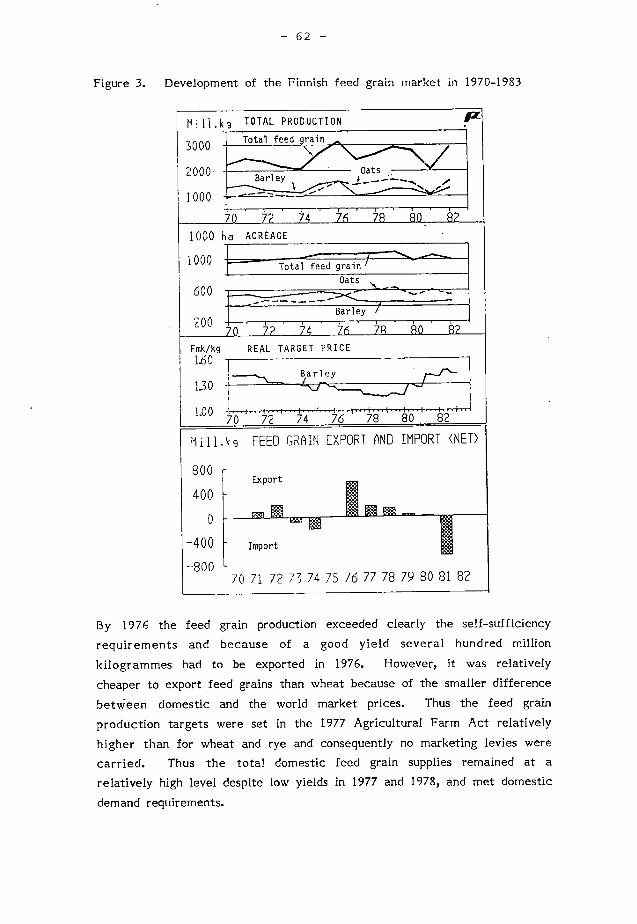
7 0 7? 74 76 AO A? 1000 ha ACREAGE
70 REAL TARGET PRICE
70 72 74 76 78 80 82
Mill.kg
3000
2000
1000
1000
600
200
Fmk/kg 1.60
1.30
TOTAL PRODUCTION
Total feed grain
Oats Barley
Total feed grain
Oats ••••
Barley
Barley
Import
0
400
800
Mill.kg FEED GRAIN EXPORT AND IMPORT (NET)
800 [ Export
400 L
70 71 72 73 74 75 76 77 78 79 80 81 82
— 62 —
Figure 3. Development of the Finnish feed grain market in 1970-1983
By 1976 the feed grain production exceeded clearly the self-sufficiency requirements and because of a good yield several hundred million
kilogrammes had to be exported in 1976. However, it was relatively
cheaper to export feed grains than wheat because of the smaller difference betvieen domestic and the world market prices. Thus the feed grain production targets were set in the 1977 Agricultural Farm Act relatively
higher than for wheat and rye and consequently no marketing levies were
carried. Thus the total domestic feed grain supplies remained at a relatively high level despite low yields in 1977 and 1978, and met domestic
demand requirements.
- 63 -
In the past decades the relative shares of barley and oats have changed in f avor of barley, reflecting the changing demand patterns. In the post-war per;od the production of pork, grain fed beef, eggs, and poultry has increased considerably resulting in a higher demand on barley. Anyhow,
the dem and patterns have been changing slowly and without sharp
short-term fluctuations.
In ali, feed grain market was relatively well balanced until the late 1970's. In 1980 it became obvious that domestic feed grain supply would not meet with the requirements of domestic demand if animal production would continue to increase. In 1981 an extremely poor crop was harvested and large amounts of feed grain had to be imported. - In the situation of today, domestic feed grain supply will be enough only if the yields per hectare are above the average level. But if the animal production will decline to meet better with the self-sufficiency target levels, present feed
grain acreages would be quite adequate.
In the past decade grain market has become more sensitive to changes in relative prices. This situation is caused by the specializing development in Finnish agriculture. A successively larger share of feed grains is produced on farms specializing in cash crops. Consequently, in the future large shifts in grain acreages can be induced with changes in relative prices.
3. Grain Storage Policies
Traditionally reserve stocks of grain have been kept by the State Granary, which is a state owned monopoly taking care of the foreign trade in grain. Private firms and farmers have usually kept only working stocks. The farm statistics indicate also that farmers have occasionally kept carry over stocks of feed grain if the yield has been especially good, but correspondingly they also seem to have reduced the feed grain acreage to some extent in the next year.
The level of the Finnish bread grain stocks compared with annual
disappearance has traditionally been among the highest ones in the world. In a review made by the Food and Agriculture Organization in 1974, the wheat stocks were reported to equal 84 percent of the estinnated average
- 64 -
annual use and the rye stocks were on a 74 percent level. The storage targets for bread grain were even higher, 93 percent and 111 percent for wheat and rye, respectively. In the past, these stocks have not been used to stabilize markets because they have been reserved for use in emergency situations, where normal trade is not possible. Anyhow, there have been plans to introduce more flexible rules for managing these stocks. Stabilization of yield fluctuations is becoming a more important target.
Feed grain stocks have been much smaller than those of bread grains compared with the domestic disappearance. The stocks have mainly reflected fluctuations in the yield, although no clear storage rules have been followed. In the last few years there has been a growing interest to increase also the feed grain stocks on a level which would minimize exports and imports caused by annual fluctuations in domestic production. Especially the large variance of yields in the 1970's has motivated these plans. Feed grain stocks are not to be reserved only for emergency situations, but they also are to actively counteract the yield fluctuations.
III Alternative Stabilization Schemes for the Finnish Grain Market
In future, a more balanced grain supply and an optimal self-sufficiency level can best be achieved by combining various means of stabilization. It must be noted, however, that the usable means have a certain hierarchy. First, sizing grain acreage determines the expected average self-sufficiency level. On the other hand, the annual fluctuations of self-sufficiency can be controlled both by carry-over stocks and by fallowing schemes. To balance the supply and demand of grain it will be necessary to use foreign trade at least to some extent, because it is not possible even in theory to stabilize year-to-year crop fluctuations. There can always be so many successive bad years that not even a large storage capacity will do.
Then, what is the optimal self-sufficiency level of grain in the whole of economy, and how can it be achieved by stocking, adjusting production and using other means of agricultural policy?
This paper will seek to examine problems connected with the optinnization of stocks. In the same connection, also other balancing means will be studied because stock policies alone can not serve as means for optimal balancing policy. It has to be related to other balancing means, such as exports, imports and fallowing.
- 65 -
1. The Goals of Society as a Basis for Stabilizing Schemes
It is necessary to make certain fundamental choices between alternative goals bef ore the various stabilizing schemes can be developed and estimated purely by economic criteria. Because grain crops vary at random, at least one stage in the food system has to be adjusted. As known, the practice in Finland has been in the past decades that the consumer does not need to change his consumption level as the agricultural production fluctuates. Consequently, the stable domestic price level gives quite considerable relief in the estimation of various balancing programmes, because in this case the preferences of the consumers and the welfare effects resulting from changed consumption need not be estinnated at ali.
Another choice in the determination of the self-sufficiency level of basic products will be between the economic benefits and the level of risk. In
the production of basic food items social risk is traditionally minimized by attempts to achieve a high self-sufficiency level and this is still done although basic food products have most often been available in the world market at prices clearly below our price level. This goal has, on the other hand, resulted in conflicts with regard to some agricultural inputs when purely economical considerations have been given the first place and a greater risk has been taken in the form of imports.
So far, it has not been possible - by means of economic theory - to estimate the real willingness of society to take risks and so straight-f orward comparisons between economic benefits and the level of social risk cannot be done. Therefore the self-sufficiency level of food production has to be chosen first on some other than economic basis and only after this it is possible to start studying how supply could be controlled to meet the chosen self-sufficiency level.
In the storing of grain the choice between risks and economic benefits has to be made in the determination of the size of the buffer stocks kept for
crisis. In respect of economic theory buffer stocks cannot be sized without
strong hypotheses about e.g. the probabilities of different kinds of crises.

- 66 -
In practice this will lead to the situation in which the level of buffer stocks and their use in various situations has to be decided separately on basis of the security interests of society. In our country it has been argued publicly that the buffer stocks should correspond to the commercial consumption of one year at least when bread grain is concerned.
When the buffer stocks of grain have been sized on the basis presented above, the balancing of the annual fluctuation of grain production can be examined as a separate problem.
2. Simulation Models an Empirical Approaches on Stabilization Schemes
Although the grain storage problem has remained important through the history, no general rules for an optimal storage program have been stated
so far. This situation is caused by some specific features connected with the storage problem. Storage operations are by their very nature actions which are aimed to bring some benefits in the future. Consequently, these benefits are necessarily stochastic. There are always considerable risks involved in the storage operations and there is no guarantee that individual storage operations will bring some economic gains. They may as well result in economic losses. Even if the expected storage benefits are clearly positive, the outcome is very risky and this may discourage private industry from keeping stocks at socially optimal level. Thus in the society, there is clearly a need for a risk neutral public agency who will keep optimal stocks.
Because of the theoretical difficulties encountered in traditional approaches, simulation techniques have been more widely used in recent years while attempting to find practical solutions to storage rules. Because of the development of modern high-capacity computers more complex simulation methods have become usable. Thus the advantages of simulation techniques in deriving storage rules can be more fully exploited e.g. to answer specific questions raised by decision makers and which cannot be answered by purely analytical means.
Simulation techniques make it also possible to compare different decision rules such as storage rules. Because future benefits and costs connected with different storage programs are not known, evaluation of such
- 67 -
programs must be based on the expected values. This method has been used in a number of empirical works on storage problem. Since the yields of Euture years are not known, the fluctuations in yield levels must be generated by series of random numbers. Different time intervals, e.g. 10-20 years or even more can be used. A great number of such random series - e.g. 100-1000 - are required to estimate the parameters describing
the alternative storage programs. In Finland/most interesting parameters would be average self-sufficiency level, total costs of stabilizing schemes, storage costs, import and export costs, how often storage capacity is fully used and how often storages run empty, as well as parameters describing variations in the former variables.
Simulation techniques will not guarantee that an optimal rule can be found. However, different rules can be compared and those which meet the prestated criteria most satisfactorily can be chosen. However, it should be kept in mind that also good storage rules may lead to losses if some factors develop exceptionally.
In some cases there have been attempts to investigate storage rules by using some recent years as basic data. The problem in this method is that it is very unlikely that the past time series will ever be observed again as such.
Sizing of Different Stabilization Schemes
So far no empirical results are obtained which would be needed to evaluate different stabilization schemes. However, economic theory shows that the eff ectiveness of alternative stabilization schemes varies according to the degree of self-sufficiency.
A small and wealthy country like Finland can normally choose to what extent it wants to rely on the world market when aiming at an equilibrium on grain market. In the past, storage operations have not been used to a large extent to stabilize annual supply fluctuations on Finnish grain market. Consequently, grain has been both imported and exported in a short period of time. In a situation where the degree of self-sufficiency is fluctuating around 100 per cent, storage policies would have been relatively beneficial.
- 68 -
When calculating costs of alternative schemes, freight costs for import and export must be added. According to the State Granary the sum of subsequent import and export costs amounted to 30 pennies per kg in 1980.
In the long run, most countries are clearly either net exporters or net importers. In such a situation the relative importance of storage operations becomes less significant. In Finland the degree of self-sufficiency has decreased considerably in the past years. Consequently, we are gradually becoming permanent grain importers. Thus it will be impossible to stabilize yearly fluctuations on grain market by storage operations, if the degree of self-sufficiency is not kept at the target level.
The relative importance of storage schemes decreases also when the average level of self-sufficiency increases above 100 percent. Because feed grain would be least costly to subsidize when exported to the world market, it would be advantageous to direct the excess capacity of the agricultural sector in Finland to feed grain production. The optimal stabilization scheme of Finnish grain market is obviously obtained when the grain production on the average is somewhat larger than domestic disappearance and storage operations are used to ensure domestic supply when yields are below normal level. When such a scheme is applied, grain will be exported in the long run. Despite the export costs involved this scheme is obviously most economical when the general target is to keep production capacity of agricultural sector at a level which will supply adequate production also if the world market supply falls short of demand.
- 69 -
THEME
THE ECONOMICS OF GRAIN PRODUCTION ON DIFFERENT
TYPES OF FARMS
- 71 -
J6sef St. Zegar
INSTITUTE OF AGRICULTURAL
AND FOOD ECONOMICS
WARSZAWA, POLAND
THE ECONOMICS OF GRAINS PRODUCTION IN PRIVATE FARMS
1. The importance of grains in the private sector of agriculture
The private sector in Polish agricu1ture1) uses approximately 3/4
of the total agricultural area and indentical is its share in
the total arable area. The share of the private sector in the
total area planted to grains is slightly higher / i.e. about 80 % /
and its share in the total grains crop oscillates around 80 %.
In absolute numbers these shares in 1982 represented the following
figures / in parenthesis we have shown the respective figure for
the whole agriculture /: agricultural area - 14.2 million hectares /
18.9 million hectares /, arable area - 11.1 million hectares / 14.5
million hectares /, area planted to grains - 6.5 million hectares
/ 8.1 million hectares /, grains crop - 16.4 million tons / 21.2
million tons /. During the period of some dozen or so recent years,
to which this paper is restricted, the discussed shares have
manifested a slight dropping trend. This phenomena had its reason
in the agricultural policy executed in the 1970's, especially in
the land policy. During the most recent years these trends have
been arrested and even slightly reversed.
1) The private sector in agriculture includes - beside the private farms / i.e. farms with the total area exceeding 0.5 hectares, run by farmers on their own land and that leased / - as well private agricultural plots with a total area of less than 0.5 hectares, used for agricultural purposes by private persons, the garden plots of employees in the socialized sector of agriculture and in addition the farms of private owners of farm animals who have no land used for agricultural purposes. Thus the private farms' share in 1982 in the respective totals for the private sector in agriculture was 97.6 % of the agricultural area, 98.2 % of the arable area and 99.3 % of the total area planted to grains.
--72 -
Grains play a very important role in the organization and
economics of the private farms. This however does not
stem the least from the link of grains production with the
maximization of agricultural income, the latter being the prin-
cipal target and economic motive in management for the dominating
population of private farms in Poland. This link in the case of
a small commercial scale farms run by peasants is indirect and
relatively complicated.
A characteristic of the small commercial scale peasant farms is
the subordination of the plant production, in this including
grains production, to the requirements of animal breeding, and
not to the requirements of the market. This characteristic is
proper for the general level of social and economic development
reached by Poland presently. The advances made by the non-agri-
cultural sectors of the national economy, especially industry,
force - through income generation - a growing demand for products
of animal origin. This is the first condition for the appearance of
the characteristic discussed. The second condition was the lack
of progress in the improvement of the agrarian structure of
private agriculture in Poland.
The sector of private agriculture in Poland is characterized
by a considerable dispersion of farms. The average agricultural
area per farm considered statistically / i.e. over 0.5 hectares /
was only little over 4.7 hectares. Out of the total number of 2.9
million units of private farms today as many as 60 % had_ an area
smaller than 5 hectares, using 1/4 of the area at the disposal
of private farming. The share of farms with an area of 10 hectares
or more in the total number of private farms was 14.7 % and their
share in the agricultural area of the private sector was 40 %.
This dispersed agrarian structure was the principal reason due to
which the majority of private farms cannot achieve the satisfying
income when orienting themselves toward commercial grains produc-
tion. In fact, in Poland there has not evolved a type of a grain -
producing farm in which grains production would constitute the

- 73 -
principal source of income. The reason for this is principally
the dispersed agrarian structure of private agriculture as well
as, though this in a lesser degree, the weakness of the agricul-
tural market and the direct links of cooperation between the farms.
The share of government purchases in private farms' total grains
output exceeded 1/5 of their total crop only in the 1973-1975
period. During the recent years this share, despite various
incentives for sales to government procurement institutions,
has dropped drastically, for instance in 1980 it was 10.3 %,
in 1981 only 6.8 %. This share of commercial production in the
total output is shaped by a number of factors, first of ali by
the relation of the grains crop to the animal numbers level and
the size of supply for agriculture of concentrated feedstuffs from
government resources, these being created principally through
the imports of grains and high protein content feedstuffs. One
might thus say that the farms' proper feedstuffs resources, in this
also included the resources of concentrate feedstuffs/grains/designate
the bottom line limit for animal production in these farms. The
actual level of animal production, over this limit, is marked by
the potential possibilities of purchase of concentrate feedstuffs
from government resources. The situation on the concentrated
feedstuffs market thus is reflected more on the size of animal
production than on the grains production in the farms, if one
would take into consideration the total area planted to ali grains.
This is witnessed by many year trends of grains production, animal
production and the volume of sales of concentrate feedstuffs to •
farmers by the government. In the first half of the 1970's grains
production was increasing, so was animal production as well as
the purchases of concentrate feedstuffs by farmers. The share of
purchased concentrate feedstuffs / from government resources /
in the total volume of concentrate feedstuffs calculated per one
head of big farm animals / cattle, swine, sheep and horses /
increased from 18 per cent in 1970 to 26 per cent in 1975.
The relation of prices offered by government procurement organi-
zations for grains to the price paid by farmers for concentrate
- 74 -
feedstuffs favored growing commercialization of grains, that is
the share of grains sold in the total grains crop. The share
of grains in the total area planted did not change however.
In the second half of the 1970's the production of grains in
private farms dropped, principally as result of stagnation in
fertilizer application and as effect of unfavorable weather
conditions. At the same time by the end of the 1970's the supply
of concentrate feedstuffs for agriculture from government resources-
began to lower. The share of concentrate feedstuffs purchased in
the total volume of concentrate feedstuffs used per one head of big
farm animals lowered from 24 % in 1980 to 21 % in 1981. In this
situation the farmers - in their economic interest - aimed at
maintaining the animal stock numbers, decreasing the sales of
grains to the state. While in the middle of the 1970's the
procurement of grains from the private farming sector amounted to
approximatelv 3.5 million tons, then in 1979 this figure was 2.2
million tons, in 1980 respectively 1.5 million tons and in 1981
the procurement of grains was only 1.1 million tons, despite the
fact that in the period 1979-1981 the production of grains in the
discussed sector of agriculture increased by 2.4 million tons.
It is without any doubt that of considerable importance remains,
though it is decreasing, the subordination of grains production
to the needs of the household / i.e. the farm family's own
consumption of its crops / and the requirements of the live draft
power force. The number of horses used as draft power is system-
atically dropping and so is changing the model of consumption in
farm families. Nevertheless objective conditions, such as
insufficient supply of tractors, imperfections in the agricultural
services sphere, problems of inadequate supply on the food products
market, as well as subjective factors like traditions, customs
etc. have resulted in these elements being still considered in
the farmers' production decisions, if one takes into consideration
the whole population.
- 75 -
Grains occupy one of the principal positions in the sphere of
organization of production processes in private farms. Arable
areas represent approximately 77 % of the total agricultural area.
In turn, grains occupy about 59 % of the arable area and 45 %
of the total agricultural land in private farming. Presently
planted to grains is an area of about 6.5 million hectares
/ in 1982 1, in this the four most important grains in Polish
agriculture, i.e. rye, wheat, barley and oats represent an area
of 5.6 million hectares.
The area planted to grains - as we have discussed it before - is
rather little elastic in respect to economic and technical and
production conditions in agriculture. A better elasticity is
manifested on the other hand by the changes in the areas planted
to the respective grains or in other words in the grains planted
area composition. This is witnessed by the statistics in Table 1.
The changes in the composition of the area planted to grains are
determined by the situation on the concentrate feedstuffs market
and the efforts of the farmers to maximize the production of
concentrate feedstuffs per unit of area earmarked for grains.
They are also the result of a decreasing number of draft horses
and of the dropping tendency in consumption of grains produced
by the farmer family itself. The most prominent characteristic
of the changes in the grains area composition is the growing
share of mixed grains grown for grain. The decisions of farmers
in this respect are correct, as these mixed grains give a better"
yield than other grains. The growth of the yields of the former
was anyway clearly visible / see Table 2 /. The crisis in Polish
agriculture, started in 1980, caused among othersa drop in the
share of wheat and anew an increase of the share of rye. This is
explained by the fact that despite the lower yields rye still
remains the basic feed grain and on the other hand the procurement
prices offered by the government for grains have been levelled
for ali of the four basic grains in Polish agriculture.
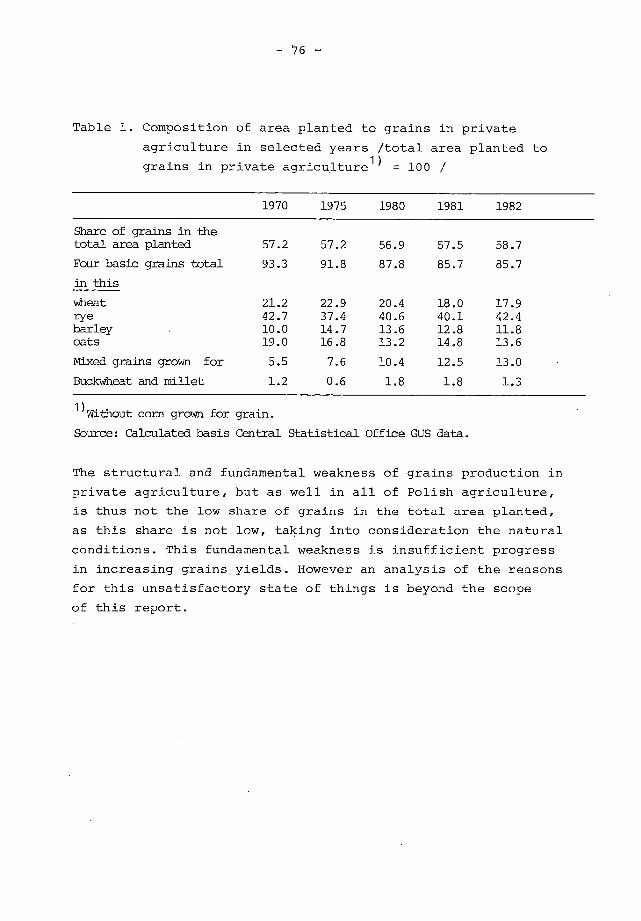
- 76 -
Table 1. Composition of area planted to grains in private
agriculture in selected years /total area planted to
grains in private agricu1ture1) = 100 /
1970 1975 1980 1981 1982
Share of grains in the total area planted 57.2 57.2 56.9 57.5 58.7
Four basic grains total
in this
93.3
21.2
91.8
22.9
87.8
20.4
85.7
18.0
85.7
17.9 wheat rye 42.7 37.4 40.6 40.1 42.4 barley 10.0 14.7 13.6 12.8 11.8 oats 19.0 16.8 13.2 14.8 13.6
Mixed grains grown for 5.5 7.6 10.4 12.5 13.0
Buckwheat and millet 1.2 0.6 1.8 1.8 1.3
1) Without corn grown for grain.
Source: Calculated basis Central Statistical Office GUS data.
The structural and fundamental weakness of grains production in
private agriculture, but as well in ali of Polish agriculture,
is thus not the low share of grains in the total area planted,
as this share is not low, taking into consideration the natural
conditions. This fundamental weakness is insufficient progress
in increasing grains yields. However an analysis of the reasons
for this unsatisfactory state of things is beyond the scope
of this report.
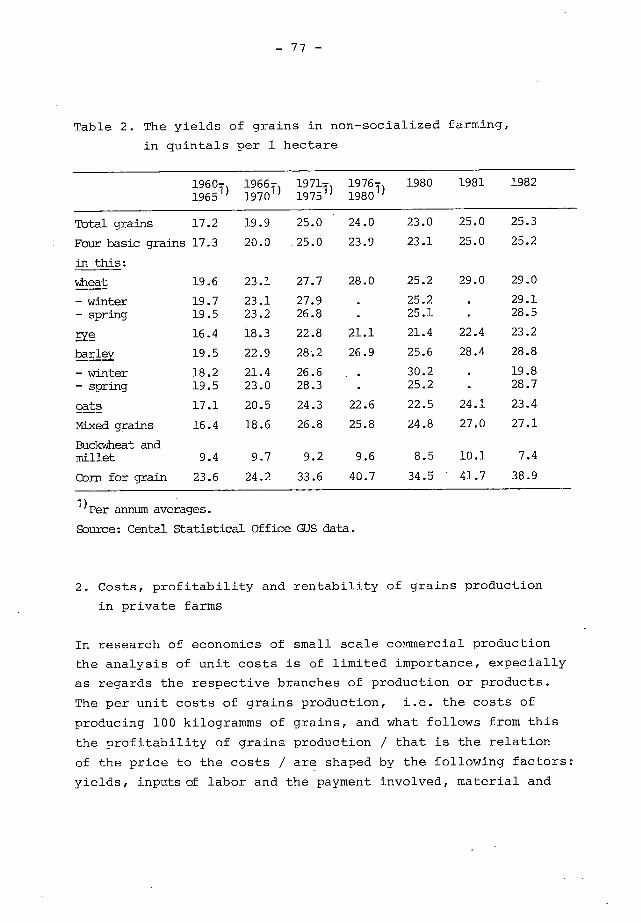
- 77 -
Table 2. The yields of grains in non-socialized farming,
in quintals per 1 hectare
1960- 1966- 1971- 197671) 1980 1981 1982 19651) 19701) 19751) 1980
Tötl grains 17.2 19.9 25.0 24.0 23.0 25.0 25.3
Four basic grains
in this:
17.3 20.0 25.0 23.9 23.1 25.0 25.2
wheat 19.6 23.1 27.7 28.0 25.2 29.0 29.0
- winter 19.7 23.1 27.9 25.2 29.1 - spring 19.5 23.2 26.8 25.1 . 28.5
....ye 16.4 18.3 22.8 21.1 21.4 22.4 23.2
barley 19.5 22.9 28.2 26.9 25.6 28.4 28.8
- winter 18.2 21.4 26.6 30.2 19.8 - spring 19.5 23.0 28.3 25.2 . 28.7
oats 17.1 20.5 24.3 22.6 22.5 24.1 23.4
Mixed grains 16.4 18.6 26.8 25.8 24.8 27.0 27.1
Buckwheat and millet 9.4 9.7 9.2 9.6 8.5 10.1 7.4
Corn for grain 23.6 24.2 33.6 40.7 34.5 41.7 38.9
1)Per annum averages.
Source: Cental Statistical Office GUS data.
2. Costs, profitability and rentability of grains production
in private farms
In research of economics of small scale commercial production
the analysis of unit costs is of limited importance, expecially
as regards the respective branches of production or products.
The per unit costs of grains production, i.e. the costs of
producing 100 kilogramms of grains, and what fo1lows from this
the profitability of grains production / that is the relation
of the price to the costs / are shaped by the following factors:
yields, inputsof labor and the payment involved, material and

- 78 -
money costs and by the procurement prices. The variations of
grains yields are quite large / see Table 2 /, the material
and money inputs increase systematically, while the procurement
prices increase by leaps. Ali this has contributed to a consid-
erable changeability of the index of grains production profit-
ability. In the 1971-81 period the profitability index for the
four basic grains varied from 79.6 % in 1980 to 131.4 % in 19731).
The per unit costs of production of the four grains in this period
have grown by 2.9 times. The fundamental cause was the rapid
increase of the remuneration for labor, which when calculated
per 100 kilograms of the four grains increased 3.6 times, despite
the fact that the inputs of labor per 100 kilograms have dropped
from 1.07 day in 1971 to 0.84 day in 1981. The material and money
inputs in the same period increased 2.4 times. The differentiated
dynamics of then labor costs and the material and money outlays
have resulted in the fact that the former constitute presently
approximately one half of the unit costs of production of the
four grains discussed. The growth of production costs was accom-
panied, though usually with some delay, by a growth of the
procurement prices, the latter increasing in the past then years
2.7 times. 56 % of the total growth of the per unit costs in the
1971-1981 period was due to the increase in the wages for a day
of labor. If one was to assume that the labor remuneration growth
was only an increase in the technical labor productivity, then
as effect of the growth of material and money outlays the price
of 100 kilograms of grains would increase only 1.9 times, not
2.7 times. From a formal point of view the production of grains
- except for three highly bad years / these being 1977, 1979 and 1980
/ - was profitable, and the total income calculated per one day
of labor more than covered the assumed labor remuneration2).
In this part of the paper we draw from calculations of costs and profitability in grains production done for the so called average private farm, which has been determined basis macroeconomic sta-tistics for the private sector, omitting farms withan area of less than 2 hectares. The average farm area so calculated is thus 7.2 hectares.
The labor remuneration per day in private farming was assumed to be equal to the total consumption fund in farmer families per person, per day.
- 79 -
The presented calculation of costs and profitability in grains
production is however for the major part of the population of
small scale commercial farms of little relevance. The point of
the matter is that grains production in the average farm / with
an area of over 2 hectares / requires only 57 labor days / 3.24
hectares of grains x 17.8 days /, that is approximately 13 % of the
labor inputs total for the farm. Thus for further utilization
there remains the balance of labor inputs, i.e. 87 %, to be
employed in the more labor intensive branches of crop production
and as well in animal breeding. In conditions of favorable for
grains production years and for their profitability, such as was
1981, the average farm would obtain from grains production,
assuming that the whole crop would be sold at socialized
procurement prices, a revenue of about 37 thousand zloty. At the
same time the total revenue of the farm was about 256 thousand
z1oty. Thus the income from the whole farm calculated per one day
of labor was a little less than 600 zloty, this being less than
in grains production. However if the farmers were to realize
directly the revenue from grains production / through their sale /,
then they would have not only to limit breeding but would also
deteriorate the effectiveness of animal production /a drop in
feeding effectiveness /. In the final effect having achieved
a relatively high revenue for the 13 % of the labor inputs
engaged in the grains production, they would not obtain the
assumed labor remuneration for the remaining part of the labor
inputs, if they couldbe realized at ali. Thus one concludes that
for the small scale commercial farm more important is the revenue"
from the whole farm calculated per unit of area and not the
revenue per one day of labor in this or other branch. The discussed
relative profitability of grains neither has a significant
importance for the farmers decisions concerning grains sales.
For instance in 1977 when the profitability index was below 100,
the sales of grains actually increased. In turn, in 1981 despite
a factual improvement of grains profitability, principally as
effect of an increase of procurement prices as well as a growth of
- 80 -
yields, the sales of grains visibly dropped. This confirms our
thesis about the relativity of the calculation of grains produc-
tion profitability and the slight elasticity of grains production
as -7egards the changes of the economic conditions of their
production in the small scale commercial production farms.
Decisive here is the economic calculation of the whole techno-
logical chain: grains - animal production.
3. Production of grains in various area groups of private farms
Previously we have stated that as result of the dispersed agrarian
structure there has not evolved in Poland on a significant scale
a type of a grain producing farm, which while specializing in
grains production would achieve a satisfying revenue. Nevertheless,
in accordance with universal regularities one may observe a certain
link between the size of the farm and the grains production in it.
This link we will illustrate with statistics of farms performing
agricultural bookkeeping and pertaining to the year 1979/80.
This year we have chosen deliberately as it was still a rather
normal year, before the crisis.
Understandable and obvious is the dependency between the area
of the farm and the share of grains in the total crop area /see
table 3 /. The most significant characteristic of the crop
composition is the forcing out of more labor intensive crops,
such as potatoes and as well sugar beets, by the less labor
intensive crops, principally grains, as the area of the farm
increases. This is explained mainly by the labor resources
balance of the farm.
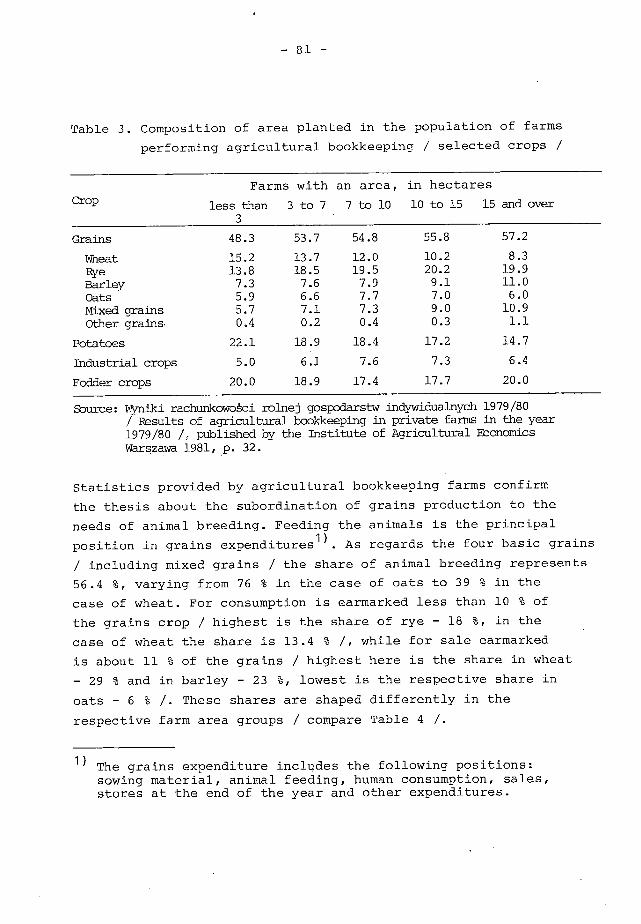
- 81 -
Table 3. Composition of area planted in the population of farms
performing agricultural bookkeeping / selected crops /
Farms with an area,
less than 3 to 7 7 to 10 3
in hectares
10 to 15 15 and over Crop
Grains 48.3 53.7 54.8 55.8 57.2
Wheat 15.2 13.7 12.0 10.2 8.3 Rye 13.8 18.5 19.5 20.2 19.9 Parley 7.3 7.6 7.9 9.1 11.0 Oats 5.9 6.6 7.7 7.0 6.0 Mixed grains 5.7 7.1 7.3 9.0 10.9 Other grains. 0.4 0.2 0.4 0.3 1.1
Potatoes 22.1 18.9 18.4 17.2 14.7
Industrial crops 5.0 6.1 7.6 7.3 6.4
Fodder crops 20.0 18.9 17.4 17.7 20.0
Source: Diyniki rachunkowoci rolnej gospodarstw indywidualnych 1979/80 / Results of agricultural bookkeeping in private farms in the ypar 1979/80 /, pdblished by the Institute of Agricultural Ebonomics Warszawa 1981, p. 32.
Statistics provided by agricultural bookkeeping farms confirm
the thesis about the subordination of grains production to the
needs of animal breeding. Feeding the animals is the principal
position in grains expenditures1). As regards the four basic grains
/ including mixed grains / the share of animal breeding represents
56.4 %, varying from 76 % in the case of oats to 39 % in the
case of wheat. For consumption is earmarked less than 10 % of
the grains crop / highest is the share of rye - 18 %, in the
case of wheat the share is 13.4 % /, while for sale earmarked
is about 11 % of the grains / highest here is the share in wheat
- 29 % and in barley - 23 %, lowest is the respective share in
oats - 6 % /. These shares are shaped differently in the
respective farm area groups / compare Table 4 /.
1) The grains expenditure includes the following positions: sowing material, animal feeding, human consumption, sales, stores at the end of the year and other expenditures.

- 82 -
Table 4. The sharesof animal feeding, human consumption and
sales in the total expenditured of grainsi)
/ total expenditure = 100 /
Destination Parin area in hectares
up to 3 3 to 7 7 to 10 10 to 15 15 and over
Animal feeding 55.0 58.1 55.7 58.6 51.0
Human consumption 18.1 11.4 8.2 6.5 5.1
Sales 9.8 12.4 19.6 19.4 18.2
in this private 5.3 3.0 3.3 2.9 3.3
1) The 4 grains. together with mixed grains.
Source: 'niki rachunkowoåci rolnej..., op.cit., p. 68.
In the 1970's in the total 4 grains expenditure the share of
animal feeding increased by over 15 per cent points / from 40.1 %
in 1969/70 to 56.4 % in 1979/80 /, while the share of human
consumption dropped / from 13.2 to 9.7 % / and so did that of
sales / from 27.8 to 17.1 % respectively /. One remarks that the
share of sales manifested considerable variations from year to
year, influenced by the crop situation, stock numbers in breeding
and the situation on the concentrate feeds market. These variations
pertained less to the sales on the private market, the share of
which oscillated around 3.5 %. The share of sales to this market
in a significant degree was linked to the development of market
prices of grains.
An analysis of statistics of agricultural bookkeeping farms
permits to state that only farms - on the average - with an
agricultural area of about 20 hectares may orient themselved on
commercial grains production, achieving at this both a revenue
higher than the average revenue of farm per day of labor and
a higher consumption fund per person, with lower costs of
production of a unit of final production / see Table 5 /.
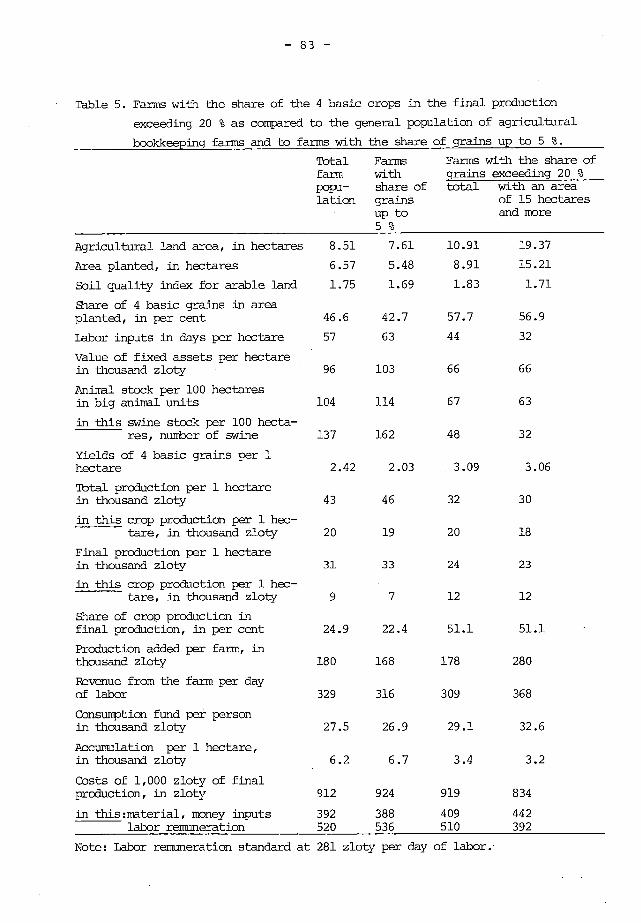
- 83 -
Table 5. Farms with the share of the 4 basic crops in the final production
exceeding 20 % as compared to the general population of agricultural
bookkeeping farms and to farms with the share of grains up to 5 %.
Tbtal farm popu- lation
Faure with Share of grains up to 5%
Farms with the share of grains exceeding 20 % total with an area
of 15 hectres and more
Agricultural land area, in hectares 8.51 7.61 10.91 19.37
Area planted, in hectares 6.57 5.48 8.91 15.21
Soil quality index for aråble land 1.75 1.69 1.83 1.71
Share of 4 basic grains in area planted, in per cent 46.6 42.7 57.7 56.9
Labor inputs in days per hectare 57 63 44 32
Valua of fixed assets per hecfare in thousand zloty 96 103 66 66
Animal stock per 100 hectares in big animal units
in this swine stock per 100 hecta-
104
137
114
162
67
48
63
32 res, nuMber of swine
Yields of 4 basic grains per 1 hectare
Tota1 production per 1 hectre in thousand zloty
in this crop production per 1 hec-tare, in thousand zloty
Final production per 1 hectare in thousand zloty
in this crop production p,...r 1 hec-tare, in thousand zloty
Share of crop production in final production, in per cent
Production added per farm, in thousand zloty
Revenue from the farm per day of låbor
Consumption fund per person in thousand zloty
Accumulation per 1 hectare, in thousand zloty
Costs of 1,000 zloty of final production, in zloty
in this:måterial, money inputs labor remuneration
2.42 2.03 . 3.09 3.06
43 46 32 30
20 19 20 18
31 33 24 23
9 7 12 12
24.9 22.4 51.1 51.1
180 168 178 280
329 316 309 368
27.5 26.9 29.1 32.6
6.2 6.7 3.4 3.2
912 924 919 834
392 388 409 442 520 536 510 392
Nöte: Labor remuneration standard at 281 zloty per day of labor.'
The farms in the lower area groups in which the share of grains
in the final production exceeded 20 %, achieved poorer economic
results than the averages for ali farms performing agricultural
bookkeeping. For instance the revenue per 1 day of labor in a farm
in the whole population of farms doing bookkeeping was averagely
329 zloty, in farms with an area of less than 3 hectares and
a share of grains in the final production over 20 % - 139 zloty,
in the 3 to 7 hectare group and an analogical grains share
203 zloty, 7 to 10 hectares - 302 zloty and in the 10 to 15
hectares group - 309 zloty. The cost of production of 1 000
zloty worth of final production was on the average 912 zloty.
In farms in which the share of grains in the final production
exceeded 20 % these costs were respectively: farm area up to
3 hectares - 1 503 zloty, 3 to 7 hectares - 1 218 zloty,
7 to 10 hectares - 939 zloty , 10 to 15 hectares - 930 zloty.
Thus it appears that the potential farms which could orient
themselves at commercial grains production should be searched
for in the group of farms with an area of at least 15 hectares
of arable land and about 20 hectares of total agricultural area.
Agricultural policy should thus support the creation of such
farms, especially on soil of better quality. An increase of the
number of such farms, and what would ensue a development of
the grains market and that of concentrate feedstuffs will favor
relative lowering of the market prices of grains and feedstuffs
- as effect of the relatively low costs of their production.
This in turn will exert a stimulating effect on increasing the
gross commercial expenditure / i.e. without subtracting purchased
concentrated feedstuffs / in grains production crop in farms with
a smaller area. This will as well favor processes of simplification,
specialization and concentration of agricultural production, in
this also of grains and thus result in lowering the per unit
costs, and as a consequence - increase farmers' revenues through
a growth of labor productivity and lower costs of production, not
only through increasing the prices of agricultural products.
April 1983, Warszawa
- 85 -
Leszek WiAniewski
INSTITUTE OF AGRICULTURAL
AND FOOD ECONOMICS
WARSZAWA, POLAND
THE ECONOMICS OF GRAINS PRODUCTION IN BIG COMMERCIAL FARMS
The agrarian structure of Polish agriculture in general does
not create conditions favoring grains production. Grains are
a product characteristic for large area farms: they require
a large scale of production, which makes profitable using spe-
cialized machinery and means a considerable decrease of the
labor inputs.
In this context the socialized sector of Polish agriculture,
being organized into large area farms, more highly mechanized
compared to the private sector, theoretically has better condi-
tions for going into production of grain crops. Despite this,
in the whole period since 1945 the share of the socialized
sector in the total grains production was lower than that of
private farms / see Table 1 /.
The state of things was the result of numerous factors.
The state farms in Poland upon their creation were burdened
with three principal tasks:
Firstly, they were to conduct activities linked with the creation
of biological progress in agriculture for ali of agriculture:
Secondly, since the area of the state sector was quite large
/ in the beginning it was 1.5 million ha / and the prospects were
for further increase in the future, this sector was to conduct
production activities, resulting in supply for consumption of
the major products, principally those of which the greatest
deficit was experienced;
- 86 -
Thirdly, the developing, modern state farming enterprises were
to become a model, a standard for the proper organization of
work and life style for the countryside composed of dispersed
and backward farms in the private sector.
The post war difficulties of the economy's development were
the reason for burdening the socialized sector in agriculture
with tasks of an intervention nature. This concerned principally
the production of such products which were little profitable for
private farms, principally animal products.
The performanceby the socialized farms of the multiple intervention
functions was in the past the fundamental reason for the appearing
difference between the potential production possibilities of
these enterprises and the effects achieved. This resulted,as
a consequence,in phenomenally of loweconomic productivity.
An analysis of the development of the socialized sector in the
post war period permits to state, that - despite the encountered
considerable difficulties - the function of extension of technical
and biological progress was executed in a satisfactory manner.
The animal breeding enterprises and seed material breeding and
reproduction enterprises are the principal producers of high
quality reproduction material in animal breeding and the seed
industry. For instance, the state farms produce about 90 % of the
total supply of elite and original seed material in grains. The
growth of this production is impressive; in 1955 the state farms
produced 55.3 thousand tons of qualified seed grains, in 1965
87.8 thousand tons and in 1975 the respective figure was 527.9
thousand tons.
One should assess positively as well the operations of the
socialized farms as an important producer of consumption products.
Their role in this field increased ali the more when the phenomena
of disequilibrium between food demand and the production of
- 87 -
agriculture was magnified. The intervention function of the state
farming enterprises then became ali the more explicit; concerned
first of ali with the task of increasing animal production,
principally beef and pork. Frequently these tasks quite exceeded
the enterprises proper potential, which caused technological
disproportions between the respective sectors of production
within the enterprise and thus constituted the fundamental cause
of the deficits experienced by the economics of a large share
of state farms.
Thus the potential capad.ties of the socialized sector in the field
of grains production for various reasons could not be fully
employed. Instead of being the principal supplier of grains and
fodder to the private sector of agriculture, the socialized
sector became a net buyer of these products from the state.
I. Production and use of grains in state farms
The socialized sector in Polish agriculture in 1982 used 24.2 %
of the total agricultural area, produced 20.7 % of the final
gross product, 23.7 % of the total market production and 10.1 %
of the production added total in agriculture.
The dominating position of the state farms in the socialized
sector of agriculture / 78.5 % of the agricultural area, 81.6 %
of the final product, 82.3 % of the market production and 80.4 %
of the production added / as well as the fact that the best and
most complete statistics are available for this group of farms
permits us to recognize it as the representative of the socialized
sector in Polish agriculturel). For this reason in our further
considerations on grains production economics we will he
speaking of the phenomena and relations in the state farms.
1)Beside the state farms, the socialized sector of Polish agricul-ture includes agricultural production cooperatives / using 3.9 % of the total agricultural area / and farms run by the agricul-tural circles cooperative organizations / the latter's major work is providing mechanization services to private farmers /.
- 88 -
An analysis of long term changes in the share of grains in the
total area planted in Polish farming, permits to state that
until 1980 this share was dropping. There were numerous reasons
for this; they have been discussed extensively by A. Wog in the
paper presented also at this seminar. Statistics presented in
Table 1 point to the fact that the general drop in the share
of grains in the total area planted was principally the effect
of the decreasing share in the state farms. In the private farms
since 1965 have been observed no important changes in this respect.
As we have stressed it in the introduction, the principal reason
forcing the state farms to limit their grains production was
their duty to perform an intervention role in the state's
agricultural policy. Other reasons however are not without
importance. Among the most important belong certainly the
changes in the production composition and production techniques.
These problems have been however extensively discussed during
our previous sessions1). One should remember here that one of
the most important changes in the production technologies was
a growth of the grain intensity of animal production. The imposed
tasks of increasing animal production - in many cases quite
exceeds the state farms' proper feedstuffs resources - which
the government administered on the state farms, resulted in a
growing demand for feedstuffs. Thus the increasing grain
requirement of the animal production technologies resulted in
aggravation of the grains and concentrate feedstuffs deficit.
At the same time the demand for roughage feedstuffs did increase
as well.
The lacking grains and feedstuffs concentrates could however
be easily supplemented by the farms through purchases from govern-
ment supplies. On the other hand, the increasing demand for
roughage had to be covered solely through an increase of their
production on the farms themselves; this latter production growth
1)See the Polish papers presented at the Finnish-Hungarian- Polish Seminars on Agricultural Economics: WaXbrzych, April 1978, Helsinki, June 1979 and Csopak, September 1980.
- 89 -
could have been achieved only partially through an increase of the
yields, while in part it was necessary to increase the area plan-
ted to the fodder crops on previously arable land. This took
place for the major part at the expense of the grains area. One
should also stress at this point that the decisions on such a way
of increasing animal production in the state farms were as well
encouraged by economic considerations. The availability of concen-
trate feedstuffs on the market / greater, by the way, for the
state farms, than for the private sector / and their low price,
made for the state farms the decisions to limit grains production
rather easy. In a much smaller degree these factors were decisive
in decisions of limiting the share of grains in the total area
planted in the private farms.
The negative effects of the rather rapid decrease of the area
planted to grains in the state farms were partly neutralized by
a growth of the yields. For example, the yields of the four
principal grains in Polish agriculture / i.e. rye, wheat, barley
and oats / increased in the period 1950-1982 in the state farms
at an annual rate of 4.6 %, while the respective figure for the
private farms was 3.4 %.
The share of the more intensive grains varieties such as wheat
and barley was also greater in the state farms. As effect of
increasing fertilizer use the yields of wheat and barley in the
state farms increased in the period 1950-1982 at an annual rate
of 5.6 %, while the respective figure for the private farms was
4.2 %. A much lower rate of yields improvement was achieved in rye
and oats, since in the state farms it was respectively 3.9 % and
in the private farms 3.1 %. Important changes took place in the
period discussed in the shares of the respective grains in the
total area planted; this was the result of higher procurement
prices for wheat and barley, compared to rye and oats, and on the
other hand the higher yields of the former were encouraging. In
the state farms the share of wheat and barley increased from 37 %
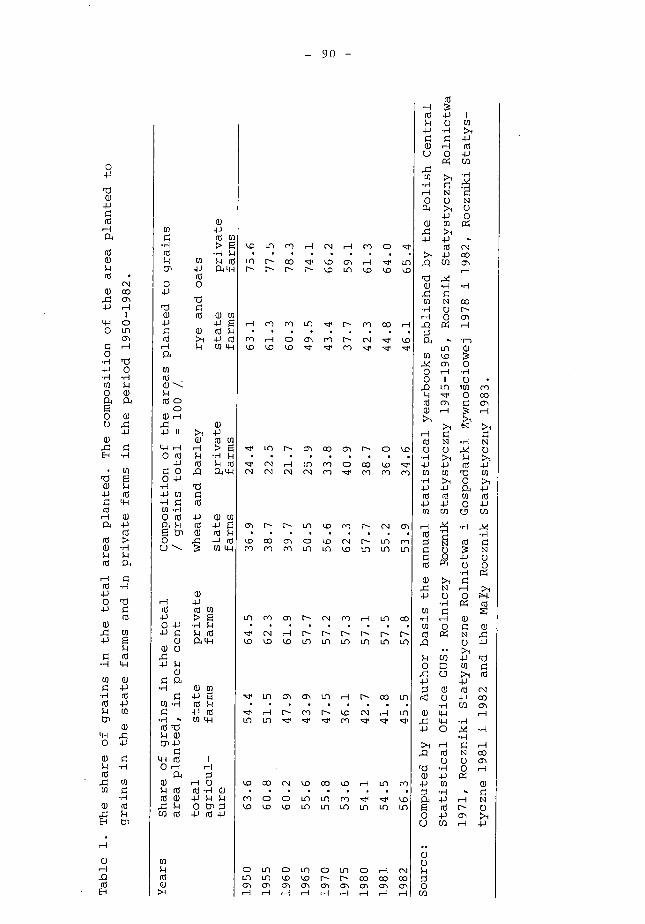
- 90 -
The composition of t he area planted to
Ln m N H CD • • • • • • • •
Ln r-- co 1.0 C51 •zr 10
N r- 1.0 Ln lD 1.13 LO
farms in the period 1950-1982.
H rn Ln r- co co • • • • • • •
(-0 H-1 c) cc rn ko kr) ko •,1"
ci Ln r-- cr) co • • . • • •
CN r-i Ln co
N N (V CO .1, M
r•-• i11 N 01
1.0 CO 01 0 10 r- Ln rn rn Ln Ln 10 Ln Ln Ln
grains in the total
M N 1-1 Ln co • • • • • • •
ID N r-- 1.0 1.0 Ln Ln Ln Ln 10 Ln
LoccccLnH Ncc cc • • • • • • • •
zt, M r's 1.13 N Ln Ln •7.
share of
1.0 CO N 1.0 CO 113 1-1 Ln rn • . • • • •
rn CD c> Ln Ln rn L.o ID >.c> 10 Ln Ln Ln Ln Ln
grains in the state farms and
CD Ln CD Ln c> Ln Ln Ln s 03 CO CO 01 C71 01 Cfl 01 01 831 01 01
rH 1-1
and oats
wheat and barley
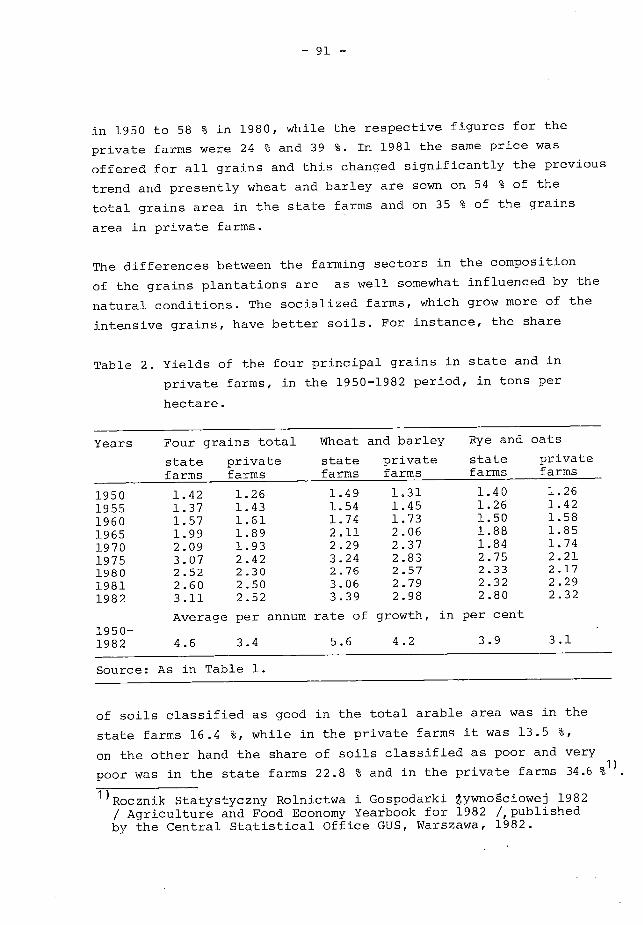
- 91 -
in 1950 to 58 % in 1980, while the respective figures for the
private farms were 24 % and 39 %. In 1981 the same price was
offered for ali grains and this changed significantly the previous
trend and presently wheat and barley are sown on 54 % of the
total grains area in the state farms and on 35 % of the grains
area in private farms.
The differences between the farming sectors in the composition
of the grains plantations are as well somewhat influenced by the
natural conditions. The socialized farms, which grow more of the
intensive grains, have better soils. For instance, the share
Table 2. Yields of the four principal grains in state and in
private farms, in the 1950-1982 period, in tons per
hectare.
Years Four grains total
state private farms farms
Wheat and barley
state private farms farms
Rye and oats
state private farms farms
1950 1.42 1.26 1.49 1.31 1.40 1.26 1955 1.37 1.43 1.54 1.45 1.26 1.42 1960 1.57 1.61 1.74 1.73 1.50 1.58 1965 1.99 1.89 2.11 2.06 1.88 1.85 1970 2.09 1.93 2.29 2.37 1.84 1.74 1975 3.07 2.42 3.24 2.83 2.75 2.21 1980 2.52 2.30 2.76 2.57 2.33 2.17 1981 2.60 2.50 3.06 2.79 2.32 2.29 1982 3.11 2.52 3.39 2.98 2.80 2.32
Average per annum rate of growth, in per cent 1950- 1982 4.6 3.4 5.6 4.2 3.9 3.1
Source: As in Table 1.
of soils classified as good in the total arable area was in the
state farms 16.4 %, while in the private farms it was 13.5 %,
on the other hand the share of soils classified as poor and very 01)
poor was in the state farms 22.8 % and in the private farms 34.6 -6 .
1)Rocznik Statystyczny Rolnictwa i Gospodarki ywno'åciowej 1982 / Agriculture and Food Economy Yearbook for 1982 /,published by the Central Statistical Office GUS, Warszawa, 1982.
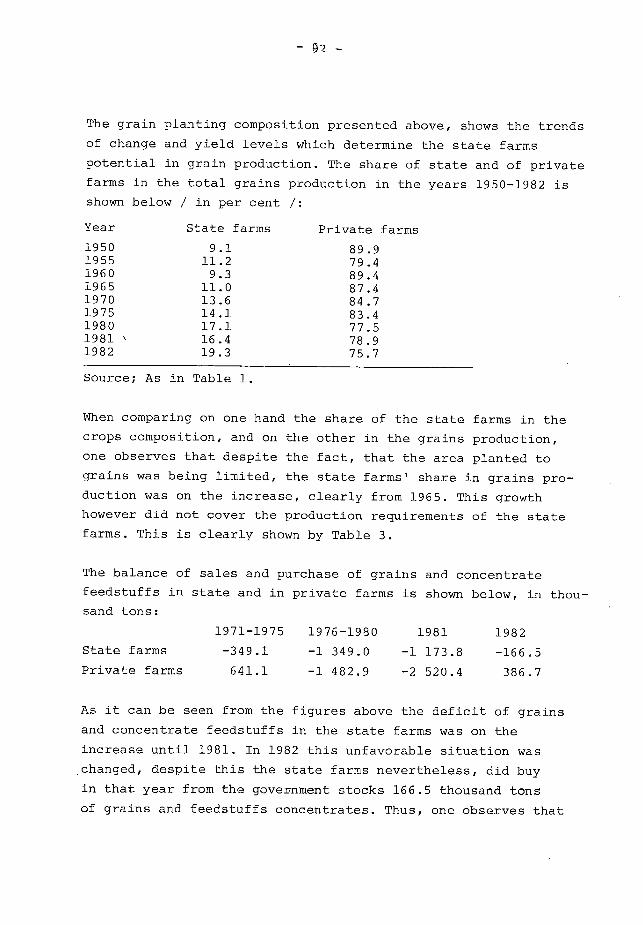
The grain planting composition presented above, shows the trends
of change and yield levels which determine the state farms
potential in grain production. The share of state and of private
farms in the total grains production in the years 1950-1982 is
shown below / in per cent /:
Year State farms Private farms
1950 9.1 89.9 1955 11.2 79.4 1960 9.3 89.4 1965 11.0 87.4 1970 13.6 84.7 1975 14.1 83.4 1980 17.1 77.5 1981 \ 16.4 78.9 1982 19.3 75.7
Source; As in Table 1.
When comparing on one hand the share of the state farms in the
crops composition, and on the other in the grains production,
one observes that despite the fact, that the area planted to
grains was being limited, the state farms' share in grains pro-
duction was on the increase, clearly from 1965. This growth
however did not cover the production requirements of the state
farms. This is clearly shown by Table 3.
The balance of sales and purchase of grains and concentrate
feedstuffs in state and in private farms is shown below, in thou-
sand tons:
1971-1975 1976-1980 1981 1982
State farms -349.1 -1 349.0 -1 173.8 -166.5 Private farms 641.1 -1 482.9 -2 520.4 386.7
As it can be seen from the figures above the deficit of grains
and concentrate feedstuffs in the •state farms was on the
increase until 1981. In 1982 this unfavorable situation was
changed, despite this the state farms nevertheless, did buy
in that year from the government stocks 166.5 thousand tons
of grains and feedstuffs concentrates. Thus, one observes that
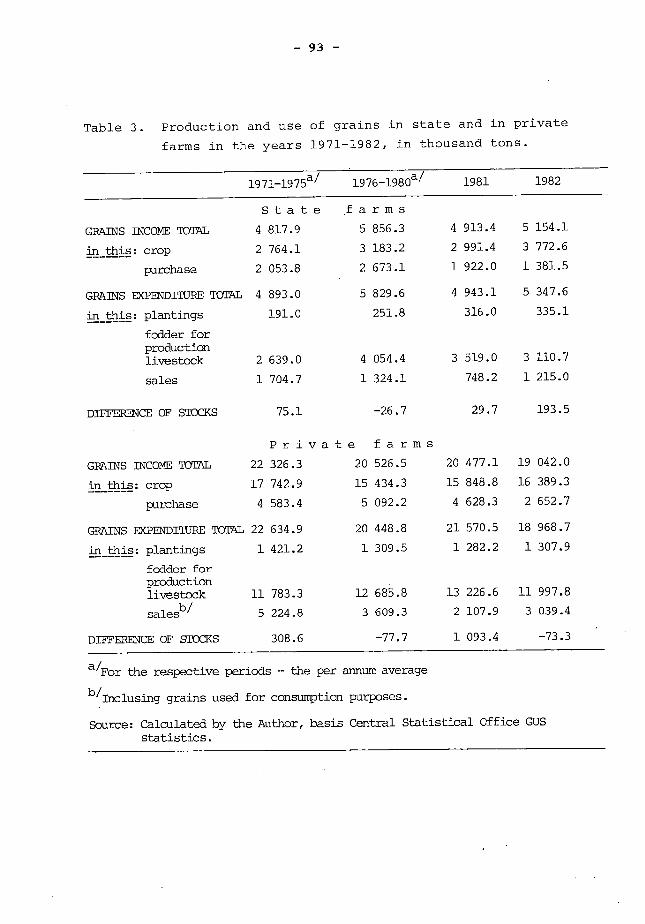
- 93 -
Table 3. Production and use of grains in state and in private farms in the years 1971-1982, in thousand tons.
1971-1975a/ 1976-1980a/ 1981 1982
State .farms
GRAINS 1NICOME TOTAL 4 817.9 5 856.3 4 913.4 5 154.1
in this: crop 2 764.1 3 183.2 2 991.4 3 772.6
purchase 2 053.8 2 673.1 1 922.0 1 381.5
GRAINS EXPENDITURE TOTAL 4 893.0 5 829.6 4 943.1 5 347.6
in this: plantings fodder for production livestock 2
191.0
639.0 4
251.8
054.4 3
316.0
519.0 3
335.1
110.7
sales 1 704.7 1 324.1 748.2 1 215.0
DIFFERKNCE OF STDCKS 75.1 -26.7 29.7 193.5
Private farms
GRAINS INCOME TOTAL 22 326.3 20 526.5 20 477.1 19 042.0
in this: crop 17 742.9 15 434.3 15 848.8 16 389.3
purchase 4 583.4 5 092.2 4 628.3 2 652.7
GRAINS EXPENDITURE TOTAL 22 634.9 20 448.8 21 570.5 18 968.7
in this: plantings fodder for production livestock
1
11
421.2
783.3
1
12
309.5
685.8
1
13
282.2
226.6
1
11
307.9
997.8
salesb/ 5 224.8 3 609.3 2 107.9 3 039.4
DiII.EPENCE OF STOCKS 308.6 -77.7 1 093.4 -73.3
a/For the respective periods - the per annum average
b/Inclusing grains used for consumption purposes.
Source: Calculated by the Author, basis Central Statistical Office GUS statistics.

- 94 -
the use of grainsandfeedstuffs in this sector was by approximately
10 % higher than the grains production, with relatively high
yields of grains of 3.11 tons per hectare. The apparent deficit
of grains cannot be fully explained by the size of the animal
production conducted. The fundamental reason for this state of
things can be observed in Polish farming during the past decade by the
growing share of grains in the animal diet, which is not always
reasonably high.
The grain intensity of animal production in state and in private
farms is shown by the figures below in which we have converted
the slaughter animals produced, milk, wool and eggs into
conventional meat units1)
The use of grains and concentrate feedstuffs, in kilograms to
produce one kilogram of meat in the respective periods,
in the groups of farms discussed, is as follows:
Years
1971-75 1976-80 1981 1982
State farms Private farms
3.30
2.50
3.77
2.75
3.71
3.17
3.54
2.93
Calculated by the Author basis Central Statistical Office GUS data.
The appearing big differences in the grain requirements in animal
production do not fully represent the feed conversion ratios.
This is because, while in the state farms, the dominating fodders
are grains and concentrate mixes, and the feeding of animals
in the private farms is still based largely on potatoes. In both
sectors,however,one observes a similar trend in feeding grains;
a growth of the quantity of grains required until 1981 and then
a marked drop since 1982. This drop was caused by a significant
limitation of the grains and feedstuffs imported. As a consequence,
1) The following calculation coefficients have been assumed: 1 kilogram of slaughter animals = 0.55 kilogram of meat; 1 liter of milk = 0.15 kilogram of meat; 1 kilogram of wool = 3.6 kilograms of meat; 1 kilogram of eggs = 1 kilogram of meat.
- 95 -
the sales of concentrate feedstuffs from government stocks
in 1982 was almost by one half lower than that of 1981. An
effect of these constraints is a clear drop in animal production
in state farms. It is estimated that approximately 10 % of the
stands in the breeding lots in the state farms was not used
in 1982 because of a shortage of feedstuffs.
II. The costs and profitability of grains production in state
farms
When speaking of the profitability of grains production G. Blohm
stated1):
"Grains production is today the most profitable extensive
crop, due to the great difference between revenues and
inputs and due to the unusually small variations of
prices and the yields achieved".
The analysis of costs and profitability of grains production in
Poland as a rule confirms this view. Also in Poland conditions
of yields variates, as compared to an average year trend of
- 6 to 8 %, while the yields of root crops vary even 15 to 20 %.
The profitability index for grains production is also higher than
that for the other extensive crops.
To give an idea of the dynaalcs of production costs and profit-
ability in the state farms, we have presented in Table 4 the
basic elements of costs of grains cultivation in the years
1960-1980. An analysis of this material permits to determine
some significant regularities.
1)G. Blom: Ekonomika i organizacja gospodarstw rolniczych
/ Economics and organization of farms; Polish translation
published by PWRiL, Warszawa, 1961.

- 96 -
In the whole post war period / i.e. since 1945 / the profitability
of wheat and barley production in Poland was much higher than
that of rye and oats. This was first of ali due to the higher
nutritional value of wheat and barley as compared to the
remaining grains, and on the other hand, this depended on the
higher soil and fertilizer requirements of the former two grains.
As we have stressed it before, in Polish agricultural land
dominate light soils / post-glacial formation /. They do not
constitute the most favorable conditions for the cultivation
of wheat. Thus, despite the price preference incentive, the
dominating grain crop grown in Poland remains still rye. This
grain, while more extensive when compared to wheat and barley,
is nevertheless in the soil and climate conditions of Polish
agriculture less failure-prone and may be grown on poor soils
as well. Not without importance is the fact, that with rye the
producer obtains more straw, which is necessary in the traditio-
nal style animal breeding in peasant farms.
The observation of the past 20 years period permits nevertheless
to notice some important changes in the grains plantations
composition. This concerns primarily state farms, as can be seen
in Table 1. The introduction of the more intensive grain varieties,
the rather rapibly increasing fertilizer use as well as a
dropping demand for straw, once modern technologies of animal
breeding are introduced / including industrial feedlots / -
ali these may be enumerated as the reasons for the increasing
share of wheat and barley in grains production composition.
The technology of grains production was also subject to rapid
changes. More rapidly than in other branches of crop production
the labor inputs decreased, substituted by increasing inputs
of tractors and machines. In the second half of the 1960's rapid
mechanization was started of the harvest of grains. Since about
10 years this harvest is executed in state farms practically
only by combine grain harvesters.

- 97-
As can be seen from Table 4 the composition of the inputs was
subject to important changes. For instance, the share of labor
in the total inputs dropped from about 16 % in 1960/61 to 7 %
in 1980/81, while the share of machine costs increased insignifi-
cantly. This is proof of the high effectiveness of the mechani-
zation introduced in grains cultivation. According to J. BaXa1)
in grain production in the period 1961-1972 on the average in
the state farms sector one hour of work of a tractor, with combine
harvester work converted into tractor work hours as well,
substituted 6.7 manhours of work and 3.2 hours of horse work;
the respective rations for potatoes were 1 tractor hour / other
machine work converted as well into tractor work hours / substi-
tuted for 3.5 manhours of work and 2.3 hours of horse work;
in sugar beet cultivation these figures were 3.6 and 2.0
respectively.
Table 5 presents information on the inputs of labor and machines
in state farms in recent years.
Among the most important changes in grains cultivation in the
1960-1980 period one should point to the progress in fertilizer
use. In this period one may distinguish two subperiods may be
determined:
until 1965 areas planted to grains received more fertilizer
than the average use. In 1960 for example per one hectare of
wheat in the state farms 135 kilograms of NPK were used,
respectively for rye 103 kilograms, while the average figure
per hectare of agricultural land was 87 kilograms.
in the consequent period, that is after 1965 this relation was
changed. The rate of growth of fertilizer use per 1 hectare
of agricultural land was higher than the respective growth
of fertilizer used for grains. For instance in 1980 the use
1)J. BaXa: Efektywnoå-å mechanizacji w paristwowych gospodarstwach rolnych / Mechanization effectiveness in state farms /, published by PWN, Warszawa, 1977.
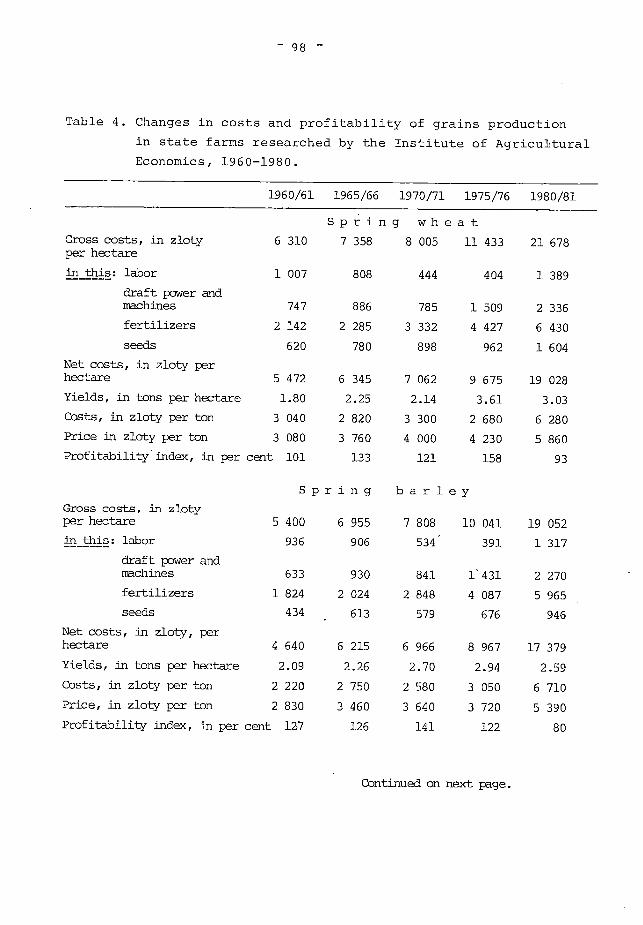
- 98 -
Table 4. Changes in costs and profitability of grains production
in state farms researched by the Institute of Agricultural
Economics, 1960-1980.
1960/61 1965/66 1970/71 1975/76 1980/81
Spring wheat
Gross costs, in zloty 6 310 per hectare
in this: låbor 1 007
draft power and machines 747
7 358
808
886
8 005
444
785
11 433
404
1 509
21 678
1 389
2 336
fertilizers 2 142 2 285 3 332 4 427 6 430
seeds 620 780 898 962 1 604
Net costs, in zloty per hectare 5 472 6 345 7 062 9 675 19 028
Yields, in tons per hectare 1.80 2.25 2.14 3.61 3.03
Costs, in zloty per ton 3 040 2 820 3 300 2 680 6 280 Price in zloty per ton 3 080 3 760 4 000 4 230 5 860
Profitability'index, in per cent 101 133 121 158 93
Spring barley
Gross costs, in zloty per hectare 5 400 6 955 7 808 10 041 19 052 in this: låbor 936
draft power and machines 633
906
930
534
841
391
1431
1 317
2 270 fertilizers 1 824 2 024 2 848 4 087 5 965 seeds 434 . 613 579 676 946
Net costs, in zloty, per hectare 4 640 6 215 6 966 8 967 17 379
Yields, in tons per hectare 2.09 2.26 2.70 2.94 2.59
Costs, in zloty per ton 2 220 2 750 2 580 3 050 6 710
Price, in zloty per ton 2 830 3 460 3 640 3 720 5 390
Profitability index, in per cent 127 126 141 122 80
Continued on next page.

- 99 -
1960/61 1965/66
Tåble 4 - continued.
1970/71 1975/76 1980/81
Gross costs, in zloty R e
y
per hectare 5 623 6 967 7 236 10 432 20 391
in this: labor draft power and machines
946
697
898
900
497
809
449
1 530
1 424
2 483 fertilizers 1 946 2 049 3 135 4 232 6 206 seeds 416 595 594 589 1 003
Net costs, in zloty per hectare 4 665 5 924 6 290 8 745 17 836 Yields, in tons per hectare 1.84 2.17 1.85 2.83 2.44 Costs, in zloty per ton 2 530 2 730 3 400 3 090 7 310 Price, zloty per ton 2 200 2 800 3 180 3 370 4 630 Profitåbility index, in per cent 87 103 94 109 63
Oats
Gross costs, in zloty per hectare 5 486 6 980 7 650 10 144 19 670 in this: labor 959 911 595 417 1 389
draft power and machines fertilizers
648
1 858 2
910
075
866
2 962
1 458
4 139
2 340
6 059 seeds 435 595 615 578 981
Net cozts, in zloty per hectare 4 748 6 210 6 798 9 128 18 012 Yie1ds in tons per hectare 1.97 2.25 2.32 2.49 2.37 Costs, in zloty per ton 2 410 2 760 2 960 3 670 7 600 Price, in zloty per ton 2 050 2 620 3 050 3 060 4 700 Profitability index, in per cent 85 95 103 83 62
SOURCE: Institute of Agricultural Economics statistics.
Table 5. Inputs of labor and draft power in production of the
basic four grains in state farms researched by the
Institute of Agricultural Economics in the years
1975/76 and 1980/81.
Input of work hours per one hectare
1975/76 1980/81
Workers 34.3 31.0 Traktors 19.5 19.6 Combines 1.7 1.9
SOURCE: Research by the Institute of Agricultural Economics. In 1975/76 an area of 9 250 hectares of grains was researched, in 1980/81 13 266 hectares.
-100 -
of NPK per 1 hectare of wheat was 302 kilograms, for rye 262
kilograms, while the average use of fertilizer per 1 hectare
of agricultural land was 294 kilograms. This slower rate of
growth in fertilizer use for grains in the second suh-period
was explained by reaching a level of fertilizer use saturation
and by the need to increase fertilizer use for other crops
than grains, principally the fodder crops, where the marginal
productivity of fertilizer use was higher than that in grains
production.
Definitely a fault in the fertilizer management in state farms,
one should recognize is, not the level of fertilizer use, but
the composition of the fertilizers applied. The level is high
enough but the share of nitrogen fertilizers is too low. For this
reason it is foreseen that in the coming years the general level
of fertilizer use per 1 hectare planted to grains will be main-
tained, but the application of nitrogen fertilizers will he
increased.
The statistics in Table 4 show that in 1980/81 the profitability
of grains production dropped rapidly. The most important reason
for this without doubt was the low level of yields in that year /
lower than that in the previous years / and at the same time
a significant growth of the labor costs. The effect of these
growing outlays was a deterioration of the relative profitability
of grains as compared to the other.crops. For comparison one may
add that in 1980/81 the profitability index for the production
of one grain unit was 109 % for crop production in general, while
for the most profitable grain, that is wheat this figure was only
93 %, for rye respectively 63 %. Such low profitability of grains
production did not appear once in the past 20 years. Thus, asidefrom
the reasons considered earlier, it was the low, insufficient pro-
fitability of this line of production which was one of the reasons
for the limiting of this crop in state farms.

The important change of prices which was started in 1981 and
continued in 1982, resulted in a significant improvement of
the profitability of grains production. The present prices, iden-
tical for ali grains, have been increased on the average 2.5 times
for wheat and over threefold for rye and oats. Thus, the identical
prices for ali grains changed the internal relations of their pro-
fitability. The attraction of growing wheat and barley deteriora-
ted relatively compared to rye and oats, as the former require
better soils and more fertilizer. This resulted naturallv in a
change of the grains plantings composition. We have spoken about
this in the first part of the paper.
The general picture of grains production in the state farms
sector is influenced by the differentiated situation of the over
1 200 enterprises operating today. Having in mind the determination
of the particular differences between the state farms in the popu-
1ation researched by the Institute of Agricultural Economics,
we have selected those in which the share of grains in the total
area planted exceeded 50 % and on the other hand, those in which
this share was below 33.5 %. Table 6 shows the principal indexes
characterizing the two groups of state farms.
As one sees from the presented data, the share of grains in
the total area planted did not exert a significant influence on the
general level of profitability in the enterprises; in both groups
this figure was similar, as the value of the production exceeded
by over 10 % the total of outlays. There were however important
differences in the soils quality, the share of green fodder crops
in the total area, in the yields of grains and in the size of ani-
mal breeding. We have found great differences among the enterpri-
ses researched in the respect of the labor inputs / calculated
as the number of workers employed per 100 hectares of agricultural
area /. Despite the 23.5 per cent points difference in the grains
share in the total area planted, the production of grains per
1 hectare of agricultural area in both state farms groups is
quite close / slightly smaller is the production of grains per
hectare in the group of farms with the larger share of grains
in the total area planted /.
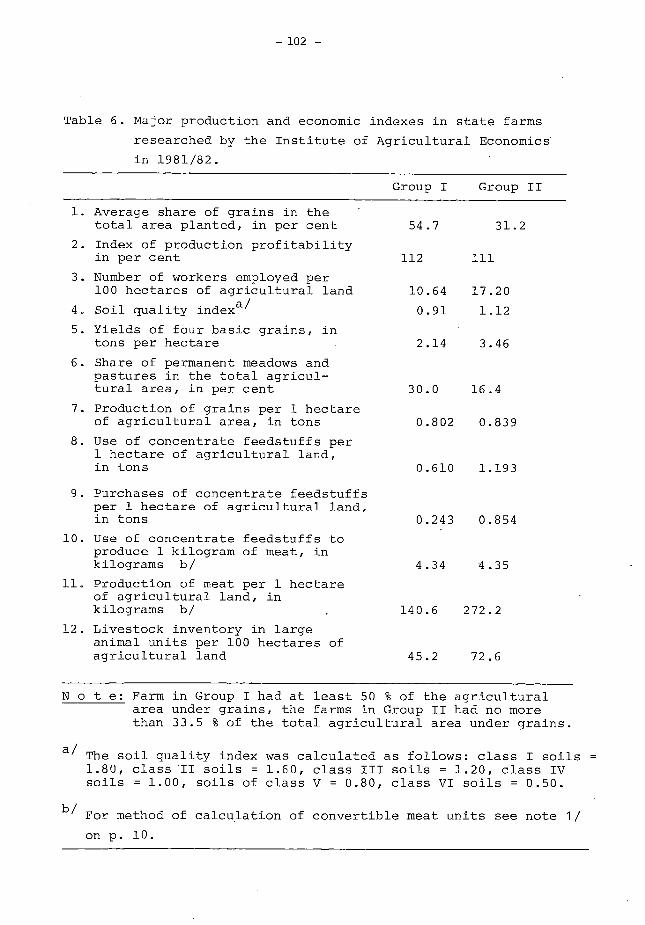
-102 -
Table 6. Major production and economic indexes in state farms
researched by the Institute of Agricultural Economics
in 1981/82.
Group I Group II
Average share of grains in the total area planted, in per cent
54.7 31.2
Index of production profitability in per cent 112 111
Number of workers employed per 100 hectares of agricultural land 10.64
17.20
Soil quality indexa/ 0.91
1.12
Yields of four basic grains, in tons per hectare 2.14
3.46
Share of permanent meadows and pastures in the total agricul- tural area, in per cent 30.0
16.4
Production of grains per 1 hectare of agricultural area, in tons 0.802
0.839
Use of concentrate feedstuffs per 1 hectare of agricultural land, in tons 0.610
1.193
Purchases of concentrate feedstuffs per 1 hectare of agricultural land, in tons
Use of concentrate feedstuffs to produce 1 kilogram of meat, in kilograms b/
Production of meat per 1 hectare of agricultural land, in kilograms b/
Livestock inventory in large animal units per 100 hectares of agricultural land
0.243 0.854
4.34 4.35
140.6 272.2
45.2 72.6
N o t e: Farm in Group I had at least 50 % of the agricultural area under grains, the farms in Group II had no more than 33.5 % of the total agricultural area under grains.
a/ The soil quality index was calculated as follows: class I soils -= 1.80, class II soils = 1.60, class III soils = 1.20, class IV soils = 1.00, soils of class V = 0.80, class VI soils = 0.50.
b/ For method of calcujation of convertible meat units see note 1/
on p. 10.

- 103 -
The discussed statistics describing the opposite groups of the
farms researched confirm the preciously presented opinion, that
the fundamental reason for the limiting of the area planted to
grains in the state farms, compared to the potential capacities,
was the past practice of the government agendas of the central
level of administering upon the state farms a high rate of animal
production growth.
The reform of the economic and financial system introduced in
1981 assumes complete independence on the part of the state
farms in the sphere of planning the production composition.
The economic effects of the introduction of the new system, at
present only a partial assessment is possible, are however clear
enough to point to the principal trends in the production composi-
tion. On one hand, 1982 saw a limiting of the animal production,
on the other anincrease of the share of grains in the crops compo-
sition, and as a consequense of this a decrease in the grains
and concentrate feedstuffs deficit of the sector discussed.
These appear to be the principal changes.
Research conducted by the Institute of Agricultural Economics
in 1982 concerning the production plans of state farms has
permitted to determine / in general terms / the foreseen future
trends1). The principal aim is to limit the size of animal pro-
duction to the available own feedstuffs stocks, this will take
place principally through giving up young cattle breeding and
further production growth in grains.
1)L. Wigniewski, Z. Kaprzyk: PGR w pierwszym etapie wprowadzania reformy gospodarczej / The state farms in the first stage of the introduction of economic reform /,published in Wieg Wsp6Y-czesna monthly, no. 9, 1982.

- 104 -
A general assessment of the economics of grains production in the
state farms permits to propose the following conclusions:
The production of grains in the socialized sector presently
and in the past does not cover the needs of this sector;
The size of grains production in the state farms is not in
conformity with the potential capacities in this respect;
The changes in economic conditions and administration intro-
duced in 1981, as we11 as the new system of management and
assessment of the state farms operations, permits prefering
the most profitable Iines of production, which in effect
brings about a significant increase of grains production;
In the national pian of economic deve1opment in agriculture
preferences are foreseen, in terms of production and incomes,
for the production of milk and grains. For both Iines of pro-
duction there is a considerable potential for growth in
the state farms, this is expecially true of grains. One may
thus foresee that in the coming years the share of grains
in the total area planted in the state farms will he increasing
at an annual rate of about 3 %. Thus the state farms will
become not only self-sufficient in grains production and
concentrate feedstuffs balance but will also be capable of
delivering these to the small private farmers, to,supplement
their own feedstuffs production.
May 1983, Warszawa.

- 105 -
Endre Szöllösi
MINISTRY OF AGRICULTURE AND FOOD
BUDAPEST, HUNGARY
INCOME SITUATION OF WHEAT AND MAIZE PRODUCTION
Production of cereals is one of the most important branches
of agriculture in Hungary, as their area is 2,7-2,8 million
hectares, 60-62 percent of arable land. Large farms / state
and cooperative farms / have a decisive role in cereal produc-
tion and they are almost the onlv producers of wheat, barley,
oats and rye. Because of the large area and higher than average
rentability, cereal production has a very important role in the
income earning of the large farms. The majority of wheat
produced / 85 percent / is directly sold to purchasing firms,
while one-third of maize produced is "sold" through the animals
of the producing farm.
Because of the good results, the strong demand of the animal
sector and the favourable export situation, expansion of
cereal production is continued. It was necessary in 1982 to
raise both cereal area and yields to raise production volume
by 13 percent, compared with the previous year.
Several changes took place in the financial regulations of
the enterprises in 1982. Of those concerning production costs,
the most important were raising energy prices by 10 and again
by 7 percent, on the average 15 percent higher transportation
charges, 3 percentage-point higher social insurance contribution
and the repeated raising of the credit rate. These measures
raised of course the cost of agricultural production, though part
of the mid-year energy price increase was refunded as a subsidy
from the state budget. No substantial changes took place in
the official prices of important production requisites / ferti-
lizers, insecticides, fungicides, herbicides, feedstuff and pro-
ducer prices of agricultural commodities.

- 106 -
Realization of grain production targets required improvement
of the material interest of the farms and the government took
some important measures in 1982 e.g.:
An additional grain production bonus was introduced for
those farms which raised production compared with the
1976-1980 average plus 10 percent;
Farms with below average soil quality /flunfavourable endowment
farms" / get higher price-subsidies for grains.
As aresult of the incentives and - especially for maize - very
favourable autumn weather, grain production reached record
volume in 1982. Total grain production was 14.7 million tons,
though combined wheat, barley, oats and rye production somewhat
lagged behind the plan.
Costs and income of grain production can be summarized on
the basis of wheat and maize production results of large farms
in 1981-1982 as follows:
Almost all large farms produce grain and the concentration
of production is comparatively high as average wheat area
per farm was over 900 hectares, maize 650 hectares in 1982.
Wheat production costs per hectare rose in 1982 6,6 percent,
maize by 7,2 percent. It is interesting to note, that though
material and energy prices rose considerably, these costs
were only 5-7 percent higher, than a year earlier because
of theresult of the favourable weather and good management
on the large farms, there were savings. In maize production
e.g. early varieties and spreading of the energy saving
wet-storage method had an important role in keeping
dehydration costs only 7 percent higher than in 1981,
though production rose by 14 percent.

- 107 -
Wheat yield per hectare rose 9,7 percent and reached 4.4
tons, maize 16.7 percent, 7.4 tons. Income from grain
production rose even more, main1y as a result of the con-
siderable grain production bonus. Thus wheat income per
hectare rose by 47 percent to 3861 Ft, maize 82 percent
to 6438 Ft.
Increase of both wheat and maize vield was higher than of
production costs and this resulted in lower net cost than
in 1981. Net cost of wheat declined 3 percent, maize 8 per-
cent. Thus farms achieved, partly as a result of the pro-
duction bonus and price subsidy, much higher income from
a unit of grain, than a year earlier.
SUMMARY
The results of wheat and maize production in 1982 considerably
improved as a result of good weather and new incentives. Average
yields were higher, especially maize yields were soaring. As a
result of cost saving net costs declined and income considerably
improved.
Budapest, June, 1983.

- 108 -
Cost and income of wheat and maize production on large-scale farms
Uhit 1981 1982 1982 index 1981=100
Wheat
Average yield
per hectare:
t/ha 4,01 4,40 109,7
- production cost1) Ft/ha 11 208 11 947 106,6 - price income 2) Ft/ha 11 653 13 323 114,3 - profit 3)
per 1 ton main product sold
Ft/ha 2 627 3 861 147,0
- net cost Ft/t 2 796 2 715 97,1 - price income 2) Ft/t 3 450 3 592 104,1 - profit 3)
profit per 100 Ft production cost 3)
Ft/t
Ft
654
23,44
877
32,30
134,1
138,0
Maize
Average yield
per hectare
t/ha 6,33 7,39 116,7
- production cost1) Ft/ha 17 365 18 621 107,2 - price income 2) Ft/ha 13 630 17 147 125,8 - profit 3)
per 1 ton maize product sold
Ft/ha - 3 533 6 438 182,2
- net cost Ft/t 2 722 2 511 , 92,2 - price income 2) Ft/t 3 281 3 393 103,4 - profit 3)
profit per 100 Ft production cost 3)
Ft/t
Ft ›
559
20,50
872
34,59
156,0
168,7
Note: 1) = totalcostsless value of by product
= including items raising profit of cereal production / price-subsidies, premium prices, bonus etc./
= production value less production cost
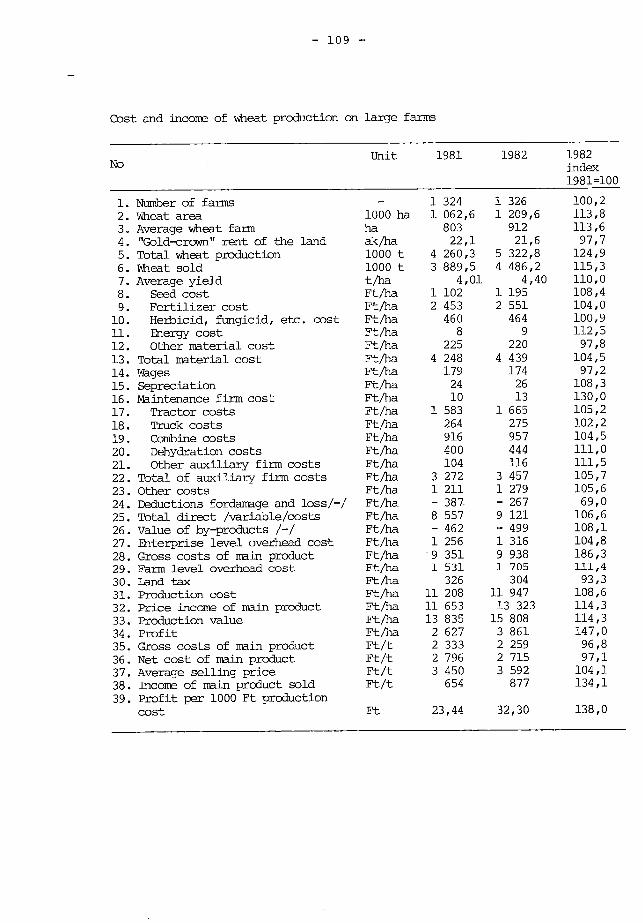
- 109 -
Cost and income of wheat production on large farms
No Unit 1981 1982 1982
index 1981=100
1. Number of farns - 1 324 1 326 100,2 2. Wheat area 1000 ha 1 062,6 1 209,6 113,8 3. Average wheat farm ha 803 912 113,6 4. "Gold-crown" rent of the land ak/ha 22,1 21,6 97,7 5. Total wheat production 1000 t 4 260,3 5 322,8 124,9 6. Wheat sold 1000 t 3 889,5 4 486,2 115,3 7. Average yield t/ha 4,01 4,40 110,0 8. Seed cost Ft/ha 1 102 1 195 108,4 9. Fertilizer cost Ft/ha 2 453 2 551 104,0 10. Herbicid, fungicid, etc. cost Ft/ha 460 464 100,9 11. Energy cost Ft/ha 8 9 112,5 12. Other material cost Ft/ha 225 220 97,8 13. Total material cost Ft/ha 4 248 4 439 104,5 14. Wages Ft/ha 179 174 97,2 15. Sepreciation Ft/ha 24 26 108,3 16. Maintenance firm cost Ft/ha 10 13 130,0 17. Tractor costs Ft/ha 1 583 1 665 105,2 18. Truck costs Ft/ha 264 275 102,2 19. Coffibine costs Ft/ha 916 957 104,5 20. Dehydration costs Ft/ha 400 444 111,0 21. Other auxiliary firm costs Ft/ha 104 116 111,5 22. Total of auxiliary firm costs Ft/ha 3 272 3 457 105,7 23. Other costs Ft/ha 1 211 1 279 105,6 24. Deductions fordamage and loss/-/ Ft/ha - 387 - 267 69,0 25. Total direct /våriable/costs Ft/ha 8 557 9 121 106,6 26. Vålue of by-products /-/ Ft/ha - 462 - 499 108,1 27. Enterprise level overhead cost Ft/ha 1 256 1 316 104,8 28. Gross costs of main product Ft/ha '9 351 9 938 186,3 29. Parin leve1 overhead cost Ft/ha 1 531 1 705 111,4 30. Land tax Ft/ha 326 304 93,3 31. Production cost Ft/ha 11 208 11 947 108,6 32. Price inccme of main product Ft/ha 11 653 13 323 114,3 33. Production value Ft/ha 13 835 15 808 114,3
Ft/ha 2 627 3 861 147,0 34. Profit 35. Gross costs of main product Ft/t 2 333 2 259 96,8 36. Net cost of main product Ft/t 2 796 2 715 97,1 37. Average selling price Ft/t 3 450 3 592 104,1 38. Inceme of main product sold Ft/t 654 877 134,1
Et 23,44 32,30 138,0 39. Profit per 1000 Ft production
cost
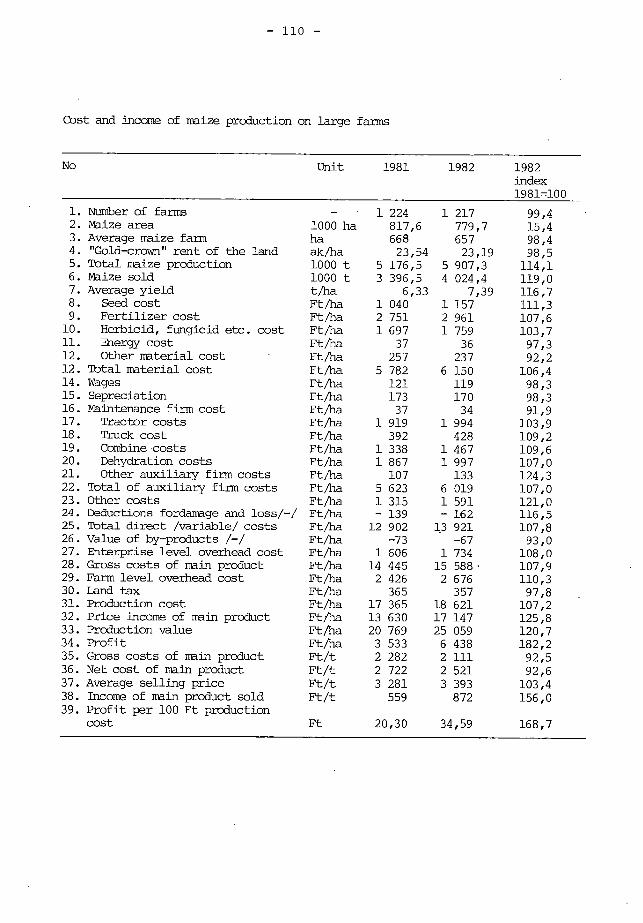
- 110 -
Cost and income of maize production on large farms
No Unit 1981 1982 1982 index 1981=100
1. NUmber of farms - - 1 224 1 217 99,4 2. Maize area 1000 ha 817,6 779,7 15,4 3. Average maize farm ha 668 657 98,4 4. "Gold-crown" rent of the land ak/ha 23,54 23,19 98,5 5. Total maize production 1000 t 5 176,5 5 907,3 114,1 6. Maize sold 1000 t 3 396,5 4 024,4 119,0 7. Average yield t/ha 6,33 7,39 116,7 8. Seed cost Ft/ha 1 040 1 157 111,3 9. Fertilizer cost Ft/ha 2 751 2 961 107,6 10. Herbicid, fungicid etc. cost Ft/ha 1 697 1 759 103,7 11. Energy cost Ft/ha 37 36 97,3 12. Other material cost Ft/ha 257 237 92,2 12. Total material cost Ft/ha 5 782 6 150 106,4 14. Wages Ft/ha 121 119 98,3 15. Sepreciation Ft/ha 173 170 98,3 16. Maintenance firm cost Ft/ha 37 34 91,9 17. Tractor costs Ft/ha 1 919 1 994 103,9 18. Truck cost Ft/ha 392 428 109,2 19. CoMbine costs Ft/ha 1 338 1 467 109,6 20. Dehydra.tion costs Ft/ha 1 867 1 997 107,0 21. Other auxiliary firm costs Ft/ha 107 133 124,3 22. Total of auxiliary firm costs Ft/ha 5 623 6 019 107,0 23. Other costs Ft/ha 1 315 1 591 121,0 24. Deductions fordamage and loss/ -/ Ft/ha - 139 - 162 116,5 25. Total direct /variable/ costs Ft/ha 12 902 13 921 107,8 26. Value of by -products 1-1 Ft/ha -73 -67 93,0 27. Enterprise level overhead cost Ft/ha 1 606 1 734 108,0 28. Gross costs of main pioduct Ft/ha 14 445 15 588 107,9 29. Farm level overhead cost Ft/ha 2 426 2 676 110,3 30. Land tax Ft/ha 365 357 97,8 31. Production cost Ft/ha 17 365 18 621 107,2 32. Price income of main product Ft/ha 13 630 17 147 125,8 33. Production value Ft/ha 20 769 25 059 120,7 34. Profit Ft/ha 3 533 6 438 182,2 35. Gross costs of main product Ft/t 2 282 2 111 92,5 36. Net cost of main product Ft/t 2 722 2 521 92,6 37. Average selling price Ft/t 3 281 3 393 103,4 38. Income of main product sold Ft/t 559 872 156,0 39. Profit per 100 Ft production
cost Ft 20,30 34,59 168,7
Bo±ena Gulbicka
INSTITUTE OF AGRICULTURAL AND
FOOD ECONOMICS
WARSZAWA, POLAND
THE GRAIN AND FEEDSTUFFS PROBLEM IN SMALL AREA PEASANT FARMS
The peasant farm economy in Poland is characterized by
a considerable dispersion on the agricultural land. Peasant farms
with a small area are a permanent feature of the agrarian structure
in Poland, since the changes of this structure, aiming in the
direction of increasing the farm area are taking place very
s1ow1y1). According to the National Census of 1978 the number
of small farms, i.e. with an area between 0.5 and 3 hectares,
in that year was 950 thousand, which represented 37 % of the total
population of farms in Poland with an area of 0,5 hectares and
more. The small farms occupy about 10 %, that is 1.5 million
hectares, of the total agricultural area used by private farms
in Poland.
In the specific situation in Poland's food economy the small
farms are expected to produce to supply for the farmer family's
own needs and for the market. A considerable number of these
farms fulfils these expections. As effect of the large number
of the small area farms in Poland, their production, especially
animal is an important position in the national food balance.
1)According to National Census statistics there were in 1950 997 thousand farms with an area between 0.5 and 3 hectares, which was 34 % of the total farm number, in 1960 the respective ficures were 1 257 thousand and 39 %, in 1970 - 1 142 thousand farms and 38 %.

- 112 -
The general economic crisis in Poland today and especially
the tight balance of payments forces a limitation of the grains
imports. Thus we will discuss more extensively the grains and
feeds problem in small farms1).
The small area of arable land does not favor the development
of grains production in the farm group discussed. Grains,
to be profitable, require a large scale of production, while in
the group of small farms with large resources of labour, the
revenue per person employed obtained from grain production
would be too small.
It is the small area of the farm and the considerable resources
of labor which point to other production orientations, more
labor intensive and more productive in character. In crop
production very profitable for small farms is the growing and
sale of industrial crops, such as tobacco, hop, sugar beet, fruits
and vegetables. However only a few of the farms in this group
appear to be engaged in these Iines of crop production.
1) The grains and feeds problem in small farms we will'discuss basis statistics obtained from agricultural bookkeeping. The average small farm performing agricultural bookkeeping has an area of about 2.01 hectare of agricultural land, in this the area planted is about 1.55 hectare. Statistics from agricultural bookkeeping provide information on the economics of farms in five area groups: less than 3 hectares, between 3 and 7 hectares, between 7 and 10 hectares, between 10 and 15 hectares and over 15 hectares. These farms achieve pro-duction results better than the average, especially the production results in animal breeding. For this reason these statistics cannot mechanically be assumed as average for the whole country, in the respective area group. On the other hand they are an excellent representation of the dynamics of changes taking place in the farms' economics, particularly in a longer time horizon.
-113 -
A questionnaire poli conducted by the Institute of Agricultural
and Food Economics had shown1) that only 6.2 % of the small
farms was selling vegetables, 10.7 % fruits, while on the other
hand 24 % of the small farms was selling grains. The production
of milk and breeding swine may be profitable for small farms
provided the scale of production is right and that concentrate
feedstuffs are used sparingly. A poll conducted in 1981 has
shown, that small farms still continue to prefer this orientation
of production. As many as 56 % of farms were selling milk and
slaughter beef and almost 48 % slaughter pork, 33 % were
selling eggs.
The crop composition in small farms is subordinated to the
requirements of animal production. In the population of farms
performing agricultural bookkeeping grains represent about 50 %
of the area planted; potatoes account for 21 %, fodder crops for
21 %, industrial crops for 5 % and vegetables for 3.5 %.
The most important changes during the passing decade were
a growth of the share of fodder crops in the composition of the
area planted, from 16 to 21 % respectively, a dropping share of
potatoes from 24.0 % to 22 % and of the industrial crops from
6.5 to 5.0 %. Some changes were observed also in the grains
composition. The share of rye in the total area planted dropped
from 19 to 14 % as well as that of oats from 9 to 6 %, while the
share of barley increased from 4.5 to 7.5 % and so did that of
mixed grains from 2.3 to 6 %. The share of wheat in the area
sown decreased from 17.0 to 16.7 %.
1)In 1981 a poll was conducted in 189 village throughout the whole country. Results have shown that 87.2 % of farms with an area between 0.5 and 3 hectares was selling agricultural products. The remaining farms were producing to cover the needs of the farm household.

-114 -
In the years 1970-1980 the yields of grains increased from
2.09 ton to 2.65 ton per hectare1). In this period on the average
from a hectare of wheat 2.63 tons were harvested, 2.43 tons
of rye per hectare, 2.91 tons of barley, 2.63 tons of oats and
3.03 tons of mixed grains per hectare. The grains yields were
characterized by large fluctuations, caused principally by
the changing weather conditions. 1978 was the best year for
grains. It was then that the yield of wheat was 3.18 tons, that
of rye 3.0 tons, barley 3.17 tons, oats 2.9 tons and mixed
grains 3.43 tons.
During the decade discussed one observes two sub-periods from
the point of view of changes in the total grains production.
In the first period, i.e. from 1970/71 to 1974/75 a permanent
growth of production had place - from 1 829 kilograms to 2 479
kilograms per farm, which meant a growth of 36 %. The second
period, starting 1975/76 is characterized by fluctuations; every
second year a production drop was experienced, followed by a
slight growth the next year. The highest level of grains produc-
tion / rye, wheat, barley and oats / per farm was achieved in
1978/79, equalling 2 483 kilograms.
The feeding of grains to animals in small farms increased more
rapidly than the production of grains. From year to year the
share of feeding in the crop total increased. And so, in the
beginning of the 1970's feeding reguired about 60 % of the crop,
in the middle of the decade this share was 75 % and by the end
of the 1970's and the beginning of the decade over 90 % of the
crop was earmarked for animal feeding.
1) The grains vields achieved by farms run by farmers performing agricultural bookkeeping are by 0.2 ton hiaher than the national average.
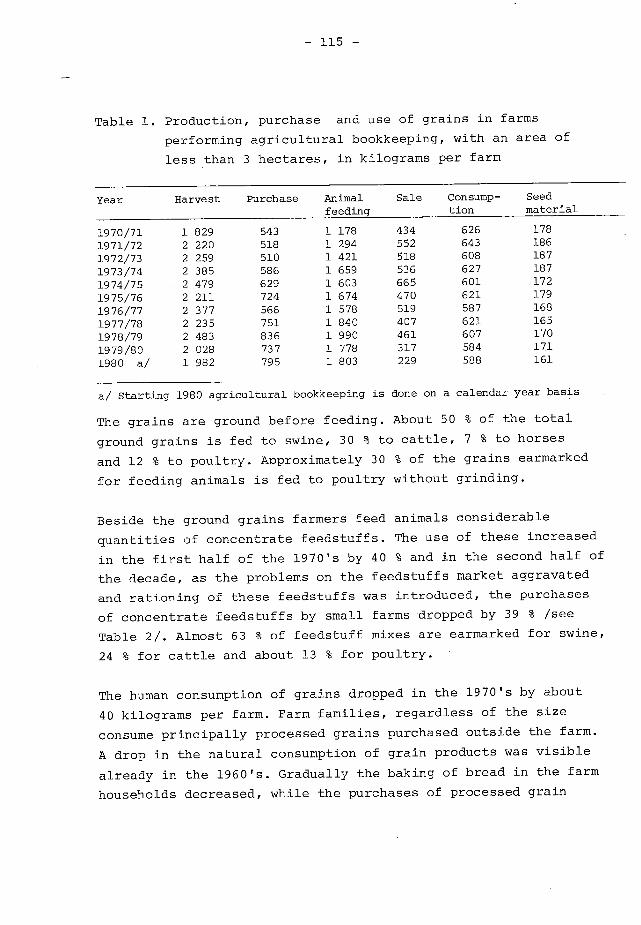
- 115 -
Table 1. Production, purchase and use of grains in farms
performing agricultural bookkeeping, with an area of
less than 3 hectares, in kilograms per farm
Year Harvest Purchase Animal feeding
Sale Consump- tion
Seed materia1
1970/71 1 829 543 1 178 434 626 178 1971/72 2 220 518 1 294 552 643 186 1972/73 2 259 510 1 421 518 608 187
1973/74 2 385 586 1 659 536 627 187
1974/75 2 479 629 1 603 665 601 172
1975/76 2 211 724 1 674 470 621 179
1976/77 2 377 566 1 578 519 587 168
1977/78 2 235 751 1 840 407 621 165
1978/79 2 483 836 1 990 461 607 170
1979/80 2 028 737 1 778 317 584 171
1980 a/ 1 982 795 1 803 229 588 161
a/ Starting 1980 agricultural bookkeeping is done on a calendar year basis
The grains are ground before feeding. About 50 % of the total
ground grains is fed to swine, 30 % to cattle, 7 % to horses
and 12 % to poultry. Approximately 30 % of the grains earmarked
for feeding animals is fed to poultry without grinding.
Beside the ground grains farmers feed animals considerable
quantities pf concentrate feedstuffs. The use of these increased
in the first half of the 1970's by 40 % and in the second half of
the decade, as the problems on the feedstuffs market aggravated
and rationing of these feedstuffs was introduced, the purchases
of concentrate feedstuffs by small farms dropped by 39 % /see
Table 2/. Almost 63 % of feedstuff mixes are earmarked for swine,
24 % for cattle and about 13 % for poultry.
The human consumption of grains dropped in the 1970's by about
40 kilograms per farm. Farm families, regardless of the size
consume principally processed grains purchased outside the farm.
A drop in the natural consumption of grain products was visible
already in the 1960's. Gradually the baking of bread in the farm
households decreased, while the purchases of processed grain
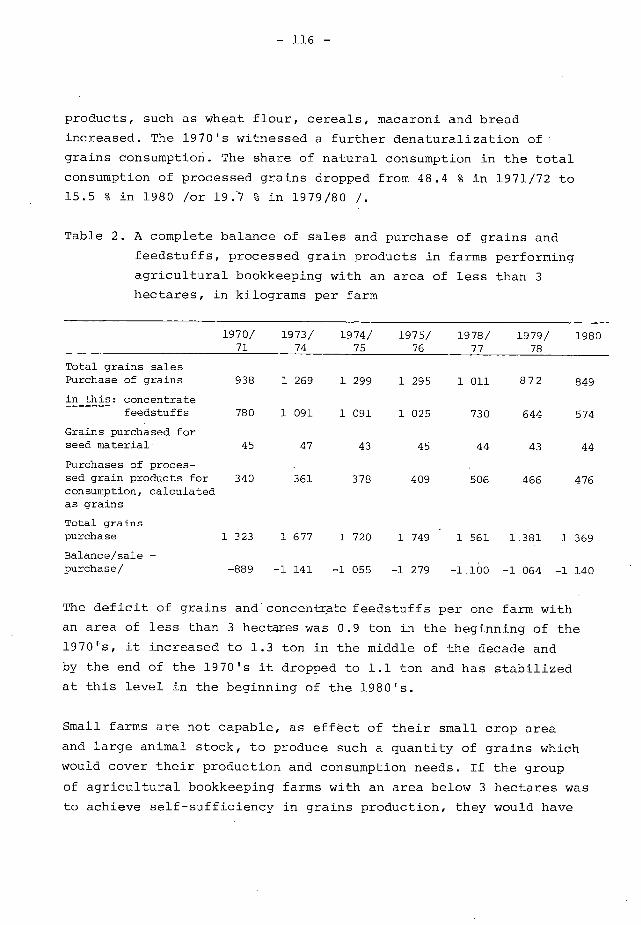
- 116 -
products, such as wheat flour, cereals, macaroni and bread
increased. The 1970's witnessed a further denaturalization of
grains consumption. The share of natural consumption in the total
consumption of processed grains dropped from 48.4 % in 1971/72 to
15.5 % in 1980 /or 19.7 % in 1979/80 /.
Table 2. A complete balance of sales and purchase of grains and
feedstuffs, processed grain products in farms performing
agricultural bookkeeping with an area of less than 3
hectares, in kilograms per farm
1970/ 71
1973/ 74
1974/ 75
1975/ 76
1978/ 77
1979/ 78
1980
938 1 269 1 299 1 295 1 011 872 849
780 1 091 1 091 1 025 730 644 574
45 47 43 45 44 43 44
340 361 378 409 506 466 476
1 323 1 677 1 720 1 749 1 561 1.381 1 369
-889 -1 141 -1 055 -1 279 -1_100 -1 064 -1 140
Total grains sa1es Purchase of grains
in this: concentrate feedstuffs
Grains purchased for seed materia1
Purchases of proces-sed grain products for consumption, calculated as grains
Total grains purchase
Balance/sale - purchase/
The deficit of grains and concentr;ate feedstuffs per one farm with an area of less than 3 hectm.-es was 0.9 ton in the beginning of the
1970's, it increased to 1.3 ton in the middle of the decade and
by the end of the 1970's it dropped to 1.1 ton and has stabilized
at this level in the beginning of the 1980's.
Small farms are not capable, as effåct of their small crop area
and large animal stock, to produce such a quantity of grains which
would cover their production and consumption needs. If the group
of agricultural bookkeeping farms with an area below 3 hectares was
to achieve self-sufficiency in grains production, they would have

- 117 -
to increase their crops by 75 % over the present level. This would
mean in effect planting to grains the whole area under cultivation.
Despite the large purchases of grains, feedstuffs and processed
cereal products, the group of farms below 3 hectares did sell
grains from their own production. This sale represented 27 to 15
per cent of the crop. Thus the production of grains in small farms
cannot be of a commercial character because on this scale it is
not profitable and the whole crop should be processed in the farm
itself in animal production. Only bigger farms, over 15 hectares
of agricultural area, are self-sufficient in grains. They are
capable of covering their needs / that is animal feeding,
consumption, seed material etc. /. Agricultural bookkeeping data
shows that the "net" sale / this meaning less than the quantities
of grains and feedstuffs concentrates purchased / in these farms
was on the average in these farms between 0.8 to 1 ton per year,
depending on the crop.
In relation to the available resources of feedstuffs the farms
in the below 3 hectares group have a high animal stock. In 1980
the group of agricultural bookkeeping farms with an area below
3 hectares had per 100 hectares of agricultural land 109 head of
swine, 86 head of cattle, in this 59 cows.
The highest indexes of animal stock per unit of agricultural area
in the small area farms we have observed in 1973/74. Per 100
hectares of agricultural area in this group of bookkeeping farms
we found 189 head of swine and 107 head of cattle.
The breeding of swine and cattle developed well in the beginning
of the 1970's, that is until 1974 in ali of the farm groups,
principally as result of a sufficient supply of the imported grains
and concentrate feedstuffs. In the second half of the past decade
difficulties appeared in the field of imports, and prices of
grains increased on the international markets. It was then that
the supply of feedstuffs to peasant farms were limited. The farms'

- 118 -
own feedstuffs base was not sufficient to maintain such a high
stock of animals, particularlv of swine, this resulted in a drop
of animal production in ali farm groups. This drop was especially
acute for the small area farms and the decrease in animal produc-
tion was the greatest there.
As animal production developed, with simultaneous intensification,
which resulted in improved productivity and a shortened breeding
cycle, the farmers departed from the traditional breeding systems,
in which grains were added to the feedstuffs. Grains became now the
basic feedstuff especially in industrial feedlot type technologies
of animal feeding.
In the 1970's and particularly in the second half of this period
one observed an increase in the grain requirement of animal breeding
also in the peasant farms. This phenomena also was observed in
farms with a small area. Potatoes, the main fodder so far, were
gradually substituted with concentrate feedstuffs. The change in
animal feeding technologies, particularly swine, consisting of
substitution of potatoes with grain feedstuffs caused in effect an
increase in the land intensity of animal production. This resulted
in a drop of the potential production capacity of the farm's own
feedstuffs and required supplementation with purchased concentrated
feedstuffs1). Nationwide the growing grain of animal'production
meanta necessary of increasing the imports of grains and feedstuffs.
In the becrinning of the 1970's the growth of concentrate feedstuffs
use was caused by a significant increase of the breeding animals
numbers and by the changes in the feeding technology, this
especially in the second half of the period discussed. The
traditional technology of feeding animals based mainly on potatoes
is very labor consuming. Thus the farmers, valuing more their
1) The feeding value of potatoes is approximately 3.5 times lover than that of grains. But when one takes into consideration the yields per unit of area - then from one hectare of potatoes one obtains twice as much feeding units compared to a hectare of grains.
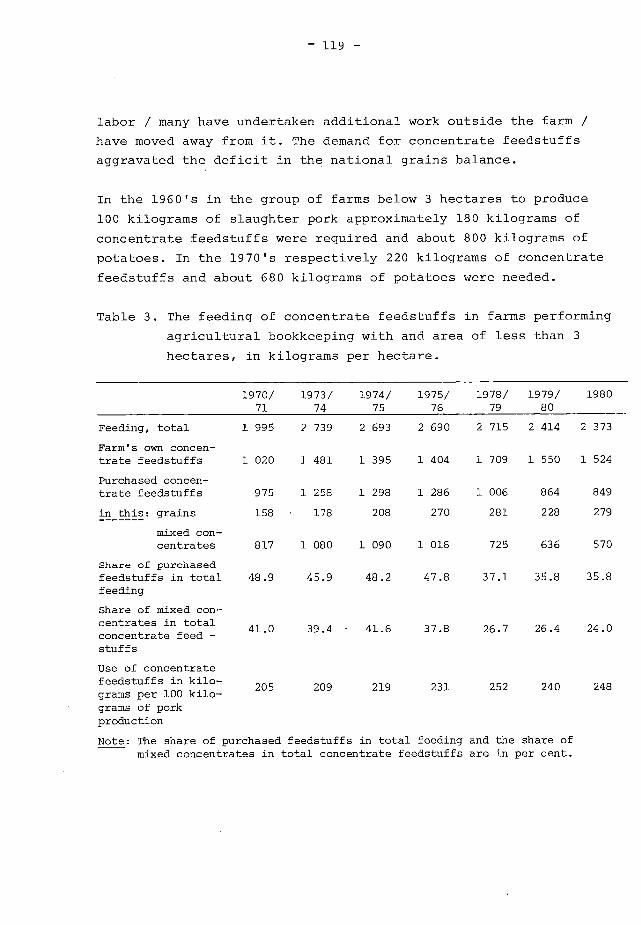
- 119 -
labor / many have undertaken additional work outside the farm /
have moved away from it. The demand for concentrate feedstuffs
aggravated the deficit in the national grains balance.
In the 1960's in the group of farms below 3 hectares to produce
100 kilograms of s1aughter pork approximately 180 kilograms of
concentrate feedstuffs were required and about 800 kilograms of
potatoes. In the 1970's respectively 220 kilograms of concentrate
feedstuffs and about 680 kilograms of potatoes were needed.
Table 3. The feeding of concentrate feedstuffs in farms performing
agricultural bookkeeping with and area of less than 3
hectares, in kilograms per hectare.
1970/ 1973/ 1974/ 1975/ 1978/ 1979/ 1980 71 74 75 76 79 80
Feeding, total 1 995 2 739 2 693 2 690 2 715 2 414 2 373
Farm's own concen- trate feedstuffs 1 020 1 481 1 395 1 404 1 709 1 550 1 524
Purchased concen- trate feedstuffs 975 1 258 1 298 1 286 1 006 864 849
in this: grains 158 178 208 270 281 228 279
mixed con- centrates 817 1 080 1 090 1 016 725 636 570
Share of purchased feedstuffs in total 48.9 45.9 48.2 47.8 37.1 35.8 35.8 feeding
Share of mixed con- centrates in total
41.0 39.4 - 41.6 37.8 26.7 26.4 24.0 concentrate feed - stuffs
Use of concentrate feedstuffs in kilo-grams per 100 kilo-grams of pork production
205 209 219 231 252 240 248
Note: The share of purchased feedstuffs in total feeding and the share of mixed concentrates in total concentrate feedstuffs are in per cent.
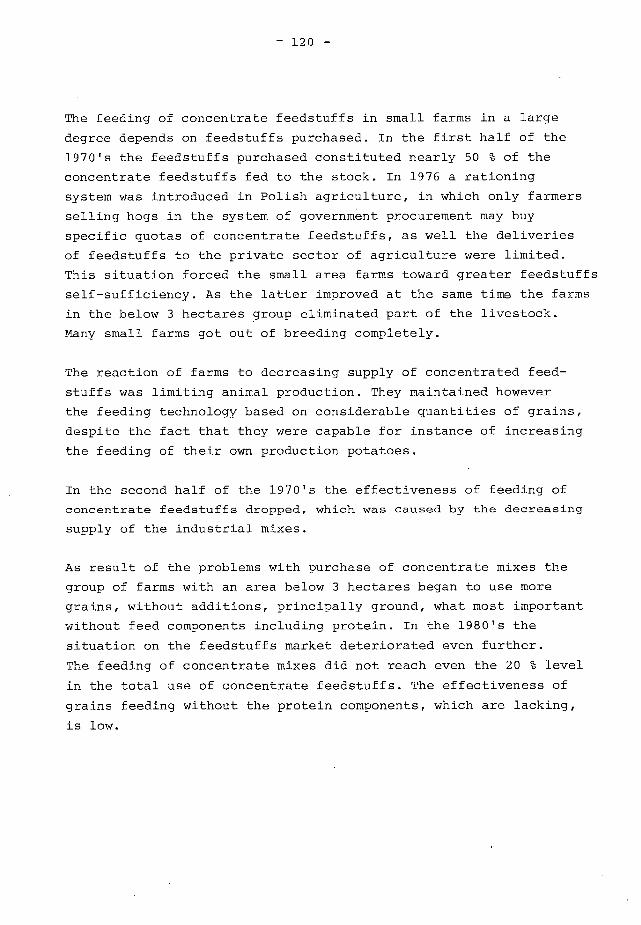
- 120 -
The feeding of concentrate feedstuffs in small farms in a large
degree depends on feedstuffs purchased. In the first half of the
1970's the feedstuffs purchased constituted nearly 50 % of the
concentrate feedstuffs fed to the stock. In 1976 a rationing
system was introduced in Polish agriculture, in which only farmers
selling hogs in the system of government procurement may buy
specific quotas of concentrate feedstuffs, as well the deliveries
of feedstuffs to the private sector of agriculture were limited.
This situation forced the small area farms toward greater feedstuffs
self-sufficiency. As the latter improved at the same time the farms
in the below 3 hectares group eliminated part of the livestock.
Many small farms got out of breeding completely.
The reaction of farms to decreasing supply of concentrated feed-
stuffs was limiting animal production. They maintained however
the feeding technology based on considerable quantities of grains,
despite the fact that thev were capable for instance of increasing
the feeding of their own production potatoes.
In the second half of the 1970's the effectiveness of feeding of
concentrate feedstuffs dropped, which was caused by the decreasing
supply of the industrial mixes.
As result of the problems with uurchase of concentrate mixes the
group of farms with an area below 3 hectares began to use more
grains, without additions, principally ground, what most important
without feed components including protein. In the 1980's the
situation on the feedstuffs market deteriorated even further.
The feeding of concentrate mixes did not reach even the 20 % level
in the total use of concentrate feedstuffs. The effectiveness of
grains feeding without the protein components, which are lacking,
is low.
- 121 -
As effect of the employment of such a technology of animal feeding
the small area farms have significantly decreased the production
of slaughter pork, and to a lesser degree of slaughter beef1).
This drop in animal production in the small farms aggravated
the national meat balance in Poland.
Despite the growing grain intensity in animal production in small
farms it is still less than that in the big farms. To produce
100 kilograms of slaughter pork they use about 60 kilograms of
concentrate feedstuffs less than the big farms / 250 and 310
kilograms, respectively in the beginning of the 1970's / 2)
The small area farms group still conducts a more traditional way
of breeding, where beside the concentrate feedstuffs and potatoes
also fed are relatively large quantities of green fodder and
household cooking wastes, which of course is not possible due
to the scale of production and the limited resources of labor
in the big farms.
The present crisis situation forces Poland to limit its imports
of grains by about 3 million tons. This means that the domestic
production of grains should increase. The small area farms indeed
In the beginning of the 1980's the small area farms produced per 1 hectare of agricultural land over 100 kilograms pork less and about 30 kilograms beef less than in 1973. In 1973/74 286 kilograms of pork and 122 kilograms of beef were produced. The relatively smallest drop was in milk pro-duction by about 150 liters per one hectare of agricultural land / compared to the 1973/74 production of 2 100 liters /. The milk production per cow decreased from 3 300 to 3 100 liters per year. The egg production remained unchanged at the 1 330 eggs per one hectare of agricultural land level.
On the average in Polish agriculture peasant farms used 30 to 60 kilograms of concentrate feedstuffs more than the farms performing agricultural bookkeeping.

- 122 -
grow too little grains but they in fact have no possibilities
of increasing this production through the expansion of the area
planted. Thus the production growth will have to be achieved
through a growth of the yields, due to better fertilizer appli-
cation and improved agrotechnics. During the last few years the
small farms have been feeding pure grains. This is a great waste
since the effectiveness of such feeding is low. The improvement of
this effectiveness is necessary and may bring considerable savings
of grains. It is necessary thus to enrich the feed grains with
the required high protein content components. It is also necessary
to limit the losses of nutrition components during harvest, storage
and feedstuffs conservation. Of great importance is maintaining the
proper quality of the feedstuffs supplied to farmers, which
frequently is substandard.
In the present crisis situation, with the dropping grains imports
the concept of farm self-sufficiency in grains is promoted. For
this reason it is necessary to achieve a drop in the grains
requirement of animal production. For the small farms, if they
are not to further decrease their animal production in this
situation, this means that a part of the grains fed previously
must be substituted by other feeds, such as dried potatoes, sugar
beet pulp, as well as high protein content fodder crops. The
feeding of potatoes should also be increased, enriched with high
protein components in the feed to improve the effectiveness of
feeding.
Warszawa, April 1983.
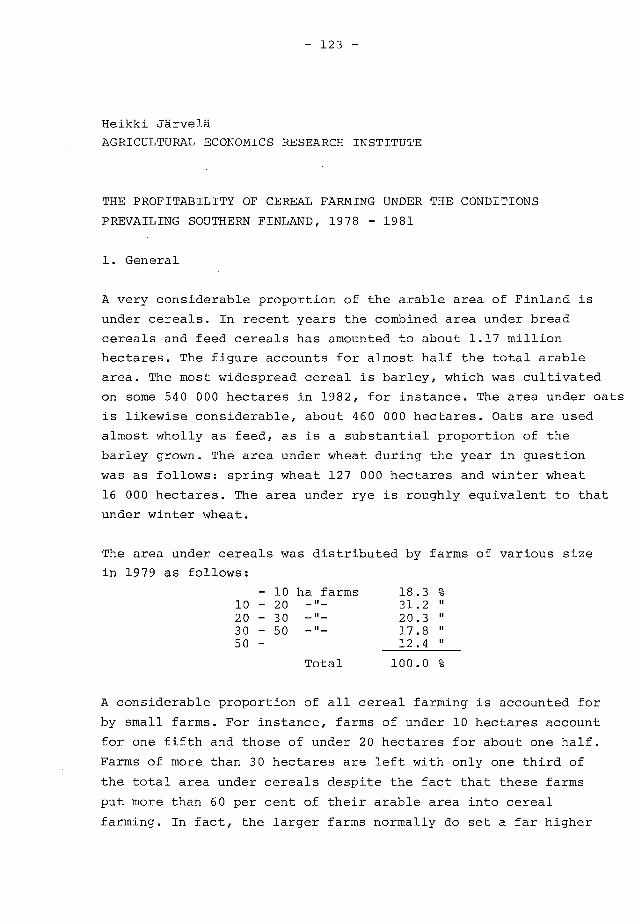
- 123 -
Heikki Järvelä
AGRICULTURAL ECONOMICS RESEARCH INSTITUTE
THE PROFITABILITY OF CEREAL FARMING UNDER THE CONDITIONS
PREVAILING SOUTHERN FINLAND, 1978 - 1981
1. General
A very considerable proportion of the arable area of Finland is
under cereals. In recent years the combined area under bread
cereals and feed cereals has amounted to about 1.17 million
hectares. The figure accounts for almost half the total arable
area. The most widespread cereal is barley, which was cultivated
on some 540 000 hectares in 1982, for instance. The area under oats
is likewise considerable, about 460 000 hectares. Oats are used
almost wholly as feed, as is a substantial proportion of the
barley grown. The area under wheat during the year in question
was as follows: spring wheat 127 000 hectares and winter wheat
16 000 hectares. The area under rye is roughly equivalent to that
under winter wheat.
The area under cereals was distributed by farms of various size
in 1979 as follows:
- 10 ha farms 18.3 10 - 20 -"- 31.2 20 - 30 -"- II 20.3 30 - 50 -"- 17.8 50 - 12.4
Total 100.0 %
A considerable proportion of all cereal farming is accounted for
by small farms. For instance, farms of under 10 hectares account
for one fifth and those of under 20 hectares for about one half.
Farms of more than 30 hectares are left with only one third of
the total area under cereals despite the fact that these farms
put more than 60 per cent of their arable area into cereal
farming. In fact, the larger farms normally do set a far higher

- 124 -
proportion of their arable area aside for cereals than do small
farms, as indicated by the following figures.
Arable area Area of farm under bread under feed total
cereal1) cereal
10 ha 2.3 25.8 28.1 10 - 20 " 3.5 39.9 43.4 20 - 30 " 5.9 48.5 54.4 30 - 50 " 9.9 53.6 63.5 50 - 14.6 51.0 65.6
On farms of under 10 hectares the proportion of the total arable
area accounted for by cereals was just under one third in 1979.
The proportion rises as farm size increases. On farms of more
than 50 hectares about 65 per cent of the arable area was put
under cereals, thereby leaving no more than about one third of
the arable area for other crops.
In regional terms, cereal production is concentrated in the
southern and western parts of the country. Oats and particularly
barley are grown in more northerly areas. It is worth pointing
out that in 1982 1 600 hectares were under barley in the Lapland
agricultural centre area, while the corresponding figure for
the Oulu agricultural centre area was some 51 300 hectares.
2. The prof itability of cereal farming on cereal farms in
southern Finland
1. Areas under cultivation and crop yields
In what follows we will seek to analyse the profitability of
cereal farming between 1978 and 1981 in the southern Finland
research area on bookkeeping farms engaged mainly in the
production of cereals. The following table shows the number of
farms and the proportions of the total arable area under cereals.
1)rye and wheat

- 125 -
Cereal farms in the southern Finland research area
Farm size Farms Crop area as a percentage of arable area category number size on southern Finland cereal farms
ha Rye Wheat Barley Oats Total
1978
10-20 ha 19 15.1 0.7 18.5 42.1 23.9 85.2 20-30 " 17 25.7 3.7 14.4 36.6 24.2 78.9 30- " 41 63.0 5.7 15.9 39.4 19.9 80.9
1979
10-20 ha 15 15.1 4.8 6.2 48.5 24.1 83.6 20-30 " , 18 25.6 5.3 11.9 37.5 25.4 80.1 30- " 45 65.7 4.7 11.6 40.9 21.9 79.1
1980
10-20 ha 18 14.9 9.0 13.3 43.8 15.0 81.1 20-30 " 18 24.9 5.9 17.6 29.0 26.7 79.2 30- " 51 64.4 7.2 15.4 36.1 17.8 76.5
1981
10-20 ha 19 15.0 3.1 18.1 42.5 15.8 79.5 20-30 " 24 25.2 4.8 17.7 31.9 24.1 78.5 30- " 60 62.6 6.3 15.5 36.7 16.8 75.3
The area under rye on these farms is fairly small, normally no more
than 3-7 per cent of the arable area. The area under wheat, which
includes both spring and winter varieties, varies between 15 and 18
per cent, with the exception of 1979, when it was lower. On these
farms barley is far the most widely grown cereal, accounting
for 35-40 per cent of the arable area. The corresponding propor-
tion for oats is 20-25 per cent. Between 1978 and 1981 the total
area under cereals on these farms has remained roughly unchanged,
i.e. at about 80 per cent of the arable area.
The following figures indicate the size of the crop yields for
these farm groups. The table also gives the average yield per
hectare for the country as a whole.

- 126 -
Farm size category
Crop yields per hectare on cereal Finland and for the whole country Rye Winter Spring Barley
wheat wheat
farms in southern on average
Oats
1978
10-20 ha 987 2 322 2 080 2 623 2 603 20-30 " 2 474 2 762 2 161 2 922 2 646 30- " 2 158 1 840 2 767 2 804 2 985
Whole country 1 940 1 880 2 120 2 570 2 420
1979
10-20 ha 1 267 1 826 3 446 2 551 2 107 20-30 " 2 053 - 2 411 2 604 3 345 30- " 2 511 2 109 2 465 2 914 3 212
Whole country 2 090 2 240 2 090 2 610 2 840
1980
10-20 ha 2 794 3 223 3 077 2 601 2 067 20-30 " 2 313 3 700 2 774 2 999 3 239 30- " 3 096 3 688 3 113 3 416 3 420
Whole country 2 320 3 250 2 760 2 880 2 810
1981
10-20 ha 1 189 1 884 2 039 1 952 1 990 20-30 " 1 364 2 209 2 388 1 933 2 341 30- " 1 375 1 654 2 382 2 326 2 640
Whole country 1 570 1 830 2 250 1 900 2 320
Crop yields per hectare normally range between 2,000 and 2 500 kg.
The crop yields vary sharply between one year and the next. The
best crop yields were obtained in 1980, when, for instance, the
yield of winter wheat came to about 3 600 kg per hectare. The other
years reviewed are far poorer owing to the rather unfavourable
weather conditions. 1981 was a particularly bad year, which is
reflected in the crop yield figures. When a comparison is drawn
between hectare yields on cereal farms in the southern Finland
research area and those of the country as a whole on average, we
see that the yields for the former are normally somewhat higher.
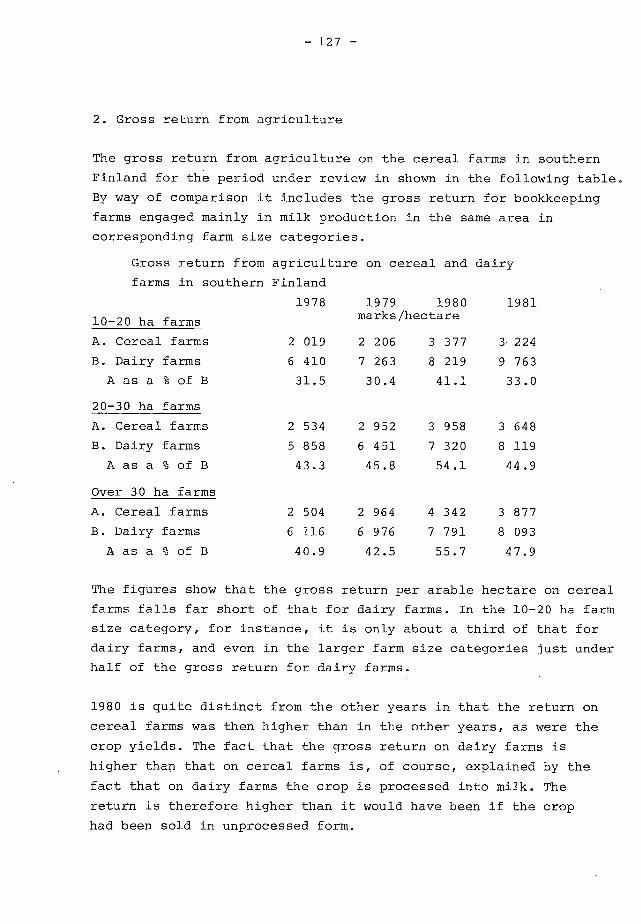
- 127 -
2. Gross return from agriculture
The gross return from agriculture on the cereal farms in southern
Finland for the period under review in shown in the following table.
By way of comparison it includes the gross return for bookkeeping
farms engaged mainly in milk production in the same area in
corresponding farm size categories.
Gross return from agriculture on cereal and dairy
farms in southern
10-20 ha farms
Finland
1978 1979 1980 marks/hectare
1981
Cereal farms 2 019 2 206 3 377 3 224
Dairy farms 6 410 7 263 8 219 9 763
A as a % of B 31.5 30.4 41.1 33.0
20-30 ha farms
A. Cereal farms 2 534 2 952 3 958 3 648
B. Dairy farms 5 858 6 451 7 320 8 119
A as a % of B 43.3 45.8 54.1 44.9
Over 30 ha farms
A. Cereal farms 2 504 2 964 4 342 3 877
B. Dairy farms 6 116 6 976 7 791 8 093
A as a % of B 40.9 42.5 55.7 47.9
The figures show that the gross return per arable hectare on cereal
farms falls far short of that for dairy farms. In the 10-20 ha farm
size category, for instance, it is only about a third of that for
dairy farms, and even in the larger farm size categories just under
half of the gross return for dairy farms.
1980 is quite distinct from the other years in that the return on
cereal farms was then higher than in the other years, as were the
crop yields. The fact that the gross return on dairy farms is
higher than that on cereal farms is, of course, explained by the
fact that on dairy farms the crop is processed into milk. The
return is therefore higher than it would have been if the crop
had been sold in unprocessed form.
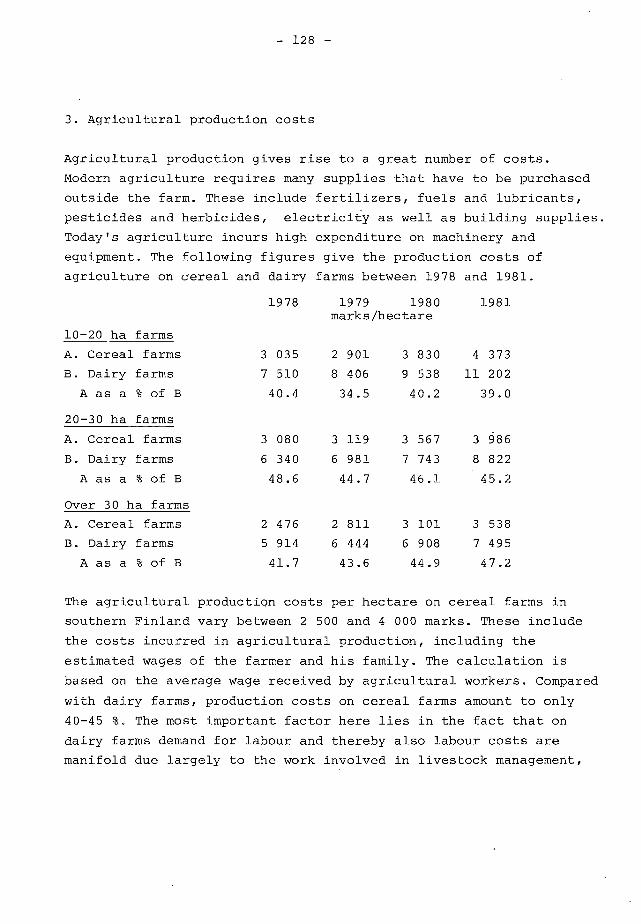
- 128 -
3. Agricultural production costs
Agricultural production gives rise to a great number of costs.
Modern agriculture requires many supplies that have to be purchased
outside the farm. These include fertilizers, fuels and lubricants,
pesticides and herbicides, electricity as well as building supplies.
Today's agriculture incurs high expenditure on machinery and
equipment. The following
agriculture on cereal
10-20 ha farms
figures
and dairy
1978
give the production costs of
farms between 1978 and 1981.
1979 1980 1981 marks/hectare
A. Cereal farms 3 035 2 901 3 830 4 373
B. Dairy farms 7 510 8 406 9 538 11 202
A as a % of B 40.4 34.5 40.2 39.0
20-30 ha farms
A. Cereal farms 3 080 3 119 3 567 3 986
B. Dairy farms 6 340 6 981 7 743 8 822
A as a % of B 48.6 44.7 46.1 45.2
Over 30 ha farms
Cereal farms 2 476 2 811 3 101 3 538
Dairy farms 5 914 6 444 6 908 7 495
A as a % of B 41.7 43.6 44.9 47.2
The agricultural production costs per hectare on cereal farms in
southern Finland vary between 2 500 and 4 000 marks. These include
the costs incurred in agricultural production, including the
estimated wages of the farmer and his family. The calculation is
based on the average wage received by agricultural workers. Compared
with dairy farms, production costs on cereal farms amount to only
40-45 %. The most important factor here lies in the fact that on
dairy farms demand for labour and thereby also labour costs are
manifold due largely to the work involved in livestock management,
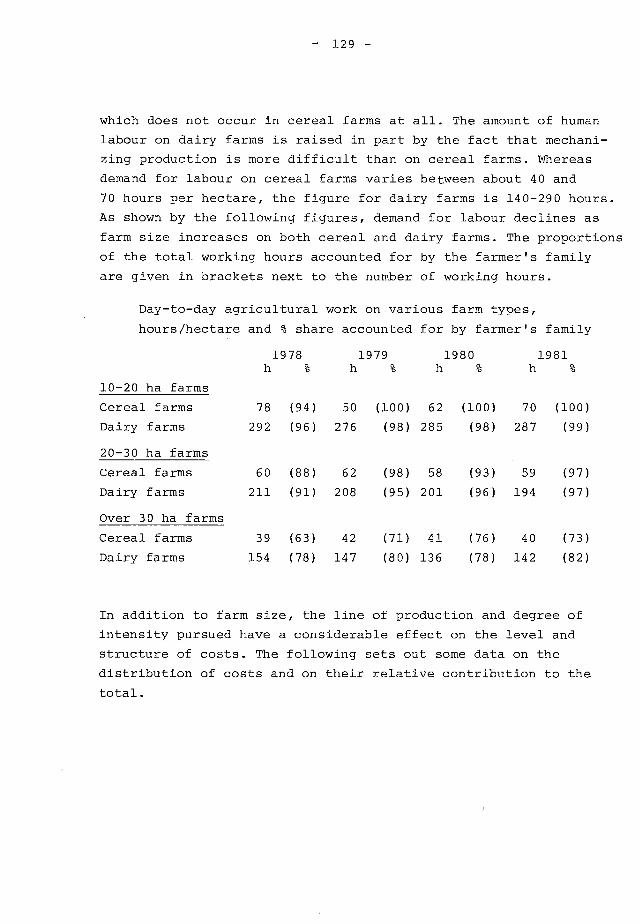
- 129 -
which does not occur in cereal farms at ali. The amount of human
labour on dairy farms is raised in part by the fact that mechani-
zing production is more difficult than on cereal farms. Whereas
demand for labour on cereal farms varies between about 40 and
70 hours per hectare, the figure for dairy farms is 140-290 hours.
As shown by the following figures, demand for labour declines as
farm size increases on both cereal and dairy farms. The proportions
of the total working hours accounted for by the farmer's family
are given in brackets next to the number of working hours.
Day-to-day agricultural work on various farm types,
hours/hectare and % share accounted for by farmer's family
10-20 ha farms
h 1978
% 1979 1980 1981
Cereal farms 78 (94) 50 (100) 62 (100) 70 (100)
Dairy farms 292 (96) 276 (98) 285 (98) 287 (99)
20-30 ha farms
Cereal farms 60 (88) 62 (98) 58 (93) 59 (97)
Dairy farms 211 (91) 208 (95) 201 (96) 194 (97)
Over 30 ha farms
Cereal farms 39 (63) 42 (71) 41 (76) 40 (73)
Dairy farms 154 (78) 147 (80) 136 (78) 142 (82)
In addition to farm size, the line of production and degree of
intensity pursued have a considerable effect on the level and
structure of costs. The following sets out some data on the
distribution of costs and on their relative contribution to the
total.
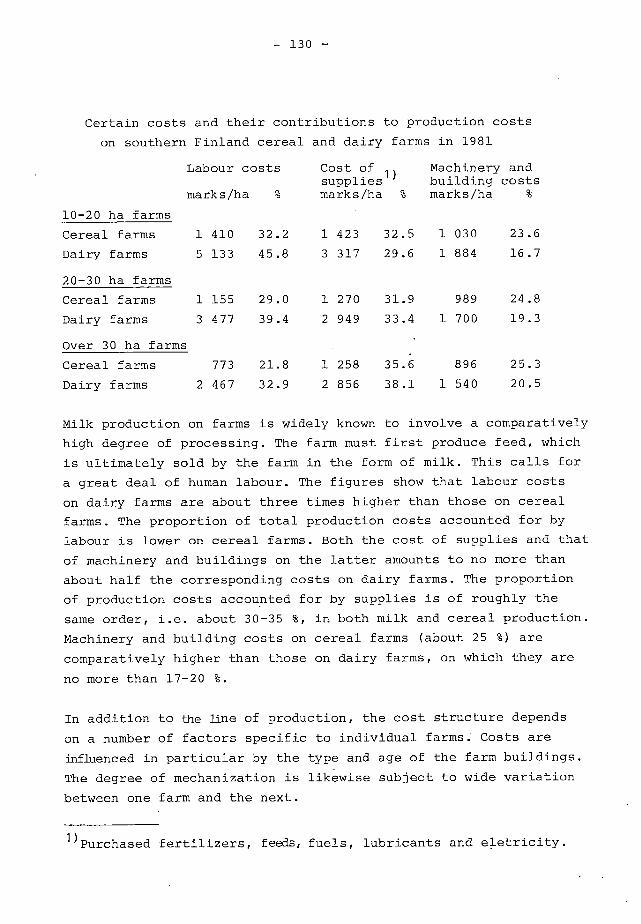
- 130 -
Certain costs and their contributions to production costs
on southern Finland cereal and dairy farms in 1981
Labour costs Cost of 1
Machinery and ) supplies building costs
marks/ha % marks/ha % marks/ha %
10-20 ha farms
Cereal farms 1 410 32.2
Dairy farms 5 133 45.8
20-30 ha farms
Cereal farms 1 155 29.0
Dairy farms 3 477 39.4
Over 30 ha farms
Cereal farms 773 21.8
Dairy farms 2 467 32.9
1 423 32.5 1 030 23.6
3 317 29.6 1 884 16.7
1 270 31.9 989 24.8
2 949 33.4 1 700 19.3
1 258 35.6 896 25.3
2 856 38.1 1 540 20.5
Milk production on farms is widely known to involve a comparatively
high degree of processing. The farm must first produce feed, which
is ultimately sold by the farm in the form of milk. This calls for
a great deal of human labour. The figures show that labour costs
on dairy farms are about three times higher than those on cereal
farms. The proportion of total production costs accounted for by
labour is lower on cereal farms. Both the cost of supplies and that
of machinery and buildings on the latter amounts to no more than
about half the corresponding costs on dairy farms. The proportion
of production costs accounted for by supplies is of roughly the
same order, i.e. about 30-35 %, in both milk and cereal production.
Machinery and building costs on cereal farms (about 25 %) are
comparatively higher than those on dairy farms, on which they are
no more than 17-20 %.
In addition to the line of production, the cost structure depends
on a number of factors specific to individual farms. Costs are
influenced in particular by the type and age of the farm buildings.
The degree of mechanization is likewise subject to wide variation
between one farm and the next.
1)Purchased fertilizers, feeds, fuels, lubricants and eletricity.
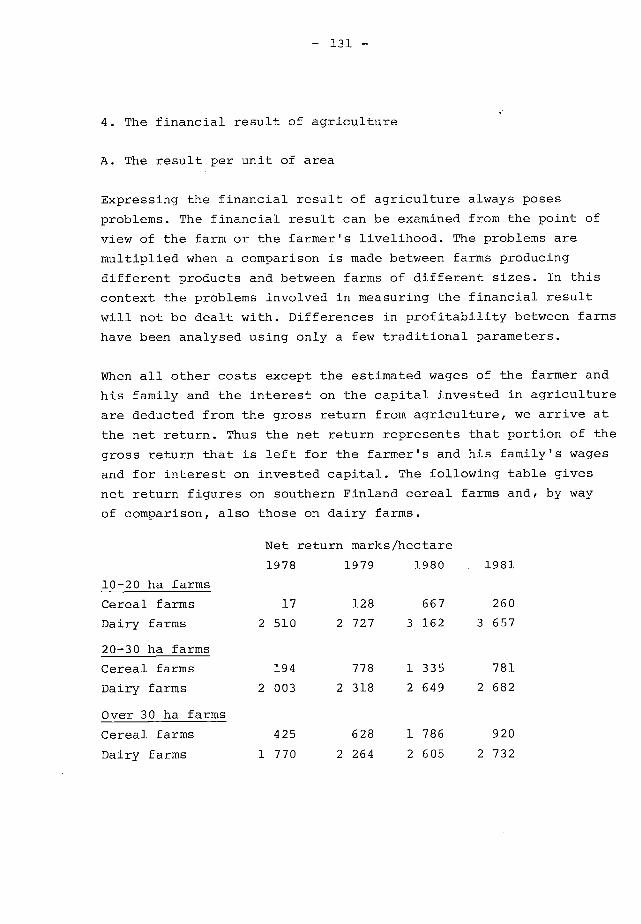
- 131 -
4. The financial result of agriculture
A. The result per unit of area
Expressing the financial result of agriculture always poses
problems. The financial result can be examined from the point of
view of the farm or the farmer's livelihood. The problems are
multiplied when a comparison is made between farms producing
different products and between farms of different sizes. In this
context the problems involved in measuring the financial result
will not be dealt with. Differences in profitability between farms
have been analysed using only a few traditional parameters.
When ali other costs except the estimated wages of the farmer and
his family and the interest on the capital invested in agriculture
are deducted from the gross return from agriculture, we arrive at
the net return. Thus the net return represents that portion of the
gross return that is left for the farmer's and his family's wages
and for interest on invested capital. The following table gives
net return figures on southern Finland cereal farms and, by way
of comparison, also those on dairy farms.
Net return marks/hectare
10-20 ha farms
1978 1979 1980 1981
Cereal farms 17 128 667 260
Dairy farms 2 510 2 727 3 162 3 657
20-30 ha farms
Cereal farms 194 778 1 335 781
Dairy farms 2 003 2 318 2 649 2 682
Over 30 ha farms
Cereal farms 425 628 1 786 920
Dairy farms 1 770 2 264 2 605 2 732
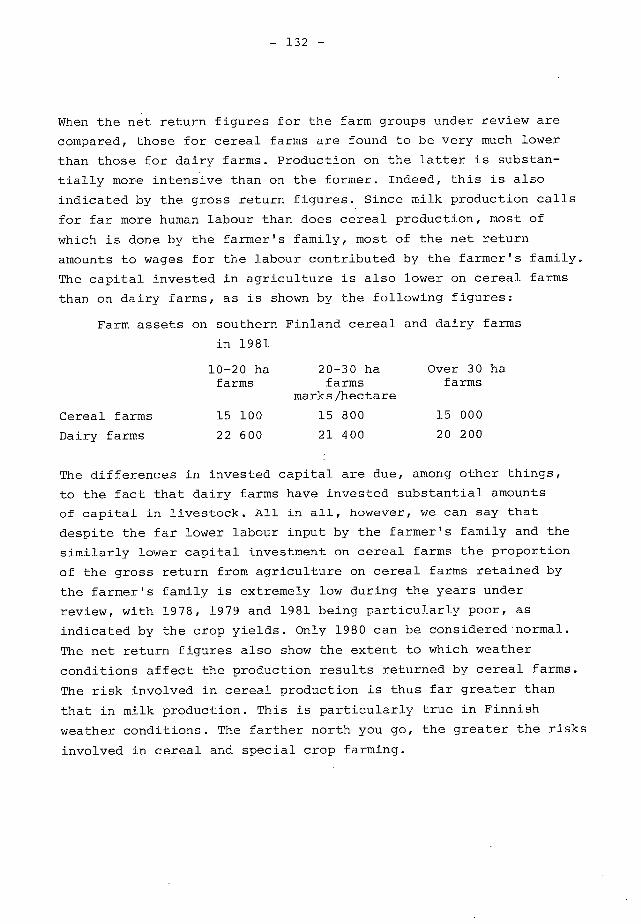
- 132 -
When the net return figures for the farm groups under review are
compared, those for cereal farms are found to be very much lower
than those for dairy farms. Production on the latter is substan-
tially more intensive than on the former. Indeed, this is also
indicated by the gross return figures. Since milk production calls
for far more human labour than does cereal production, most of
which is done by the farmer's family, most of the net return
amounts to wages for the labour contributed by the farmer's family.
The capital invested in agriculture is also lower on cereal farms
than on dairy farms, as is shown by the following figures:
Farm assets on southern Finland cereal and dairy farms
in 1981
10-20 ha farms
20-30 ha farms
marks/hectare
Over 30 ha farms
Cereal farms 15 100 15 800 15 000
Dairy farms 22 600 21 400 20 200
The differences in invested capital are due, among other things,
to the fact that dairy farms have invested substantial amounts
of capital in livestock. Ali in ali, however, we can say that
despite the far lower labour input by the farmer's family and the
similarly lower capital investment on cereal farms the proportion
of the gross return from agriculture on cereal farms retained by
the farmer's family is extremely low during the years under
review, with 1978, 1979 and 1981 being particularly poor, as
indicated by the crop yields. Only 1980 can be considered normal.
The net return figures also show the extent to which weather
conditions affect the production results returned by cereal farms.
The risk involved in cereal production is thus far greater than
that in milk production. This is particularly true in Finnish
weather conditions. The farther north you go, the greater the risks
involved in cereal and special crop farming.

- 133 -
B. Relative profitability
The result obtained from agriculture can be measured in a number
of ways. One measure used is the profitability coefficient, which
is obtained as follows.
Profitability coefficient - Net return
Estim. wage Interest of farmer's claim on family capital
The farmer's family's wage is estimated below on the basis of the
average wage rates paid to agricultural workers, and a 5 % rate
of interest has been calculated on capital. Thus the profitability
coefficient is a ratio which indicates the relation of the result
obtained (the net return) to the goal set: to obtain the same wage
for the work done by the farmer's family as that paid on average to
agricultural workers, and a 5 % rate of interest on invested
capital. If the value of the coefficient is 1.00 the result obtained
and the goal are equal, and the goal has thus been achieved.
Profitability coefficient
1978 1979 1980 1981
10-20 ha farms
Cereal farms 0.01 0.39 0.37 0.12
Dairy farms 0.56 0.57 0.57 0.59
20-30 ha farms
Cereal farms 0.14 0.49 0.81 0.41
Dairy farms 0.62 0.63 0.66 0.60
Over 30 ha farms
Cereal farms 0.42 0.56 1.45 0.69
Dairy farms 0.75 0.88 0.97 0.87
The figures given indicate that the goal set has not been achieved,
for the value of the profitability coefficient falls short of 1.00,
with a single exception. The differences in profitability between
cereal farms and dairy farms are similar to the case where the net
return is used as the measure of profitability. They are neverthe-

- 134 -
less relatively lower here because, in calculating the profitability
coefficient, account was taken of the sacrifices made (the amount
of labour contributes by the farmer's family and the capital
invested), and these are smaller on cereal farms than on dairy farms.
The profitability coefficient is normally lower on cereal farms than
on dairy farms. The only exceptions came in 1980 for 20-30 ha and
over 30 ha farms, for which the dairy farm coefficient is lower. In
comparing the various years we see that the cereal farm coefficient
varies widely. In contrast, the coefficients for dairy farms were
suprisingly even from year to year. The best results in both cereal
and dairy farms were obtained in the over 30 ha farm category and
the poorest in the 10-20 ha farm category.
C. The financial result per hour of work and farmer family
The best picture of the financial result is perhaps afforded by a
comparison of earnings per working hour and per family. The
following figures calculated per hour show that in cereal farming
on small farms the hourly wage has also been low during exceptional
years. We also see that earnings per hour in cereal farming on
larger units were rather satisfactory during favourable years.
The hourly wage in milk production is not high, but seems secure.
Earnings per hour and family per annum
10-20 ha 20-30 ha Over 30 ha marks/ marks/ marks/ marks/ marks/ marks/ hour family hour family hour family
Cereal farms
1978 0.13 150 1.82 2 700 5.21 10 000 1979 1.30 1 100 7.12 11 800 8.06 17 200 1980 6.09 6 200 12.54 18 200 23.95 52 100 1981 2.20 2 500 7.40 11 400 12.53 25 000
Dairy farms
1978 6.92 29 600 7.63 36 700 9.33 46 100 1979 7.93 33 300 8.75 43 500 12.39 62 300 1980 8.84 38 100 10.34 49 700 15.05 71 200 1981 10.16 44 600 10.42 49 100 15.34 78 100

_ 135 -
The figures calculated per family or farm show that especially
on small farms the family's total earnings are low owing to a low
labour input. This applies equally to the more favourable years.
Not until we get to the larger farms can cereal farming provide
the family with a livelhood. Owincr to the larger labour requirements
involved, earnings per family in milk production on medium-sized
farms are satisfactory. In Finland the susceptibility to risk is
substantially lower in milk production than in cereal farming.
- 137 -
THEME I I I .
MARKET I NG PROBLEMS
- 139 -
Zsuzsanna FUlöp
RESEARCH INSTITUTE FOR AGRICULTURAL ECONOMICS
BUDAPEST, HUNGARY
,NEW INTERFIRM RELATIONS AND THEIR ROLE IN THE PROMOTION OF
AGRICULTURAL FOREIGN TRADE
The vital role of foreign trade in the Hungarian national
economy is a widely known fact and thus the importance of an
efficient food and foreign trade intersectoral relationship
for an export led growth strategy is easy to understand. In
the past years however, because of the rigidities of the orga-
nizations and the conflicting interests of producer - and
foreign trade firms-involved just the efficient interrelation-
ship got into progressive difficulties. This situation became
particularly onerous because of the bad shape of world economy
and the sharply increasing market requirements in the 1970's.
As a consequence there is a growth effort to ease tensions
and resolve conflicting interests among producing and foreign
trading firms since the second half of the 1970's.
This paper tries to give a description of those experiments
which attempt - in the sphere of agricultural exports1) - to
modify interfirm relationships and the organizational system.
The paramount aim of these changes was an improvement in res-
ponses to foreign market impulses and the stepping up of the
risk taking capacity of the firms. Preconditions should be set
to achieve higher interest of ali participants in more efficient
foreign trade. At the start mainly an improvement of interfirm
relationships was envisaged, but later it became progressively
clear that organizational changes have to be started, too.
1) "Agricultural exports" is used in the paper for food, beverage, oilseed etc. / SITC 0, 1, 22, 29, 4 / exports.
- 140 -
The preconditions
Foreign trade is in Hungary - like in ali socialist countries -
a state monopoly, exercised by the state foreign trade
organization. The "foreign trade organization" is a term for
ali firms, organizations, authorities which are involved with
strictly defined competences at different stages in the management
of foreign trade; in this paper, however "foreign trade organi-
zation" is used in a narrow sense, referrincr to foreign trade
firms only.
Producer firms are the following:
agricultural firms / state farms , cooperative farms, house-
hold farms of co-operative members, simple types of co-
operatives, private farms etc. /;
food industrial firms / in addition to processing, some
purchase and transport raw products for export also /;
supplying and servicing firms of agriculture / e.g. commer-
cial organizations of co-operatives / TSzKER / and of state farms / AGKER /;
interfirm organizations / joint enterprises, production
systems, combinates, agro-industrial associations /.
Foreign trade firms are in direct contractual relationship
with state farms, co-operatives, food industry firms and
commercial organizations of producer firms. In this paper the
most important interrelationship, that between foreign trade
and industrial firms, is used to present the problem.
- 141 -
Organization of foreign trade and food industry
The organizational system and the types of interrelationships
of firms are an outcome of the economic policy and the control
and management system of the state.
An exploration of new ways and means in economic management
started in the years 1956-1957, with the aim of a partial and
gradual transformation of the planning and management system.
Apart from smaller modifications however, the directive planning
and management system remained in force until 1968. With the
introduction of the new economic management system however, at
the lst January 1968, a new chapter of the national economy was
started, despite the fact, that in 1973-1978, efforts concentra-
ted on the development of production somewhat pushed into back-
ground the progress of economic reform.
The new economic management system very strongly emphasized
foreign trade but did not interfere with the state monopoly of
foreign trade. The idea of a closer co-operation between produc-
tion and foreign trade was raised in the course of the preparatory
work already, but the institutional system remained despite this
untouched, as there were no plans for a modification of this.
Improvement of foreign trade efficiency was expected to result
from the closer co-operation of production and foreign trade
and of a transformation of the relationships.
The organizational system of foreign trade was shaped by the fact
that foreign trade firms were created in the post 1945 years
with state owned capital as distinctly separated organizations
from the production. The assignment of the handling of products
and product groups to the very few and very large foreign trade
firms was fundamentally made accorting to product and not demand
relations. Every firm was specialized for handling strictly
defined products. This specialization was reflected in their
internal organization, too.

- 142 -
This foreign trade organization was the necessary outcome of
the strict separation of production from marketing, of the
domestic from the foreign market, and the outstanding importance
attached to a bureaucratic / easy / control system as ali the
economic control and management of the national economy was based
on directive methods.
The organization of foreign trade was modified after 1968; in
the course of this a producer firm / State Farm Båbolna / in the
agriculture and food sector was entitled for self-managed export.
Authorizations for self-managed export were given in this time
in rising numbers in other sectors, and firms having already self
managed export-import authorization got extensions of the hand-
led products. /9 large firms in metallurgy and engineering got
self-managed export authorization in 1957 already /. Commissionary
firms were established in this period also, in the form of joint-
stock and limited liability companies.
From 1978 onwards authorizations for self-managed export and
permissions for individual foreign trade deals were again
extended on a larger scale.
However really substantial changes, interfering with the
organization started only in 1980 when authorization for "parallel
export" i.e. export of products that were handled by some
other foreign trade firm was given for strictly defined products,
to the GENERALIMPEX foreign trade company, which was established
without fixing the goods handled by the firm. Since this,
producers firms in the agricultural sector may choose whether
to export fresh, preserved, deep frozen fruits and vegetables
through the specialized foreign trade firm HUNGAROFRUCT or
through GENERAL IMPEX.
The monopoly of foreign trade firms was again somewhat loosened
in 1981-1982 with extension of parallel foreign trade to further
products.
- 143 -
The organization of food industry was set up in view of the
requirements of the directive management system similarly to
the foreign trade organization. The present situation is the
outcome of alternative centralizing and decentralizing periods.
Ali the concepts declared that organizational changes were made
with the aim of increasing the independence of the firms. The
state-owned firm is the most important organizational form
according the rulings of the establishing authority under the
supervision of a ministry or council / municipal,district etc. /
with complete management and accounting independence, or
belonging to a "trust", or having the position of a monipolistic
enterprise. Firms belonging to a trust have greater independence
than those belonging to a monopolistic enterprise; the firm
of a trust is an independent legal entity having own financial
statement. Food processing exists outside the state food
industry also, in plants of state farms, farmers' and consumers'
co-operatives.
Monopolistic state enterprises were dominant before 1968 in
food industry; after this trust firms became prevailing. There
were 10 monopolistic enterprises in 1964 and 4 trusts with
member firms while in 1971 3 monopolistic enterprises remained
and the number of trusts augmented to 10. Substantial organi-
zational changes started in 1980 when 3 trusts /wine, sugar,
tobacco / and 1 monopolistic enterprise / confectionary industry
and in 1982 when 3 other trusts / poultry, canning and brewing
industry / were dissolved. At present there exist 2 monopolistic
enterprises / refrigerating and vegetable oil industry /,
4 trusts / meat, dairy, distilling and milling industry / and
64 independent firms.
Types of interrelationships
Interrelationships of producer and foreign trade firms also
developed confirming the requirements of economic control and
management.

- 144 -
Prior to 1968, the producer and foreign trade firms entered so
called supply or "pian" contracts the later referring to the
obligation to put down pian targets into interfirm contracts.
The foreign trade firm purchased at a price fixed by the autho-
rities from the producer firm and sold on own account; there
was no close relationship between the purchased and the selling
price. Both the producer and the foreign trade firm were interested
in the volume. Foreign trade firms had no means for effective
commercial activity since they did not dispose of financial
assets necessary.
Contractual relationships between producer and foreign trade
firms significantly changed after 1968. Commission became the
predominant contractual relationship with pool, joint account
etc. agreements, and export and import on own account of the
foreign trade firm which was the dominantform previously, was
allowed only on permission. At the request of the consigner
it was obligatory for the foreign trade firm to enter a contract
of commission i.e. a compulsory consignatary relationship was
created. Because of the fixed commodity handling competence of
the specialized foreign trade firms however, the producer firms
could sen their goods to a single foreign trade firm only.
Thus a monopolistic situation and a compulsory relationship
existed for both partners.
For some commodities - e.g. grain - this was a working
interrelationship while for others changes were necessary which
started from 1978.
Grain trading is characterized by the following. The commodity
flow and the prices of bread grains are fixed; only firms
belonging to the Grains Trust / Gabona Tröszt / are entitled to
purchase and trade bread grains at prices fixed in advance. Bread
grain / wheat / produced by state farms and farmers' co-operatives
is purchased by the local firm of the Gabona Tröszt. Wheat is
- 145 -
delivered to the store of the purchaser or remains at the pro-
ducer on a storage contract. / There are jointly operated store-
houses also /. Firms sell wheat destined for export on account of
the volume of stocks and the consumption expected to the Ga-
bonaforgalmi 6s Malomipari Szolgåltatö Vållalat / Grain Trading
and Milling Industry Servicing Enterprise /. This is a firm of
the Grains Trust in direct interrelationship with AGRIMPEX foreign
trade firml). Interrelationship is based on commission contracts
including profit interest i.e. the producer and the foreign
trade firm share profits achieved, at a fixed ratia.
Sale outlets for feed grains are somewhat different. Gabona
Tröszt is not the sole purchasing and marketing agency;
production systems also can participate. / Share of these
however, is only about 5 percent of total feed grain turnover/.
The same is true of the production and marketing of fixed feeds,
with the difference that imported protein used for the production
of fixed feed, imported by AGRIMPEX can be purchased only by the
Grains Trust and the Feed Association Agård - Båbolna - Környe;
thus other mixed feed producers must buy imported protein from
these organizations. The share of Grains Trust in imported
protein is 70 percent, that of the Feed Association 30 percent.
Protein import is made, on the basis of a simple commission
contract, without profit sharing.
Both parties consider the interrelationship of Grains Trust and
AGRIMPEX as good. AGRIMPEX transfered since 1968 some of its
development fund to the Grains Trust for the promotion of
exports but this is not enough for the construction of new silos,
storehouses and is usually used for the purchase of grain loading
machinery and other storage equipment. Commission contracts
serving as a basis of the interrelationship comply with the
characteristics of grain trading i.e.:
1)AGRIMPEX was established in 1952 and deals e.g. with export and import of grains, oilseeds, veaetable oil, sugar, starch, import of protein feed, export of dehyclrated flour for feeding, etc.
-146 -
bread grain has central role in the supply of the population,
grains are subject to central management,
export transactions are generally centrally made involving
great quantitites,
produce is typically homogenous, etc.
There is no intention to modify the interrelationships of
grain marketing in the future and there are no plans for the
introduction of self-managed foreign trading either.
For several products however the commission contract which is
almost universal since 1968, does not really work. New regula-
tions were introduced in 1978 to ease existing tensions,
urging a closer co-operation of the partners and establishing
suitable preconditions. In compliance with the new regulations
producer and foreign trade firms can establish foreign trade
associations and agencies without legal entity. So far eight
foreign trade associations and agencies were established for the
export of agricultural and food products. Ali these have in
common that business for the association is done by the foreign
trade firms with the respective operational units performing
necessary administration. It is envisaged for these associations
and agencies in the future to be transformed into organizations
with greater independence, having their own accounting etc.
Members of these associations and bureaus, i.e. producer and
foreign trade firms share profits and losses. Decisions are made
collectively at the meetings of the Board of Managers made up
from the representatives of the member firms.
Foreign trade associations and agencies were established to
enhance co-operation of member firms and thereby to augment hard
currency income from export and to increase efficiency of
production for export. In addition both producers and foreign
traders tacitly hoped to obtain profits supposed to accumulate
at the partner.

- 147 -
Producer firms also thought it would he easier to get self-managed
export authorization in this wav.
But according to experience available, foreign trade associations
and agencies have realized only to some extent these are somewhat
exaggerated hopes.
Production and marketing undoubtedly moved nearer to each other;
production managers get from direct information a better insight
into problems of foreign trade and foreign trade managers get
deeper knowledge of the difficulties of production; pricing
improved also. A better coordination of production and the market
opportunities, however, did not succeed. Two main conclusions
arise:
a/ the new interrelationships are not much better than the
earlier,
b/ this is quite obvious, as new interrelationships did not
result in more capital available and the very restricted
commercial capital did not start to function properly.
There are still very little freely disposable financial resources
in the hand of foreign trade firms and this makes even reasonable
risk taking hardly possible. / New income regulation introduced
in 1980 reduced instead of increasing free financial means of
foreign trade firms /.
Much more important in my opinion than the setting up of
associations and agencies was the initiation in 1980 of
organizational changes; loosening of the monopoly of specialized
foreign trade firms by granting parallel export rights and
easing of compulsory interrelationships.
- 148 -
For the sake of accuracy, it must be stressed however that
parallel export rights exist for the time being only within
a very narrow sphere. But the future lies undoubtedly in the
liquidation of compusory interrelationships and the creation
of the basis of free choices, i.e. the establishment of the
preconditions - last but not least financial resources - for
such decisions.
Budapest, May, 1983.

- 149 -
MichaX Kisiel
INSTITUTE OF AGRICULTURAL
AND FOOD ECONOMICS
WARSZAWA, POLAND
RECENT DEVELOPMENTS ON THE INTERNATIONAL GRAIN MARKETS AND
THEIR IMPLICATIONS FOR THE GRAIN BALANCE IN POLISH AGRICULTURE
The global volume of food production, including grains, has grown
significantly since the world food crisis of the early 1970's.
Despite this fact, some of the international grain market cha-
racteristics, which are very unfavourable for the importers
persist, even though their origin was in the crisis years. What
more, there are reasons to believe, that with the passing of time,
these negative phenomena will rather undergo consolidation, while
their listing will come to include further negative aw.)ects.
1. First of ali, many things point to the fact, that the arrangement
where it is the exporter who dictates the terms of trade will
continue. This situation originated in the 1972/73 to 1975/76
period. The potential conditions for such as a state of things were
formed long before the 1970's decade as a result of interregional
disproportions in the agricultural production potential growth
rates. From a rather large group of countries shipping grains,
there emerged a small group of the so called structural exporters.
Having at their disposal great potential possibilities of pro-
duction growth already in the 1950's this group of countries
began to determine the world grain supply situation. The other
exporters did not only stop exporting grain but together with
the countries, previously self-sufficient in grain production
joined the importers group.
- 150 -
The transformation of the world grain market into a producers'
market, both in the 1950's and 1960's was counteracted mainly by
stagnation trends in the import demand. These were in turn the
effect of the progress of the so called "green revolution" in
the agriculture of the developing countries, existing agricultural
protectionism systems in the importer region of Western Europe
and also the result of the autarchy model of agricultural
development in the countries of Eastern Europe. These factors
were instrumental in the cumulation of large grain surpluses on
the markets of the exporting countries, since the effective
demand for grain imports was increasing more slowly than the
supply.
During the last dozen years the arrangement of the international
grain markets has changed fundamentally. Without going into the
reasons of these changes for the moment, one should state that
first of a11 the scale of the world imports demand has increased
great1y. It was found that the crisis of the yearly 1970's has
uncovered only a part of these needs. It was in the following
years that a great number of countries appeared, representing
various levels of economic develoument, which began to increase
markedly their imports of wheat and/or coarse grains. What
more important, new customers appeared, buying both types of
grain on a mass scale, which in the final effect resulted in
a growing rate of concentration of the demand sources.
During the last several years, according to IWC and FAO estimates,
the world trade includes, per annum, about 210 million tons of
grains, in this 95 to 100 million tons of wheat, 102 to 103
million tons of coarse grains and 9 to 10 million tons of rice.
The first figure should be related to 138 million tons registered
during the crisis years. Quite apart from this, important changes
have taken place on the side of supply. In fact, the group of
exporters dwindled down, since the USSR became an importer,
while the exporting position of the USA was considerably
strengthtened. According to FAO statistics in the years 1976/77-

- 151 -
1980/81 it was in the USA where about 65 % of the exportable
surpluses of the principal exporting countries was concentrated,
in this about 50 % of wheat and 80 % of coarse grains surpluses.
The respective shares for the period 1971/72-1975/76 were 59, 47
and 72 %. To present an idea of the potential of this and other
major exporting countries to influence the world grain market
situation, we will only say, that 6 countries / USA, Canada,
Argentina, Australia, France and the Republic of South Agrica /
control today over 90 % of world coarse grain trade and 92 % of
the wheat trade.
2. Another phenomenon is beginning to take on a permanent character;
the tendency to deteriorating commercial conditions for buying grains
on the international markets, originating in the crisis years,
while a new element are upward movements of prices also during
periods of abundant supply. This trend is supported, first of
ali, by growing capacity of the world grain market. At the founda-
tions of this lies the impossibility to cover with the domestic
production in some regions of the world, the growing demand for
cereal products. One should also enumerate here the acceleration
of the rate of grain utilisation for feed in many parts of the
world. It is true, that the progress in animal feeding and the
weakening domestic demand for products of animal origin, due to
recession, have decreased gradually the import demand of the
until recently leading importer region - Western Europe,
nevertheless when one considers the dynamics of the global demand
for grains, the second half of the 1970's differs none from the
period of the food crisis. Available statistics show, that in the
years 1976/77-1980/81 the per annum rate of growth of the grain
trade amounted to 5.9 %, the respective figure for wheat was
4.1 % and coarse grains 7.6 %, thus being only a little lower
than the comparable rates for the 1971/72-1975/76 period / respec-
tively 6.8; 4.4; 9.3 %.1).
1) While in the years 1971/72-1975/76 the world grain trade amounted on the average to 126 million tons of grains /excluding rice /, than in the years 1976/77-1980/81 this quantity increased to 167 million tons and in 1981/82 amounted to 203 million tons. When including rice into the global turnover in 1980/81 the figure was 214 million tons, constituting 15 % of the global production and representing approximately 49 billion US dollars.

- 152 -
The discussed changes in the capacity of the world grain market
one should attribute, among other to the growing import needs of
many countries in Africa, Latin America, the Near and Far East,
describedin general as developing countries. After a few years
of limited expansion, these countries have marked again strongly
their presence on the international grain markets in the beginning
of the 1970's, when faced with a series of poor crops, a drop of
per capita grain production and the threat of hunger as effect
of this. In fact, in the period 1971/72-1975/76 they increased
their imports by about 50 %. The development of the import demand
in the later part of the 1970's remains in a close connection
with transformations in the world energy and raw materials
economy. The phenomena accompanying the deterioration of the
global energy and raw materials balances / such as the growth
of prices of basic inputs used in agricultural production -
fertilizers, pesticides, as well as the basic machines and tools
have lead first of ali to a slowing down of the food production
growth rates and correspondingly increasing of the import needs
of the low-income countries, which don'thave at their disposal
resources of raw materials worth mention. This particularly
pertains to the countries of Africa, where for years now the per
capita grain production has been dropping, as well as to substan-
tial group of countries in Latin America and the Far East, which
in order to maintain the nutrition of their population at least
at the level of the physiological minimum, must expand their grain
imports, quite regardless of the changing conditions of the
international markets.
The changes in the grain economies of the producers and exporters
of petroleum prof iting by this product's growing prices, be it
members of OPEC or countries outside that organization, and
the changes in the grain demand by the rapidly developing coun-
tries of the so called Third World, e.g. The People's Republic
of China and Brasil, exert however •a much greater influence on
the global demand for grains, than the previously discussed group
of countries. Despite the significant progress in development of
- 153 -
domestic grain production the agriculture of these countries
is not capable of facing the growing demand pressure, both for
processed cereals as well as for the products of animal origin,
which stemm from the growing population numbers and the improving
income situation of the populations. Some of these countries have,
during the recent years, commenced the realisation of programmes
of animal production growth, in this also projects of feedlots
type. A1ready today these producers constitute a factual threat
to the bargaining positions of the coarse grains importers.
It was above group of countries, principally the PRC, Brasil,
Egypt, Mexico and the OPEC countries which appeared on the
international market with magnified demand for grains and as
a result of this, the group of developing countries as a whole
in the period 1976/77-1980/81 was responsible for 56 % of the
global increment of the world gross grain imports1), while their
share in the world grain trade increased from 38 % in the years
1971/72-1975/76 to 43 %.
A new, different element of the global market situation was the
joining of the competition on the grain market, particularly the
coarse grain market, by the European CMEA countries. During the
previous periods these countries in a very limited extent depended
on grain supplies from third countries. The realization of
programs of accelerated animal production development aimed at
improvement of the nutrition standards of the population,
undertaken in early 1970's, resulted in a radical change of the
situation. It was aga:Llst this background that the deficits became
aggravated in the importing countries / the GDR and Czecho-
slovakia /, the limiting of the grain surpluses in Romania and
Bulgaria, while the Soviet Union, the only important exporter of
grains in the CMEA faced a necessity of taking up mass scale
imports. It is true, that in most countries during the last
years, one observes a significant increase of the grain crops,
nevertheless, to maintain the desired rate of animal production
growth, since the labor-saving but grain intensive animal feeding
1)This share was 42 % in the case of coarse grains and 86 % in wheat, according to FAO statistics
- 154 -
technologies have become quite universal, it is necessary to
expand the imports further. In the years 1976/77-1980/81 the
gross grain imports increased, in comparison with the previous
five year period by 50 % / the net growth was 87 % /, reaching
the level of 36.4 million.tons, of which two thirds were coarse
grains. One should add that from this volume, averagely 22 m.
tons per year / 62 % /were absorbed by the recognization as
prospective USSR market. Of these 22 m. tons, 6 m. tons
was wheat. In the period discussed the CMEA countries contributed
to almost 30 % of the increment of the volume of the global trade
in grains1), while their share in the world grain trade amounted
to 22 %, compared to the 19.4 % in the previous five year period.
The growing demand for grains of Japan, one of the traditional
great importers, results in identical effects on the world grain
market. Since there is no real potential for expanding domestic
grain production, this country in order to develop its animal
production must depend in an increasing degree on foreign
supp1ies2).
Secondly, the possibility of further deterioration of the trends
as regards the economic conditions of grains purchasing on the
international markets, is supported by the directions of change
which the economies and national grain policies of the major
grain exporting countries are undergoing.
Having released during the food crisis period the surpluses
burdening the domestic markets, these countries have in the
period 1976-1981 rapidly increased the volume of their grain
production, taking the opportunity of the favorable market
1) In the case of wheat this share was 13 %, while in coarse grains it exceeded 34 %.
2)Availab1e statistics show, that every five years the Japanese imports of grains increased bv about 4 m. tons, which means an annual rate of growth of the imports volume of approximately 5 %. In the years 1976/77-1980/81 the Japanese market absorbed on average 5.5 m. tons of wheat and 18 m. tons of coarse grains, while the share of this country in the global trade in grains oscillated around 14 %.

- 155 -
situation. To present the scale of changes taking place, we
quote the fact that during the time discussed the total grain
crons of the principal exporting countries / excluding the EEC /
haverisen at a rate of 3.1 % per annum / the respective rate for
wheat was 4.3 % and that for coarse grains 2.8 % /, which compares
to the 2.8 % annual rate in the years 1971-1975.
With the present level of society affluence and the standard of
nutrition in major exporting countries, a growth of the population
incomes and lirked increments of demand for food of animal origin,
don'tcause so extensive, as in the other countries, effects
in the area of grain utilisation. The total domestic use of ) grains1 usually increases moderately, and presently in a situation
of economic recession, this rate has dropped to almost zero
dimensions2). With this state of things the rapid growth of grain
production in a rather short period of time lead to a considerable
growth of the surpluses and the renewal of the process of stock
accumulation, which resulted among others in the lowering of
export prices in the years 1975/76-1977/78. These phenomena
appeanadin intensive form in the countries distinquished by a high
production growth rate, this particularly the USA and Canada.
The awareness of the extensive implications of the changes in the
trade balances, in the farmers' incomes and the governments'
budgets outlays for the agricultural prices supporting programs,
which would have place if the grain prices on the international
markets would drop, have resulted in the exporting countries in
intensification of the efforts aimed at counteracting a possible
repeating of such developments. Extra pressure in this direction
is exerted by process taking place of growing prices of the inputs
1)It is worth to mention here that in countries like Australia, Canada, USA the use of grains per capita annually is in the range of 800 to 1000 kilograms of which 80 % constitutes feed use.
2)According to FAO statistics in the years 1976/77-1980/81 the domestic use of wheat in the principal exporter countries / EEC including / increased in comparison with the years 1971/72-1975/76 by as little as 1.9 % and of coarse grain by 1.5 %.
- 156 -
and services used for production purposes, which leads to
increasing per unit costs. The latter makes maintaining the
income parity of the rural population difficult as well.
Due to their position on the international grain markets the USA
for many years now lead in the efforts aimed at the protection
of the interests of the exporting countries. In this country
most sensitive to the influences of changes taking place on
grain markets, the system of protecting agriculture from deterio-
rating market conditions has been perfected for dozens of yearS,
and recently new elements to this system have been added. Without
going into details we will limit ourselves to the statement that
the recent changes in the price support programs assume far
reaching government intervention in the sphere of production,
domestic turnover and a narrowing down of the export subsidies
only to cases justified by the interests of the US foreign policy.
A totally new element is the exclusion from domestic turnover and
from externa1 trade specified quantities of grains from the
current crop, the size of which is determined by the situation
on the domestic and international markets. The removed grain
is meant to be added to the so called farmer-owned reserve. When
it may be necessary to cut down the area planted to grains this
reserve may be used ascompensation for the crop lost in effect
by the farmers. One needs nct to conment, that such a construction
of the programs permits considerable maneuver when managing the
export supplies flows, which in turn gives the possibility to
counteract to some extent, the dropping prices in a situation of
abundant supply (See table No 1).
Let us add to this, that the discussed activities aimed at
counteracting the downward movements of grain prices on the world
market, are not limited only to the domestic market. It is enough
to mention the quite recent initiatives by the USA concerning
the creation of a wheat exportersl cartel or the coordination
efforts undertaken by this country to manage the trade policies
of the principal exporters.
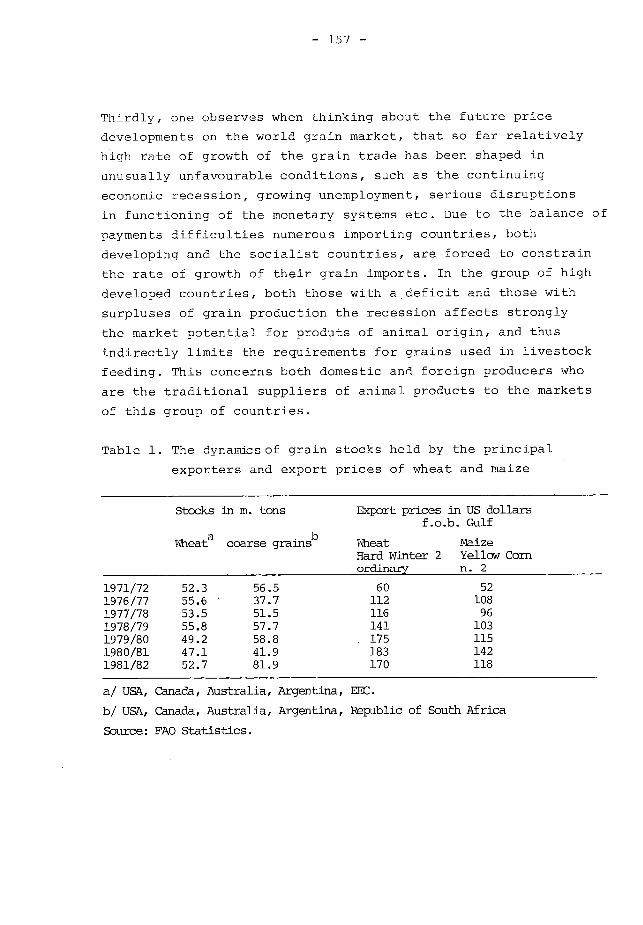
- 157 -
Thirdly, one observes when thinking about the future price
developments on the world grain market, that so far relatively
high tate of growth of the grain trade has been shaped in
unusually unfavourable conditions, such as the continuing
economic recession, growing unemployment, serious disruptions
in functioning of the monetary systems etc. Due to the balance of
payments difficulties numerous importing countries, both
developing and the socialist countries, are forced to constrain
the rate of growth of their grain imports. In the group of high
developed countries, both those with a. deficit and those with
surpluses of grain production the recession affects strongly
the market potential for produts of animal origin, and thus
indirectly limits the requirements for grains used in livestock
feeding. This concerns both domestic and foreign producers who
are the traditional suppliers of animal products to the markets
of this group of countries.
Table 1. The dvnam.i2sof grain stocks held by the principal
exporters and export prices of wheat and maize
Stocks in m. tons EXport prices in US dollars f.o.b. Gulf
Wheata . b
coarse grains Wheat Hard Winter 2 ordinary
Maize Yellow Corn n. 2
1971/72 52.3 56.5 60 52 1976/77 55.6 37.7 112 108 1977/78 53.5 51.5 116 96 1978/79 55.8 57.7 141 103 1979/80 49.2 58.8 175 115 1980/81 47.1 41.9 183 142 1981/82 52.7 81.9 170 118
a/ USA, Canada, Australia, Argentina, EEC.
b/ USA, Canada, Australia, Argentina, Republic of South Africa
Source: FAO Statistics.
- 158 -
One should rather expect that as respective economies will come
out of the recession, the demand for grains on the international
market will keep growing which of course will not remain without
influence on the demand and supply equilibrium and the price
levels.
3. There are reasons to believe that the phenomenon of a structural
absence of stability on the international grain markets is
becoming a permanent feature. Anintensive manifestation of this
disstability was observed during the crisis years of 1972/73-
1975/76 and since that the trade is taking place in a situation
of high insecurity.
While it is true, that demand supply, as well as the prices on the
international grain markets have always undergone certain
fluctuations, nevertheless our recognition of this phenomenon
today, permits to state, that the scale of these fluctuations,
together with the dimensions of their effects is quite incom-
parable with the previous changes. In addition, in contrast to
the previous periods when market fluctuations in the final effect
came down to rather small price changes, in the 1970's we
observed a new development - this being the insecurity caused by a
lack of guarantee of the possibility to buy on the international
market the required quantities of grains.
If one essays to find the reasons for this state of things, one
observes that in the 1970's the influence of changes in the
volume of the world grain crops in the situation on the interna-
tional market has increased greatly. This occurence is linked
with the expansion of the geographical area of the grain trade,
to include countries with large market potentials, the agricul-
ture of which at the same time is particularly susceptible to
climatic variations of frequently subject to natural disasters,
such as floods, droughts etc.
- 159 -
In this situation even small changes in the global volume of the
grain crops, have serious repercussions. They result in fluctua-
tions of the turnover volume, rapid changes in the demand-supply
ratio and leaps of prices. The experiences of the years 1972/73-
1975/76 have shown that the occurence of poor crops in the
principal production regions may lead to a situation when it
is impossible to cover the import demand for grains because of
a lack of supply.
At the same time, recently, to natural factors which have always
to some extent influenced the market situation, new elements have
been added. The insecurity situations as to the possibilities and
economic conditions of grain purchases, which add to the
nervousness of the grain trade participants and the growing
speculation are magnified namely by:
firstly, the discussed previously, difficult to foresee, while
recently more and more frequent changes in the national grain
policies of the leading grain producers and exporters as well
as other participants of the grain trade.
secondly, we are faced with repeating and growing in importance
practices by some of the exporting countries aimed at achieving
specific political effects on the international scene. This
concerns particularly the United States in which the consequent
administrations have declared officially food trade and food aid
as a political weapon. Food trade is used to excert pressures
on the food importing countries, accompanied, when required by the
whole system of legal and financial measures, including formal
embargoes, which secure control over the volume and directions
of the geography of the exports. These activities lead to a
desintegration of the global market and exert a strongly desta-
bilizing incluence. The experience of the 1980 and 1981 shows
that particularly extensive are the effects in this respect of
the recently frequently employed embargo and restrictions of
other type.
- 160 -
II
4. The complex nature of the links of the grain-feed-livestock
sector in Polish agriculture with the international grain markets,
resulting from the core of the concept of solving the grain problem
in Poland, presumed some years ago, mean in effect, that the
shaping of the fundamental proportions of the national grain
balance remains in close connection with the developments on the
world market.
The conditions of the world grain market exert no influence on
the dimensions of the direct grain consumption. The wheat and
rye crops in Poland have always considerably exceeded their
utilization in production of grain products, and with the passing
of time this use represents a dropping share of the total grain
utilization. While it is true that since a long time ago wheat
is imported to Poland, but this is a characteristic substitution
import, since the quantity of this grain necessary to improve
the quality of the domestically produced flour varies between 1.0
to 1.5 million tons, of which 0.1 to 0.3 million tons is durum
and other hard wheats.
The situation is quite different when it comes to the feed use
of grains. The domestic production of grains and feedstuffs is
insufficient to cover the growing feed requirements of the live-
stock sector, which in turn must produce enough to meet the
domestic market needs and to secure at the same time the position
of an ewbn- cn the animal products'international markets. It is
also too low in comparison with the processing capacities of
Polish agriculture. 'Ihese considerations generally were the reason
why in fact it was in the second half of the 1950's the concept
of self-sufficiency in grains was given up. The idea then was
to increase grain imports, while deve1oping exports of animal
products. Since then, the dimensions of grain utilization for feed,
and what follows the size of animal production, became dependent
on the dynamics of exports prof itability and the access to the
- 161 -
markets where animal products could be located and on the
other hand by the possibilities of grain and feedstuffs import.
During the last 25 years, exept for the five year period 1966-1970,
the scale of grain imports was increasing. In the years 1955-1965
with an increased flow of imported grains, from about 1.75 million
tons per annum in the 1956-1960 period to about 2.7 million tons
in the 1961-1965 period. Poland became an important exporter of
meat, meat products, poultry, eggs and dairy products to interna-
tional markets, particularly to the developed countries. The
exports of animal origin products which has bound, according to
estimates, about 50 % of the imported grains and feedstuffs,
constituted over 60 % of the dimensions of Polish agricultural
and food products exports. The surplus of convertible currencies
thus obtained became one of the principal sources for the
financing of imports of investment goods for the needs of the
industrialization of the country.
The size of the grain imports reached its peak in the second
half of the 1970's.Since the domestic production of grains in this
period dropped, compared to the years 1971-1975 by about 7 %,
reaching a low 19.5 million tons, then the imports reached the
level of 6.8 million tons per annum / this including maize and
sorghum /. This was twice the size of imports in the previous
five year period and threefold more than in the second half of
the 1960's. In these conditions the importance of imports in the
use of grains in feeding increased considerably. It is estimated
that in the beginning of the 1970's the imports covered up to
20 % of the total grain used for feed, then in 1975 this share
increased to 30 % and in 1980 it already exceeded 40 %. This was
accompanied by the dropping level of grain self-sufficiency.
In the years 1976-1980 the index of domestic grain supply to the
total reguirements was about 74 %, while in the 1971-1975 period
this was 85 % and in the years 1966-1970 90 % respectively.
- 162 -
5. The experience of the 1970's shows that maintaining in a long
run the size of grain imports at this high level results in a far
reaching dependence of the livestock production on the supplies
of grains and feedstuffs from abroad is neither possible nor
desired.
This dependence is no longer possible especially in the light of
the deteriorating economic conditions of purchasing grains on the
international markets. The realization of such a great scale of
grain imports results, first of all, in the problem of the
growing costs of it, which must be covered by exports returns.
Some idea of the effects of the growing import prices and their
influence on the outlays connected with the grain imports is
presented by the following figures. According to statistics
provided by the Polish Central Statistical Office GUS to total
outlays for the grain imports / excluding high protein feedstuffs
amounted to 17.8 billion exchange zloty, that is 5.78 billion US
dollars. This sum was twofold higher than the value of the
imported grains calculated in 1970 prices, which means in effect
that one half of the outlays borne was the result of the growth
of prices paid in imports. To complete the picture, let us add,
that in 1981 grain imports valued 4.59 billion exchange zloty /
equivalent of 1.38 billion US dollars / constituted about 47 %
of the total value of the food and agricultural imports and almost
9 % of Poland's total imports. In 1971 the foreign currency outlays
for grain imports amounted to 804 million zloty / 201 million US
dollars / being the equivalent of 30 % of the total agricultural
and food imports and 3.8 % of the total imports.
On the other hand the growing prices paid for the imported grains
have magnified the effect observed in Polish agriculture, that
the growing use of grains in animal production caused the growth
of the foreign currency costs involved in it, which of course did
not remain without effect on the profitability of the exports of
the animal origin products. While it is true that the growing
- 163 -
prices of the imported grains were accompanied by growing prices
obtained in the exports of the animal oriin products, nevertheless
it is estimated, that the prices of animal products are growing
rather slowly, compared to the prices of grains. As effect,
the Polish exports are loosing their purchasing power due to the
deteriorating terms of trade.
Similar effects as those above also result from the today narrowing
down possibilities of placing animal products on the international
markets. It becomes more difficult to balance the costs of grain
imports with these animal products exports, the market for which
is constrained by the extended recession, protectionist policies
in the developed countries etc. As effect of the above in the
1970's the import quotas alloted to Poland were decreased,
concerning a number of important Polish export products, among
these being bacon and young slaughter cattle. Nothing seems to
indicate at present that the situation in this respect will
undergo changes soon.
Together with the domestic considerations / such as a demand
pressure on the domestic meat products market in Poland / which
in important manner influenced the export supply potential,
the previously discussed factors were determinant, that in
contrast with the former periods, when the import-export
transactions would bring a considerable hard currency surplus,
in the 1970's the balancing of grain imports costs with revenues
from meat product exports was no longer possible. Already in the
final years of the period 1971-1975 a deficit was registered in
the trade in grains and feedstuffs and livestock products, which
in the consequent years became permanent. The ensuing deficit
in the food and agricultural products trade was an important
element shaping the general foreign trade deficit and debt
situation in Poland.
- 164 -
The difficulties in this respect / i.e. the balancing of foreign
currency outlays for grain imports / are additionally aggravated
by the fact that the remaining CMEA countries also experience
deficits in their national grain balances thus the potential
supply from these markets is presently minimum. This is important
since in respect to these markets Poland could balance its trade
with exports of industrial goods. It was in the beginning of the
1970's decade that these countries were an important supplier of
grains to Poland, particularly USSR, covering about 70 % of the
Polish requirements for grain imports. By the end of the decade
this share dropped to 5 %, while the principal supplier became
the United States/ 41 % of the total grain imports, in this
23 % of the wheat and 54 % of the coarse grains imports / as well
as Canada and France.
The limiting of grain imports, and in a further perspective the
achievement of self-sufficiency in grain production becames a
necessity when faced with progressing political influences on the
grain trade. The developments in recent years, casus of the USSR
in 1980 and Poland 1981, have supplied more than required proof
to confirm the thesis that self-sufficiency in grain production
and more broadly in food production are the real foundation for
economic and political sovereignity of a country.
May 1983, Warszawa.

- 165 -
Seppo Koivula
FINNISH STATE GRANARY
THE POSITION OF FINNISH STATE GRANARY IN THE GRAIN
POLICY IN FINLAND
I The position and facilities of Finnish State Granary
Finnish State Granary (Valtion Viljavarasto) is an organisation
acting under Ministry of Agriculture. The basic role and
activities of the company are determined in a separate law
on State Granary, which was renewed in 1980. The company,
itself, had its 50-years celebration a few years ago.
In order to perform the functions put forward by the government,
State Granary has a separate fund outside state budget. Because
State Granary has the obligation to act on business principles,
this fund can be accumulated mainly through the returns of the
business activities, or if this is not sufficient by borrowing
from the domestic capital market or hopefully, by receiving assets
from the state budget. State Granary owns and operates the suo
and reserve stock capacity. The total grain stocking capacity
owned by State Granary was at the end of 1982 936 000 metric
tons in 17 different locations throughout the country. There are
three port silos: Naantali, Helsinki and Rauma, others are
situated inland. Some have been built at the connection of flour
mills. The main import and export silo is situated at Naantali
with a storage capacity of 200 000 tons for bulk grain. Because
of the limitation of the draft Naantali can receive vessels up to
abt 30 000 metric tons. The amount of personnel of the whole
company was at the same time 348.
State Granary operates under the supervision of Ministry of
Agriculture and Forestry and has its own Board of Directors
representing different interest groups: Ministry of Agriculture
- 166 -
and Forestry, Ministry of Finance, Board of Agriculture,
producers, consumers, flour mills, army etc. The managing
director of State Granary acts as a chairman of the Board.
There are six different depautments performing different functions
in the company.
II The functions and activities of the State Granary
The national food security requires a reasonable rate of self-
sufficiency in basic food commodities, which are produced in
relatively unfavourable climatic and geographical conditions.
Also the relatively big agricultural labour force and the very
important aspects of regional and employment policies concerning
northern and eastern Finland must be taken into account in the
national agricultural policy. This reguires a certain degree of
import protection. The main objective of the agricultural produc-
tion policy, at present, is an attainment of a better balance
between agricultural production and domestic consumption.
The general agricultural policy and conditions are, of course,
the backround for the existence of the State Granary, its
position and activities.
Most of the functions performed by the State Granary are
included in a separately law on State Granary. In addition to,
what is stated in this law, government may give additional tasks.
The different functions and obligations to be performed by
the State Granary are as follows:
1. The important and central function is the obligation to hold
reserve and stabilization stocks of grain and grain seeds and
to make sure that there is always in all circumstances enough
grain in the country to meet the consumption needs. Government
confirms each year the minimum reserve stock level. For the

- 167 -
current crop year 1982/83 this minimum level is 233 000 tons
of bread grain (wheat and rye). This reserve is planned to be
increased by 1987 to 400 000 tons equalling to one year's
commercial consumption of bread grains (100 000 tons of rye
and 300 000 tons of wheat).
For the feed grain there is currently no fixed reserve stock
level, but the target is to build up by 1987 another 400 000 metric
tons reserve in feed grains (barley and oats), equalling to half
a year's commercial consumption.
Because of the difficulties experienced in the seed grain production
and due to the fact, that the imported seed varieties, have very
often proved to be unsatisfactory in our conditions, the reserve
stocks for seed grains are planned to be increased to 100 000
metric tons equalling to one year's commercial consumption. Current
minimum level for seed grain stocks is 20 000 tons.
The basic principle is, that increase of stocks should originate
from domestic production. In early eighties build-up of stocks
has not been possible due to very bad harvest especially in
crop year 1981/82.
The reserve and stabilization stocks can be considered to be
necessary in a country, like Finland, who has had very big
fluctuations in the production from year to year. There is also
a confirmed reserve stock level for certain other agricultural
commodities, f.i. grass seeds. Presently this reserve consists
of 1 200 tons of timothy seed. In practice there is also
a reserve stock for peas, although no exact minimum stock level
has been confirmed.
The reserve stocks of grain and other products are owned by
the State Granary. Most of them are stored in elevators owned
by the State Granary. Out of grain reserves 23 000 tons can be
stored on farms and the grass seed is stored by the private trade.
- 168 -
The second and as well a very important function of State
Granary is stabilization of domestic grain prices through buying
and selling in the domestic grain market or alternatively by
exporting or importing grain.
2.1. Domestic grain trade. The State Granary has the oblication
to buy ali surplus grain offered by farmers by the end of each
crop year at a price confirmed annually by the government.
Its market share differs of course, from year to year, but tends
to he about 25-30 %. State Granary buys through the domestic co-
operatives and independent whole-sale corporations and sells to
the milling and compounding industry.
2.2. Foreign grain trade. In certain vears foreign grain exchange -
either imports or exports - has been a very important instrument in
stabilizing the domestic grain market. Because of this and because
of the fact, that domestic grain prices differ substantially from
the international grain prices, the foreign trade of basic grains
has been concentrated on the government agency, State Granary,
which has necessary facilities to handle large amounts of grain
and is able to make the necessary co-ordination of export and
import measures. Import and export decisions are made by the
government and the Board of Marketing.
Because of the great fluctuations in production and trade pattern
part of the "unnecessary exchange" is planned to he compensated
through reserve stocks, although the financial implications are
still to he reviewed.
In addition to its commercial activity in the grain market
State Granary has also been addressed the obligation to supervise
and control the domestic grain trade. This function is mainly
carried out through the suo personnel in different locations
of the country.

_ 169 -
State Granary should also look after, that the grain produc-
tion has the right distribution in the country in regard to the
climatic and soil conditions. The possibilities to affect this
target are limited, because State Granary is not able to decide
the most important tool in this respect: the price and price
relations of different grain. However, certain preliminary and
subsidiary measures are carried out by the State Granary. These
include f.i. payment of acreage subsidies, after the government
has decided the amount of payment.
The State Granary was originally established to supply grain
and other food-stuff to state institutions and this function
still exists, although it is no more the central role of the
company.
State Granary is not directly involved in the processing
of grain, although it has its own seed handling facilities,
where seed grain is cleaned, certified and packed. The marketing
to the farms is carried out through domestic grain trade. To some
extent State Granary is also involved in the export and import
of seed grains.
In addition to the functions described above State Granary
performs grain research and testing through its research
laboratories, represents the country in differents international
occasions including FAO and International Wheat Council,
co-operates with the Ministry of Foreign Affairs in food aid
questions etc.
Altogether it can be stated, that Finnish State Granary does
play an active role in the grain marketing structure in Finland
and other matters related to grain.
- 170 -
Voitto Koskenmäki
RAISIO FACTORIES
GRAIN AND FEED TRADE IN FINLAND
1. Structure of grain consumption, changes and new areas
Background and structure of consumption. The national grain
market in Finland has changed very much after the second world
war. However, the development has been nearly the same in ali
European countries. In Finland, I suppose, the increasing of
commercial grain has been one of the strongest developments,
because the structure in the milling industry changed very much
at the same time as farmers' own consumption decreased roughly.
(Figures la-c). We can easily understand the rationalization and
development in the milling industry, if we compare the number
of mills in 1950, what was about one hundred, and today we have
only seven enterprises working on milling industry, and only
the biggest ones have several milling units. We have to say that
it is the new technology, which has made it Possible for this
to happen, and it is no suprise to anybody, if I tell you
that in Sweden they had made a survey, which came to the result,
that only one milling unit would he enough for the whole Swedish
market. Anyway, we haven't got that far in Finland, but our
milling enterprises are pretty big ones, and we believe, they are
big enough to develop new products of grain and to introduce
them effectively to the consumers.
Changes of bread grain consumption. As we all know very well,
the Finnish market is relatively well protected against the
foreign competition on the grain branch, like most today,
European countries today, including the Common Market.
Although it is a fact, that it is not easy to import grain
products or meal to Finland, we have to compete in the market
all the time against other products and other services, which
are continuously offered to the consumer. We can fully agree with

- 171 -
the Pillosophy that if we stop promoting grain products and bread,
we will very soon lose the market to other foodstuffs, and the
consumption level shall dive down. Maybe it is just strong
promotion and advertising for grain products what has kept the
consumption per capita on the fixed level during the last ten
years. (Figure 2). If we compare the development in other countries
in Europe during the same period, we can very easily find out that
the consumption level has dropped in most of the countries and
now averages 83 kg per capita. If we still compare Finland
to the countries, which have similar standard of living, we
can find outthat for instance in Sweden they are now trying to
stabilize the bread and grain consumption on a level, which
is very much (abt. 10 kg/capita) lower than the Finnish level is.
I have talked that long about the consumption and it's deve-
lopment, because the consumption is the basis of the market
for farming, for milling, and for marketing. I also want to
underline that as difficult as it is to import the grain pro-
ducts to Finland, it is as difficult to export them.
Milling and bakery industry is very clearly limited to the
domestic circles in Finland.
The total milling quantity of rye is todav abt. 100 000 tons
a year, and quantity of wheat is abt. 290 000 tons a year.
When we realize the consumption level Per capita and the number
of consumers, which doesn't change at ali nowadays, we can
understand that the grain market of wheat and rye is nearly
the same from the year to year. Additionally I have to mention
that so called "technical use" of wheat, for example starch,
is increasing in Finland rouqhly. For these purposes we are using
about 40-50 000 tons of wheat a vear.
Feed grain. On the feed grain section the situation is
completely different. The consumption of animal feed has increased
roughly during the whole 1970's. (Figure 3). The feeding of animals
itself has changed a lot. Especially in milk production we are
- 172 -
using more feed grain today than it used to be ten years ago.
Also the quantity of animal production has increased especially
in pork production. But if we think of the development during the
next five years, we don't believe the increase of feed
consumption shall continue the same. Instead of increasing
we expect that the market to slightly decrease because of
rough limitation of animal production through our agricultural
policy. One reason for the structural development on feed
branch has been specializatimby farmers. Some of them have
specialized to grow grain, and some of them to animal produc-
tion, milk, pork, meat or eggs. That means that still smaller
quantities of feed grain are consumed on the farms themselves,
but the grain comes to the commercial market and goes to the
consumption in the form of compound feed. If we look at statis-
tics we will find that the quantity of commercial feed grain
used for compound feed has increased surinq the last ten years
from 280 000 tons to 900 000 tons. Roughly we can say that the
quantity has doubled.
On the feed branch there has been found also totally new uses
for grain: considerable quantities of grain are nowadays used
for compound feed for fur-bearing animals and fish. This utili-
zation was not even considered thirty years ago.
The most remarkable new area in utilization of grain is the
technical and chemical grain processing areas. The chemical
fraction of grain ingredients and their utilization areas have
been developed, and this development work has opened quite new
areas for grain. This development work has at the same time
opened the international view and market to the Finnish grain
branch. In our country this new thinking is now leading to a
remarkable production, that also compensates for import especially
in our starch supply.
- 173 -
2. Structure of grain trade
We can most easily study the structure of the Finnish grain
market through the attached picture. (Figure 4). There are
about four hundred retail shops in the market, which are in-
volved in the commercial grain business. Most of them are
members in the bigger country-wide marketing chains, of which
three are co-operative ones. The industrial processing (mill-
ing, compounding, packaging, marketing) is run through seven
milling enterprises and six feed factories, of which some are
working both the milling and on the compound feed sections.
The grain itself is ofter delivered directly from the farm
to the mill, but also stored by a retail shopkeeper in his
small local granary. Mills and feed factories have the majority
commercial grain stores in the country, about 600 000 tons.
The retail shops and central firms themselves don't store the
grain very much, but they have a remarkable storing capacity
also, about 300 300 tons. The main responsibility for storing
grain in the country is on the State Granary, which has the
storing capacity nearly as big as the commercial capacity
altogether. The State Granary also has an exclusive right
to import or export grain as we already during the seminar
have studied. So, if the mill or feed factory needs grain, it
can buy it directly from the market through central firms and
retailers or, in some cases, also directly from the farmers,
or from the State Granary, which is responsible to import, if
there is not enough grain in the country. When the mills and
feed factories cannot buy ali the grain what is offered in the
market, the State Granary is obliged to buy it and to store it
for the following years, or, in case the national storage
level is high enough, to export the grain to the world market.
- 174 -
3. Legislation and regulation of grain trade
The acting of the State Granary is based on a special law
given in the latest renewed fann31.12.1980, and this law is an
important part of the regulating system of the grain market in
Finland. (Figure 5). But the grain trade itself is still reu-
lated by another law, "the law on grain trade", given in 1972 and
renewed in 1978. This law guarantees to the farmer very good
security and rights to make claims if he thinks the analysis
of grain is not made by the official way etc. etc. For the
farmer it is very important to get guarantee of analysis of
his grain because the variation of the quality is very strong
in the Finnish weather conditions. The basis price of the
grain is given by the government, basing again on the negotia-
tion results between government and farmers' union, and this
basis price is so called target price. The variation around
the target price level in Finland is rather little, most of
variation comes from the quality pricing system.
The supervising of the law belongs to the ministry of agri-
culture, who has given practical control work to the State
Granary. The personnel making the grain analysis, taking samp-
les, and so on, must he qualified through a certain examina-
tion based on the law. The State Granary's central laboratory
has a right to accept the equipment in the laboratories and
time to time the State Granary controls the condition of
equipment and the analysis methods as well as the punctuality
of the analysis. Also based on the law, the ministry of agri-
culture has given out the orders how to declare the analysis
results and price setting factors to the farmer in order to
make it easier for farmer to understand pricing lists and
compare them between each. After the orders, the buyer who has
bought the grain and taken the sample and made an analysis of
the grain, has to store the double sample for two weeks after
the date when the analysis result has been given to the far-
mer. This is in order to give the farmer possibility to make
his complaint, if he wants to.
- 175 -
4. Production and trade of special cereals
Malting barley. Finland can with a good reason be mentioned as
a pioneer in the world asfar as production of malting barley concerned.
(Figure 6). We produce malting barley on the contract basis, which
is less used in other remarkable producer countries. This means
that the Finnish malt can always be made of pure varieties of
barley. On the other hand, we have to admit that without speci-
alized production it has not been possible for us to achieve
barley to meet the high germination and other quality demands
in our country for malting purposes.
The cultivation of malting barley is a special area of grain
business in our country, and without purposeful work Finland
would even now buy malting barley from Central Europe. Instead
of it Finland is even capable to export malt to the world market,
and Finnish malt is desired as well in the East as in the West,
thanks to the high quality. However, Finland's selfsupport of
malting barley needs continuous care and also security storing.
Last autumn we had a very good crop of malting barley, and in this
kind of situations export is very important to balance the produc-
tion, otherwise the continuous and steady maintenance of this
special area would not be possible.
Oilseeds. Cultivation of oilseeds is a production area, which
doesn't belong to grain business in the narrowest sense of the
word. Anyway, the cultivation of oilseeds uses the same production
resources as grain, and because it's effect on our food chain is
of great importance both in feed and food support, it is
reasonable to examine oilseed production as a part of our grain
business.
The oilseed production in Finland was started in 1950 by Oy
Kasviöljy, which belongs to Raision Tehtaat. (Figure 7). Until
the mid 1970's only winter turnip rape varieties were culti-
- 176 -
vated. After that cultivation concentrated on production of
spring varieties, expecially spring rape and spring turnip
rape. At the same time the production has strongly increased,
our self-support being now of remarkable weight: in regard to
vegetable oils Finland is fully self-supporting in net quan-
tity, and in regard to oil cakes an meal abt. 40 % of the
demand is covered from the domestic production. As far as vegetable
oils is concernedthedeveloping work of oil quality is not ready
so far, and we must change part of rape oil into foreign oils,
which better meet the demands of feed industry. Furthermore,
according to the newest examinations, rape oil is
suitable even as fuel for agricultural tractors, which is a
thing worth mentioning, if we think,for example, of crisis condi-
tions.
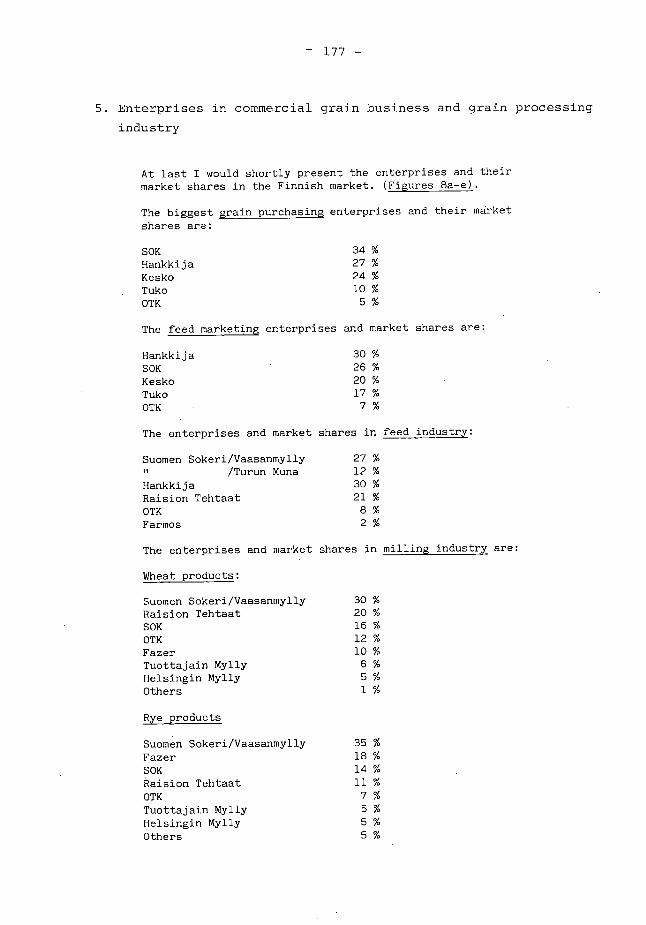
- 177 -
5. Enterprises in commercial grain business and grain processing
industry
At last I would shortly present the enterprises and their market shares in the Finnish market. (Figures 8a-e).
The biggest grain purchasing enterprises and their market shares are:
SOK 34% Hankkija 27 % Kesko 24 % Tuko 10 % OTK 5%
The feed marketing enterprises and market shares are:
Hankkija 30 % SOK 26% Kesko 20 % Tuko 17 % OTK 7%
The enterprises and market shares in feed industry:
Suomen Sokeri/Vaasanmylly 27 % /Turun Muna 12 %
Hankkija 30 % Raision Tehtaat 21 % OTK 8% Farmos 2 %
The enterprises and market shares in milling industry are:
Wheat products:
Suomen Sokeri/Vaasanmylly 30 % Raision Tehtaat 20 % SOK 16% OTK 12% Fazer 10 % Tuottajain Mylly 6 % Helsingin Mylly 5 % Others 1 %
Rye products
Suomen Sokeri/Vaasanmylly 35 % Fazer 18 % SOK 14% Raision Tehtaat 11 % OTK 7% Tuottajain Mylly 5 % Helsingin Mylly 5 % Others 5 %
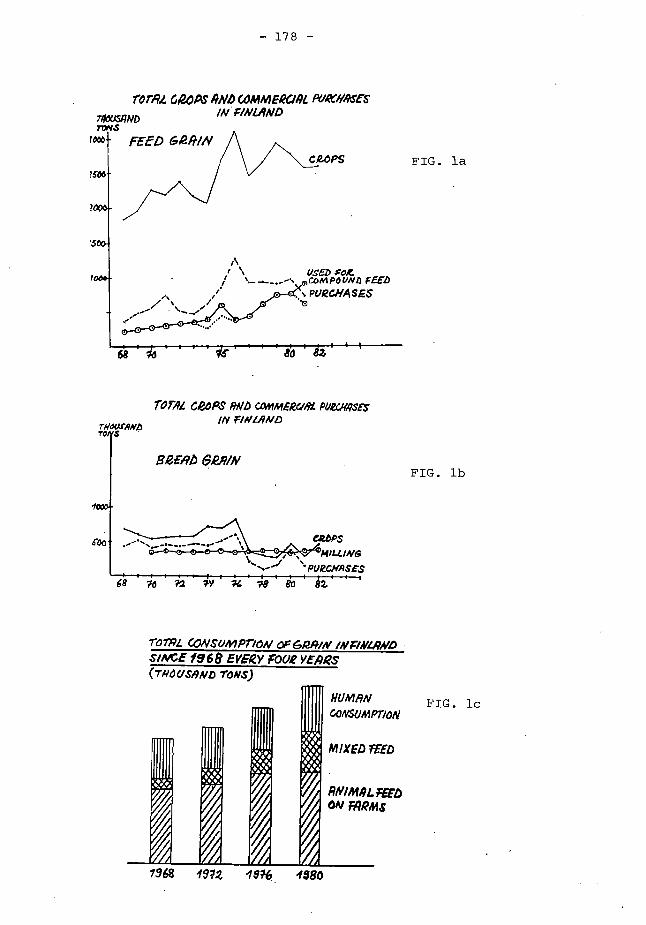
- 178 -
7" Go2OPS. AND COMMERCIRL PI/kWASES' //V FINLAND nousgmo
nwS te% FEEL) 6,2~
FIG. la ?StS6
\ /
•
-\ "•••
US'ED CoM130 UNI) FEEL) PURCHASES
rorAz CP,OPS COnIMERcl« rgatu'ibvp IN
TO S
68 1d dd
CP-DPS MILLING
PURCHASES "?8 13.0 82 68 10 ?2
Ref,9A ePA/N FIG. lb
TOML GONSUMPTION OF 61249/N mirmizn,v4 • suvcE 1968 EVERY FoUR vEARs (rmousrmo roms)
NUM« GONSOMPTION
MIXEDfEED
ANIMALTin ON FARMs
FIG. lc
1968 191.2 1916 1980
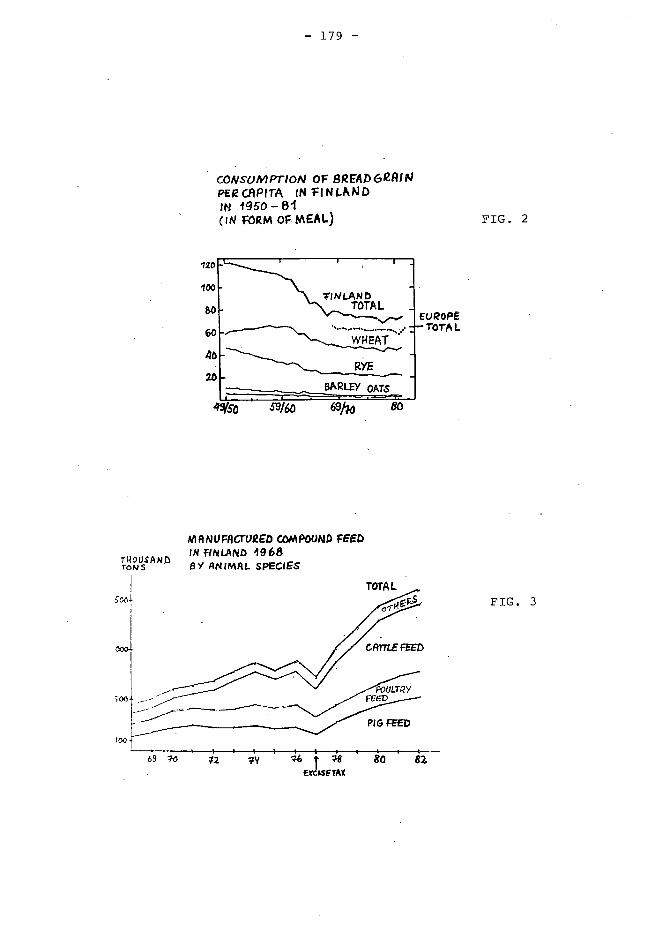
PIG FEED
12 16 1 80 82 ucisErAx
— 179 —
CONSuMPTION OF 8READ62RiAl PER CAPITA lN FINLAND 1N 1O-81 (IN FORM OF MEAL)
FIG. 2
7-140U.SAND rom 5
MANURICTUREDCOMPOUNDFEED ft< FINLAND 4968 BY ANIMAL SPECIES
FIG. 3
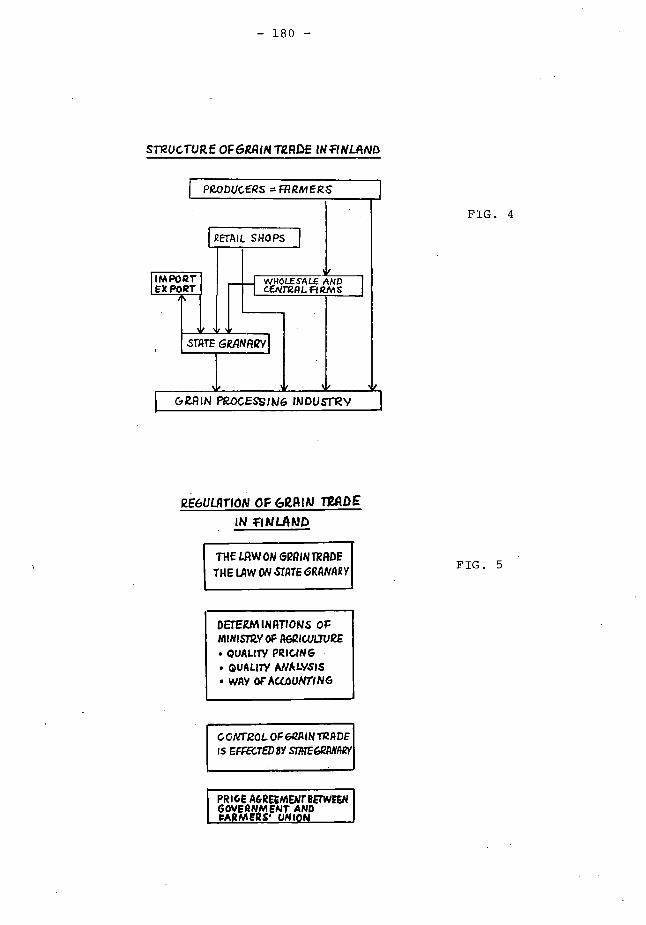
imPoRT Ex PoRT
WHOLESALE AND c£KnZALFfiaMS
LzETAIL SHOPS
STATE GRANRRY
— 180 —
STRUCTURE OF6R.RlNTRDE IN NLAND
PR.oDucERs = fkMERS
cieniN PROCESSING INDUSTRY
FIG . 4
REGULRTION OF &LAIN TRADE IN ;INLAAID
THE LRW ON GRRINTRRDE THE LAW ON STATE 6AANARY
FIG . 5
DETER.M [NATIONS oF muNisTRY OF FIGRICULTURE
QuAL11Y PRiuNG QuALtrY ANALYSIS WAY OFACCoUNTING
CONTROL OF GRAIN TRADE is EFFECTEDBY sutibbeAMY
PRICE A&REEMENT'BETWEEN GOvERNm ENT AND FAAMERS• UNION
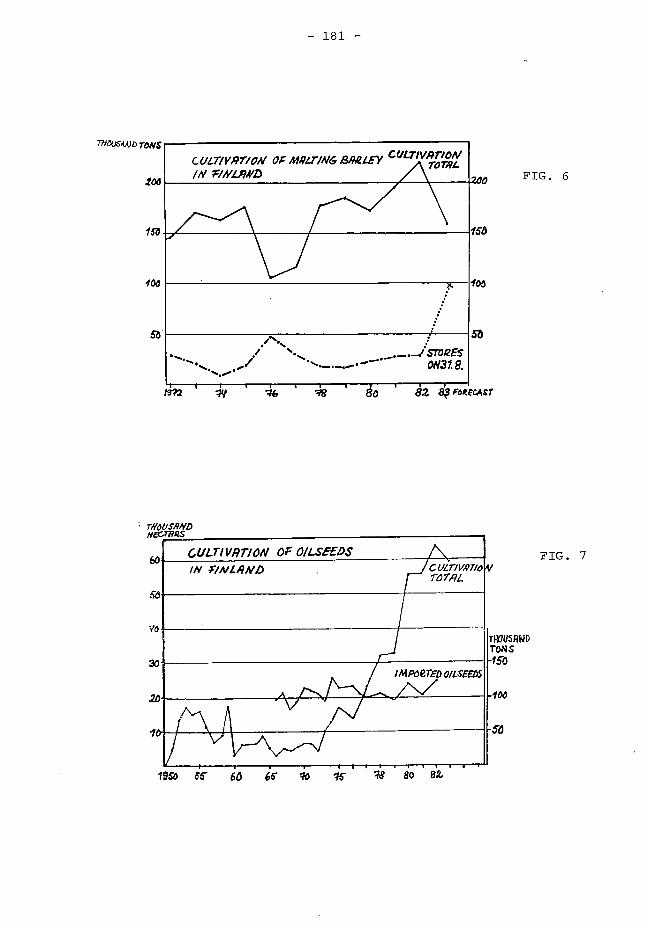
cucrlygrio,v cT 4147zrim6 imairv CCILTIVAMAI 70779L /N F/AIL9.1113
).• • ;•
I I ,. ..,
' / -... .... ..,..
."., ••••..,. „._.,..... ...... _.--
. . —.1 .5700N3RzE 85 .
77/&s4A.ID Tms
165
160
100
0 FIG. 6
150
ioo
51)
4.,•,...
CULT1VRTION OF OILSEEDS 1N PAILAND C uLTIV/Mo
7'07:9 Z.
I MPoeTED m6E05
1950 65 60 66•10 1 5- 1 8 80 az
V
.2[
FIG. 7
TROUSIIND TONs 150
100
50
- 181 -
1992 19 16 «98 8.2 .949 FoxEcArr
' rI/ou.SRND
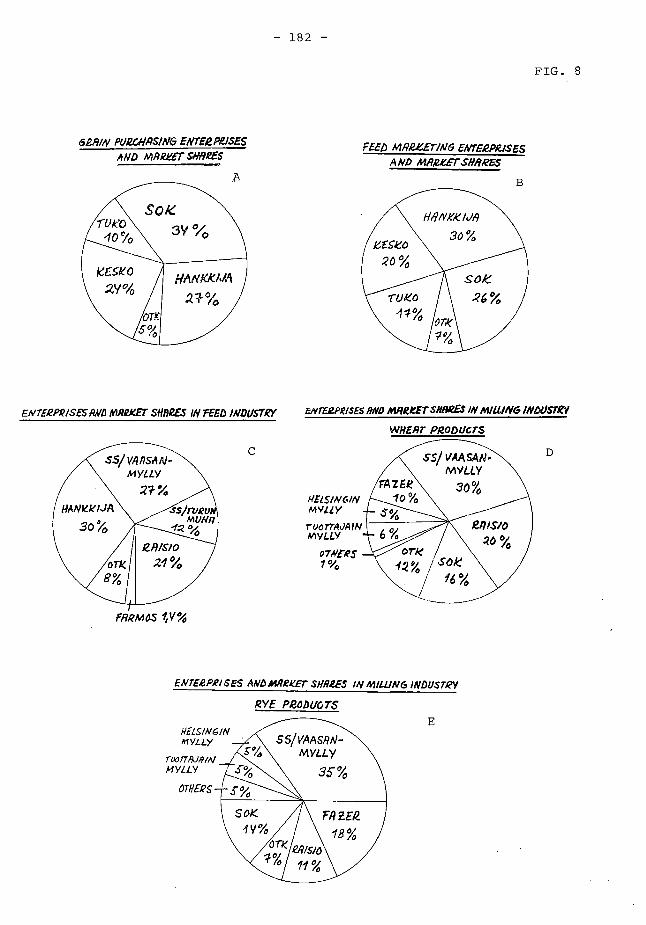
HELSINGIN ft1VL/..
ruorMRIAI MYLLY
OTIIERS
S VAASRN-MYLLY
35- %
SOK 1 V%
- 182 -
FIG. 8
6ZAIN ENTE2P£1SES AND mAREr smes FEED MREZErIN6 ENTERPRISES
AND MAR.ILETSNARES
ENTEEPRISES AND NWRXET SHARES INFEED INDUSTRY
FARMOS 1/ 11%
ENTERPRIsES RAD MARkET ~Ra Hy *IMUA% INDUSTRY
WHEAT PRODUCTS
35/ VAASAN-MYLLY
FAZER 30% WELSINGIN 10% MYLLY S % roorTAJAIN /LP/S/0 MYLLY 6
oTNI-R5 101 ori< %
7 0/0 1.294 1SÖk 16%
ENTEePRiSES AND AWKET SNR1E3 MILLIN& INDUSTRY
RYE PRODUOTS
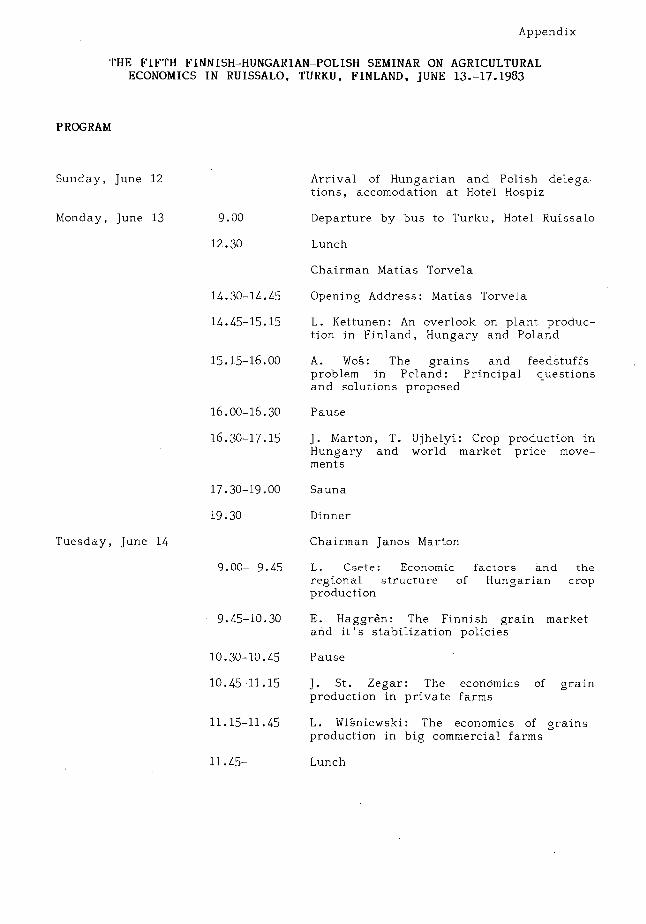
Appendix
THE FIFTH FINNISH-HUNGARIAN-POLISH SEMINAR ON AGRICULTURAL ECONOMICS IN RUISSALO, TURKU, FINLAND, JUNE 13.-17.1983
PROGRAM
Sunday, , June 12 Arrival of Hungarian and Polish delega- tions , accomodation at Hotel Hospiz
Monday, , June 13 9.00 Departure by bus to Turku, Hotel Ruissalo
12.30 Lunch
Chairman Matias Torvela
14.30-14.45 Opening Address : Matias Torvela
14.45-15.15 L. Kettunen: An overlook on plant produc- tion in Finland, Hungary and Poland
15.15-16.00 A. The grains and feedstuffs problem in Pcland: Principal questions and solutions proposed
16.00-16.30 Pause
16.30-17.15 J. Marton, T. Ujhelyi : Crop production in Hungary and world market price move-ments
Tuesday, , June 14
17.30-19.00 Sauna
19.30 Dinner
Chairman Janos Marton
9.00- 9.45 L. Csete: Economic factors and the regional structure of Hungarian crop production
9.45-10.30 E. Haggren : The Finnish grain market and it ' s stabilization policies
10.30-10.45 Pause
10.45-11.15 J. St . Zegar : The economics of grain production in private farms
11.15-11.45 L. Winiewski: The economics of grains production in big commercial farms
11.45- Lunch

Chairman Augustyn Ihro
Wednesday, June 15
Thursday, June 16
Friday, June 17
13.00-13.30 E. Szöllösi: Income situation of wheat and maize production
13.30-14.00 B. Gulbicka: The grains and feedstuffs problem in small area peasant farms
14.00-14.30 H. Järvelä: The economic results of grain production in South-Finland
15.00- Sightseeing in Turku
18.30 Dinner
Chairman Tamas Ujhelyi
9.00- 9.30 Zs. Role of new producer/foreign trade relations in the expansion of foreign trade
9.30-10.00 M. Kisiel: Recent developments on the international grains markets and their implications for the grains balance in Polish agriculture
10.00-10.15 Pause
10.15-11.00 S. Koivula: The position of Finnish state granary in the grain policy in Finland
11.00-11.45 V. Koskenmäki: Grain and feed trade in Finland
11.45 Lunch
13.15 Departure by bus to Raisio, visit at Raisio Factories Sauna, dinner
c.a. 22.00 Arrival to Hotel
9.00-10.00 Directors meeting
Chairman Lauri Kettunen
10.00-11.00 Closing session; general discussion
11.30- Lunch
14.00 Departure to Helsinki
c.a. 17.00 Arrival at Helsinki
11.15- Departure to Valtion Viljavarasto (Finnish state granary) Lunch
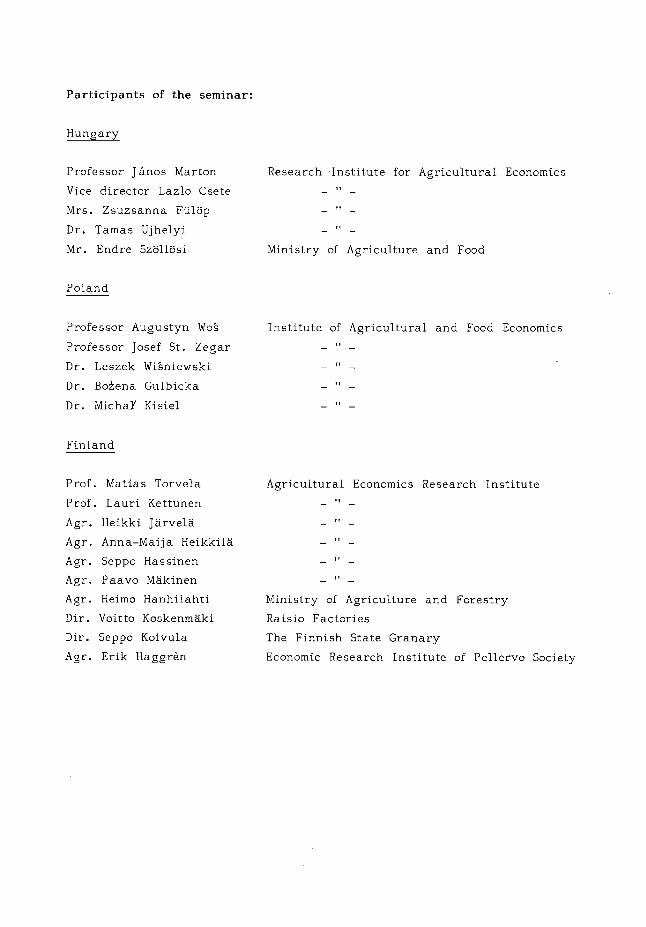
Participants of the seminar:
Hungary
Professor jånos Marton
Vice director Lazlo Csete
Mrs. Zsuzsanna Ftilöp
Dr. Tamas Ujhelyi
Mr. Endre Szöllösi
Poland
Professor Augustyn Woå
Professor Josef St. Zegar
Dr. Leszek Winiewski
Dr. Bo±ena Gulbicka
Dr. Michal/ Kisiel
Research Institute for Agricultural Economics
Ministry of Agriculture and Food
Institute of Agricultural and Food Economics
Finland
Prof. Matias Torvela
Prof. Lauri Kettunen
Agr. Heikki Järvelä
Agr. Anna-Maija Heikkilä
Agr. Seppo Hassinen
Agr. Paavo Mäkinen
Agr. Heimo Hanhilahti
Dir. Voitto Koskenmäki
Dir. Seppo Koivula
Agr. Erik Haggren
Agricultural Economics Research Institute
Ministry of Agriculture and Forestry
Raisio Factories
The Finnish State Granary
Economic Research Institute of Pellervo Society

ISBN 951-9202-03-X