Embed Size (px)
Citation preview
1
The Effect of Financial Derivatives Usages on Commercial
Banks Risk and Value: Evidence from European Markets
Chuang-Chang Chang, Keng-Yu Ho and Yu-Jen Hsiao*
Abstract
We use a new set of data containing European banks operating in 25 countries to analyze the effect of derivative use on measure of risk and value. We find that using derivatives does seem to increase banks’ risk. Further investigation reveals that the positive (negative) risk exposures are driven by banks that use of derivatives for trading (hedging), supporting the argument that derivatives can increase (reduce) banks’ risk if they are effectively used for trading (hedging) purpose. We also find significant evidence that the use of financial derivatives is positively associated with bank market value. Specially, we find trading purpose for banks mainly causes an increase in bank value, this differ from theories that suggest the decision to hedge is value increasing by non-financial firms.
Keywords: Commercial Banks; European Markets; Financial Derivatives.
JEL Classification: G15; G20; G21.
* Chuang-Chang Chang is at the Department of Finance, National Central University, Taiwan; Keng-Yu Ho is at the Department of Finance, National Taiwan University, Taiwan; Yu-Jen Hsiao is at the Department of Finance, National Dong Hwa University, Taiwan.
2
1. Introduction
The traditional role for banks has been perceived to be the reduction of transactions
costs and the provision of information. However, given the technological, information,
and financial innovations of the last decade, risk sharing and risk management are
increasingly being viewed as a major source of value creation in banking. Allen and
Santomero (1997) argue that these changes have increasingly shifted banks away from
their traditional activities. Instead, they suggest that banks are making increasing use
of financial markets to transfer, transform, and redistribute risk. Thus the financial
markets’ perception of bank activities has taken on increasing importance. Especially,
after global financial crisis in 2008, banks’ derivative activities have become
increasingly controversial1. In fact, the effect of derivative use on risk measure and
value is especially important in banking since banks dominate most derivative
markets.
However, the use of derivatives contracts by banks has increased in the past two
decades, the effect of derivatives on the risks and market value of banks is still
unknown. Despite more widely available data on derivatives usage, the evidence
obtained from empirical research on its effects is mixed2. One possible answer to such
contradictory results is whether banks use derivatives for trading or hedging purpose.
Previous studies have used data disclosed by all kinds of firms, including
non-financial firms and banks industries, been trying to improve our understanding of
1 For example, the US Federal Reserve Board Chairman Alan Greenspan argues that derivatives had contributed to the development of a “far more flexible, efficient and resilient financial system that existed just a quarter-century ago”, whereas in contrast, the noted US investor Warren Buffet, views derivatives as “time bombs for both the parties that deal in them and the economic system.” 2 For example, Peek and Rosengren (1997) provide evidence that the group of large banks in the derivative market includes a relatively high percentage of troubled institutions. In contrast, Hassan Karels and Peterson (1994) find that most of the off-balance-sheet banking activities including derivatives use are associated to decrease the risk exposure. Venkatachalam (1996) documents that notional amount of derivatives are negatively related to bank equity value. However, Riffe (1997) finds that the notional amounts of derivatives are positively related to bank equity.
3
how firms use derivatives.3 The identifying assumption in nearly all of this literature
has been that firms, including financial firms4, use derivatives for hedging. However,
Chernenko and Faulkender (2011) have demonstrated non-financial firms use
derivatives not only for hedging but also for speculation. In the practice, not to
mention for financial firms, banks’ involvement in the derivatives market has been
considerably asymmetric with respect to trading and hedging activities and banks
more likely to speculate with derivatives5. Therefore, the primary objective of this is
to empirically investigate whether bank’s purpose (trading or hedging) of using
derivatives is significantly related to their bank risk and value.
Although there are many empirical studies investigating the association between
derivatives activities and banks’ risk and value in the U.S. (for example, Hassan,
Karels and Peterson, 1994) and Venkatachalam, 1996)), to the best of our knowledge,
Not only there is no empirical study providing European market evidence6, which is
3 Examples include broad cross-sectional analyses such as Nance, Smith, and Smithson (1993), Mian (1996), Geczy, Minton, and Schrand (1997), Graham and Smith (1999), Barton (2001), Hentschel and Kothari (2001), Graham and Rogers (2002), DaDalt, Gay,and Nam (2002), Guay and Kothari (2003), Bartram, Bown and Fehle (2009), Bartram, Bown and Conrad (2011), and Chernenko and Faulkender (2011), as well as analyses in specific industries such as gold mining in Tufano (1996, 1998), Petersen and Thiagarajan (2000), the oil and gas industry in Haushalter (2000), Jin and Jorion (2006), MacKay and Moeller (2007), the air line industry in Carter, Rogers, and Simkins (2006), the mutual fund industry in Koski and Pontiff (1999), the hedge fund industry in Chen (2011), and banks in Hassan, Karels and Peterson (1994), and Venkatachalam (1996). 4 Due to deposit guarantees, security and regulations for the public, financial firms are more likely to focus on hedge. Whidbee and Wohar (1999) assumes that banks use derivatives do so primarily for the purpose of hedging the risk exposures that arise as a result of the asset-transformation functions they perform. Purnanadam (2007) analyze the determinants of interest rate hegdging in commercial banks. 5 U.S. banks with the top 5 largest derivatives portfolios hold 99.6 percent of their contracts for trading purposes, primarily customer service transactions, while the remaining 0.4 percent is held for their own risk management needs (OCC (2009)). Minton et al. (2009) find that in 2005 the gross national amount of credit derivatives held by banks exceeds the amount of loans on their books. Only 23 large banks out of 395 use credit derivatives and the most of their derivatives positions are held for dealer activities rather than for hedging of loans. The net notional amount of credit derivatives used for hedging of loans in 2005 represents less than 2% of the total national amount of credit derivatives held by banks and less than 2% of their loans. 6 Not only is Europe by far the most important region for derivatives, which have become a major part of the European financial services sector and a major direct and indirect contributor to economic growth, but it is also the most important region in the global derivatives market. The global OTC derivatives segment is mainly based in London. Many European banks are currently global leaders in derivatives. Furthermore, Goddard, Molyneux, Wilson and Tavakoli (2007) highlight a number of key recent developments in the academic literature on European banking
4
the most important region in the global derivative market7, but also our unique bank
data have exactly information on derivative usage across different underlying assets
for trading or hedging purposes, that is never used from previous related research.
Besides, further to the impact as a whole of derivatives use on risk exposure, the
separate effect of each type of derivatives has been recently researched.8 Thus we also
separately consider the impact of the using foreign exchange and interest rate
derivatives on the bank’s risk and bank value,
This paper fills the gap by empirically examine the effect of derivative usage on
bank’s risk and value. We use a new, unique raw dataset that includes 355 listed
commercial bank’s observations in 25 Europe countries. We are able to examine the
extent to which banks, either through their use of derivative with different underlying
assets for trading or hedging purpose defined by IFRS accounting rule, can mitigate a
market wide decline. The one important finding that emerges from the analyses is that
we find the level of derivatives activities is positively associated with bank risk.
Further investigation reveals that the positive (negative) risk exposures are driven by
banks that use of derivatives for trading (hedging), supporting the argument that
derivatives can increase (reduce) banks’ risk if they are effectively used for trading
(hedging) purpose.
The other key fining reports that banks increase in the use of derivatives
corresponds to greater bank market value, supporting the argument that banks are
more likely to speculate with derivatives. Nevertheless, we find significant evidence
7 With 44 per cent of the total global outstanding volume, the European derivatives market has a significantly higher share than its total share of equities or bonds; see Bank for International Settlements (2008) and World Federation of Exchanges (WFE) statistics (www.world-exchanges.org). 8 For example, Allaynnis and Weston (2001) find that firm value (as measured by Tobin’s q) is higher for U.S. firms with foreign exchange exposure that use foreign currency derivatives to hedge. Purnanandam (2007) suggests that a potential benefit of interest rate derivative usage comes from its ability to allow a commercial bank to maintain smooth operating policies in the event of external shocks. Unlike derivative non-user banks, the user banks may fewer (or no) adjustments to their on-balance sheet maturity GAPs and do not significantly cut their lending volume when the Fed tighten the money supply.
5
that the use of foreign exchange derivatives for trading (hedging) purpose is
significantly (insignificantly) and positively associated with bank value. Specially, for
interest rate derivative, banks use it not only for trading but also for hedging purpose
are significantly and positively associated with bank value. In other words, we find
trading purpose for banks mainly causes an increase in bank value, this differ from
theories that suggest the decision to hedge is value increasing by non-financial firms
but maintain the argument that banks are more likely to speculate with derivatives.
The remainder of this paper is organized as follows. Section 2 identifies the data
sources, defines the variables, and establishes the empirical methods used in this paper.
Section 3 presents our empirical results. Section 4 summarizes and concludes the
paper.
2 Data and Variable Definitions
2.1 Data
Until recently, data on derivative usage by banks outside of the world were disclosed
largely on a voluntary basis. A move toward common international Financial
Reporting Standards Resources (IFRS) means that it is now practical to study
international derivative use at the bank level. Because reporting standards can vary
within and across countries, we also conduct robust checks that restrict our sample to
those banks that comply with IFRS.
We obtain data on banks’ balance sheet and income statements from a
comprehensive database from the Bankscope database maintained by Fitch/IBCA/
Bureau Van Dijk, which provides a global database containing information on over
23,000 public and private banks. This panel data only includes commercial banks and
bank holding companies (BHCs). We use data from consolidated accounts if available
and otherwise from unconsolidated accounts to avoid double counting. The yearly
observations are matched with country-level factors in the corresponding year, and the
6
country profiles are specifically taken from the International Financial Statistics
database of the International Monetary Fund. The initial sample consists of 218 listed
European banks. We exclude banks that are foreign subsidiaries or branches,
which reduces our sample to 1,112 banks. We drop additional banks for assorted
reasons, an unreadable annual report or annual reports not containing “notes to the
Firm-level Statements; stock price data are not available in Datastream and have no
information on derivatives usage for trading or hedging purpose, resulting in a sample
of 355 observations in 25 countries in the European market9.
Base on our unique database, the derivatives that banks use for trading or
hedging can be mainly composed of six types of derivatives: (i) foreign exchange, (ii)
interest rate (iii) equity (iv) credit (v) commodity and (vi) other derivatives. We show
the number of banks derivatives separately for six types of derivatives from Table 1
reveals that foreign exchange derivatives are the most common and followed by
interest rate derivatives. Financial exposure of banks that engage in both domestic
banking activity and foreign exchange operations can be separated into two primary
categories: foreign exchange exposure and interest rate exposure. Such exposure can
have a significant impact on a bank’s financial performance (Mun and Morgan, 2003).
Therefore, in this paper, we only separately consider that the effect of using foreign
exchange and interest rate derivatives on the bank’s risk and value. Besides, we can
find that banks’ involvement in the derivatives market has been considerably
asymmetric with respect to trading and hedging activities. Simultaneously, compared
with the value of derivatives used for trading, the value of derivatives held by banks
for hedging is much smaller in our sample.
9 The dataset comprised of the following 25 countries: Austria, Belgium, Bulgaria, Czech Republic, Denmark, Finland, France, Germany, Greece, Hungary, Ireland, Italy, Lithuania, Norway, Poland, Portugal, Romania, Russian Federation, Slovakia, Slovenia, Spain, Sweden, Switzerland, Turkey, and the United Kingdom.
7
<Table 1 is inserted about here>
3.2 Variable Definitions
The following sub-sections define the dependent and independent variables used
in the empirical analyses in the present study.10
3.2.1 Dependent Variable: Bank Risk
While the risk of assets and liabilities contain different components and their
interactions are difficult to decompose, the assumption of efficient capital markets
suggests that net exposures can be estimated empirically using a bank’s stock price
as an aggregate measure of relevant information. Consequently, we follow Bartram,
Brown and Conrad (2011) to use the standard deviation of daily stock returns ( returnσ )
for each bank to measure the bank risk11.
3.2.2 Dependent Variable: Bank Value
The franchise value of a bank equals the present value of the current and future
profits that a bank is expected to earn. This can be proxied by Tobin’s Q ratio, the
ratio of the market value of the assets to the book value (Luc and Ross (2007)).
However, Tobin’s Q ratio has two potential shortcomings (De Jonghe, and Vennet
(2008))12. Therefore, we follow De Jonghe, and Vennet (2008) to use noise-adjusted
Tobin’s Q ratio ( NAQ ) as a measure of bank’s franchise valuation13.
3.2.3 Independent Variable
We employ the notional outstanding amounts of derivatives to capture the extent 10 In order to facilitate a quick overview on our explanatory variables, we provide for the variables that we used in other studies and ours in Appendix. 11 In addition, as further checks for robustness, we also carry out empirical analyses using market beta which is estimated by Sharp market model to measure the bank risk. The tenor of the results remains largely unchanged. 12 First shortcoming is that although economic theory assumes the maximization of shareholder value, bank managers may not maximize the value of the firm when there is separation between ownership and control. Second, measurement error and (bad) luck may have an effect on bank’s market valuation (Poterba (1988)). 13 For robustness, we also reassess and confirm the results using the Tobin’s Q to measure the bank’s value. For protectional purpose, we do not report these results in a table and the tenor of the results remains unchanged.
8
of derivative activities by banks in Europe. Following Bartram, Brown and Conrad
(2011), the usage of derivatives (DER) is measured by a binary variable14 as follows:
DERit =1 if Commercial bank i uses derivative at year tDERit = 0 if Commercial bank i does not use derivative at year t
3.2.4 Control Variables
In order to rule out the possible effects on bank value and risk from balance sheet
control variables. We follow the extent literatures to add a number of control variables.
Below, we describe the various controls that we use in our multivariate tests and the
theoretical reasons that led us to use them.
(a) Diversification
Diversification of activities within a single financial conglomerate could yield
economics of scope that boost valuations. Or, diversification of activities could
intensify agency problems and induce a discount in the valuation of financial
conglomerate. Thus, we follow Luc and Ross (2007) to construct two measures that
focus on diversification. Asset diversity (MAD) is a measure of diversification across
different types of assets and is calculated as
assets earning Totalassets) earningOther loans(Net 1 −
−
where other earning assets include securities and investments. Total earning assets is
the sum of net loans and other earning assets. MAD takes values between zero and one
with higher values indicating greater diversification.
Income diversity (MID) is a measure of diversification across different sources of
income and is calculated as
income operating Totalincome) operatingOther incomeinterst (Net 1 −
−
14 In our robust empirical models, we use the bank’s notional outstanding amounts of total derivatives, foreign exchange derivatives and interest rate derivatives respectively, scaled by the bank’s total assets, as continuous measures of the bank’s involvement in derivatives markets. Total derivatives include interest rate, foreign exchange, equity, commodity, credit and other derivatives. For protectional purpose, we do not report these results in a table and the tenor of the results remains unchanged.
9
Net interest income is interest income minus interest expense and other operating
income includes net fee income, net commission income, and net trading income.
Income diversity takes value between zero and one with higher values indicating
greater diversification. The MAD and MID measures are “complementary” in that
asset diversity is based on stock variables and income diversity is based on flow
variables.
(b) Bank Size
There is ambiguous evidence for banks as to whether size leads to higher
accounting profitability15. However, large banks are more likely to use derivatives
than are smaller banks (Sinkey and Carter (2000)). We use the natural logarithm of a
bank’s total asset (SIZE) to control for the effect of size.
(c) Profitability
A Profitable bank is likely to trade at a premium relative to a less profitable one.
Thus, if hedgers are more profitable, they will have higher bank value. To control for
profitability, we use return on equity (ROE), defined as the ratio of net income to total
equity, which is particularly important to shareholders and is related to the charter
value of a bank. Besides, Net interest margin (NIM) is a measure of intermediation
profitability before credit losses. It is calculated as net interest income (the difference
between total interest income and total interest expense) dividend by total assets. We
also included it as control variable.
(d) Financial Distress
Since higher capital (EQRAT) defined as the ratio of equity capital to total assets
and liquidity (LIQ) defined as the liquidity assets divided by total assets reduces banks
probability to distress, and thus, a lower value of risk; therefore, we included them as
15 See Mukherjee, Ray and Miller (2001) and Steve, Schaecj and Wolfe (2007) for arguments that large bank size leads a higher bank value and, inverse, see Bonaccorsi, Patti and Gobbi (2001) for arguments that large bank size leads a lower bank value.
10
control variables.
(e) Risk Exposure
In this study, given data availability, we employ total corporate and commercial
loans divided by total assets (CCLOAN) and non-interest income divided by total
income (NOMINT) as additional variables to proxy for on-balance sheet interest rate
risk. High interest rate reduces economic growth, hence, the volume of IPOs and
acquisitions decline, thereby reducing banks’ non-interest income. Thus, banks that
are more reliant on non-interest income should have more exposure to interest rate
risk. On the other hand, if banks have a high concentration of loans, which is
commonly repriced more often than once a year, they will have less exposure to
interest rate risk. We also control for credit risk proxied by RES which defined by loan
loss reserve divided by total assets. We also consider the natural logarithm of GDP
(LNGDP) to control different countries face different level of macroeconomic or
country risk (Bartram, Brown and Fehle (2009)).
4. Empirical Results
4.1 Summary Statistics
Table 2 presents summary statistics of the main variables that we use in our
article. The average ROE and NIM for the sample is 12.46% and 2.39%, which are
slightly smaller than US banks16, respectively.
<Table 2 is inserted about here>
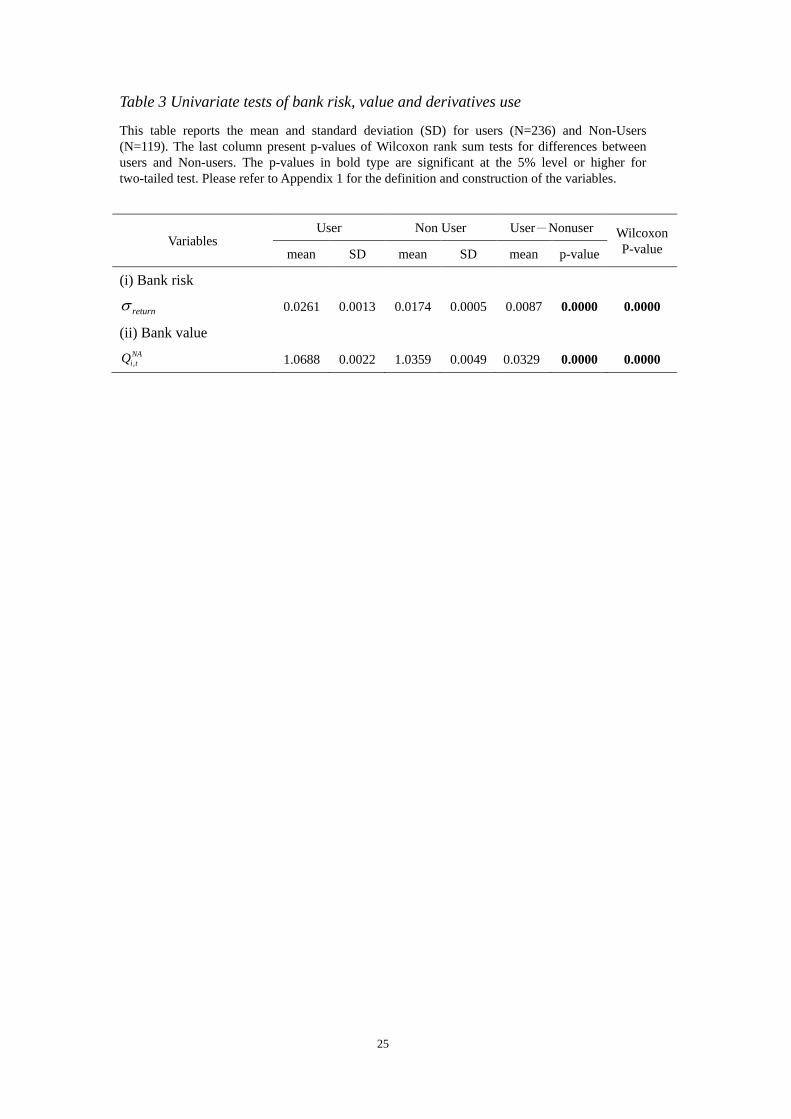
4.2 Univariate Results
To begin, we compare the simple average of bank risk and value in our sample
categorized by derivatives use.17 These results are presented in Table 3. We measure
16 The average ROE and NIM for the bank samples in US is 13.36% and 3.44% (see Minton, Stulz and Williamson (2009)). 17 In order to avoid selection bias problem in our study, we also follow Bartram, Brwon and Conrad (2011) to use propensity score matching method. For protectional purpose, we do not report these results in a table and the tenor of the results remains unchanged.

11
the significance of difference between the two types of banks using non-parametric
Wilcoxon tests. Table 3 reports the p-value of these tests together with the means,
medians and difference in means of bank characteristic for derivative users and
nonusers. The results in Table 3 only refer to general derivatives use and shows that
banks using derivatives have higher bank risk and value.
<Table 3 is inserted about here>
4.3 Panel Regression Analysis for the Whole Sample
To answer the question as to how effect of derivatives on bank risk and value, we
implement the panel regression with fixed effect and follow Peterson (2009) to
estimate standard error cluster by firm18. These relationships can be expressed as
follows:
(1) it12111098
76543210
εααααααααααααασ
+++++++++++++=
ititititit
itititititititireturn
LNGDPRESNOMINTCCLOANLIQEQRATNIMROELNTASSMIDMADDER
(2) it12111098
76543210
εααααααααααααα
+++++++++++++=
ititititit
itititititititiNAit
LNGDPRESNOMINTCCLOANLIQEQRATNIMROELNTASSMIDMADDERQ
When we consider the derivatives with the specific underlying asset in Equation
(1)-(2), DER will be replaced by related derivative variables, for example, if we want
to consider the effect of bank’s foreign exchange derivatives on their bank risk and
value, DER will be replaced by FEDER.
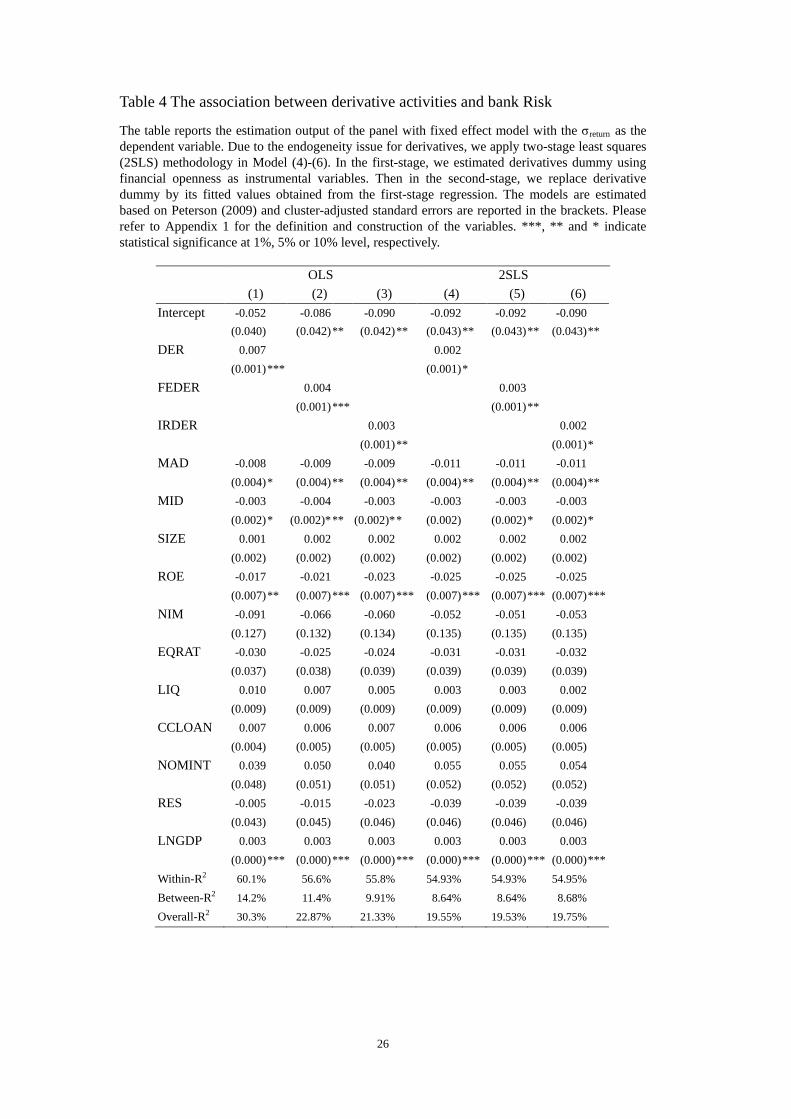
4.3.1 Bank Risk
In this section, we given one of primary focus of this study which is the impact
of financial derivatives usage on bank risk and the control variables serve to
compensate for any on- and off-balance sheet variable interactions. The results of the
panel regression model with fixed effect are shown in Table 4. We further
18 The Hausman test is the standard procedure used in empirical panel data analysis in order to discriminate between the fixed effects and random effects model. Based on our Hausman test result, p-value of 0.000, the panel regression model with the estimation of fixed effects is more suitable than a model with the estimation of random effects.
12
disaggregate DER (model (1)) into FEDER (model (2)) and IRDER (model (3)) to
examine if bank use different underlying asset of derivatives reduce or increase bank
risk exposure.
The results in model (1)-(3) indicate that there is a significantly positive
relationship, between DER and bank risk, suggesting that the level of derivatives
activities in banks is associated with an increase in bank risk exposure.
<Table 4 is inserted about here>
We also note that DER may be endogenous variable in Equation (1). To correct
for such endogeniety issue, we estimate our regression model using the two-stage
least squares (2SLS) methodology. Specifically, in the first-stage regression, we
estimate DER using financial openness (OPENNESS)19 as instrumental variables.
Then in the second-stage regressions, we replace DER by its fitted values obtained
from the first-stage regression.20 However, the results in model (4)-(6), there is a less
significantly positive relationship between DER and bank risk exposure.21
Furthermore, in order to examine whether the effect of using derivatives for the
trading or hedging purpose with different underlying assets on bank’s risk, we
separately run panel regression by bank’s purpose and disaggregate DER into FEDER
and IRDER related. Table 5 presents four separate panel regression models. For
FXDER, the results, show that using equity or foreign exchange derivatives for
trading (model (1) in Table 5) (hedging (model (2) in Table 5)) purpose can increase
(decrease) bank risk, remain weak consistently. This finding is consistent with Rogers
and Sinkey (1999) and The Economist (2002)’s arguments22. The results, model (3) in
19 The OPENNESS variable used in this study is taken from Chinn and Ito (2008), which is available at http://web.pdx.edu/~ito/. 20 We do not report the full details of the first-stage regression. However, they are available upon request. 21 Due to brevity, we report only main results for the analyses in later subsections. The 2SLS regression results, being qualitatively similar, are available upon request. 22 Derivatives can reduce banks’ risk if they are effectively used for hedging purposes or meeting
13
Table 5, indicate that there is positive relationship between TIRDER and bank risk.
However, there is a significantly negative relationship between HIRDER and bank
risk exposure (model (4) in Table 5), suggesting that using IR derivatives for trading
(hedging) purpose can increase (decrease) bank risk.23
<Table 5 is inserted about here>
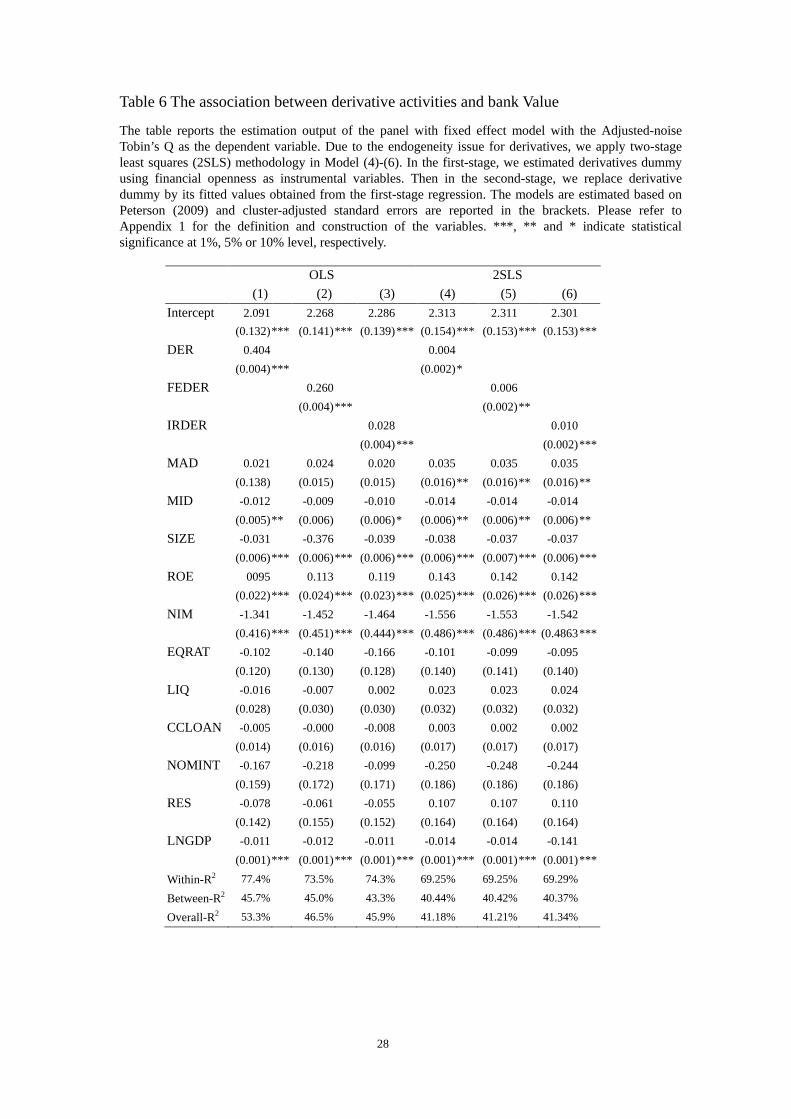
4.3.2 Bank Value
In this section, we given the other of primary focus of this study which is the
impact of financial derivatives usage on bank value and the control variables serve to
compensate for any on- and off-balance sheet variable interactions. The results of the
panel regression model with fixed effect are shown in Table 6. Similar to the
sub-section of bank risk considered, we still disaggregate DER (Model (1)) into
FEDER and IRDER to examine if the use of, FEDER (Model (2)) and IRDER (Model
(3)) reduces or increase bank’s value.
Model (1)-(3) in Table 6 shows the results of the fixed-effect panel regression
model. We find a positive and significant (p-value <0.1) relationship between
derivative uses and bank value for banks with exposure. This result supporting the
argument banks are more likely to speculate with derivatives. To correct for such
endogeniety issue in equation (2), we also estimate our regression model using the
two-stage least squares (2SLS) methodology. However, the results in model (4)-(6), ,
remain weak consistently.
<Table 6 is inserted about here>
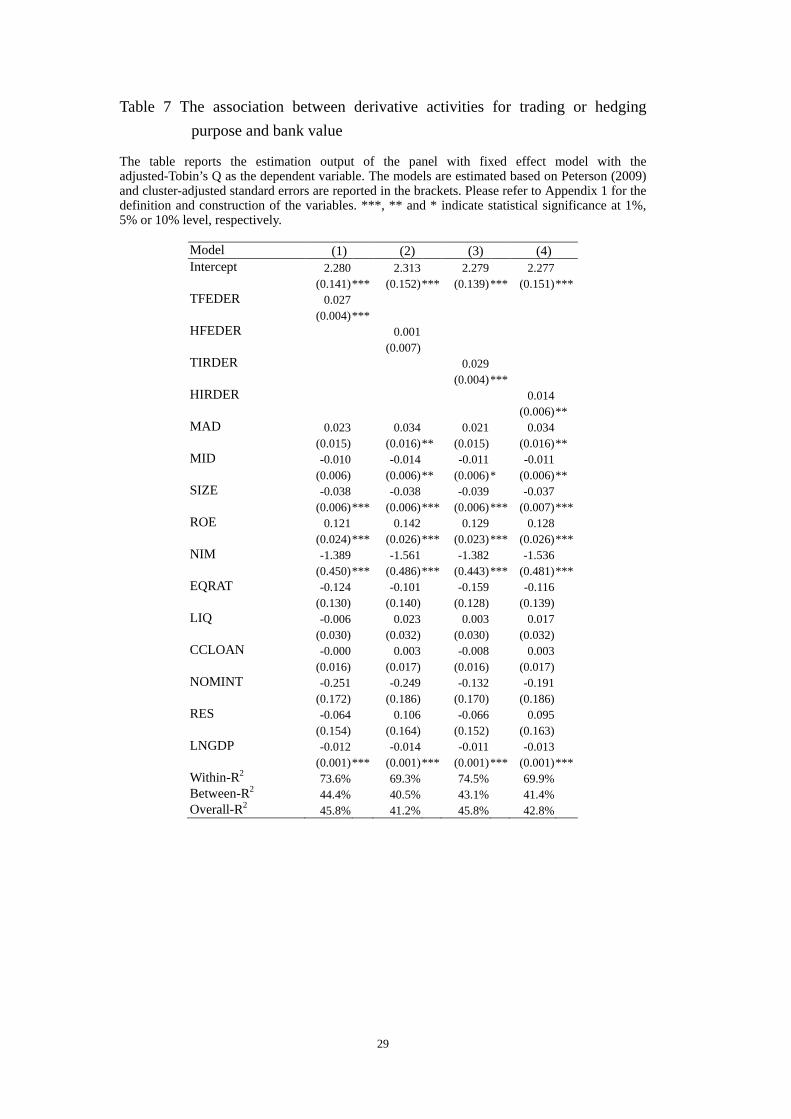
In order to perform further tests to examine whether hedging or trading purpose
for banks mainly causes an increase in bank value, Table 7 reports the effect of using
customers’ needs (Rogers and Sinkey (1999)). If banks use derivatives for trading purpose, derivative activities can increase banks’ risk (The Economist (2002)). 23 For robustness test, we also exclude 172 bank-year observations that simultaneously use derivatives for hedging purpose and trading purpose as defined by the IFRS accounting rule. For protectional purpose, we do not report these results in a table and the tenor of the results remains unchanged.
14
derivatives with different underlying assets for trading or hedging purpose on bank
value. We find significant evidence that the use of foreign exchange (model (1) in
Table 7) derivatives for trading purpose is significantly and positively associated with
bank value. Specially, for interest rate derivative (model (3) and (4) in Table 7), banks
use it not only for trading but also for hedging purpose are significantly and positively
associated with bank value. In other words, we find trading purpose for banks mainly
causes an increase in bank value, this differ from theories that suggest the decision to
hedge is value increasing by non-financial firms.24
According to modern finance theory, the link between derivative usage and firm
value depends on the extent to which their use effectively addresses market
imperfections such taxes, distress costs and agency costs, resulting in a potential
effect on firm value.25 If the manager’s wealth is a concave function of firm value, the
manager will tend to hedge as much as possible because his wealth will be higher
when firm value is hedged relative to his expected wealth for the unhedged firm value
(for example, Smith and Stulz (1985) and Nance, Smith and Smithson (1993)).
However, if the manager’s wealth is a convex function of firm value, like bank
industry, the manager faces a trade-off between expected wealth and the risk of that
wealth. The other way can increase firm value is by reducing the likelihood of
financial distress. As noted by Sinkey and Carter (2000), however, the notion that risk
management reduces the costs of financial distress may not apply to banking
institutions. Because of federal deposit guarantees, bank are not apply to the same
market discipline as other firms, and as such, they not benefit from hedging to the
same extent as nonfinancial firms.26
24 For robustness test, we also exclude 172 bank-year observations that simultaneously use derivatives for hedging purpose and trading purpose as defined by the IFRS accounting rule. For protectional purpose, we do not report these results in a table and the tenor of the results remains unchanged. 25 For example, Smith and Stulz (1985); Stulz (1990) and Nance, Smith and Smithson (1993). 26 In other words, deposit insurance mat mitigate some of the costs of financial distress because the
15
In conclusion, in the banking industry, the payoff to equity holders is more
convex then in other industries. Because of the very high leverage of banks and the
risk-shifting opportunities provided by deposit insurance, equity holders in banks face
a convex payoff. This is especially true when banks are poorly capitalized. Equity in
any firm can be viewed as a call option on the assets of the firm (Black and Scholes
(1973)) and deposit insurance provides a subsidy to bank owners in the form of the
put option (Merton (1977); Ronn and Verma (1986)). Risk taking by the bank
increases the value of both options.
<Table 7 is inserted about here>
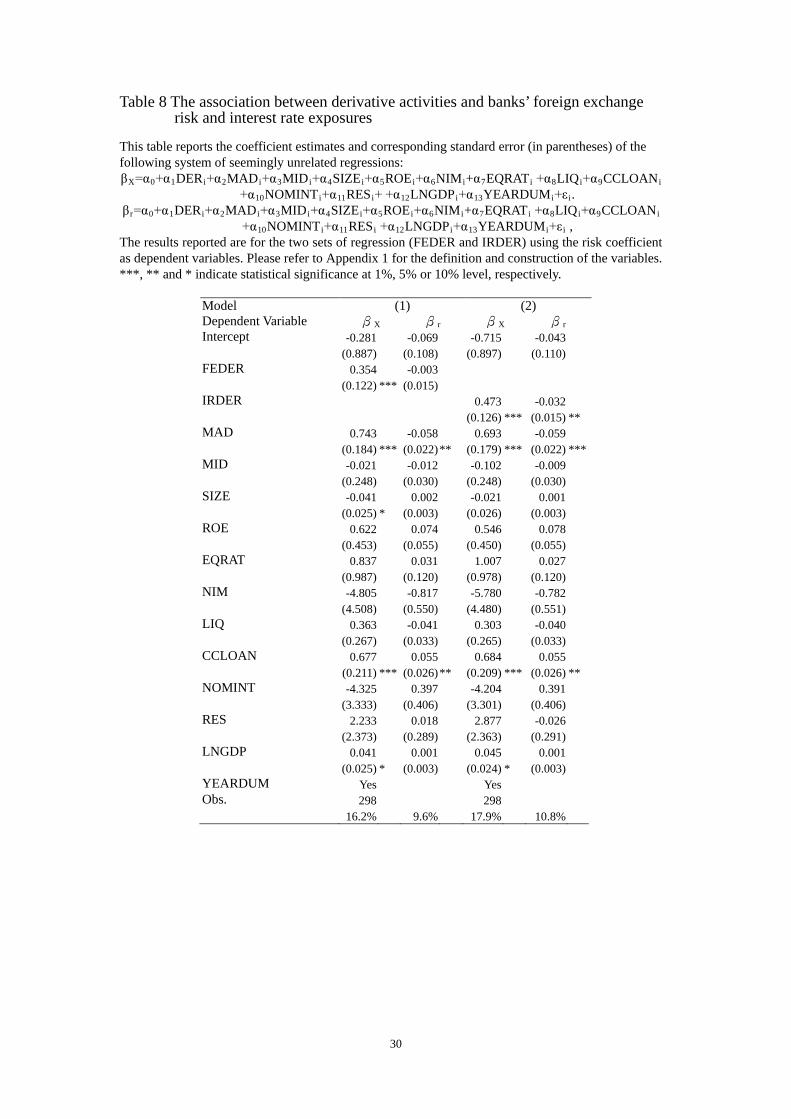
4.4 Seemingly Unrelated Regressions Analysis for the Whole Sample
In order to examine the extent to which banks, either through their use of
derivative with different underlying assets for trading or hedging purpose, can
mitigate a market wide decline. We follow Reichert and Shyu (2003); Au Yong, Faff
and Chalmers(2009) and Pathan (2009) methodology, the market, foreign exchange and
interest rate exposure betas are estimated for each sample bank as follows:
itrjtrtxjtxtmtmtitit uSRRR ++++= βββα (3)
where itR is the monthly return on bank stock i during time period t; mtβ , mtR are
the market beta and the monthly return on the local market index at time t; xtβ , xjtR
are the foreign exchange beta and the monthly return on a foreign exchange, measures
in US dollars per unit of foreign currencies, for country j at time t; rtβ , rjtS are the
interest rate beta and the monthly difference between lending and deposit rate in
country j at time t; itα , itu are constant and random error terms, respectively.27
FDIC bears most of these costs. 27 In the section, local market index and exchange rate are collected from the Datastream database and monthly lending and deposit rate are taken from International Financial Statistics (IFS) database by IMF. However, we can’t get the monthly lending and deposit rate in four countries, including Austria, Bulgaria, Slovakia and Turkey, from IFS.
16
The stage two cross-sectional regressions hypothesizes that foreign exchange and
interest rate betas, estimated from equation (3), are a function of both off-balance
sheet derivatives and traditional on-balance sheet banking activities as follows:
i131211109
876543210
εααααααααααααααβ
++++++++++++++=
iiiii
iiiiiiiix
YEARDUMLNGDPRESNOMINTCCLOANLIQEQRATNIMROELNTASSMIDMADDER
(4) i131211109
876543210
εααααααααααααααβ
++++++++++++++=
iiiii
iiiiiiiir
YEARDUMLNGDPRESNOMINTCCLOANLIQEQRATNIMROELNTASSMIDMADDER
where Year dummy i (YEARDUM) is a binary variable that take the value of one if
data belongs to year i and zero otherwise. Equation (4) is estimated as a system of
seemingly unrelated regressions (SUR). There are two main types of derivatives
include foreign exchange, and interest rate that we concerned. When we consider the
derivatives with the specific underlying asset in Equation (4), DER will be replaced
by related derivative variables, for example if we want to consider the effect of bank’s
foreign exchange derivatives on their foreign exchange betas, DER will be replaced
by FEDER. By linking the bank’s beta xβ and rβ , we are also able to distinguish
between trading and hedging derivatives positions. Using this approach we are able to
conclude that banks that have exposed betas do appear to trade or hedge with
derivatives.
<Table 8 is inserted about here>
Table 8 reports the results for two models of SUR regressions. The results shows
that there is a significantly positive (p < 0.001) relationship between FEDER (IRDER)
and bank’s foreign exchange (interest rate) exposure, suggesting that the level of
foreign exchange (interest rate) derivatives activities in banks is associated with an
increase in foreign exchange (interest rate) exposure.
<Table 9 is inserted about here>
Furthermore, in order to examine whether the effect of using derivatives for the
trading (model (1) and (2) in Table 9) or hedging (model (3) and (4) in Table 9)
17
purpose with different underlying assets on bank’s risk, we separately run SUR
regression by bank’s purpose and disaggregate DER into FEDER and IRDER related.
The results for model (1) and (2) in Table 9, indicate that there is significantly positive
(negative) relationship between TFEDER (TIRDER) and bank’s foreign exchange
(interest rate) beta. Nevertheless, there is also a negative (positive) (model (3) and (4)
in Table 9), although not significantly, relationship between HFEDER (HIRDER) and
bank’s foreign exchange (interest rate) beta. These findings are also consistent with
previous findings in this paper.
5. Conclusion
In this paper, we use a new set of data containing European banks operating in 25
countries to analyze the effect of derivative use on measure of risk and value. For the
univariate test, we find that derivative usage is more prevalent in banks with higher
exposures to bank risk and bank value. In multivariate regression for bank risk, the
use of derivatives does seem to increase European banks risk. A possible explanation
for this finding is that banks may use derivatives to speculate risk changes or bank’s
derivative trading activities may have exposed them to risk changes that are not
effectively hedged. Further investigation revealed that the use of derivatives for
hedging does seem to decrease European banks’ risk, supporting the argument that
derivatives can increase (reduce) banks’ risk if they are effectively used for trading
(hedging) purposes.
Using adjusted-noise Tobin’s Q as an approximation for bank market value, we
find significant evidence that the use of derivatives is positively associated with bank
market value. Specially, we find trading purpose for banks mainly causes an increase
in bank value. This finding supporting the argument banks are more likely to
speculate with derivatives and this differ from theories that suggest the decision to
18
hedge is value increasing by non-financial firms. Equity in any firm can be viewed as
a call option on the assets of the firm (Black and Scholes (1973)) and deposit
insurance provides a subsidy to bank owners in the form of the put option (Merton
(1977); Ronn and Verma (1986)). Risk taking by the bank increases the value of both
options. The higher bank value is also accompanied by greater risk.
Our findings will be particularly useful in addressing regulatory concerns
regarding the risk effect of derivative usage. That is, regulator should continues to
encourage better management of banks’ internal control system and /or greater
derivative disclosure to impose market discipline on banks to ensure that there is no
unwarranted risk taking. Such actions would help reduce the likelihood and
magnitude of banking losses and probability of banking system collapse, like global
final crisis in 2008.
References
Allayannis, G., and Weston, J. P., 2001. The Use of Foreign Currency Derivatives and Firm Market Value. Review of Financial Studies 14, 243-276.
Allen, F., and Sanatomero, A., 1997. The theory of financial intermediation. Journal of Banking and Finance 21, 1461-1485.
Au Yong, H. H., Faff, R., and Chalmers, K., 2009. Derivatives activities and Asia- Pacific banks’ interest rate and exchange rate exposures. Int. Fin. Markets, Inst. and Money 19, 16-32.
Bank for International Settlements (2008), Quarterly Review March 2008 – Statistical Annex.
Barton, J., 2001. Does the use of financial derivatives affect earnings management decisions? The Accounting Review 71(1), 1-26.
Bartram, S. M., Brown, G. W., and Conrad, J., 2011. The Effects of Derivatives on Firm Risk and Value. Journal of Financial and Quantitative Analysis, 46, 967-999..
Bartram, S. M., Brown, G. W., and Fehle, E. R., 2009. International Evidence on Financial Derivative Usage. Financial Management, 38(1), 185-206.
19
Black, F., and Scholes, M., 1973. The Pricing of options and corporate liabilities. Journal of Political Economy 81, 637-654.
Bonaccorsi, E., Patti, D., and Gobbi, G., 2001. The changing structure of local credit Markets: Are small businesses special? Journal of Banking and Finance 25, 2209-2237.
Carter, D. A., Rogers, D. A., and Simkins, B. J., 2006. Does Hedging Affect Firm Value? Evidence from the US Airline Industry. Financial Management 35:1, 53-86.
Chernenko, S., and Faulkender, M., 2011. The Two Sides of Derivatives Usage: Hedging and Speculative with Interest Rate Swaps. Journal of Financial and Quantitative Analysis 46, 1727-1754.’
Chen, Y., 2011. Derivatives Use and Risk Taking: Evidence from the Hedge Fund Industry. Journal of Financial and Quantitative Analysis, 46, 1073-1106.
Chinn, M., and Ito, H., 2008. A New Measure of Financial Openness. Journal of Comparative Policy Analysis: Research and Practice 10(3), 309-322.
DaDalt, P., Gay, G., and Nam, J., 2002. Asymmetric information and corporate derivatives use. Journal of Futures Markets 22, 241-267.
De Jonghe, O., and Vennet, V., R., 2008. Competition versus efficiency: What drives franchise values in European banking? Journal of Banking & Finance 32, 1820-1835.
Geczy, C., Minton, B., and Schrand C.,1997. Why Firms Use Currency Derivatives. Journal of Finance 52, 1323-1354.
Goddard, J., Molyneux, P., Wilson, J. O.S., Tavakoli, M., 2007. European banking: An overview. Journal of Banking & Finance 31, 1911-1935.
Graham, J., and Smith C., 1999. Tax Incentives to Hedge. Journal of Finance 54, 2241-2263.
Graham, J. and Rogers, D. A., 2002. Do Firms Hedge in Response to Tax Incentives? Journal of Finance 57:2, 815-840.
Guay, W., and Kothari, S. P., 2003. How Much Do Firms Hedge with Derivatives? Journal of Financial Economics 70, 423-461.
Hassan, M. K., Karels, G. V., and Peterson, M. O., 1994. Deposit insurance, market discipline and off-balance sheet banking risk of large US Commercial banks. Journal of Banking and Finance 18, 575-593.
Haushalter, D., 2000. Financing Policy, Basis Risk, and Corporate Hedging: Evidence from Oil and Gas Producers. Journal of Finance 55, 107-152.
20
Hentschel, L., and Kothari, S. P., 2001. Are corporations reducing or taking risks with derivatives? Journal of Financial and Quantitative Analysis 36, 93-118.
Jin, Y., and Jorion, P., 2006. Firm Value and Hedging: Evidence from U.S. Oil and Gas Producers. Journal of Finance 61, 893-919.
Koski, J., and Pontiff, J., 1999. How are derivatives used? Evidence from the mutual fund industry. Journal of Finance 54, 791-816.
Luc, L., and Ross, L., 2007. Is there a diversification discount in financial conglomerates? Journal of Financial Economics 85, 331-367.
Mackay, P., and Moeller, S., 2007. The value of Corporate Risk Management. Journal of Finance 62:3, 1379-1419.
Merton, R. C., 1977. An analytic derivation of the cost of deposit insurance and loan guarantees: An application of modern option pricing theory. Journal of Banking and Finance 1, 3-11.
Mukherjee, K., Ray, S. C., and Miller, S. M., 2001. Productivity growth in large US commercial banks: The initial post-deregulation experience. Journal of Banking and Finance 25, 913-939.
Mun, K. C., and Morgan, G. E., 2003. Bank foreign exchange and interest rate risk management : simultaneous versus separate hedging strategies. Journal of Financial Intermediation 12, 277-297.
Mian, S., 1996. Evidence on Corporate Hedging Policy. Journal of Financial and Quantitative Analysis 31, 419-439.
Minton, B. A., Stulz, R., and Williamson, R., (2009), ‘How Much Do Banks Use Credit Derivatives to Hedge Loans?’ Journal of Financial Services Research 35, 1-31.
Nance, D. R., Smith, C. W. Jr., and Smithson, C. W., 1993 .On the Determinants of Corporate Hedging. Journal of Finance 48, 267-284.
OCC (Office of Comptroller of Currency Administrators of National Banks), 2009, OCC Bank Derivative Report Fourth Quarter.
Pathan, S., 2009. Strong boards, CEO power and bank risk-taking. Journal of Banking and Finance 33, 1340-1350.
Peek, J., and Rosengren, E., 1997. Derivatives activity at troubled banks. Journal of Financial Services Research 12, 287-302.
21
Petersen, M. A., 2009. Estimating Standard Errors in Financial Panel Data Sets: Comparing Approaches. Reviews of Financial Studies 22, 435-480.
Petersen, M., and Thiagarajan, S., 2000. Risk Measurement and Hedging: With and Without Derivatives. Financial Management 29, 5-30.
Poterba, James M., 1988. Comments on Fazzari, Hubbard and Petersen. Brookings Papers on Economic Activity, 200-204.
Purnanandam, A., 2007. Interest rate derivatives at commercial banks: An empirical investigation. Journal of Monetary Economics 54, 1769-1808.
Reichert, A. and Shyu, Y., 2003. Derivative activities and the risk of international banks: A market index and VaR approach. International Review of Financial Analysis 12, 489-511.
Riffe, S., 1997. The Valuation of Off-Balance sheet Financial Instrument Disclosure in The Banking Industry, In B. Schachter (ed.) Derivatives, Regulation and Banking: Advances in Finance, Investment and Banking Services. Amsterdam :North-Holland, 93-121.
Rogers, K., and Sinkey Jr. J.F., 1999. An analysis of non-traditional activities at US
commercial banks. Review of Financial Economics 8, 25-39.
Ronn, E. I., and Verma, A. K., 1986. Pricing risk adjusted deposit insurance: An option based model. Journal of Finance 41, 871-896.
Sinkey, Jr., J.F., and Carter, D.A., 2000. Evidence on the financial characteristics of banks that do and do not use derivatives, The Quarterly Review of Economics and Finance 40, 431-449.
Smith, C. W., and Stulz, R., 1985. The determinants of firm’s hedging policies. Journal of Financial and Quantitative Analysis 20, 391-405.
Stulz, R., 1990. Managerial discretion and optimal financing policies. Journal of Financial Economics 26, 3-27.
Steve, M., Schaeck, K., and Wolfe, S., 2007. Small European Banks: Benefits from Diversification? Journal of Banking and Finance 31, 1975-1998.
The Economist, 2002. Free lunch, for now: Japanese banks and their interest-rate swaps. The Economist 364 (8286), 57.
Tufano, P., 1996. Who Manages Risk? An Empirical Examination of the Risk management Practices in the Gold mining Industry. Journal of Finance 51:4, 1097-1137.
Tufano, P., 1998. The Determinants of Stock Price Exposure: Financial Engineering and the

22
Gold Mining Industry. Journal of Finance 53:3, 1015-1152.
Venkatachalam, M., 1996. Value-relevance of bank’s derivatives disclosures. Journal of Accounting and Economics 22, 327-355.
Whidbee, D. A., and Wohar, M., 1999. Derivatives activities and management incentives in the banking industry. Journal of Corporate Finance 5, 251-276.
23
Table 1 Summary of the use of derivatives for trading and hedging separately for different types of derivatives
This table shows the number of banks using derivatives for trading and hedging purpose separately for foreign exchange derivatives, interest rate derivatives, equity derivatives, credit derivatives, commodity derivatives and other derivatives during 2004 to 2008. However, banks can simultaneously use derivatives with different underlying assets for trading or hedging purposes. Foreign exchange
Derivatives Interest Rate Derivatives
Equity Derivatives
Credit derivatives
Commodity derivatives
Other Derivatives
Trading Hedging Trading Hedging Trading Hedging Trading Hedging Trading Hedging Trading Hedging
2004 19 5 18 10 8 1 4 0 1 0 17 7 2005 42 37 43 13 24 20 6 0 6 0 10 4 2006 53 42 52 12 33 24 6 0 6 0 18 4 2007 46 35 48 11 30 20 9 0 9 0 23 5 2008 7 9 7 1 3 1 0 0 0 0 1 0 2004~2008 167 128 168 47 98 66 25 0 22 0 69 20
24
Table 2 summary statistics
Table A of this table presents the summary statistics of the variables used in this study, reporting the mean, median and standard deviation (S.D.) of the time-series variables for 355 observations over the sample period which runs from 2004 to 2008. Please refer to Appendix 1 for the definition and construction of the variables.
Variables Mean Median S.D. Max. Min.
Dependent Variables-Bank Risk
returnσ 0.0203 0.0176 0.0112 0.0639 0.0010
Dependent Variables-Bank Value NAtiQ , 1.0569 1.0678 0.0440 1.1115 0.9399
Independent Variables DER 0.04851 1.0000 0.1029 1.0000 0.0000
Control Variables
MAD 0.6128 0.6254 0.2121 0.9994 0.0926
MID 0.6685 0.7163 0.3502 0.9982 0.0707
SIZE 24.0452 23.785 2.2515 28.968 19.145
ROE 0.1246 0.1400 0.1299 0.4617 -0.6667
NIM 0.0239 0.0218 0.0129 0.0975 0.0027
EQRAT 0.0783 0.0682 0.0487 0.4728 0.0139
LIQ 0.2520 0.2276 0.1399 0.7711 0.0206
CCLOAN 0.1904 0.1580 0.2050 0.7070 0.0000
NOMINT 0.0163 0.0128 0.0172 0.2569 0.0011
RES 0.0170 0.0144 0.0173 0.1308 0.0000
LNGDP 24.288 23.841 2.2386 30.357 20.398
25
Table 3 Univariate tests of bank risk, value and derivatives use
This table reports the mean and standard deviation (SD) for users (N=236) and Non-Users (N=119). The last column present p-values of Wilcoxon rank sum tests for differences between users and Non-users. The p-values in bold type are significant at the 5% level or higher for two-tailed test. Please refer to Appendix 1 for the definition and construction of the variables.
Variables User Non User User-Nonuser Wilcoxon
P-value mean SD mean SD mean p-value
(i) Bank risk
returnσ 0.0261 0.0013 0.0174 0.0005 0.0087 0.0000 0.0000
(ii) Bank value NAtiQ , 1.0688 0.0022 1.0359 0.0049 0.0329 0.0000 0.0000
26
Table 4 The association between derivative activities and bank Risk
The table reports the estimation output of the panel with fixed effect model with the σreturn as the dependent variable. Due to the endogeneity issue for derivatives, we apply two-stage least squares (2SLS) methodology in Model (4)-(6). In the first-stage, we estimated derivatives dummy using financial openness as instrumental variables. Then in the second-stage, we replace derivative dummy by its fitted values obtained from the first-stage regression. The models are estimated based on Peterson (2009) and cluster-adjusted standard errors are reported in the brackets. Please refer to Appendix 1 for the definition and construction of the variables. ***, ** and * indicate statistical significance at 1%, 5% or 10% level, respectively.
OLS 2SLS (1) (2) (3) (4) (5) (6) Intercept -0.052 -0.086 -0.090 -0.092 -0.092 -0.090 (0.040) (0.042) ** (0.042) ** (0.043) ** (0.043) ** (0.043) ** DER 0.007 0.002 (0.001) *** (0.001) * FEDER 0.004 0.003 (0.001) *** (0.001) **
IRDER 0.003 0.002 (0.001) ** (0.001) * MAD -0.008 -0.009 -0.009 -0.011 -0.011 -0.011 (0.004) * (0.004) ** (0.004) ** (0.004) ** (0.004) ** (0.004) ** MID -0.003 -0.004 -0.003 -0.003 -0.003 -0.003 (0.002) * (0.002)*
** (0.002)* * (0.002) (0.002) * (0.002) *
SIZE 0.001 0.002 0.002 0.002 0.002 0.002 (0.002) (0.002) (0.002) (0.002) (0.002) (0.002) ROE -0.017 -0.021 -0.023 -0.025 -0.025 -0.025 (0.007) ** (0.007) *** (0.007) *** (0.007) *** (0.007) *** (0.007) *** NIM -0.091 -0.066 -0.060 -0.052 -0.051 -0.053 (0.127) (0.132) (0.134) (0.135) (0.135) (0.135) EQRAT -0.030 -0.025 -0.024 -0.031 -0.031 -0.032 (0.037) (0.038) (0.039) (0.039) (0.039) (0.039) LIQ 0.010 0.007 0.005 0.003 0.003 0.002 (0.009) (0.009) (0.009) (0.009) (0.009) (0.009) CCLOAN 0.007 0.006 0.007 0.006 0.006 0.006 (0.004) (0.005) (0.005) (0.005) (0.005) (0.005) NOMINT 0.039 0.050 0.040 0.055 0.055 0.054 (0.048) (0.051) (0.051) (0.052) (0.052) (0.052) RES -0.005 -0.015 -0.023 -0.039 -0.039 -0.039 (0.043) (0.045) (0.046) (0.046) (0.046) (0.046) LNGDP 0.003 0.003 0.003 0.003 0.003 0.003 (0.000) *** (0.000) *** (0.000) *** (0.000) *** (0.000) *** (0.000) *** Within-R2 60.1% 56.6% 55.8% 54.93% 54.93% 54.95% Between-R2 14.2% 11.4% 9.91% 8.64% 8.64% 8.68% Overall-R2 30.3% 22.87% 21.33% 19.55% 19.53%
19.75%
27
Table 5 The association between derivative activities for trading or hedging purpose and bank Risk
The table reports the estimation output of the panel with fixed effect model with the σ return as the dependent variable. The models are estimated based on Peterson (2009) and cluster-adjusted standard errors are reported in the brackets. Please refer to Appendix 1 for the definition and construction of the variables. ***, ** and * indicate statistical significance at 1%, 5% or 10% level, respectively.
Model (1) (2) (3) (4) Intercept -0.087 -0.088 -0.089 -0.079 (0.041) ** (0.042) ** (0.042) ** (0.042) * TFEDER 0.004 (0.001) *** HFEDER -0.003 (0.002) TIRDER 0.003 (0.001) *** HIRDER -0.005 (0.002) *** MAD -0.009 -0.011 -0.009 -0.011 (0.004) ** (0.004) ** (0.004) ** (0.004) ** MID -0.004 -0.003 -0.003 -0.004 (0.002) ** (0.002) * (0.002) * (0.002) ** SIZE 0.002 0.002 0.002 0.002 (0.002) (0.002) (0.002) (0.002) ROE -0.022 -0.023 -0.024 -0.020 (0.007) *** (0.007) *** (0.007) *** (0.007) *** NIM -0.076 -0.042 -0.071 -0.059 (0.132) (0.134) (0.133) (0.133) EQRAT -0.027 -0.031 -0.024 -0.025 (0.038) (0.039) (0.038) (0.038) LIQ 0.007 0.003 0.005 0.005 (0.009) (0.009) (0.009) (0.009) CCLOAN 0.006 0.006 0.007 0.006 (0.005) (0.005) (0.005) (0.005) NOMINT 0.055 0.049 0.041 0.033 (0.050) (0.051) (0.051) (0.051) RES -0.013 -0.037 -0.019 -0.035 (0.045) (0.045) (0.046) (0.045) LNGDP 0.003 0.003 0.003 0.003 (0.000) *** (0.000) *** (0.000) *** (0.000) *** Within-R2 56.8% 55.4% 56.2% 56.5% Between-R2 9.93% 10.4% 9.29% 11.2% Overall-R2 21.3% 21.5% 21.1% 23.1%
28
Table 6 The association between derivative activities and bank Value
The table reports the estimation output of the panel with fixed effect model with the Adjusted-noise Tobin’s Q as the dependent variable. Due to the endogeneity issue for derivatives, we apply two-stage least squares (2SLS) methodology in Model (4)-(6). In the first-stage, we estimated derivatives dummy using financial openness as instrumental variables. Then in the second-stage, we replace derivative dummy by its fitted values obtained from the first-stage regression. The models are estimated based on Peterson (2009) and cluster-adjusted standard errors are reported in the brackets. Please refer to Appendix 1 for the definition and construction of the variables. ***, ** and * indicate statistical significance at 1%, 5% or 10% level, respectively.
OLS 2SLS (1) (2) (3) (4) (5) (6) Intercept 2.091 2.268 2.286 2.313 2.311 2.301 (0.132) *** (0.141) *** (0.139) *** (0.154) *** (0.153) *** (0.153) *** DER 0.404 0.004 (0.004) *** (0.002) * FEDER 0.260 0.006 (0.004) *** (0.002) ** IRDER 0.028 0.010 (0.004) *** (0.002) *** MAD 0.021 0.024 0.020 0.035 0.035 0.035 (0.138) (0.015) (0.015) (0.016) ** (0.016) ** (0.016) ** MID -0.012 -0.009 -0.010 -0.014 -0.014 -0.014 (0.005) ** (0.006) (0.006) * (0.006) ** (0.006) ** (0.006) ** SIZE -0.031 -0.376 -0.039 -0.038 -0.037 -0.037 (0.006) *** (0.006) *** (0.006) *** (0.006) *** (0.007) *** (0.006) *** ROE 0095 0.113 0.119 0.143 0.142 0.142 (0.022) *** (0.024) *** (0.023) *** (0.025) *** (0.026) *** (0.026) *** NIM -1.341 -1.452 -1.464 -1.556 -1.553 -1.542 (0.416) *** (0.451) *** (0.444) *** (0.486) *** (0.486) *** (0.4863
***
EQRAT -0.102 -0.140 -0.166 -0.101 -0.099 -0.095 (0.120) (0.130) (0.128) (0.140) (0.141) (0.140) LIQ -0.016 -0.007 0.002 0.023 0.023 0.024 (0.028) (0.030) (0.030) (0.032) (0.032) (0.032) CCLOAN -0.005 -0.000 -0.008 0.003 0.002 0.002 (0.014) (0.016) (0.016) (0.017) (0.017) (0.017) NOMINT -0.167 -0.218 -0.099 -0.250 -0.248 -0.244 (0.159) (0.172) (0.171) (0.186) (0.186) (0.186) RES -0.078 -0.061 -0.055 0.107 0.107 0.110 (0.142) (0.155) (0.152) (0.164) (0.164) (0.164) LNGDP -0.011 -0.012 -0.011 -0.014 -0.014 -0.141 (0.001) *** (0.001) *** (0.001) *** (0.001) *** (0.001) *** (0.001) *** Within-R2 77.4% 73.5% 74.3% 69.25% 69.25% 69.29%
Between-R2 45.7% 45.0% 43.3% 40.44% 40.42% 40.37%
Overall-R2 53.3% 46.5% 45.9% 41.18% 41.21% 41.34%
29
Table 7 The association between derivative activities for trading or hedging purpose and bank value
The table reports the estimation output of the panel with fixed effect model with the adjusted-Tobin’s Q as the dependent variable. The models are estimated based on Peterson (2009) and cluster-adjusted standard errors are reported in the brackets. Please refer to Appendix 1 for the definition and construction of the variables. ***, ** and * indicate statistical significance at 1%, 5% or 10% level, respectively.
Model (1) (2) (3) (4) Intercept 2.280 2.313 2.279 2.277 (0.141) *** (0.152) *** (0.139) *** (0.151) *** TFEDER 0.027 (0.004) *** HFEDER 0.001 (0.007) TIRDER 0.029 (0.004) *** HIRDER 0.014 (0.006) ** MAD 0.023 0.034 0.021 0.034 (0.015) (0.016) ** (0.015) (0.016) ** MID -0.010 -0.014 -0.011 -0.011 (0.006) (0.006) ** (0.006) * (0.006) ** SIZE -0.038 -0.038 -0.039 -0.037 (0.006) *** (0.006) *** (0.006) *** (0.007) *** ROE 0.121 0.142 0.129 0.128 (0.024) *** (0.026) *** (0.023) *** (0.026) *** NIM -1.389 -1.561 -1.382 -1.536 (0.450) *** (0.486) *** (0.443) *** (0.481) *** EQRAT -0.124 -0.101 -0.159 -0.116 (0.130) (0.140) (0.128) (0.139) LIQ -0.006 0.023 0.003 0.017 (0.030) (0.032) (0.030) (0.032) CCLOAN -0.000 0.003 -0.008 0.003 (0.016) (0.017) (0.016) (0.017) NOMINT -0.251 -0.249 -0.132 -0.191 (0.172) (0.186) (0.170) (0.186) RES -0.064 0.106 -0.066 0.095 (0.154) (0.164) (0.152) (0.163) LNGDP -0.012 -0.014 -0.011 -0.013 (0.001) *** (0.001) *** (0.001) *** (0.001) *** Within-R2 73.6% 69.3% 74.5% 69.9% Between-R2 44.4% 40.5% 43.1% 41.4% Overall-R2 45.8% 41.2% 45.8% 42.8%
30
Table 8 The association between derivative activities and banks’ foreign exchange risk and interest rate exposures
This table reports the coefficient estimates and corresponding standard error (in parentheses) of the following system of seemingly unrelated regressions: βX=α0+α1DERi+α2MADi+α3MIDi+α4SIZEi+α5ROEi+α6NIMi+α7EQRATi +α8LIQi+α9CCLOANi
+α10NOMINTi+α11RESi+ +α12LNGDPi+α13YEARDUMi+ε i. βr=α0+α1DERi+α2MADi+α3MIDi+α4SIZEi+α5ROEi+α6NIMi+α7EQRATi +α8LIQi+α9CCLOANi
+α10NOMINTi+α11RESi +α12LNGDPi+α13YEARDUMi+ε i , The results reported are for the two sets of regression (FEDER and IRDER) using the risk coefficient as dependent variables. Please refer to Appendix 1 for the definition and construction of the variables. ***, ** and * indicate statistical significance at 1%, 5% or 10% level, respectively.
Model (1) (2) Dependent Variable βX βr βX βr Intercept -0.281 -0.069 -0.715 -0.043 (0.887) (0.108) (0.897) (0.110) FEDER 0.354 -0.003 (0.122) *** (0.015) IRDER 0.473 -0.032 (0.126) *** (0.015) ** MAD 0.743 -0.058 0.693 -0.059 (0.184) *** (0.022) ** (0.179) *** (0.022) *** MID -0.021 -0.012 -0.102 -0.009 (0.248) (0.030) (0.248) (0.030) SIZE -0.041 0.002 -0.021 0.001 (0.025) * (0.003) (0.026) (0.003) ROE 0.622 0.074 0.546 0.078 (0.453) (0.055) (0.450) (0.055) EQRAT 0.837 0.031 1.007 0.027 (0.987) (0.120) (0.978) (0.120) NIM -4.805 -0.817 -5.780 -0.782 (4.508) (0.550) (4.480) (0.551) LIQ 0.363 -0.041 0.303 -0.040 (0.267) (0.033) (0.265) (0.033) CCLOAN 0.677 0.055 0.684 0.055 (0.211) *** (0.026) ** (0.209) *** (0.026) ** NOMINT -4.325 0.397 -4.204 0.391 (3.333) (0.406) (3.301) (0.406) RES 2.233 0.018 2.877 -0.026 (2.373) (0.289) (2.363) (0.291) LNGDP 0.041 0.001 0.045 0.001 (0.025) * (0.003) (0.024) * (0.003) YEARDUM Yes Yes Obs. 298 298 16.2% 9.6% 17.9% 10.8%
31
Table 9 The association between derivative activities for trading or hedging purpose and banks’ foreign exchange and interest rate risk exposures
This table reports the coefficient estimates and corresponding t-statistics (in parentheses) of the following system of seemingly unrelated regressions:
βX=α0+α1DERi+α2MADi+α3MIDi+α4SIZEi+α5ROEi+α6NIMi+α7EQRATi +α8LIQi+α9CCLOANi +α10NOMINTi+α11RESi+ +α12LNGDPi+α13YEARDUMi+ε i.
βr=α0+α1DERi+α2MADi+α3MIDi+α4SIZEi+α5ROEi+α6NIMi+α7EQRATi +α8LIQi+α9CCLOANi +α10NOMINTi+α11RESi +α12LNGDPi+α13YEARDUMi+ε i ,
The results show the effect of using derivatives for the trading (model (1) ~(2) ) or hedging (model (3) ~(4)) purpose with different underlying assets on bank’s risk. Please refer to Appendix 1 for the definition and construction of the variables. ***, ** and * indicate statistical significance at 1%, 5% or 10% level, respectively.
Dependent Variable (1) (2) (3) (4)
βX βr βX βr βX βr βX βr Intercept 0.008 -0.079 -0.360 -0.056 0.442 -0.081 0.401 -0.069 (0.892) (0.108) (0.905) (0.110) (0.856) (0.103) (0.857) (0.103) TFEDER 0.221 0.002 (0.103) ** (0.014) TIRDER 0.320 -0.007 (0.117) *** (0.003) *** HFEDER -0.137 0.007 (0.126) (0.015) HIRDER 0.136 0.005 (0.103) (0.012) MAD 0.712 -0.057 0.687 -0.059 0.614 -0.058 0.615 -0.057 (0.187) *** (0.023) ** (0.181) *** (0.022) *** (0.182) *** (0.022) *** (0.182) *** (0.022) *** MID -0.003 -0.013 -0.069 -0.010 0.060 -0.013 0.037 -0.012 (0.250) (0.030) (0.251) (0.031) (0.249) (0.030) (0.250) (0.030) SIZE -0.052 0.003 -0.037 0.002 -0.063 0.003 -0.061 0.002 (0.025) ** (0.003) (0.026) (0.003) (0.024) *** (0.003) (0.024) ** (0.003) ROE 0.744 0.074 0.727 0.074 0.690 0.072 0.712 0.074 (0.456) (0.055) (0.453) (0.055) (0.459) (0.055) (0.458) (0.055) EQRAT 0.923 0.031 1.076 0.026 0.834 0.030 0.863 0.031 (0.996) (0.120) (0.992) (0.121) (1.000) (0.120) (0.999) (0.120) NIM -4.726 -0.826 -5.646 -0.791 -4.386 -0.834 -4.814 -0.798 (4.550) (0.550) (4.544) (0.553) (4.566) (0.550) (4.585) (0.552) LIQ 0.383 -0.416 0.354 -0.041 0.407 -0.040 0.341 -0.040 (0.269) (0.033) (0.267) (0.033) (0.271) (0.033) (0.272) (0.033) CCLOAN 0.686 0.056 0.701 0.055 0.640 0.055 0.642 0.056 (0.213) *** (0.026) ** (0.212) *** (0.026) ** (0.213) *** (0.026) ** (0.213) *** (0.026) ** NOMINT -4.336 0.398 -4.198 0.392 -4.289 0.406 -4.179 0.388 (3.361) (0.406) (3.340) (0.406) (3.379) (0.407) (3.379) (0.407) RES 1.615 0.036 2.073 -0.000 0.602 0.026 0.404 0.038 (2.380) (0.288) (2.371) (0.289) (2.341) (0.282) (2.346) (0.283) LNGDP 0.035 0.001 0.040 0.001 0.025 0.001 0.027 0.001 (0.025) (0.003) (0.025) (0.003) (0.024) (0.003) (0.024) (0.003) YEARDUM Yes Yes Yes Yes Obs. 298 298 298 298
R2 14.9% 9.6% 16.0% 10.7% 14.1% 9.7% 14.3% 9.7%
32
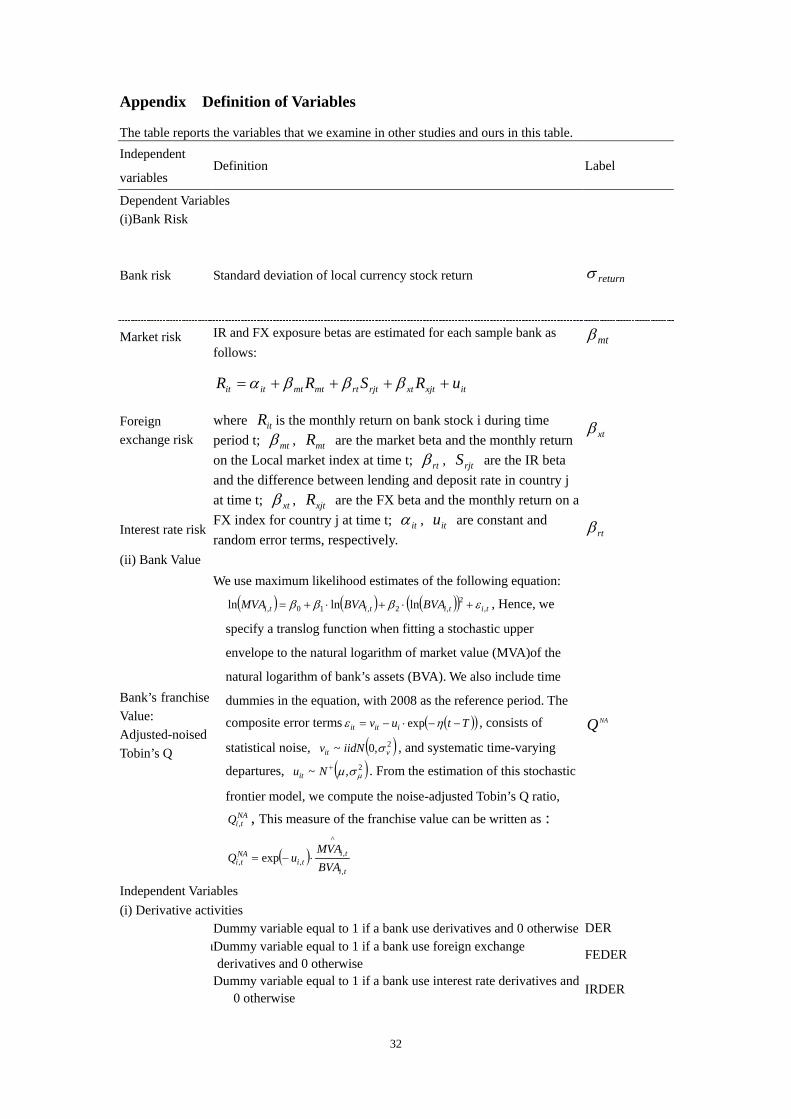
Appendix Definition of Variables
The table reports the variables that we examine in other studies and ours in this table. Independent
variables Definition Label
Dependent Variables (i)Bank Risk
Bank risk Standard deviation of local currency stock return returnσ
Market risk IR and FX exposure betas are estimated for each sample bank as follows:
itxjtxtrjtrtmtmtitit uRSRR ++++= βββα
where itR is the monthly return on bank stock i during time period t; mtβ , mtR are the market beta and the monthly return on the Local market index at time t; rtβ , rjtS are the IR beta and the difference between lending and deposit rate in country j at time t; xtβ , xjtR are the FX beta and the monthly return on a FX index for country j at time t; itα , itu are constant and random error terms, respectively.
mtβ
Foreign exchange risk xtβ
Interest rate risk rtβ
(ii) Bank Value
Bank’s franchise Value: Adjusted-noised Tobin’s Q
We use maximum likelihood estimates of the following equation:
( ) ( ) ( )( ) titititi BVABVAMVA ,2
,2,10, lnlnln εβββ +⋅+⋅+= , Hence, we
specify a translog function when fitting a stochastic upper
envelope to the natural logarithm of market value (MVA)of the
natural logarithm of bank’s assets (BVA). We also include time
dummies in the equation, with 2008 as the reference period. The
composite error terms ( )( )Ttuv iitit −−⋅−= ηε exp , consists of
statistical noise, ( )2,0~ vit iidNv σ , and systematic time-varying
departures, ( )2,~ µσµ+Nuit . From the estimation of this stochastic
frontier model, we compute the noise-adjusted Tobin’s Q ratio, NAtiQ , , This measure of the franchise value can be written as :
( )ti
titi
NAti BVA
MVAuQ
,
^
,,, exp ⋅−=
NAQ
Independent Variables (i) Derivative activities Dummy variable equal to 1 if a bank use derivatives and 0 otherwise DER uDummy variable equal to 1 if a bank use foreign exchange
derivatives and 0 otherwise FEDER
Dummy variable equal to 1 if a bank use interest rate derivatives and 0 otherwise
IRDER
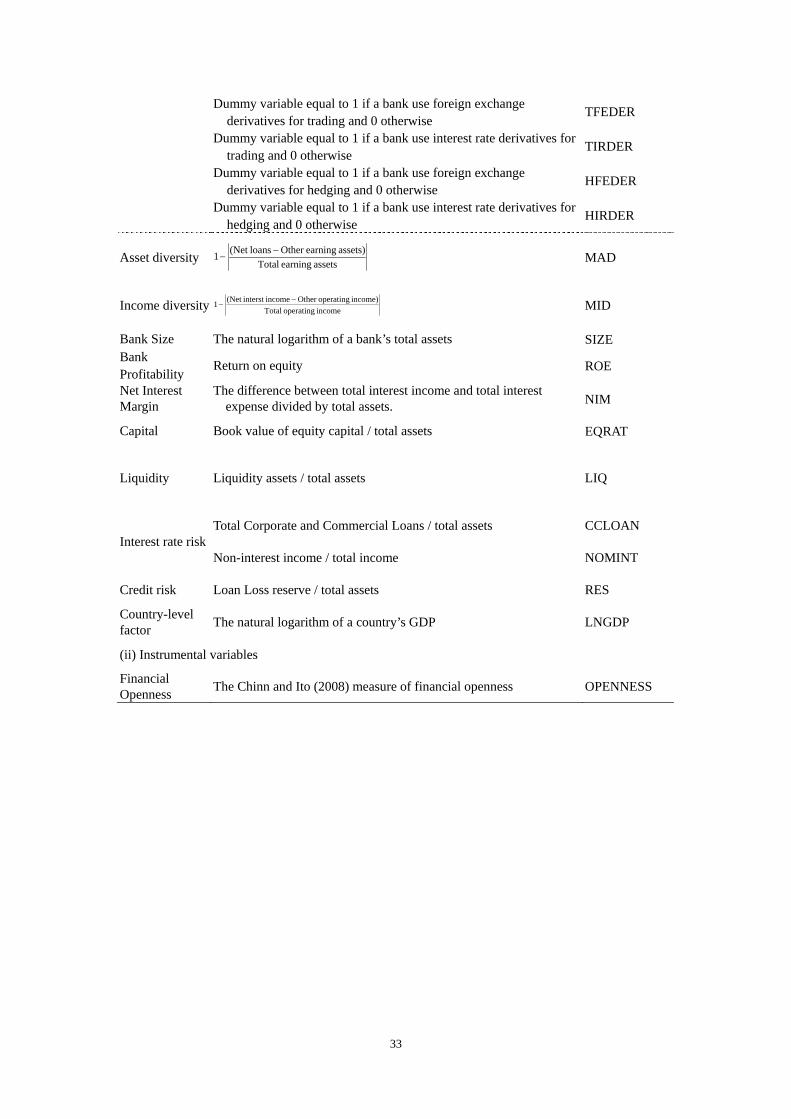
33
Dummy variable equal to 1 if a bank use foreign exchange derivatives for trading and 0 otherwise
TFEDER
Dummy variable equal to 1 if a bank use interest rate derivatives for trading and 0 otherwise
TIRDER
Dummy variable equal to 1 if a bank use foreign exchange derivatives for hedging and 0 otherwise
HFEDER
Dummy variable equal to 1 if a bank use interest rate derivatives for hedging and 0 otherwise
HIRDER
Asset diversity assets earning Totalassets) earningOther loans(Net 1 −
−
MAD
Income diversity income operating Totalincome) operatingOther incomeinterst (Net 1 −
−
MID
Bank Size The natural logarithm of a bank’s total assets SIZE Bank Profitability Return on equity ROE
Net Interest Margin
The difference between total interest income and total interest expense divided by total assets. NIM
Capital Book value of equity capital / total assets EQRAT
Liquidity Liquidity assets / total assets LIQ
Interest rate risk Total Corporate and Commercial Loans / total assets CCLOAN
Non-interest income / total income NOMINT
Credit risk Loan Loss reserve / total assets RES
Country-level factor The natural logarithm of a country’s GDP LNGDP
(ii) Instrumental variables
Financial Openness The Chinn and Ito (2008) measure of financial openness OPENNESS