Embed Size (px)
Citation preview
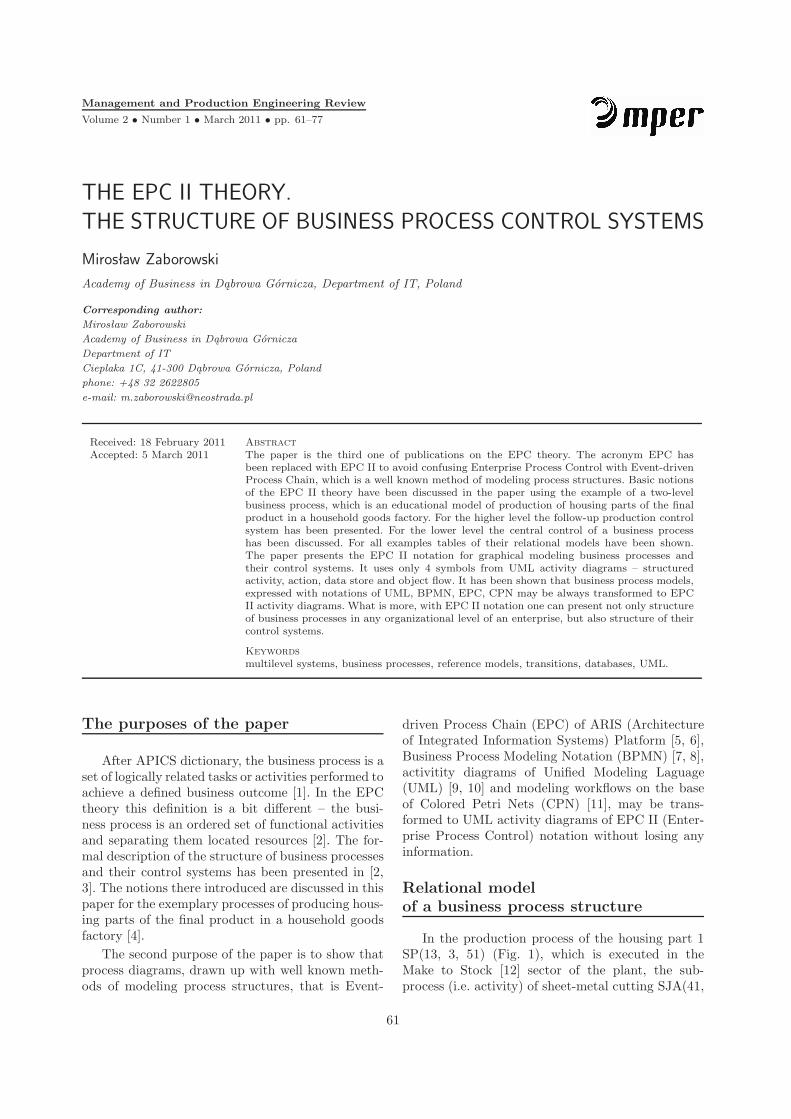
Management and Production Engineering Review
Volume 2 • Number 1 • March 2011 • pp. 61–77
THE EPC II THEORY.
THE STRUCTURE OF BUSINESS PROCESS CONTROL SYSTEMS
Mirosław Zaborowski
Academy of Business in Dąbrowa Górnicza, Department of IT, Poland
Corresponding author:
Mirosław Zaborowski
Academy of Business in Dąbrowa Górnicza
Department of IT
Cieplaka 1C, 41-300 Dąbrowa Górnicza, Poland
phone: +48 32 2622805
e-mail: [email protected]
Received: 18 February 2011 Abstract
Accepted: 5 March 2011 The paper is the third one of publications on the EPC theory. The acronym EPC hasbeen replaced with EPC II to avoid confusing Enterprise Process Control with Event-drivenProcess Chain, which is a well known method of modeling process structures. Basic notionsof the EPC II theory have been discussed in the paper using the example of a two-levelbusiness process, which is an educational model of production of housing parts of the finalproduct in a household goods factory. For the higher level the follow-up production controlsystem has been presented. For the lower level the central control of a business processhas been discussed. For all examples tables of their relational models have been shown.The paper presents the EPC II notation for graphical modeling business processes andtheir control systems. It uses only 4 symbols from UML activity diagrams – structuredactivity, action, data store and object flow. It has been shown that business process models,expressed with notations of UML, BPMN, EPC, CPN may be always transformed to EPCII activity diagrams. What is more, with EPC II notation one can present not only structureof business processes in any organizational level of an enterprise, but also structure of theircontrol systems.
Keywords
multilevel systems, business processes, reference models, transitions, databases, UML.
The purposes of the paper
After APICS dictionary, the business process is aset of logically related tasks or activities performed toachieve a defined business outcome [1]. In the EPCtheory this definition is a bit different – the busi-ness process is an ordered set of functional activitiesand separating them located resources [2]. The for-mal description of the structure of business processesand their control systems has been presented in [2,3]. The notions there introduced are discussed in thispaper for the exemplary processes of producing hous-ing parts of the final product in a household goodsfactory [4].
The second purpose of the paper is to show thatprocess diagrams, drawn up with well known meth-ods of modeling process structures, that is Event-
driven Process Chain (EPC) of ARIS (Architectureof Integrated Information Systems) Platform [5, 6],Business Process Modeling Notation (BPMN) [7, 8],activitity diagrams of Unified Modeling Laguage(UML) [9, 10] and modeling workflows on the baseof Colored Petri Nets (CPN) [11], may be trans-formed to UML activity diagrams of EPC II (Enter-prise Process Control) notation without losing anyinformation.
Relational model
of a business process structure
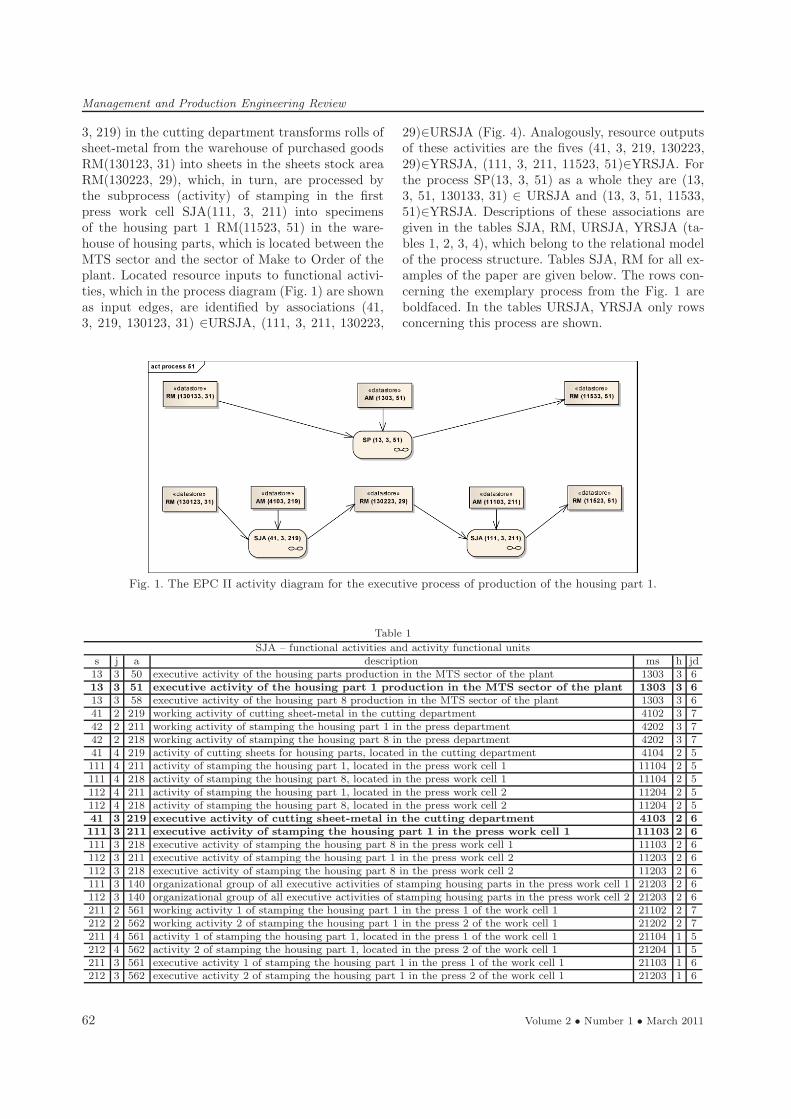
In the production process of the housing part 1SP(13, 3, 51) (Fig. 1), which is executed in theMake to Stock [12] sector of the plant, the sub-process (i.e. activity) of sheet-metal cutting SJA(41,
61
Management and Production Engineering Review
3, 219) in the cutting department transforms rolls ofsheet-metal from the warehouse of purchased goodsRM(130123, 31) into sheets in the sheets stock areaRM(130223, 29), which, in turn, are processed bythe subprocess (activity) of stamping in the firstpress work cell SJA(111, 3, 211) into specimensof the housing part 1 RM(11523, 51) in the ware-house of housing parts, which is located between theMTS sector and the sector of Make to Order of theplant. Located resource inputs to functional activi-ties, which in the process diagram (Fig. 1) are shownas input edges, are identified by associations (41,3, 219, 130123, 31) ∈URSJA, (111, 3, 211, 130223,
29)∈URSJA (Fig. 4). Analogously, resource outputsof these activities are the fives (41, 3, 219, 130223,29)∈YRSJA, (111, 3, 211, 11523, 51)∈YRSJA. Forthe process SP(13, 3, 51) as a whole they are (13,3, 51, 130133, 31) ∈ URSJA and (13, 3, 51, 11533,51)∈YRSJA. Descriptions of these associations aregiven in the tables SJA, RM, URSJA, YRSJA (ta-bles 1, 2, 3, 4), which belong to the relational modelof the process structure. Tables SJA, RM for all ex-amples of the paper are given below. The rows con-cerning the exemplary process from the Fig. 1 areboldfaced. In the tables URSJA, YRSJA only rowsconcerning this process are shown.
Fig. 1. The EPC II activity diagram for the executive process of production of the housing part 1.
Table 1
SJA – functional activities and activity functional unitss j a description ms h jd13 3 50 executive activity of the housing parts production in the MTS sector of the plant 1303 3 613 3 51 executive activity of the housing part 1 production in the MTS sector of the plant 1303 3 6
13 3 58 executive activity of the housing part 8 production in the MTS sector of the plant 1303 3 641 2 219 working activity of cutting sheet-metal in the cutting department 4102 3 742 2 211 working activity of stamping the housing part 1 in the press department 4202 3 742 2 218 working activity of stamping the housing part 8 in the press department 4202 3 741 4 219 activity of cutting sheets for housing parts, located in the cutting department 4104 2 5111 4 211 activity of stamping the housing part 1, located in the press work cell 1 11104 2 5111 4 218 activity of stamping the housing part 8, located in the press work cell 1 11104 2 5112 4 211 activity of stamping the housing part 1, located in the press work cell 2 11204 2 5112 4 218 activity of stamping the housing part 8, located in the press work cell 2 11204 2 541 3 219 executive activity of cutting sheet-metal in the cutting department 4103 2 6
111 3 211 executive activity of stamping the housing part 1 in the press work cell 1 11103 2 6
111 3 218 executive activity of stamping the housing part 8 in the press work cell 1 11103 2 6112 3 211 executive activity of stamping the housing part 1 in the press work cell 2 11203 2 6112 3 218 executive activity of stamping the housing part 8 in the press work cell 2 11203 2 6111 3 140 organizational group of all executive activities of stamping housing parts in the press work cell 1 21203 2 6112 3 140 organizational group of all executive activities of stamping housing parts in the press work cell 2 21203 2 6211 2 561 working activity 1 of stamping the housing part 1 in the press 1 of the work cell 1 21102 2 7212 2 562 working activity 2 of stamping the housing part 1 in the press 2 of the work cell 1 21202 2 7211 4 561 activity 1 of stamping the housing part 1, located in the press 1 of the work cell 1 21104 1 5212 4 562 activity 2 of stamping the housing part 1, located in the press 2 of the work cell 1 21204 1 5211 3 561 executive activity 1 of stamping the housing part 1 in the press 1 of the work cell 1 21103 1 6212 3 562 executive activity 2 of stamping the housing part 1 in the press 2 of the work cell 1 21203 1 6
62 Volume 2 • Number 1 • March 2011
Management and Production Engineering Review
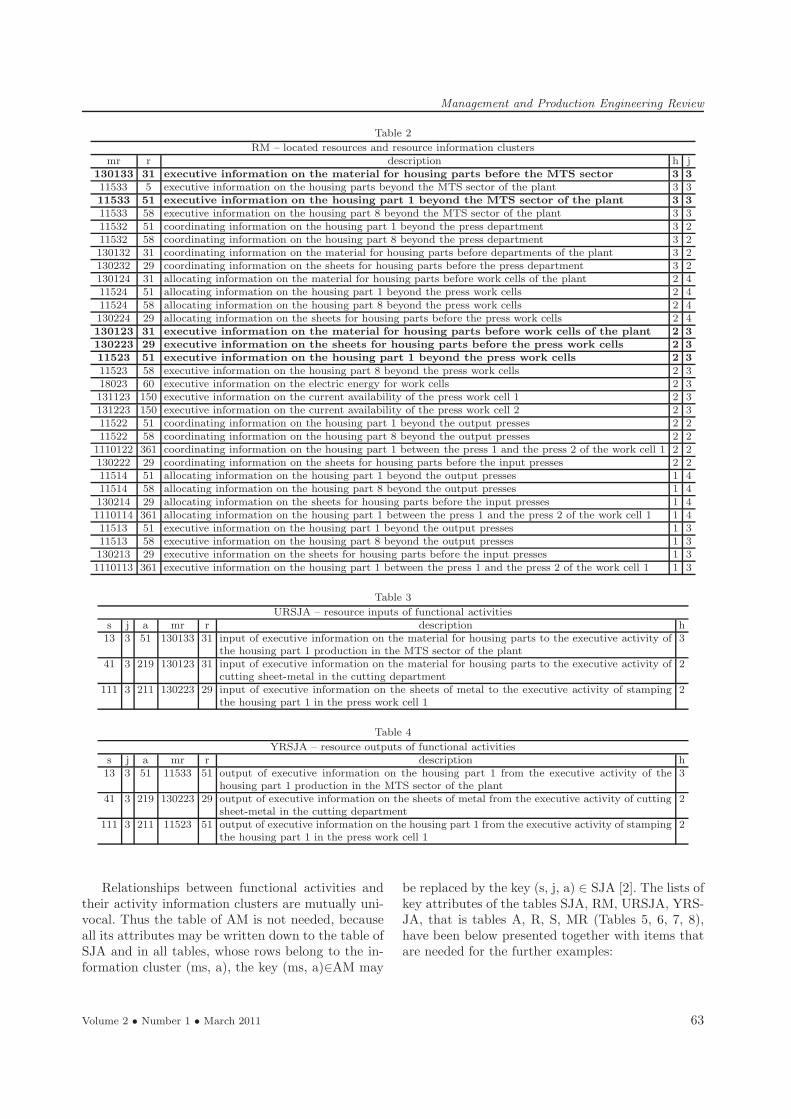
Table 2
RM – located resources and resource information clustersmr r description h j
130133 31 executive information on the material for housing parts before the MTS sector 3 3
11533 5 executive information on the housing parts beyond the MTS sector of the plant 3 311533 51 executive information on the housing part 1 beyond the MTS sector of the plant 3 3
11533 58 executive information on the housing part 8 beyond the MTS sector of the plant 3 311532 51 coordinating information on the housing part 1 beyond the press department 3 211532 58 coordinating information on the housing part 8 beyond the press department 3 2130132 31 coordinating information on the material for housing parts before departments of the plant 3 2130232 29 coordinating information on the sheets for housing parts before the press department 3 2130124 31 allocating information on the material for housing parts before work cells of the plant 2 411524 51 allocating information on the housing part 1 beyond the press work cells 2 411524 58 allocating information on the housing part 8 beyond the press work cells 2 4130224 29 allocating information on the sheets for housing parts before the press work cells 2 4130123 31 executive information on the material for housing parts before work cells of the plant 2 3
130223 29 executive information on the sheets for housing parts before the press work cells 2 3
11523 51 executive information on the housing part 1 beyond the press work cells 2 3
11523 58 executive information on the housing part 8 beyond the press work cells 2 318023 60 executive information on the electric energy for work cells 2 3131123 150 executive information on the current availability of the press work cell 1 2 3131223 150 executive information on the current availability of the press work cell 2 2 311522 51 coordinating information on the housing part 1 beyond the output presses 2 211522 58 coordinating information on the housing part 8 beyond the output presses 2 21110122 361 coordinating information on the housing part 1 between the press 1 and the press 2 of the work cell 1 2 2130222 29 coordinating information on the sheets for housing parts before the input presses 2 211514 51 allocating information on the housing part 1 beyond the output presses 1 411514 58 allocating information on the housing part 8 beyond the output presses 1 4130214 29 allocating information on the sheets for housing parts before the input presses 1 41110114 361 allocating information on the housing part 1 between the press 1 and the press 2 of the work cell 1 1 411513 51 executive information on the housing part 1 beyond the output presses 1 311513 58 executive information on the housing part 8 beyond the output presses 1 3130213 29 executive information on the sheets for housing parts before the input presses 1 31110113 361 executive information on the housing part 1 between the press 1 and the press 2 of the work cell 1 1 3
Table 3
URSJA – resource inputs of functional activitiess j a mr r description h13 3 51 130133 31 input of executive information on the material for housing parts to the executive activity of
the housing part 1 production in the MTS sector of the plant3
41 3 219 130123 31 input of executive information on the material for housing parts to the executive activity ofcutting sheet-metal in the cutting department
2
111 3 211 130223 29 input of executive information on the sheets of metal to the executive activity of stampingthe housing part 1 in the press work cell 1
2
Table 4
YRSJA – resource outputs of functional activitiess j a mr r description h13 3 51 11533 51 output of executive information on the housing part 1 from the executive activity of the
housing part 1 production in the MTS sector of the plant3
41 3 219 130223 29 output of executive information on the sheets of metal from the executive activity of cuttingsheet-metal in the cutting department
2
111 3 211 11523 51 output of executive information on the housing part 1 from the executive activity of stampingthe housing part 1 in the press work cell 1
2
Relationships between functional activities andtheir activity information clusters are mutually uni-vocal. Thus the table of AM is not needed, becauseall its attributes may be written down to the table ofSJA and in all tables, whose rows belong to the in-formation cluster (ms, a), the key (ms, a)∈AM may
be replaced by the key (s, j, a) ∈ SJA [2]. The lists ofkey attributes of the tables SJA, RM, URSJA, YRS-JA, that is tables A, R, S, MR (Tables 5, 6, 7, 8),have been below presented together with items thatare needed for the further examples:
Volume 2 • Number 1 • March 2011 63
Management and Production Engineering Review
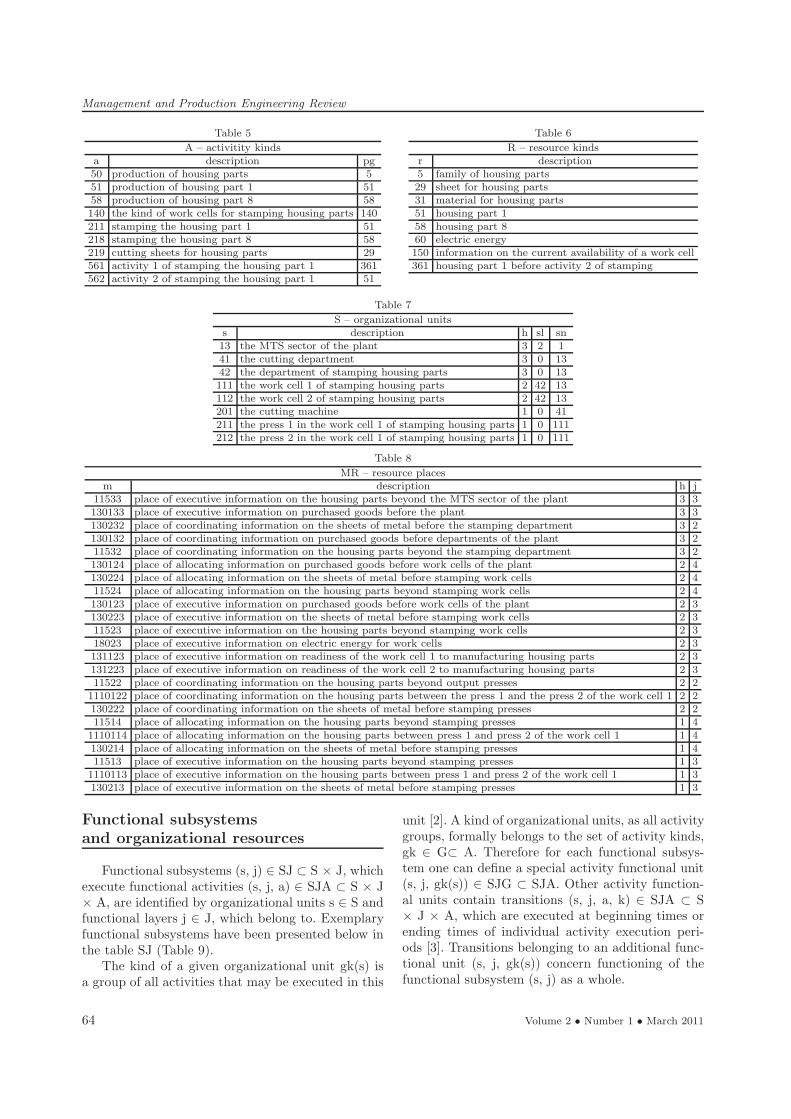
Table 5
A – activitity kindsa description pg50 production of housing parts 551 production of housing part 1 5158 production of housing part 8 58140 the kind of work cells for stamping housing parts 140211 stamping the housing part 1 51218 stamping the housing part 8 58219 cutting sheets for housing parts 29561 activity 1 of stamping the housing part 1 361562 activity 2 of stamping the housing part 1 51
Table 6
R – resource kindsr description5 family of housing parts29 sheet for housing parts31 material for housing parts51 housing part 158 housing part 860 electric energy150 information on the current availability of a work cell361 housing part 1 before activity 2 of stamping
Table 7
S – organizational unitss description h sl sn13 the MTS sector of the plant 3 2 141 the cutting department 3 0 1342 the department of stamping housing parts 3 0 13111 the work cell 1 of stamping housing parts 2 42 13112 the work cell 2 of stamping housing parts 2 42 13201 the cutting machine 1 0 41211 the press 1 in the work cell 1 of stamping housing parts 1 0 111212 the press 2 in the work cell 1 of stamping housing parts 1 0 111
Table 8
MR – resource placesm description h j11533 place of executive information on the housing parts beyond the MTS sector of the plant 3 3130133 place of executive information on purchased goods before the plant 3 3130232 place of coordinating information on the sheets of metal before the stamping department 3 2130132 place of coordinating information on purchased goods before departments of the plant 3 211532 place of coordinating information on the housing parts beyond the stamping department 3 2130124 place of allocating information on purchased goods before work cells of the plant 2 4130224 place of allocating information on the sheets of metal before stamping work cells 2 411524 place of allocating information on the housing parts beyond stamping work cells 2 4130123 place of executive information on purchased goods before work cells of the plant 2 3130223 place of executive information on the sheets of metal before stamping work cells 2 311523 place of executive information on the housing parts beyond stamping work cells 2 318023 place of executive information on electric energy for work cells 2 3131123 place of executive information on readiness of the work cell 1 to manufacturing housing parts 2 3131223 place of executive information on readiness of the work cell 2 to manufacturing housing parts 2 311522 place of coordinating information on the housing parts beyond output presses 2 21110122 place of coordinating information on the housing parts between the press 1 and the press 2 of the work cell 1 2 2130222 place of coordinating information on the sheets of metal before stamping presses 2 211514 place of allocating information on the housing parts beyond stamping presses 1 41110114 place of allocating information on the housing parts between press 1 and press 2 of the work cell 1 1 4130214 place of allocating information on the sheets of metal before stamping presses 1 411513 place of executive information on the housing parts beyond stamping presses 1 31110113 place of executive information on the housing parts between press 1 and press 2 of the work cell 1 1 3130213 place of executive information on the sheets of metal before stamping presses 1 3
Functional subsystems
and organizational resources
Functional subsystems (s, j) ∈ SJ ⊂ S × J, whichexecute functional activities (s, j, a) ∈ SJA ⊂ S × J× A, are identified by organizational units s ∈ S andfunctional layers j ∈ J, which belong to. Exemplaryfunctional subsystems have been presented below inthe table SJ (Table 9).The kind of a given organizational unit gk(s) is
a group of all activities that may be executed in this
unit [2]. A kind of organizational units, as all activitygroups, formally belongs to the set of activity kinds,gk ∈ G⊂ A. Therefore for each functional subsys-tem one can define a special activity functional unit(s, j, gk(s)) ∈ SJG ⊂ SJA. Other activity function-al units contain transitions (s, j, a, k) ∈ SJA ⊂ S× J × A, which are executed at beginning times orending times of individual activity execution peri-ods [3]. Transitions belonging to an additional func-tional unit (s, j, gk(s)) concern functioning of thefunctional subsystem (s, j) as a whole.
64 Volume 2 • Number 1 • March 2011
Management and Production Engineering Review
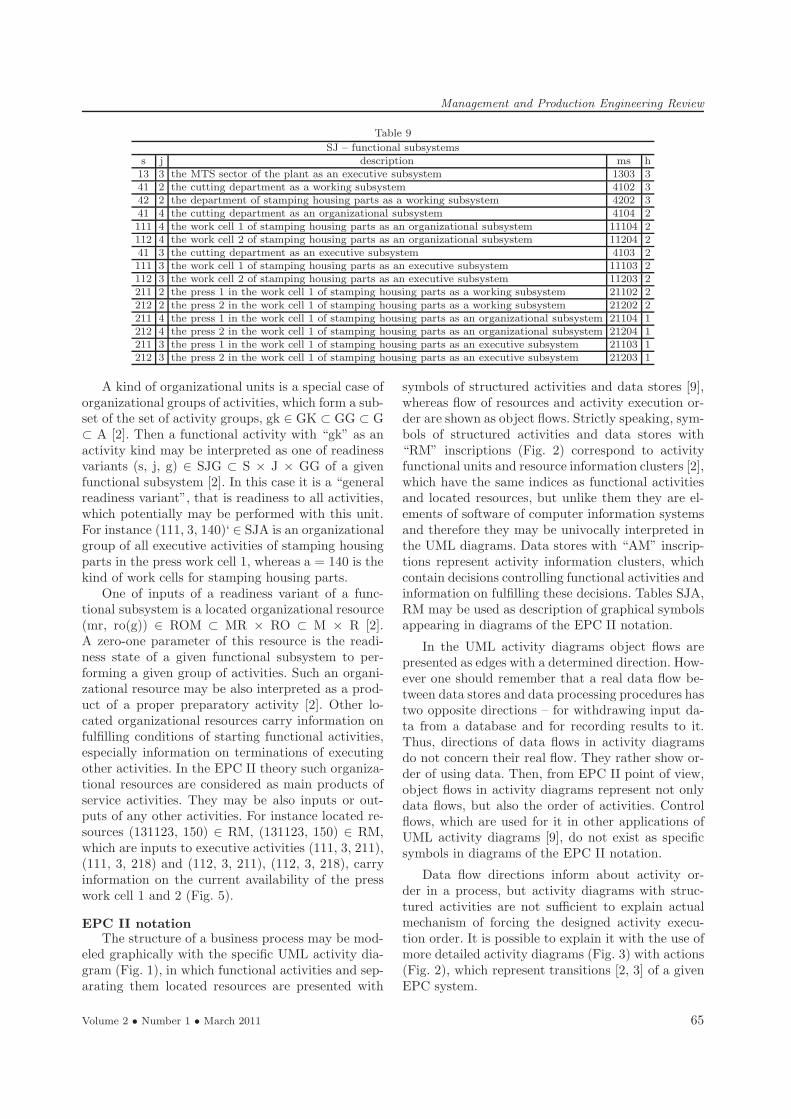
Table 9
SJ – functional subsystemss j description ms h13 3 the MTS sector of the plant as an executive subsystem 1303 341 2 the cutting department as a working subsystem 4102 342 2 the department of stamping housing parts as a working subsystem 4202 341 4 the cutting department as an organizational subsystem 4104 2111 4 the work cell 1 of stamping housing parts as an organizational subsystem 11104 2112 4 the work cell 2 of stamping housing parts as an organizational subsystem 11204 241 3 the cutting department as an executive subsystem 4103 2111 3 the work cell 1 of stamping housing parts as an executive subsystem 11103 2112 3 the work cell 2 of stamping housing parts as an executive subsystem 11203 2211 2 the press 1 in the work cell 1 of stamping housing parts as a working subsystem 21102 2212 2 the press 2 in the work cell 1 of stamping housing parts as a working subsystem 21202 2211 4 the press 1 in the work cell 1 of stamping housing parts as an organizational subsystem 21104 1212 4 the press 2 in the work cell 1 of stamping housing parts as an organizational subsystem 21204 1211 3 the press 1 in the work cell 1 of stamping housing parts as an executive subsystem 21103 1212 3 the press 2 in the work cell 1 of stamping housing parts as an executive subsystem 21203 1
A kind of organizational units is a special case oforganizational groups of activities, which form a sub-set of the set of activity groups, gk ∈ GK ⊂ GG ⊂ G⊂ A [2]. Then a functional activity with “gk” as anactivity kind may be interpreted as one of readinessvariants (s, j, g) ∈ SJG ⊂ S × J × GG of a givenfunctional subsystem [2]. In this case it is a “generalreadiness variant”, that is readiness to all activities,which potentially may be performed with this unit.For instance (111, 3, 140)‘ ∈ SJA is an organizationalgroup of all executive activities of stamping housingparts in the press work cell 1, whereas a = 140 is thekind of work cells for stamping housing parts.One of inputs of a readiness variant of a func-
tional subsystem is a located organizational resource(mr, ro(g)) ∈ ROM ⊂ MR × RO ⊂ M × R [2].A zero-one parameter of this resource is the readi-ness state of a given functional subsystem to per-forming a given group of activities. Such an organi-zational resource may be also interpreted as a prod-uct of a proper preparatory activity [2]. Other lo-cated organizational resources carry information onfulfilling conditions of starting functional activities,especially information on terminations of executingother activities. In the EPC II theory such organiza-tional resources are considered as main products ofservice activities. They may be also inputs or out-puts of any other activities. For instance located re-sources (131123, 150) ∈ RM, (131123, 150) ∈ RM,which are inputs to executive activities (111, 3, 211),(111, 3, 218) and (112, 3, 211), (112, 3, 218), carryinformation on the current availability of the presswork cell 1 and 2 (Fig. 5).
EPC II notation
The structure of a business process may be mod-eled graphically with the specific UML activity dia-gram (Fig. 1), in which functional activities and sep-arating them located resources are presented with
symbols of structured activities and data stores [9],whereas flow of resources and activity execution or-der are shown as object flows. Strictly speaking, sym-bols of structured activities and data stores with“RM” inscriptions (Fig. 2) correspond to activityfunctional units and resource information clusters [2],which have the same indices as functional activitiesand located resources, but unlike them they are el-ements of software of computer information systemsand therefore they may be univocally interpreted inthe UML diagrams. Data stores with “AM” inscrip-tions represent activity information clusters, whichcontain decisions controlling functional activities andinformation on fulfilling these decisions. Tables SJA,RM may be used as description of graphical symbolsappearing in diagrams of the EPC II notation.
In the UML activity diagrams object flows arepresented as edges with a determined direction. How-ever one should remember that a real data flow be-tween data stores and data processing procedures hastwo opposite directions – for withdrawing input da-ta from a database and for recording results to it.Thus, directions of data flows in activity diagramsdo not concern their real flow. They rather show or-der of using data. Then, from EPC II point of view,object flows in activity diagrams represent not onlydata flows, but also the order of activities. Controlflows, which are used for it in other applications ofUML activity diagrams [9], do not exist as specificsymbols in diagrams of the EPC II notation.
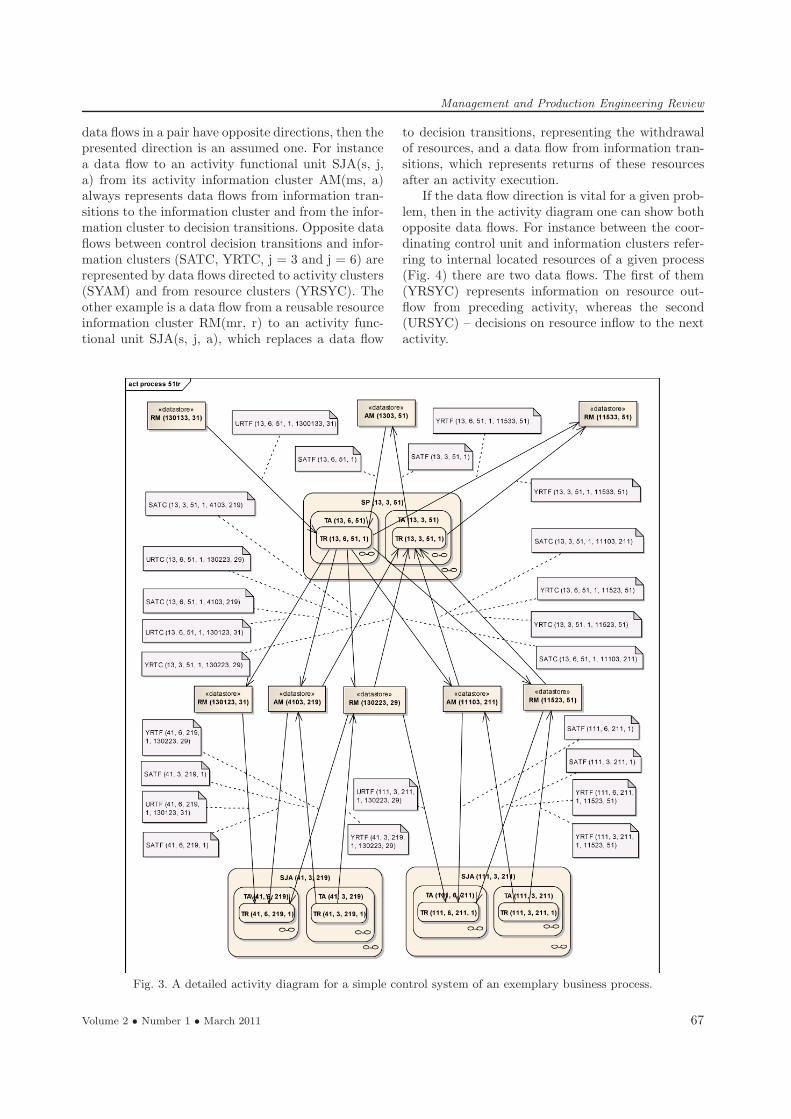
Data flow directions inform about activity or-der in a process, but activity diagrams with struc-tured activities are not sufficient to explain actualmechanism of forcing the designed activity execu-tion order. It is possible to explain it with the use ofmore detailed activity diagrams (Fig. 3) with actions(Fig. 2), which represent transitions [2, 3] of a givenEPC system.
Volume 2 • Number 1 • March 2011 65
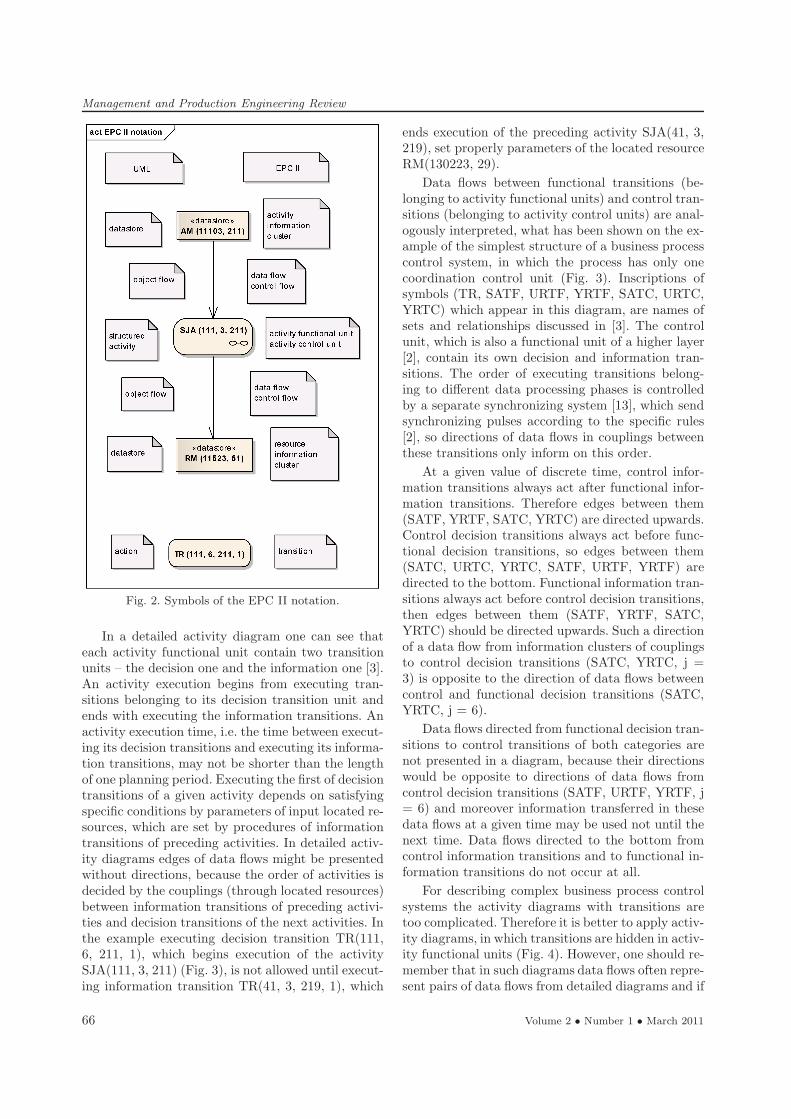
Management and Production Engineering Review
Fig. 2. Symbols of the EPC II notation.
In a detailed activity diagram one can see thateach activity functional unit contain two transitionunits – the decision one and the information one [3].An activity execution begins from executing tran-sitions belonging to its decision transition unit andends with executing the information transitions. Anactivity execution time, i.e. the time between execut-ing its decision transitions and executing its informa-tion transitions, may not be shorter than the lengthof one planning period. Executing the first of decisiontransitions of a given activity depends on satisfyingspecific conditions by parameters of input located re-sources, which are set by procedures of informationtransitions of preceding activities. In detailed activ-ity diagrams edges of data flows might be presentedwithout directions, because the order of activities isdecided by the couplings (through located resources)between information transitions of preceding activi-ties and decision transitions of the next activities. Inthe example executing decision transition TR(111,6, 211, 1), which begins execution of the activitySJA(111, 3, 211) (Fig. 3), is not allowed until execut-ing information transition TR(41, 3, 219, 1), which
ends execution of the preceding activity SJA(41, 3,219), set properly parameters of the located resourceRM(130223, 29).
Data flows between functional transitions (be-longing to activity functional units) and control tran-sitions (belonging to activity control units) are anal-ogously interpreted, what has been shown on the ex-ample of the simplest structure of a business processcontrol system, in which the process has only onecoordination control unit (Fig. 3). Inscriptions ofsymbols (TR, SATF, URTF, YRTF, SATC, URTC,YRTC) which appear in this diagram, are names ofsets and relationships discussed in [3]. The controlunit, which is also a functional unit of a higher layer[2], contain its own decision and information tran-sitions. The order of executing transitions belong-ing to different data processing phases is controlledby a separate synchronizing system [13], which sendsynchronizing pulses according to the specific rules[2], so directions of data flows in couplings betweenthese transitions only inform on this order.
At a given value of discrete time, control infor-mation transitions always act after functional infor-mation transitions. Therefore edges between them(SATF, YRTF, SATC, YRTC) are directed upwards.Control decision transitions always act before func-tional decision transitions, so edges between them(SATC, URTC, YRTC, SATF, URTF, YRTF) aredirected to the bottom. Functional information tran-sitions always act before control decision transitions,then edges between them (SATF, YRTF, SATC,YRTC) should be directed upwards. Such a directionof a data flow from information clusters of couplingsto control decision transitions (SATC, YRTC, j =3) is opposite to the direction of data flows betweencontrol and functional decision transitions (SATC,YRTC, j = 6).
Data flows directed from functional decision tran-sitions to control transitions of both categories arenot presented in a diagram, because their directionswould be opposite to directions of data flows fromcontrol decision transitions (SATF, URTF, YRTF, j= 6) and moreover information transferred in thesedata flows at a given time may be used not until thenext time. Data flows directed to the bottom fromcontrol information transitions and to functional in-formation transitions do not occur at all.
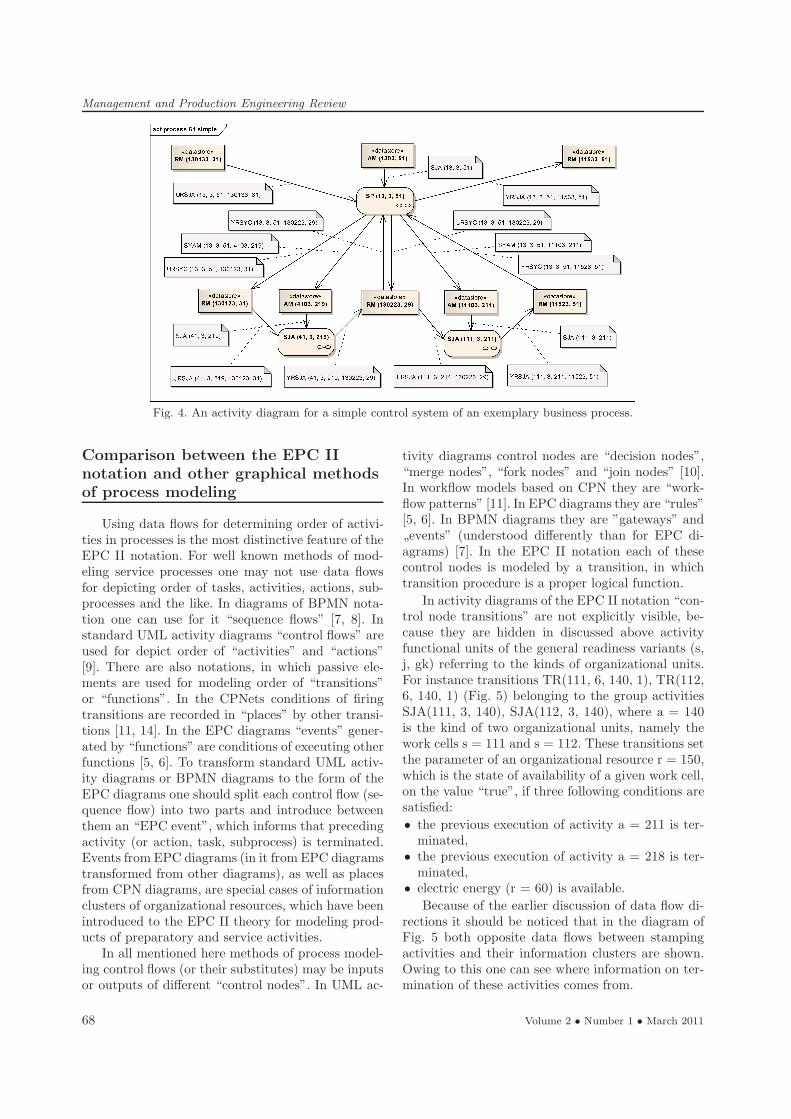
For describing complex business process controlsystems the activity diagrams with transitions aretoo complicated. Therefore it is better to apply activ-ity diagrams, in which transitions are hidden in activ-ity functional units (Fig. 4). However, one should re-member that in such diagrams data flows often repre-sent pairs of data flows from detailed diagrams and if
66 Volume 2 • Number 1 • March 2011
Management and Production Engineering Review
data flows in a pair have opposite directions, then thepresented direction is an assumed one. For instancea data flow to an activity functional unit SJA(s, j,a) from its activity information cluster AM(ms, a)always represents data flows from information tran-sitions to the information cluster and from the infor-mation cluster to decision transitions. Opposite dataflows between control decision transitions and infor-mation clusters (SATC, YRTC, j = 3 and j = 6) arerepresented by data flows directed to activity clusters(SYAM) and from resource clusters (YRSYC). Theother example is a data flow from a reusable resourceinformation cluster RM(mr, r) to an activity func-tional unit SJA(s, j, a), which replaces a data flow
to decision transitions, representing the withdrawalof resources, and a data flow from information tran-sitions, which represents returns of these resourcesafter an activity execution.If the data flow direction is vital for a given prob-
lem, then in the activity diagram one can show bothopposite data flows. For instance between the coor-dinating control unit and information clusters refer-ring to internal located resources of a given process(Fig. 4) there are two data flows. The first of them(YRSYC) represents information on resource out-flow from preceding activity, whereas the second(URSYC) – decisions on resource inflow to the nextactivity.
Fig. 3. A detailed activity diagram for a simple control system of an exemplary business process.
Volume 2 • Number 1 • March 2011 67
Management and Production Engineering Review
Fig. 4. An activity diagram for a simple control system of an exemplary business process.
Comparison between the EPC II
notation and other graphical methods
of process modeling
Using data flows for determining order of activi-ties in processes is the most distinctive feature of theEPC II notation. For well known methods of mod-eling service processes one may not use data flowsfor depicting order of tasks, activities, actions, sub-processes and the like. In diagrams of BPMN nota-tion one can use for it “sequence flows” [7, 8]. Instandard UML activity diagrams “control flows” areused for depict order of “activities” and “actions”[9]. There are also notations, in which passive ele-ments are used for modeling order of “transitions”or “functions”. In the CPNets conditions of firingtransitions are recorded in “places” by other transi-tions [11, 14]. In the EPC diagrams “events” gener-ated by “functions” are conditions of executing otherfunctions [5, 6]. To transform standard UML activ-ity diagrams or BPMN diagrams to the form of theEPC diagrams one should split each control flow (se-quence flow) into two parts and introduce betweenthem an “EPC event”, which informs that precedingactivity (or action, task, subprocess) is terminated.Events from EPC diagrams (in it from EPC diagramstransformed from other diagrams), as well as placesfrom CPN diagrams, are special cases of informationclusters of organizational resources, which have beenintroduced to the EPC II theory for modeling prod-ucts of preparatory and service activities.In all mentioned here methods of process model-
ing control flows (or their substitutes) may be inputsor outputs of different “control nodes”. In UML ac-
tivity diagrams control nodes are “decision nodes”,“merge nodes”, “fork nodes” and “join nodes” [10].In workflow models based on CPN they are “work-flow patterns” [11]. In EPC diagrams they are “rules”[5, 6]. In BPMN diagrams they are ”gateways” and„events” (understood differently than for EPC di-agrams) [7]. In the EPC II notation each of thesecontrol nodes is modeled by a transition, in whichtransition procedure is a proper logical function.
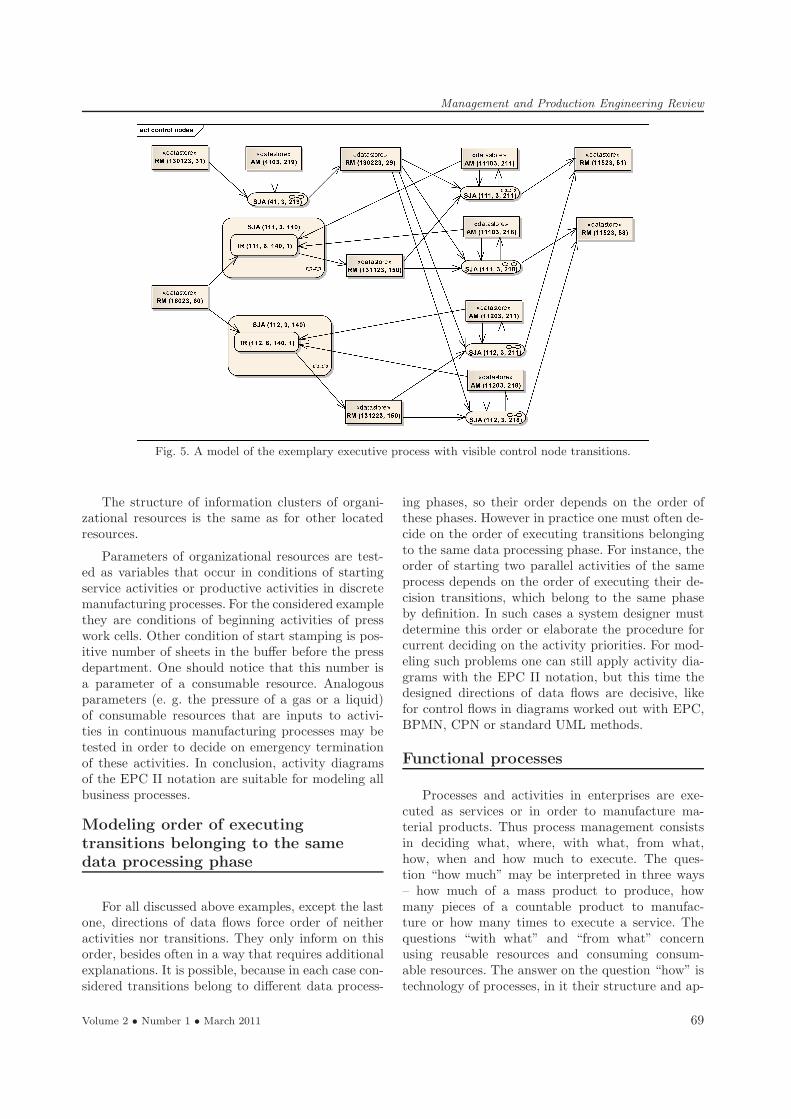
In activity diagrams of the EPC II notation “con-trol node transitions” are not explicitly visible, be-cause they are hidden in discussed above activityfunctional units of the general readiness variants (s,j, gk) referring to the kinds of organizational units.For instance transitions TR(111, 6, 140, 1), TR(112,6, 140, 1) (Fig. 5) belonging to the group activitiesSJA(111, 3, 140), SJA(112, 3, 140), where a = 140is the kind of two organizational units, namely thework cells s = 111 and s = 112. These transitions setthe parameter of an organizational resource r = 150,which is the state of availability of a given work cell,on the value “true”, if three following conditions aresatisfied:
• the previous execution of activity a = 211 is ter-minated,
• the previous execution of activity a = 218 is ter-minated,
• electric energy (r = 60) is available.
Because of the earlier discussion of data flow di-rections it should be noticed that in the diagram ofFig. 5 both opposite data flows between stampingactivities and their information clusters are shown.Owing to this one can see where information on ter-mination of these activities comes from.
68 Volume 2 • Number 1 • March 2011
Management and Production Engineering Review
Fig. 5. A model of the exemplary executive process with visible control node transitions.
The structure of information clusters of organi-zational resources is the same as for other locatedresources.
Parameters of organizational resources are test-ed as variables that occur in conditions of startingservice activities or productive activities in discretemanufacturing processes. For the considered examplethey are conditions of beginning activities of presswork cells. Other condition of start stamping is pos-itive number of sheets in the buffer before the pressdepartment. One should notice that this number isa parameter of a consumable resource. Analogousparameters (e. g. the pressure of a gas or a liquid)of consumable resources that are inputs to activi-ties in continuous manufacturing processes may betested in order to decide on emergency terminationof these activities. In conclusion, activity diagramsof the EPC II notation are suitable for modeling allbusiness processes.
Modeling order of executing
transitions belonging to the same
data processing phase
For all discussed above examples, except the lastone, directions of data flows force order of neitheractivities nor transitions. They only inform on thisorder, besides often in a way that requires additionalexplanations. It is possible, because in each case con-sidered transitions belong to different data process-
ing phases, so their order depends on the order ofthese phases. However in practice one must often de-cide on the order of executing transitions belongingto the same data processing phase. For instance, theorder of starting two parallel activities of the sameprocess depends on the order of executing their de-cision transitions, which belong to the same phaseby definition. In such cases a system designer mustdetermine this order or elaborate the procedure forcurrent deciding on the activity priorities. For mod-eling such problems one can still apply activity dia-grams with the EPC II notation, but this time thedesigned directions of data flows are decisive, likefor control flows in diagrams worked out with EPC,BPMN, CPN or standard UML methods.
Functional processes
Processes and activities in enterprises are exe-cuted as services or in order to manufacture ma-terial products. Thus process management consistsin deciding what, where, with what, from what,how, when and how much to execute. The ques-tion “how much” may be interpreted in three ways– how much of a mass product to produce, howmany pieces of a countable product to manufac-ture or how many times to execute a service. Thequestions “with what” and “from what” concernusing reusable resources and consuming consum-able resources. The answer on the question “how” istechnology of processes, in it their structure and ap-
Volume 2 • Number 1 • March 2011 69
Management and Production Engineering Review
plied procedures. Description of a process structuresanswers also on the question “what to execute”, be-cause it points out kinds of activities, from whichprocesses of given kinds are composed.The answer on the question “where to execute”
a given activity is the identifier of a working subsys-tem (e.g. a department in a plant or a work centerin a work cell). The more detailed answer on thesame question is pointing out the one of organiza-tional subsystems, which a given working subsystemis composed of (e.g. the work cell in a departmentor the workstation in a work center). The answer onthe question “when” are schedules of executive ordersof activities located in organizational subsystems. Itis obvious that the time scale applied to determinedate and time of start and finish of executive ordersis smaller than time scale, which is used to planningburden of organizational subsystems with “allocatedactivities”. In the EPC II theory activities allocat-ed to working subsystems are called “working activ-ities”, whereas activities allocated to organizationalsubsystems and controlled with the time scale ap-plied to organizational systems of the lower level arecalled “executive activities”.Working, allocated and executive activities are
special cases of functional activities. Activity func-tional units (s, j, a) ∈ SJA ⊂ S × J × A from the en-tire enterprise, which correspond to these functionalactivities, form functional layers (h, j) ∈ HJF, iden-tified by a number of organizational levels h ∈ H anda number of layers in a given level j ∈ J = {2, 1, 4, 3}.The list of layers appearing in the considered exam-ples is given in the following table HJF (Table 10).
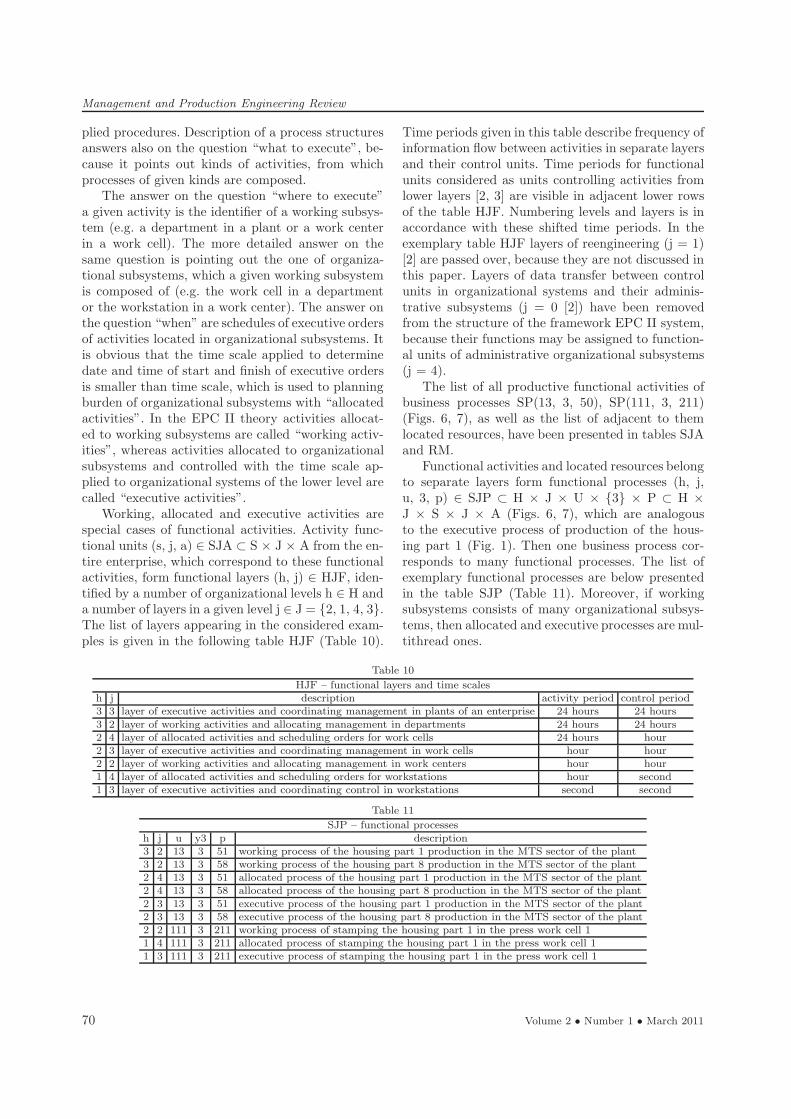
Time periods given in this table describe frequency ofinformation flow between activities in separate layersand their control units. Time periods for functionalunits considered as units controlling activities fromlower layers [2, 3] are visible in adjacent lower rowsof the table HJF. Numbering levels and layers is inaccordance with these shifted time periods. In theexemplary table HJF layers of reengineering (j = 1)[2] are passed over, because they are not discussed inthis paper. Layers of data transfer between controlunits in organizational systems and their adminis-trative subsystems (j = 0 [2]) have been removedfrom the structure of the framework EPC II system,because their functions may be assigned to function-al units of administrative organizational subsystems(j = 4).The list of all productive functional activities of
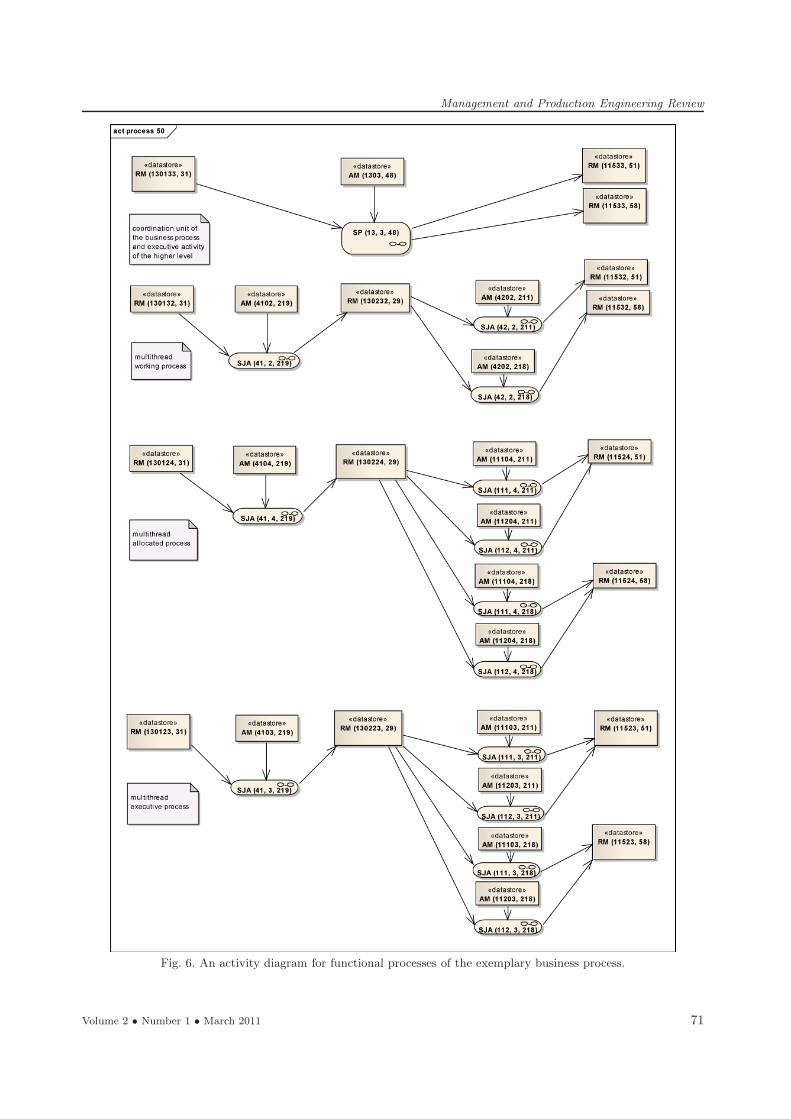
business processes SP(13, 3, 50), SP(111, 3, 211)(Figs. 6, 7), as well as the list of adjacent to themlocated resources, have been presented in tables SJAand RM.Functional activities and located resources belong
to separate layers form functional processes (h, j,u, 3, p) ∈ SJP ⊂ H × J × U × {3} × P ⊂ H ×J × S × J × A (Figs. 6, 7), which are analogousto the executive process of production of the hous-ing part 1 (Fig. 1). Then one business process cor-responds to many functional processes. The list ofexemplary functional processes are below presentedin the table SJP (Table 11). Moreover, if workingsubsystems consists of many organizational subsys-tems, then allocated and executive processes are mul-tithread ones.
Table 10
HJF – functional layers and time scalesh j description activity period control period3 3 layer of executive activities and coordinating management in plants of an enterprise 24 hours 24 hours3 2 layer of working activities and allocating management in departments 24 hours 24 hours2 4 layer of allocated activities and scheduling orders for work cells 24 hours hour2 3 layer of executive activities and coordinating management in work cells hour hour2 2 layer of working activities and allocating management in work centers hour hour1 4 layer of allocated activities and scheduling orders for workstations hour second1 3 layer of executive activities and coordinating control in workstations second second
Table 11
SJP – functional processesh j u y3 p description3 2 13 3 51 working process of the housing part 1 production in the MTS sector of the plant3 2 13 3 58 working process of the housing part 8 production in the MTS sector of the plant2 4 13 3 51 allocated process of the housing part 1 production in the MTS sector of the plant2 4 13 3 58 allocated process of the housing part 8 production in the MTS sector of the plant2 3 13 3 51 executive process of the housing part 1 production in the MTS sector of the plant2 3 13 3 58 executive process of the housing part 8 production in the MTS sector of the plant2 2 111 3 211 working process of stamping the housing part 1 in the press work cell 11 4 111 3 211 allocated process of stamping the housing part 1 in the press work cell 11 3 111 3 211 executive process of stamping the housing part 1 in the press work cell 1
70 Volume 2 • Number 1 • March 2011
Management and Production Engineering Review
Fig. 6. An activity diagram for functional processes of the exemplary business process.
Volume 2 • Number 1 • March 2011 71
Management and Production Engineering Review
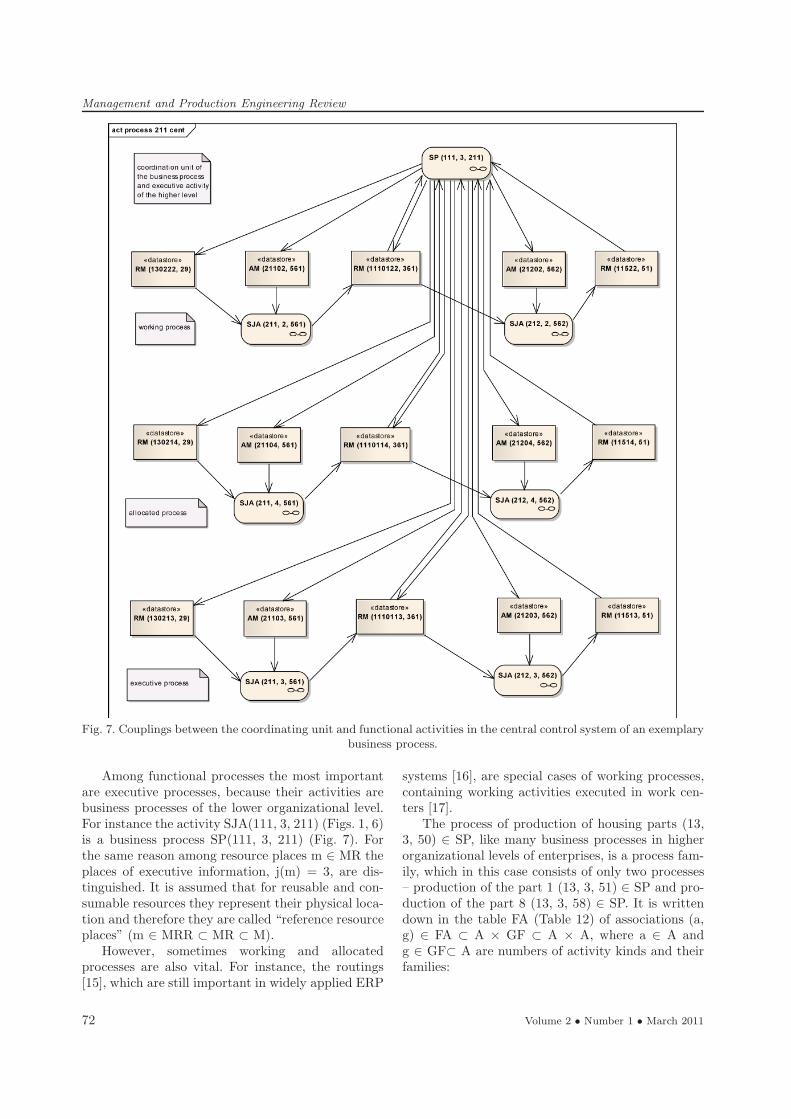
Fig. 7. Couplings between the coordinating unit and functional activities in the central control system of an exemplarybusiness process.
Among functional processes the most importantare executive processes, because their activities arebusiness processes of the lower organizational level.For instance the activity SJA(111, 3, 211) (Figs. 1, 6)is a business process SP(111, 3, 211) (Fig. 7). Forthe same reason among resource places m ∈ MR theplaces of executive information, j(m) = 3, are dis-tinguished. It is assumed that for reusable and con-sumable resources they represent their physical loca-tion and therefore they are called “reference resourceplaces” (m ∈ MRR ⊂ MR ⊂ M).However, sometimes working and allocated
processes are also vital. For instance, the routings[15], which are still important in widely applied ERP
systems [16], are special cases of working processes,containing working activities executed in work cen-ters [17].The process of production of housing parts (13,
3, 50) ∈ SP, like many business processes in higherorganizational levels of enterprises, is a process fam-ily, which in this case consists of only two processes– production of the part 1 (13, 3, 51) ∈ SP and pro-duction of the part 8 (13, 3, 58) ∈ SP. It is writtendown in the table FA (Table 12) of associations (a,g) ∈ FA ⊂ A × GF ⊂ A × A, where a ∈ A andg ∈ GF⊂ A are numbers of activity kinds and theirfamilies:
72 Volume 2 • Number 1 • March 2011
Management and Production Engineering Review
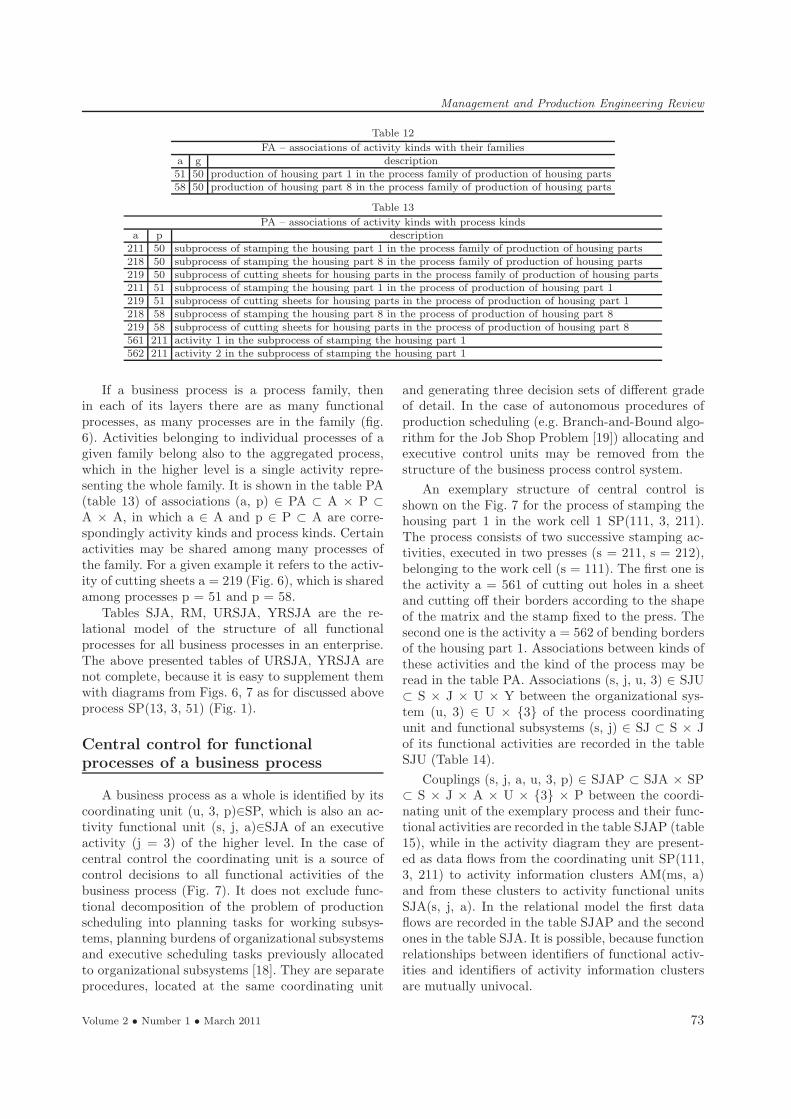
Table 12
FA – associations of activity kinds with their familiesa g description51 50 production of housing part 1 in the process family of production of housing parts58 50 production of housing part 8 in the process family of production of housing parts
Table 13
PA – associations of activity kinds with process kindsa p description211 50 subprocess of stamping the housing part 1 in the process family of production of housing parts218 50 subprocess of stamping the housing part 8 in the process family of production of housing parts219 50 subprocess of cutting sheets for housing parts in the process family of production of housing parts211 51 subprocess of stamping the housing part 1 in the process of production of housing part 1219 51 subprocess of cutting sheets for housing parts in the process of production of housing part 1218 58 subprocess of stamping the housing part 8 in the process of production of housing part 8219 58 subprocess of cutting sheets for housing parts in the process of production of housing part 8561 211 activity 1 in the subprocess of stamping the housing part 1562 211 activity 2 in the subprocess of stamping the housing part 1
If a business process is a process family, thenin each of its layers there are as many functionalprocesses, as many processes are in the family (fig.6). Activities belonging to individual processes of agiven family belong also to the aggregated process,which in the higher level is a single activity repre-senting the whole family. It is shown in the table PA(table 13) of associations (a, p) ∈ PA ⊂ A × P ⊂A × A, in which a ∈ A and p ∈ P ⊂ A are corre-spondingly activity kinds and process kinds. Certainactivities may be shared among many processes ofthe family. For a given example it refers to the activ-ity of cutting sheets a = 219 (Fig. 6), which is sharedamong processes p = 51 and p = 58.Tables SJA, RM, URSJA, YRSJA are the re-
lational model of the structure of all functionalprocesses for all business processes in an enterprise.The above presented tables of URSJA, YRSJA arenot complete, because it is easy to supplement themwith diagrams from Figs. 6, 7 as for discussed aboveprocess SP(13, 3, 51) (Fig. 1).
Central control for functional
processes of a business process
A business process as a whole is identified by itscoordinating unit (u, 3, p)∈SP, which is also an ac-tivity functional unit (s, j, a)∈SJA of an executiveactivity (j = 3) of the higher level. In the case ofcentral control the coordinating unit is a source ofcontrol decisions to all functional activities of thebusiness process (Fig. 7). It does not exclude func-tional decomposition of the problem of productionscheduling into planning tasks for working subsys-tems, planning burdens of organizational subsystemsand executive scheduling tasks previously allocatedto organizational subsystems [18]. They are separateprocedures, located at the same coordinating unit
and generating three decision sets of different gradeof detail. In the case of autonomous procedures ofproduction scheduling (e.g. Branch-and-Bound algo-rithm for the Job Shop Problem [19]) allocating andexecutive control units may be removed from thestructure of the business process control system.
An exemplary structure of central control isshown on the Fig. 7 for the process of stamping thehousing part 1 in the work cell 1 SP(111, 3, 211).The process consists of two successive stamping ac-tivities, executed in two presses (s = 211, s = 212),belonging to the work cell (s = 111). The first one isthe activity a = 561 of cutting out holes in a sheetand cutting off their borders according to the shapeof the matrix and the stamp fixed to the press. Thesecond one is the activity a = 562 of bending bordersof the housing part 1. Associations between kinds ofthese activities and the kind of the process may beread in the table PA. Associations (s, j, u, 3) ∈ SJU⊂ S × J × U × Y between the organizational sys-tem (u, 3) ∈ U × {3} of the process coordinatingunit and functional subsystems (s, j) ∈ SJ ⊂ S × Jof its functional activities are recorded in the tableSJU (Table 14).
Couplings (s, j, a, u, 3, p) ∈ SJAP ⊂ SJA × SP⊂ S × J × A × U × {3} × P between the coordi-nating unit of the exemplary process and their func-tional activities are recorded in the table SJAP (table15), while in the activity diagram they are present-ed as data flows from the coordinating unit SP(111,3, 211) to activity information clusters AM(ms, a)and from these clusters to activity functional unitsSJA(s, j, a). In the relational model the first dataflows are recorded in the table SJAP and the secondones in the table SJA. It is possible, because functionrelationships between identifiers of functional activ-ities and identifiers of activity information clustersare mutually univocal.
Volume 2 • Number 1 • March 2011 73

Management and Production Engineering Review
Table 14
SJU – couplings between functional subsystems and their control unitss j u y description ms h13 3 13 4 the MTS sector of the plant as an executive subsystem in an organizational subsystem 1303 341 2 13 3 the cutting department as a working subsystem in an organizational system 4102 342 2 13 3 the press department as a working subsystem in an organizational system 4202 341 4 41 2 the cutting department as an organizational subsystem in a working subsystem 4104 2111 4 42 2 the press work cell 1 as an organizational subsystem in a working subsystem 11104 2112 4 42 2 the press work cell 2 as an organizational subsystem in a working subsystem 11204 241 3 41 4 the cutting department as an executive subsystem in an organizational subsystem 4103 2111 3 111 4 the press work cell 1 as an executive subsystem in an organizational subsystem 11103 2112 3 112 4 the press work cell 2 as an executive subsystem in an organizational subsystem 11203 2211 2 111 3 the press 1 in the work cell 1 as a working subsystem in an organizational system 21102 2212 2 111 3 the press 2 in the work cell 1 as a working subsystem in an organizational system 21202 2211 4 111 3 the press 1 in the work cell 1 as an organizational subsystem in an organizational system 21104 1212 4 111 3 the press 2 in the work cell 1 as an organizational subsystem in an organizational system 21204 1211 3 111 3 the press 1 in the work cell 1 as an executive subsystem in an organizational subsystem 21103 1212 3 111 3 the press 2 in the work cell 1 as an executive subsystem in an organizational subsystem 21203 1
Table 15
SJAP – couplings between functional activities of a stamping process and their coordinating control unitss j a u y p description ms h211 2 561 111 3 211 activity 1 in the working process of stamping the housing part 1 in the press work cell 1 21102 2212 2 562 111 3 211 activity 2 in the working process of stamping the housing part 1 in the press work cell 1 21202 2211 4 561 111 3 211 activity 1 in the allocated process of stamping the housing part 1 in the press work cell 1 21104 1212 4 562 111 3 211 activity 2 in the allocated process of stamping the housing part 1 in the press work cell 1 21204 1211 3 561 111 3 211 activity 1 in the executive process of stamping the housing part 1 in the press work cell 1 21103 1212 3 562 111 3 211 activity 2 in the executive process of stamping the housing part 1 in the press work cell 1 21203 1
The coordinating unit of a business process isconnected with its functional activities not onlythrough above discussed activity couplings, but al-so by input and output resource couplings (Fig. 7):
(s, j, a, m, r, u, 3, p) ∈ URSJAP ⊂ URSJA × SP
⊂ S × J × A × M × R × U × {3} × P,
(s, j, a, m, r, u, 3, p) ∈ YRSJAP ⊂ YRSJA × SP
⊂ S × J × A × M × R × U × {3} × P,
which are split into associations
(m, r, u, 3, p) ∈ URSYP
⊂ RM × SP ⊂ M × R × U × {3} × P,
(m, r, u, 3, p) ∈ YRSYP
⊂ RM × SP ⊂ M × R × U × {3} × P
of the coordinating unit (u, 3, p) ∈ SP with resourceinformation clusters (m, r) ∈ RM and associations
(s, j, a, m, r) ∈ URSJA ⊂ SJA × RM
⊂ S × J × A × M × R,
(s, j, a, m, r) ∈ YRSJA ⊂ SJA × RM
⊂ S × J × A × M × R
of resource information clusters (m, r)∈RM withfunctional activities (s, j, a)∈SJA. The partial asso-ciations are represented in activity diagrams by dataflows between the coordinating unit SP(u, 3, p) andresource information clusters RM(m, r), as well asbetween these clusters and activity functional unitsSJA(s, j, a).
Multilayer follow-up control
for functional processes
of a business process
Apart from the centralized structure there areother structures of business process control systems.The most distributed one (that does not mean themost general) is the structure of the follow-up pro-duction control system [17], which is presented inthe Fig. 8 for the exemplary process SP(13, 3, 50).Activity functional units SJA, appearing in this di-agram, are also activity control units [2, 3], whichprocess decisions into more detailed decisions. Thecoordinating control unit is as well an activity func-tional unit of the higher level, what has been abovediscussed.
General formal description of couplings betweenfunctional activities and their activity control unitsis analogous to the description of couplings in thecentral control system. One should only replace thekind of a process p ∈ P ⊂ A with the kind of a supe-rior activity c ∈ C ⊂ A and the number y=3 of thelayer of coordinating management with the numberof any control layer y ∈ Y ⊂ J. Activity couplingsand resource couplings between activity functionaland control units
(s, j, a, u, y, c) ∈ SJAC ⊂ SJA × SYC
⊂ S × J × A × U × Y × C,
74 Volume 2 • Number 1 • March 2011
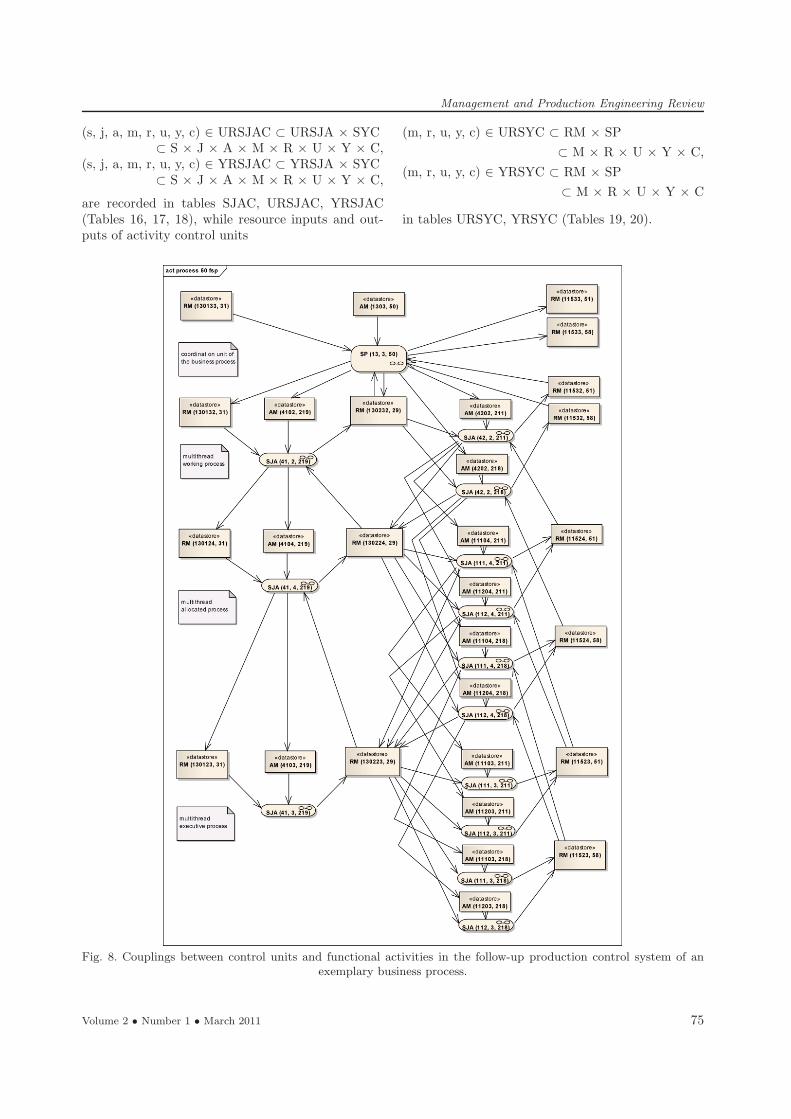
Management and Production Engineering Review
(s, j, a, m, r, u, y, c) ∈ URSJAC ⊂ URSJA × SYC⊂ S × J × A × M × R × U × Y × C,
(s, j, a, m, r, u, y, c) ∈ YRSJAC ⊂ YRSJA × SYC⊂ S × J × A × M × R × U × Y × C,
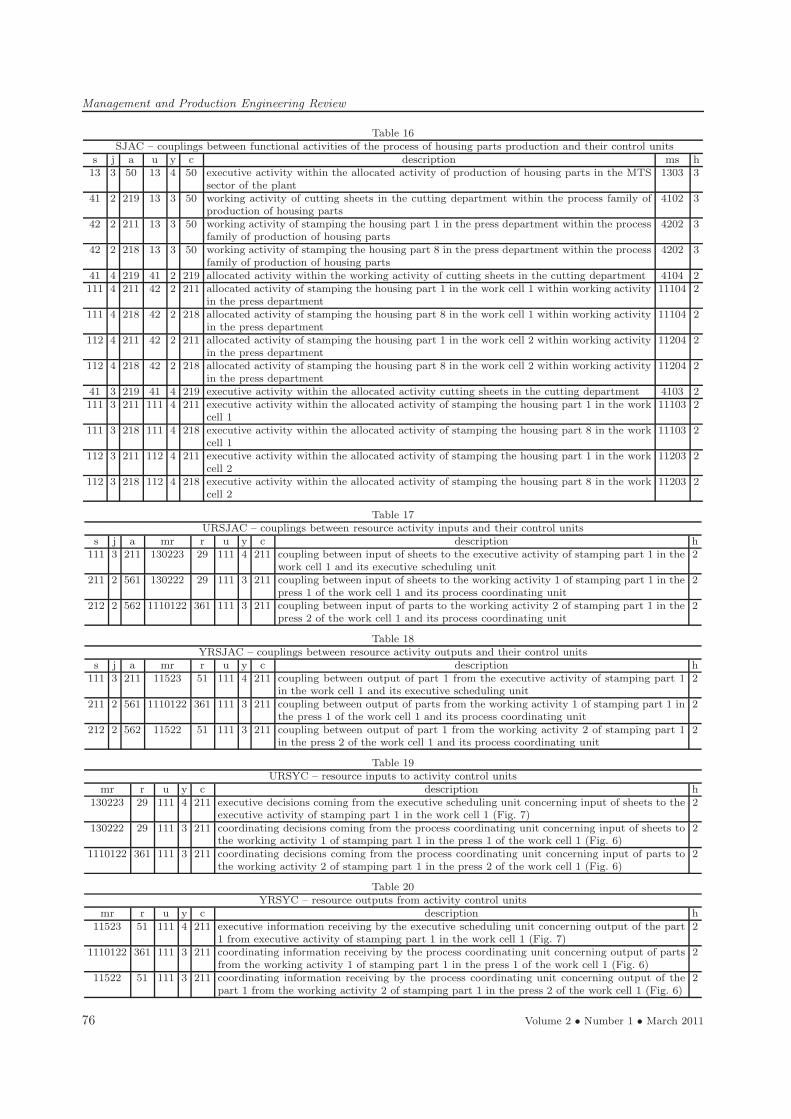
are recorded in tables SJAC, URSJAC, YRSJAC(Tables 16, 17, 18), while resource inputs and out-puts of activity control units
(m, r, u, y, c) ∈ URSYC ⊂ RM × SP
⊂ M × R × U × Y × C,
(m, r, u, y, c) ∈ YRSYC ⊂ RM × SP
⊂ M × R × U × Y × C
in tables URSYC, YRSYC (Tables 19, 20).
Fig. 8. Couplings between control units and functional activities in the follow-up production control system of anexemplary business process.
Volume 2 • Number 1 • March 2011 75
Management and Production Engineering Review
Table 16SJAC – couplings between functional activities of the process of housing parts production and their control units
s j a u y c description ms h13 3 50 13 4 50 executive activity within the allocated activity of production of housing parts in the MTS
sector of the plant1303 3
41 2 219 13 3 50 working activity of cutting sheets in the cutting department within the process family ofproduction of housing parts
4102 3
42 2 211 13 3 50 working activity of stamping the housing part 1 in the press department within the processfamily of production of housing parts
4202 3
42 2 218 13 3 50 working activity of stamping the housing part 8 in the press department within the processfamily of production of housing parts
4202 3
41 4 219 41 2 219 allocated activity within the working activity of cutting sheets in the cutting department 4104 2111 4 211 42 2 211 allocated activity of stamping the housing part 1 in the work cell 1 within working activity
in the press department11104 2
111 4 218 42 2 218 allocated activity of stamping the housing part 8 in the work cell 1 within working activityin the press department
11104 2
112 4 211 42 2 211 allocated activity of stamping the housing part 1 in the work cell 2 within working activityin the press department
11204 2
112 4 218 42 2 218 allocated activity of stamping the housing part 8 in the work cell 2 within working activityin the press department
11204 2
41 3 219 41 4 219 executive activity within the allocated activity cutting sheets in the cutting department 4103 2111 3 211 111 4 211 executive activity within the allocated activity of stamping the housing part 1 in the work
cell 111103 2
111 3 218 111 4 218 executive activity within the allocated activity of stamping the housing part 8 in the workcell 1
11103 2
112 3 211 112 4 211 executive activity within the allocated activity of stamping the housing part 1 in the workcell 2
11203 2
112 3 218 112 4 218 executive activity within the allocated activity of stamping the housing part 8 in the workcell 2
11203 2
Table 17URSJAC – couplings between resource activity inputs and their control units
s j a mr r u y c description h111 3 211 130223 29 111 4 211 coupling between input of sheets to the executive activity of stamping part 1 in the
work cell 1 and its executive scheduling unit2
211 2 561 130222 29 111 3 211 coupling between input of sheets to the working activity 1 of stamping part 1 in thepress 1 of the work cell 1 and its process coordinating unit
2
212 2 562 1110122 361 111 3 211 coupling between input of parts to the working activity 2 of stamping part 1 in thepress 2 of the work cell 1 and its process coordinating unit
2
Table 18YRSJAC – couplings between resource activity outputs and their control units
s j a mr r u y c description h111 3 211 11523 51 111 4 211 coupling between output of part 1 from the executive activity of stamping part 1
in the work cell 1 and its executive scheduling unit2
211 2 561 1110122 361 111 3 211 coupling between output of parts from the working activity 1 of stamping part 1 inthe press 1 of the work cell 1 and its process coordinating unit
2
212 2 562 11522 51 111 3 211 coupling between output of part 1 from the working activity 2 of stamping part 1in the press 2 of the work cell 1 and its process coordinating unit
2
Table 19URSYC – resource inputs to activity control units
mr r u y c description h130223 29 111 4 211 executive decisions coming from the executive scheduling unit concerning input of sheets to the
executive activity of stamping part 1 in the work cell 1 (Fig. 7)2
130222 29 111 3 211 coordinating decisions coming from the process coordinating unit concerning input of sheets tothe working activity 1 of stamping part 1 in the press 1 of the work cell 1 (Fig. 6)
2
1110122 361 111 3 211 coordinating decisions coming from the process coordinating unit concerning input of parts tothe working activity 2 of stamping part 1 in the press 2 of the work cell 1 (Fig. 6)
2
Table 20YRSYC – resource outputs from activity control units
mr r u y c description h11523 51 111 4 211 executive information receiving by the executive scheduling unit concerning output of the part
1 from executive activity of stamping part 1 in the work cell 1 (Fig. 7)2
1110122 361 111 3 211 coordinating information receiving by the process coordinating unit concerning output of partsfrom the working activity 1 of stamping part 1 in the press 1 of the work cell 1 (Fig. 6)
2
11522 51 111 3 211 coordinating information receiving by the process coordinating unit concerning output of thepart 1 from the working activity 2 of stamping part 1 in the press 2 of the work cell 1 (Fig. 6)
2
76 Volume 2 • Number 1 • March 2011
Management and Production Engineering Review
Obviously, the structure of the central controlsystem is a special case of the general structure ofbusiness process control systems. It may be record-ed as inclusions P ⊂ C, SP ⊂ SYC, SJAP ⊂SJAC, URSJAP ⊂ URSJAC, YRSJAP ⊂ YRSJAC,URSYP ⊂ URSYC, YRSYP ⊂ YRSYC. Then thetable SJAC that is presented below should be sup-plemented by the table SJAP concerning the exem-plary process of the lower level. In the exemplarytables URSJAC, YRSJAC, URSYC, YRSYC onlyseveral selected rows have been shown. Among themthere are rows belonging to tables URSJAP, YRS-JAP, URSYP, YRSYP.
Conclusions
Business process models, expressed in notationsof UML, BPMN, EPC, CPN may be always trans-formed into activity diagrams of the EPC II nota-tion, which uses selected graphical symbols of theUML. What is more, EPC II diagrams may be ap-plied for modeling business process control systemsin all functional layers and organizational levels of anenterprise. Both, process structure and structure ofbusiness process control system, may be recorded inthe relational database of the universal frameworkEPC II system. It refers to any business processesin any enterprises, irrespective of their branch andsize, as well as to any production control methods,irrespective of control system structures and decisionprocedures called by their transitions.
References
[1] Blackstone J.H., Cox J.F., APICS Dictionary, 10Edition 2002, 11 Edition 2005.
[2] Zaborowski M., The EPC theory. Basic Notions ofEnterprise Process Control, Management and Pro-duction Engineering Review, 1, 3, 75–96, September2010.
[3] Zaborowski M., The EPC theory. Couplings betweenTransitions in Enterprise Process Control Systems,Management and Production Engineering Review,1, 4, 77–92, December 2010.
[4] Zaborowski M., The Follow-up Production Control,Publishing House of Silesian University of Technol-ogy, Gliwice, 2003 (in Polish).
[5] Scheer A.-W., Business Process Engineering, Ref-erence Models for Industrial Enterprises, Springer-Verlag, 1994.
[6] Davis R., Brabander E., ARIS Design Platform,Getting Started with BPM, Springer-Verlag, 2007.
[7] The Business Process Model, Sparx Systems, 2007,http://www.sparxsystems.com
[8] Business Process Model and Notation (BPMN),v.2.0, 2011, http://www.omg.org/spec/BPMN/2.0
[9] Using UML Part Two – Behavioral Modeling Dia-grams. Sparx Systems, 2007,http://www.sparxsystems.com
[10] OMG Unified Modeling Language, Superstruc-ture, version 2.3. May 2010, http://www.omg.org/-spec/UML/2.3/Superstructure/PDF/
[11] van der Aalst W., van Hee K., Workflow Manage-ment, Models, Methods and Systems, MIT Press,2002.
[12] Browne J., Harhen J., Shivnan J., Production Man-agement Systems, Addison-Wesley 1996.
[13] Zaborowski M., The Information-Decision Modelof Resource Management, Chapter 5 in M. Gruz,M. Lisiński [Ed.], P. Markiewicz, H. Walica, M.Zaborowski “Resource Management in an Enter-prise”, Publishing House of Academy of Business inDąbrowa Górnicza, 2006, pp. 139–204 (in Polish).
[14] Jensen K., Colored Petri Nets, Springer-Verlag,Berlin, 1997.
[15] Landvater D.V., Gray C.D., MRP II Standard Sys-tem, Oliver Wight Publications, 1989.
[16] Ptak C.A., Schragenheim E., ERP Tools, Tech-niques and Applications for Integrating the SupplyChain. The St. Lucie Press, 2004.
[17] Zaborowski M., The Follow-up Control of Enter-prise Resources, Publishing House of J. Skalmierski,Gliwice, 2008 (in Polish).
[18] Sawik T., Discrete Optimization in Flexible Manu-facturing Systems, WNT, Warsaw, 1992 (in Polish).
[19] Pinedo M., Scheduling: theory, algorithms and sys-tems, Springer-Verlag, 2007.
Volume 2 • Number 1 • March 2011 77