Embed Size (px)
Citation preview

THE GLOBAL HOUSE OF PRESTIGE BEAUTY
ANNUAL STOCKHOLDERS’ MEETINGNOVEMBER 14, 2017
FABRIZIO FREDA
PRESIDENT AND CHIEF EXECUTIVE OFFICER
FORWARD-LOOKING INFORMATIONThe forward-looking statements in this presentation, including those containing words and phrases like “will likely result,” “expect,” “believe,” “planned,” “may,” “should,” “could,” “anticipate,”
“estimate,” “project,” “intend,” “forecast” or similar expressions are intended to identify “forward-looking statements” within the meaning of the Private Securities Litigation Reform Act of 1995. These
statements include our expectations regarding sales, earnings or other future financial performance and liquidity, product introductions, entry into new geographic regions, information systems
initiatives, new methods of sale, our long-term strategy, restructuring and other charges and resulting cost savings, and future operations or operating results. Although we believe that our
expectations are based on reasonable assumptions within the bounds of our knowledge of our business and operations, actual results may differ materially from our expectations. Factors that could
cause actual results to differ from expectations include, without limitation:
(1) increased competitive activity from companies in the skin care, makeup, fragrance and hair care businesses;
(2) our ability to develop, produce and market new products on which future operating results may depend and to successfully address challenges in our business;
(3) consolidations, restructurings, bankruptcies and reorganizations in the retail industry causing a decrease in the number of stores that sell our products, an increase in the ownership concentration
within the retail industry, ownership of retailers by our competitors or ownership of competitors by our customers that are retailers and our inability to collect receivables;
(4) destocking and tighter working capital management by retailers;
(5) the success, or changes in timing or scope, of new product launches and the success, or changes in the timing or the scope, of advertising, sampling and merchandising programs;
(6) shifts in the preferences of consumers as to where and how they shop;
(7) social, political and economic risks to our foreign or domestic manufacturing, distribution and retail operations, including changes in foreign investment and trade policies and regulations of the
host countries and of the United States;
(8) changes in the laws, regulations and policies (including the interpretations and enforcement thereof) that affect, or will affect, our business, including those relating to our products or distribution
networks, changes in accounting standards, tax laws and regulations, environmental or climate change laws, regulations or accords, trade rules and customs regulations, and the outcome and
expense of legal or regulatory proceedings, and any action we may take as a result;
(9) foreign currency fluctuations affecting our results of operations and the value of our foreign assets, the relative prices at which we and our foreign competitors sell products in the same markets
and our operating and manufacturing costs outside of the United States;
(10) changes in global or local conditions, including those due to the volatility in the global credit and equity markets, natural or man-made disasters, real or perceived epidemics, or energy costs, that
could affect consumer purchasing, the willingness or ability of consumers to travel and/or purchase our products while traveling, the financial strength of our customers, suppliers or other contract
counterparties, our operations, the cost and availability of capital which we may need for new equipment, facilities or acquisitions, the returns that we are able to generate on our pension assets and
the resulting impact on funding obligations, the cost and availability of raw materials and the assumptions underlying our critical accounting estimates;
(11) shipment delays, commodity pricing, depletion of inventory and increased production costs resulting from disruptions of operations at any of the facilities that manufacture nearly all of our supply
of a particular type of product (i.e. focus factories) or at our distribution or inventory centers, including disruptions that may be caused by the implementation of information technology initiatives, or by
restructurings;
(12) real estate rates and availability, which may affect our ability to increase or maintain the number of retail locations at which we sell our products and the costs associated with our other facilities;
(13) changes in product mix to products which are less profitable;
(14) our ability to acquire, develop or implement new information and distribution technologies and initiatives on a timely basis and within our cost estimates and our ability to maintain continuous
operations of such systems and the security of data and other information that may be stored in such systems or other systems or media;
(15) our ability to capitalize on opportunities for improved efficiency, such as publicly-announced strategies and restructuring and cost-savings initiatives, and to integrate acquired businesses and
realize value therefrom;
(16) consequences attributable to local or international conflicts around the world, as well as from any terrorist action, retaliation and the threat of further action or retaliation;
(17) the timing and impact of acquisitions, investments and divestitures; and
(18) additional factors as described in our filings with the Securities and Exchange Commission, including the Annual Report on Form 10-K for the fiscal year ended June 30, 2017.
We assume no responsibility to update forward-looking statements made herein or otherwise.
NON-GAAPDISCLOSURES
These materials include some non-GAAP financial measures
relating to: constant currency; charges associated with
restructuring and other activities; goodwill and other intangible
asset impairments; changes in the fair value of contingent
consideration; and the China deferred tax asset valuation
allowance reversal. We use certain non-GAAP financial
measures, among other financial measures, to evaluate our
operating performance, which represent the manner in which
we conduct and view our business. Management believes that
excluding certain items that are not comparable from period to
period, or do not reflect our underlying ongoing business,
provides transparency for such items and helps investors and
others compare and analyze operating performance from period
to period. In the future, we expect to incur charges or
adjustments similar in nature to those listed above below;
however, the impact to our results in a given period may be
highly variable and difficult to predict. Our non-GAAP financial
measures may not be comparable to similarly titled measures
used by, or determined in a manner consistent with, other
companies. While we consider the non-GAAP measures useful
in analyzing our results, they are not intended to replace, or act
as a substitute for, any presentation included in the
consolidated financial statements prepared in conformity with
U.S. GAAP. Information about GAAP and non-GAAP financial
measures, including reconciliation information, is included on
the Investors area of the Company’s website,
www.elcompanies.com, under the heading “GAAP
Reconciliation.”

FISCAL 2017 HIGHLIGHTS
Grew net sales ahead of global prestige
beauty; gained share
Pivoted business to capture new consumers
Achieved strong double-digit sales growth
in key areas
Accelerated momentum in every quarter
throughout the year
Acquired Too Faced and BECCA
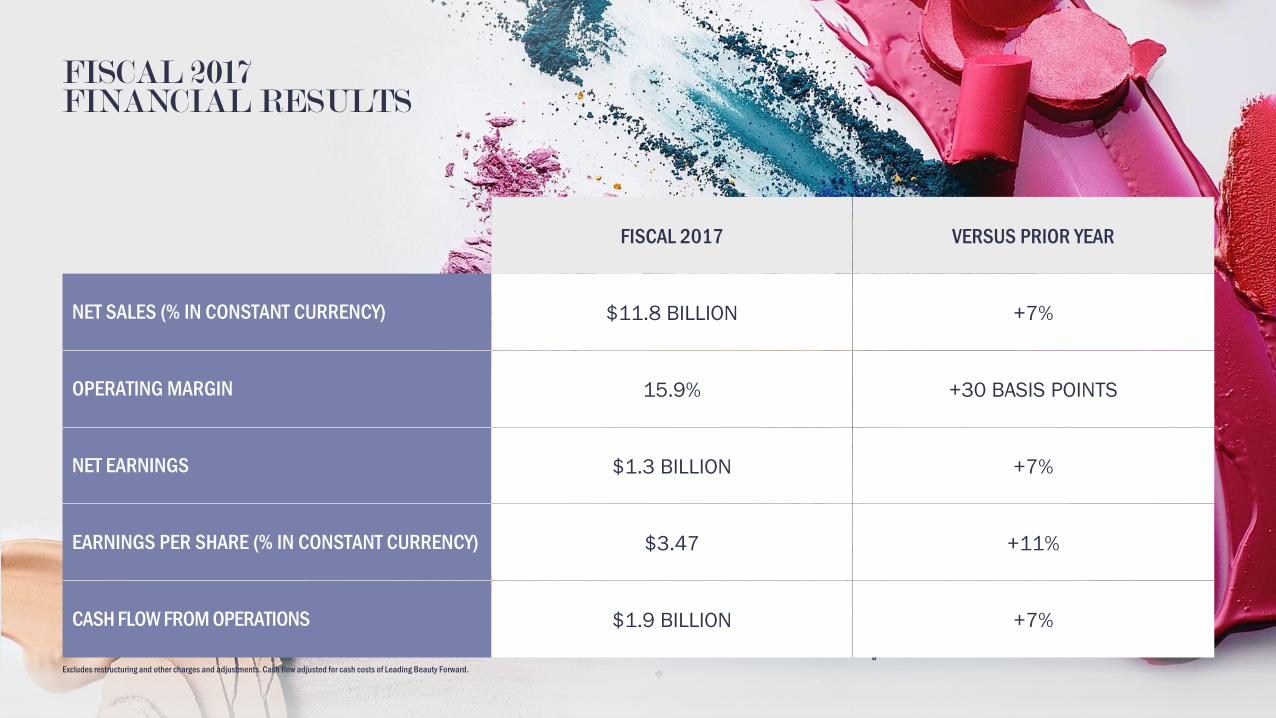
FISCAL 2017 FINANCIAL RESULTS
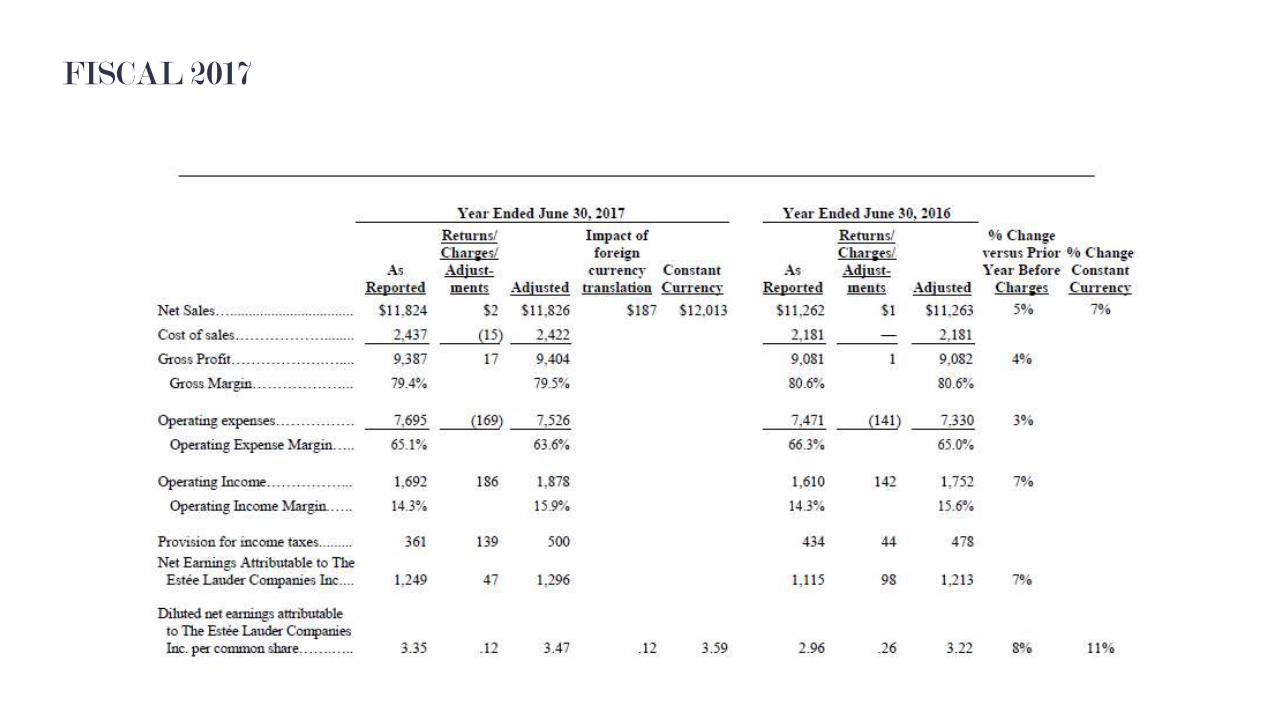
FISCAL 2017 VERSUS PRIOR YEAR
NET SALES (% IN CONSTANT CURRENCY) $11.8 BILLION +7%
OPERATING MARGIN 15.9% +30 BASIS POINTS
NET EARNINGS $1.3 BILLION +7%
EARNINGS PER SHARE (% IN CONSTANT CURRENCY) $3.47 +11%
CASH FLOW FROM OPERATIONS $1.9 BILLION +7%
Excludes restructuring and other charges and adjustments. Cash flow adjusted for cash costs of Leading Beauty Forward.
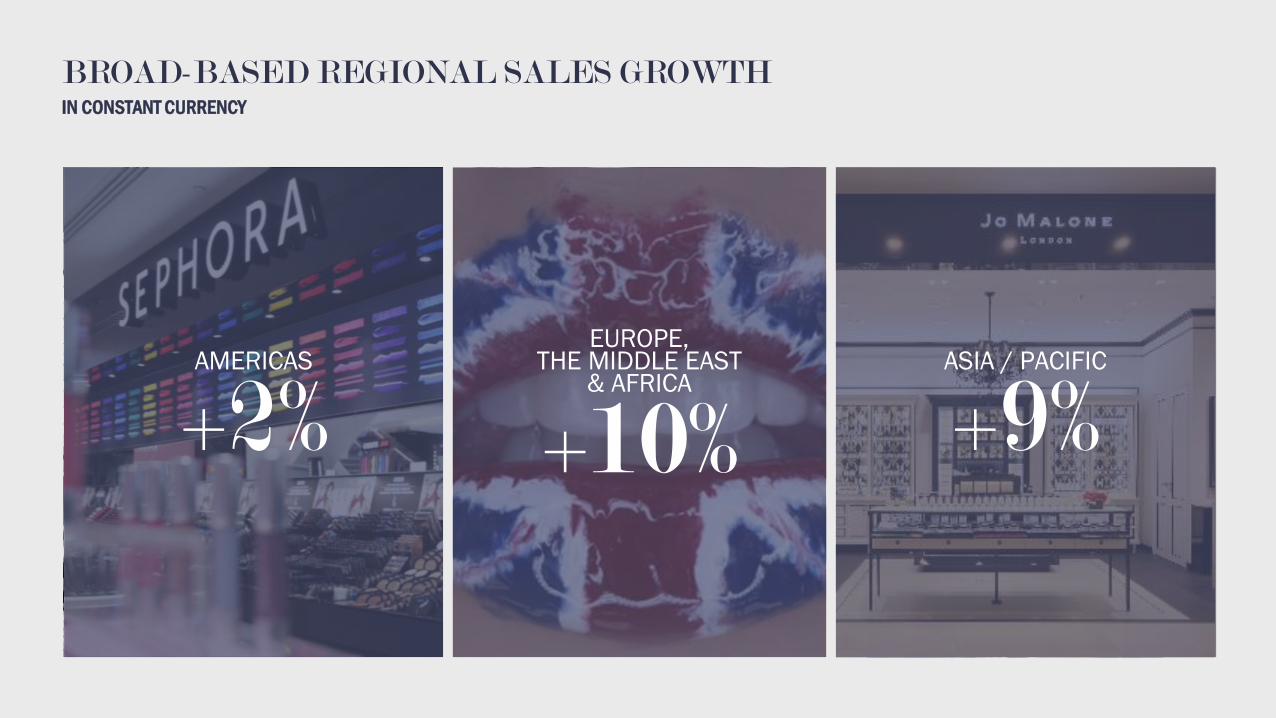
BROAD-BASED REGIONAL SALES GROWTHIN CONSTANT CURRENCY
AMERICAS
+2%ASIA / PACIFIC
+9%EUROPE,
THE MIDDLE EAST & AFRICA
+10%
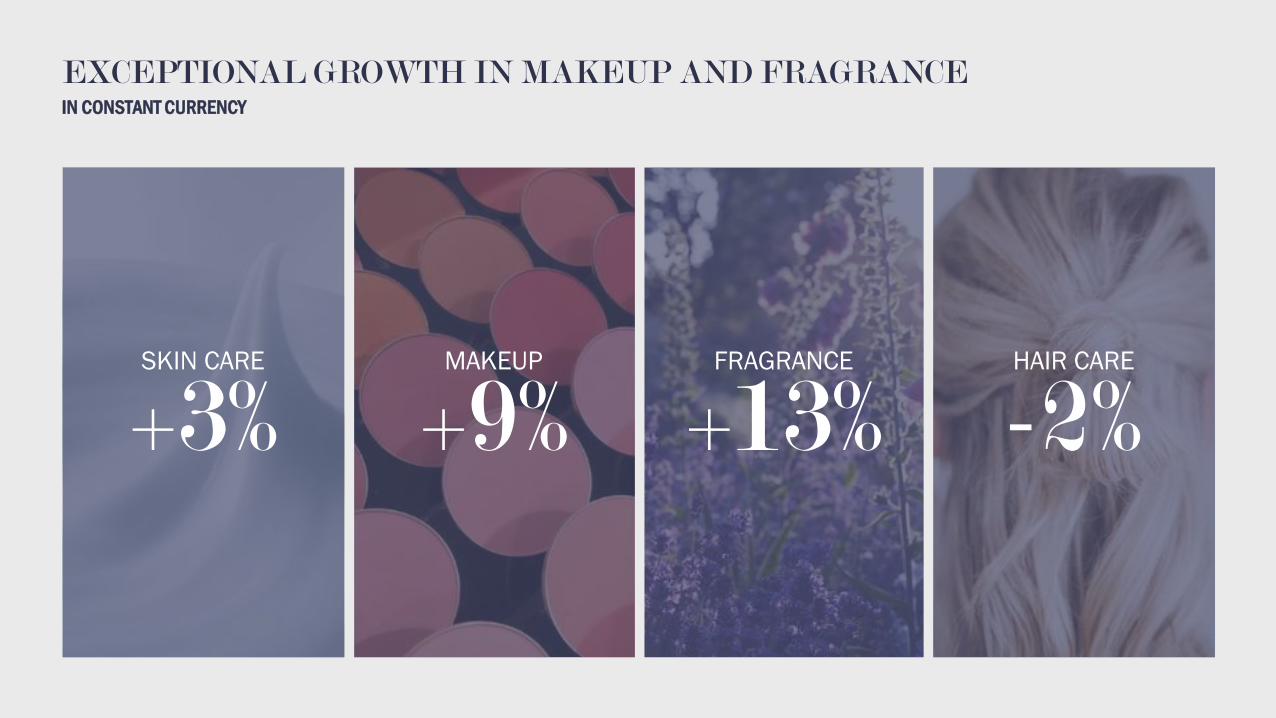
EXCEPTIONAL GROWTH IN MAKEUP AND FRAGRANCEIN CONSTANT CURRENCY
SKIN CARE
+3%MAKEUP
+9%FRAGRANCE
+13%HAIR CARE
-2%
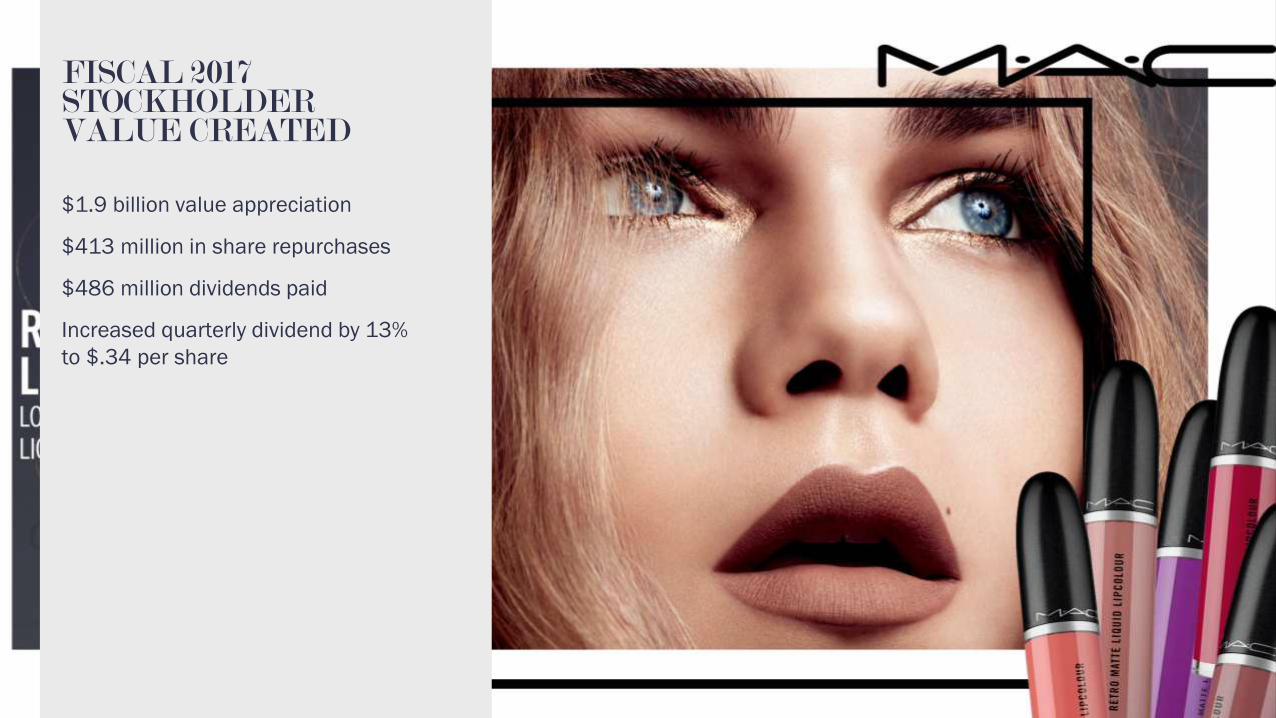
FISCAL 2017 STOCKHOLDER VALUE CREATED
$1.9 billion value appreciation
$413 million in share repurchases
$486 million dividends paid
Increased quarterly dividend by 13%
to $.34 per share
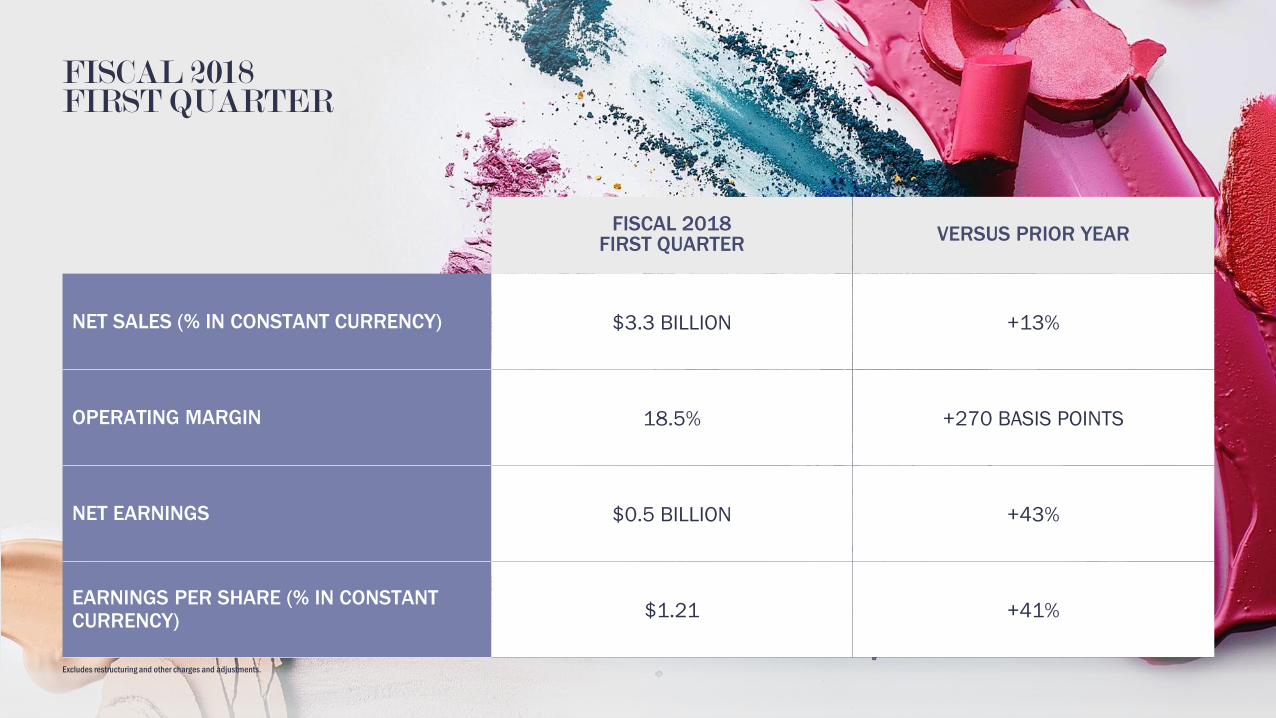
FISCAL 2018 FIRST QUARTER
FISCAL 2018FIRST QUARTER
VERSUS PRIOR YEAR
NET SALES (% IN CONSTANT CURRENCY) $3.3 BILLION +13%
OPERATING MARGIN 18.5% +270 BASIS POINTS
NET EARNINGS $0.5 BILLION +43%
EARNINGS PER SHARE (% IN CONSTANT CURRENCY)
$1.21 +41%
Excludes restructuring and other charges and adjustments.
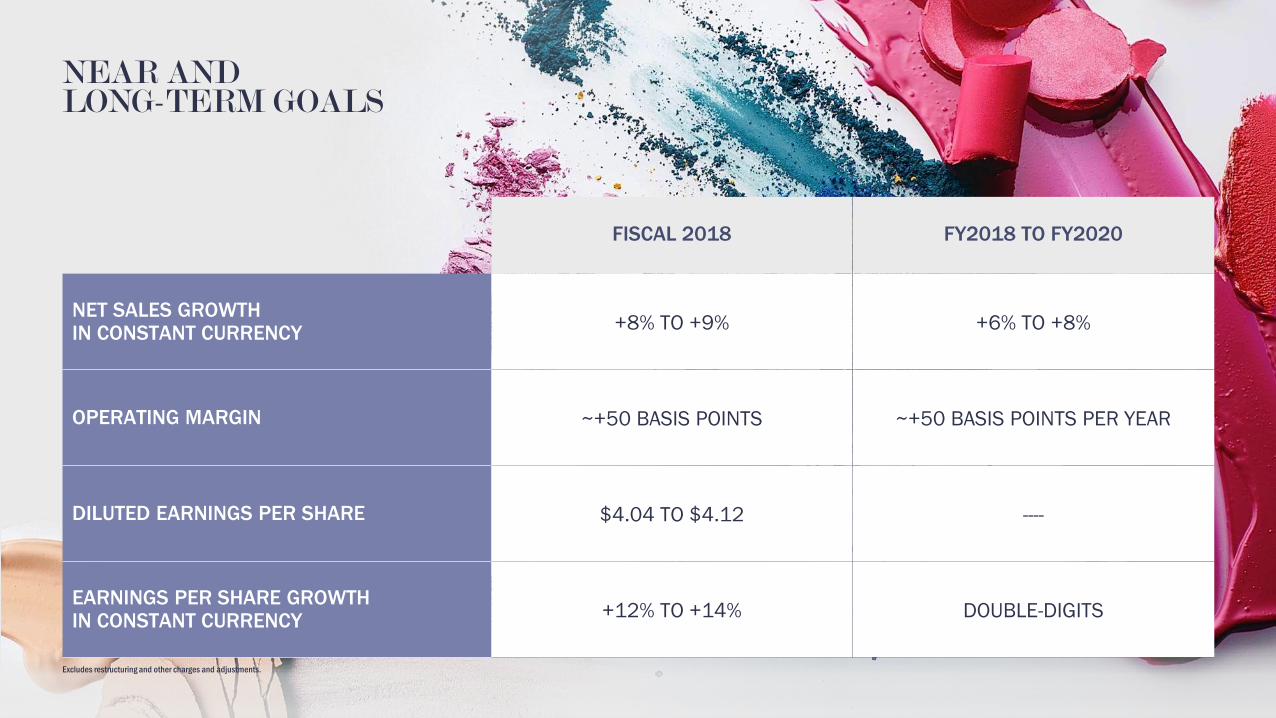
NEAR AND LONG-TERM GOALS
FISCAL 2018 FY2018 TO FY2020
NET SALES GROWTHIN CONSTANT CURRENCY
+8% TO +9% +6% TO +8%
OPERATING MARGIN ~+50 BASIS POINTS ~+50 BASIS POINTS PER YEAR
DILUTED EARNINGS PER SHARE $4.04 TO $4.12 ----
EARNINGS PER SHARE GROWTHIN CONSTANT CURRENCY
+12% TO +14% DOUBLE-DIGITS
Excludes restructuring and other charges and adjustments.

$10.6 billion value appreciation
(through 11/10/17)
$45+ billion market capitalization
Increased quarterly dividend by
12% to $.38 per share
FISCAL 2018 STOCKHOLDER VALUE

TOTAL STOCKHOLDER RETURN
Twelve Months Ended November 10, 2017
S&P CONSUMER
STAPLES
ESTĒE LAUDER S&P 500
62%
22%
11%
ESTĒE LAUDER COMPANIES
PEER AVERAGE
S&P 500
S&P CONSUMER STAPLES
PEER AVERAGE
27%
Peer group includes L’Oreal, LVMH, Shiseido, AmorePacific and Coty.

PIVOTING TO TOMORROW
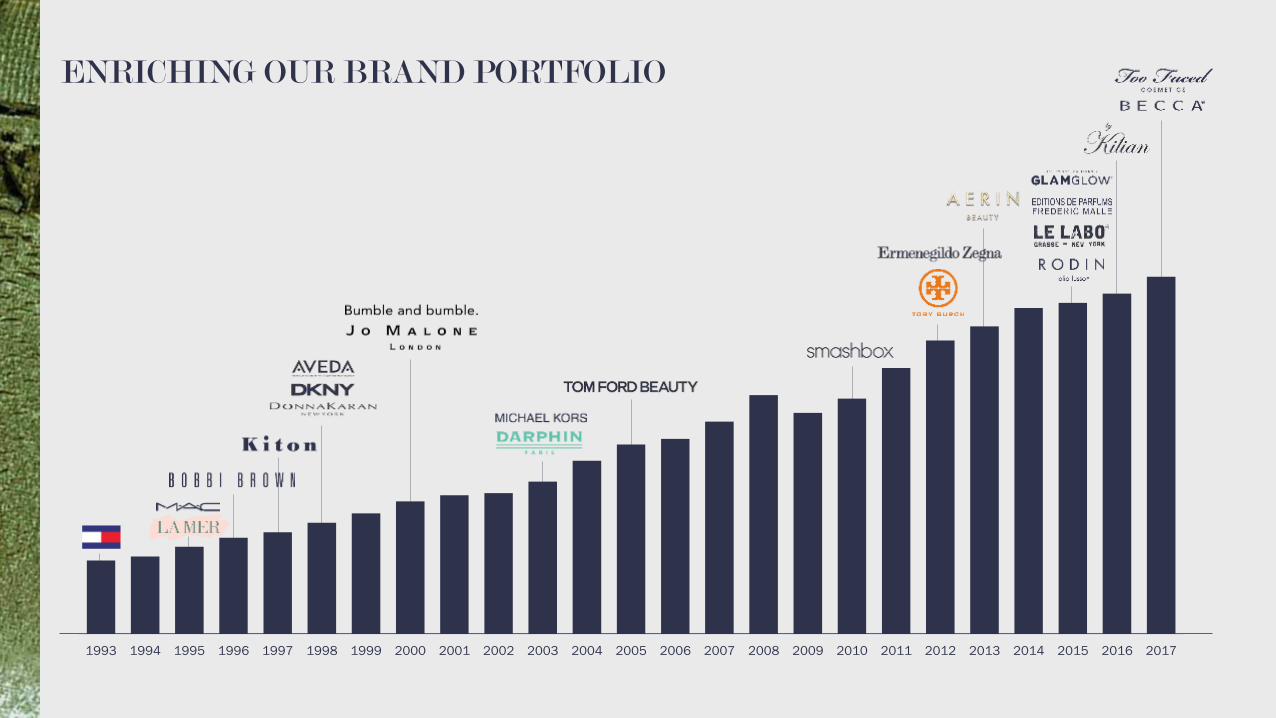
1993 1994 1995 1996 1997 1998 1999 2000 2001 2002 2003 2004 2005 2006 2007 2008 2009 2010 2011 2012 2013 2014 2015 2016 2017
ENRICHING OUR BRAND PORTFOLIO
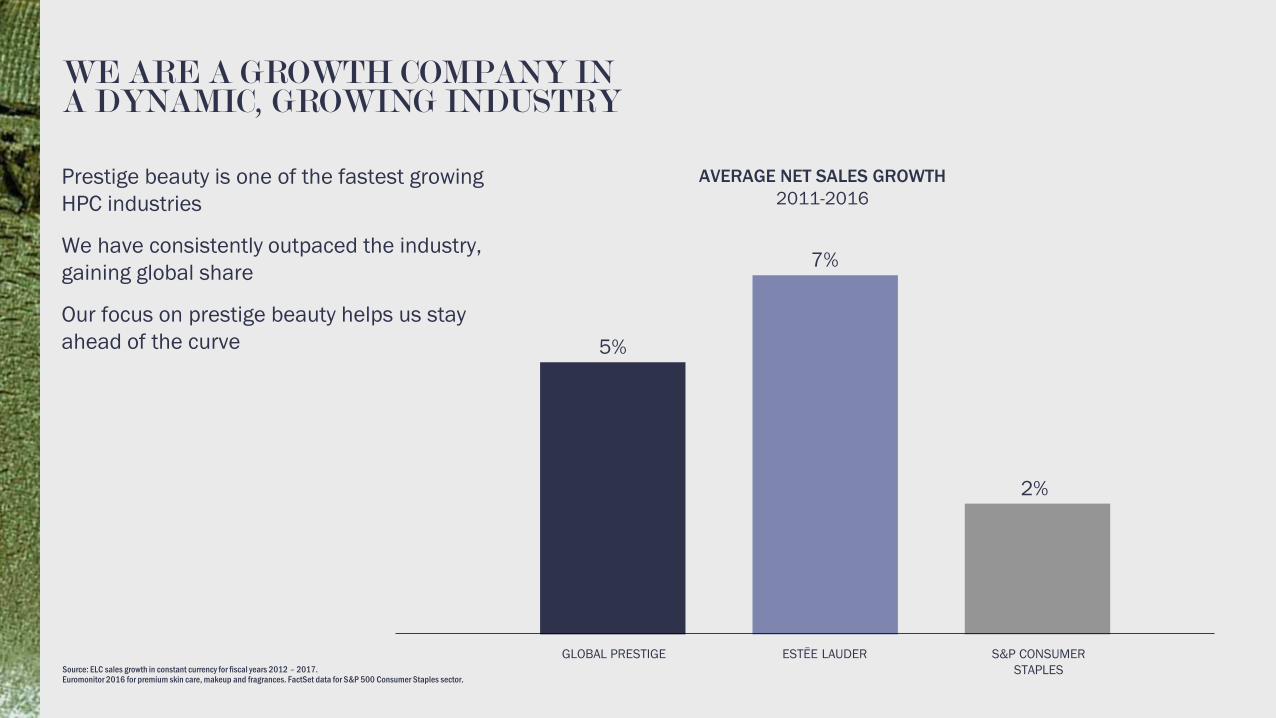
WE ARE A GROWTH COMPANY IN A DYNAMIC, GROWING INDUSTRY
AVERAGE NET SALES GROWTH
2011-2016
S&P CONSUMER
STAPLES
ESTĒE LAUDERGLOBAL PRESTIGE
5%
7%
2%
Source: ELC sales growth in constant currency for fiscal years 2012 – 2017. Euromonitor 2016 for premium skin care, makeup and fragrances. FactSet data for S&P 500 Consumer Staples sector.
Prestige beauty is one of the fastest growing
HPC industries
We have consistently outpaced the industry,
gaining global share
Our focus on prestige beauty helps us stay
ahead of the curve
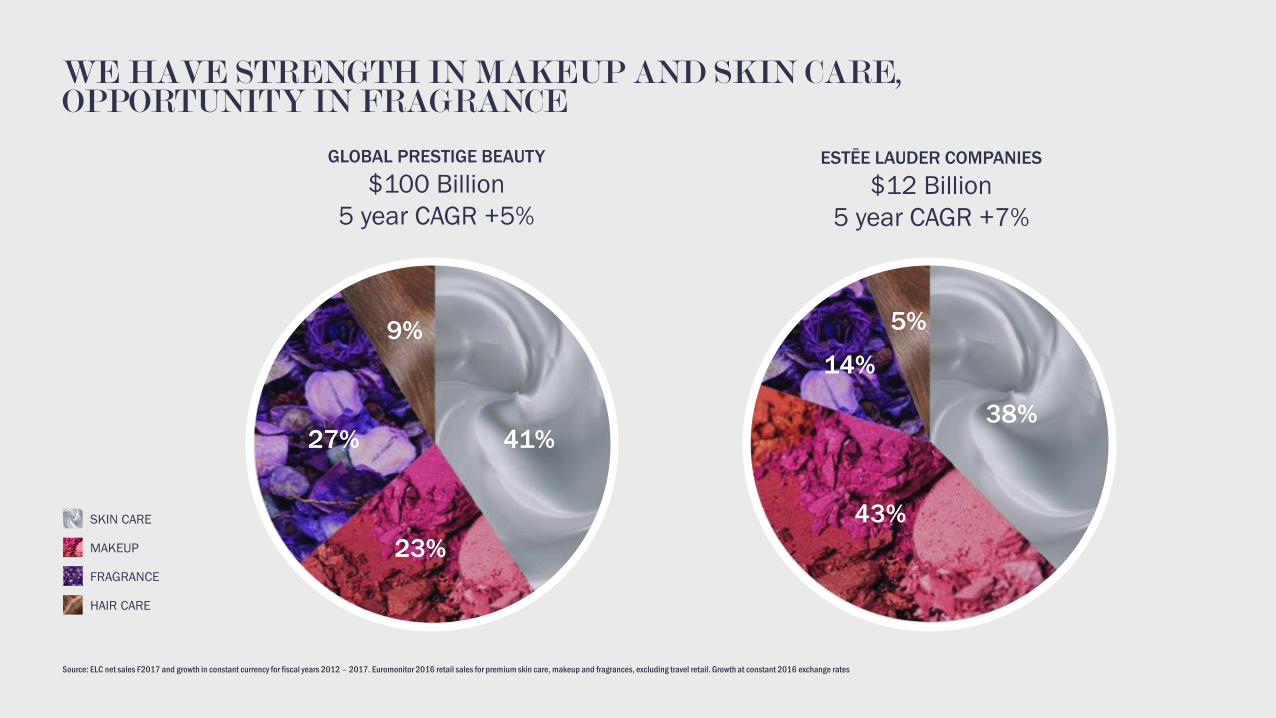
WE HAVE STRENGTH IN MAKEUP AND SKIN CARE, OPPORTUNITY IN FRAGRANCE
Source: ELC net sales F2017 and growth in constant currency for fiscal years 2012 – 2017. Euromonitor 2016 retail sales for premium skin care, makeup and fragrances, excluding travel retail. Growth at constant 2016 exchange rates
GLOBAL PRESTIGE BEAUTY
$100 Billion
5 year CAGR +5%
SKIN CARE
MAKEUP
FRAGRANCE
HAIR CARE
ESTĒE LAUDER COMPANIES
$12 Billion
5 year CAGR +7%
41%
23%
9%
27%38%
43%
5%
14%
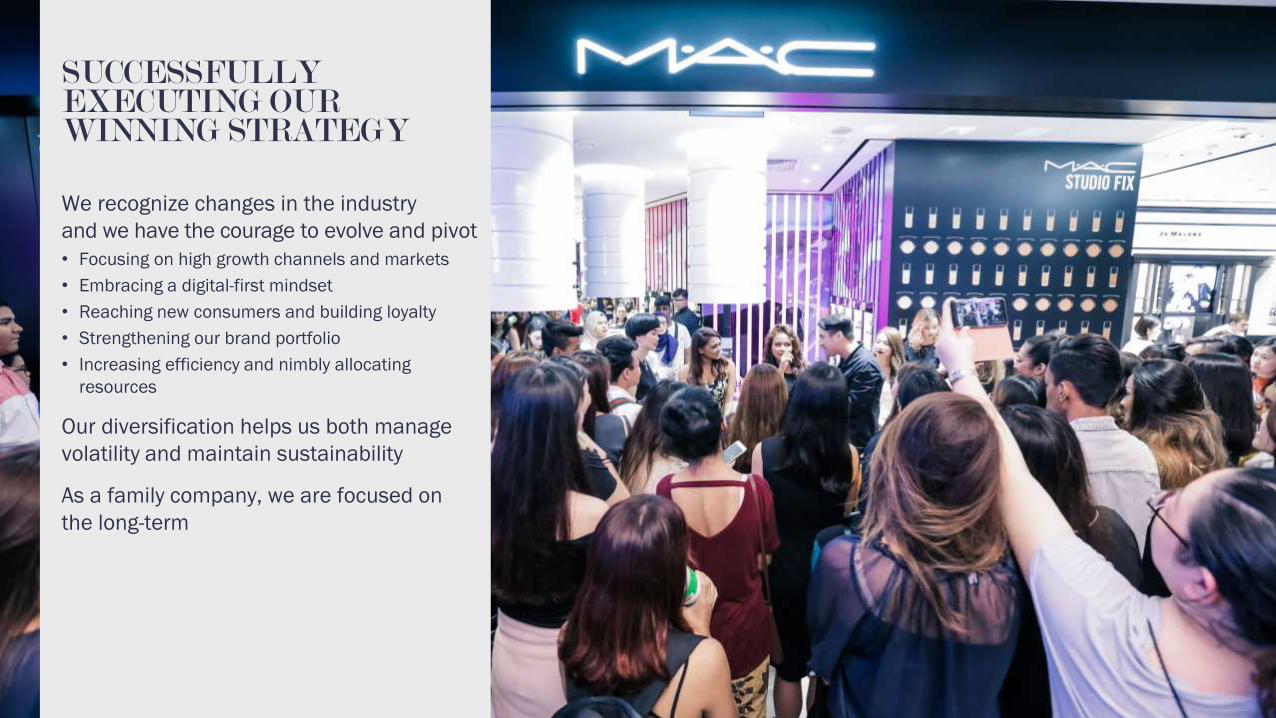
SUCCESSFULLY EXECUTING OUR WINNING STRATEGY
We recognize changes in the industry
and we have the courage to evolve and pivot
• Focusing on high growth channels and markets
• Embracing a digital-first mindset
• Reaching new consumers and building loyalty
• Strengthening our brand portfolio
• Increasing efficiency and nimbly allocating
resources
Our diversification helps us both manage
volatility and maintain sustainability
As a family company, we are focused on
the long-term
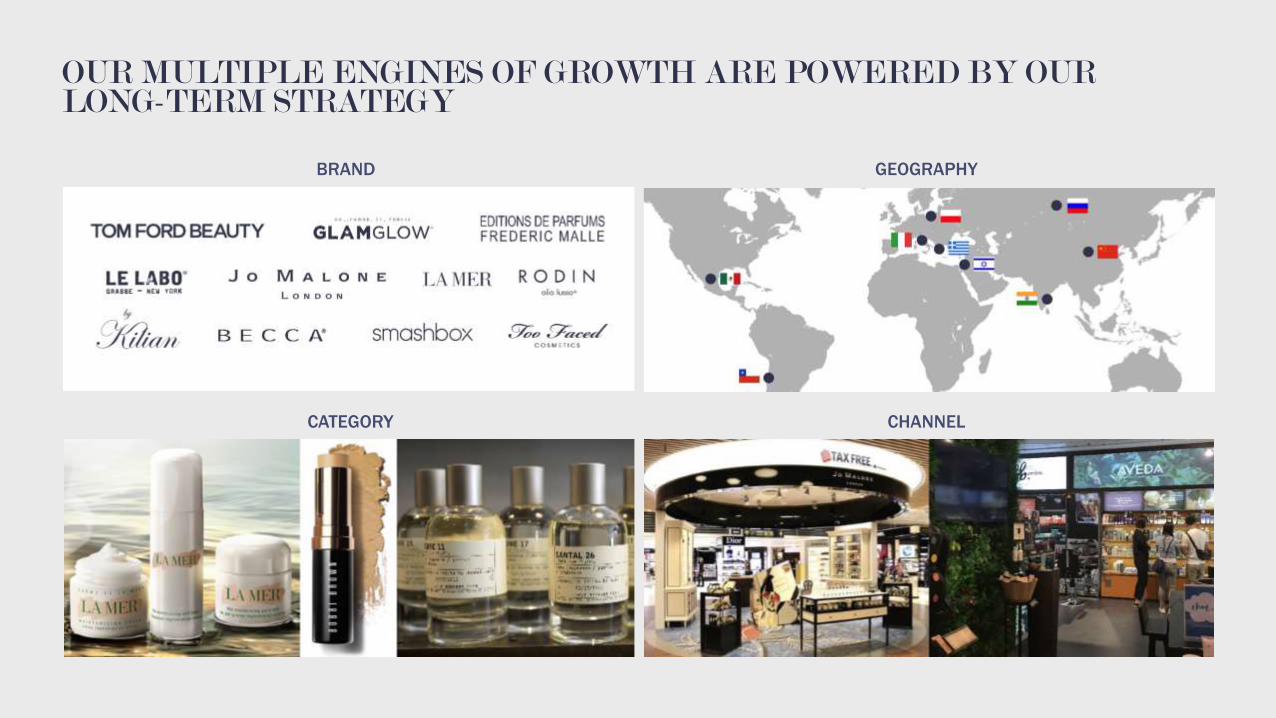
BRAND GEOGRAPHY
OUR MULTIPLE ENGINES OF GROWTH ARE POWERED BY OUR LONG-TERM STRATEGY
CATEGORY CHANNEL

DRIVING MOMENTUM AROUND THE WORLD
Reaching new consumers
Building demand in emerging markets
• Launching new brands
• Trading consumers up from mass
Attracting millennials in developed countries
Focusing on the biggest fast-growth
opportunities by region

APPLYING A DIGITAL-FIRST MINDSET
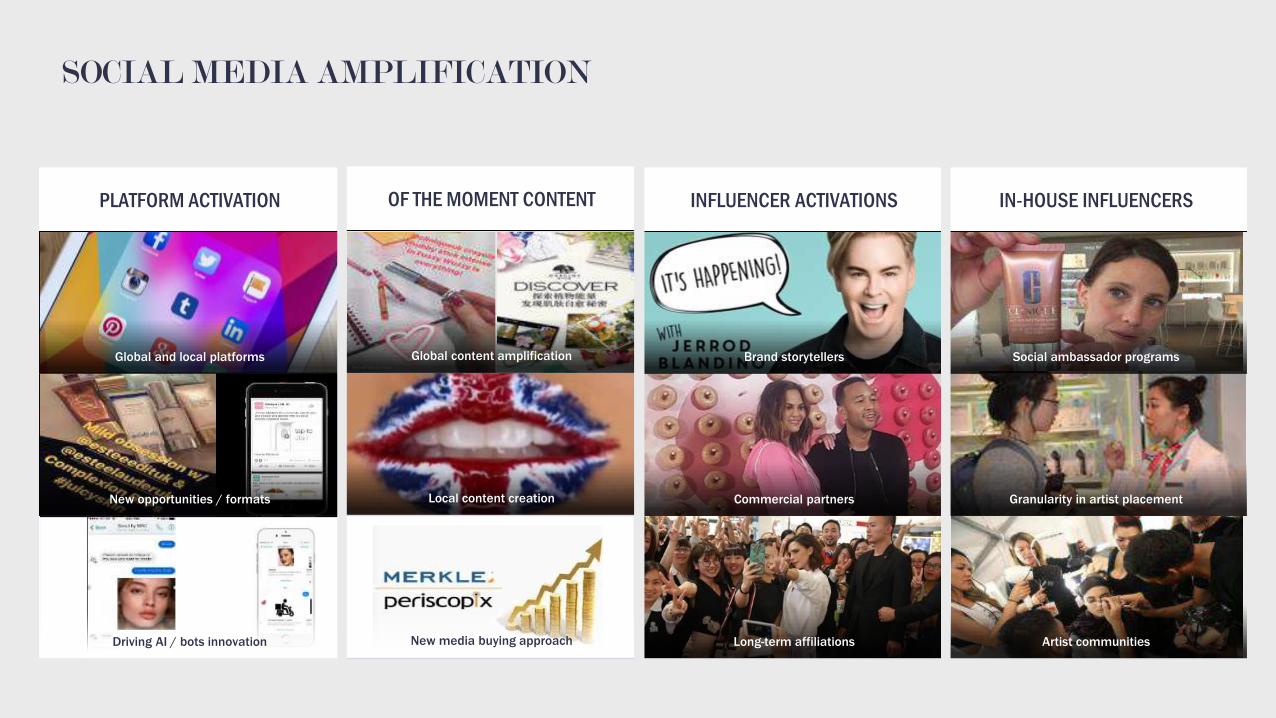
IN-HOUSE INFLUENCERS
Social ambassador programs
Granularity in artist placement
Artist communities
INFLUENCER ACTIVATIONS
Brand storytellers
Commercial partners
Long-term affiliations
SOCIAL MEDIA AMPLIFICATION
PLATFORM ACTIVATION
Global and local platforms
New opportunities / formats
Driving AI / bots innovation
OF THE MOMENT CONTENT
Global content amplification
Local content creation
New media buying approach
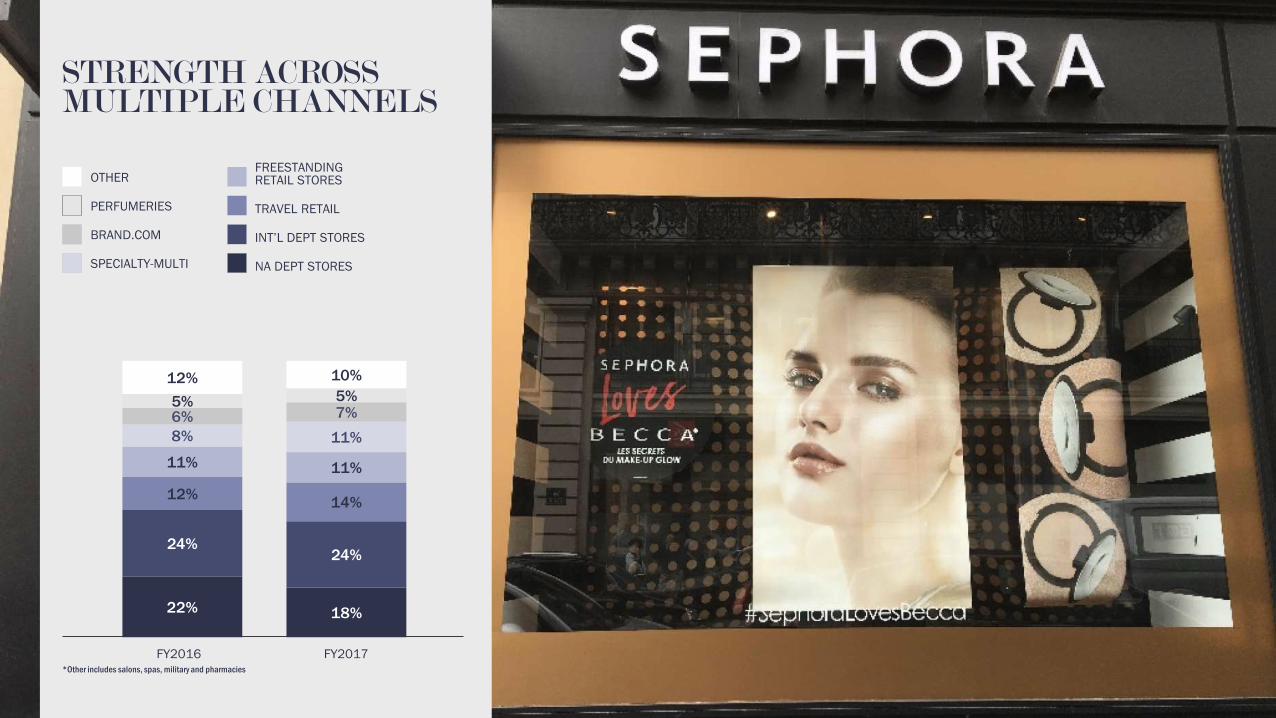
OTHER
PERFUMERIES
BRAND.COM
SPECIALTY-MULTI
FY2017FY2016*Other includes salons, spas, military and pharmacies
22% 18%
24%24%
12%14%
11% 11%
8% 11%
6% 7%5% 5%
12% 10%
STRENGTH ACROSS MULTIPLE CHANNELS
FREESTANDING RETAIL STORES
TRAVEL RETAIL
INT’L DEPT STORES
NA DEPT STORES
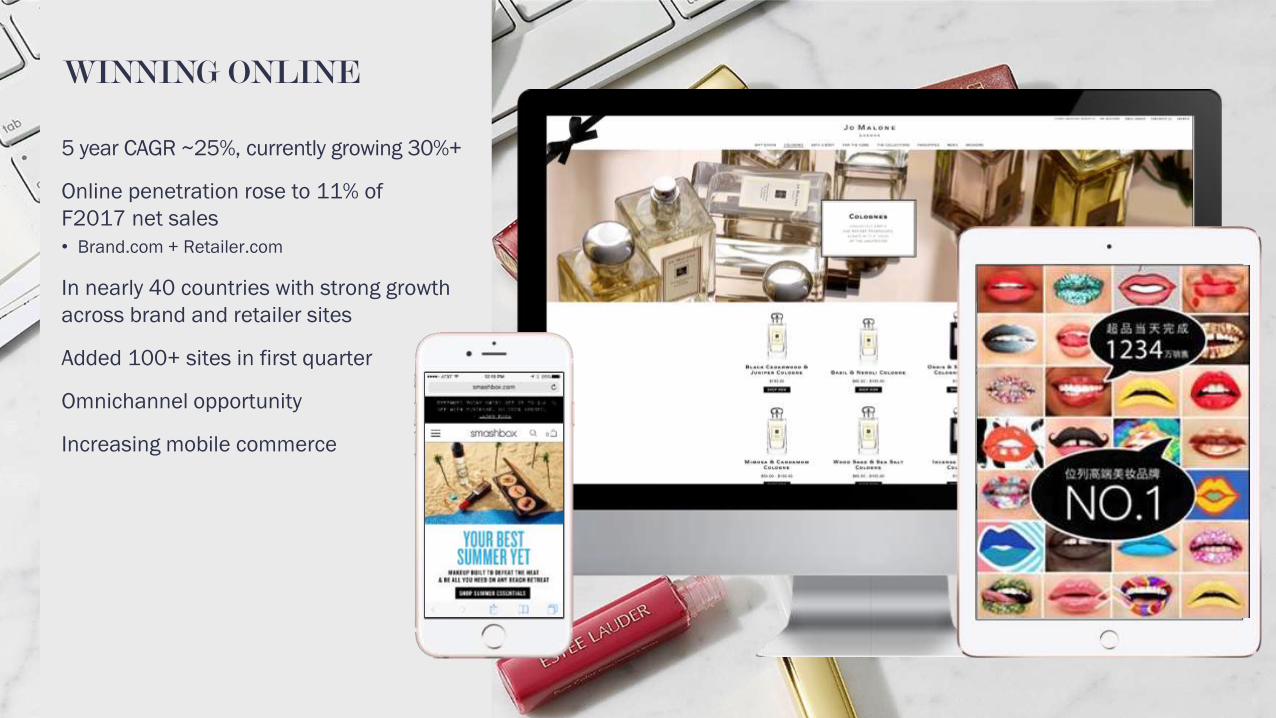
WINNING ONLINE
5 year CAGR ~25%, currently growing 30%+
Online penetration rose to 11% of
F2017 net sales
• Brand.com + Retailer.com
In nearly 40 countries with strong growth
across brand and retailer sites
Added 100+ sites in first quarter
Omnichannel opportunity
Increasing mobile commerce
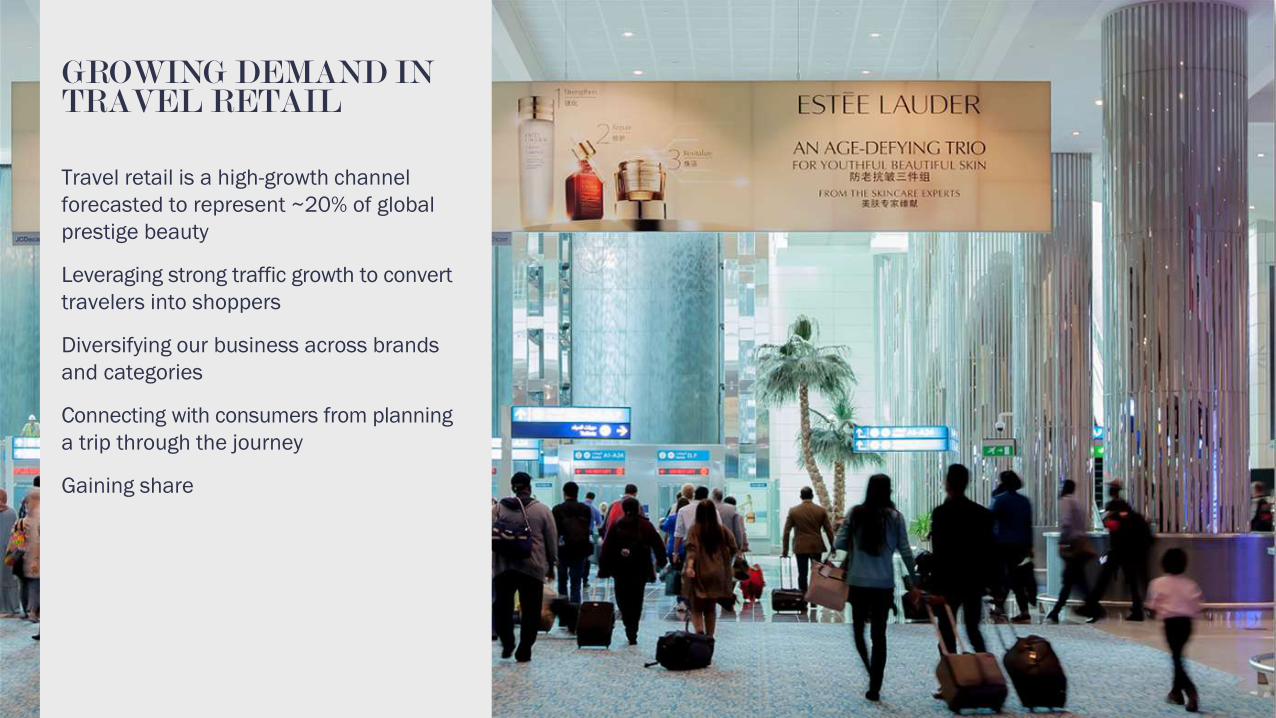
GROWING DEMAND IN TRAVEL RETAIL
Travel retail is a high-growth channel
forecasted to represent ~20% of global
prestige beauty
Leveraging strong traffic growth to convert
travelers into shoppers
Diversifying our business across brands
and categories
Connecting with consumers from planning
a trip through the journey
Gaining share
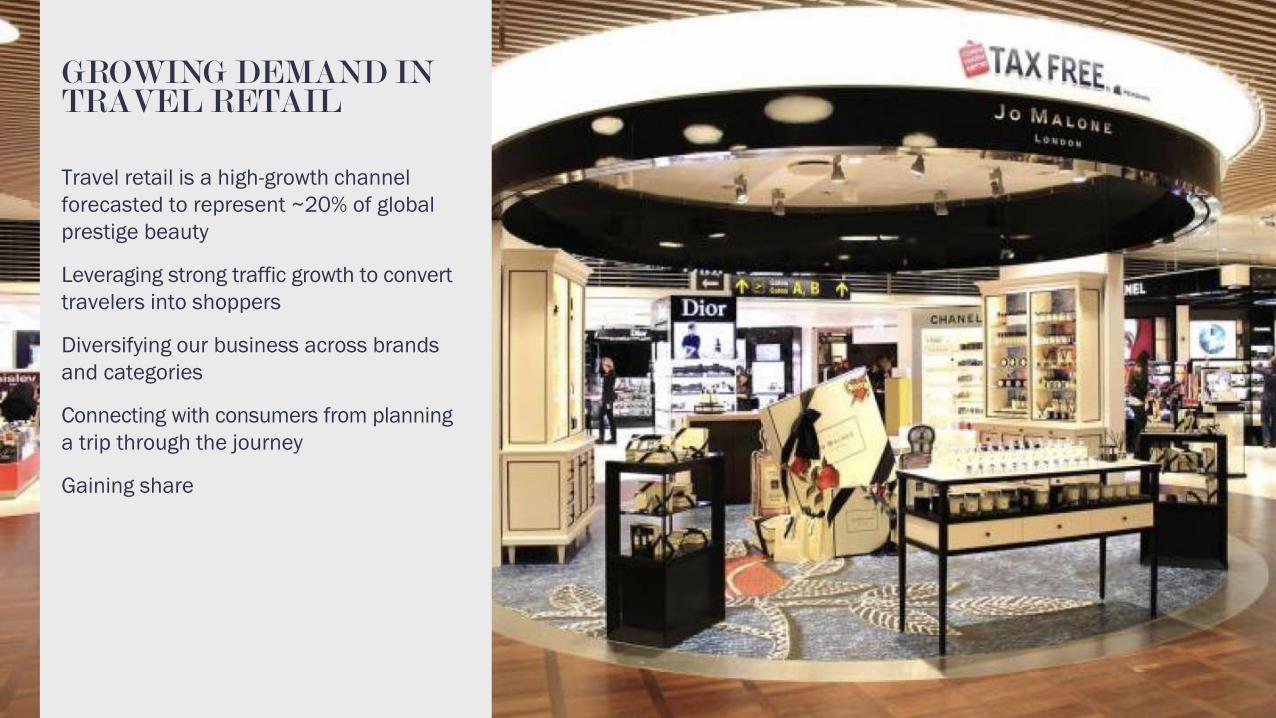
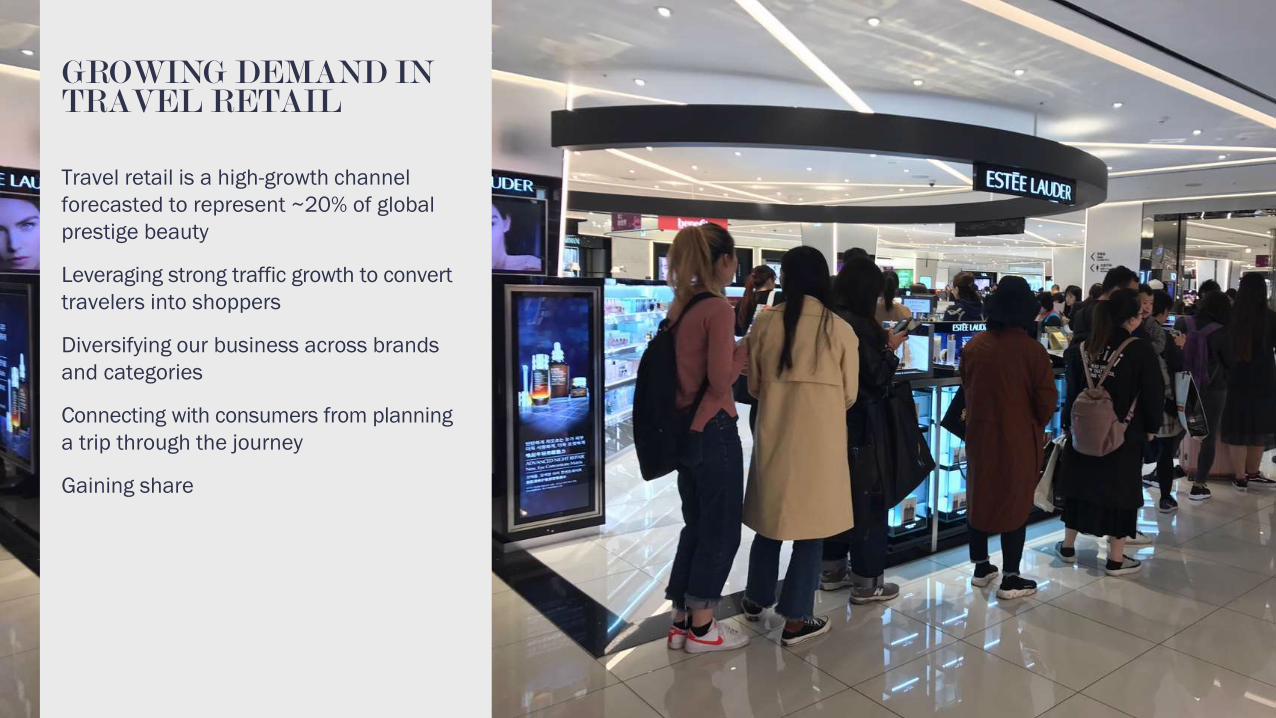
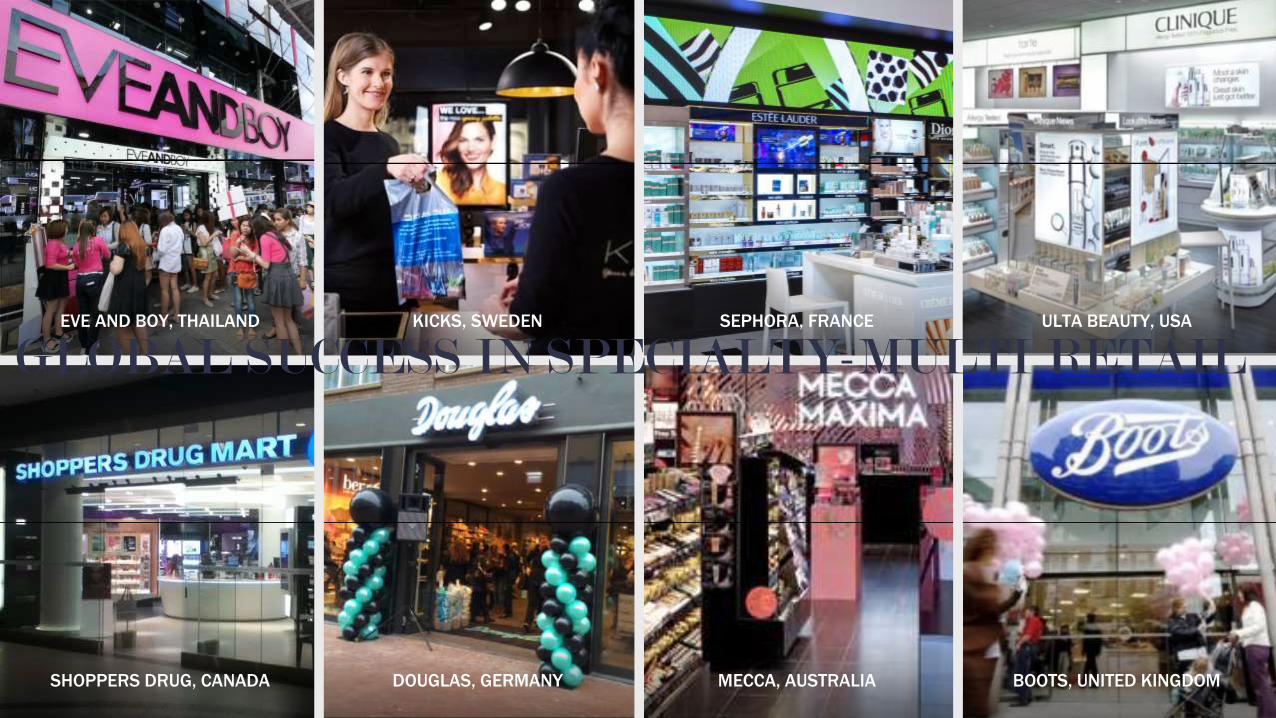
SHOPPERS DRUG, CANADA DOUGLAS, GERMANY MECCA, AUSTRALIA BOOTS, UNITED KINGDOM
EVE AND BOY, THAILAND KICKS, SWEDEN SEPHORA, FRANCE ULTA BEAUTY, USA
GLOBAL SUCCESS IN SPECIALTY-MULTI RETAIL
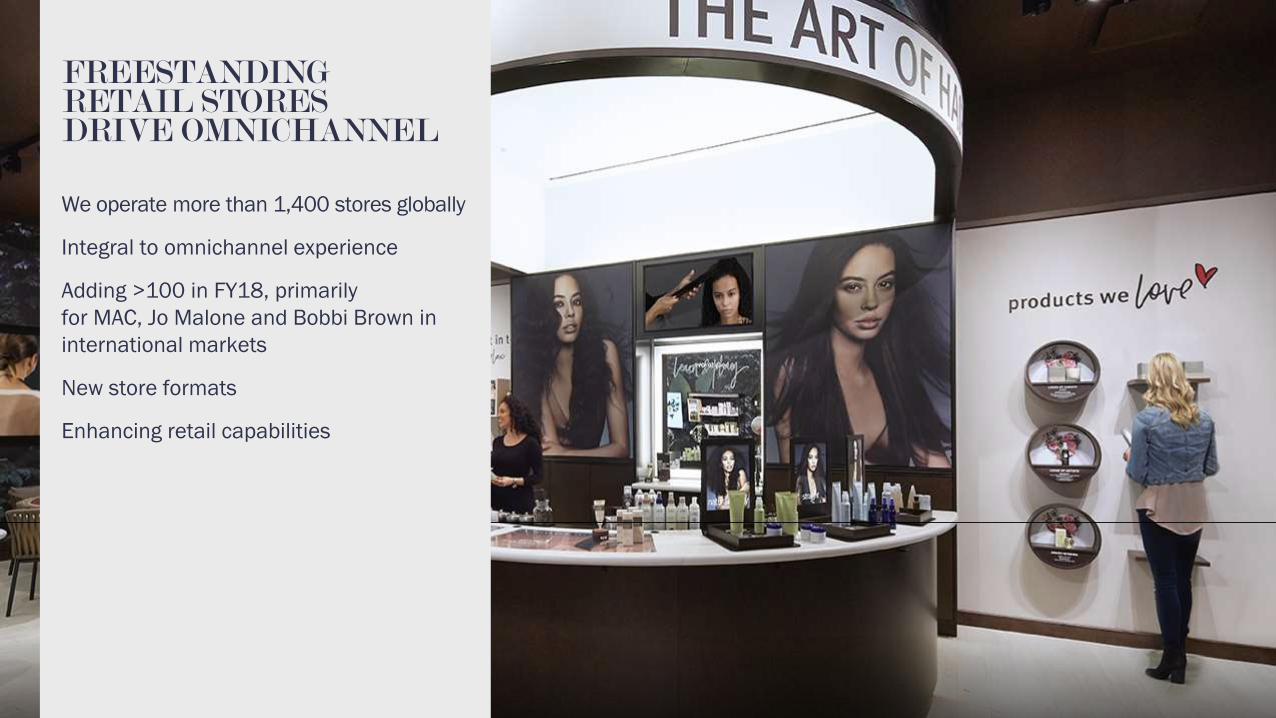
FREESTANDING RETAIL STORES DRIVE OMNICHANNEL
We operate more than 1,400 stores globally
Integral to omnichannel experience
Adding >100 in FY18, primarily
for MAC, Jo Malone and Bobbi Brown in
international markets
New store formats
Enhancing retail capabilities
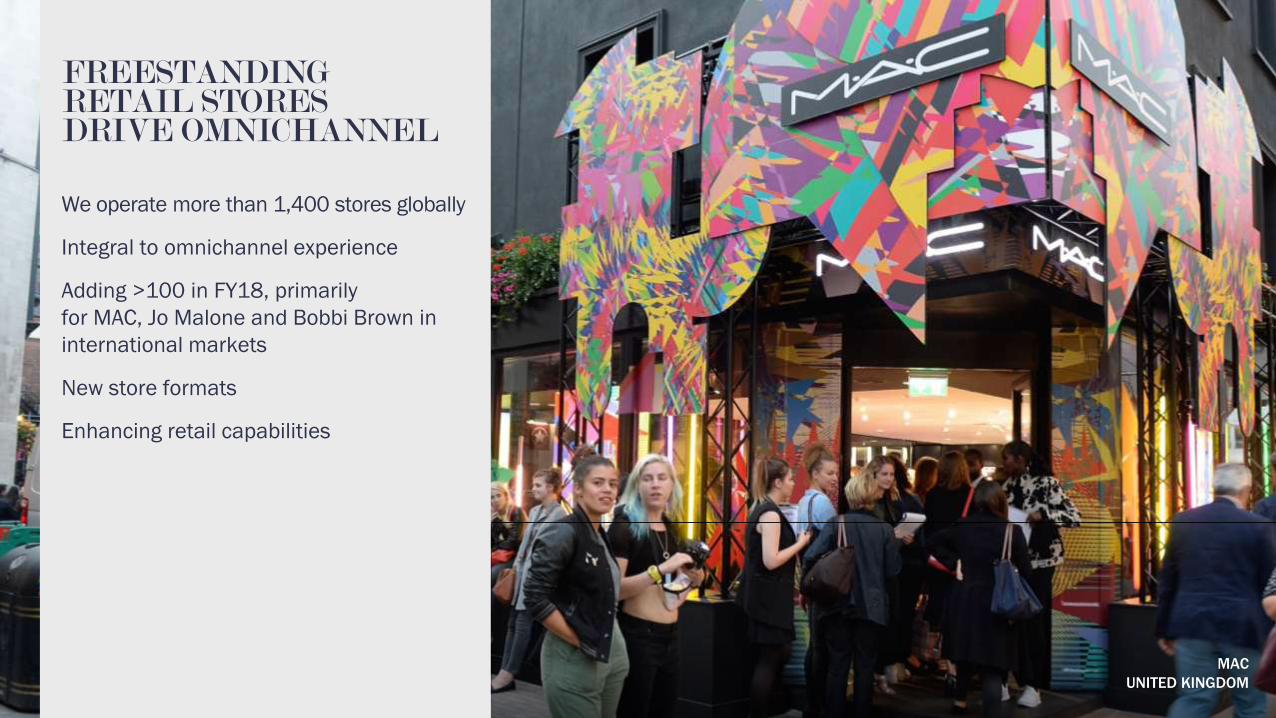
MAC
UNITED KINGDOM
FREESTANDING RETAIL STORES DRIVE OMNICHANNEL
We operate more than 1,400 stores globally
Integral to omnichannel experience
Adding >100 in FY18, primarily
for MAC, Jo Malone and Bobbi Brown in
international markets
New store formats
Enhancing retail capabilities
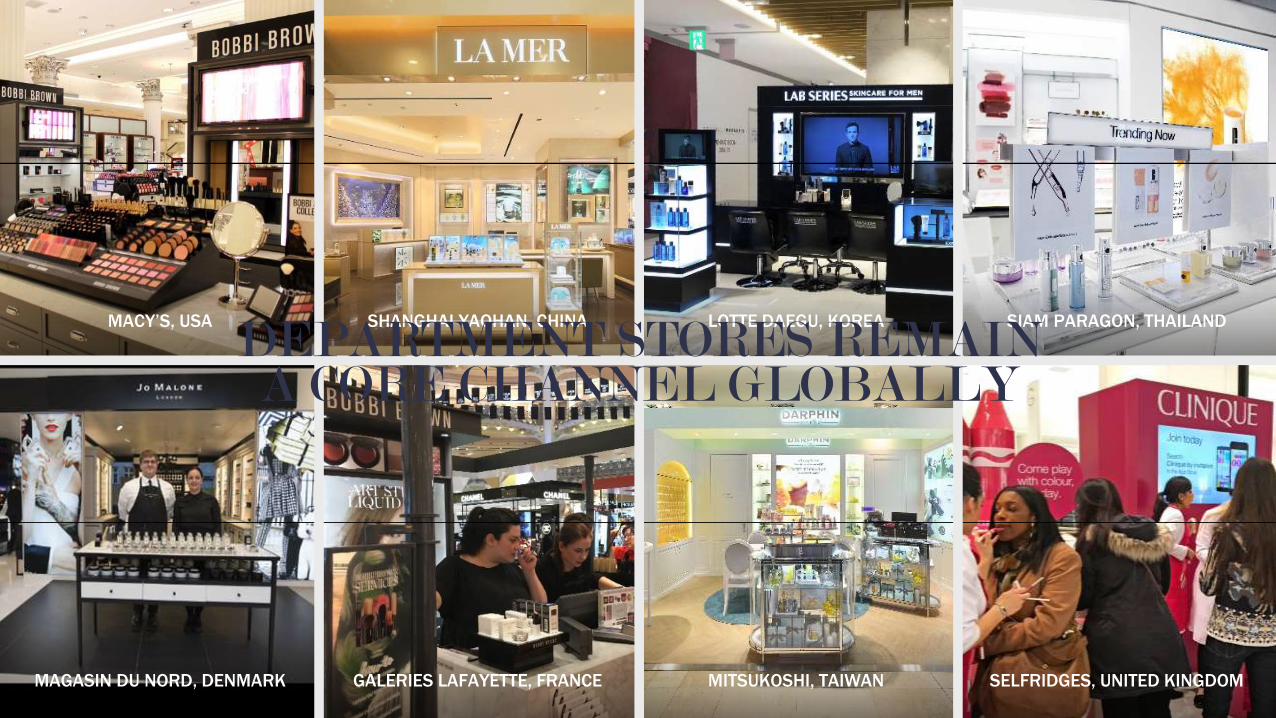
MITSUKOSHI, TAIWANMAGASIN DU NORD, DENMARK GALERIES LAFAYETTE, FRANCE SELFRIDGES, UNITED KINGDOM
MACY’S, USA SHANGHAI YAOHAN, CHINA LOTTE DAEGU, KOREA SIAM PARAGON, THAILAND
DEPARTMENT STORES REMAIN A CORE CHANNEL GLOBALLY

CREATIVITY AND INNOVATION UNDERPIN OUR SUCCESS
Innovating hero franchises
Trial vs. loyalty
Developing breakthrough formulations
and packaging
Creating trends
Improving speed to market

BREADTH OF SKIN CARE INNOVATION


CAPTURING & CREATINGMAKEUP TRENDS


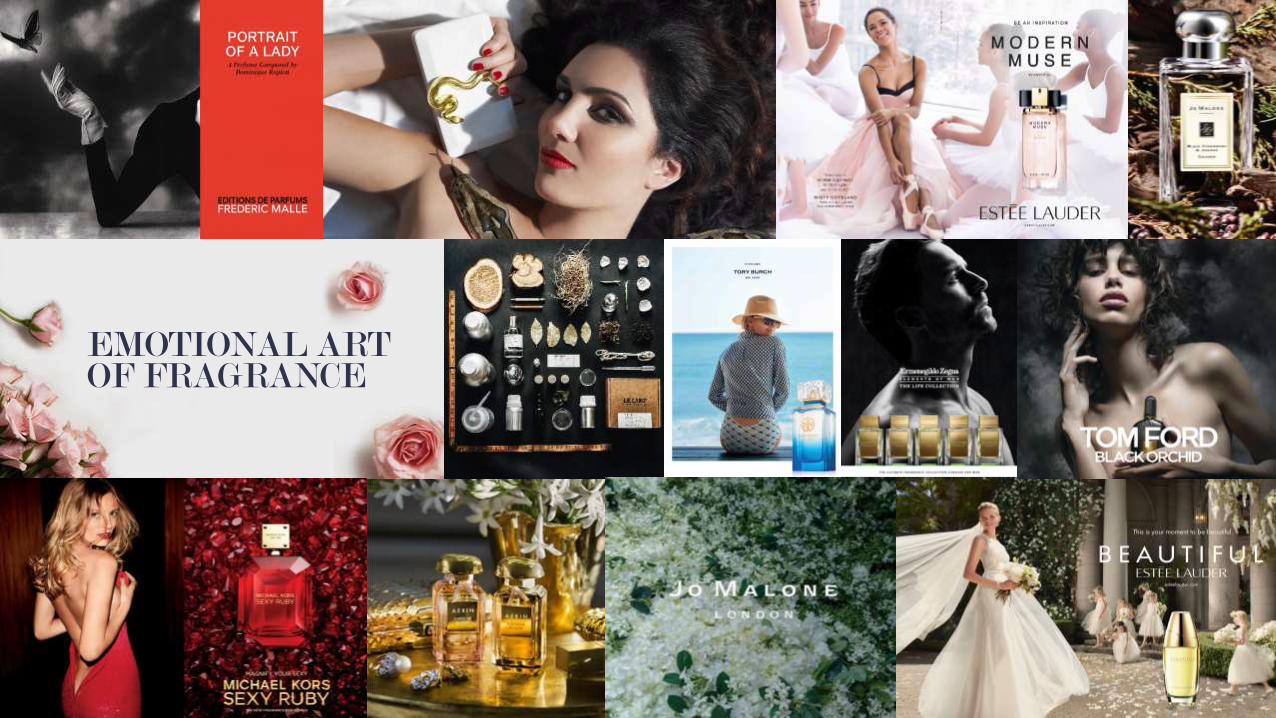
EMOTIONAL ART OF FRAGRANCE


ADVANCES IN HAIR CARE


CREATING SUSTAINABILITY FOR THE LONG-TERM
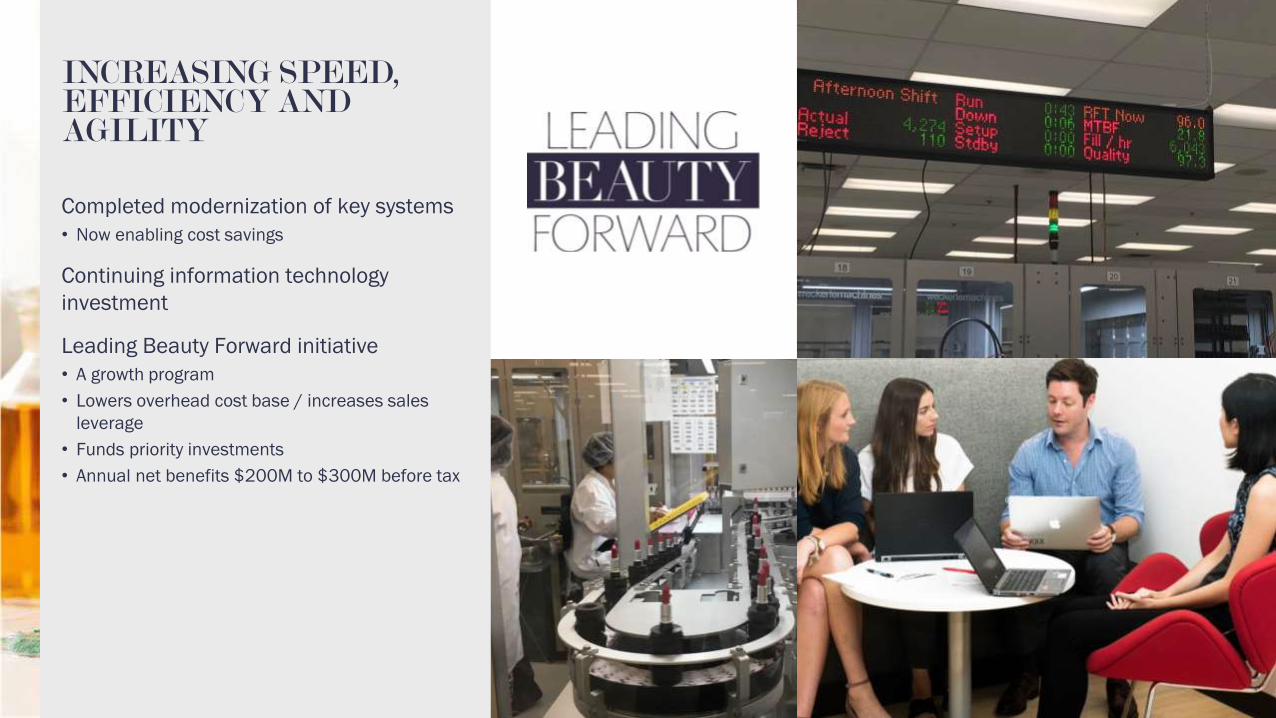
INCREASING SPEED, EFFICIENCY ANDAGILITY
Completed modernization of key systems
• Now enabling cost savings
Continuing information technology
investment
Leading Beauty Forward initiative
• A growth program
• Lowers overhead cost base / increases sales
leverage
• Funds priority investments
• Annual net benefits $200M to $300M before tax

WORLD CLASS LEADERSHIP AND TALENT DEVELOPMENT
Leveraging our strengths
• Great brand builders
• Creativity and innovation capabilities
Digital-first mindset reflected in
hiring, development

COMMITMENT TOINCLUSION ANDDIVERSITY
22 Employee Resource Groups globally
High-Touch Inclusion Seminar delivered to
over 8,000 employees globally
I&D strategic plan and locally relevant
affiliate plans
Recognized for leadership in I&D
Strong female representation at all levels

CORPORATE CITIZENSHIP AND SUSTAINABILITY
Strong social and environmental
commitments
Invest in communities and causes that
create positive environmental and social
impacts across signature giving areas
Promote climate resilience by committing
to net-zero emissions by 2020
Commitment to safety

APPENDIX
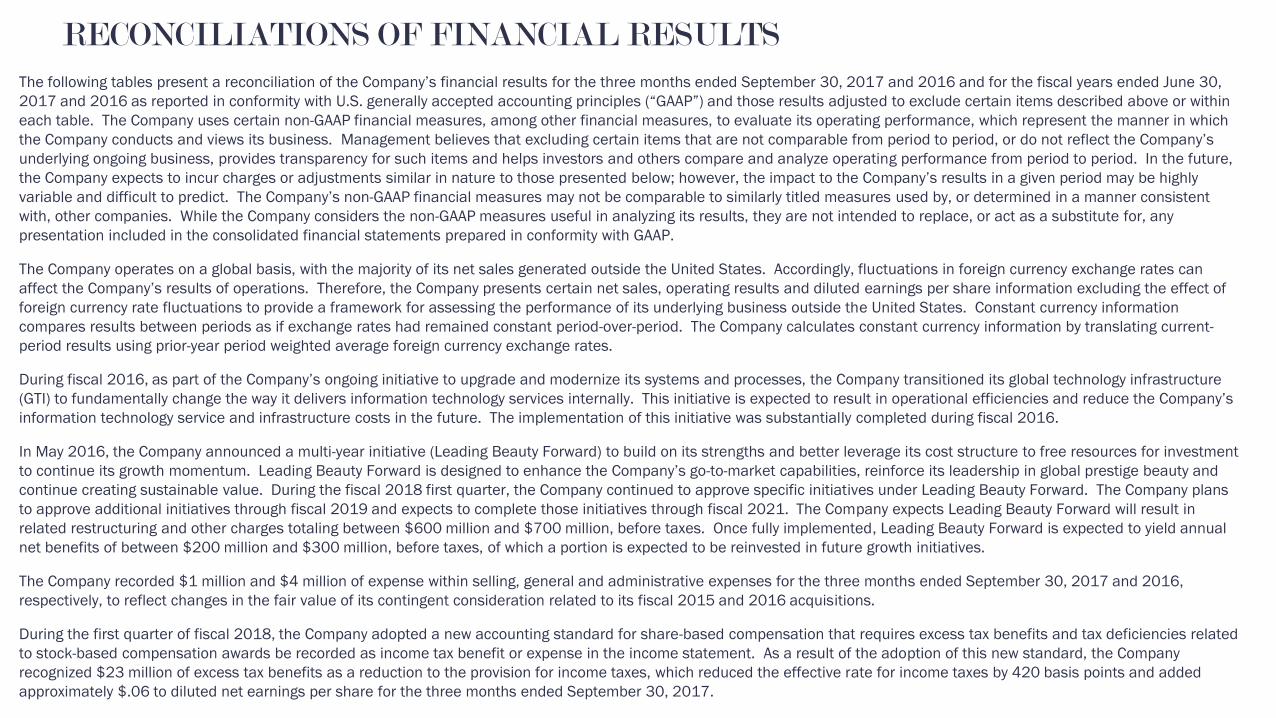
RECONCILIATIONS OF FINANCIAL RESULTS
The following tables present a reconciliation of the Company’s financial results for the three months ended September 30, 2017 and 2016 and for the fiscal years ended June 30,
2017 and 2016 as reported in conformity with U.S. generally accepted accounting principles (“GAAP”) and those results adjusted to exclude certain items described above or within
each table. The Company uses certain non-GAAP financial measures, among other financial measures, to evaluate its operating performance, which represent the manner in which
the Company conducts and views its business. Management believes that excluding certain items that are not comparable from period to period, or do not reflect the Company’s
underlying ongoing business, provides transparency for such items and helps investors and others compare and analyze operating performance from period to period. In the future,
the Company expects to incur charges or adjustments similar in nature to those presented below; however, the impact to the Company’s results in a given period may be highly
variable and difficult to predict. The Company’s non-GAAP financial measures may not be comparable to similarly titled measures used by, or determined in a manner consistent
with, other companies. While the Company considers the non-GAAP measures useful in analyzing its results, they are not intended to replace, or act as a substitute for, any
presentation included in the consolidated financial statements prepared in conformity with GAAP.
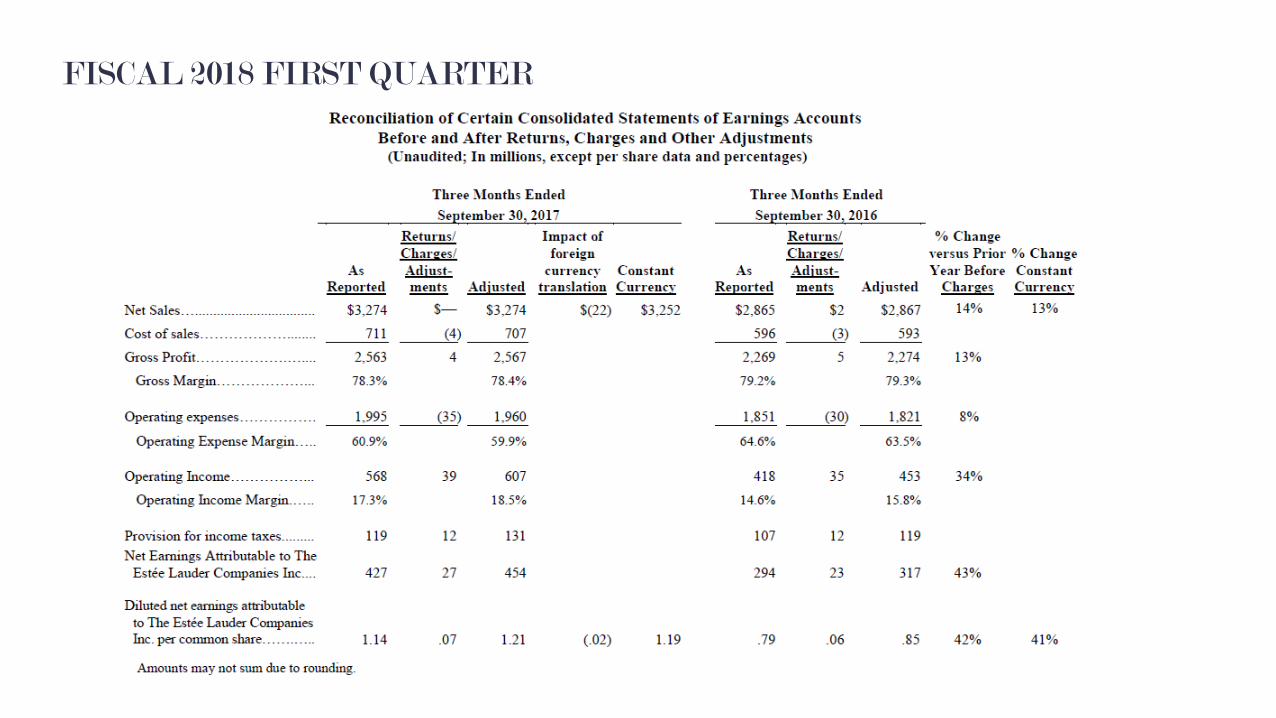
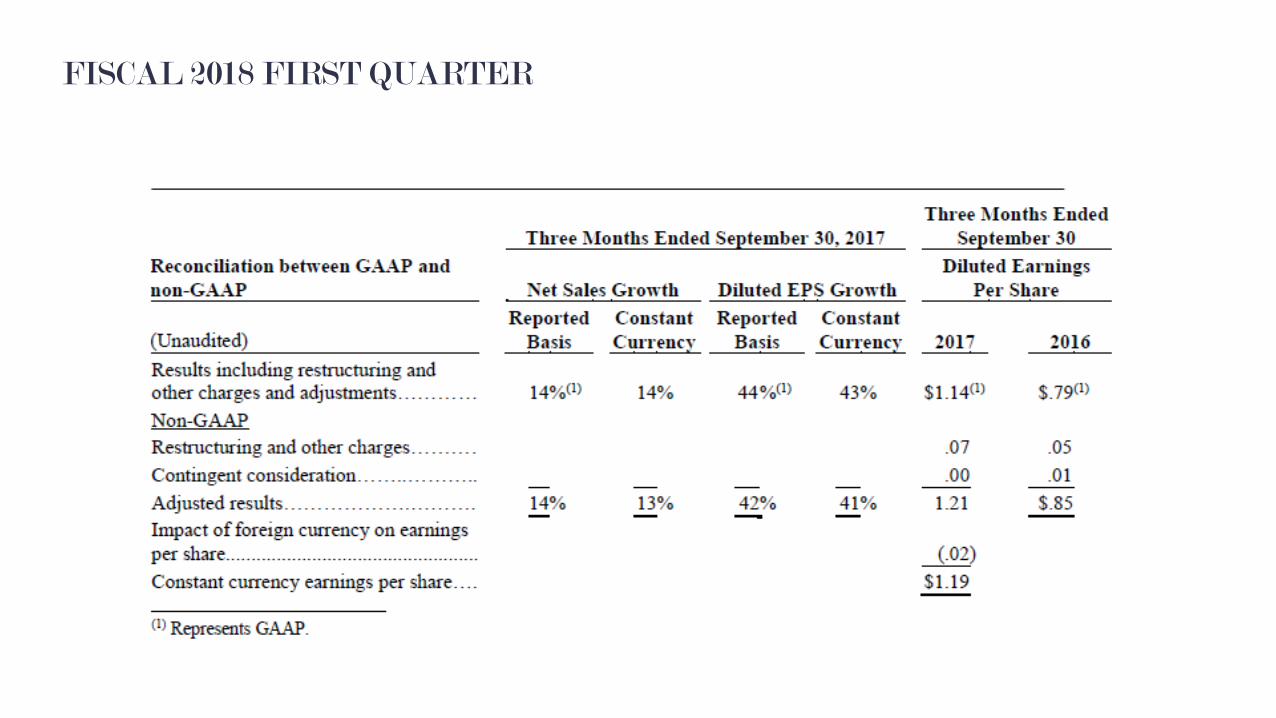
The Company operates on a global basis, with the majority of its net sales generated outside the United States. Accordingly, fluctuations in foreign currency exchange rates can
affect the Company’s results of operations. Therefore, the Company presents certain net sales, operating results and diluted earnings per share information excluding the effect of
foreign currency rate fluctuations to provide a framework for assessing the performance of its underlying business outside the United States. Constant currency information
compares results between periods as if exchange rates had remained constant period-over-period. The Company calculates constant currency information by translating current-
period results using prior-year period weighted average foreign currency exchange rates.
During fiscal 2016, as part of the Company’s ongoing initiative to upgrade and modernize its systems and processes, the Company transitioned its global technology infrastructure
(GTI) to fundamentally change the way it delivers information technology services internally. This initiative is expected to result in operational efficiencies and reduce the Company’s
information technology service and infrastructure costs in the future. The implementation of this initiative was substantially completed during fiscal 2016.
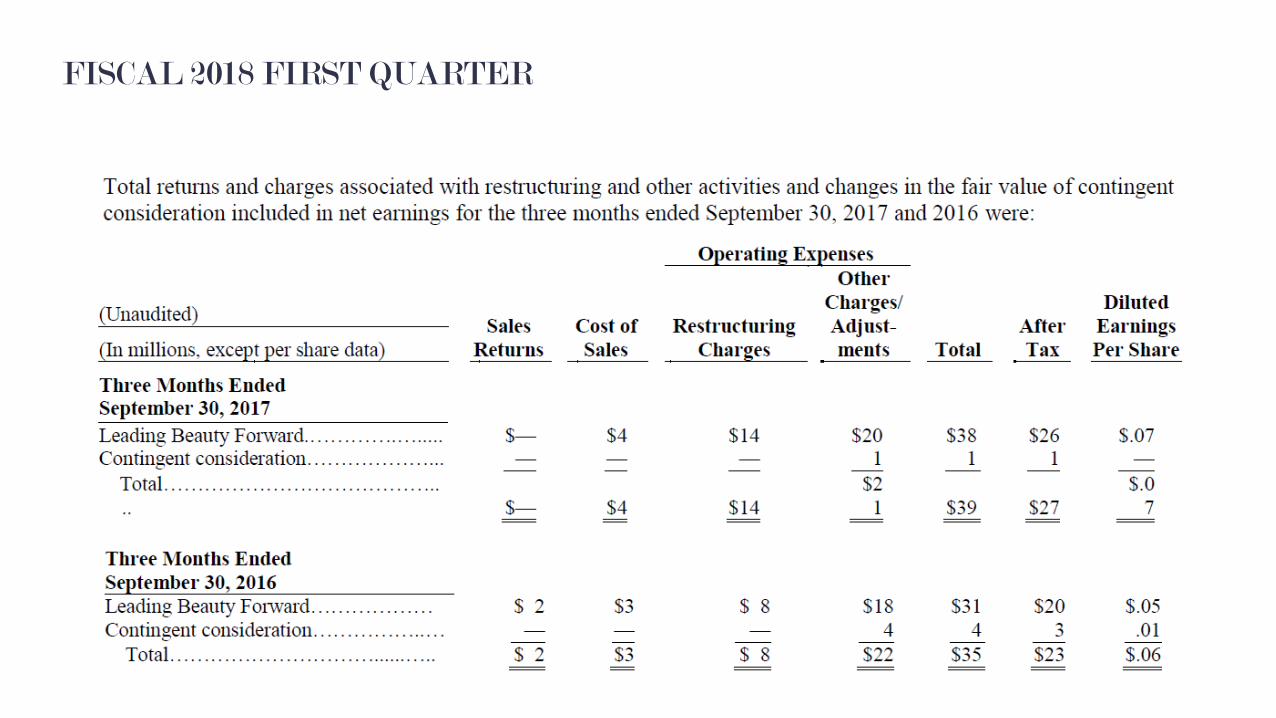
In May 2016, the Company announced a multi-year initiative (Leading Beauty Forward) to build on its strengths and better leverage its cost structure to free resources for investment
to continue its growth momentum. Leading Beauty Forward is designed to enhance the Company’s go-to-market capabilities, reinforce its leadership in global prestige beauty and
continue creating sustainable value. During the fiscal 2018 first quarter, the Company continued to approve specific initiatives under Leading Beauty Forward. The Company plans
to approve additional initiatives through fiscal 2019 and expects to complete those initiatives through fiscal 2021. The Company expects Leading Beauty Forward will result in
related restructuring and other charges totaling between $600 million and $700 million, before taxes. Once fully implemented, Leading Beauty Forward is expected to yield annual
net benefits of between $200 million and $300 million, before taxes, of which a portion is expected to be reinvested in future growth initiatives.
The Company recorded $1 million and $4 million of expense within selling, general and administrative expenses for the three months ended September 30, 2017 and 2016,
respectively, to reflect changes in the fair value of its contingent consideration related to its fiscal 2015 and 2016 acquisitions.
During the first quarter of fiscal 2018, the Company adopted a new accounting standard for share-based compensation that requires excess tax benefits and tax deficiencies related
to stock-based compensation awards be recorded as income tax benefit or expense in the income statement. As a result of the adoption of this new standard, the Company
recognized $23 million of excess tax benefits as a reduction to the provision for income taxes, which reduced the effective rate for income taxes by 420 basis points and added
approximately $.06 to diluted net earnings per share for the three months ended September 30, 2017.
FISCAL 2018 FIRST QUARTER
FISCAL 2018 FIRST QUARTER
FISCAL 2018 FIRST QUARTER
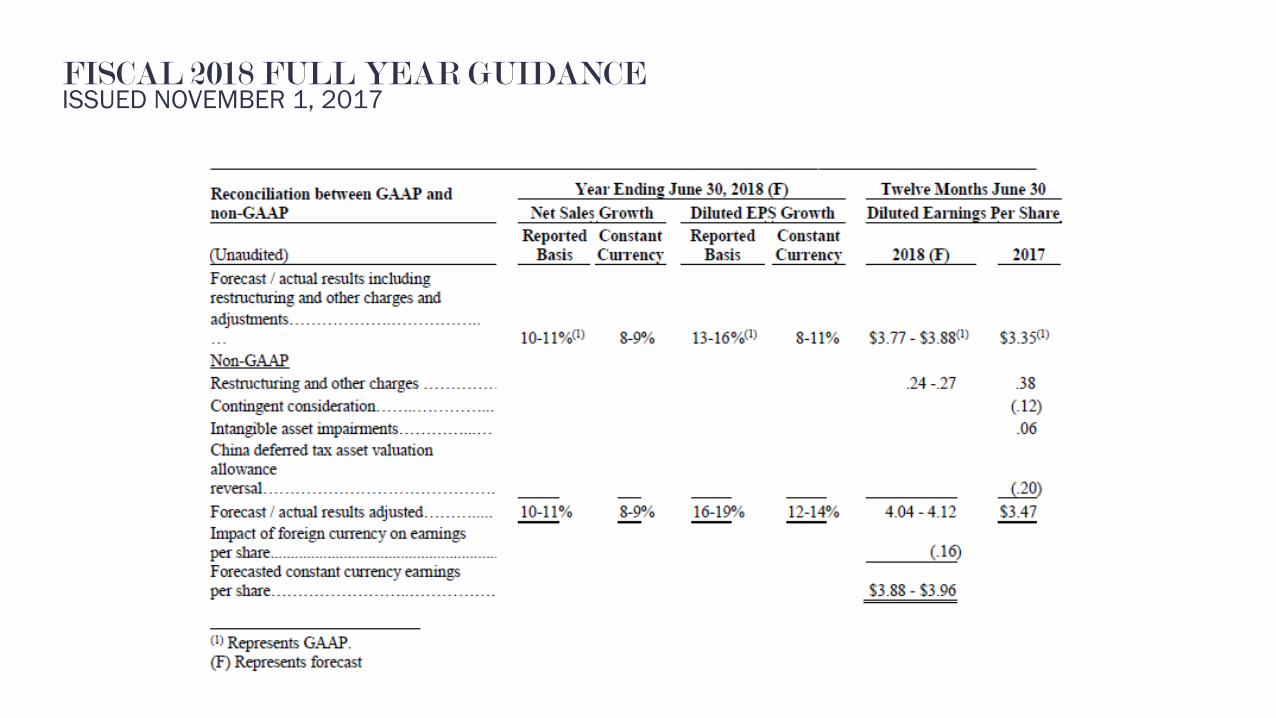
FISCAL 2018 FULL YEAR GUIDANCEISSUED NOVEMBER 1, 2017
FISCAL 2017
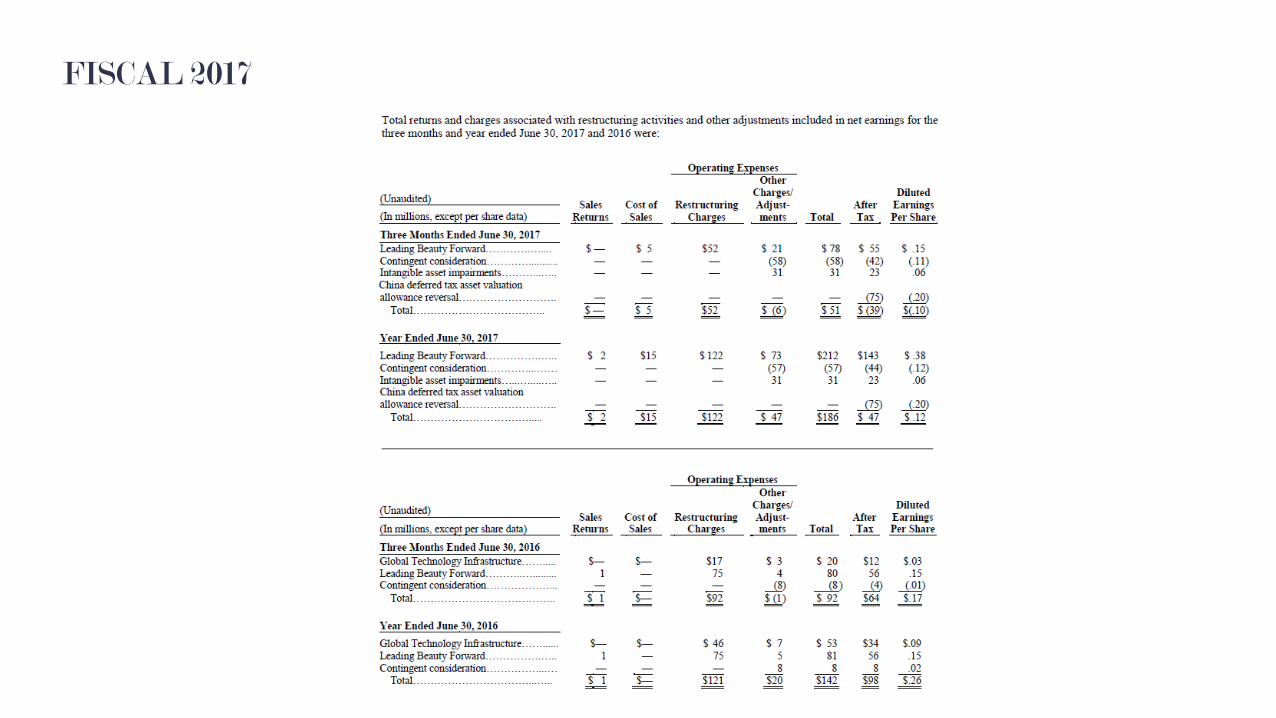
In June 2017, the Company revised and approved financial projections for certain of its fiscal 2015 and 2016 acquisitions. In the process, the Company noted that actual results and the most recent projections were lower during their respective earn-out measurement periods than the financial targets made at June 30, 2016 and it reassessed the likelihood of achieving those targets. As a result, the Company recognized a $58 million gain within selling, general and administrative expenses, to reflect the adjusted fair value of its contingent consideration, primarily related to the acquisitions of GLAMGLOW, Editions de Parfums Frédéric Malle and Le Labo as of June 30, 2017. The gain recognized for the 2017 full fiscal year was $57 million.
The Company performs annual impairment tests for each of its reporting units. In addition, the Company may perform interim impairment tests as a result of changes in circumstances and certain financial indicators. Such tests may conclude that the carrying value of certain assets exceed their estimated fair values, resulting in the recognition of impairment charges. During the fourth quarter of fiscal 2017, the Company recorded goodwill impairment charges related to the Editions de Parfums Frédéric Malle and RODIN olio lusso reporting units of $22 million and $6 million, respectively. Additionally, during the fourth quarter of fiscal 2017, the Company recognized impairment charges related to the RODIN olio lusso trademark, customer relationship and persona intangible assets of $3 million.
In the fourth quarter of fiscal 2017, China enacted a favorable change to its tax law that expanded the corporate income tax deduction allowance for advertising and promotional expenses. As a result of the new law, in the fourth quarter of fiscal2017, the Company released into income its previously established deferred tax asset valuation allowance of approximately $75 million related to its accumulated carryforward of excess advertising and promotional expenses.
FISCAL 2017
FISCAL 2017