Embed Size (px)
Citation preview
Transforming the Automotive Industry: Strategic Assessment of the Global Alternative
Powertrain Market
© 2008 Frost & Sullivan. All rights reserved.
October 2008
The Global Oil Paradox

2
© 2008Frost & Sullivan. All rights reserved.
Who we are…
• A global growth consulting company that partners with clients to support the development of innovative growth strategies.
• For more than 45 years, we have leveraged our comprehensive market expertise to serve an extensive clientele that includes Global 1000 companies, emerging companies, and the investment community
• We offer industry research and market strategies, provide growth consulting and corporate training, and support clients to help grow their businesses.
Automotive & Transportation
Chemicals, Materials & Food
Aerospace & Defense
Energy
Environmental, Building Controls & PPE
Healthcare
Information & Communication Technologies
Industrial Automation & Electronics
3
© 2008Frost & Sullivan. All rights reserved.
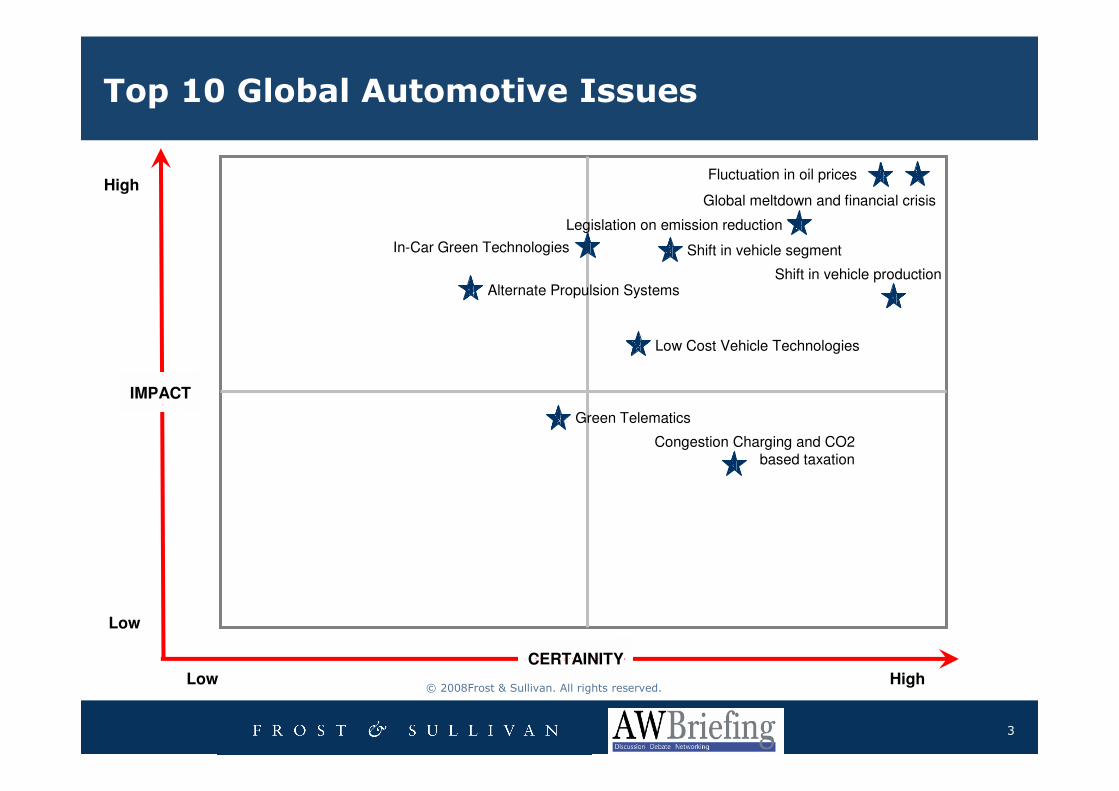
Top 10 Global Automotive Issues
CERTAINITY
IMPACT
High
Low
Low High
Shift in vehicle production
Shift in vehicle segment
Fluctuation in oil prices
Green Telematics
Legislation on emission reduction
In-Car Green Technologies
Alternate Propulsion Systems
Congestion Charging and CO2 based taxation
Global meltdown and financial crisis
Low Cost Vehicle Technologies
4
© 2008Frost & Sullivan. All rights reserved.
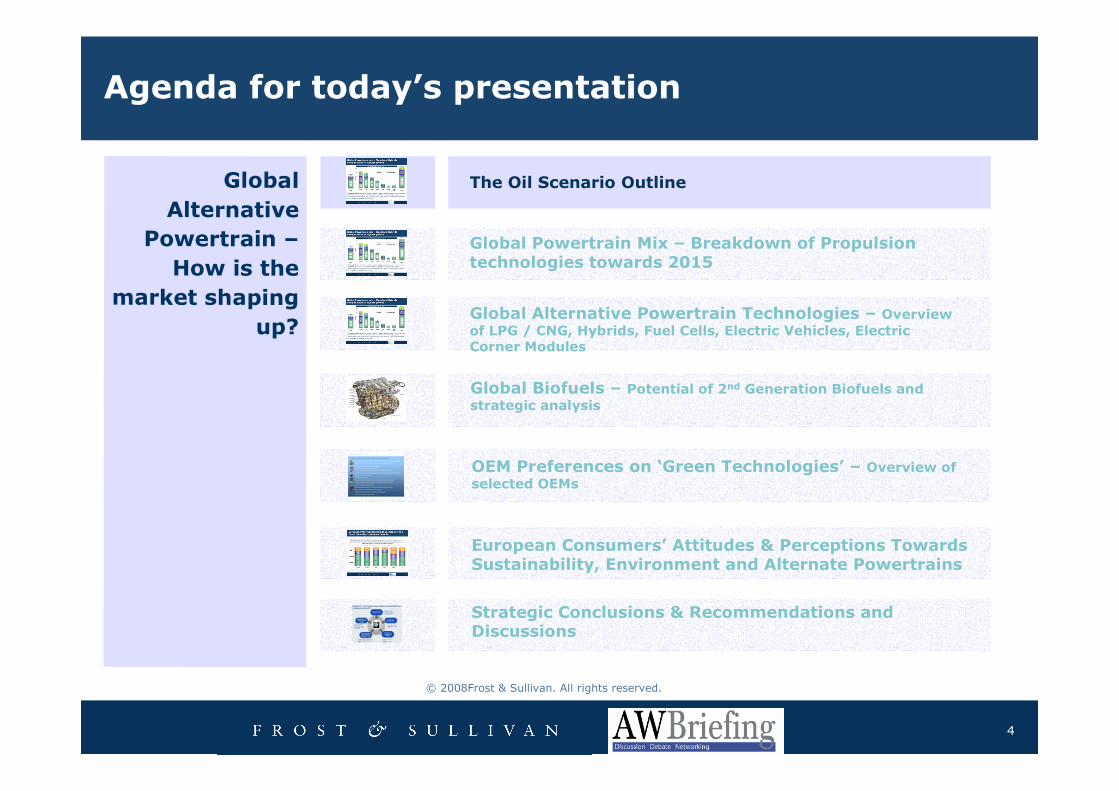
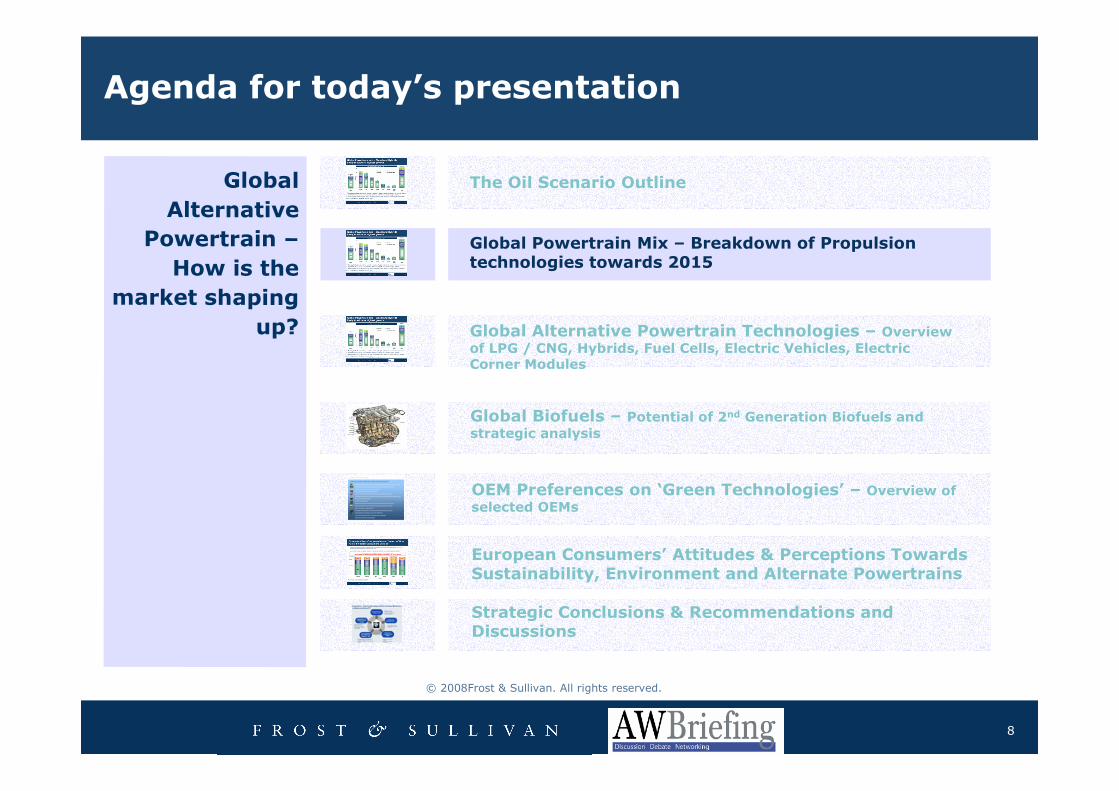
Agenda for today’s presentation
Global
Alternative
Powertrain –
How is the
market shaping
up?
European Consumers’ Attitudes & Perceptions Towards Sustainability, Environment and Alternate Powertrains
Global Biofuels – Potential of 2nd Generation Biofuels and
strategic analysis
Strategic Conclusions & Recommendations and Discussions
Global Alternative Powertrain Technologies – Overview
of LPG / CNG, Hybrids, Fuel Cells, Electric Vehicles, Electric Corner Modules
OEM Preferences on ‘Green Technologies’ – Overview of
selected OEMs
Global Powertrain Mix – Breakdown of Propulsion technologies towards 2015
The Oil Scenario Outline
5
© 2008Frost & Sullivan. All rights reserved.
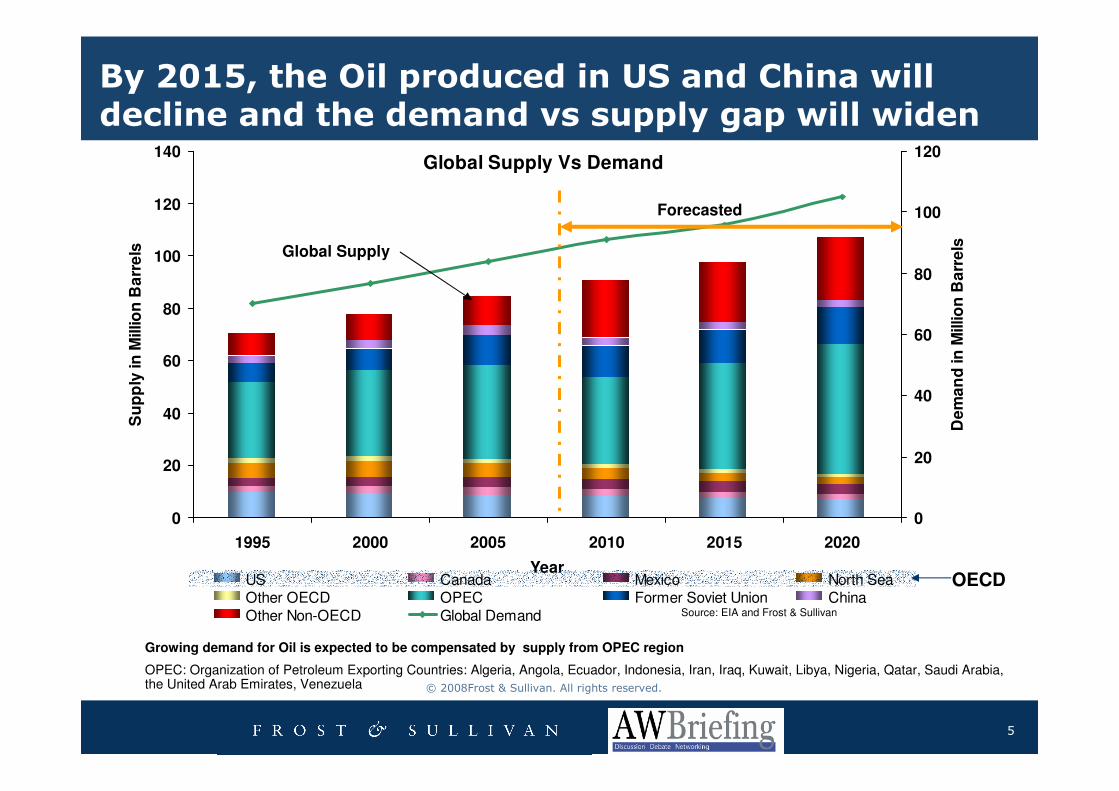
Global Supply Vs Demand
0
20
40
60
80
100
120
140
1995 2000 2005 2010 2015 2020
Year
Su
pp
ly in
Millio
n B
arr
els
0
20
40
60
80
100
120
De
ma
nd
in
Millio
n B
arr
els
US Canada Mexico North SeaOther OECD OPEC Former Soviet Union ChinaOther Non-OECD Global Demand
By 2015, the Oil produced in US and China will decline and the demand vs supply gap will widen
Global Supply
Forecasted
Source: EIA and Frost & Sullivan
OECD
Growing demand for Oil is expected to be compensated by supply from OPEC region
OPEC: Organization of Petroleum Exporting Countries: Algeria, Angola, Ecuador, Indonesia, Iran, Iraq, Kuwait, Libya, Nigeria, Qatar, Saudi Arabia, the United Arab Emirates, Venezuela
6
© 2008Frost & Sullivan. All rights reserved.
1930 1950 1970 1990 2010 2030 2050
Bill
ion
Ba
rre
ls p
er
ye
ar
0
10
20
30
40
50
60
Discovered in Past
Future discoveries forecast
Production
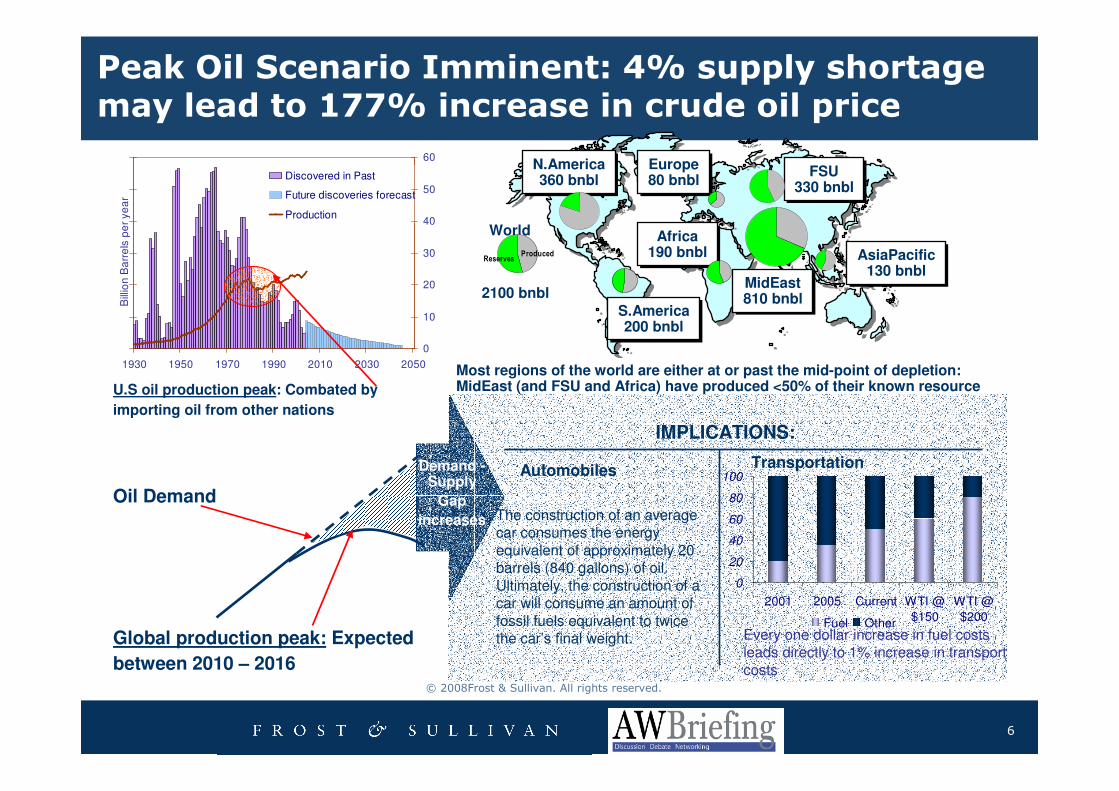
Peak Oil Scenario Imminent: 4% supply shortage may lead to 177% increase in crude oil price
U.S oil production peak: Combated by
importing oil from other nations
Global production peak: Expected
between 2010 – 2016
Oil Demand
Demand -Supply
Gap
increases
IMPLICATIONS:
0
20
40
60
80
100
2001 2005 Current WTI @
$150
WTI @
$200Fuel Other
Every one dollar increase in fuel costs leads directly to 1% increase in transport costs
TransportationAutomobiles
The construction of an average car consumes the energy equivalent of approximately 20 barrels (840 gallons) of oil. Ultimately, the construction of a car will consume an amount of fossil fuels equivalent to twice the car’s final weight.
N.America360 bnbl
N.America360 bnbl
S.America200 bnbl
S.America200 bnbl
FSU330 bnbl
FSU330 bnbl
MidEast810 bnbl
MidEast810 bnbl
AsiaPacific130 bnbl
AsiaPacific130 bnbl
Africa190 bnbl
Africa190 bnbl
Europe80 bnbl
Europe80 bnbl
World
2100 bnbl
ProducedReserves
Most regions of the world are either at or past the mid-point of depletion: MidEast (and FSU and Africa) have produced <50% of their known resource
7
© 2008Frost & Sullivan. All rights reserved.
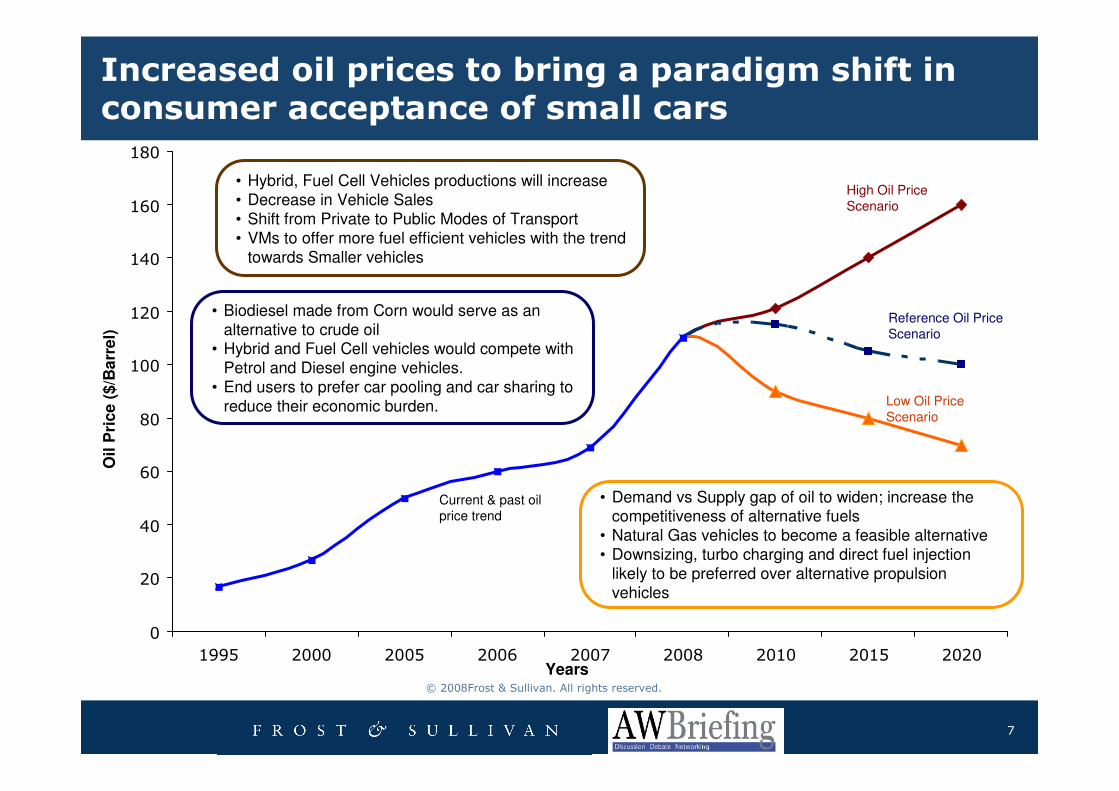
Increased oil prices to bring a paradigm shift in consumer acceptance of small cars
0
20
40
60
80
100
120
140
160
180
1995 2000 2005 2006 2007 2008 2010 2015 2020
Current & past oil price trend
High Oil Price Scenario
Reference Oil Price Scenario
Low Oil Price Scenario
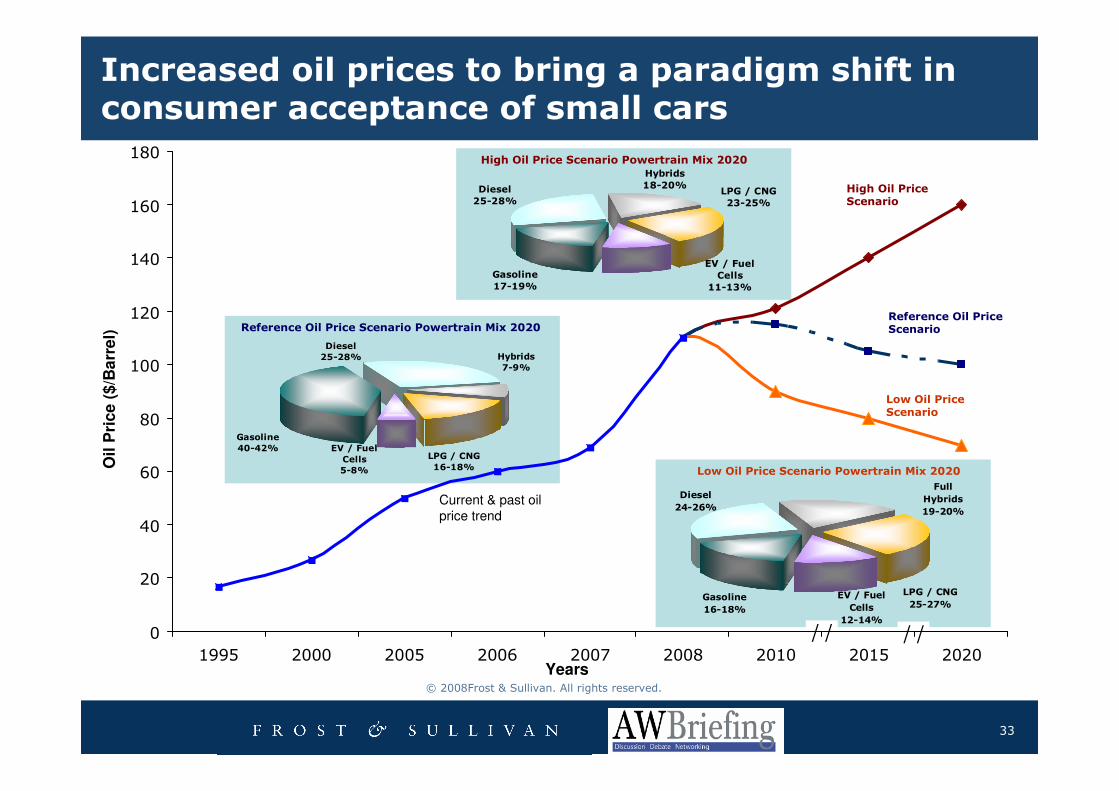
• Hybrid, Fuel Cell Vehicles productions will increase• Decrease in Vehicle Sales• Shift from Private to Public Modes of Transport• VMs to offer more fuel efficient vehicles with the trend
towards Smaller vehicles
• Demand vs Supply gap of oil to widen; increase the competitiveness of alternative fuels
• Natural Gas vehicles to become a feasible alternative• Downsizing, turbo charging and direct fuel injection
likely to be preferred over alternative propulsion vehicles
• Biodiesel made from Corn would serve as an alternative to crude oil
• Hybrid and Fuel Cell vehicles would compete with Petrol and Diesel engine vehicles.
• End users to prefer car pooling and car sharing to reduce their economic burden.
Years
Oil
Pri
ce
($
/Ba
rre
l)
8
© 2008Frost & Sullivan. All rights reserved.
Agenda for today’s presentation
Global
Alternative
Powertrain –
How is the
market shaping
up?
European Consumers’ Attitudes & Perceptions Towards Sustainability, Environment and Alternate Powertrains
Global Biofuels – Potential of 2nd Generation Biofuels and
strategic analysis
Strategic Conclusions & Recommendations and Discussions
Global Alternative Powertrain Technologies – Overview
of LPG / CNG, Hybrids, Fuel Cells, Electric Vehicles, Electric Corner Modules
OEM Preferences on ‘Green Technologies’ – Overview of
selected OEMs
Global Powertrain Mix – Breakdown of Propulsion technologies towards 2015
The Oil Scenario Outline
9
© 2008Frost & Sullivan. All rights reserved.
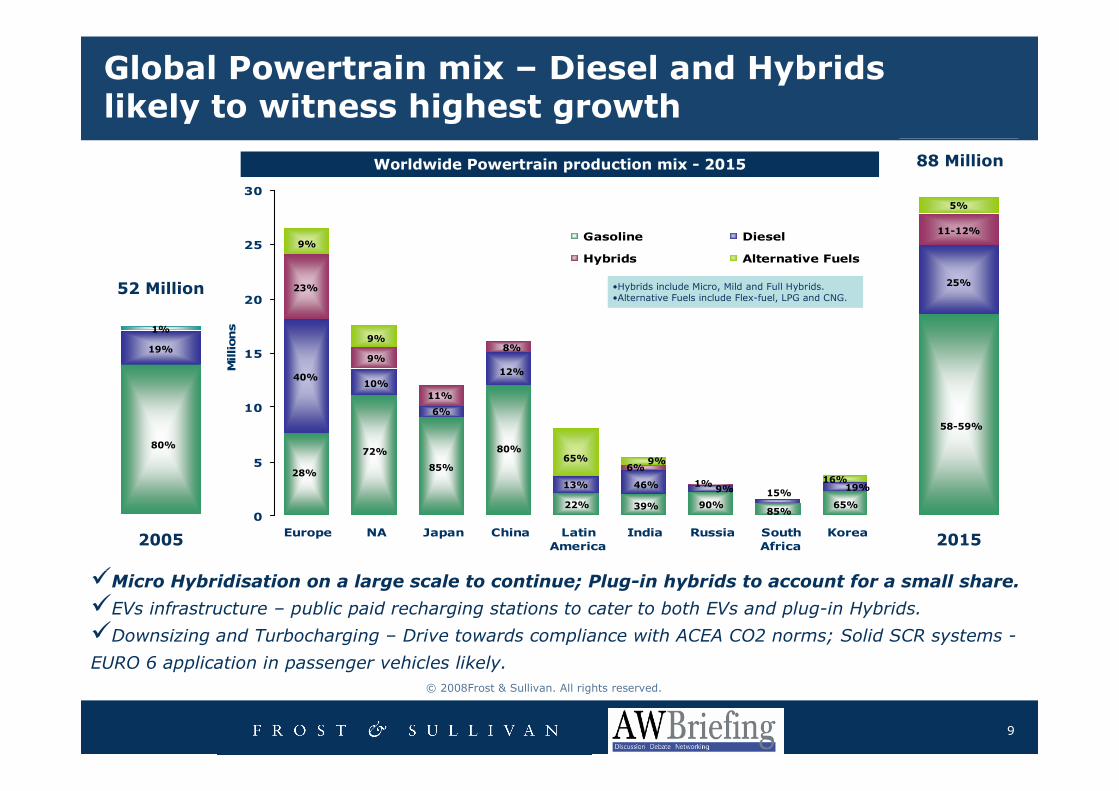
Global Powertrain mix – Diesel and Hybrids likely to witness highest growth
�Micro Hybridisation on a large scale to continue; Plug-in hybrids to account for a small share.
�EVs infrastructure – public paid recharging stations to cater to both EVs and plug-in Hybrids.
�Downsizing and Turbocharging – Drive towards compliance with ACEA CO2 norms; Solid SCR systems -
EURO 6 application in passenger vehicles likely.
Worldwide Powertrain production mix - 2015
0
5
10
15
20
25
30
Europe NA Japan China Latin
America
India Russia South
Africa
Korea
Millions
Gasoline Diesel
Hybrids Alternative Fuels
80%
19%
1%
2005 2015
52 Million
88 Million
28%
40%
23%
9%
72%
10%
9%
9%
85%
6%
80%
12%
39%
46%
6%
90%85%
58-59%
25%
11-12%
5%
15%9%
11%
9%
1%
8%
65%
13%
22%
•Hybrids include Micro, Mild and Full Hybrids.•Alternative Fuels include Flex-fuel, LPG and CNG.
65%
16%19%
10
© 2008Frost & Sullivan. All rights reserved.
Agenda for today’s presentation
Global
Alternative
Powertrain –
How is the
market shaping
up?
European Consumers’ Attitudes & Perceptions Towards Sustainability, Environment and Alternate Powertrains
Global Biofuels – Potential of 2nd Generation Biofuels and
strategic analysis
Strategic Conclusions & Recommendations and Discussions
Global Alternative Powertrain Technologies – Overview
of LPG / CNG, Hybrids, Fuel Cells, Electric Vehicles, Electric Corner Modules
OEM Preferences on ‘Green Technologies’ – Overview of
selected OEMs
Global Powertrain Mix – Breakdown of Propulsion technologies towards 2015
The Oil Scenario Outline
11
© 2008Frost & Sullivan. All rights reserved.
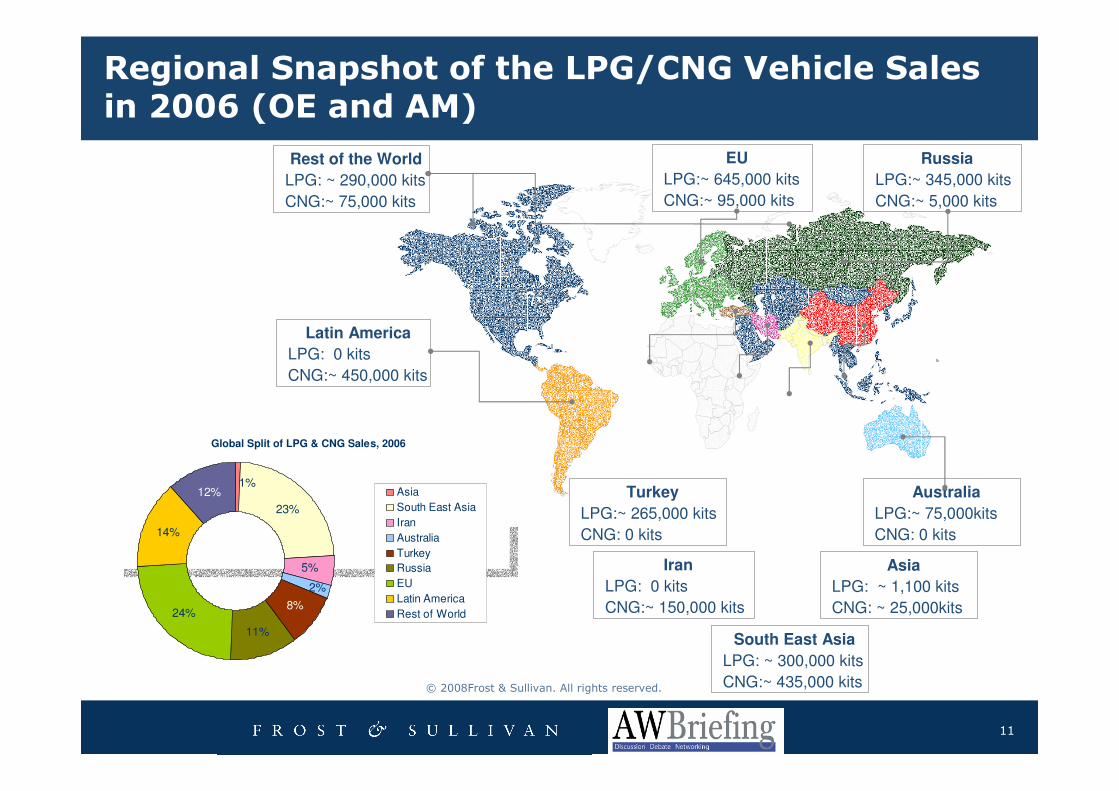
Regional Snapshot of the LPG/CNG Vehicle Sales in 2006 (OE and AM)
EU
LPG:~ 645,000 kits
CNG:~ 95,000 kits
Rest of the World
LPG: ~ 290,000 kits
CNG:~ 75,000 kits
Latin America
LPG: 0 kits
CNG:~ 450,000 kits
Russia
LPG:~ 345,000 kits
CNG:~ 5,000 kits
Australia
LPG:~ 75,000kits
CNG: 0 kits
Asia
LPG: ~ 1,100 kits
CNG: ~ 25,000kits
South East Asia
LPG: ~ 300,000 kits
CNG:~ 435,000 kits
Iran
LPG: 0 kits
CNG:~ 150,000 kits
Turkey
LPG:~ 265,000 kits
CNG: 0 kits
Global Split of LPG & CNG Sales, 2006
23%
5%
11%
24%
14%
2%
1%12%
8%
Asia
South East Asia
Iran
Australia
Turkey
Russia
EU
Latin America
Rest of World
13
© 2008Frost & Sullivan. All rights reserved.
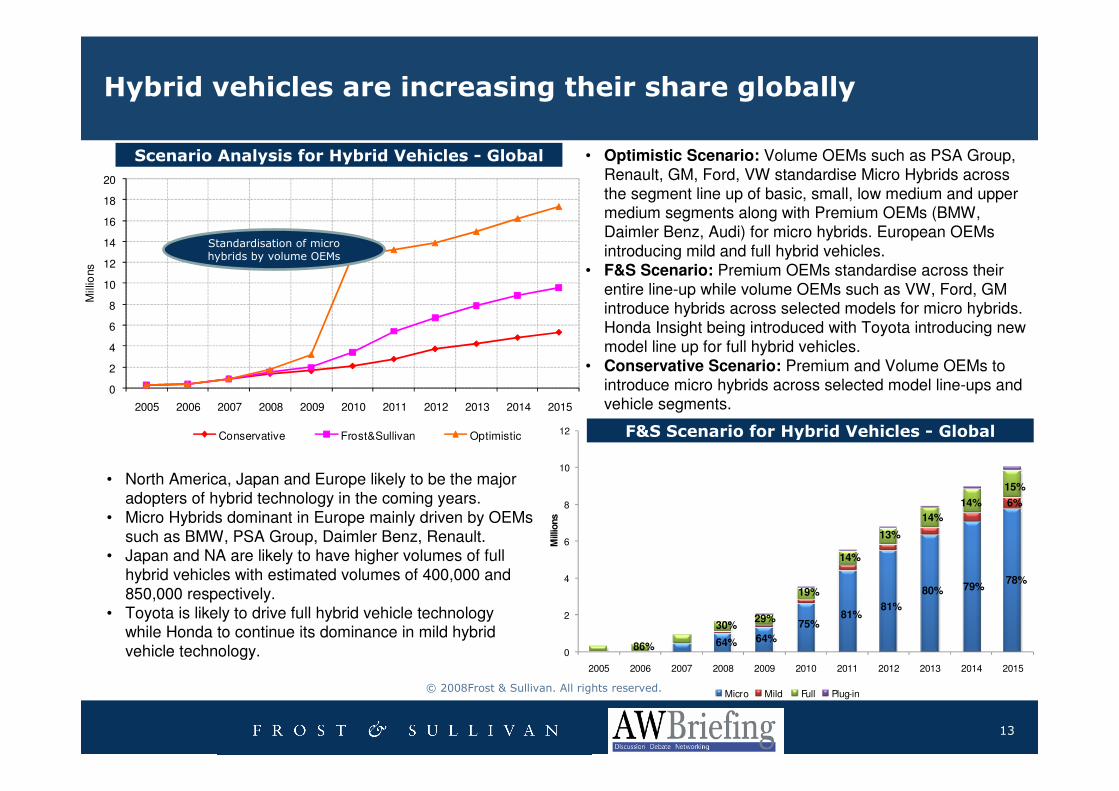
Hybrid vehicles are increasing their share globally
• Optimistic Scenario: Volume OEMs such as PSA Group, Renault, GM, Ford, VW standardise Micro Hybrids across the segment line up of basic, small, low medium and upper medium segments along with Premium OEMs (BMW, Daimler Benz, Audi) for micro hybrids. European OEMs introducing mild and full hybrid vehicles.
• F&S Scenario: Premium OEMs standardise across their entire line-up while volume OEMs such as VW, Ford, GM introduce hybrids across selected models for micro hybrids. Honda Insight being introduced with Toyota introducing new model line up for full hybrid vehicles.
• Conservative Scenario: Premium and Volume OEMs to introduce micro hybrids across selected model line-ups and vehicle segments.
Scenario Analysis for Hybrid Vehicles - Global
F&S Scenario for Hybrid Vehicles - Global
0
2
4
6
8
10
12
14
16
18
20
2005 2006 2007 2008 2009 2010 2011 2012 2013 2014 2015
Mill
ions
Conservative Frost&Sullivan Optimistic
Standardisation of micro hybrids by volume OEMs
• North America, Japan and Europe likely to be the major adopters of hybrid technology in the coming years.
• Micro Hybrids dominant in Europe mainly driven by OEMs such as BMW, PSA Group, Daimler Benz, Renault.
• Japan and NA are likely to have higher volumes of full hybrid vehicles with estimated volumes of 400,000 and 850,000 respectively.
• Toyota is likely to drive full hybrid vehicle technology while Honda to continue its dominance in mild hybrid vehicle technology. 0
2
4
6
8
10
12
2005 2006 2007 2008 2009 2010 2011 2012 2013 2014 2015
Mill
ions
Micro Mild Full Plug-in
86% 64%
30%
64%
29%75%
81%81%
80% 79%78%
19%
14%
13%
14%
14%
15%
6%
14
© 2008Frost & Sullivan. All rights reserved.
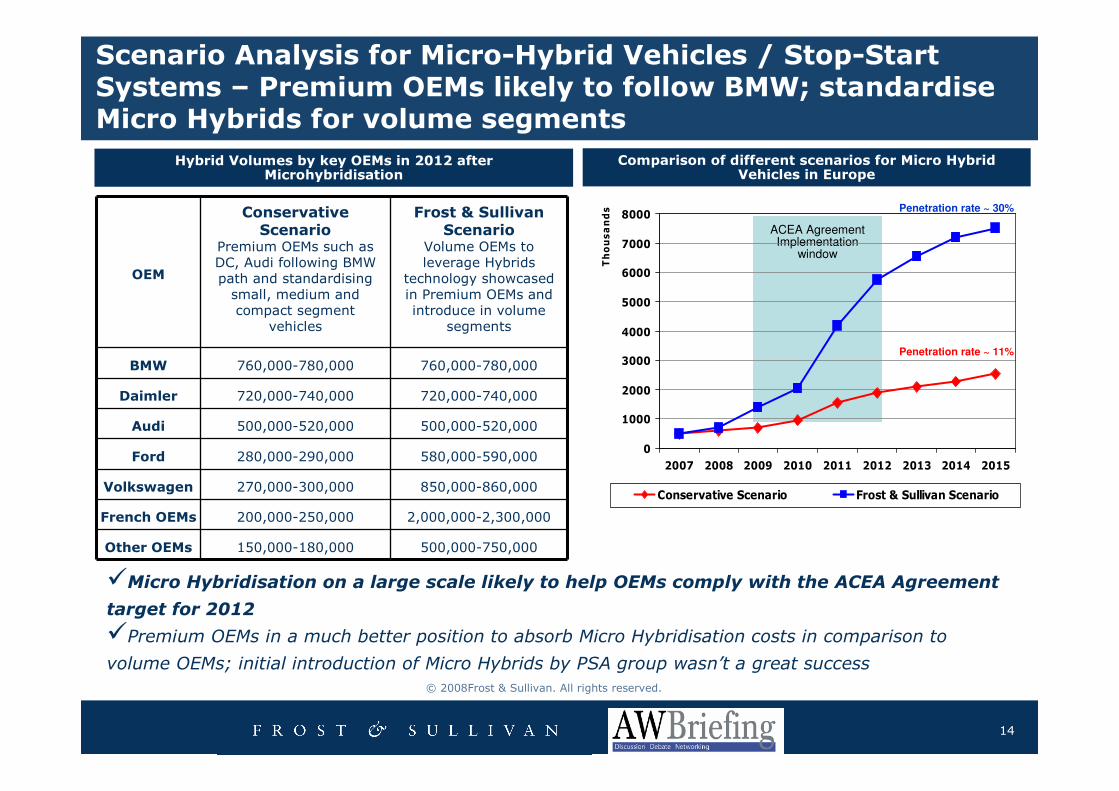
Scenario Analysis for Micro-Hybrid Vehicles / Stop-Start Systems – Premium OEMs likely to follow BMW; standardise Micro Hybrids for volume segments
ACEA Agreement Implementation
window
0
1000
2000
3000
4000
5000
6000
7000
8000
2007 2008 2009 2010 2011 2012 2013 2014 2015
Thousands
Conservative Scenario Frost & Sullivan Scenario
Comparison of different scenarios for Micro Hybrid Vehicles in Europe
OEM
Conservative Scenario
Premium OEMs such as DC, Audi following BMW path and standardising small, medium and compact segment
vehicles
Frost & Sullivan Scenario
Volume OEMs to leverage Hybrids
technology showcased in Premium OEMs and introduce in volume
segments
BMW 760,000-780,000 760,000-780,000
Daimler 720,000-740,000 720,000-740,000
Audi 500,000-520,000 500,000-520,000
Ford 280,000-290,000 580,000-590,000
Volkswagen 270,000-300,000 850,000-860,000
French OEMs 200,000-250,000 2,000,000-2,300,000
Other OEMs 150,000-180,000 500,000-750,000
Hybrid Volumes by key OEMs in 2012 after Microhybridisation
Penetration rate ~ 30%
Penetration rate ~ 11%
�Micro Hybridisation on a large scale likely to help OEMs comply with the ACEA Agreement
target for 2012
�Premium OEMs in a much better position to absorb Micro Hybridisation costs in comparison to
volume OEMs; initial introduction of Micro Hybrids by PSA group wasn’t a great success
15
© 2008Frost & Sullivan. All rights reserved.
0
50
100
150
200
250
300
2004 2005 2006 2007 2008 2009 2010 2011 2012 2013 2014 2015
Unit Shipments (Thousands)
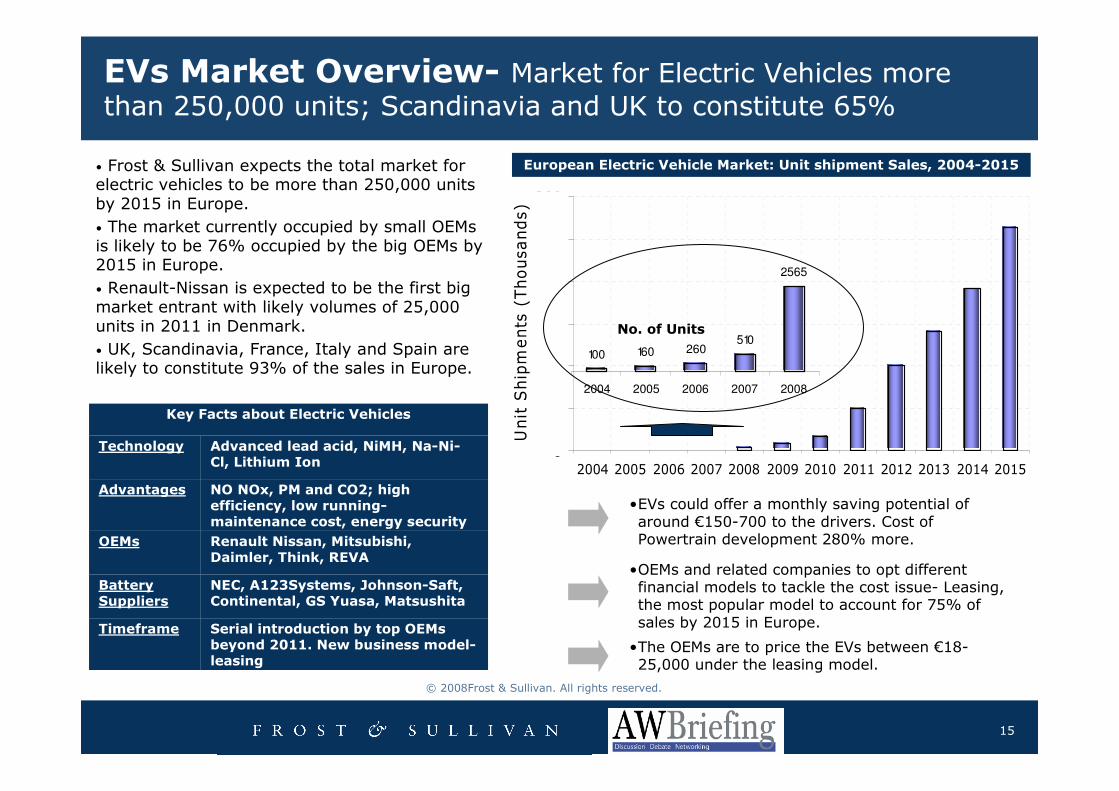
EVs Market Overview- Market for Electric Vehicles more
than 250,000 units; Scandinavia and UK to constitute 65%
European Electric Vehicle Market: Unit shipment Sales, 2004-2015
100 160 260510
2565
2004 2005 2006 2007 2008
• Frost & Sullivan expects the total market for electric vehicles to be more than 250,000 units by 2015 in Europe.
• The market currently occupied by small OEMs is likely to be 76% occupied by the big OEMs by 2015 in Europe.
• Renault-Nissan is expected to be the first big market entrant with likely volumes of 25,000 units in 2011 in Denmark.
• UK, Scandinavia, France, Italy and Spain are likely to constitute 93% of the sales in Europe.
•EVs could offer a monthly saving potential of around €150-700 to the drivers. Cost of Powertrain development 280% more.
•OEMs and related companies to opt different financial models to tackle the cost issue- Leasing, the most popular model to account for 75% of sales by 2015 in Europe.
•The OEMs are to price the EVs between €18-25,000 under the leasing model.
No. of Units
Renault Nissan, Mitsubishi, Daimler, Think, REVA
OEMs
NO NOx, PM and CO2; high efficiency, low running-maintenance cost, energy security
Advantages
Serial introduction by top OEMs beyond 2011. New business model-leasing
Timeframe
NEC, A123Systems, Johnson-Saft, Continental, GS Yuasa, Matsushita
Battery Suppliers
Advanced lead acid, NiMH, Na-Ni-Cl, Lithium Ion
Technology
Key Facts about Electric Vehicles
16
© 2008Frost & Sullivan. All rights reserved.
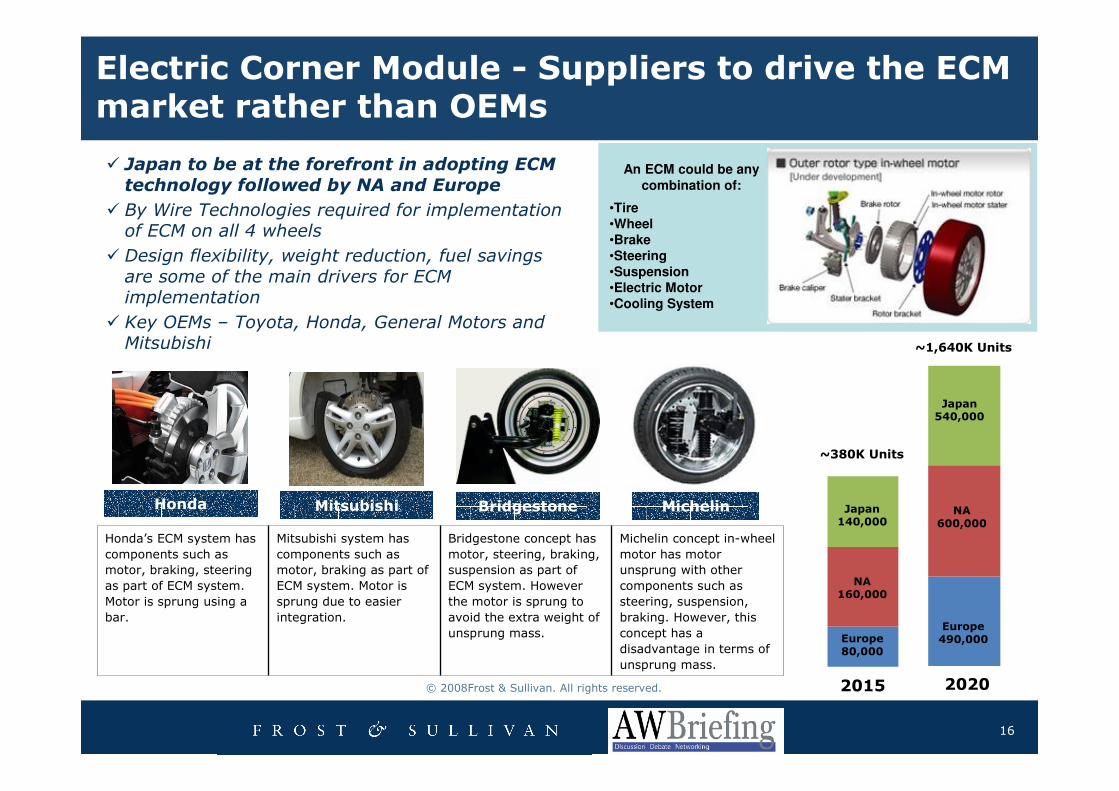
Electric Corner Module - Suppliers to drive the ECM market rather than OEMs
Europe80,000
NA160,000
Japan140,000
Europe490,000
NA600,000
Japan540,000
20202015
~380K Units
~1,640K Units
An ECM could be any combination of:
•Tire•Wheel •Brake•Steering•Suspension•Electric Motor•Cooling System
Honda’s ECM system has
components such as
motor, braking, steering
as part of ECM system.
Motor is sprung using a
bar.
Mitsubishi system has
components such as
motor, braking as part of
ECM system. Motor is
sprung due to easier
integration.
Bridgestone concept has
motor, steering, braking,
suspension as part of
ECM system. However
the motor is sprung to
avoid the extra weight of
unsprung mass.
Michelin concept in-wheel
motor has motor
unsprung with other
components such as
steering, suspension,
braking. However, this
concept has a
disadvantage in terms of
unsprung mass.
Honda Mitsubishi Bridgestone Michelin
� Japan to be at the forefront in adopting ECM technology followed by NA and Europe
� By Wire Technologies required for implementation of ECM on all 4 wheels
� Design flexibility, weight reduction, fuel savings
are some of the main drivers for ECM implementation
� Key OEMs – Toyota, Honda, General Motors and Mitsubishi
17
© 2008Frost & Sullivan. All rights reserved.
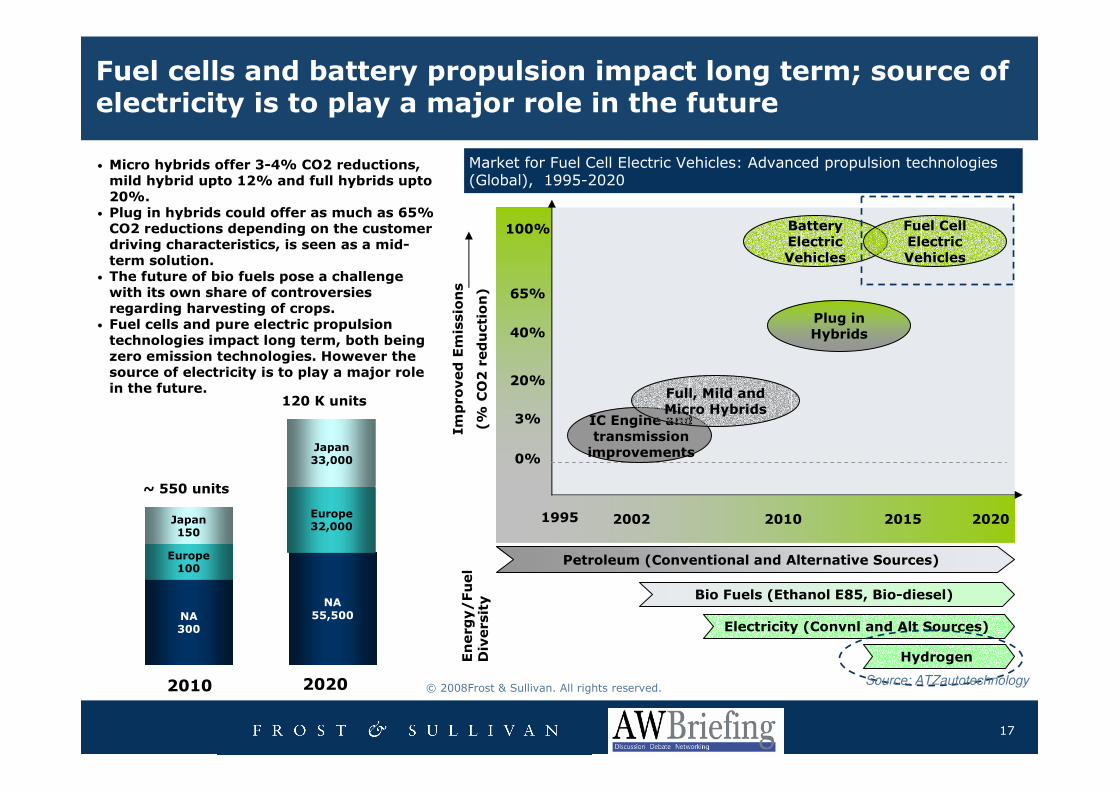
Fuel cells and battery propulsion impact long term; source of electricity is to play a major role in the future
• Micro hybrids offer 3-4% CO2 reductions, mild hybrid upto 12% and full hybrids upto 20%.
• Plug in hybrids could offer as much as 65% CO2 reductions depending on the customer driving characteristics, is seen as a mid-term solution.
• The future of bio fuels pose a challenge with its own share of controversies regarding harvesting of crops.
• Fuel cells and pure electric propulsion technologies impact long term, both being zero emission technologies. However the source of electricity is to play a major role in the future.
NA55,500
Europe32,000
Japan33,000
2020
NA300
Europe100
Japan150
2010
~ 550 units
120 K units
IC Engine and transmission improvements
Full, Mild and Micro Hybrids
Plug in Hybrids
Battery Electric Vehicles
Fuel Cell Electric Vehicles
Improved Emissions
(% CO2 reduction)
0%
3%
20%
40%
65%
100%
1995 2002 2010 2015 2020
Energy/Fuel
Diversity
Petroleum (Conventional and Alternative Sources)
Bio Fuels (Ethanol E85, Bio-diesel)
Electricity (Convnl and Alt Sources)
Hydrogen
Market for Fuel Cell Electric Vehicles: Advanced propulsion technologies (Global), 1995-2020
Source: ATZautotechnology

18
© 2008Frost & Sullivan. All rights reserved.
Agenda for today’s presentation
Global
Alternative
Powertrain –
How is the
market shaping
up?
European Consumers’ Attitudes & Perceptions Towards Sustainability, Environment and Alternate Powertrains
Strategic Conclusions & Recommendations and Discussions
Global Alternative Powertrain Technologies – Overview
of LPG / CNG, Hybrids, Fuel Cells, Electric Vehicles, Electric Corner Modules
OEM Preferences on ‘Green Technologies’ – Overview of
selected OEMs
Global Powertrain Mix – Breakdown of Propulsion technologies towards 2015
The Oil Scenario Outline
Global Biofuels – Potential of 2nd Generation Biofuels and
strategic analysis
19
© 2008Frost & Sullivan. All rights reserved.
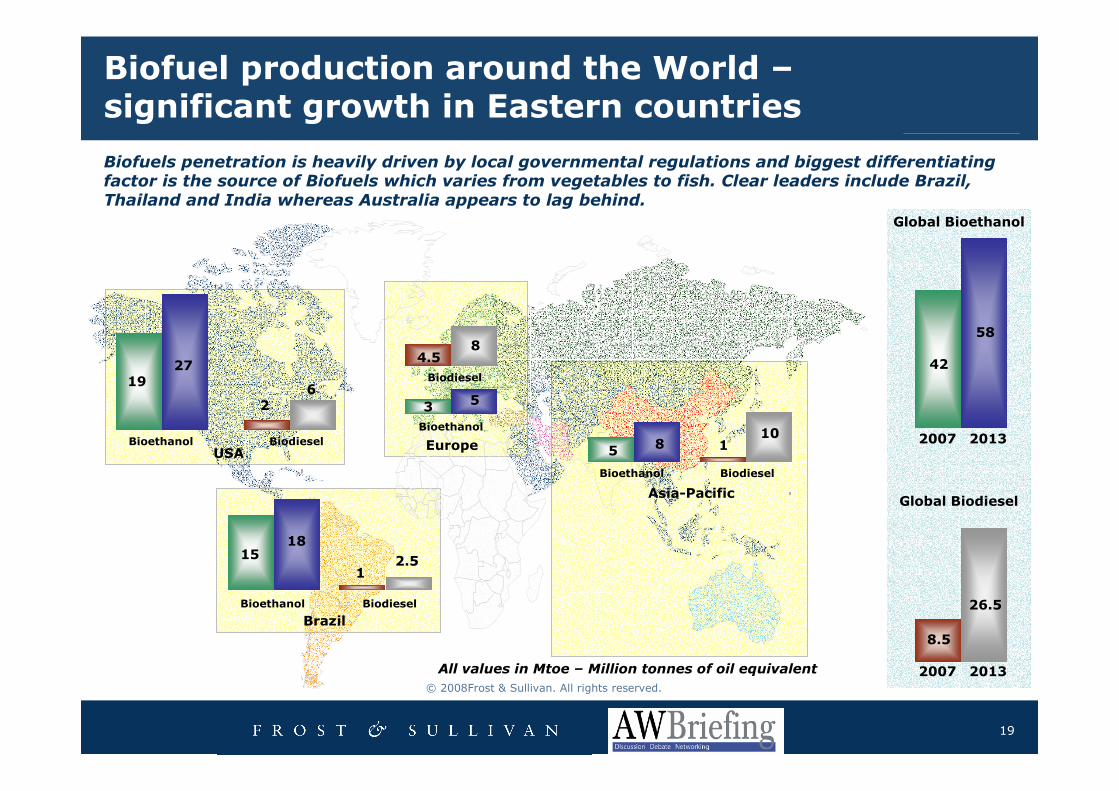
Biofuel production around the World –significant growth in Eastern countries
Biofuels penetration is heavily driven by local governmental regulations and biggest differentiating factor is the source of Biofuels which varies from vegetables to fish. Clear leaders include Brazil, Thailand and India whereas Australia appears to lag behind.
1927
1518
35
58
26
4.58
12.5
110
42
58
8.5
26.5
Global Bioethanol
Global Biodiesel
2007 2013
2007 2013All values in Mtoe – Million tonnes of oil equivalent
BiodieselBioethanol
BiodieselBioethanol
BiodieselBioethanol
Bioethanol
Biodiesel
USA
Brazil
Europe
Asia-Pacific
20
© 2008Frost & Sullivan. All rights reserved.
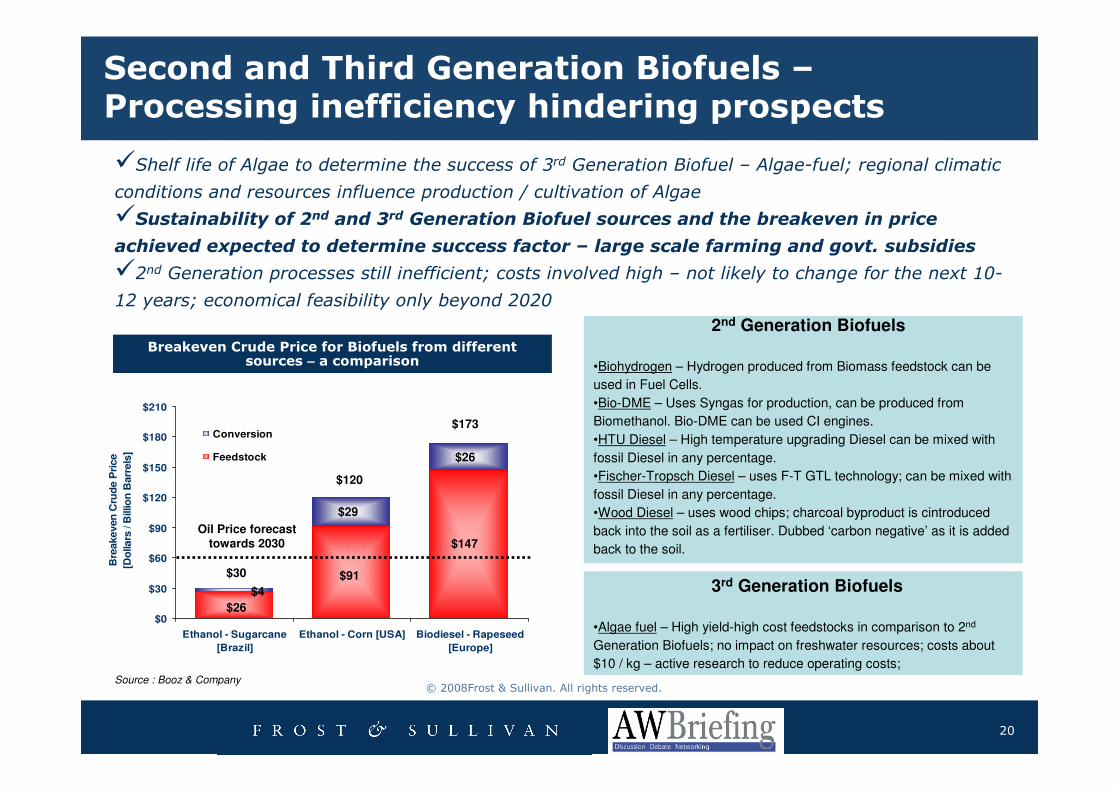
Second and Third Generation Biofuels –Processing inefficiency hindering prospects
2nd Generation Biofuels
•Biohydrogen – Hydrogen produced from Biomass feedstock can be
used in Fuel Cells.
•Bio-DME – Uses Syngas for production, can be produced from
Biomethanol. Bio-DME can be used CI engines.
•HTU Diesel – High temperature upgrading Diesel can be mixed with
fossil Diesel in any percentage.
•Fischer-Tropsch Diesel – uses F-T GTL technology; can be mixed with
fossil Diesel in any percentage.
•Wood Diesel – uses wood chips; charcoal byproduct is cintroduced
back into the soil as a fertiliser. Dubbed ‘carbon negative’ as it is added
back to the soil.
�Shelf life of Algae to determine the success of 3rd Generation Biofuel – Algae-fuel; regional climatic
conditions and resources influence production / cultivation of Algae
�Sustainability of 2nd and 3rd Generation Biofuel sources and the breakeven in price
achieved expected to determine success factor – large scale farming and govt. subsidies
�2nd Generation processes still inefficient; costs involved high – not likely to change for the next 10-
12 years; economical feasibility only beyond 2020
3rd Generation Biofuels
•Algae fuel – High yield-high cost feedstocks in comparison to 2nd
Generation Biofuels; no impact on freshwater resources; costs about
$10 / kg – active research to reduce operating costs;
$0
$30
$60
$90
$120
$150
$180
$210
Ethanol - Sugarcane
[Brazil]
Ethanol - Corn [USA] Biodiesel - Rapeseed
[Europe]
Bre
akeven
Cru
de P
rice
[Do
llars
/ B
illio
n B
arr
els
]
Conversion
Feedstock
$26
$4
$30 $91
$29
$120
$147
$26
$173
Oil Price forecast towards 2030
Source : Booz & Company
Breakeven Crude Price for Biofuels from different sources – a comparison
21
© 2008Frost & Sullivan. All rights reserved.
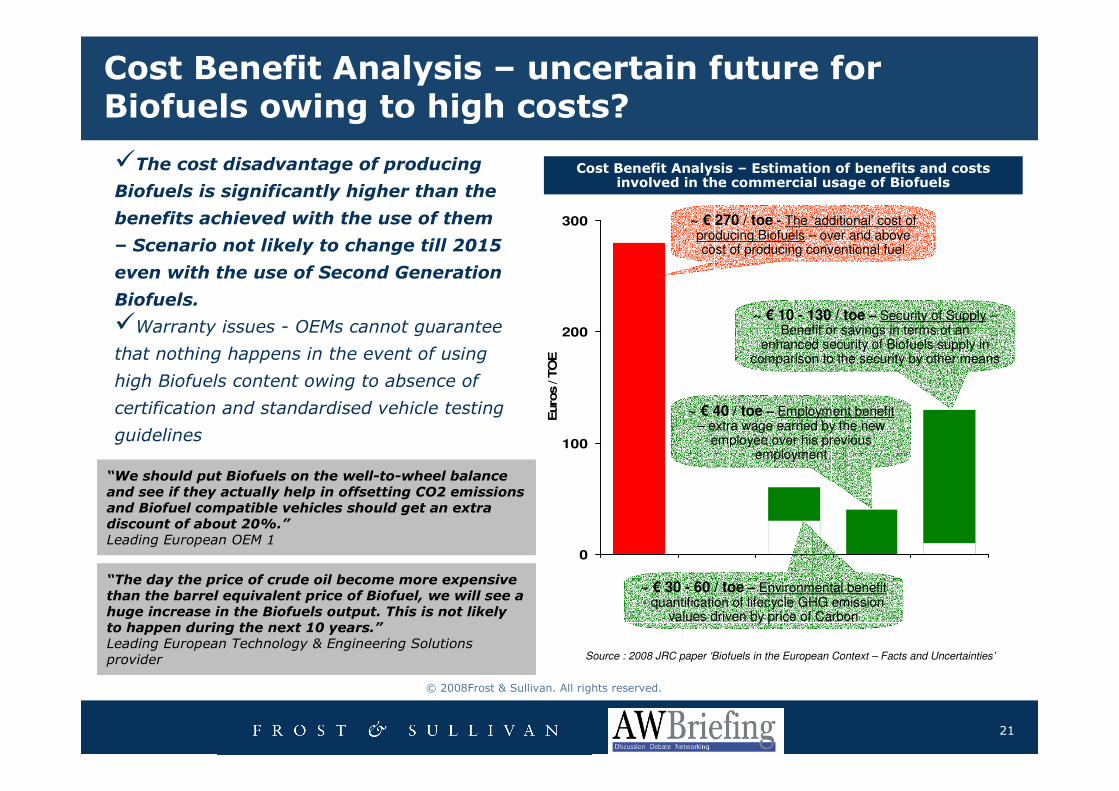
Cost Benefit Analysis – uncertain future for Biofuels owing to high costs?
0
100
200
300
Euro
s / T
OE
~ € 270 / toe - The ‘additional’ cost of producing Biofuels – over and above cost of producing conventional fuel
~ € 30 - 60 / toe – Environmental benefit- quantification of lifecycle GHG emission
values driven by price of Carbon
~ € 40 / toe – Employment benefit– extra wage earned by the new
employee over his previous employment
~ € 10 - 130 / toe – Security of Supply –Benefit or savings in terms of an
enhanced security of Biofuels supply in comparison to the security by other means
Cost Benefit Analysis – Estimation of benefits and costs involved in the commercial usage of Biofuels
Source : 2008 JRC paper ‘Biofuels in the European Context – Facts and Uncertainties’
“The day the price of crude oil become more expensive than the barrel equivalent price of Biofuel, we will see a huge increase in the Biofuels output. This is not likely to happen during the next 10 years.”Leading European Technology & Engineering Solutions provider
�The cost disadvantage of producing
Biofuels is significantly higher than the
benefits achieved with the use of them
– Scenario not likely to change till 2015
even with the use of Second Generation
Biofuels.
�Warranty issues - OEMs cannot guarantee
that nothing happens in the event of using
high Biofuels content owing to absence of
certification and standardised vehicle testing
guidelines
“We should put Biofuels on the well-to-wheel balance and see if they actually help in offsetting CO2 emissions and Biofuel compatible vehicles should get an extra discount of about 20%.”Leading European OEM 1
22
© 2008Frost & Sullivan. All rights reserved.
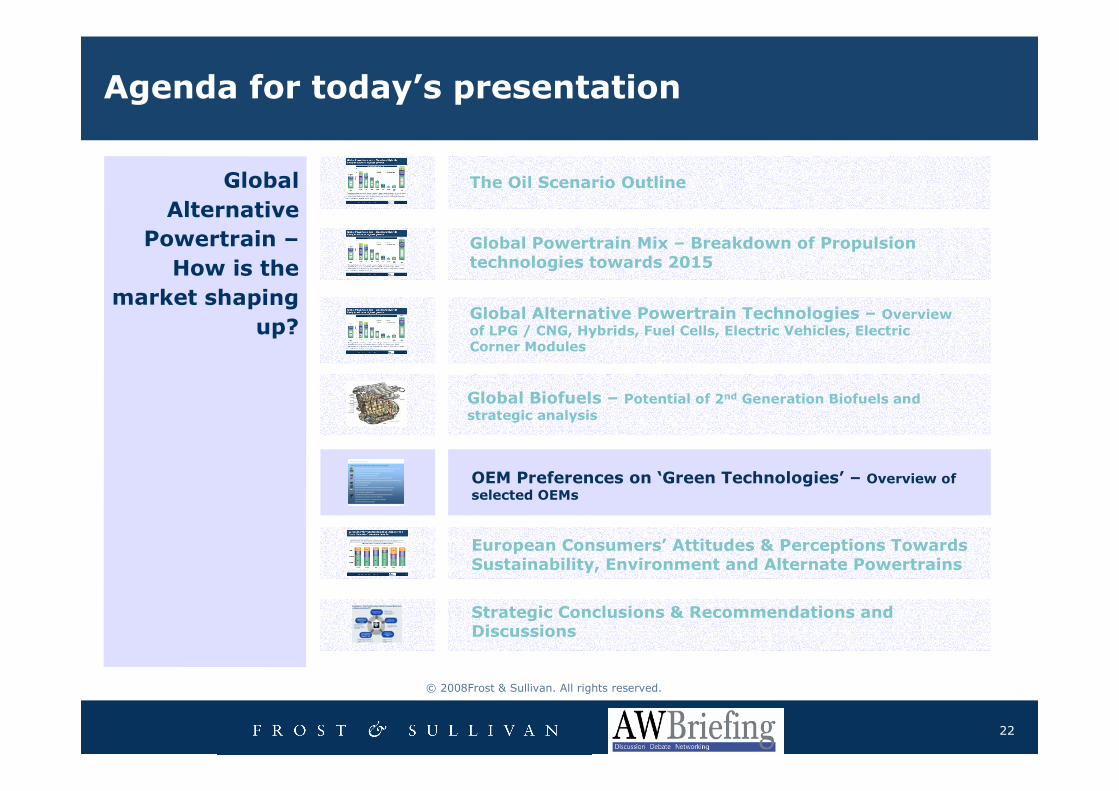
Agenda for today’s presentation
Global
Alternative
Powertrain –
How is the
market shaping
up?
European Consumers’ Attitudes & Perceptions Towards Sustainability, Environment and Alternate Powertrains
Strategic Conclusions & Recommendations and Discussions
Global Alternative Powertrain Technologies – Overview
of LPG / CNG, Hybrids, Fuel Cells, Electric Vehicles, Electric Corner Modules
Global Powertrain Mix – Breakdown of Propulsion technologies towards 2015
The Oil Scenario Outline
Global Biofuels – Potential of 2nd Generation Biofuels and
strategic analysis
OEM Preferences on ‘Green Technologies’ – Overview of
selected OEMs
23
© 2008Frost & Sullivan. All rights reserved.
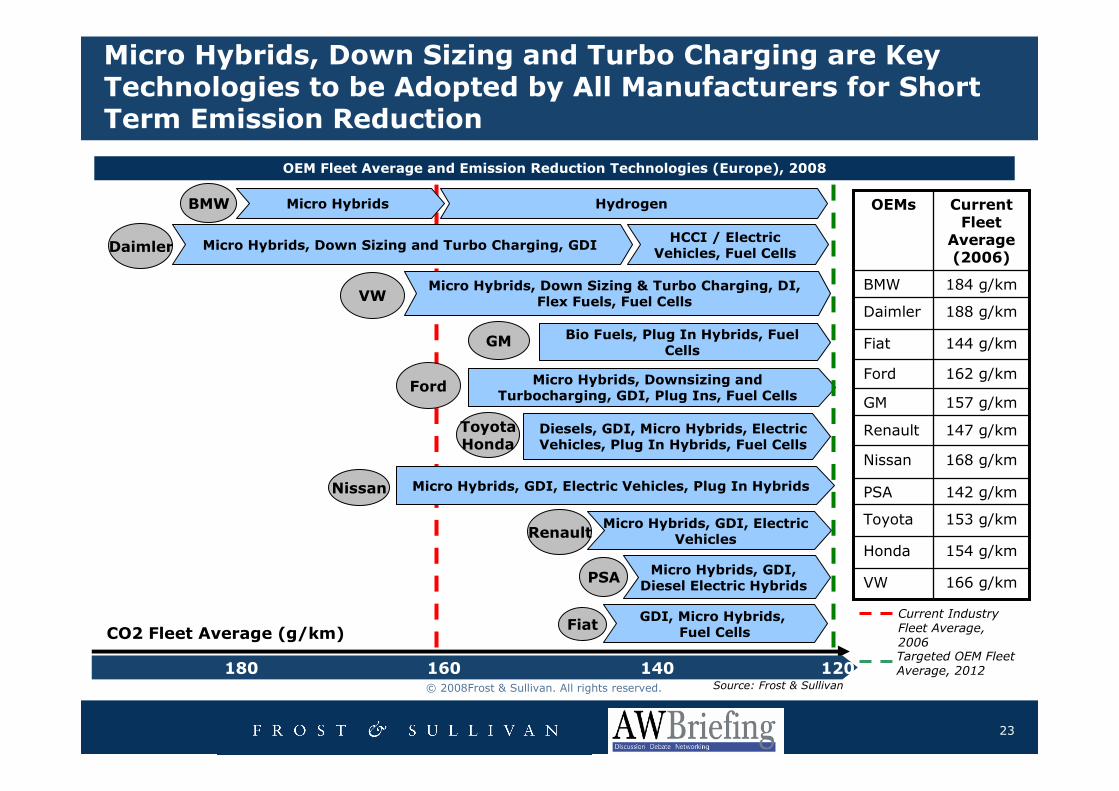
Micro Hybrids, Down Sizing and Turbo Charging are Key Technologies to be Adopted by All Manufacturers for Short Term Emission Reduction
180 160 140 120
Bio Fuels, Plug In Hybrids, Fuel Cells
Micro Hybrids, Downsizing and Turbocharging, GDI, Plug Ins, Fuel Cells
Diesels, GDI, Micro Hybrids, Electric Vehicles, Plug In Hybrids, Fuel Cells
Micro Hybrids, GDI, Electric Vehicles, Plug In Hybrids
Micro Hybrids, GDI, Electric Vehicles
Micro Hybrids, GDI, Diesel Electric Hybrids
GDI, Micro Hybrids,Fuel Cells
Micro Hybrids, Down Sizing & Turbo Charging, DI, Flex Fuels, Fuel Cells
BMW
Daimler
VW
GM
Ford
ToyotaHonda
Renault
PSA
Fiat
Nissan
Hydrogen
HCCI / Electric Vehicles, Fuel Cells
166 g/kmVW
154 g/kmHonda
153 g/kmToyota
142 g/kmPSA
168 g/kmNissan
147 g/kmRenault
157 g/kmGM
162 g/kmFord
144 g/kmFiat
188 g/kmDaimler
184 g/kmBMW
Current Fleet
Average (2006)
OEMs
Current Industry Fleet Average, 2006Targeted OEM Fleet Average, 2012
Micro Hybrids
Micro Hybrids, Down Sizing and Turbo Charging, GDI
OEM Fleet Average and Emission Reduction Technologies (Europe), 2008
CO2 Fleet Average (g/km)
Source: Frost & Sullivan
24
© 2008Frost & Sullivan. All rights reserved.
Agenda for today’s presentation
Global
Alternative
Powertrain –
How is the
market shaping
up?
European Consumers’ Attitudes & Perceptions Towards Sustainability, Environment and Alternate Powertrains
Strategic Conclusions & Recommendations and Discussions
Global Alternative Powertrain Technologies – Overview
of LPG / CNG, Hybrids, Fuel Cells, Electric Vehicles, Electric Corner Modules
Global Powertrain Mix – Breakdown of Propulsion technologies towards 2015
The Oil Scenario Outline
Global Biofuels – Potential of 2nd Generation Biofuels and
strategic analysis
OEM Preferences on ‘Green Technologies’ – Overview of
selected OEMs
25
© 2008Frost & Sullivan. All rights reserved.
European Consumers’ Attitudes &
Perceptions Towards Sustainability,
Environment and Alternate Powertrains
(Hybrids, Flex-Fuels, NG Vehicles)
Key Relevant Findings

26
© 2008Frost & Sullivan. All rights reserved.
Pollution• Air (Incl. CO2), Noise, Water
Pollution• Air (Incl. CO2), Noise, Water Depletion of Natural Resources
and Alternative Fuels
Depletion of Natural Resources and Alternative Fuels
Climate ChangeClimate ChangeFuel EfficiencyFuel Efficiency
RecyclingRecycling
Passenger Cars + Light Trucks – 55%
• A web survey was conducted using a randomly screened on-line consumer panel, consumers were given incentives
• In all 2,648 interviews were conducted for this survey and F&S ensured that a solid representation of vehicle segments were captured from each country covered including France, UK, Germany, Italy and Spain
• Respondents were recruited based on vehicle segment who were personally involved in the purchase decision of the vehicles.
• A good representation of different age groups (younger than 17 were screened out) & gender to ensure a good representation of consumers.
100%2,648100%604100%211100%300100%317100%609100%607Total
3.8%1002.5%157.6%164.0%125.0%164.3%262.5%15SUV-
Small
9.3%2469.9%6011.4%247.7%236.9%229.2%5610.0%61SUV
Large
13.7%36413.1%7920.4%4312.7%3815.1%4812.3%7513.3%81MPV
24.4%64724.8%15021.3%4525.3%7624.3%7724.6%15024.5%149D&E
24.4%64524.7%14920.4%4325.0%7524.3%7724.6%15024.9%151C
24.4%64625.0%15119.0%4025.3%7624.3%7725.0%15224.7%150A&B
TotalUKSwedenSpainItalyGermanyFrance
The Study Focuses on 5 Key Parameters that Define the Sustainability and Environmental Impact of Products
27
© 2008Frost & Sullivan. All rights reserved.
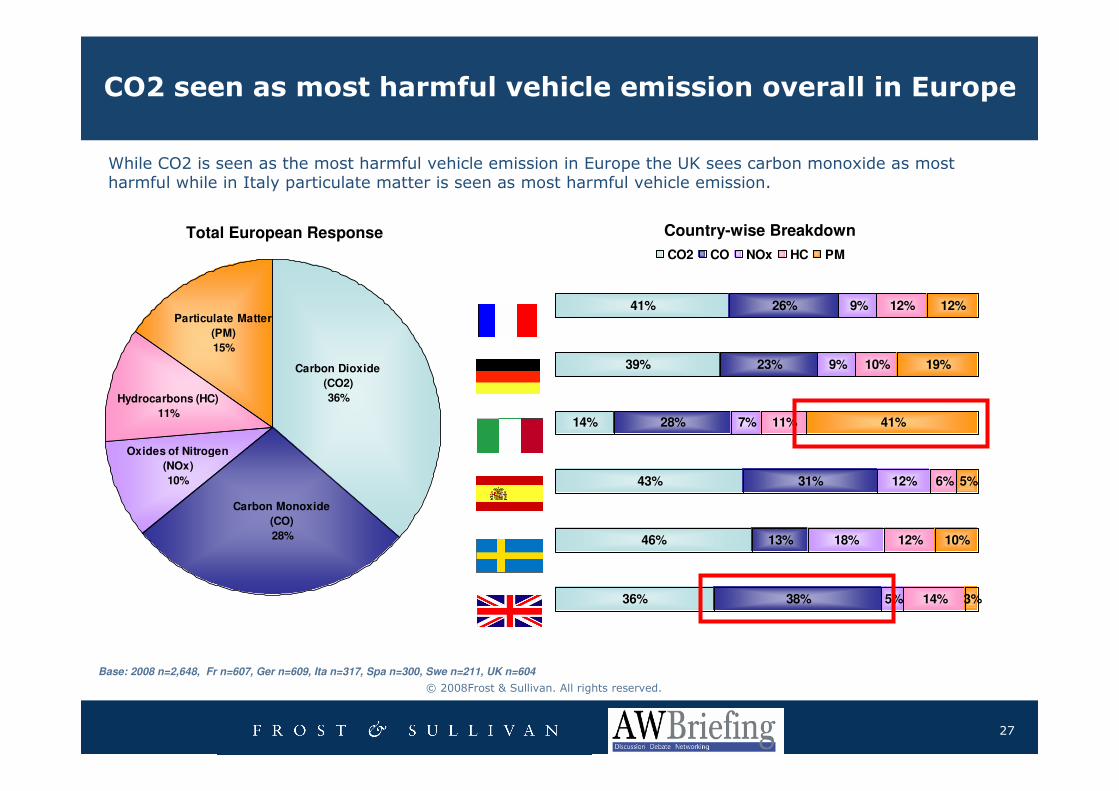
CO2 seen as most harmful vehicle emission overall in Europe
36%
46%
43%
14%
39%
41%
38%
13%
31%
28%
23%
26%
5%
18%
12%
7%
9%
9%
14%
12%
6%
11%
10%
12%
3%
10%
5%
41%
19%
12%
CO2 CO NOx HC PM
Hydrocarbons (HC)
11%
Oxides of Nitrogen
(NOx)
10%
Carbon Dioxide
(CO2)
36%
Carbon Monoxide
(CO)
28%
Particulate Matter
(PM)
15%
Total European Response Country-wise Breakdown
Base: 2008 n=2,648, Fr n=607, Ger n=609, Ita n=317, Spa n=300, Swe n=211, UK n=604
While CO2 is seen as the most harmful vehicle emission in Europe the UK sees carbon monoxide as most harmful while in Italy particulate matter is seen as most harmful vehicle emission.
28
© 2008Frost & Sullivan. All rights reserved.
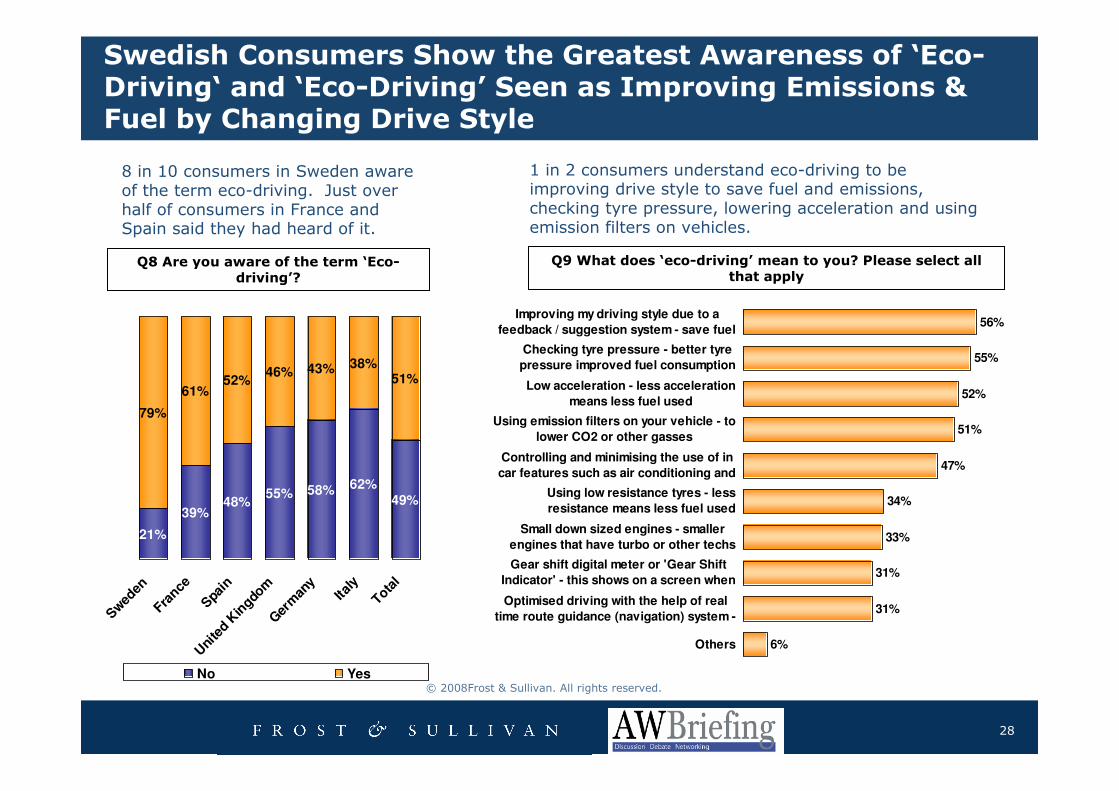
Swedish Consumers Show the Greatest Awareness of ‘Eco-Driving‘ and ‘Eco-Driving’ Seen as Improving Emissions & Fuel by Changing Drive Style
8 in 10 consumers in Sweden aware of the term eco-driving. Just over half of consumers in France and Spain said they had heard of it.
Q8 Are you aware of the term ‘Eco-driving’?
21%
39%48%
55% 58% 62%49%
79%
61%52%
46% 43% 38%51%
Swed
en
France
Spain
Uni
ted K
ingdo
mG
erm
any
Italy
Total
No Yes
33%
31%
31%
6%
34%
47%
51%
52%
55%
56%Improving my driving style due to a
feedback / suggestion system - save fuel
Checking tyre pressure - better tyre
pressure improved fuel consumption
Low acceleration - less acceleration
means less fuel used
Using emission filters on your vehicle - to
lower CO2 or other gasses
Controlling and minimising the use of in
car features such as air conditioning and
Using low resistance tyres - less
resistance means less fuel used
Small down sized engines - smaller
engines that have turbo or other techs
Gear shift digital meter or 'Gear Shift
Indicator' - this shows on a screen when
Optimised driving with the help of real
time route guidance (navigation) system -
Others
1 in 2 consumers understand eco-driving to be improving drive style to save fuel and emissions, checking tyre pressure, lowering acceleration and using emission filters on vehicles.
Q9 What does ‘eco-driving’ mean to you? Please select all that apply
29
© 2008Frost & Sullivan. All rights reserved.
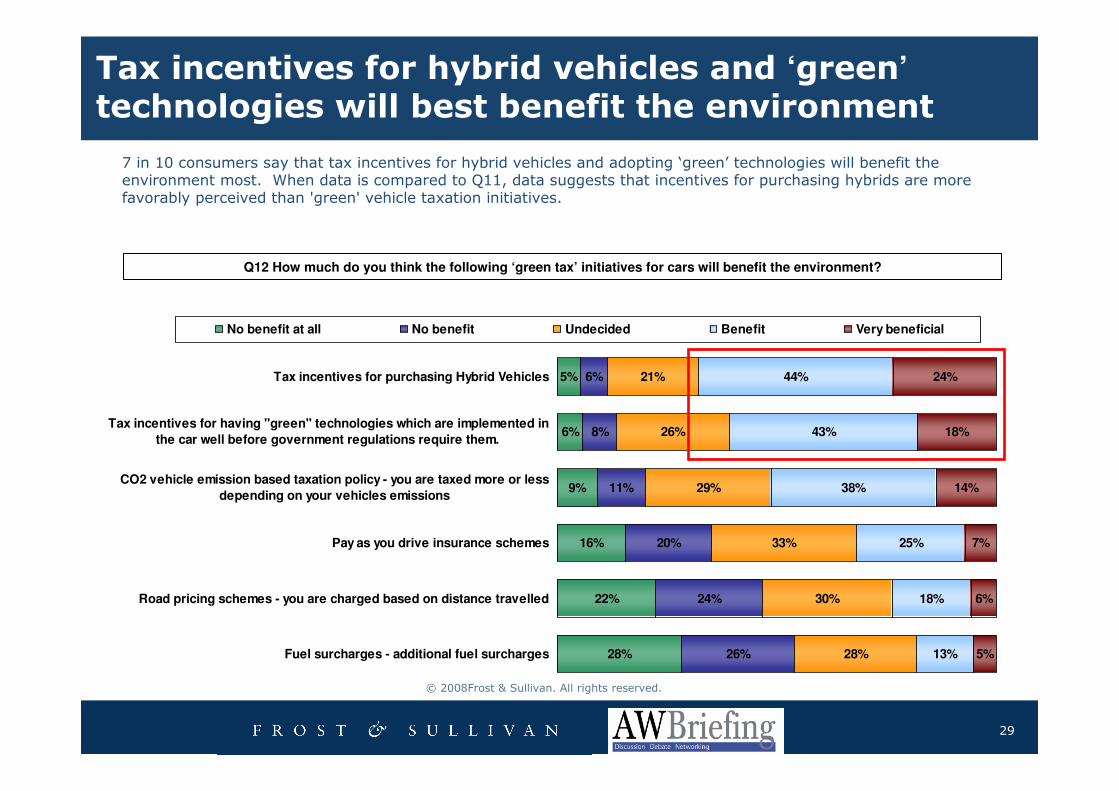
Tax incentives for hybrid vehicles and ‘green’technologies will best benefit the environment
7 in 10 consumers say that tax incentives for hybrid vehicles and adopting ‘green’ technologies will benefit the environment most. When data is compared to Q11, data suggests that incentives for purchasing hybrids are more favorably perceived than 'green' vehicle taxation initiatives.
Q12 How much do you think the following ‘green tax’ initiatives for cars will benefit the environment?
5%
6%
9%
6%
29%
33%
30%
28%
44%
43%
38%
25%
18%
13%
18%
14%
7%
6%
5%
16%
22%
28%
8%
11%
20%
24%
26%
26%
21% 24%Tax incentives for purchasing Hybrid Vehicles
Tax incentives for having "green" technologies which are implemented in
the car well before government regulations require them.
CO2 vehicle emission based taxation policy - you are taxed more or less
depending on your vehicles emissions
Pay as you drive insurance schemes
Road pricing schemes - you are charged based on distance travelled
Fuel surcharges - additional fuel surcharges
No benefit at all No benefit Undecided Benefit Very beneficial
30
© 2008Frost & Sullivan. All rights reserved.
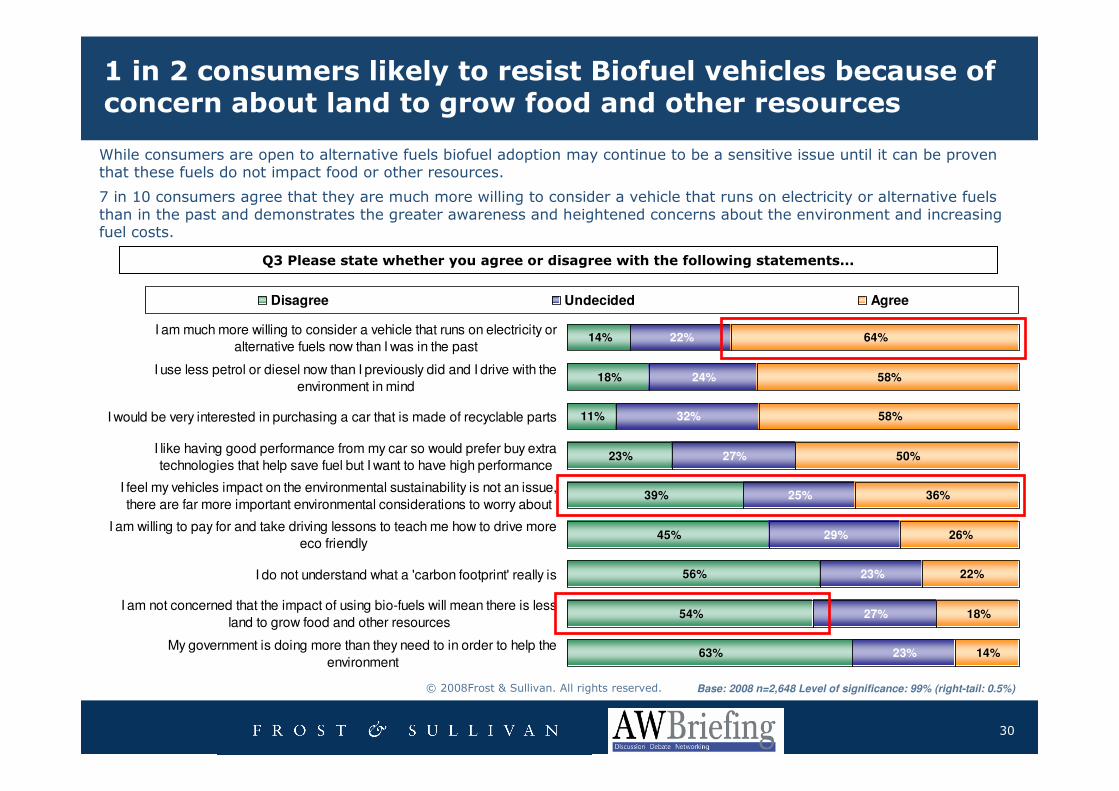
1 in 2 consumers likely to resist Biofuel vehicles because of concern about land to grow food and other resources
Q3 Please state whether you agree or disagree with the following statements...
14%
18%
11%
23%
39%
45%
56%
54%
63%
22%
24%
32%
27%
25%
29%
23%
27%
23%
58%
50%
36%
26%
22%
18%
14%
58%
64%I am much more willing to consider a vehicle that runs on electricity or
alternative fuels now than I was in the past
I use less petrol or diesel now than I previously did and I drive with the
environment in mind
I would be very interested in purchasing a car that is made of recyclable parts
I like having good performance from my car so would prefer buy extra
technologies that help save fuel but I want to have high performance
I feel my vehicles impact on the environmental sustainability is not an issue,
there are far more important environmental considerations to worry about
I am willing to pay for and take driving lessons to teach me how to drive more
eco friendly
I do not understand what a 'carbon footprint' really is
I am not concerned that the impact of using bio-fuels will mean there is less
land to grow food and other resources
My government is doing more than they need to in order to help the
environment
Disagree Undecided Agree
Base: 2008 n=2,648 Level of significance: 99% (right-tail: 0.5%)
While consumers are open to alternative fuels biofuel adoption may continue to be a sensitive issue until it can be proven that these fuels do not impact food or other resources.
7 in 10 consumers agree that they are much more willing to consider a vehicle that runs on electricity or alternative fuels than in the past and demonstrates the greater awareness and heightened concerns about the environment and increasing fuel costs.
31
© 2008Frost & Sullivan. All rights reserved.
Agenda for today’s presentation
Global
Alternative
Powertrain –
How is the
market shaping
up?
European Consumers’ Attitudes & Perceptions Towards Sustainability, Environment and Alternate Powertrains
Strategic Conclusions & Recommendations and Discussions
Global Alternative Powertrain Technologies – Overview
of LPG / CNG, Hybrids, Fuel Cells, Electric Vehicles, Electric Corner Modules
Global Powertrain Mix – Breakdown of Propulsion technologies towards 2015
The Oil Scenario Outline
Global Biofuels – Potential of 2nd Generation Biofuels and
strategic analysis
OEM Preferences on ‘Green Technologies’ – Overview of
selected OEMs

32
© 2008Frost & Sullivan. All rights reserved.
Strategic Outlook towards 2020 and Beyond –To be prepared for the ‘unknown’
�Demand from countries like China and India likely to play a critical
part in the price and output of crude oil – Oil exploration rate, cost of
processing and quality of oil to be deciding factors
�Local governments providing strategic support to Biofuels need to ensure
that short term detrimental effects are minimised while providing subsidies
and benefits to Biofuels
�Oil companies forecasting price for crude oil to be about $55 - $60
by 2030; huge potential for Biofuels to contribute considering
agricultural growth
�2nd Generation Biofuels to be commercially successful only if price of
extracting Biofuels is lesser than or equal to price of producing fossil fuels
Non-OPEC
Supply
56%
Biofuels
Volume
44%
Non-OPEC
Supply
70% Biofuels
Volume
30%
2030 Scenario 1 – considering historical agricultural supply growth
2030 Scenario 2 –considering half of historical agricultural supply growth
Source : Booz & Company
Total supply of 110 MBPD Total supply of 85 MBPD
33
© 2008Frost & Sullivan. All rights reserved.
Increased oil prices to bring a paradigm shift in consumer acceptance of small cars
Current & past oil price trend
High Oil Price Scenario
Reference Oil Price Scenario
Low Oil Price Scenario
Years
Oil
Pri
ce
($
/Ba
rre
l)
Gasoline
17-19%
LPG / CNG
23-25%
EV / Fuel
Cells
11-13%
Hybrids
18-20%Diesel
25-28%
/ / / /
Gasoline
40-42%LPG / CNG
16-18%
EV / Fuel
Cells
5-8%
Hybrids
7-9%
Diesel
25-28%
Gasoline
16-18%
LPG / CNG
25-27%EV / Fuel
Cells
12-14%
Full
Hybrids
19-20%
Diesel
24-26%
High Oil Price Scenario Powertrain Mix 2020
Reference Oil Price Scenario Powertrain Mix 2020
Low Oil Price Scenario Powertrain Mix 2020
0
20
40
60
80
100
120
140
160
180
1995 2000 2005 2006 2007 2008 2010 2015 2020
34
© 2008Frost & Sullivan. All rights reserved.
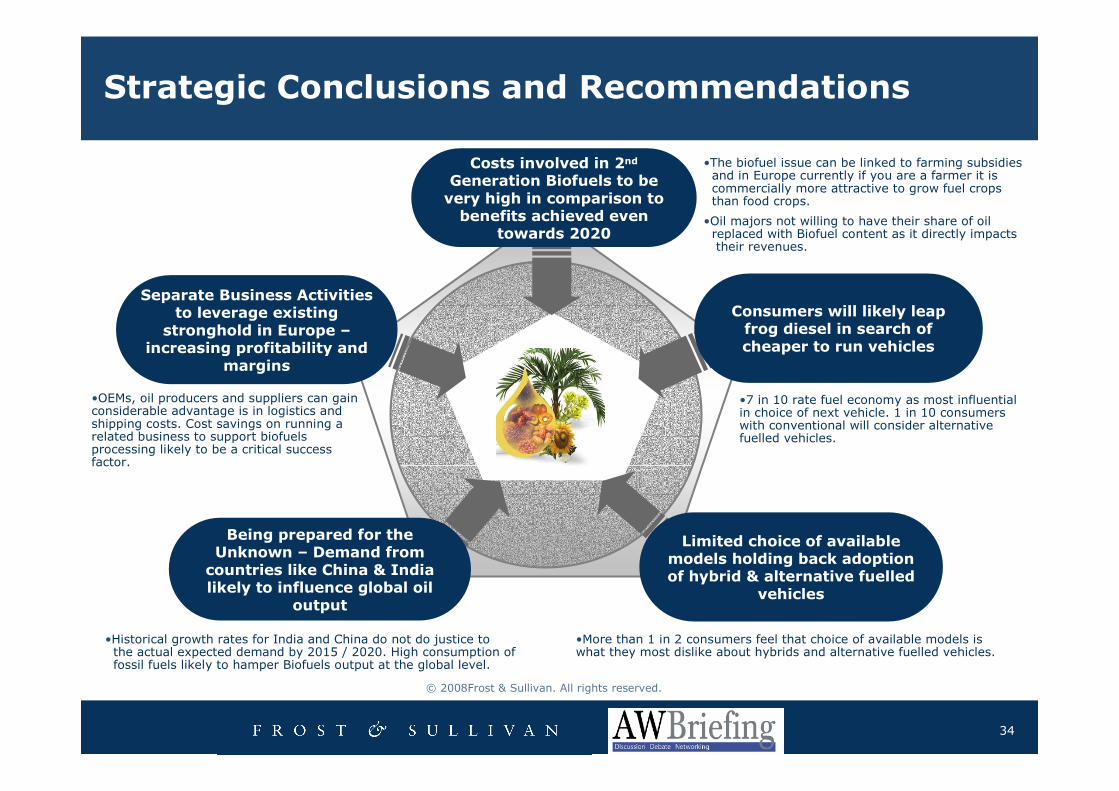
Strategic Conclusions and Recommendations
•OEMs, oil producers and suppliers can gain considerable advantage is in logistics and shipping costs. Cost savings on running a related business to support biofuels processing likely to be a critical success factor.
•More than 1 in 2 consumers feel that choice of available models is what they most dislike about hybrids and alternative fuelled vehicles.
•The biofuel issue can be linked to farming subsidies and in Europe currently if you are a farmer it is commercially more attractive to grow fuel crops than food crops.
•Oil majors not willing to have their share of oil replaced with Biofuel content as it directly impacts their revenues.
•7 in 10 rate fuel economy as most influential in choice of next vehicle. 1 in 10 consumers with conventional will consider alternative fuelled vehicles.
Consumers will likely leap frog diesel in search of cheaper to run vehicles
Limited choice of available models holding back adoption of hybrid & alternative fuelled
vehicles
Being prepared for the Unknown – Demand from
countries like China & India likely to influence global oil
output
Separate Business Activities to leverage existing
stronghold in Europe –increasing profitability and
margins
Costs involved in 2nd
Generation Biofuels to be very high in comparison to benefits achieved even
towards 2020
•Historical growth rates for India and China do not do justice tothe actual expected demand by 2015 / 2020. High consumption offossil fuels likely to hamper Biofuels output at the global level.