Embed Size (px)
Citation preview
The impact of agricultural soil usage on activity and abundance of ammonifying bacteria in selected soils from PolandAgnieszka Wolińska1*, Anna Szafranek‑Nakonieczna1, Artur Banach1, Mieczysław Błaszczyk2 and Zofia Stępniewska1
BackgroundNitrogen transformation in agro-ecosystems is indispensable to sustain the future crop production (Bhuyan et al. 2014). N-mineralization, a microbial process supplying min-eral N to plants in terrestrial ecosystems (Doran 1987; Bach et al. 2012; Wang et al. 2013), is influenced by biomass inputs, microbial activities, and different abiotic factors such as microclimatic variations and land use patterns (Bhuyan et al. 2014). Land use change plays a very important role in regulating soil N mineralization and availability by altering soil biological, physical, and chemical properties (Marquard et al. 2009; Cam-pos 2010). Thus, it is assumed that intensification of agricultural practices modifies the
Abstract
The aim of the study was to demonstrate the impact of soil agricultural usage on the abundance of ammonifying bacteria (AB) and their activity, expressed as arginine ammonification (AA). Five agriculturally exploited types of soils (FAO): Haplic Luvisol, Brunic Arenosol, Mollic Gleysol, Eutric Fluvisol, and Rendzina Leptosol were studied. The controls were non‑agricultural soils of the same type located in close proximity to agricultural sites. The tested soils varied in terms of pH (4.18–7.08), total carbon (8.39–34.90 g kg−1), easily degradable carbon content (0.46–1.11 g kg−1), moisture (5.20–13.50 %), and nitrogen forms (mg kg−1): 1.68–27.17, 0.036–0.862, 0.012–3.389 for nitrate nitrogen, nitrite nitrogen, and ammonia nitrogen, respectively. The AB abundance in agricultural soils ranged from 1.1 to 6.4 × 10⁴ cfu g−1, while in the controls it was significantly higher—from 2.0 to 110 × 104 cfu g−1 of soil. Also, AA in the controls was three‑times higher than in the agricultural soils. Strong associations between AA and the abundance of AB in the control (r = 0.954***) and agricultural soils (r = 0.833***) were proved. In the agricultural soils, the AB abundance and AA were influenced by pH (r = 0.746*** and r = 0.520***) and carbon content (r = 0.488*** and r = 0.391***). The AB abundance was also affected by easily degradable carbon (r = 0.517**) and nitrite nitrogen (r = 0.376*), whilst ammonium nitrogen influenced AA (r = 0.451*). Our results indicate that the abundance of AB and AA may be good indicators of soil biological conditions.
Keywords: Arginine ammonification, Ammonifying bacteria, Agricultural soil usage, Nitrogen forms, pH
Open Access
© 2016 The Author(s). This article is distributed under the terms of the Creative Commons Attribution 4.0 International License (http://creativecommons.org/licenses/by/4.0/), which permits unrestricted use, distribution, and reproduction in any medium, provided you give appropriate credit to the original author(s) and the source, provide a link to the Creative Commons license, and indicate if changes were made.
RESEARCH
Wolińska et al. SpringerPlus (2016) 5:565 DOI 10.1186/s40064-016-2264-8
*Correspondence: [email protected] 1 Department of Biochemistry and Environmental Chemistry, Institute of Biotechnology, The John Paul II Catholic University of Lublin, Konstantynów 1 I Str., 20‑708 Lublin, PolandFull list of author information is available at the end of the article
Page 2 of 13Wolińska et al. SpringerPlus (2016) 5:565
plant composition and soil characteristics that regulate the water content, nutrient avail-ability (Rhoades and Coleman 1999), pH (Campos 2010), and carbon content (Wolińska et al. 2014). The study performed by Mäder et al. (2002) and Nourbakhsh and Aline-jadian (2009) clearly indicated that intensive agriculture has increased crop yields but also posed severe environmental problems. A majority of them are associated with the high input of N fertilizers in intensive crop production (Deng and Tabatabai 2000; Mar-quard et al. 2009). As described by Nourbakhsh and Alinejadian (2009), N mineraliza-tion is a process of conversion of organic forms of N to ammonium (NH4
+), which can be easily taken up by plants and thus play a vital role in plant growth (Doran 1987; Wang et al. 2013).
Our paper considers arginine ammonification activity as a biological function partici-pating in the mineralization of organic N. Earlier reports also suggested that soil micro-organisms catabolize arginine via different pathways, and NH4
+ is a predominant end product (Nourbakhsh and Alinejadian 2009). Additionally, AA can be considered as an estimation of soil microbial-population size and their general activity (Alef and Kleiner 1987; Bonde et al. 2001; Nourbakhsh and Alinejadian 2009), and thus it is a convenient, inexpensive, sensitive, and relatively fast method recommended for estimation of micro-bial potential activity (Alef and Kleiner 1987; Kresović and Liĉina 2002).
It is known that each soil type has its own microflora that is affected positively or neg-atively by the pattern of soil usage, which is directly reflected in soil fertility (Tintor et al. 2009; Marinkovic et al. 2012; Kheyrodin et al. 2012). Among the huge diversity of micro-organisms in the soil environment, chemolitho-autotrophic AB from the β subclass of Proteobacteria (Kowalchuk and Stephen 2001; Qiu et al. 2010) are ubiquitous and found in nearly all soil, freshwater, and marine environments (Horz et al. 2004; Qiu et al. 2010). Moreover, they are of great environmental importance, as NH4
+ oxidation is the rate-limiting step of nitrification and is thus central to the global nitrogen cycle (Kowalchuk and Stephen 2001; Wielgosz et al. 2010). For these reasons, we suggest that AB might be an adequate indicator of soil biodegradation processes occurring in agricultural soils.
The fact that soil management strongly influences soil biodiversity, for example in agricultural ecosystems, was described by Valpassos et al. (2001) and Imaz et al. (2010). Moreover, Tscharntke et al. (2012) indicated that agricultural types of soil contain con-siderably smaller numbers of microorganisms (about 140–150 species per g of soil), in comparison with natural soils (1000s of species per g of soil). Also, the reduction in the number of bacterial phylogenetic groups affected by human agricultural activities is a cause of the small taxonomic group content in arable soils (Tscharntke et al. 2012). Finally, the lack of biodiversity is another consequence for agricultural soils not being able to become naturally regenerated, which may lead to their inability of regaining a satisfactory level of fertility (Wolińska et al. 2014). Additionally, the management prac-tices used in many agro-ecosystems (e.g. monocultures, extensive use of tillage, chemi-cal inputs) degrade the fragile web of community interactions between pests and their natural enemies and lead to increased pest and disease problems (Valpassos et al. 2001; Marquard et al. 2009; Kheyrodin et al. 2012). A question arises about what management practices adversely affect the functioning of soil ecosystems.
Consequently, we hypothesised that both AA and abundance of AB are strongly affected by land use and might be an adequate and easily measurable indicator of
Page 3 of 13Wolińska et al. SpringerPlus (2016) 5:565
biological degradation processes. The particular objectives of the study were as follows: (1) quantification of soil N forms and AB abundance in five different arable and non-cultivated soil types, and (2) determination of correlations between soil environmental factors influencing AB abundance and AA in agricultural and control soils. Our aim is strictly consistent with the recommendations of the European Environmental Agency (EEA) and the Commission of the European Communities (EC), European Union (EU), biodiversity strategy to 2020 and European project ENVASSO, strongly promoting the description of soil microbiological degradation state.
MethodsStudy site
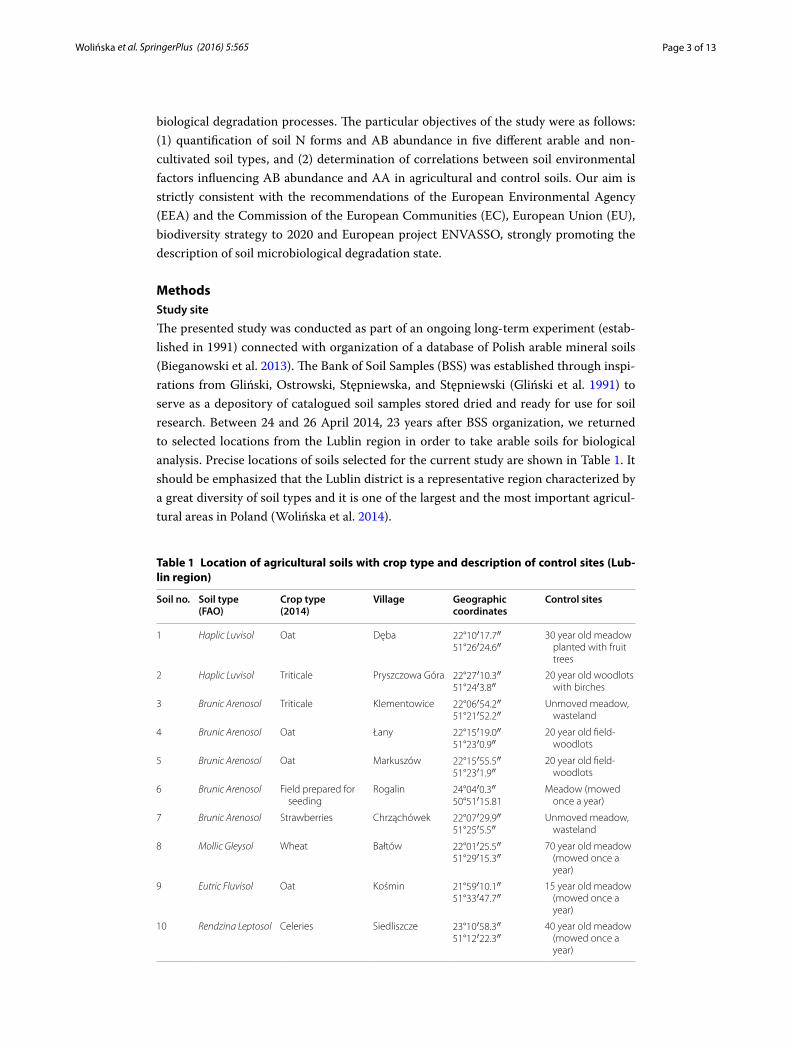
The presented study was conducted as part of an ongoing long-term experiment (estab-lished in 1991) connected with organization of a database of Polish arable mineral soils (Bieganowski et al. 2013). The Bank of Soil Samples (BSS) was established through inspi-rations from Gliński, Ostrowski, Stępniewska, and Stępniewski (Gliński et al. 1991) to serve as a depository of catalogued soil samples stored dried and ready for use for soil research. Between 24 and 26 April 2014, 23 years after BSS organization, we returned to selected locations from the Lublin region in order to take arable soils for biological analysis. Precise locations of soils selected for the current study are shown in Table 1. It should be emphasized that the Lublin district is a representative region characterized by a great diversity of soil types and it is one of the largest and the most important agricul-tural areas in Poland (Wolińska et al. 2014).
Table 1 Location of agricultural soils with crop type and description of control sites (Lub-lin region)
Soil no. Soil type (FAO)
Crop type (2014)
Village Geographic coordinates
Control sites
1 Haplic Luvisol Oat Dęba 22°10′17.7″51°26′24.6″
30 year old meadow planted with fruit trees
2 Haplic Luvisol Triticale Pryszczowa Góra 22°27′10.3″51°24′3.8″
20 year old woodlots with birches
3 Brunic Arenosol Triticale Klementowice 22°06′54.2″51°21′52.2″
Unmoved meadow, wasteland
4 Brunic Arenosol Oat Łany 22°15′19.0″51°23′0.9″
20 year old field‑woodlots
5 Brunic Arenosol Oat Markuszów 22°15′55.5″51°23′1.9″
20 year old field‑woodlots
6 Brunic Arenosol Field prepared for seeding
Rogalin 24°04′0.3″50°51′15.81
Meadow (mowed once a year)
7 Brunic Arenosol Strawberries Chrząchówek 22°07′29.9″51°25′5.5″
Unmoved meadow, wasteland
8 Mollic Gleysol Wheat Bałtów 22°01′25.5″51°29′15.3″
70 year old meadow (mowed once a year)
9 Eutric Fluvisol Oat Kośmin 21°59′10.1″51°33′47.7″
15 year old meadow (mowed once a year)
10 Rendzina Leptosol Celeries Siedliszcze 23°10′58.3″51°12′22.3″
40 year old meadow (mowed once a year)
Page 4 of 13Wolińska et al. SpringerPlus (2016) 5:565
Soil characteristics
Soil samples were taken using Egner’s bow from the topsoil layer (0–20 cm) of agri-culturally exploited sites (three replicates of 2 kg, consisting of about 50 samples taken from a 100 m2 area). Arable soils were collected from non-ploughed sites in order to avoid artifacts from ploughing perturbations (Wolińska et al. 2014). Consistently, con-trol samples were taken from non-agriculturally cultivated and non-forested sites (at least 1-ha area) located in close vicinity to the basic soils and belonging to the same soil type (Table 1). As a control, old meadows or field-woodlots were selected. For the study, five types of soils were chosen: Haplic Luvisol, Brunic Arenosol, Mollic Gleysol, Eutric Fluvisol, and Rendzina Leptosol. Under laboratory conditions, each sample was passed through a 2.0-mm sieve to remove large pieces of rocks and plant material and stored at 4 °C prior analysis.
The moisture content was determined according to the ASTM D2216-10 norm (1999) by the gravimetric method (24 h, 105 °C).
The pH values were determined from a 2:1 soil suspension in distilled water using a multifunctional potential meter (Hach Lange) equipped with a glass electrode (pH E16M340). The measurements were taken in triplicate after stabilisation of the readings.
Total carbon (TC) was determined using an automatic carbon analyser TOC-VCSH SSM 5000A (Shimadzu, Japan). Soil samples (150 mg) were pulverized, dried prior to analysis, and then combusted at 900 °C in a column containing a platinum and cobalt oxide catalyst (Wolińska et al. 2014). Under these conditions, all carbon compounds were converted into carbon dioxide and detected by an infrared detector (NDIR). Each TC recording was realized in triplicate.
Permanganate oxidizable carbon (POXC), i.e. an equivalent of carbon easily available to microorganisms, was determined according to the Weil et al. (2003) method based on the carbon oxidation by permanganate resulting in bleaching of a purple solution. Prior to the analysis, a standard curve was prepared using 0.2 KMnO4 in a 1-M CaCl2 (pH 7.2) stock solution. Absorbance was measured at 550 nm using distilled water as a background (UV-1800 Shimadzu). For the calculation of the POXC content in the soil sample, the following formula was used (Weil et al. 2003):
where 0.02 mol/l is the initial solution concentration, a and b are the intercept and the slope of the standard curve, respectively, 9000 is the amount of C in mg oxidized by 1 mol of MnO4, 0.02 l is the volume of the KMnO4 solution that has reacted, and 0.0025 is the amount of the soil sample in kg.
The concentrations of NH4-N, NO3-N, and NO2-N were determined colorimetri-cally using an Auto Analyser 3 System (Bran+Luebbe, Germany). Prior to analysis, the examined nutrients were extracted using deionised water (35 g fresh soil and 100 ml water). NH4-N and NO3-N were measured using, respectively, hydrazine sulphate (Kam-phake et al. 1967) and salicylate (Grasshoff and Johannsen 1972) as a colour marker. The NO2-N analysis was based on the latter method excluding hydrazine sulphate. The
ActiveC(
mgkg−1)
= [0.02mol/l−(a+ b× absorbance)] × (9000 mgC/mol)
× (0.02 l solution/0.0025 kg soil)
Page 5 of 13Wolińska et al. SpringerPlus (2016) 5:565
results obtained were corrected for the amount of the soil sample and expressed as mg per kg of fresh soil.
Arginine ammonification
Potential AA was quantified using the method proposed by Alef and Kleiner (1987) with modification by Wyczółkowski and Dąbek-Szreniawska (2005). Two portions equivalent to 5 g oven dry soil were taken. One portion was incubated for 4 h at 30 °C in an incuba-tor after addition of 2 ml of 11.5 M arginine solution, whereas the other was used as a control where distilled water instead of the arginine solution was applied. Then, the soils were extracted with 18 ml 2 M KCl by 30 min shaking and filtered through Whatman 42 filter paper. Five millilitres of 2-M KCl, 2 ml of 0.12-M sodium phenolate, 1 ml of 0.17-mM nitroprusside sodium dehydrate, and 1 ml of sodium hypochlorite were added sub-sequently to 1 ml of the supernatants and incubated for 30 min in darkness. After that, absorbance was determined at 630 nm (UV-1800 Shimadzu). The AA rate was given in micrograms of NH4-N liberated per gram dry weight per hour.
Abundance of ammonifiers
The soil samples (5 g each) were suspended separately in 50 ml 0.85 % NaCl. Then, each sample was prepared in tenfold dilution series and each dilution (1 ml) was inoculated into triplicate broth culture tubes for incubation (7 days, 26 °C), as described by Sut-ton (2010). For AB growth, 1 % water-peptone medium (g l−1: casein 10.0; NaCl 5.0; Na2HPO4 1.5; KH2PO4 9.0) was applied (Wolińska et al. 2013). Following 1-week incu-bation, Nessler reagent (0.5 ml) was added into each tube in order to detect ammonia presence/absence based on the colour reaction. All tubes in the three series were exam-ined for colour reaction, and the specific patterns of growth in the tubes were scored against a most probable number (MPN) table for a three-replicate design from the US Food and Drugs Administration’s Bacterial Analytical Manual (Sutton 2010). The pat-terns of growth were read from the aforementioned table to provide MPN and a 95 % confidence interval (Sutton 2010). The populations of microbes were expressed as an MPN per g dry soil.
Statistical analysis
Data were analysed using analysis of variance (ANOVA) for the randomized complete block. Mean separations were made for significant effects at p < 0.05 using the LSD post hoc test (Wolińska et al. 2014). Spearman’s rho correlation coefficient between chemical and biological soils properties was also determined. All statistical analyses were carried out using Statistica 9.0 (Statsoft Ltd., UK) software.
Results and discussionChemical soil characteristics
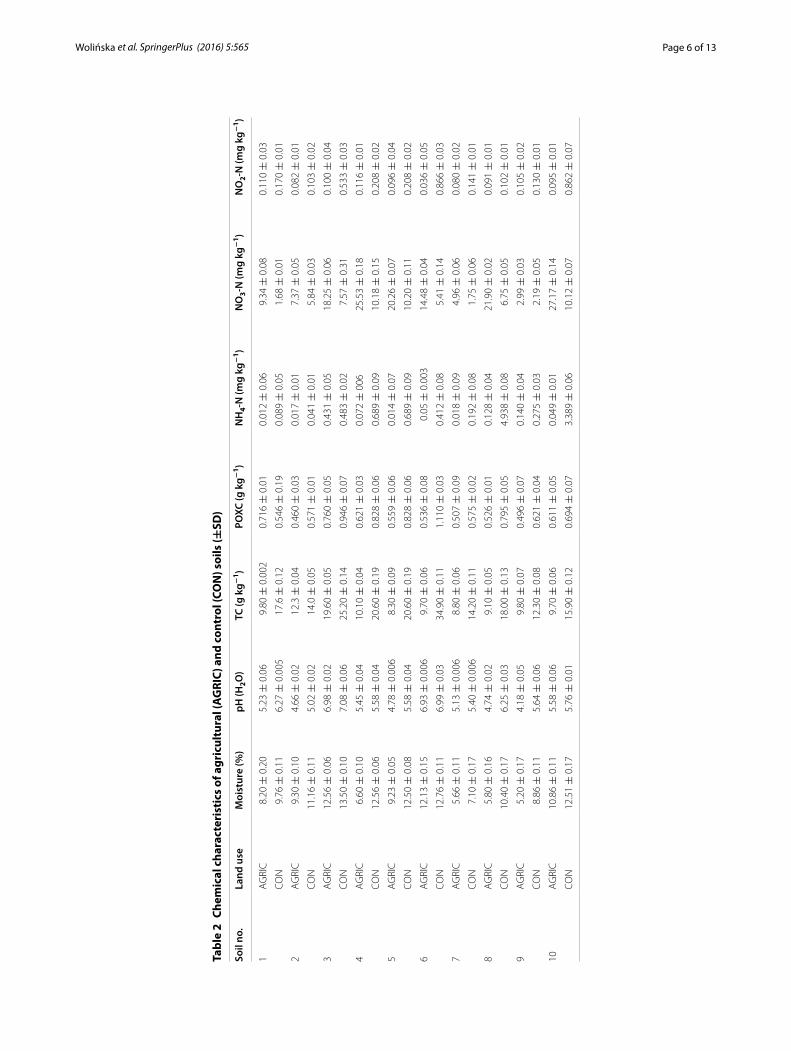
The major chemical characteristics of the studied soils are shown in Table 2. It was observed that the agricultural and control soils strongly differed in terms of moisture, pH, TC, POXC, and N forms. This differentiation confirms the fact that soil management is a crucial factor influencing not only soil biology but also soil chemical features. The agri-cultural soils were characterized by substantially lower pH values than the non-cultivated
Page 6 of 13Wolińska et al. SpringerPlus (2016) 5:565
Tabl
e 2
Chem
ical
cha
ract
eris
tics
of a
gric
ultu
ral (
AG
RIC)
and
con
trol
(CO
N) s
oils
(±SD
)
Soil
no.
Land
use
Moi
stur
e (%
)pH
(H2O
)TC
(g k
g−1 )
POXC
(g k
g−1 )
NH
4-N
(mg
kg−
1 )N
O3-
N (m
g kg
−1 )
NO
2-N
(mg
kg−
1 )
1A
GRI
C8.
20 ±
0.2
05.
23 ±
0.0
69.
80 ±
0.0
020.
716 ±
0.0
10.
012 ±
0.0
69.
34 ±
0.0
80.
110 ±
0.0
3
CON
9.76
± 0
.11
6.27
± 0
.005
17.6
± 0
.12
0.54
6 ±
0.1
90.
089 ±
0.0
51.
68 ±
0.0
10.
170 ±
0.0
1
2A
GRI
C9.
30 ±
0.1
04.
66 ±
0.0
212
.3 ±
0.0
40.
460 ±
0.0
30.
017 ±
0.0
17.
37 ±
0.0
50.
082 ±
0.0
1
CON
11.1
6 ±
0.1
15.
02 ±
0.0
214
.0 ±
0.0
50.
571 ±
0.0
10.
041 ±
0.0
15.
84 ±
0.0
30.
103 ±
0.0
2
3A
GRI
C12
.56 ±
0.0
66.
98 ±
0.0
219
.60 ±
0.0
50.
760 ±
0.0
50.
431 ±
0.0
518
.25 ±
0.0
60.
100 ±
0.0
4
CON
13.5
0 ±
0.1
07.
08 ±
0.0
625
.20 ±
0.1
40.
946 ±
0.0
70.
483 ±
0.0
27.
57 ±
0.3
10.
533 ±
0.0
3
4A
GRI
C6.
60 ±
0.1
05.
45 ±
0.0
410
.10 ±
0.0
40.
621 ±
0.0
30.
072 ±
006
25.5
3 ±
0.1
80.
116 ±
0.0
1
CON
12.5
6 ±
0.0
65.
58 ±
0.0
420
.60 ±
0.1
90.
828 ±
0.0
60.
689 ±
0.0
910
.18 ±
0.1
50.
208 ±
0.0
2
5A
GRI
C9.
23 ±
0.0
54.
78 ±
0.0
068.
30 ±
0.0
90.
559 ±
0.0
60.
014 ±
0.0
720
.26 ±
0.0
70.
096 ±
0.0
4
CON
12.5
0 ±
0.0
85.
58 ±
0.0
420
.60 ±
0.1
90.
828 ±
0.0
60.
689 ±
0.0
910
.20 ±
0.1
10.
208 ±
0.0
2
6A
GRI
C12
.13 ±
0.1
56.
93 ±
0.0
069.
70 ±
0.0
60.
536 ±
0.0
80.
05 ±
0.0
0314
.48 ±
0.0
40.
036 ±
0.0
5
CON
12.7
6 ±
0.1
16.
99 ±
0.0
334
.90 ±
0.1
11.
110 ±
0.0
30.
412 ±
0.0
85.
41 ±
0.1
40.
866 ±
0.0
3
7A
GRI
C5.
66 ±
0.1
15.
13 ±
0.0
068.
80 ±
0.0
60.
507 ±
0.0
90.
018 ±
0.0
94.
96 ±
0.0
60.
080 ±
0.0
2
CON
7.10
± 0
.17
5.40
± 0
.006
14.2
0 ±
0.1
10.
575 ±
0.0
20.
192 ±
0.0
81.
75 ±
0.0
60.
141 ±
0.0
1
8A
GRI
C5.
80 ±
0.1
64.
74 ±
0.0
29.
10 ±
0.0
50.
526 ±
0.0
10.
128 ±
0.0
421
.90 ±
0.0
20.
091 ±
0.0
1
CON
10.4
0 ±
0.1
76.
25 ±
0.0
318
.00 ±
0.1
30.
795 ±
0.0
54.
938 ±
0.0
86.
75 ±
0.0
50.
102 ±
0.0
1
9A
GRI
C5.
20 ±
0.1
74.
18 ±
0.0
59.
80 ±
0.0
70.
496 ±
0.0
70.
140 ±
0.0
42.
99 ±
0.0
30.
105 ±
0.0
2
CON
8.86
± 0
.11
5.64
± 0
.06
12.3
0 ±
0.0
80.
621 ±
0.0
40.
275 ±
0.0
32.
19 ±
0.0
50.
130 ±
0.0
1
10A
GRI
C10
.86 ±
0.1
15.
58 ±
0.0
69.
70 ±
0.0
60.
611 ±
0.0
50.
049 ±
0.0
127
.17 ±
0.1
40.
095 ±
0.0
1
CON
12.5
1 ±
0.1
75.
76 ±
0.0
115
.90 ±
0.1
20.
694 ±
0.0
73.
389 ±
0.0
610
.12 ±
0.0
70.
862 ±
0.0
7
Page 7 of 13Wolińska et al. SpringerPlus (2016) 5:565
soils. pH in the arable soils ranged from 4.18 to 6.98; however, values similar to neutral pH were noted only in two cases (soil Nos. 3 and 6). In a majority of the investigated agri-cultural soils, pH oscillated in the range of acidic conditions (4.18 ± 0.05–5.58 ± 0.06). Similarly to pH, a decrease in the TC content in arable soils was observed and it oscil-lated between 8.30 ± 0.09 and 19.60 ± 0.05 g kg−1, whilst in the control soils the TC values were significantly higher and varied between 14.00 ± 0.05 and 34.90 ± 0.11 g kg−1 (p < 0.01). Nevertheless, the amount of carbon easily available to microorganisms, expressed as POXC, was even lower and ranged from 0.496 ± 0.07 to 0.760 ± 0.05 g kg−1 and from 0.546 ± 0.19 to 1.110 ± 0.03 g kg−1 for the agricultural and control soils, respec-tively. Generally, the pool of POXC accounted for only 4.0–6.0 % of TC. Guo et al. (2010), Swędrzyńska et al. (2013), and Wolińska et al. (2014) proved that systematic agricultural practices contribute to a significant decrease in pH values towards acidification, which is one of the causes of soil degradation. Also Dec (2014) reported that agricultural soils are characterized by a slightly acidic reaction (pH 6.3–6.5). Additionally, our observa-tions might be supported by the findings of Valpassos et al. (2001), who reported that a no-tillage (controls) system showed the highest carbon content. Also Chan et al. (1992) and Gajic et al. (2006) assumed that continuous cropping and cultivation of many of the world’s soils has resulted in a substantial decline in the TC content.
The dominant form of N was the nitrate nitrogen (NO3-N); however, its level in the cultivated soils was substantially higher than in the controls and ranged between 2.99 ± 0.03 and 27.17 ± 0.14 mg kg−1; in turn, in the controls it was lower by 44–62.5 % and remained in the range of 1.68 ± 0.01–10.20 ± 0.11 mg kg−1. The dominance of nitrate nitrogen in the agricultural soils, especially during the spring season (soils were extracted in April 2014), can be explained by the fact that agricultural practices such as fertilization, particularly those performed after winter time (early spring), stimulate aero-bic N transformation, resulting in nitrification of NH4-N (Campos 2010), and indirectly influence microbial activity. Booth et al. (2006) mentioned that NO3-N production and consumption in tilled soils are mediated more by TC and less than by the direct effects of disturbance; this is because as labile carbon is respired away, heterotrophs become less competitive and nitrifiers more competitive for NH4-N, resulting in increases in the size of the NO3-N pool. Two other forms of nitrogen (NH4-N and NO2-N) achieved the following values in the agricultural managed soils: 0.012 ± 0.06–0.431 ± 0.05 and 0.036 ± 0.05–0.116 ± 0.01 mg kg−1 for NH4-N and NO2-N, respectively. In contrast, the amounts of ammonium and nitrite nitrogen in the non-cultivated soils were even three-fold–tenfold higher than those noted in the agricultural soils, and oscillated between 0.041 ± 0.01 and 4.938 ± 0.08 mg kg−1 in the case of NH4-N and from 0.102 ± 0.01 to 0.866 ± 0.03 mg kg−1 for NO2-N. Our results are in agreement with other studies show-ing variations in inorganic nitrogen, depending on land use (Banach et al. 2009; Campos 2010). However, the investigations by Campos (2010) were not strictly connected with arable soils, which were the subject in the current study, but related to tropical cloud for-est, grassland, and coffee crop. Undoubtedly, the higher N richness noted in the cultivated soils is associated with continuous nitrogen fertilization thereof. This is consistent with the results of Li and Lang (2014) indicating a similar trend noted in uncultivated and cul-tivated black soil. Comparable findings were presented by Zhang et al. (2013) for wood-land and agricultural soils. It should also be pointed that a high level of N fertilization
Page 8 of 13Wolińska et al. SpringerPlus (2016) 5:565
can drive soil acidification (Guo et al. 2010) and modify the population numbers of soil microorganisms and availability of nutrients (Wolińska et al. 2014), which is the cause of differentiation of biological activity as an effect of agricultural management. Bach et al. (2012) indicated that grassland restoration on clay loam soils increases microbial biomass C and N, improves soil structure, and promotes soil C accrual.
Arginine ammonification level
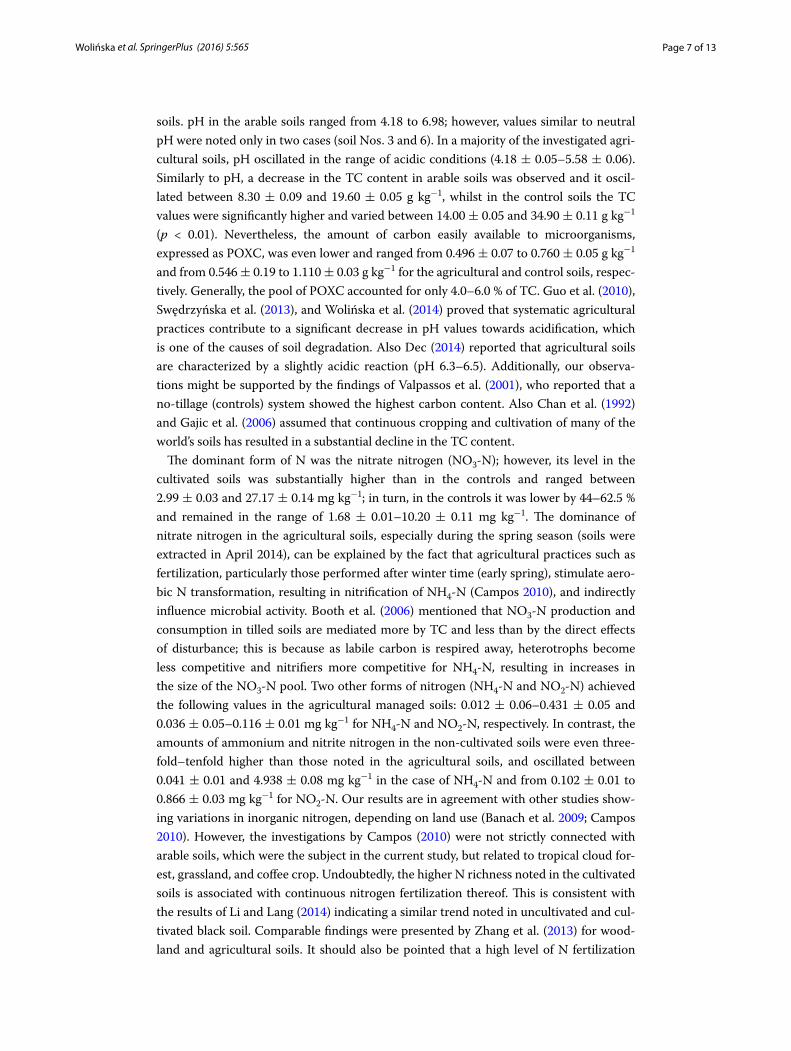
The responses of AA to different soil management are presented in Fig. 1. Consist-ent with our hypothesis, there was a strong decline in AA as an effect of human agricultural practices, which confirms the fact that AA is a sensitive factor of bio-degradation processes in cultivated soils. AA in the arable soils ranged from 1.86 to 17.98 µg N g−1 d.m. h−1, whereas in the control soils they were ca. twofold–fourfold higher and amounted to 6.89–47.02 µg N g−1 d.m. h−1. The maximum level of ammo-nium-N mineralised from arginine (17.98 and 47.02 µg N g−1 d.m. h−1 for the arable and control soils, respectively) was observed in Brunic Arenosol (No. 3). This confirms the results of Lin and Brookes (1999) and Kresović and Liĉina (2002), who determined AA at a level of 0.1–17.1 µg N g−1 d.m. h−1 and 4.5–17.8 µg N g−1 d.m. h−1 in arable soils, respectively. In their analysis of 34 soils, Alef and Kleiner (1987) reported that the AA rate usually ranged from 0.51 to 13 µg N g−1 d.m. h−1, whereas Kaiser et al. (1992) sug-gested much lower rates. In their 27 soils, AA ranged from 0.03 to 2.71 µg N g−1 d.m. h−1. Since most heterotrophic bacteria are able to ammonify arginine, AA is proportional to the soil microbial biomass and may be used as an indicator of microbial activity (Alef and Kleiner 1987; Lin and Brookes 1999; Kresović and Liĉina 2002). The greater rate of N mineralization in non-cultivated soils has been attributed to higher availability of organic N as well as to higher microbial activity, as indicated by Zaman et al. (2004). The recorded values of the AA rate confirm a tendency towards mineral N immobilisation in the soil, which is usually unfavourable for crop plants, although—on the other hand—it reduces oxidation of NH4-N–NO3-N in the process of nitrification, thus limiting poten-tial losses of nitrogen (Frąc and Jezierska-Tys 2009).
Abundance of ammonifying bacteria
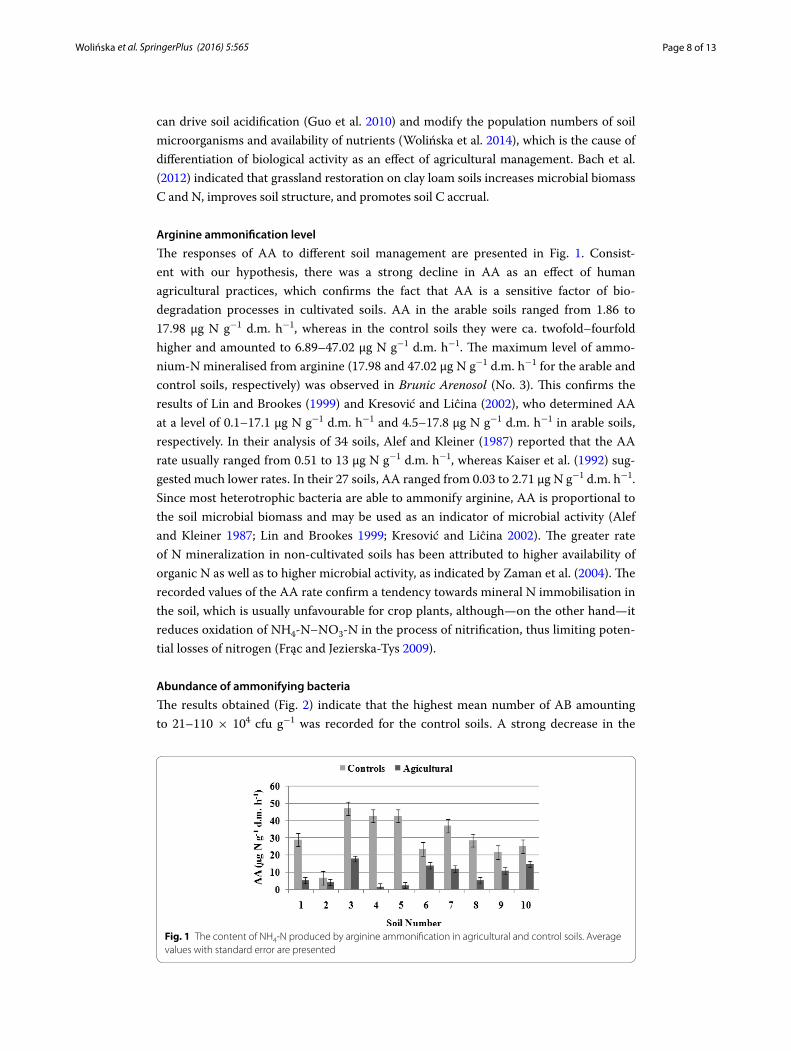
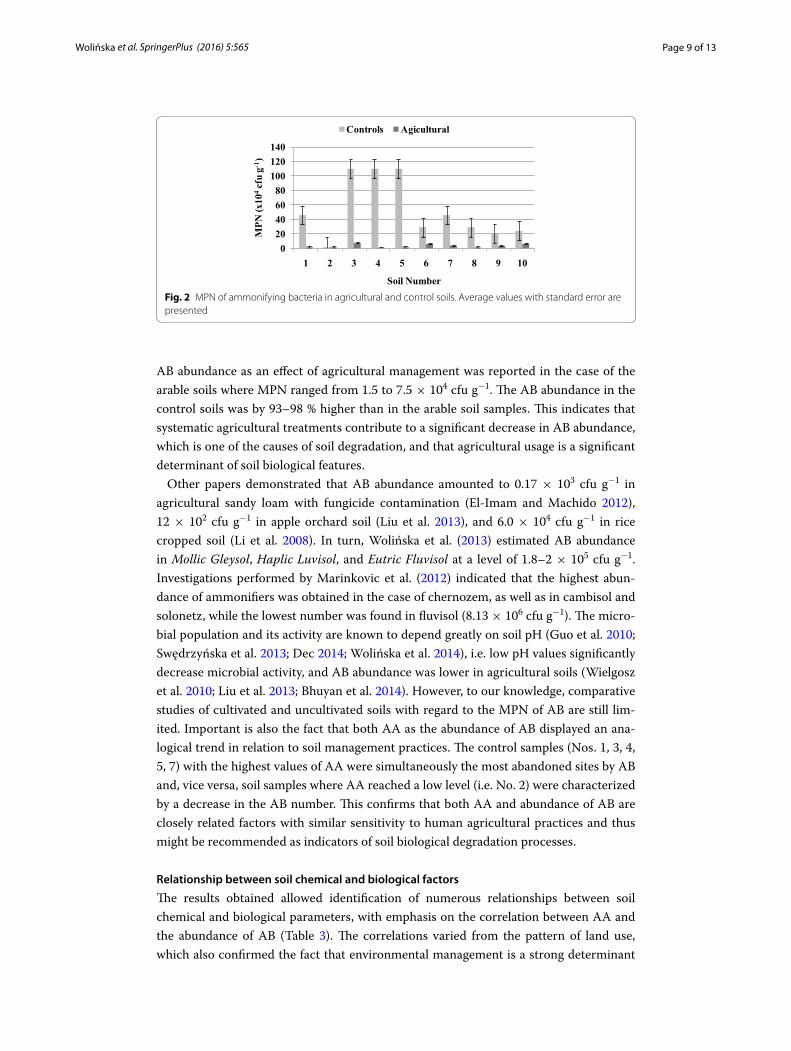
The results obtained (Fig. 2) indicate that the highest mean number of AB amounting to 21–110 × 104 cfu g−1 was recorded for the control soils. A strong decrease in the
Fig. 1 The content of NH4‑N produced by arginine ammonification in agricultural and control soils. Average values with standard error are presented
Page 9 of 13Wolińska et al. SpringerPlus (2016) 5:565
AB abundance as an effect of agricultural management was reported in the case of the arable soils where MPN ranged from 1.5 to 7.5 × 10⁴ cfu g−1. The AB abundance in the control soils was by 93–98 % higher than in the arable soil samples. This indicates that systematic agricultural treatments contribute to a significant decrease in AB abundance, which is one of the causes of soil degradation, and that agricultural usage is a significant determinant of soil biological features.
Other papers demonstrated that AB abundance amounted to 0.17 × 10³ cfu g−1 in agricultural sandy loam with fungicide contamination (El-Imam and Machido 2012), 12 × 102 cfu g−1 in apple orchard soil (Liu et al. 2013), and 6.0 × 10⁴ cfu g−1 in rice cropped soil (Li et al. 2008). In turn, Wolińska et al. (2013) estimated AB abundance in Mollic Gleysol, Haplic Luvisol, and Eutric Fluvisol at a level of 1.8–2 × 10⁵ cfu g−1. Investigations performed by Marinkovic et al. (2012) indicated that the highest abun-dance of ammonifiers was obtained in the case of chernozem, as well as in cambisol and solonetz, while the lowest number was found in fluvisol (8.13 × 10⁶ cfu g−1). The micro-bial population and its activity are known to depend greatly on soil pH (Guo et al. 2010; Swędrzyńska et al. 2013; Dec 2014; Wolińska et al. 2014), i.e. low pH values significantly decrease microbial activity, and AB abundance was lower in agricultural soils (Wielgosz et al. 2010; Liu et al. 2013; Bhuyan et al. 2014). However, to our knowledge, comparative studies of cultivated and uncultivated soils with regard to the MPN of AB are still lim-ited. Important is also the fact that both AA as the abundance of AB displayed an ana-logical trend in relation to soil management practices. The control samples (Nos. 1, 3, 4, 5, 7) with the highest values of AA were simultaneously the most abandoned sites by AB and, vice versa, soil samples where AA reached a low level (i.e. No. 2) were characterized by a decrease in the AB number. This confirms that both AA and abundance of AB are closely related factors with similar sensitivity to human agricultural practices and thus might be recommended as indicators of soil biological degradation processes.
Relationship between soil chemical and biological factors
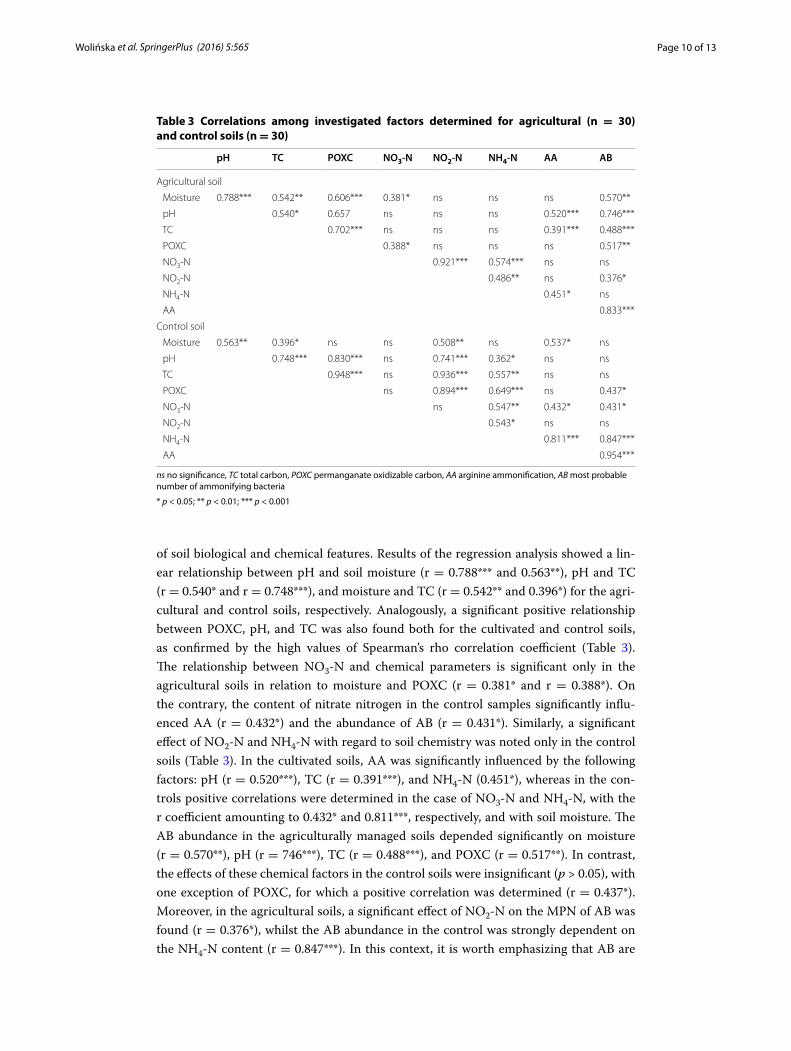
The results obtained allowed identification of numerous relationships between soil chemical and biological parameters, with emphasis on the correlation between AA and the abundance of AB (Table 3). The correlations varied from the pattern of land use, which also confirmed the fact that environmental management is a strong determinant
020406080
100120140
1 2 3 4 5 6 7 8 9 10M
PN (x
104
cfu
g-1)
Soil Number
Controls Agicultural
Fig. 2 MPN of ammonifying bacteria in agricultural and control soils. Average values with standard error are presented
Page 10 of 13Wolińska et al. SpringerPlus (2016) 5:565
of soil biological and chemical features. Results of the regression analysis showed a lin-ear relationship between pH and soil moisture (r = 0.788*** and 0.563**), pH and TC (r = 0.540* and r = 0.748***), and moisture and TC (r = 0.542** and 0.396*) for the agri-cultural and control soils, respectively. Analogously, a significant positive relationship between POXC, pH, and TC was also found both for the cultivated and control soils, as confirmed by the high values of Spearman’s rho correlation coefficient (Table 3). The relationship between NO3-N and chemical parameters is significant only in the agricultural soils in relation to moisture and POXC (r = 0.381* and r = 0.388*). On the contrary, the content of nitrate nitrogen in the control samples significantly influ-enced AA (r = 0.432*) and the abundance of AB (r = 0.431*). Similarly, a significant effect of NO2-N and NH4-N with regard to soil chemistry was noted only in the control soils (Table 3). In the cultivated soils, AA was significantly influenced by the following factors: pH (r = 0.520***), TC (r = 0.391***), and NH4-N (0.451*), whereas in the con-trols positive correlations were determined in the case of NO3-N and NH4-N, with the r coefficient amounting to 0.432* and 0.811***, respectively, and with soil moisture. The AB abundance in the agriculturally managed soils depended significantly on moisture (r = 0.570**), pH (r = 746***), TC (r = 0.488***), and POXC (r = 0.517**). In contrast, the effects of these chemical factors in the control soils were insignificant (p > 0.05), with one exception of POXC, for which a positive correlation was determined (r = 0.437*). Moreover, in the agricultural soils, a significant effect of NO2-N on the MPN of AB was found (r = 0.376*), whilst the AB abundance in the control was strongly dependent on the NH4-N content (r = 0.847***). In this context, it is worth emphasizing that AB are
Table 3 Correlations among investigated factors determined for agricultural (n = 30) and control soils (n = 30)
ns no significance, TC total carbon, POXC permanganate oxidizable carbon, AA arginine ammonification, AB most probable number of ammonifying bacteria
* p < 0.05; ** p < 0.01; *** p < 0.001
pH TC POXC NO3-N NO2-N NH4-N AA AB
Agricultural soil
Moisture 0.788*** 0.542** 0.606*** 0.381* ns ns ns 0.570**
pH 0.540* 0.657 ns ns ns 0.520*** 0.746***
TC 0.702*** ns ns ns 0.391*** 0.488***
POXC 0.388* ns ns ns 0.517**
NO3‑N 0.921*** 0.574*** ns ns
NO2‑N 0.486** ns 0.376*
NH4‑N 0.451* ns
AA 0.833***
Control soil
Moisture 0.563** 0.396* ns ns 0.508** ns 0.537* ns
pH 0.748*** 0.830*** ns 0.741*** 0.362* ns ns
TC 0.948*** ns 0.936*** 0.557** ns ns
POXC ns 0.894*** 0.649*** ns 0.437*
NO3‑N ns 0.547** 0.432* 0.431*
NO2‑N 0.543* ns ns
NH4‑N 0.811*** 0.847***
AA 0.954***
Page 11 of 13Wolińska et al. SpringerPlus (2016) 5:565
particularly active only if there is a high level of organic compounds in the soil and in the case of lack of mineral fertilization, as is the case in uncultivated soils. This is also related to the microbial life economics: if AB do not necessarily run the ammonification pro-cess, they use mineral nitrogen only. Finally, both in the agricultural and control soils, significant relationships between AA and the abundance of AB were determined to be r = 0.833*** and r = 0.954***. This interrelationship suggests that both parameters can be used as indicators of the soil biological degradation phenomenon.
Contrary to our results regarding agricultural soils, Tiquia et al. (2002) reported that AA was dependent neither on the change in TC (r2 = 0.04) nor N forms (r2 = 0.002), which remains in agreement to our finding but only with respect to the control sites. Rosenkranz et al. (2012) suggested that soil water content correlated positively with net ammonification rates and determined r = 0.25***. This is consistent with our study, as we also noted a positive effect of soil moisture on AA in the control soils (r = 0.537*). Alef and Kleiner (1987) and Lin and Brookes (1999) found no relationship between AA and pH, which is comparable to our data regarding the control soils (characterized by pH close to neutral); however, in the case of agricultural soils (characterized by lower pH than controls), we determined a significant effect of pH on AA (Table 3). The same effect connected with acidic pH was also suggested by Lin and Brookes (1999); how-ever, they did not calculate Spearman’s rho correlation coefficient. Alef and Kleiner (1987) reported that the AA rate was closely correlated with the amount of soil micro-bial biomass. This is comparable to our results, as we noted a strong positive correlation (p < 0.001) between AA and the AB abundance, both in the agricultural as control soils. Additionally, in our work, there were highly significant correlations between NH4-N and AA (Table 3), which remains in agreement with the observations reported by Lin and Brookes (1999).
ConclusionsOur data established that systematic agricultural practices significantly influenced soil biological and chemical properties. Comparison between the cultivated and control soils proved that agricultural exploited sites are biologically degraded, which was confirmed by the acidic pH, lower values of TC, and pool of POXC. The decreasing trend in the chemical factors was the cause of inhibition of AA and the AB abundance noted in ara-ble soils. As demonstrated already in laboratory tests, the AA assay was quite sensitive and responded quickly to the mode of land use, similarly to the abundance of AB. The close relationship between these two factors was verified by the high values of Spear-man’s rho correlation coefficient, i.e. r = 0.833*** and r = 0.954*** for the agricultural and control soils, respectively. Similarly, the hypothesis that both AA as AB abundance are strongly affected by human agricultural management and might be adequate and easily measurable indicators of the biological degradation process has been confirmed.Authors’ contributionsAW carried out soil physico‑chemical factors (moisture, pH, TC), performed statistical analysis, participated in the design of the study and drafted the manuscript. ASN carried out arginine ammonification and microbial abundance analyses. AB determined forms of nitrogen and permanganate oxidizable carbon. MB helped to draft the manuscript and has given final approval of the version to be published. ZS revised the manuscript critically. All authors read and approved the final manuscript.
Page 12 of 13Wolińska et al. SpringerPlus (2016) 5:565
Author details1 Department of Biochemistry and Environmental Chemistry, Institute of Biotechnology, The John Paul II Catholic Univer‑sity of Lublin, Konstantynów 1 I Str., 20‑708 Lublin, Poland. 2 Department of Microbial Biology, Warsaw University of Life Sciences, 159 Nowoursynowska, Str., 02‑776 Warsaw, Poland.
AcknowledgementsThis project was supported by the National Science Centre (Poland), granted on the basis of decision DEC‑2013/09/D/NZ9/02482. We are also grateful for our technical assistant Andrzej Górski for his participation in the field trips and help in TC analyses and Marek Pazur from the Institute of Agrophysics Polish Academy of Sciences in Lublin (Poland) for his help in precise location of places for soil sampling (strictly according BSS points).
Competing interestsThe authors declare that they have no competing interests.
Received: 25 June 2015 Accepted: 3 May 2016
ReferencesAlef K, Kleiner D (1987) Applicability of arginine ammonification as indicator of microbial activity in different soils. Biol
Fertil Soils 5:148–151ASTM D2216‑10 (1999) Standard test methods for laboratory determination of water (moisture) in soil and rock by mass.
Am Soc Test Mat 1–5Bach EM, Baer SG, Six J (2012) Plant and soil responses to high and low diversity grassland restoration practices. Environ
Manage 49:412–424. doi:10.1007/s00267‑011‑9787‑0Banach AM, Banach K, Visser EJW, Stępniewska Z, Smits AJM, Roelofs JGM, Lamers LPM (2009) Effects of summer flood‑
ing on floodplain biogeochemistry in Poland; implications for increased flooding frequency. Biogeochemistry 92:247–262. doi:10.1007/s10533‑009‑9291‑2
Bhuyan SI, Tripathi OP, Khan ML (2014) Effect of season, soil and land use pattern on soil N‑mineralization, ammonifica‑tion and nitrification: a study in Arunachal Pradesh, eastern Himalaya. Int J Environ Sci 5(1):88–97
Bieganowski A, Witkowska‑Walczak B, Gliński J, Sokołowska Z, Sławiński C, Brzezińska M, Włodarczyk T (2013) Database of Polish arable mineral soils: a review. Int Agrophys 27:335–350. doi:10.2478/intag‑2013‑0003
Bonde TA, Nielsen TH, Miller M, Sørensen J (2001) Argininie ammonification assay as a rapid index of gross N mineraliza‑tion in agricultural soils. Biol Fertil Soils 34:179–184. doi:10.1007/s003740100395
Booth MS, Stark JM, Hart SC (2006) Soil‑mixing effects on inorganic nitrogen production and consumption in forest and shrubland soils. Plant Soil 289:5–15. doi:10.1007/s00267‑010‑9517‑z
Campos A (2010) Response of soil inorganic nitrogen to land use and topographic position in the Cofre de Perote Vul‑cano (Mexico). Environ Manage 46:213–224. doi:10.1007/s00267‑010‑9517‑z
Chan KY, Robert WP, Heenan DP (1992) Organic carbon and associated properties of a red earth after 10 years of rotation under different stubble and tillage practices. Aust J Soil Res 309:71–83. doi:10.1071/SR9920071
Dec D (2014) Assessment of the microbiological activity in agricultural and urban soils. Soil Sci Ann 65(4):156–160. doi:10.1515/ssa‑2015‑0009
Deng SP, Tabatabai MA (2000) Effect of cropping systems on nitrogen mineralization in soils. Biol Fertil Soils 31:211–218Doran JW (1987) Microbial biomass and mineralizable nitrogen distribution in no‑tillage and plowed soils. Biol Fertil Soils
5:68–75El‑Imam AMA, Machido DA (2012) Growth of ammonium oxidizing bacteria in soil treated with some fungicides. Glob J
Environ Sci 11(1):1–7. doi:10.4314/gjes.v11i1‑2.2Frąc M, Jezierska‑Tys S (2009) Biological indicators of soil quality after application of dairy sewage sludge. Environ Prot
Eng 35(4):49–61Gajic B, Dugalic G, Djurovic N (2006) Comparison of soil matter organic content, aggregate composition and water stabil‑
ity of Gleyic Fluvisol from adjacent forest and cultivated area. Agron Res 4(2):499–508Gliński J, Ostrowski J, Stępniewska Z, Stępniewski W (1991) Soil samples bank representing mineral soils of Poland. Probl
Agrop 66:5–57 (in Polish)Grasshoff K, Johannsen H (1972) A new sensitive and direct method for the automatic determination of ammonia in sea
water. J Cons Int Explor Mer 34(3):516–521. doi:10.1093/icesjms/34.3.516Guo JH, Liu XJ, Zhang Y, Shen JL, Han WX, Zhang WF, Christie P, Goulding KWT, Vitousek PM, Zhang VS (2010) Significant
acidification in major Chinese croplands. Science 327:1008–1010. doi:10.1126/science.1182570Horz HP, Barbrook A, Field CB, Bohannan BJM (2004) Ammonia oxidizing bacteria respond to multifactorial global
change. Proc Natl Acad Sci USA 101(42):15136–15141. doi:10.1073/pnas.0406616101Imaz MJ, Virto I, Bescansa P, Enrique A, Fernandez‑Ugalde O, Karlen DL (2010) Soil quality indicator response to tillage and
residua management on semi‑arid Mediterranean cropland. Soil Tillage Res 107:17–25. doi:10.1016/j.still.2010.02.003Kaiser EA, Mueller T, Joergenson RG, Heinemeyer O (1992) Evaluation of methods to estimate the soil microbial biomass
relationship with soil texture and organic matter. Soil Biol Biochem 24:675–683Kamphake LJ, Hannah SA, Cohen JM (1967) Automated analysis for nitrate by hydrazine reduction. Wat Res 1:205–206.
doi:10.1016/0043‑1354(67)90011‑5Kheyrodin H, Ghazvininan K, Taherian M (2012) Tillage and manure effect on soil microbial biomass and respiration, and
on enzyme activities. Afr J Biotechnol 11(81):14652–14659. doi:10.5897/AJB09.1335Kowalchuk GA, Stephen JR (2001) Ammonia oxidizing bacteria: a model for molecular microbial ecology. Annu Rev
Microbiol 55:485–529. doi:10.1146/annurev.micro.55.1.485
Page 13 of 13Wolińska et al. SpringerPlus (2016) 5:565
Kresović M, Liĉina V (2002) The determination of potential ammonification in soil by arginine method. J Agric Sci 47(2):129–135
Li P, Lang M (2014) Gross nitrogen transformations and related N2O emissions in uncultivated and cultivated black soil. Biol Fertil Soils 50:197–206. doi:10.1007/s00374‑013‑0848‑9
Li H, Liang X, Chen Y, Lian Y, Tian G, Ni W (2008) Effect of nitrification inhibitor DMPP on nitrogen leaching, nitrifying organisms, and enzymes activities in a rice‑oilseed rape cropping system. J Environ Sci 20:149–155
Lin Q, Brookes PC (1999) Arginine ammonification as a method to estimate soil microbial biomass and microbial com‑munity structure. Soil Biol Biochem 31:1985–1997. doi:10.1016/S0038‑0717(99)00121‑2
Liu L, Qin S, Lü D, Wang B, Yang Z (2013) Variation of potential nitrification and ammonia oxidizing bacteria community with plant growing period in apple orchard soil. J Int Agric. doi:10.1016/S2095‑3119(13)60424‑4
Mäder P, Filiebßach A, Dubois D, Gunst L, Fried P, Niggli U (2002) Soil fertility and biodiversity in organic farming. Science 296:1694–1697. doi:10.1002/jpln.200700287
Marinkovic J, Bjelic D, Vasin J, Tintor B, Ninkov J (2012) The distribution of microorganisms in different types of agricultural soils in the Vijvodina province. Res J Agric Sci 44(3):73–78
Marquard E, Weigelt A, Temperton VM, Roscher C, Schumacher J, Buchmann N, Fischer M, Weisser WW, Schmid B (2009) Plant species richness and functional composition drive over yielding in a 6‑year grassland experiment. Ecology 90:3290–3302
Nourbakhsh F, Alinejadian A (2009) Argininie ammonification and l‑glutaminase assays as rapid indices of corn nitrogen availability. J Plant Nutr Soil Sci 172:127–133. doi:10.1002/jpln.200700287
Qiu S, Chen G, Zhou Y (2010) Abundance and diversity of ammonia oxidizing bacteria in relation to ammonium in a Chinese shallow eutrophic urban lake. Braz J Microbiol 41:218–226. doi:10.1590/S1517‑838220100001000031
Rhoades CC, Coleman DC (1999) Nitrogen mineralization and nitrification following land conservation in montae Ecua‑dor. Soil Biol Biochem 31:1347–1354
Rosenkranz S, Wilcke W, Eisenhouer N, Oelmann Y (2012) Net ammonification as influenced by plant diversity in experi‑mental grasslands. Soil Biol Biochem 48:78–87. doi:10.1016/j.soilbio.2012.01.008
Sutton S (2010) The most probable number method and its use in QC microbiology. J GXP Compliance 14(4):28–33Swędrzyńska D, Małecka I, Blecharczyk A, Swędrzyński A, Starzyk J (2013) Effects of various long‑term tillage on some
chemical and biological properties of soil. Pol J Environ Stud 22(6):1835–1844Tintor B, Miloŝević N, Vasin J (2009) Microbiological properties of chernozem of southern Backa (Serbia) according to
different methods of land use. Field Veg Crop Res 46:189–198Tiquia SM, Wan JHC, Tam FMY (2002) Dynamics of yard trimmings composting as determined by dehydrogenase activity,
ATP content, arginine ammonification, and nitrification potential. Proc Biochem 37:1057–1065Tscharntke T, Clough Y, Wanger TC, Jackson L, Motzke I, Perfecto I, Vandermeer J, Whitbread A (2012) Global food security,
biodiversity conservation and the future of agricultural intensification. Biol Conserv 151:53–59. doi:10.1016/j.biocon.2012.01.068
Valpassos MAR, Cavalcante EGS, Cassiolato AMR, Alves MC (2001) Effects of soil management systems on soil micro‑bial activity, bulk density and chemical properties. Pesqui Agropecu Bras 36(12):1539–1545. doi:10.1590/S0100‑204X2001001200011
Wang F, Li J, Zou B, Xu X, Li Z (2013) Effect of prescribed fire on soil properties and N transformation in two vegetation types in south China. Environ Manage 51:1164–1173. doi:10.1007/s00267‑013‑0044‑6
Weil RR, Islam KR, Stine MA, Gruver JB, Samson‑Liebig SE (2003) Estimating active carbon for soil quality assessment: a simplified method for laboratory and field use. Am J Altern Agric 18(1):3–17
Wielgosz E, Jóźwiakowski K, Bielińska EJ (2010) Numbers of ammonifying, nitrifying and denitrifying bacteria in sewage treated in a system of biological stabilisation ponds. Teka Kom Ochr Kszt Środ Przyr 7:446–456
Wolińska A, Stępniewska Z, Kuźniar A (2013) Characterization of microbial community in the selected Polish mineral soils after long term storage. Afr J Microbiol Res 7(7):595–603. doi:10.5897/AJMR12.2308
Wolińska A, Szafranek‑Nakonieczna A, Banach A, Rekosz‑Burlaga H, Goryluk‑Salmonowicz A, Błaszczyk M, Stępniewska Z, Górski A (2014) Biological degradation of agricultural soils from Lublin region (SE Poland). Int J Curr Microbiol Appl Sci 3(11):558–571
Wyczółkowski AI, Dąbek‑Szreniawska M (2005) Enzymes taking part in organic nitrogen mineralization. Acta Agrophys 3:37–61
Zaman M, Matsushima M, Chang SX, Inubushi K, Nguyen L, Gotao S, Kaneko F, Yoneyama T (2004) Nitrogen mineraliza‑tion, N2O production and soil microbiological properties as affected by long‑term applications of sewage sludge composts. Biol Fertil Soils 40:101–109. doi:10.1007/s00374‑004‑0746‑2
Zhang JB, Zhu TB, Meng TZ, Zhang YC, Yang JJ, Yang WY, Müller C, Cai ZC (2013) Agricultural land use affects nitrate production and conservation in humid subtropical soils in China. Soil Biol Biochem 62:107–114. doi:10.1016/j.soilbio.2013.03.006