Embed Size (px)
Citation preview
1© 2011 The MathWorks, Inc.
信用リスクモデリング ケーススタディ
The MathWorks® Computational Finance Team

2
Time Table
Time Agenda
15:20 – 15:25 Introduction
15:25 – 15:50 決定木による格付モデル
15:50 – 16:00 休憩
16:00 – 16:15 遷移行列とデフォルト確率
16:15 – 16:35 信用リスクの解析
16:35 – 16:50 まとめ

3
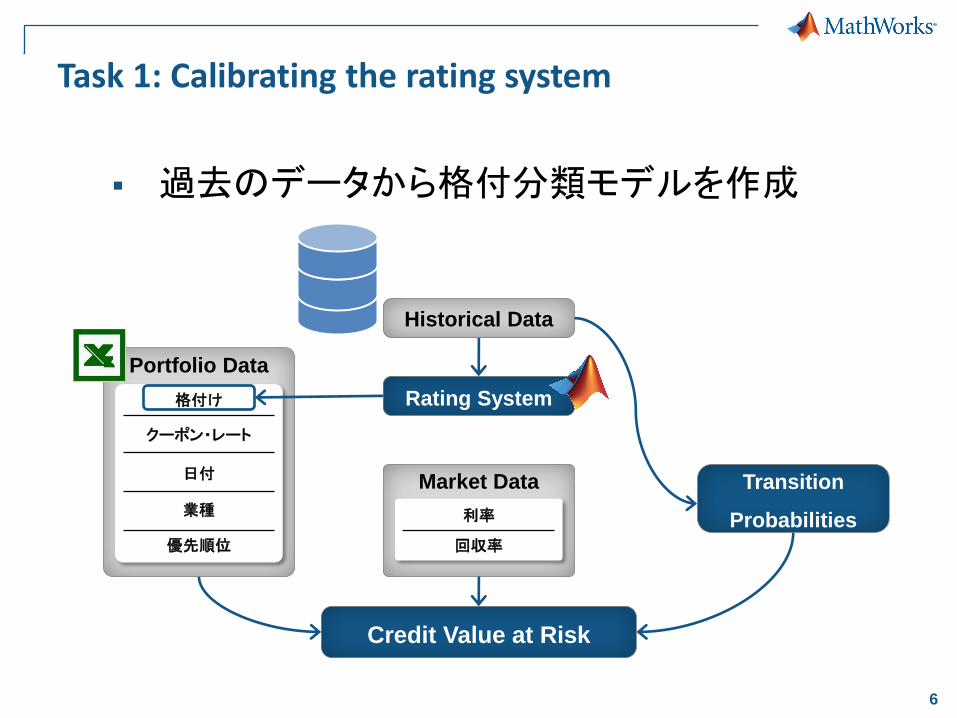
利率
回収率
Market Data
目標:信用リスクモデルのアプリケーション作成
Credit Value at Risk
信用VaR を算出するツールを開発しExcel のアプリケーションとして組み込む
Historical Data
Rating System
Portfolio Data
格付け
クーポン・レート
日付
業種
優先順位
Transition
Probabilities

4
要求課題
計算能力– 1,000 以上の債券銘柄
– 10,000 回のシミュレーション
コスト– 開発工数の削減
– 既存環境への適用
透明性– アルゴリズムの可読性
– 第三者への説明

5
Agenda
決定木による格付モデル
遷移行列とデフォルト確率
信用リスクの解析
まとめ
6
利率
回収率
Market Data
Task 1: Calibrating the rating system
Credit Value at Risk
過去のデータから格付分類モデルを作成
Historical Data
Rating System
Portfolio Data
格付け
クーポン・レート
日付
業種
優先順位
Transition
Probabilities
7
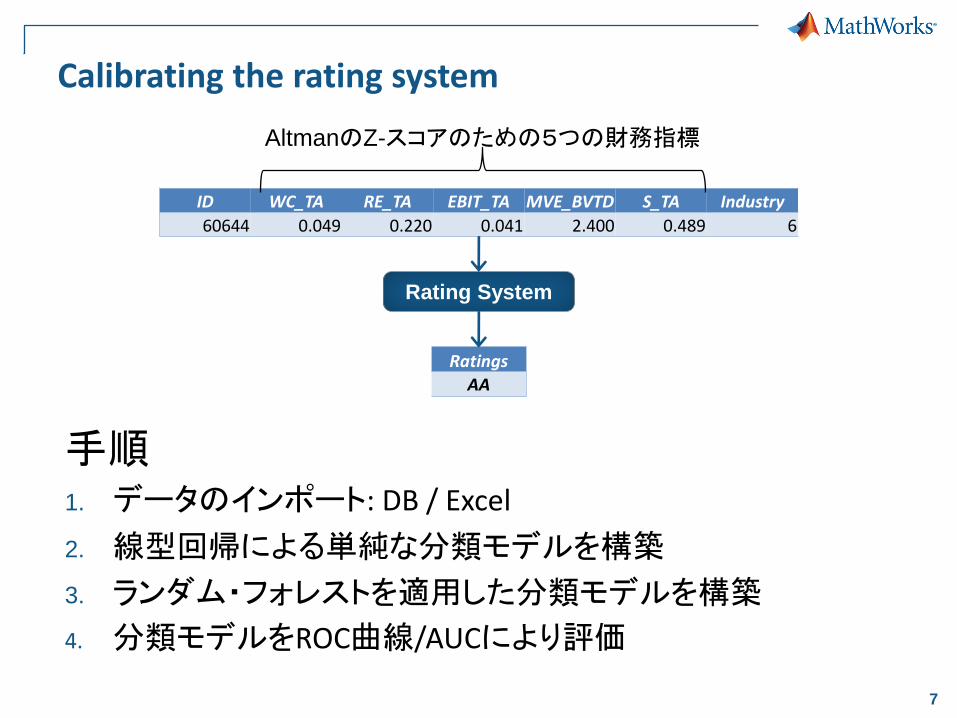
Calibrating the rating system
手順1. データのインポート: DB / Excel
2. 線型回帰による単純な分類モデルを構築
3. ランダム・フォレストを適用した分類モデルを構築
4. 分類モデルをROC曲線/AUCにより評価
ID WC_TA RE_TA EBIT_TA MVE_BVTD S_TA Industry
60644 0.049 0.220 0.041 2.400 0.489 6
Ratings
AA
Rating System
AltmanのZ-スコアのための5つの財務指標
8
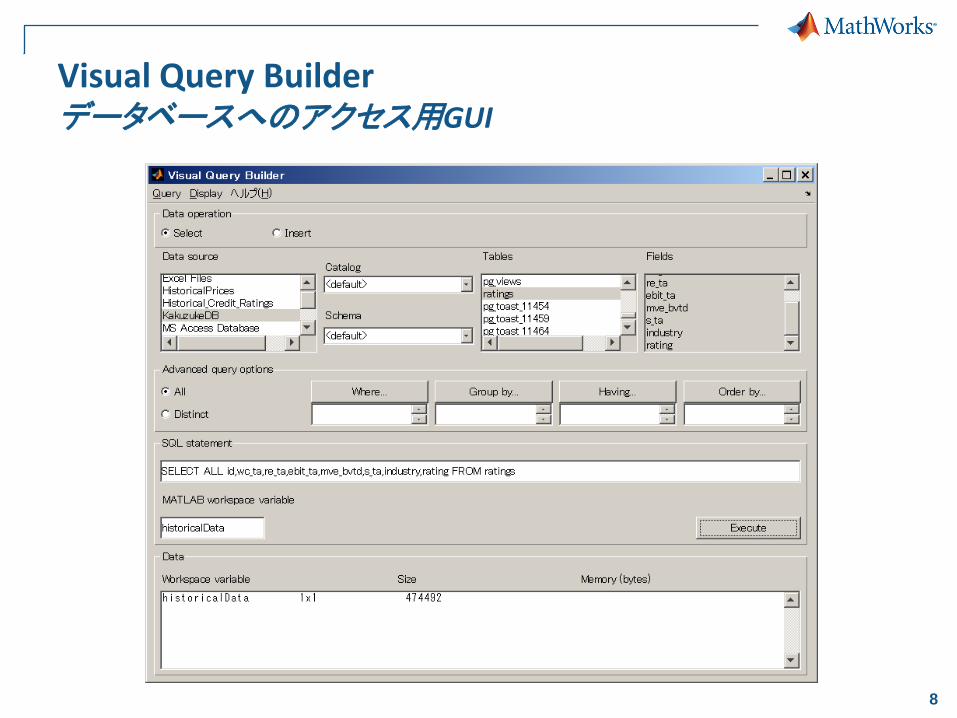
Visual Query Builderデータベースへのアクセス用GUI
9
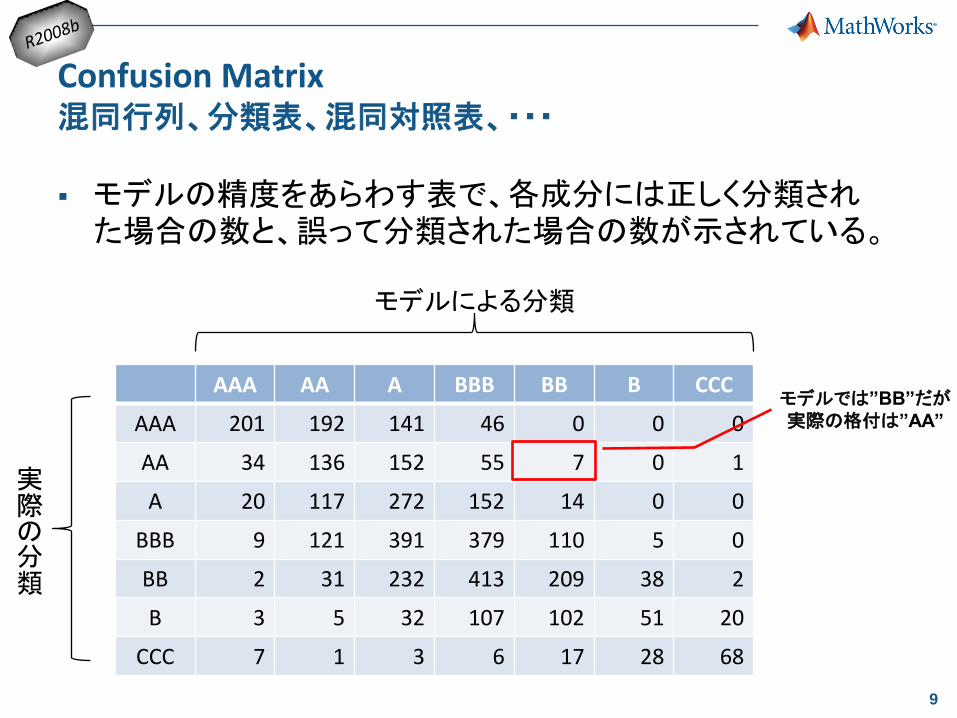
Confusion Matrix混同行列、分類表、混同対照表、・・・
モデルの精度をあらわす表で、各成分には正しく分類された場合の数と、誤って分類された場合の数が示されている。
AAA AA A BBB BB B CCC
AAA 201 192 141 46 0 0 0
AA 34 136 152 55 7 0 1
A 20 117 272 152 14 0 0
BBB 9 121 391 379 110 5 0
BB 2 31 232 413 209 38 2
B 3 5 32 107 102 51 20
CCC 7 1 3 6 17 28 68
実際の分類
モデルによる分類
モデルでは”BB”だが実際の格付は”AA”
10
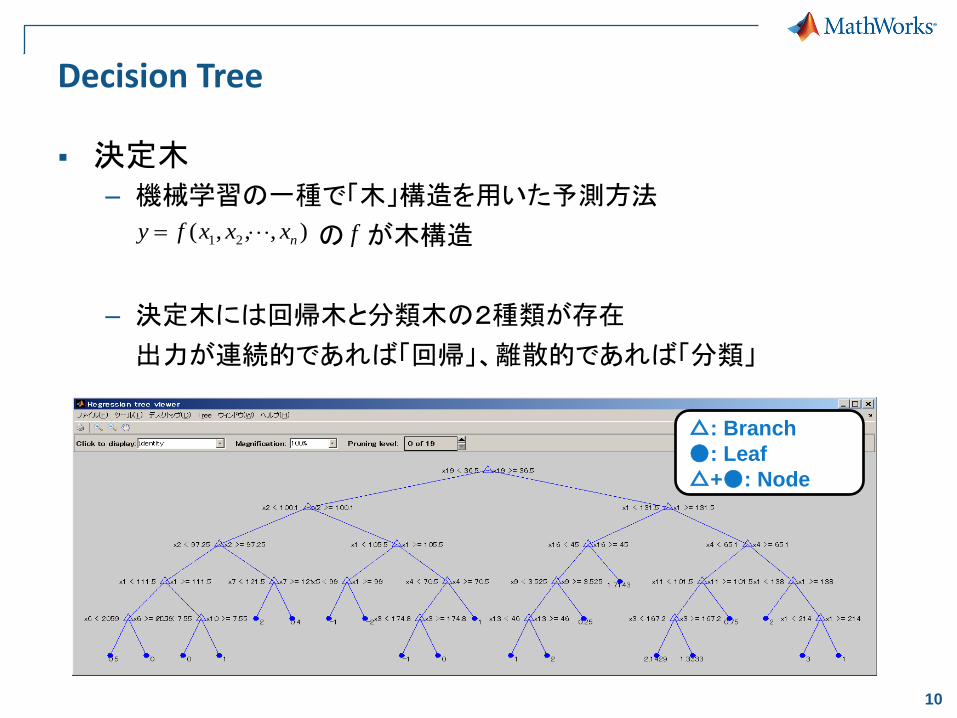
Decision Tree
決定木– 機械学習の一種で「木」構造を用いた予測方法
の が木構造
– 決定木には回帰木と分類木の2種類が存在
出力が連続的であれば「回帰」、離散的であれば「分類」
),,,( 21 nxxxfy f
△: Branch
●: Leaf
△+●: Node
11
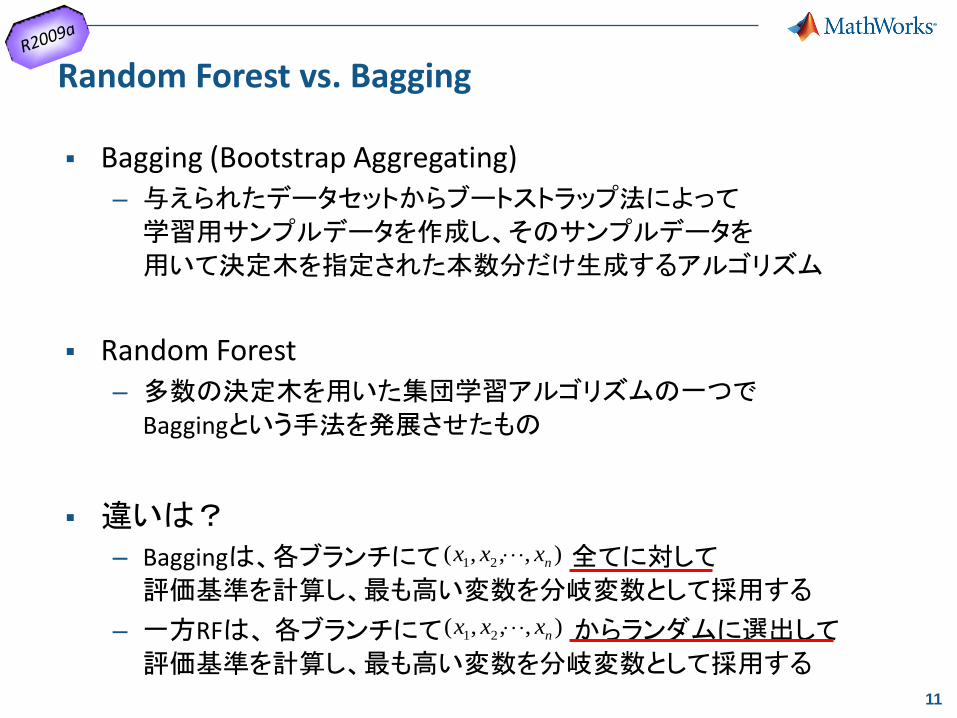
Random Forest vs. Bagging
Bagging (Bootstrap Aggregating)
– 与えられたデータセットからブートストラップ法によって
学習用サンプルデータを作成し、そのサンプルデータを
用いて決定木を指定された本数分だけ生成するアルゴリズム
Random Forest
– 多数の決定木を用いた集団学習アルゴリズムの一つで
Baggingという手法を発展させたもの
違いは?– Baggingは、各ブランチにて 全てに対して
評価基準を計算し、最も高い変数を分岐変数として採用する
– 一方RFは、各ブランチにて からランダムに選出して
評価基準を計算し、最も高い変数を分岐変数として採用する
),,,( 21 nxxx
),,,( 21 nxxx
12
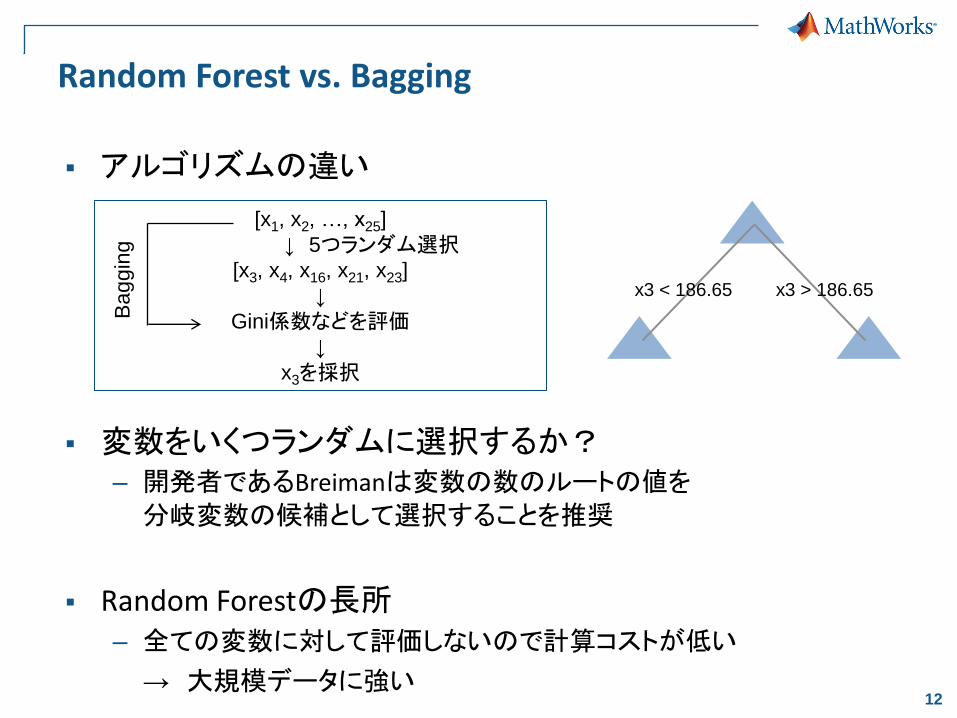
Random Forest vs. Bagging
アルゴリズムの違い
変数をいくつランダムに選択するか?– 開発者であるBreimanは変数の数のルートの値を
分岐変数の候補として選択することを推奨
Random Forestの長所– 全ての変数に対して評価しないので計算コストが低い
→ 大規模データに強い
x3 < 186.65 x3 > 186.65
[x1, x2, …, x25]
↓ 5つランダム選択[x3, x4, x16, x21, x23]
↓
Gini係数などを評価↓
x3を採択
Bagg
ing

13
ROC曲線: Receiver Operating Characteristic Curve受信者動作特性曲線
ROC曲線: 分類の精度を表すグラフ– 赤枠で囲まれるような表を考え、閾値「11」を
設けます。この時、11以上を陽性(Positive)、
11未満を陰性(Negative)といい、5個のFのう
ち1個がPositive側に含まれることから偽陽
性率は0.2で、10個のTのうち5個がPositive
側に属するので真陽性率は0.5となります。
– 関数「perfcurve」はFalse/True Positive Rate
やAUC (Area under the curve)を計算する
スコア ラベル(分類)
偽陽性率(False Positive)
真陽性率(True Positive)
16 T 0 0.1
15 T 0 0.2
14 F 0.2 0.2
13 T 0.2 0.3
12 T 0.2 0.4
11 T 0.2 0.5
10 F 0.4 0.5
9 T 0.4 0.6
8 T 0.4 0.7
8 T 0.4 0.8
8 T 0.4 0.9
8 F 0.6 0.9
7 F 0.8 0.9
6 T 0.8 1
5 F 1 1
Threshold= 11

14
ROC曲線とAUC
>> [x, y, t, auc] = perfcurve(labels, scores, 'T‘);
>> plot(x,y);
>> xlabel(‘False Positive Rate’); ylabel('True Positive Rate');
>> text(0.5, 0.3, ['AUC = ', num2str(auc)], 'EdgeColor', 'k');
>> title('ROC曲線');
AUC: ROC曲線とx軸が囲む領域の面積で、AUCが1に近いほど分類の精度が高いことを意味する

15
CAP曲線Cumulative Accuracy Profile
格付
x以下でデフォルトした会社の割合
格付 x 以下に属する会社の割合0
1
1
D
Dx
k
k
N
Nx
k
k
x
N
kD
D
: 格付の低いほうから並べた順序付きランク
: 会社の総数
: 格付 k でデフォルトした会社の数
: デフォルトした会社の総数
kN :格付 k に属する会社の数
理想的な予測精度
ランダムな予測精度

16
ARAccuracy Ratio
以下のように囲まれる面積の比で定義される値で、1に近いほど分類モデルの精度が良いことを示す
AR =
の面積
の面積
17
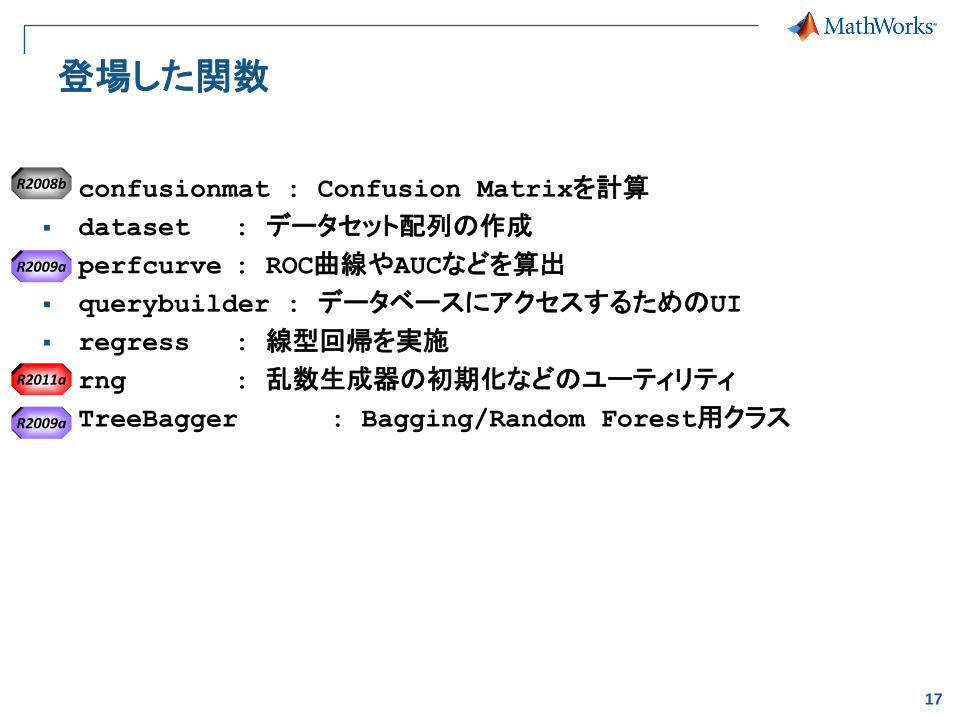
登場した関数
confusionmat : Confusion Matrixを計算
dataset : データセット配列の作成
perfcurve : ROC曲線やAUCなどを算出
querybuilder : データベースにアクセスするためのUI
regress : 線型回帰を実施
rng : 乱数生成器の初期化などのユーティリティ
TreeBagger : Bagging/Random Forest用クラス
R2011a
R2008b
R2009a
R2009a
18
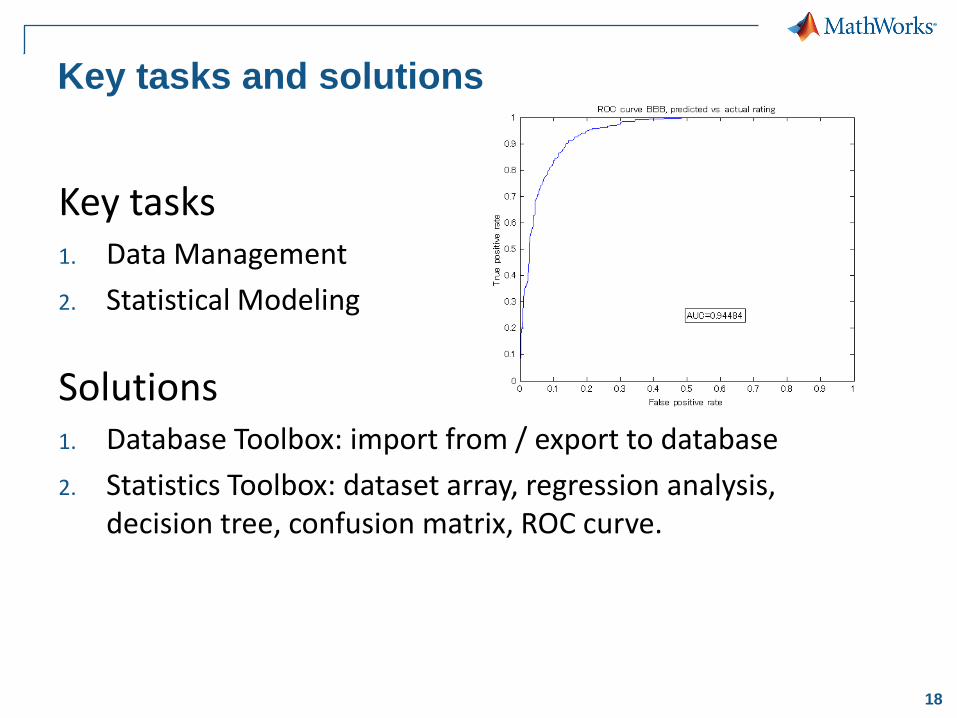
Key tasks1. Data Management
2. Statistical Modeling
Solutions1. Database Toolbox: import from / export to database
2. Statistics Toolbox: dataset array, regression analysis, decision tree, confusion matrix, ROC curve.
Key tasks and solutions
19
Agenda
決定木による格付モデル
遷移行列とデフォルト確率
信用リスクの解析
まとめ
20
利率
回収率
Market Data
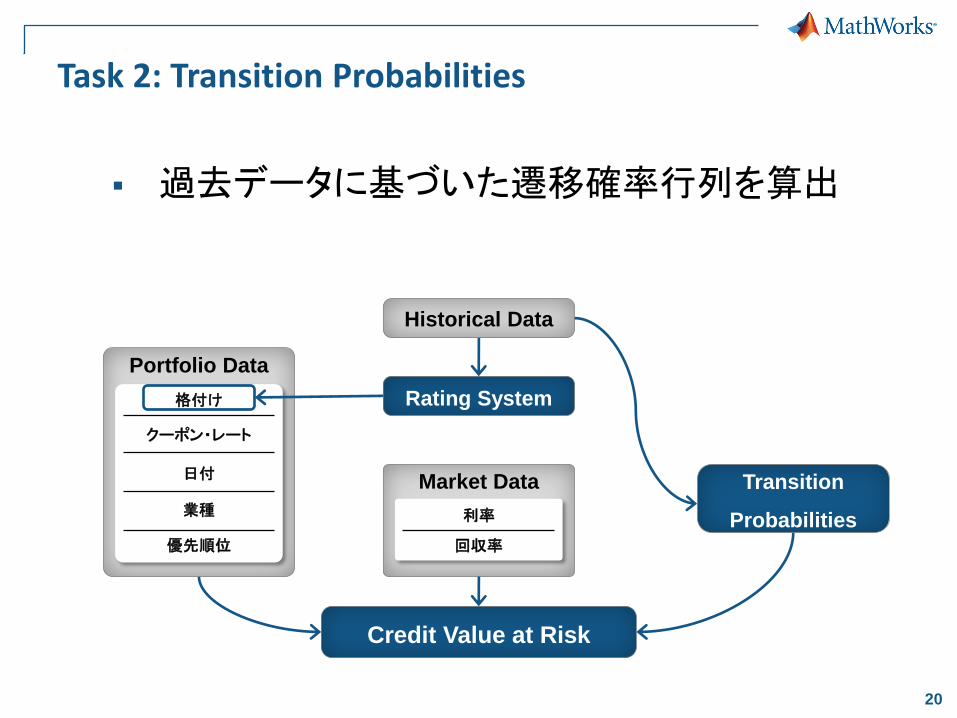
Task 2: Transition Probabilities
Credit Value at Risk
過去データに基づいた遷移確率行列を算出
Historical Data
Rating System
Portfolio Data
格付け
クーポン・レート
日付
業種
優先順位
Transition
Probabilities
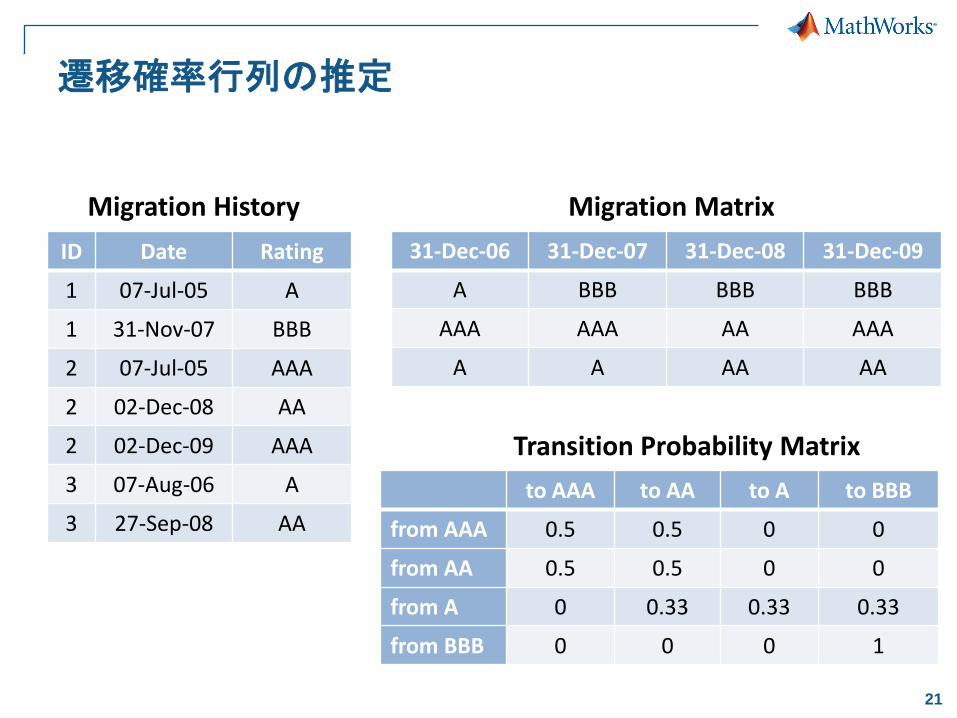
21
31-Dec-06 31-Dec-07 31-Dec-08 31-Dec-09
A BBB BBB BBB
AAA AAA AA AAA
A A AA AA
Migration Matrix
Transition Probability Matrix
ID Date Rating
1 07-Jul-05 A
1 31-Nov-07 BBB
2 07-Jul-05 AAA
2 02-Dec-08 AA
2 02-Dec-09 AAA
3 07-Aug-06 A
3 27-Sep-08 AA
Migration History
to AAA to AA to A to BBB
from AAA 0.5 0.5 0 0
from AA 0.5 0.5 0 0
from A 0 0.33 0.33 0.33
from BBB 0 0 0 1
遷移確率行列の推定

22
93.68%
2.44%
0.14%
0.03%
0.03%
0.00%
0.00%
0.00%
5.55%
92.60%
4.18%
0.23%
0.12%
0.00%
0.00%
0.00%
0.59%
4.03%
91.02%
7.49%
0.73%
0.11%
0.00%
0.00%
0.18%
0.73%
3.90%
87.86%
8.27%
0.82%
0.37%
0.00%
0.00%
0.15%
0.60%
3.78%
86.74%
9.64%
1.84%
0.00%
0.00%
0.00%
0.08%
0.39%
3.28%
85.37%
6.24%
0.00%
0.00%
0.00%
0.00%
0.06%
0.18%
2.41%
81.88%
0.00%
0.00%
0.06%
0.08%
0.16%
0.64%
1.64%
9.67%
100.00%
AAA AA A BBB BB B CCC D
AAA
AA
A
BBB
BB
B
CCC
D
手順1. テキストデータのインポートと時系列データの作成
2. Migration Matrixの生成
3. 遷移確率行列の算出と可視化
4. デフォルト確率の計算
遷移確率行列の推定
23
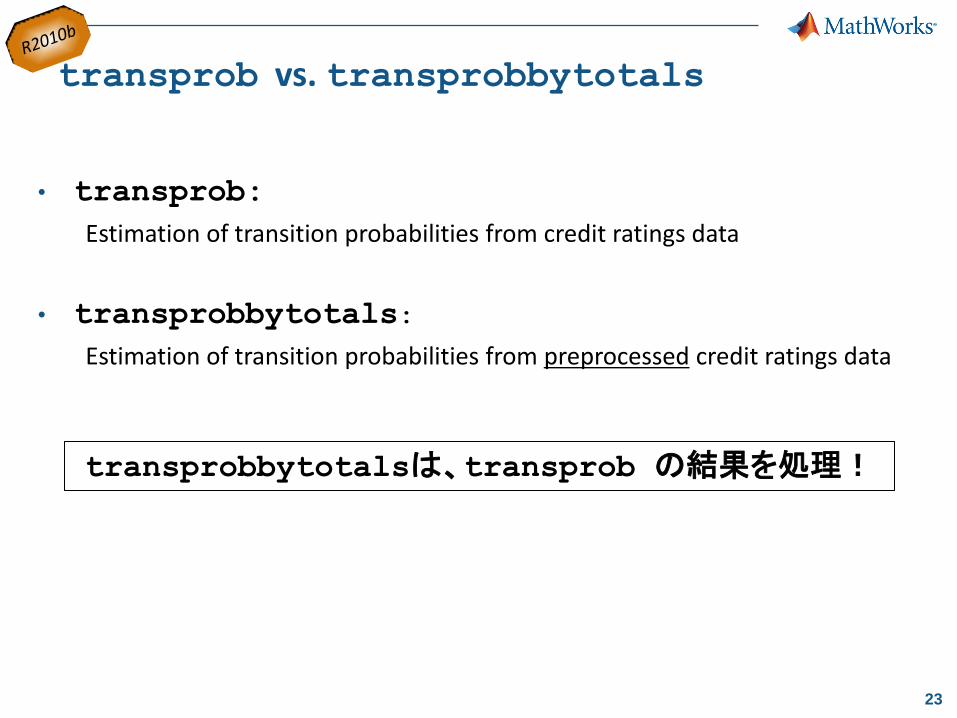
transprob vs. transprobbytotals
• transprob:
Estimation of transition probabilities from credit ratings data
• transprobbytotals:
Estimation of transition probabilities from preprocessed credit ratings data
transprobbytotalsは、transprob の結果を処理!

24
Open exchange for the MATLAB and Simulink user community
662,000 visits per month
File Exchange– Upload/download access to free files including
MATLAB code, Simulink models, and documents
– Ability to rate files, comment, and ask questions
– More than 9,000 contributed files, 400 submissions per month, 25,500 downloads per day
Newsgroup– Web forum for technical discussions about MATLAB
and Simulink
– 200 posts per day
Blogs– Frequent posts from key MathWorks developers
who design and build the products
– Open conversation at blogs.mathworks.com
Based on February 2009 data
MATLAB Central

25
登場した関数
cfdates : キャッシュフロー日付の作成
fillts : Financial Time Series Objectの欠損データ補完
fints : Financial Time Series Objectを作成
intersect : 2つの集合の共通部分を抽出 (A∩B)
ordinal : オーディナル配列の作成
parfor : forループの並列版
transprob : 格付データから遷移確率行列を推定
transprobbytotals :前処理済み格付データから遷移確率行列を推定
R2008a
R2010b
R2010b
26
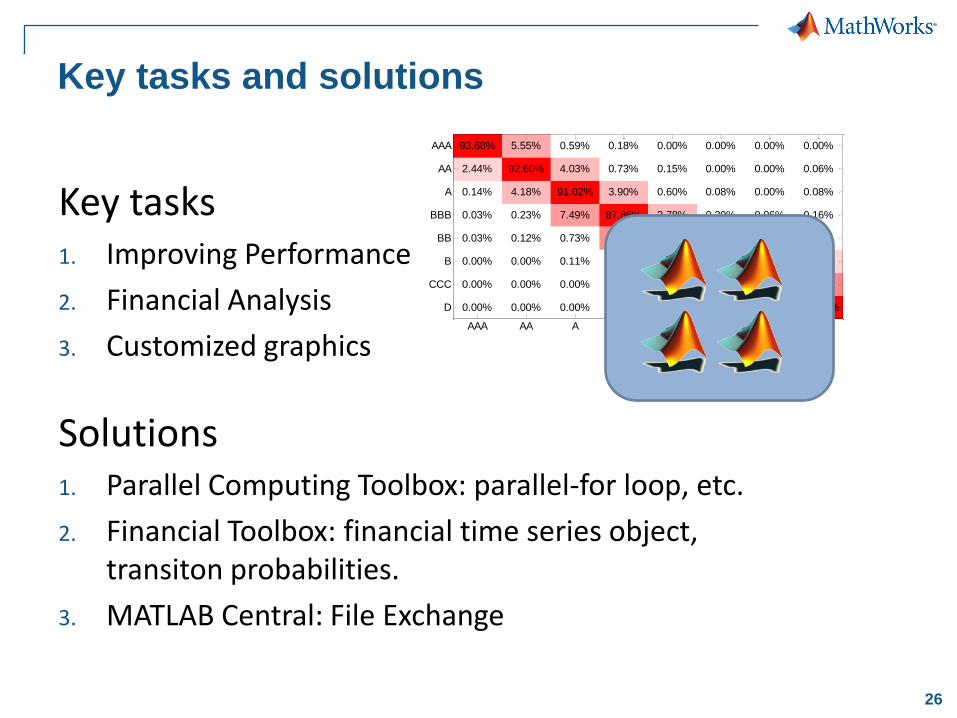
Key tasks1. Improving Performance
2. Financial Analysis
3. Customized graphics
Solutions1. Parallel Computing Toolbox: parallel-for loop, etc.
2. Financial Toolbox: financial time series object, transiton probabilities.
3. MATLAB Central: File Exchange
Key tasks and solutions
93.68%
2.44%
0.14%
0.03%
0.03%
0.00%
0.00%
0.00%
5.55%
92.60%
4.18%
0.23%
0.12%
0.00%
0.00%
0.00%
0.59%
4.03%
91.02%
7.49%
0.73%
0.11%
0.00%
0.00%
0.18%
0.73%
3.90%
87.86%
8.27%
0.82%
0.37%
0.00%
0.00%
0.15%
0.60%
3.78%
86.74%
9.64%
1.84%
0.00%
0.00%
0.00%
0.08%
0.39%
3.28%
85.37%
6.24%
0.00%
0.00%
0.00%
0.00%
0.06%
0.18%
2.41%
81.88%
0.00%
0.00%
0.06%
0.08%
0.16%
0.64%
1.64%
9.67%
100.00%
AAA AA A BBB BB B CCC D
AAA
AA
A
BBB
BB
B
CCC
D
27
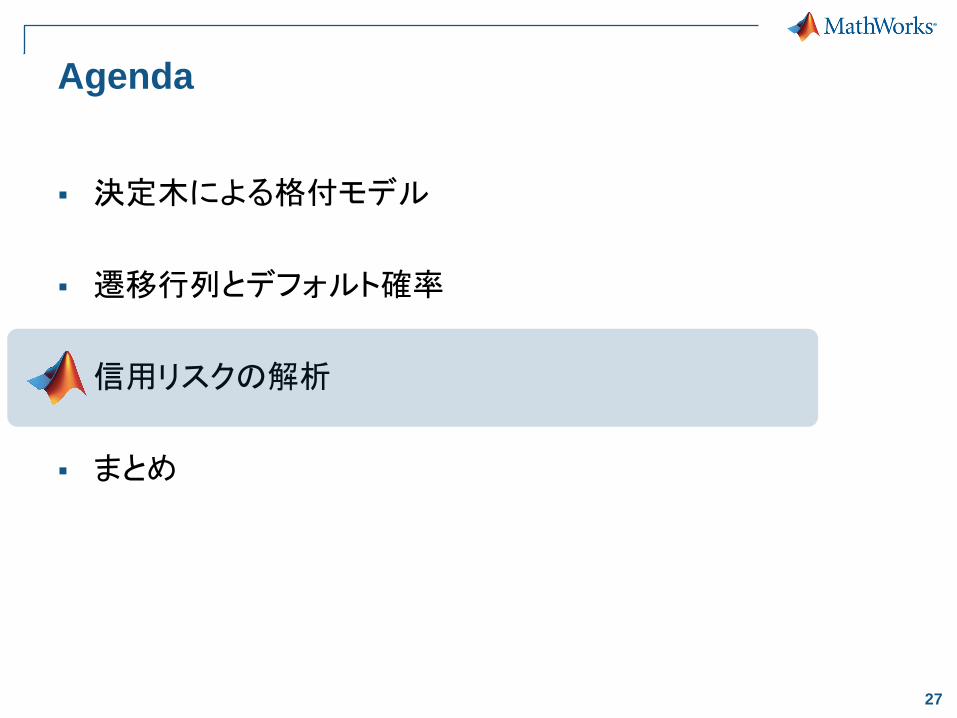
Agenda
決定木による格付モデル
遷移行列とデフォルト確率
信用リスクの解析
まとめ

28
利率
回収率
Market Data
Task 3: Credit Risk Analysis
Credit Value at Risk
債券ポートフォリオの信用VaRを計算
Historical Data
Rating System
Portfolio Data
格付け
クーポン・レート
日付
業種
優先順位
Transition
Probabilities
29
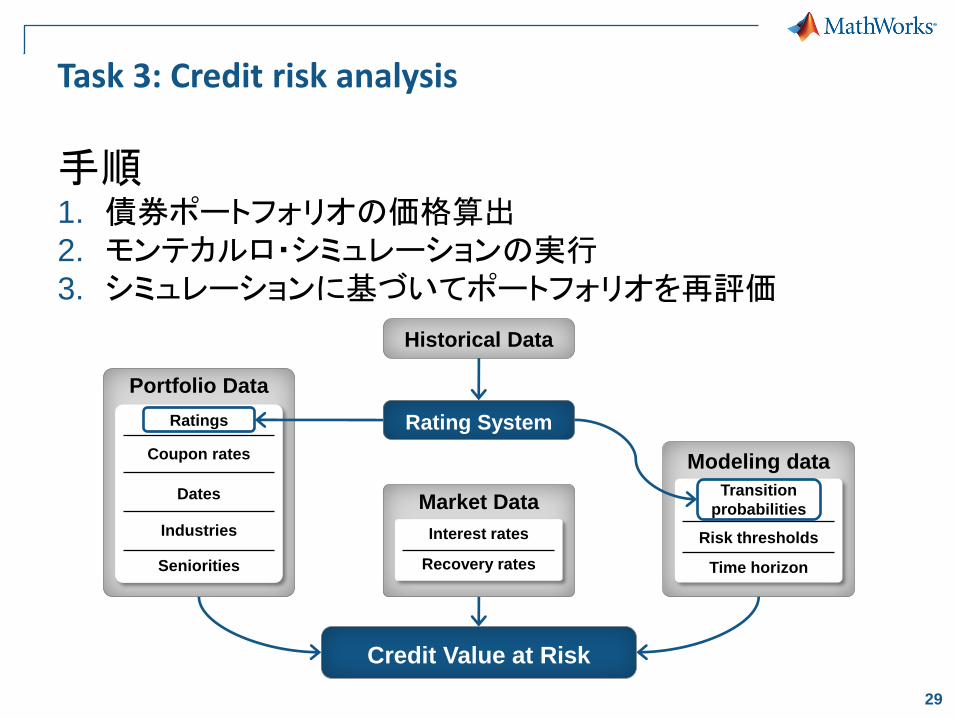
Task 3: Credit risk analysis
手順1. 債券ポートフォリオの価格算出2. モンテカルロ・シミュレーションの実行3. シミュレーションに基づいてポートフォリオを再評価
Interest rates
Recovery rates
Market Data
Portfolio Data
Ratings
Coupon rates
Dates
Industries
Seniorities
Transition
probabilities
Time horizon
Modeling data
Risk thresholds
Credit Value at Risk
Historical Data
Rating System
30
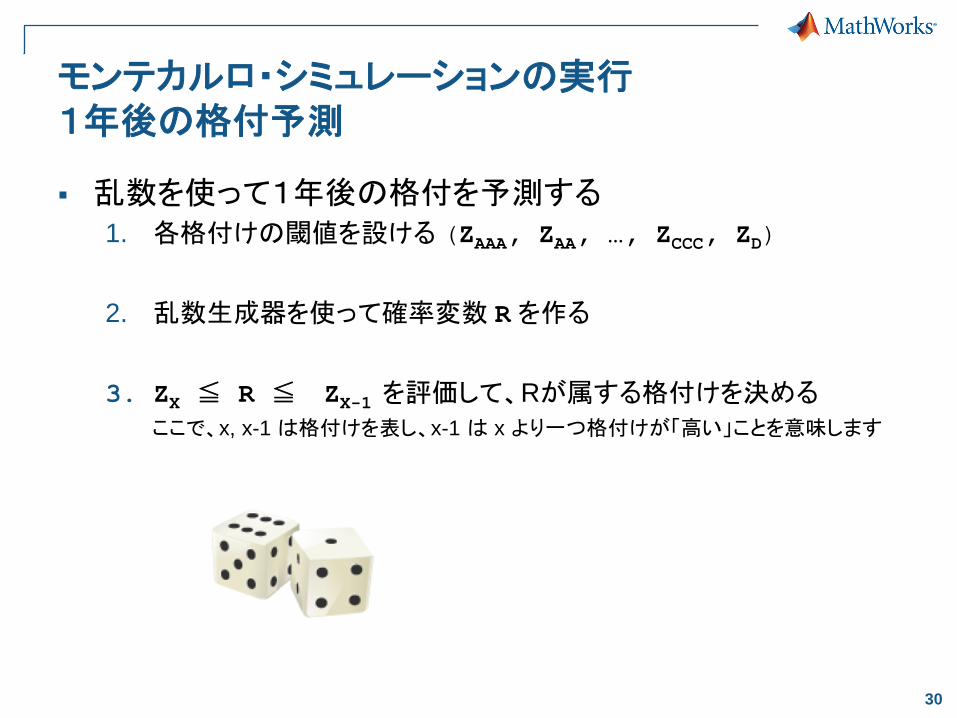
モンテカルロ・シミュレーションの実行1年後の格付予測
乱数を使って1年後の格付を予測する1. 各格付けの閾値を設ける (ZAAA, ZAA, …, ZCCC, ZD)
2. 乱数生成器を使って確率変数 R を作る
3. ZX ≦ R ≦ ZX-1 を評価して、Rが属する格付けを決める
ここで、x, x-1 は格付けを表し、x-1 は x より一つ格付けが「高い」ことを意味します
31
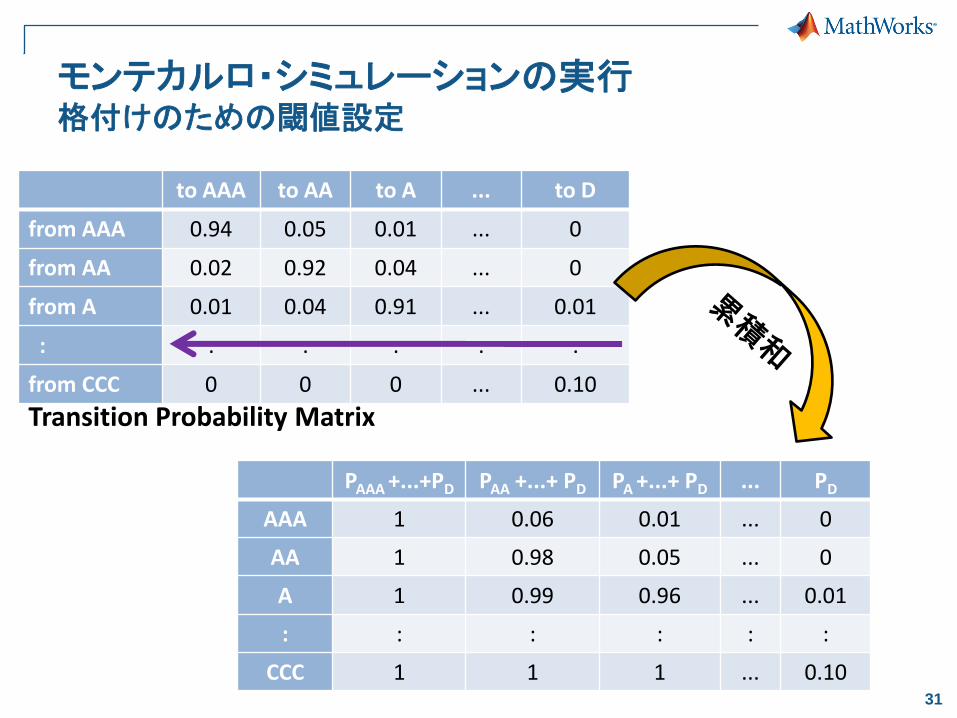
モンテカルロ・シミュレーションの実行格付けのための閾値設定
to AAA to AA to A ... to D
from AAA 0.94 0.05 0.01 ... 0
from AA 0.02 0.92 0.04 ... 0
from A 0.01 0.04 0.91 ... 0.01
: : : : : :
from CCC 0 0 0 ... 0.10
Transition Probability Matrix
PAAA +...+PD PAA +...+ PD PA +...+ PD ... PD
AAA 1 0.06 0.01 ... 0
AA 1 0.98 0.05 ... 0
A 1 0.99 0.96 ... 0.01
: : : : : :
CCC 1 1 1 ... 0.10
32
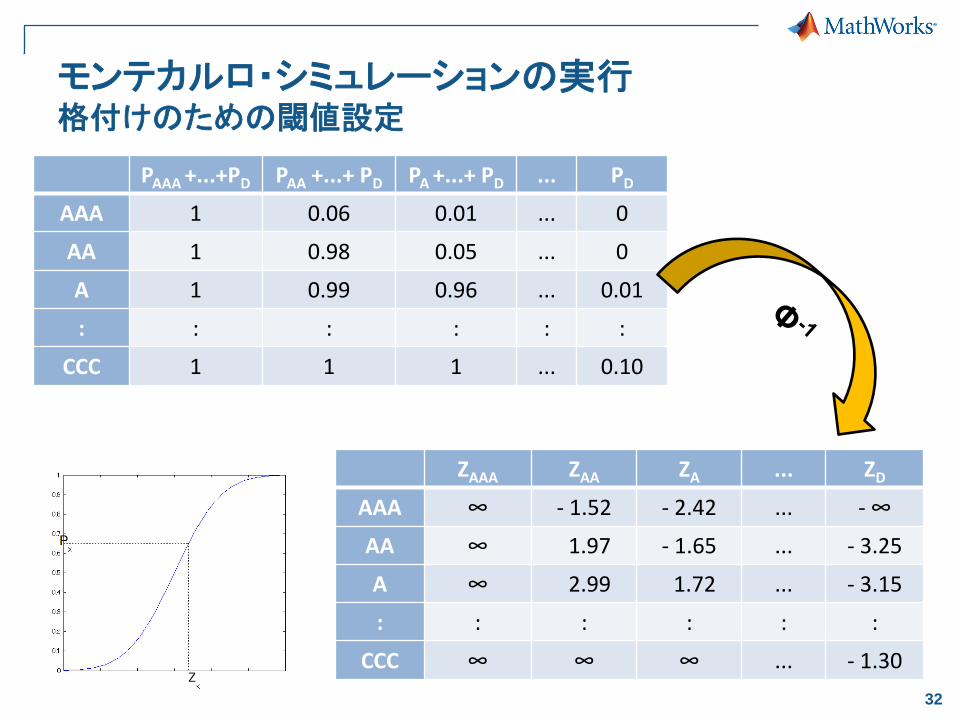
モンテカルロ・シミュレーションの実行格付けのための閾値設定
PAAA +...+PD PAA +...+ PD PA +...+ PD ... PD
AAA 1 0.06 0.01 ... 0
AA 1 0.98 0.05 ... 0
A 1 0.99 0.96 ... 0.01
: : : : : :
CCC 1 1 1 ... 0.10
ZAAA ZAA ZA ... ZD
AAA ∞ - 1.52 - 2.42 ... - ∞
AA ∞ 1.97 - 1.65 ... - 3.25
A ∞ 2.99 1.72 ... - 3.15
: : : : : :
CCC ∞ ∞ ∞ ... - 1.30
33
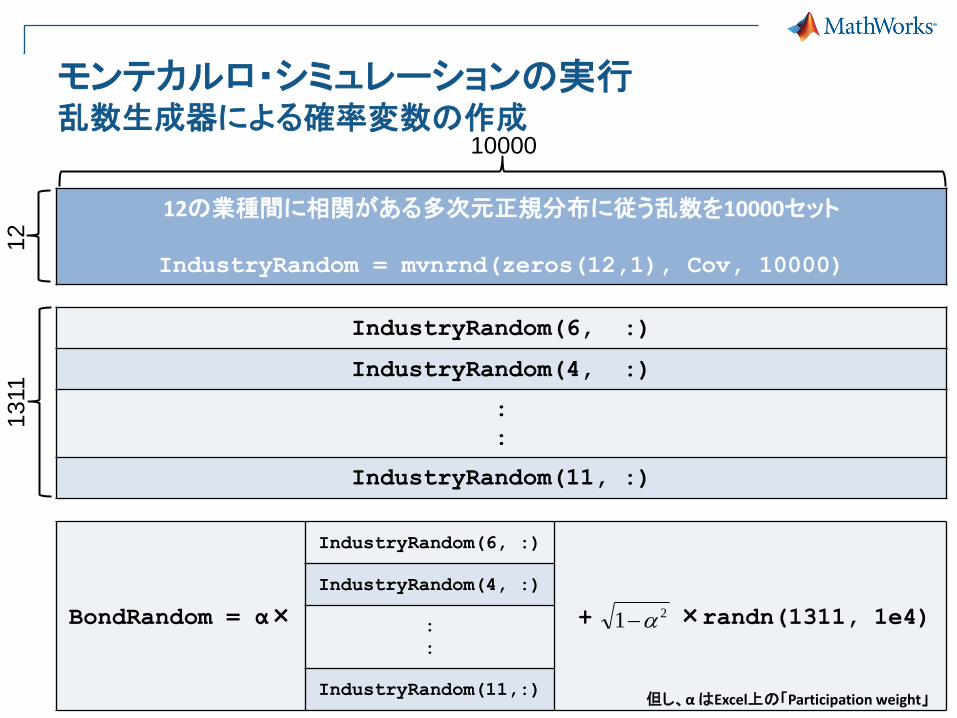
モンテカルロ・シミュレーションの実行乱数生成器による確率変数の作成
IndustryRandom(6, :)
IndustryRandom(4, :)
:
:
IndustryRandom(11, :)
12の業種間に相関がある多次元正規分布に従う乱数を10000セット
IndustryRandom = mvnrnd(zeros(12,1), Cov, 10000)
10000
12
1311
BondRandom = α×
IndustryRandom(6, :)
+ ×randn(1311, 1e4)
IndustryRandom(4, :)
:
:
IndustryRandom(11,:)
21
但し、α はExcel上の「Participation weight」

34
モンテカルロ・シミュレーションの実行確率変数がどの格付けに属するか評価
ZX ≦ BondRandom(n, :) ≦ ZX-1 を評価
• たとえば、n番目の債権がAAで先に作成した閾値ベクトルが
ZAAA ZAA ZA ZBBB ... ZCCC ZD
AA ∞ 1.97 - 1.65 -2.34 ... -3.24 -3.25
で、乱数により生成した BondRandom(n, :) のある成分の値が「-0.2735」とすると
ZA ≦ -0.2735 ≦ ZAA
という関係より、シミュレーションの結果は”ZAA “と判定される。

35
シミュレーションに基づいてポートフォリオを再評価
シミュレーションの結果、格付が「D」判定になった場合はSeniority (優先順位)に応じて、Β分布に従う乱数により回収率をシミュレーション
(デフォルト時の価格) = (額面価格) × ( に従う乱数)),( ba
但し、
2
2232
2
232
2
b
a

36
Speeding-Up MATLAB
”bsxfun”関数
「(m×n)行列と(m×1)ベクトル」をループなしで処理
bsxfun @plus,
,
=
37
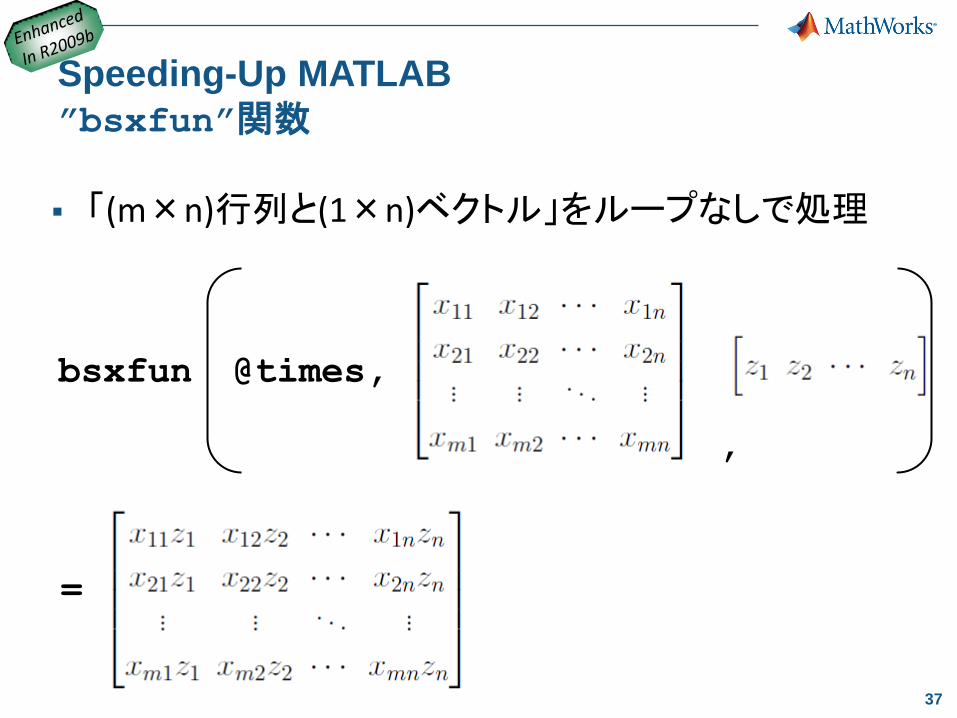
Speeding-Up MATLAB
”bsxfun”関数
「(m×n)行列と(1×n)ベクトル」をループなしで処理
=
bsxfun @times,
,

38
登場した関数
betarnd : Β分布に従う乱数生成
bsxfun : 行列とベクトルを要素ごとに演算
prbyzero : ゼロ・クーポン・イールドカーブから債券価格を算出
mvnrnd : 多次元正規分布に従う乱数生成
norminv : 正規分布の逆関数
prctile : パーセンタイル値の計算
R2009b
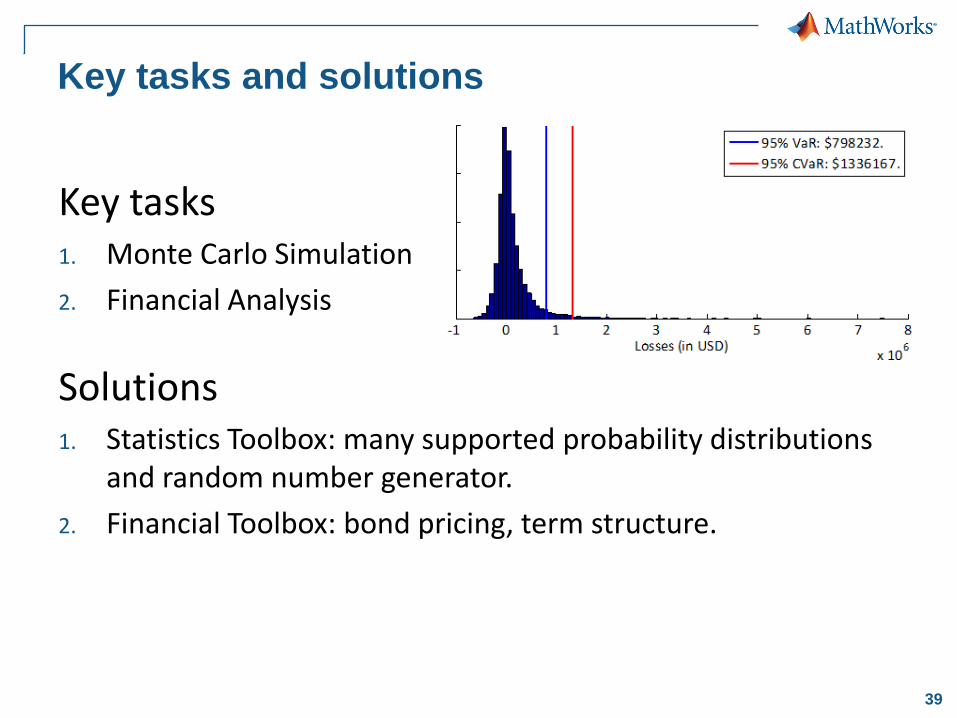
39
Key tasks1. Monte Carlo Simulation
2. Financial Analysis
Solutions1. Statistics Toolbox: many supported probability distributions
and random number generator.
2. Financial Toolbox: bond pricing, term structure.
Key tasks and solutions
40
Agenda
決定木による格付モデル
遷移行列とデフォルト確率
信用リスクの解析
まとめ
41
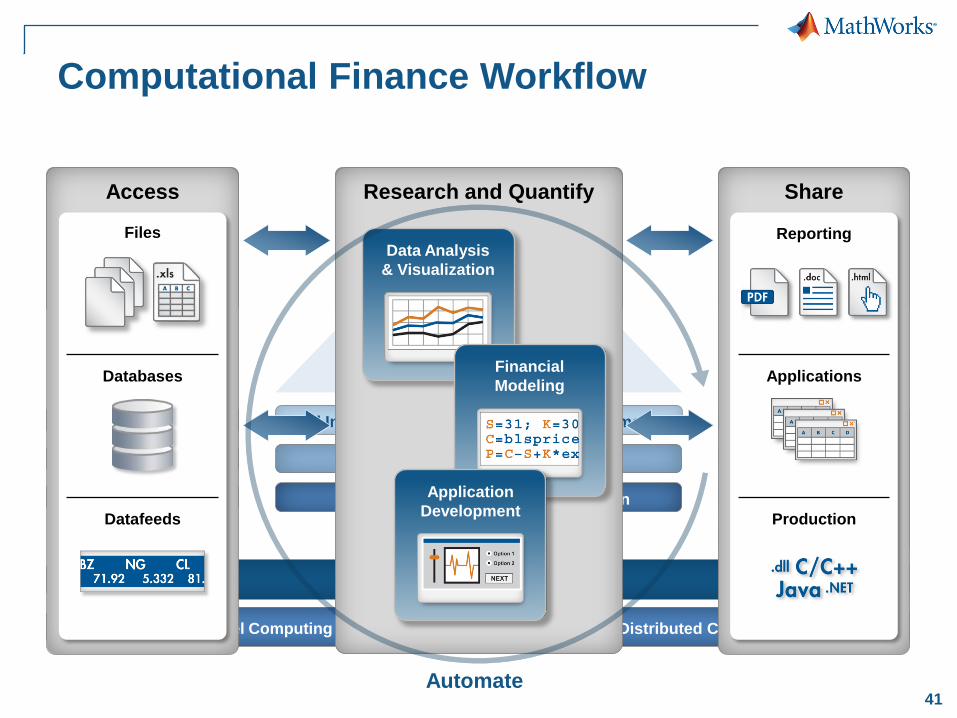
Computational Finance Workflow
Financial
Statistics Optimization
Fixed Income Financial Derivatives Econometrics
MATLAB
Parallel Computing MATLAB Distributed Computing Server
Files
Databases
Datafeeds
Access
Reporting
Applications
Production
Share
Data Analysis and Visualization
Financial Modeling
Application Development
Research and Quantify
Datafeed
Database
Spreadsheet Link EX
Builder NE
Builder EX
Builder JA
MATLAB Compiler
Rep
ort G
en
era
tor
Research and Quantify
Data Analysis
& Visualization
Financial
Modeling
Application
Development
Reporting
Applications
Production
Share
Automate
Files
Databases
Datafeeds
Access

42
標準モジュール生成と配布Excel VBAへの組込み

43
MATLABデスクトップ
End User
1
2
Toolboxes
標準モジュールの配布フロー
3
4
.dll
MATLAB Builder™ EX
MATLAB Compiler
MATLAB® Compiler™
44
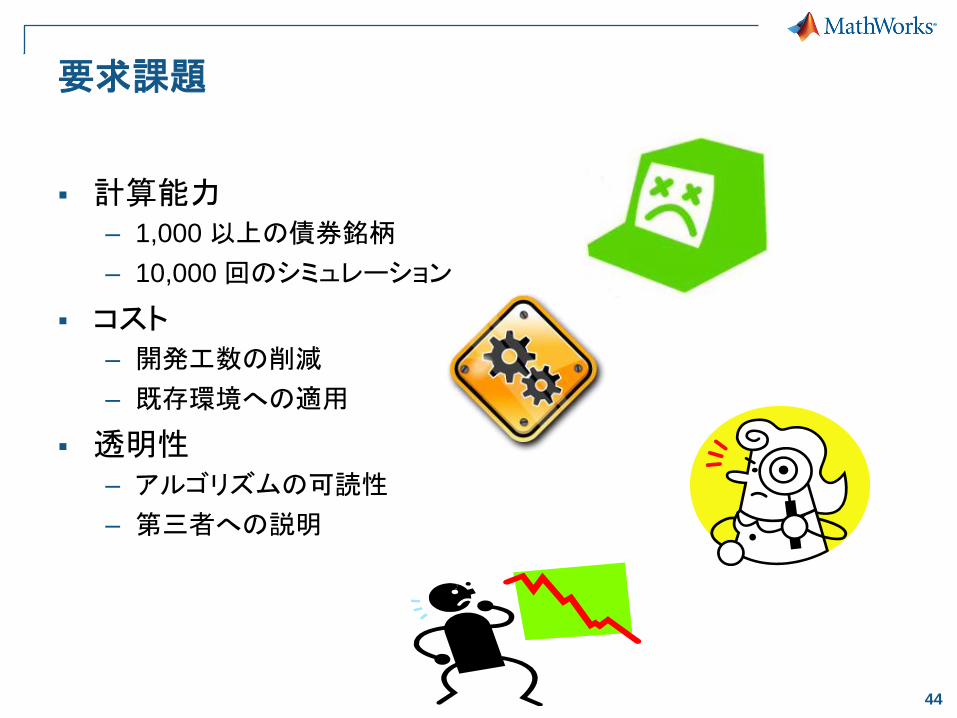
要求課題
計算能力– 1,000 以上の債券銘柄
– 10,000 回のシミュレーション
コスト– 開発工数の削減
– 既存環境への適用
透明性– アルゴリズムの可読性
– 第三者への説明
45
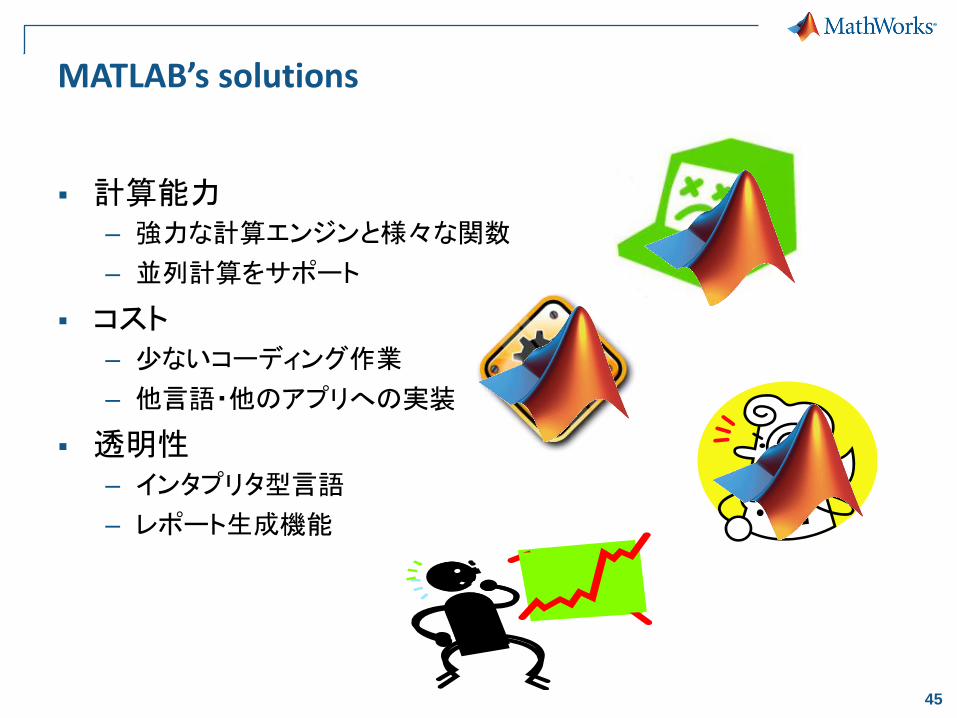
MATLAB’s solutions
計算能力– 強力な計算エンジンと様々な関数
– 並列計算をサポート
コスト– 少ないコーディング作業
– 他言語・他のアプリへの実装
透明性– インタプリタ型言語
– レポート生成機能

46
トレーニング サービス
投資 効果 トレーニング サービス 定期 トレーニング;
東京、名古屋、大阪にて定期開催
基礎コース(11)、応用コース(11)、
専門コース(4)を ご提供
オンサイト トレーニング; お客様サイトにて開催
ご要望に応じて3つのレベルでカリキュラムのカスタマイズが可能
投資対効果の最大化

47
Support and Community

48
Connections Program
More than 300 add-on products and services that
complement and extend MathWorks products:
Specialized third-party toolboxes for MATLAB
Interfaces to third-party software and hardware products
Specialized training courses and consulting services
System integrators and suppliers that incorporate
MathWorks products
49
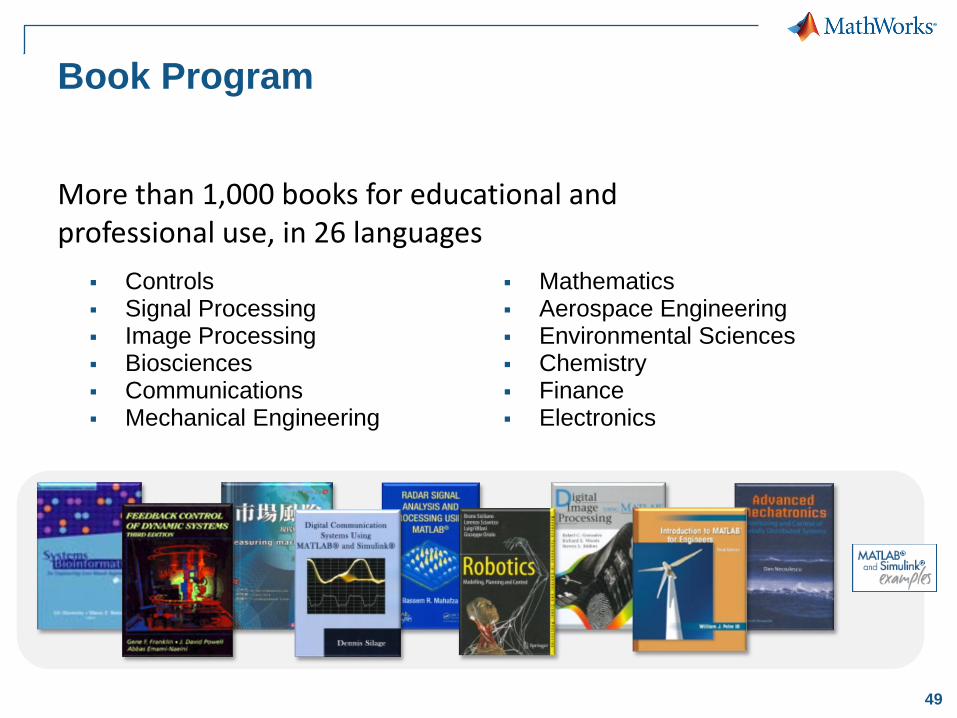
Book Program
Controls Signal Processing Image Processing Biosciences Communications Mechanical Engineering
Mathematics Aerospace Engineering Environmental Sciences Chemistry Finance Electronics
More than 1,000 books for educational and professional use, in 26 languages

50
Technical Support
Resources
Over 100 support engineers
– All with MS degrees (EE, ME, CS)
– Local support in North America,
Europe, and Asia
Comprehensive, product-specific Web
support resources
High customer satisfaction
95% of calls answered
within three minutes
70% of issues resolved
within 24 hours
80% of customers surveyed
rate satisfaction at 80-100%