Embed Size (px)
Citation preview

The Metabochip, a Custom Genotyping Array for GeneticStudies of Metabolic, Cardiovascular, andAnthropometric TraitsBenjamin F. Voight1,2., Hyun Min Kang3., Jun Ding4, Cameron D. Palmer1,5, Carlo Sidore3,6,7,
Peter S. Chines8, Noel P. Burtt1, Christian Fuchsberger3, Yanming Li3, Jeanette Erdmann9,
Timothy M. Frayling10, Iris M. Heid11,12, Anne U. Jackson3, Toby Johnson13, Tuomas O. Kilpelainen14,
Cecilia M. Lindgren15, Andrew P. Morris15, Inga Prokopenko15,16, Joshua C. Randall15, Richa Saxena1,17,18,
Nicole Soranzo19, Elizabeth K. Speliotes1,20, Tanya M. Teslovich3, Eleanor Wheeler19, Jared Maguire1,
Melissa Parkin1, Simon Potter19, N. William Rayner15,16,19, Neil Robertson15,16, Kathleen Stirrups19,
Wendy Winckler1, Serena Sanna6, Antonella Mulas6, Ramaiah Nagaraja4, Francesco Cucca6,7,
Ines Barroso19,21, Panos Deloukas19, Ruth J. F. Loos14, Sekar Kathiresan1,17,22,23, Patricia B. Munroe13,
Christopher Newton-Cheh1,17,22,23, Arne Pfeufer24,25,26, Nilesh J. Samani27,28, Heribert Schunkert9,
Joel N. Hirschhorn1,5,29, David Altshuler1,17,23,29,30,31*, Mark I. McCarthy15,16,32*, Goncalo R. Abecasis3*,
Michael Boehnke3*
1 Medical Population Genetics, The Broad Institute of Harvard and Massachusetts Institute of Technology, Cambridge, Massachusetts, United States of America,
2 Department of Pharmacology, University of Pennsylvania Perelman School of Medicine, Philadelphia, Pennsylvania, United States of America, 3 Department of
Biostatistics, Center for Statistical Genetics, University of Michigan, Ann Arbor, Michigan, United States of America, 4 Laboratory of Genetics, National Institute on Aging,
National Institutes of Health, Baltimore, Maryland, United States of America, 5 Divisions of Endocrinology and Genetics and Program in Genomics, Children’s Hospital,
Boston, Massachusetts, United States of America, 6 Istituto di Ricerca Genetica e Biomedica, Consiglio Nazionale delle Ricerche (CNR), Monserrato, Italy, 7 Dipartimento di
Scienze Biomediche, Universita di Sassari, Sassari, Italy, 8 Genome Technology Branch, National Human Genome Research Institute, Bethesda, Maryland, United States of
America, 9 Universitat zu Lubeck, Medizinische Klinik II, and Nordic Center of Cardiovascular Research, Lubeck, Germany, 10 Genetics of Complex Traits, Peninsula College
of Medicine and Dentistry, University of Exeter, Exeter, United Kingdom, 11 Department of Epidemiology and Preventive Medicine, University Hospital Regensburg,
Regensburg, Germany, 12 Helmholtz Zentrum Munchen—German Research Center for Environmental Health, Institute of Epidemiology, Neuherberg, Germany,
13 Clinical Pharmacology and Barts and the London Genome Centre, William Harvey Research Institute, Barts and the London School of Medicine, Queen Mary University
of London, London, United Kingdom, 14 MRC Epidemiology Unit, Institute of Metabolic Science, Addenbrooke’s Hospital, Cambridge, United Kingdom, 15 Wellcome Trust
Centre for Human Genetics, University of Oxford, Oxford, United Kingdom, 16 Oxford Centre for Diabetes, Endocrinology, and Metabolism, Churchill Hospital, University of
Oxford, Oxford, United Kingdom, 17 Center for Human Genetic Research, Massachusetts General Hospital, Boston, Massachusetts, United States of America,
18 Department of Anesthesia, Critical Care and Pain Medicine, Massachusetts General Hospital, Boston, Massachusetts, United States of America, 19 Wellcome Trust
Sanger Institute, Hinxton, Cambridge, United Kingdom, 20 Department of Internal Medicine, Division of Gastroenterology and Center for Computational Medicine and
Bioinformatics, University of Michigan, Ann Arbor, Michigan, United States of America, 21 University of Cambridge Metabolic Research Laboratories, Institute of Metabolic
Science, Addenbrooke’s Hospital, Cambridge, United Kingdom, 22 Cardiovascular Research Center and Cardiology Division, Massachusetts General Hospital, Boston,
Massachusetts, United States of America, 23 Department of Medicine, Harvard Medical School, Boston, Massachusetts, United States of America, 24 Institute of Human
Genetics, Klinikum Rechts der Isar Technische Universitat Munchen, Munich, Germany, 25 Institute of Human Genetics, Helmholtz Zentrum Munchen, Deutsches
Forschungszentrum fur Gesundheit und Umwelt, Neuherberg, Germany, 26 EURAC Center of Biomedicine, Bolzano, Italy, 27 Department of Cardiovascular Sciences,
Glenfield Hospital, University of Leicester, Leicester, United Kingdom, 28 Leicester NIHR Biomedical Research Unit in Coronary Artery Disease, Glenfield Hospital, Leicester,
United Kingdom, 29 Department of Genetics, Harvard Medical School, Boston, Massachusetts, United States of America, 30 Department of Molecular Biology, Harvard
Medical School, Boston, Massachusetts, United States of America, 31 Diabetes Unit, Massachusetts General Hospital, Boston, Massachusetts, United States of America,
32 Oxford NIHR Biomedical Research Centre, Churchill Hospital, Oxford, United Kingdom
Abstract
Genome-wide association studies have identified hundreds of loci for type 2 diabetes, coronary artery disease andmyocardial infarction, as well as for related traits such as body mass index, glucose and insulin levels, lipid levels, and bloodpressure. These studies also have pointed to thousands of loci with promising but not yet compelling association evidence.To establish association at additional loci and to characterize the genome-wide significant loci by fine-mapping, wedesigned the ‘‘Metabochip,’’ a custom genotyping array that assays nearly 200,000 SNP markers. Here, we describe theMetabochip and its component SNP sets, evaluate its performance in capturing variation across the allele-frequencyspectrum, describe solutions to methodological challenges commonly encountered in its analysis, and evaluate itsperformance as a platform for genotype imputation. The metabochip achieves dramatic cost efficiencies compared todesigning single-trait follow-up reagents, and provides the opportunity to compare results across a range of related traits.The metabochip and similar custom genotyping arrays offer a powerful and cost-effective approach to follow-up large-scalegenotyping and sequencing studies and advance our understanding of the genetic basis of complex human diseases andtraits.
PLoS Genetics | www.plosgenetics.org 1 August 2012 | Volume 8 | Issue 8 | e1002793
Citation: Voight BF, Kang HM, Ding J, Palmer CD, Sidore C, et al. (2012) The Metabochip, a Custom Genotyping Array for Genetic Studies of Metabolic,Cardiovascular, and Anthropometric Traits. PLoS Genet 8(8): e1002793. doi:10.1371/journal.pgen.1002793
Editor: Greg Gibson, Georgia Institute of Technology, United States of America
Received December 6, 2011; Accepted May 13, 2012; Published August 2, 2012
Copyright: � 2012 Voight et al. This is an open-access article distributed under the terms of the Creative Commons Attribution License, which permitsunrestricted use, distribution, and reproduction in any medium, provided the original author and source are credited.
Funding: Support from the National Institutes of Health (HG000376, HG005214, HG005581, DK062370, NO1-AG-1-2109), the Wellcome Trust (098051), the BritishHeart Foundation, and the Leicester NIHR Biomedical Research Unit in Cardiovascular Disease is gratefully acknowledged. The funders had no role in study design,data collection and analysis, decision to publish, or preparation of the manuscript.
Competing Interests: The authors have declared that no competing interests exist.
* E-mail: [email protected] (MB); [email protected] (DA); [email protected] (MIM); [email protected] (GRA)
. These authors contributed equally to this work.
Introduction
Recent data emerging from theoretical models [1,2] and
empirical observation through genome-wide association studies
(GWAS) (for example [3,4]) demonstrate that hundreds of genetic
loci contribute to complex traits in humans. These data prompt
two questions: (1) can additional genetic loci be identified by
follow-up of the most significantly associated variants after initial
GWAS meta-analysis? and (2) can further investigation via genetic
fine-mapping refine association signals at established genetic loci?
Systematically addressing these two questions should help improve
understanding of the genetic architecture of complex traits and
their shared genetic determinants, and suggest hypotheses and
disease mechanisms that can be tested in functional experiments or
model systems [5].
Addressing these two questions requires genotyping thousands of
individuals at many genetic markers. For most currently available
genotyping technologies, this kind of characterization is cost-
prohibitive. To address this need in the context of type 2 diabetes,
coronary artery disease and myocardial infarction, and quantitative
traits related to these diseases, we designed the Metabochip, a
custom genotyping array that provides accurate and cost-effective
genotyping of nearly 200,000 single nucleotide polymorphisms
(SNPs) chosen based on GWAS meta-analyses of 23 traits (Table 1).
Metabochip SNPs were selected from the catalogs developed by the
International HapMap [6] and 1000 Genomes [7] Projects,
allowing inclusion of SNPs across a wide range of the allele
frequency spectrum. These included 63,450 SNPs to follow-up the
top ,5,000 or ,1,000 (see Methods) independent association
signals for each of the 23 traits, 122,241 SNPs to fine-map 257 loci
which showed genome-wide significant evidence for association
with one or more of the 23 traits, and 16,992 SNPs chosen for a
variety of other reasons (see Methods and Table 2). In designing the
array, we sought to maximize assay success rates as well as the
number of variants that could be assayed; Illumina custom arrays
include a fixed number of ‘‘beads’’ and some sites can be assayed
with a single bead while others require two [8].
Here, we describe Metabochip array design, and evaluate
performance of the array in common genetic analysis steps,
including quality control steps such as genomic control calculations,
identification of related individuals, and fine-mapping of known
disease susceptibility loci. Our results provide practical guidance to
investigators and show that for fine-mapping loci the Metabochip
provides much greater resolution than prior GWAS arrays.
Methods
Core Features of the Metabochip: Traits and SNPsThe Metabochip was designed by representatives of the Body
Fat Percentage [9], CARDIoGRAM (coronary artery disease and
myocardial infarction) [10], DIAGRAM (type 2 diabetes) [11],
GIANT (anthropometric traits) [3,12,13], Global Lipids Genetics
(lipids) [4], HaemGen (hematological measures) [14], ICBP (blood
pressure) [15], MAGIC (glucose and insulin) [16–18], and QT-
IGC (QT interval) [19,20] GWAS meta-analysis consortia. The
array is comprised of SNPs selected across two tiers of traits
(Table 1). Tier 1 is comprised of eleven traits deemed to be of
primary interest: type 2 diabetes (T2D), fasting glucose, coronary
artery disease and myocardial infarction (CAD/MI), low density
lipoprotein (LDL) cholesterol, high density lipoprotein (HDL)
cholesterol, triglycerides, body mass index (BMI), systolic and
diastolic blood pressure, QT interval, and waist-to-hip ratio
adjusted for BMI (WHR). Tier 2 is comprised of twelve traits of
secondary interest: fasting insulin, 2-hour glucose, glycated
hemoglobin (HbA1c), T2D age of diagnosis, early onset T2D
(diagnosis age,45 years), waist circumference adjusted for BMI,
height, body fat percentage, total cholesterol, platelet count, mean
platelet volume, and white blood cell count.
We included three design classes of SNPs on the Metabochip
(Table 2):
1. Replication SNPs: ,5,000 (Tier 1) or ,1,000 (Tier 2) SNPs
were selected to follow-up the top independent association
signals from the largest available GWAS meta-analysis for each
of the 23 traits (Supplementary Table S1).
2. Fine-mapping SNPs: SNPs were selected from the catalogs of the
International HapMap Project [6] and the August 2009 release
of the 1000 Genomes Project [7] to fine-map 257 loci associated
at genome-wide significance (P,561028) in preliminary anal-
yses of one or more of the 23 traits (See Figure 1, Supplementary
Table S2 and S3, and Supplementary Text for details).
3. Other SNPs: These were comprised of independent SNPs for
which genome-wide significant associations had been reported
for any trait, SNP tags for copy number polymorphisms
(CNPs), the MHC region, and the mitochondrial genome,
fingerprint SNPs from GWA array products, a set of
chromosome X and Y markers for sex verification, and
‘‘wild-card’’ SNPs based on consortium-specific hypotheses and
interests (for example, based on a known pathway or early
deep-sequencing studies). A detailed description of how SNPs
were selected in each of these categories can be found in the
Supplementary Text [21–25].
In total, 217,695 SNPs were chosen for the array (Table 2).
20,970 SNPs (9.6%) failed during the assay manufacturing process,
resulting in 196,725 SNPs available for genotyping. A summary
file annotating each Metabochip SNP with ascertainment criteria,
SNP assay, a list of unintended duplicate SNPs (Supplementary
Table S4), and reference strand orientation for alleles is provided
at http://www.sph.umich.edu/csg/kang/MetaboChip/.
Metabochip Array Design
PLoS Genetics | www.plosgenetics.org 2 August 2012 | Volume 8 | Issue 8 | e1002793

Data Generation and Quality Control (QC)We evaluated the utility of the Metabochip and accuracy of its
genotype calls in three sample sets: (1) 15,896 northern European
individuals from the FUSION, METSIM, HUNT, Tromsø, and
Diagen studies [26–30] together with 67 HapMap samples
genotyped at least two times each and called using Illumina
GenomeStudio software by re-clustering these data; (2) 6,614
Sardinian individuals organized in 1,243 extended families from
the SardiNIA study [31,32] called by GenomeStudio software
using default cluster data; and (3) 9,715 Nordic individuals from
the Malmø Preventive Project, the Scania Diabetes Registry, and
the Botnia Study [33–35] genotyped using a modified version of
the BIRDSEED genotype calling algorithm [36].
We applied standard SNP- and sample-based QC filters based
on call rate, Hardy-Weinberg equilibrium deviations, duplicate
genotype inconsistencies, and failures of Mendelian inheritance; in
the Nordic sample, we also carried out checks based on plate-
specific characteristics. These filters resulted in final data sets of
163,222 polymorphic SNPs genotyped in 67 HapMap samples,
142,812 polymorphic SNPs genotyped in 6,164 Sardinians, and
Table 1. Summary of Metabochip SNPs by trait: Fine-mapping and replication.
Consortium Trait Name Fine Mapping Replication SNPs
# Loci Size (Mb) # SNPs
Tier 1
DIAGRAM Type 2 Diabetes 34 6.56 16,717 5,057
CARDIoGRAM MI and CAD 30 9.60 19,558 6,485
Lipids HDL Cholesterol 23 4.62 12,150 5,024
LDL Cholesterol 21 4.06 9,981 5,060
Triglyceride 20 4.68 9,784 5,057
GIANT Body Mass Index 24 7.48 18,211 5,055
Waist-to-Hip Ratio* 15 2.25 5,464 5,056
MAGIC Fasting Glucose 19 5.05 13,644 5,058
ICBP Diastolic Blood Pressure 20 8.34 13,239 5,060
Systolic Blood Pressure 21 6.01 10,641 5,059
QT-IGC QT Interval 18 4.08 10,910 5,041
Tier 2
DIAGRAM T2D Age of Diagnosis 0 0.00 0 1,039
T2D Early Onset 0 0.00 0 1,040
HaemGen Mean Platelet Volume 0 0.00 0 657
Platelet Count 0 0.00 0 577
White Blood Cell 0 0.00 0 598
Lipids Total Cholesterol 0 0.00 0 941
Body Fat Body Fat Percentage 0 0.00 0 1,035
GIANT Height 0 0.00 0 1,050
Waist Circumference* 2 0.50 1,374 1,048
MAGIC 2-Hour Glucose 3 0.61 1,249 1,038
Glycated Hemoglobin 5 0.46 2,181 1,045
Fasting Insulin 2 0.67 1,309 1,046
TOTAL With Redundancy 257 64.97 146,453 68,126
Unique Regions/SNPs 257 45.52 122,241 63,450
SNP counts are numbers of SNPs successfully manufactured on the Metabochip array.*Waist-to-hip ratio and waist circumference were adjusted for body mass index.doi:10.1371/journal.pgen.1002793.t001
Author Summary
Recent genetic studies have identified hundreds of regionsof the human genome that contribute to risk for type 2diabetes, coronary artery disease and myocardial infarction,and to related quantitative traits such as body mass index,glucose and insulin levels, blood lipid levels, and bloodpressure. These results motivate two central questions: (1)can further genetic investigation identify additional associ-ated regions?; and (2) can more detailed genetic investiga-tion help us identify the causal variants (or variants morestrongly correlated with the causal variants) in the regionsidentified so far? Addressing these questions requiresassaying many genetic variants in DNA samples fromthousands of individuals, which is expensive and time-consuming when done a few SNPs at a time. To facilitatethese investigations, we designed the ‘‘Metabochip,’’ acustom genotyping array that assays variation in nearly200,000 sites in the human genome. Here we describe theMetabochip, evaluate its performance in assaying humangenetic variation, and describe solutions to methodologicalchallenges commonly encountered in its analysis.
Metabochip Array Design
PLoS Genetics | www.plosgenetics.org 3 August 2012 | Volume 8 | Issue 8 | e1002793

179,165 polymorphic SNPs genotyped in 8,473 Nordic individ-
uals.
Statistical Analysis Using Metabochip: Genomic Control,PCA, and Kinship Estimation
Since Metabochip SNPs were selected to be associated with our
23 traits of interest, performing genomic control correction [37]
requires some care. To select a set of (near)-independent SNPs that
are not associated with an analysis trait of interest, we focused on
SNPs selected to replicate signals unrelated to the trait of interest
(for example, QT interval SNPs for a T2D association analysis),
also removing SNPs within 250 kb of SNPs previously associated
with the trait of interest, and then LD-pruning the remaining
SNPs so that no SNP pair is in strong LD (r2..3).
To estimate kinship coefficients or to correct for population
stratification using principal components analysis (PCA) or
multidimensional scaling (MDS) covariates, we require SNPs that
are not too rare and are not in strong pairwise LD. We found that
taking SNPs with MAF..05 and LD-pruning them so that no
SNP pair has r2..3 works well for PCA and MDS (data not
shown). The same subset of SNPs can be used for pairwise IBD
estimation using the maximum-likelihood method of Milligan [38]
implemented in PLINK [39] or the variance-components method
of Balding and Nichols [40] implemented in EMMAX [41].
Imputation Preparation and EvaluationWe carried out genotype imputation in the Sardinian data. We
imputed variants observed in a reference set of 280 Europeans
from the August 2010 1000 Genomes Project data into: (a) 6,164
individuals genotyped on the Metabochip [32], (b) 1,097
individuals genotyped on the Affymetrix 6.0 array, and (c) 1,412
individuals genotyped on the Affymetrix 500 K array [42]. We
evaluated mean estimated r2 within fine-mapping regions using
minimac ([43]; www.genome.sph.umich.edu/wiki/minimac), and
empirically compared the imputation quality using the published
Sanger sequencing data in five fine mapping loci [32]. In addition,
we evaluated mean estimated r2 across different continental
populations by leaving one individual out from the 1000 Genomes
reference panel and imputing them using markers present in each
platform across the fine mapping regions and a 1 Mb window
flanking each region. We also compared association power
obtained by imputation into GWAS and Metabochip samples in
Metabochip fine-mapping regions by comparing LDL cholesterol
association evidence in 2,342 of these individuals genotyped using
both the Metabochip and one of the Affymetrix arrays.
Results
Evaluation of Array Design and Genotype QualityOf 217,695 SNPs chosen for the Metabochip across all design
categories, 196,725 (90.4%) were successfully manufactured on the
array (Table 2). The 48,846 previously manufactured SNPs had
higher success rate (95.4%) than the 168,849 new SNP assays
(88.7%). Illumina design score was predictive of the quality of
manufactured SNP assays. For example, 25% of SNPs with design
score,0.6 failed to produce genotype calls due to poor clustering
of the intensity data, compared to 3.1% of SNPs with design score
between 0.6 and 1.0 (Supplementary Figure S1).
We evaluated genotype calling accuracy for 67 HapMap
samples genotyped multiple times using three different calling
strategies: (a) Illumina GenomeStudio with reclustering the
intensity data using .15,000 samples; (b) Illumina GenomeStudio
based on default clusters provided by Illumina; and (c) GenoSNP
[44], which calls genotypes based on a within-sample-between-
markers analysis of intensity data rather than a between-sample-
within-marker analysis.
The large majority of Metabochip SNPs yielded high quality
genotypes. For the 67 HapMap samples called using GenomeS-
tudio with reclustering, only 8,344 (4.2%) of the 196,725 SNP
assays had genotype call rates ,95%, while another 25,958 SNPs
(13.2%) were monomorphic. Using GenomeStudio and default
clusters, these numbers were 12,131 (6.2%) and 25,311 (12.9%),
while using GenoSNP, they were 18,107 (9.2%) and 25,532
(13.0%).
Using GenomeStudio with reclustering, genotype concordance
between Metabochip genotypes for duplicate pairs was 99.998%
overall and 99.990% for heterozygotes. Comparing Metabochip
genotypes to HapMap 3 genotypes for the 59,935 SNPs in
common, genotype concordance was 99.93% overall and 99.84%
for heterozygotes, similar to the 99.87% Mendelian consistency
rate reported in the HapMap3 data [45]. We observed similar
concordance rates for these sample sets using the Illumina caller
with default clusters (99.93% overall, 99.84% for heterozygotes),
or using GenoSNP [44] (99.85% overall, 99.81% for heterozy-
gotes).
Table 2. Summary of Metabochip SNPs by SNP category.
SNP Category Chosen for Array Passed Manufacture Among 67 HapMap samples
.95% Called MAF.0 MAF,.05
Replication 66,130 63,450 (95.9%) 61,386 (96.7%) 60,585 (98.7%) 6,121 (10.1%)
Fine-Mapping 139,877 122,241 (87.4%) 116,779 (95.5%) 92,731 (79.4%) 37,552 (40.5%)
Prior Trait Association 2,210 2,116 (95.7%) 2,043 (96.5%) 2,039 (99.8%) 235 (11.5%)
CNP tags 6,888 6,626 (96.2%) 6,250 (94.3%) 6,160 (98.6%) 941 (15.3%)
MHC 3,203 2,909 (90.8%) 2,550 (87.7%) 2,537 (99.5%) 185 (7.3%)
Mitochondrial 144 135 (93.8%) 102 (75.6%) 66 (64.7%) 28 (42.4%)
Chromosome X/Y 112 107 (95.5%) 106 (99.1%) 104 (98.1%) 0 (0%)
Fingerprint 46 43 (93.5%) 40 (93.0%) 40 (100%) 0 (0%)
Wildcard 5,323 5,056 (95.0%) 4,847 (95.9%) 4,108 (84.8%) 493 (12.0%)
TOTAL (without redundancy) 217,695 196,725 (90.4%) 188,395 (95.8%) 163,107 (86.6%) 44,967 (27.6%)
Numbers in parenthesis represents the proportion of the SNPs in the previous column. A SNP may fall into multiple categories.doi:10.1371/journal.pgen.1002793.t002
Metabochip Array Design
PLoS Genetics | www.plosgenetics.org 4 August 2012 | Volume 8 | Issue 8 | e1002793
Genotype concordance for less common variants was slightly
lower than for common variants. For example, among the
singleton SNPs in the 67 HapMap samples, 98.9% of heterozy-
gous genotypes were concordant with HapMap3 for the two
GenomeStudio call sets and 97.8% for the GenoSNP set.
Heterozygous genotype concordances for singleton SNPs between
duplicate pairs were 99.76%, 99.70%, and 99.83% for the three
call sets.
Frequency Spectrum and CoverageWe evaluated the allele frequency spectrum for Metabochip
SNPs in the 67 HapMap samples (Figure 2). Mean MAF of
Metabochip SNPs was .152 overall, .109 among fine-mapping
SNPs, and .224 among replication SNPs. Among these three SNP
sets, 38%, 53%, and 12% of SNPs had MAF,.05, and 14%, 21%,
and 2% were monomorphic.
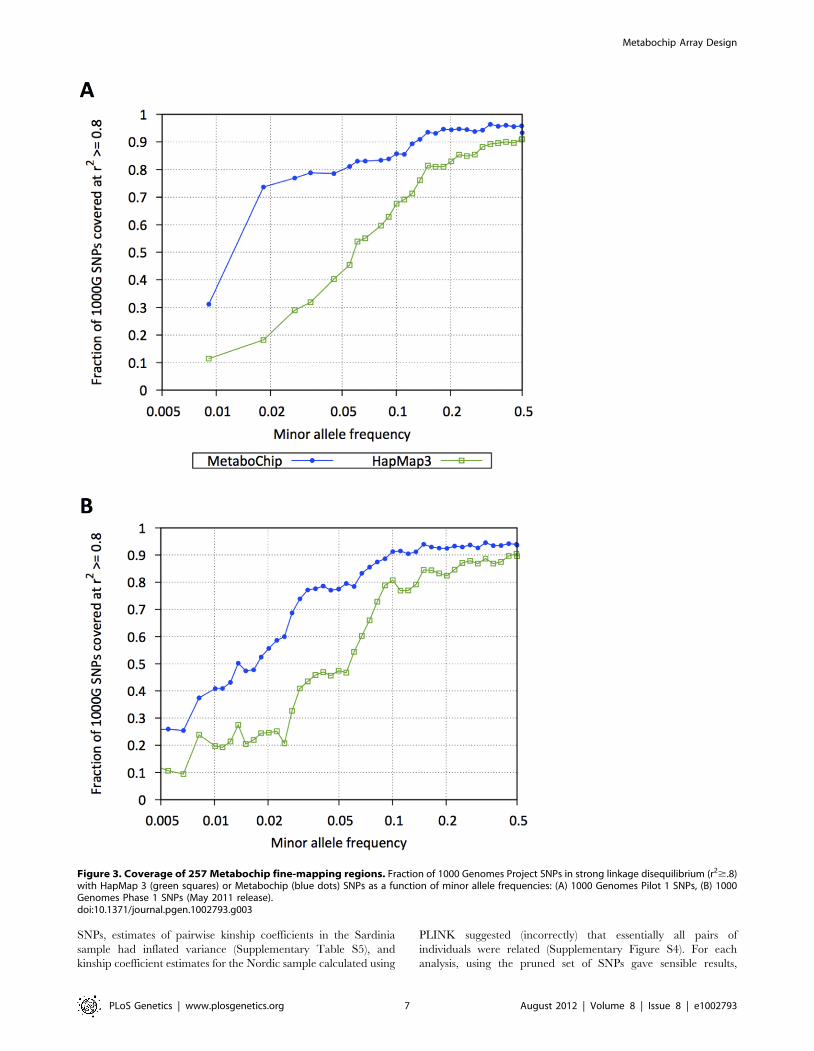
Within the 257 fine-mapping regions (45.52 Mb), 109,855 SNPs
were catalogued by the 1000 Genomes Project [7] pilot studies
and 240,805 SNPs are in the current Phase 1 release (as of
November 2011). Of these, 122,241 fine-mapping SNPs were
genotyped on the Metabochip (Supplementary Table S2). In the
1000 Genomes European samples, Metabochip SNPs tag 82.0%
and 54.5% of all Pilot and Phase 1 1000 Genomes variants in
these regions at r2$.8, compared to 61.3% and 40.3% coverage
using HapMap 3 SNPs (Figure 3). Among SNPs with MAF,.05,
Metabochip SNPs tag 61.9% and 33.8% at r2$.8, compared to
24.3% and 17.0% using HapMap 3. Using genotype imputation,
we can impute 82% of 1000 Genomes Phase 1 European SNPs
with MAF.0.5% with an estimated r2$0.8.
Genotype Imputation within the Metabochip Fine-Mapping Regions
We next investigated accuracy of genotype imputation into the
257 Metabochip fine-mapping regions using the 280 Europeans
from 1000 Genomes Project [7] as reference set and the 6,164
individuals in the Sardinian Metabochip sample as target. Figure 3
displays estimated r2 values in the Metabochip fine-mapping
regions as a function of MAF. Also displayed are estimated r2
values for SNPs in these regions using the 280 European 1000
Genomes project samples as reference set and 1,412 Sardinians
genotyped on the Affymetrix 500 K and 1,097 Sardinians
genotyped on the Affymetrix 6.0 chips as targets. Imputation
accuracy into the Sardinian Metabochip sample is greater in all
allele frequency ranges than for the samples genotyped using the
GWAS arrays. For example, among SNPs with .02#MAF,.05,
mean estimated r2 for the Affymetrix 500 K, Affymetrix 6.0, and
Metabochip samples were .47, .62, and .84, respectively (Figure 4).
The improved imputation accuracy for Metabochip compared to
GWAS array is primarily due to increased marker density of the
Metabochip in these regions.
Figure 1. Example of signal fine mapping (SFM) and locus fine mapping (LFM) regions. A SFM region seeks to map the initial associationsignal. SFM regions were designed using linkage disequilibrium (LD) r2 estimates from the 1000 Genomes Project and HapMap CEU data. Initialboundaries were determined by identifying all SNPs satisfying r2$.5 with the index SNP, and then expanded to the nearest flanking recombinationhotspot, but stopped if there was no hotspot nearby. LFM regions (blue) were similarly designed but expanded to capture functional units of interestsuch as nearby coding genes. The figure plots LD r2 for SNPs (red dots) within the region and recombination rate (blue lines) as a function of positionon the chromosome. Gene positions and structures are displayed in the lower panel. MI = myocardial Infarction; CAD = cardiovascular disease;HDL = high-density lipoprotein; LDL = low-density lipoprotein; T2D = type 2 diabetes.doi:10.1371/journal.pgen.1002793.g001
Metabochip Array Design
PLoS Genetics | www.plosgenetics.org 5 August 2012 | Volume 8 | Issue 8 | e1002793

Imputation quality in the Metabochip fine-mapping regions
using Metabochip is also improved for non-European individuals
compared to imputation using GWAS platforms. Using a leave-
one-sample-out approach, we evaluated the average r2 from the
1000 Genomes reference panel into Affymetrix 500 k, Affymetrix
6.0, and Metabochip. For example, among SNPs with
.02,MAF,.05, mean estimated r2 across European individuals
for the chips were .78, .83, and .93, respectively. For individuals
with African ancestry, corresponding values were .78, .85, and .94,
and for individuals of Asian ancestry, they were .67, .72, and .89
(Supplementary Figure S2). The fact that imputation of rare
variants in African ancestry populations is more accurate than in
European populations is probably explained by noting that – in
the short regions evaluated here – there will be only a limited
number of common variant haplotypes in Europeans and, in some
cases, these will not effectively tag specific rare variants. In African
populations, with a larger variety of rare haplotypes, it is more
likely (relative to Europeans) that at least one haplotype will
capture rare variants of interest.
In addition, we empirically evaluated the quality of experimen-
tally determined and imputed SNPs within the five fine mapping
regions by comparing individual genotypes with those obtained by
Sanger sequencing. For 126 SNPs evaluated, the average r2 in
analyses based on the Affymetrix 500 k and 6.0 arrays was .46 and
.55, respectively. Analyses based on Metabochip showed average
r2 = .79. Focusing on 48 SNPs that were imputed in all three
analyses, the average r2 was .31 (Affymetrix 500 K), .41
(Affymetrix 6.0), and .57 (Metabochip) (Supplementary Figure S3).
High-Resolution Association Analysis within MetabochipFine-Mapping Regions
To compare the power and resolution for association testing in
the Metabochip fine-mapping regions to that of standard GWAS
arrays, we revisited the LDL cholesterol association analysis from
the SardiNIA study [32] in 2,342 individuals genotyped for both
Metabochip and an Affymetrix (6.0 or 500 k) GWAS chip. Here,
we focus on five of the six most strongly associated loci from
Willer et al. [46], in and around PCSK9, LDLR, APOE/APOC1/
APOC2, SORT1, and APOB (Figure 5A–J), all of which were
designated for locus fine mapping by the Global Lipids Genetics
Consortium.
In the SORT1 and APOB regions, the peak association signals for
the two data sets are similar (Figure 5A–D). For PCSK9, LDLR,
and APOE/APOC1/APOC2, Metabochip based analysis resulted in
considerably stronger association signals. For PCSK9 and APOE/
APOC1/APOC2, the most strongly associated variants were low-
frequency SNPs (MAF = 1.1% for PCSK9, MAF = 3.4% for APOE)
that were directly genotyped on the Metabochip but not on the
Affymetrix chips (Figure 5E–J). Although the signals from
common variants are similar, the peak SNPs were not imputed
accurately in the Affymetrix data (estimated r2 = .04 and .08,
respectively). Within the LDLR region, there are 165 SNPs in the
1000 Genomes European panel. None of these SNPs are on the
Affymetrix chips and only eight could be imputed at estimated
r2$.3 using the Affymetrix data; the locus is also hard to impute
using HapMap 2 as a reference, with the peak association signals
corresponding to r2 of ,.40. In contrast, 36 of the 165 SNPs were
directly genotyped in Metabochip, and 122 were imputed at
estimated r2$.3. As a result, imputation into the Metabochip data
resulted in a substantial association signal (p = 7.361026), while
for the Affymetrix data, p..02 at all markers (Figure 5I–J). These
results demonstrate that dense genotyping may substantially
improve imputation accuracy, increasing association power even
for common variants.
Performing Standard Statistical Analyses UsingMetabochip Genotype Data
We carried out kinship estimation between pairs of individuals
and calculated genotype-based principal components for inclusion
as covariates in genetic association analysis using all Metabochip
SNPs that passed QC, and then using the pruned subset of SNPs
described in the Methods section. When using all QC-passing
Figure 2. Allele frequency spectrum for Metabochip SNPs by design category. Blue dots, red squares, and green triangles display fractionsof replication, fine-mapping, and all other SNPs (see Table 2) in each of the tabulated minor allele-frequency bins. CNP = copy number polymorphism.doi:10.1371/journal.pgen.1002793.g002
Metabochip Array Design
PLoS Genetics | www.plosgenetics.org 6 August 2012 | Volume 8 | Issue 8 | e1002793
SNPs, estimates of pairwise kinship coefficients in the Sardinia
sample had inflated variance (Supplementary Table S5), and
kinship coefficient estimates for the Nordic sample calculated using
PLINK suggested (incorrectly) that essentially all pairs of
individuals were related (Supplementary Figure S4). For each
analysis, using the pruned set of SNPs gave sensible results,
Figure 3. Coverage of 257 Metabochip fine-mapping regions. Fraction of 1000 Genomes Project SNPs in strong linkage disequilibrium (r2$.8)with HapMap 3 (green squares) or Metabochip (blue dots) SNPs as a function of minor allele frequencies: (A) 1000 Genomes Pilot 1 SNPs, (B) 1000Genomes Phase 1 SNPs (May 2011 release).doi:10.1371/journal.pgen.1002793.g003
Metabochip Array Design
PLoS Genetics | www.plosgenetics.org 7 August 2012 | Volume 8 | Issue 8 | e1002793

reducing variance in estimated kinship coefficients in the Sardinia
sample and removing the artifactual estimates of close relatedness
in the Nordic sample.
Because many Metabochip SNPs were included specifically due
to prior evidence for association of T2D, CAD/MI and related
traits, controlling for potential population stratification in
Metabochip analysis requires some care. Not surprisingly, carrying
out T2D association analysis in the Nordic sample on all SNPs
passing QC without inclusion of genotype-based principal
components resulted in a large genomic control inflation factor
(lGC = 1.44). Including all SNPs that passed QC to estimate
principal components (PCs), and then including those PCs as
covariates in the association analysis gave reduced but still
substantial inflation (lGC = 1.13). When we instead estimated test
statistic inflation based only on the 3,772 LD-pruned QT interval
replication SNPs (not expected to associate with T2D) we obtained
a genomic control inflation factor near unity (lGC = 1.01).
Assessing Overlap among SNPs across TraitsWe were interested whether the replication SNP sets submitted
by the GWAS consortia for the different traits showed more or less
overlap than expected by chance. To address this question, we
counted the number of SNPs in common across pairs of traits, and
used simulation to test whether the observed overlaps were
different than expected under the null hypothesis of genetic
independence of pairs of traits (Supplementary Table S6). Not
surprisingly, we observed substantial SNP set overlaps (and greater
than expected assuming independence) for multiple pairs of
correlated traits, notably SBP and DBP (38% proportion of
maximum possible overlap), HDL and TG (17%), and TC and
LDL (87%). We also observed substantial genetic overlap (4%)
between LDL and SBP, which are nearly uncorrelated traits.
Overall, we observed an excess of nominally significant SNP set
overlaps, consistent with (but in no way proof of) the hypothesis a
shared genetic etiology between these cardiometabolic traits.
Discussion
We designed the Metabochip, a custom genotyping array for
replication of the top association signals from the largest available
GWAS meta-analysis for 23 T2D and CAD/MI related traits and
for fine-mapping 257 genome-wide significant association signals for
15 of these traits (Table 1). The Metabochip also includes a set of
SNPs representing genome-wide significant associations across a
range of human traits; SNPs that tag known copy number
polymorphisms, the MHC, and mitochondrial variants; X and Y
chromosome SNPs for sex verification, fingerprint SNPs for sample
tracking, and ‘‘wildcard’’ SNPs selected by the participating GWAS
consortia (Table 2). The array has already been genotyped on DNA
samples from hundreds of thousands of individuals and preliminary
analyses across the contributing GWAS consortia have identified
hundreds of new genome-wide association signals (manuscripts
being prepared by each of the consortia).
In designing the Metabochip, 90.4% of chosen SNPs were
successfully designed and manufactured onto the array, and of
these, ,82% passed QC filters in our three example studies,
resulting in very complete coverage of variation in our 257
fine-mapping regions. Of course, as time passes and catalogs of
SNPs expand, potential shortcomings in coverage should
become apparent. Currently, coverage of 1000 Genomes Pilot
Study European SNPs in the fine-mapping regions is 82.0% at
a tagging threshold of r2$.8. Coverage of Phase 1 European
SNPs in these regions is 54.5%, and the number increases to
73.7% for SNPs at MAF.0.5%. Using genotype imputation,
we can impute 82% of 1000 Genomes Phase 1 European SNPs
with MAF.0.5% with estimated r2$0.8. The resulting data
are of high quality, with 99.99% duplicate consistency in
heterozygotes and 99.77% Mendelian consistency in hetero-
zygotes in our studies. Further, Metabochip fine-mapping
regions provide an excellent target for genotype imputation
from relevant reference sets, and in our experience can provide
more complete coverage than provided by standard HapMap-
Figure 4. Imputation accuracy (estimated r2) in fine mapping regions. Imputation accuracy for differing numbers of Sardinian individuals asmeasured by estimated r2 value across the 257 Metabochip fine mapping regions for Metabochip (red squares), Affymetrix 6.0 GWAS SNPs (greentriangles), and Affymetrix 500 k GWAS SNPs (blue circles) as a function of minor allele frequency bin.doi:10.1371/journal.pgen.1002793.g004
Metabochip Array Design
PLoS Genetics | www.plosgenetics.org 8 August 2012 | Volume 8 | Issue 8 | e1002793

Figure 5. Regional association plots for LDL cholesterol association in the SardiNIA study. Association plots for a study of 2,432 Sardinianindividuals for five Metabochip fine-mapping regions using 1000 Genomes data as reference set and Affymetrix genotypes (left panels : A,C,E,G,H) orMetabochip genotypes (right panels : B,D,F,H,J) as target sets. The figures plot 2log10 of the association p-value within the region and recombinationrate (blue lines) as a function of position on the chromosome. Blue, green, and red dots and triangles indicate genotyped and imputed SNPs withminor allele frequencies less than 0.02, greater than or equal 0.02 and less than 0.05, and greater than or equal 0.05, respectively. Gene positions andstructures are displayed in the lower panel.doi:10.1371/journal.pgen.1002793.g005
Metabochip Array Design
PLoS Genetics | www.plosgenetics.org 9 August 2012 | Volume 8 | Issue 8 | e1002793

based GWAS arrays (Figure 3) for both common and less
common variants.
A key decision in the fine-mapping of any GWAS signal concerns
the size of the region where genetic variation will be examined
exhaustively. In designing the Metabochip, we focused on relatively
small regions surrounding each lead SNP – these included all variants
in strong linkage disequilibrium (r2..5) and a small shoulder
extending .02 cM beyond that (typically, ,20 kb). This decision
was informed by the observation that, in cases where GWAS signals
and Mendelian disease loci overlap, they are typically very close
together (typically within ,10 kb of each other and nearly always
within ,100 kb; see [4] for a discussion of the issue), although there
are exceptions to this rule (see [47], for example).
Within each fine-mapping region, we selected variants identified
by the HapMap consortium and early analyses of the 1000
Genomes Consortium data. The 1000 Genomes Project and other
sequence based catalogs of genetic variation are now more
extensive that at the time of array design, but (as noted above) our
analyses show that the SNPs selected for inclusion in the
Metabochip form a useful reagent for genotyping imputation –
not only for the imputation of newly discovered SNPs in the fine-
mapping regions (see above) but also for the imputation of other
types of variants, such as indel polymorphisms, that have become
part of newer 1000 Genomes Project analyses (unpublished data).
Several other design choices for Metabochip were to some
degree arbitrary: which traits to include; balance in numbers of
SNPs for replication, fine mapping, and other purposes; and how
to prioritize among SNPs available for each purpose. Were we to
design a similar chip now, we would take advantage of the now
available more extensive and deeply annotated SNP catalogs. In
addition, we would likely include a set of randomly ascertained
SNPs to facilitate analysis that control for population structure and
other artifacts. Finally, with empirical evidence from this and other
projects on the relationship between SNP design score and
empirical probability of successful design, we would likely replace
design score by probability of successful design. This approach
would likely result in even higher call rates.
Because Metabochip SNPs are highly enriched for trait-
associated SNPs and .60% are clustered in the ,1.5% of the
genome that comprises the fine-mapping regions, Metabochip
genotype data present some challenges to standard analyses such
as relationship estimation, principal components analysis, and
genomic control determination. However, as we demonstrated,
these challenges can be overcome by focusing on replication SNPs
expected to be unrelated to the trait of interest. An alternative
approach is to use SNPs that were not associated with the trait(s) of
interest in the corresponding GWAS (for example, p-value..50
for all such traits) and then to LD-prune the resulting set of SNPs
to identify a near-independent set. An alternative that is also
worthy of investigation in the analysis of case-control samples is
the application of principal component factor loadings derived
from a controls-only analysis to the combined sample of cases and
controls. When this last alternative is considered, it is important to
check that PCA axes derived from controls represent all relevant
ancestries present in cases. The design of the array, focused on
replication and fine-mapping and selecting SNPs from early
releases of the HapMap and 1000 Genomes Projects, resulted in a
highly non-random ascertainment of SNPs. Thus, we cannot
recommend use of Metabochip SNPs for population genetic
analyses that rely on unbiased, and/or comprehensive ascertain-
ment schemes for SNPs.
The need for follow-up genotyping is a frequent requirement of
GWAS and sequencing studies of complex human traits.
Approaching array design in a coordinated fashion across related
studies and traits can be particularly cost-effective, since per array
costs often drop dramatically with increasing numbers of
individuals to be genotyped, and (given sufficient numbers of
individuals) may increase only modestly with increasing numbers
of SNPs. For example, a custom chip designed to genotype the
,22,000 DIAGRAM-selected type 2 diabetes Metabochip SNPs
in the ,80,000 individuals genotyped on Metabochip by the
DIAGRAM consortium studies would have cost ,$55 compared
to the Metabochip cost of $39, delivering only 1/9 as many
genotypes at .40% greater cost. Furthermore, examining the
association between SNPs tentatively associated with one trait for
other related traits can also be informative, highlighting pleiotropy
across related traits and helping discover new association signals;
for example, two of the ten novel type 2 diabetes loci identified to
date by Metabochip analysis by the DIAGRAM consortium were
placed on Metabochip for other traits [48]. In the case of the
Metabochip, which is less expensive than many smaller trait
specific arrays, this opportunity to collect more information and
investigate the effects of SNPs associated with other traits actually
comes with reduced costs (compared to trait specific arrays),
although with the need to organize across multiple consortia and
to share the number of SNPs that can be cost-effectively
genotyped. The ‘‘Immunochip’’ [49] follows this same paradigm
and supports genotyping of ,200,000 SNPs identified on the basis
of GWAS meta-analyses for immunological disorders, while the
recently designed ‘‘exome chip’’ (Benjamin Neale, Goncalo
Abecasis, personal communication) supports genotyping of
,250,000 exonic SNPs identified via large-scale exome sequenc-
ing studies totaling .12,000 individuals. These and other similar
array products represent valuable tools in ongoing efforts to
understand the genetic architecture of complex human traits.
Supporting Information
Figure S1 Distribution of Illumina design scores by Metabochip
SNP category.
(TIFF)
Figure S2 Imputation accuracy in fine mapping regions across
three continental populations for (A) Europeans (B) Africans, and
(C) East Asians.
(TIFF)
Figure S3 Empirical concordance between Sanger sequencing
data and imputed genotypes. Empirical r2 was evaluated between
Sanger sequencing data and imputed genotypes from Metabochip
or (A) Affymetrix 500 K SNPs and (B) Affymetrix 6.0 SNPs across
five loci in 256 Sardinians.
(TIFF)
Figure S4 Distribution of estimates of pairwise genome-wide
identity-by-descent (IBD) sharing generated by PLINK for all
SNPs and for pruned SNPs.
(TIFF)
Table S1 Summary of replication SNP submission.
(EPS)
Table S2 Summary of fine-mapping regions.
(EPS)
Table S3 Summary of SNPs within fine-mapping loci.
(EPS)
Table S4 List of unintended duplicated SNPs.
(EPS)
Table S5 Estimation of pairwise kinship coefficients.
(EPS)
Metabochip Array Design
PLoS Genetics | www.plosgenetics.org 10 August 2012 | Volume 8 | Issue 8 | e1002793
Table S6 Observed count of SNPs in common (upper) between
Tier 1 and Tier 2 replication traits submissions and significance of
observed overlap (lower).
(EPS)
Text S1 Technical details of SNP selection criteria.
(DOC)
Acknowledgments
We thank members of the Body Fat Percentage, CARDIoGRAM,
DIAGRAM, HaemGen, GIANT, Global Lipids, ICBP-GWAS, MAGIC,
and QT-IGC GWAS consortia for association results contributing to
replication SNPs selection and for nomination of fine-mapping regions and
their physical boundaries, the 1000 Genome Project for early access to pilot
SNP calls, and the FUSION, METSIM, HUNT, Tromsø, Diagen,
SardiNIA, Malmø Preventive Project, Scania Diabetes Registry, and
Botnia Study investigators for use of their Metabochip genotype data. We
thank Jennifer Stone, Kimberly Gietzen, Mike Eberle, Luana Galver,
Tristan Orpin, and their Illumina team for technical, logistical, and
informatics support in array design and development, and Damien
Croteau-Chonka for contributing annotations for duplicated SNPs
provided in the Supplementary Table S4.
Author Contributions
Conceived and designed the experiments: BFV HMK JNH DA MIM
GRA MB. Analyzed the data: BFV HMK JD CDP CS PSC NPB CF YL
JE TMF IMH AUJ TJ TOK CML APM IP JCR RS NS EKS TMT EW
JM MP SP NWR NR KS WW SS AM. Contributed reagents/materials/
analysis tools: AM RN FC IB PD RJFL SK PBM CN-C AP NJS HS.
Wrote the paper: BFV HMK GRA MB. Critically revised the manuscript,
including comments and feedback: BFV HMK JE TMF TOK CML NS
NWR SS RN IB RJFL SK CN-C NJS JNH DA MIM GRA MB.
References
1. Yang J, Benyamin B, McEvoy BP, Gordon S, Henders AK, et al. (2010)Common SNPs explain a large proportion of the heritability for human height.
Nat Genet 42:565–569.
2. Yang J, Manolio TA, Pasquale LR, Boerwinkle E, Caporaso N, et al. (2011)
Genome partitioning of genetic variation for complex traits using commonSNPs. Nat Genet 43:519–525.
3. Allen HL, Estrada K, Lettre G, Berndt SI, Weedon MN, et al. (2010) Hundreds
of variants clustered in genomic loci and biological pathways affect human
height. Nature 467:832–838.
4. Teslovich TM, Musunuru K, Smith AV, Edmondson AC, Stylianou IM, et al.
(2010) Biological, clinical and population relevance of 95 loci for blood lipids.Nature 466:707–713.
5. Musunuru K, Strong A, Frank-Kamenetsky M, Lee NA, Ahfeldt T, et al. (2010)
From noncoding variant to phenotype via SORT1 at the 1p13 cholesterol locus.
Nature 466:714–719.
6. rFrazer KA, Ballinger DG, Cox DR, Hinds DA, Stuve LL, et al (2007) A secondgeneration human haplotype map of over 3.1 million SNPs. Nature 449:851–861.
7. The 1000 Genomes Project Consortium (2010) A map of human genomevariation from population-scale sequencing. Nature 467:1061–1073.
8. Gunderson KL, Steemers FJ, Ren H, Ng P, Zhou L (2006) Whole-genomegenotyping. Methods Enzymol 410:359–376.
9. Kilpelainen TO, Zillikens MC, Stancakova A, Finucane FM, Ried JS, et al.(2011) Genetic variation near IRS1 associates with reduced adiposity and an
impaired metabolic profile. Nat Genet 43:753–760.
10. Schunkert H, Konig IR, Kathiresan S, Reilly MP, Assimes TL, et al (2011)
Large-scale association analysis identifies 13 new susceptibility loci for coronaryartery disease. Nat Genet 43:333–338.
11. Voight BF, Scott LJ, Steinthorsdottir V, Morris AP, Dina C, et al (2010) Twelvetype 2 diabetes susceptibility loci identified through large-scale association
analysis. Nat Genet 42:579–589.
12. Heid IM, Jackson AU, Randall JC, Winkler TW, Qi L, et al (2010) Meta-
analysis identifies 13 new loci associated with waist-hip-ratio and reveals sexualdimorphism in the genetic basis of fat distribution. Nat Genet 42:949–960.
13. Speliotes EK, Willer CJ, Berndt SI, Monda KL, Thorleifsson G, et al (2010)
Association analyses of 249,796 individuals reveal 18 new loci associated with
body mass index. Nat Genet 42:937–948.
14. Soranzo N, Spector TD, Mangino M, Kuhnel B, Rendon A, et al. (2009) A
genome-wide meta-analysis identifies 22 loci associated with eight hematologicalparameters in the HaemGen consortium. Nat Genet 41:1182–1190.
15. Ehret GB, Munroe PM, Rice KM, Bochud M, Johnson AD, et al (2011) Genetic
variants in novel pathways influence blood pressure and coronary artery disease
risk. Nature 478:103–109.
16. Dupuis J, Langenberg C, Prokopenko I, Saxena R, Soranzo N, et al (2010) Newgenetic loci implicated in fasting glucose homeostasis and their impact on type 2
diabetes risk. Nat Genet 42:105–116.
17. Soranzo N, Sanna S, Wheeler E, Gieger C, Radke D, et al. (2010) Common
variants at 10 genomic loci influence hemoglobin A1(C) levels via glycemic and
nonglycemic pathways. Diabetes 59:3229–3239.
18. Saxena R, Hivert MF, Langenberg C, Tanaka T, Pankow JS, et al. (2010)Genetic variation in GIPR influences the glucose and insulin responses to an oral
glucose challenge. Nat Genet 42:142–148.
19. Newton-Cheh C, Eijgelsheim M, Rice KM, de Bakker PI, Yin X, et al. (2009)
Common variants at ten loci influence QT interval duration in the QTGENStudy. Nat Genet 41:399–406.
20. Pfeufer A, Sanna S, Arking DE, Muller M, Gateva V, et al. (2009) Commonvariants at ten loci modulate the QT interval duration in the QTSCD Study.
Nat Genet 41:407–414.
21. Hindorff LA, Sethupathy P, Junkins HA, Ramos EM, Mehta JP, et al. (2009)
Potential etiologic and functional implications of genome-wide association locifor human diseases and traits. Proc Natl Acad Sci USA 106:9362–9367.
22. de Bakker PI, McVean G, Sabeti PC, Miretti MM, Green T, et al. (2006) Ahigh-resolution HLA and SNP haplotype map for disease association studies in
the extended human MHC. Nat Genet 38:1166–1172.
23. Saxena R, deBakker PI, Singer K, Mootha V, Burtt N, et al. (2006)Comprehensive association testing of common mitochondrial DNA variation
in metabolic disease. Am J Hum Genet 79:54–61.
24. Van den Ouweland JM, Lemkes HH, Ruitenbeek W, Sandkuijl LA, de Vijlder
MF, et al. (1992) Mutation in mitochondrial tRNA(Leu)(UUR) gene in a large
pedigree with maternally transmitted type 2 diabetes mellitus and deafness. NatGenet 1:368–371.
25. Poulton L, Luan J, Macaulay V, Hennings S, Mitchell J, et al. (2002) Type 2diabetes is associated with a common mitochondrial variant: evidence from a
population-based case-control study. Hum Mol Genet 11:1581–1583.
26. Schwarz PEH, Towers GW, Fischer S, Govindarajalu S, Schulze J, et al. (2006)Hypoadiponectinemia is associated with progression toward type 2 diabetes and
genetic variation in the ADIPOQ gene promoter. Diabetes Care 29:1645–1650.
27. Scott LJ, Mohlke KL, Bonnycastle LL, Willer CJ, Li Y, et al. (2007) A genome-
wide association study of type 2 diabetes in Finns detects multiple susceptibility
variants. Science 316:1341–1345.
28. Stancakova A, Javorsky M, Luulasmaa T, Haffner SM, Kuusisto L, et al. (2009)
Changes in insulin sensitivity and insulin release in relation to glycemia andglucose tolerance in 6416 Finnish men. Diabetes 58:1212–1221.
29. Hertel JK, Johansson S, Sonestedt E, Johsson A, Lie RT, et al. (2011) FTO, type
2 diabetes, and weight gain throughout adult life: a meta-analysis of 41,504subjects from the Scandinavian HUNT, MDC, and MPP studies. Diabetes
60:1637–1644.
30. Jacobsen BK, Eggen AE, Mathiesen EB, Wilsgaard T, Njolstad I (2011) Cohort
profile: The Tromso Study. Int J Epidemiol DOI doi: 10.1093/ije/dyr049.
31. Pilia G, Chen WM, Scuteri A, Orru M, Albai G, et al. (2006) Heritability ofcardiovascular and personality traits in 6,148 Sardinians. PLoS Genet 2:e132.
32. Sanna S, Li B, Mulas A, Sidore C, Kang HM, et al. (2011) Fine mapping of five
loci associated with low-density lipoprotein cholesterol detects variants thatdouble the explained heritability. PloS Genet DOI:10.1371/journal.p-
gen.1002198.
33. Bakhtadze E, Cervin C, Lindholm E, Borg H, Nilsson P, et al. (2008) Common
variants in the TCF7L2 gene help to differentiate autoimmune from non-
autoimmune diabetes in young (15–34 years) but not in middle aged (40–59years) diabetic patients. Diabetologia 51:2224–2232.
34. Cervin C, Lyssenko V, Bakhtadze E, Lindholm E, Nilsson P, et al. (2008)Genetic similarities between latent autoimmune diabetes in adults, type 1
diabetes, and type 2 diabetes. Diabetes 57:1433–1437.
35. Lyssenko V, Jonsson A, Almgren P, Pulizzi N, Isomaa B, et al. (2008) Clinicalrisk factors, DNA variants, and the development of type 2 diabetes. N Engl J Med
359:2220–2232.
36. Korn JM, Kuruvilla FG, McCarroll SA, Wysoker A, Nemesh J, et al. (2008)
Integrated genotype calling and association analysis of SNPs, common copy
number polymorphisms and rare CNVs. Nat Genet 40:1253–1260.
37. Devlin B, Roeder K (1999) Genomic control for association studies. Biometrics
55:997–1004.
38. Milligan GB (2003) Maximum-likelihood estimation of relatedness. Genetics
163:1153–1167.
39. Purcell S, Neale B, Todd-Brown K, Thomas L, Ferreira MA, et al. (2007)PLINK: a tool set for whole-genome association and population-based linkage
analyses. Am J Hum Genet 81:559–575.
40. Balding DJ, Nichols RA (1995) A method for quantifying differentiation betweenpopulations at multi-allelic loci and its implications for investigating identify and
paternity. Genetics 96:3–12.
41. Kang HM, Sul JH, Service SK, Zaitlen NA, Kong SY, et al. (2010) Variance
component model to account for sample structure in genome-wide association
studies. Nat Genet 42:348–354.
Metabochip Array Design
PLoS Genetics | www.plosgenetics.org 11 August 2012 | Volume 8 | Issue 8 | e1002793

42. Scuteri A, Sanna S, Chen WM, Uda M, Albai G, et al. (2007) Genome-wide
association scan shows genetic variants in the FTO gene are associated withobesity-related traits. PloS Genet 3: doi:10.1371/journal.pgen.0030115.
43. Howie B, Fuchsberger C, Stephens M, Marchini J, Abecasis GR (2011) Fast and
accurate genotype imputation in genome-wide association studies through pre-phasing. Submitted.
44. Giannoulatou E, Yau C, Colella S, Ragoussis J, Holmes CC (2008) GenoSNP: avariational Bayes within-sample SNP genotyping algorithm that does not require
a reference population. Bioinformatics 24:2209–2214.
45. The International HapMap 3 Consortium (2010) Integrating common and raregenetic variation in diverse human populations. Nature 467:52–58.
46. Willer CJ, Sanna S, Jackson AU, Scuteri A, Bonnycastle LL, et al. (2008) Newly-
identified loci that influence lipid concentrations and risk of coronary arterydisease. Nat Genet 40:161–169.
47. Loos RJ, Lindgren CM, Li S, Wheeler E, Zhao JH, et al. (2008) Common
variants near MC4R are associated with fat mass, weight and risk of obesity. NatGenet 40:768–75
48. Morris AP, Voight BF, Teslovich TM, Ferreira T, Segre AV, et al. (2012) Large-scale association analysis provides insights into the genetic architecture and
pathophysiology of type 2 diabetes, submitted for publication.
49. Cortes A, Brown MA (2011) Promise and pitfalls of the Immunochip. ArthritisRes Ther 13:101.
Metabochip Array Design
PLoS Genetics | www.plosgenetics.org 12 August 2012 | Volume 8 | Issue 8 | e1002793


![[Poster] Physiological and Anthropometric Profile of Portuguese Professional Kickboxers, Gil S., Leonardo C., Tatiana P., João B](https://img.pdfslide.tips/doc/110x75/55720e67497959fc0b8c7750/poster-physiological-and-anthropometric-profile-of-portuguese-professional-kickboxers-gil-s-leonardo-c-tatiana-p-joao-b.jpg)