Embed Size (px)
Citation preview

www.efpia.eu
The Pharmaceutical Industry in FiguresKey Data 2015
EFPIA Key Data | 2015
32
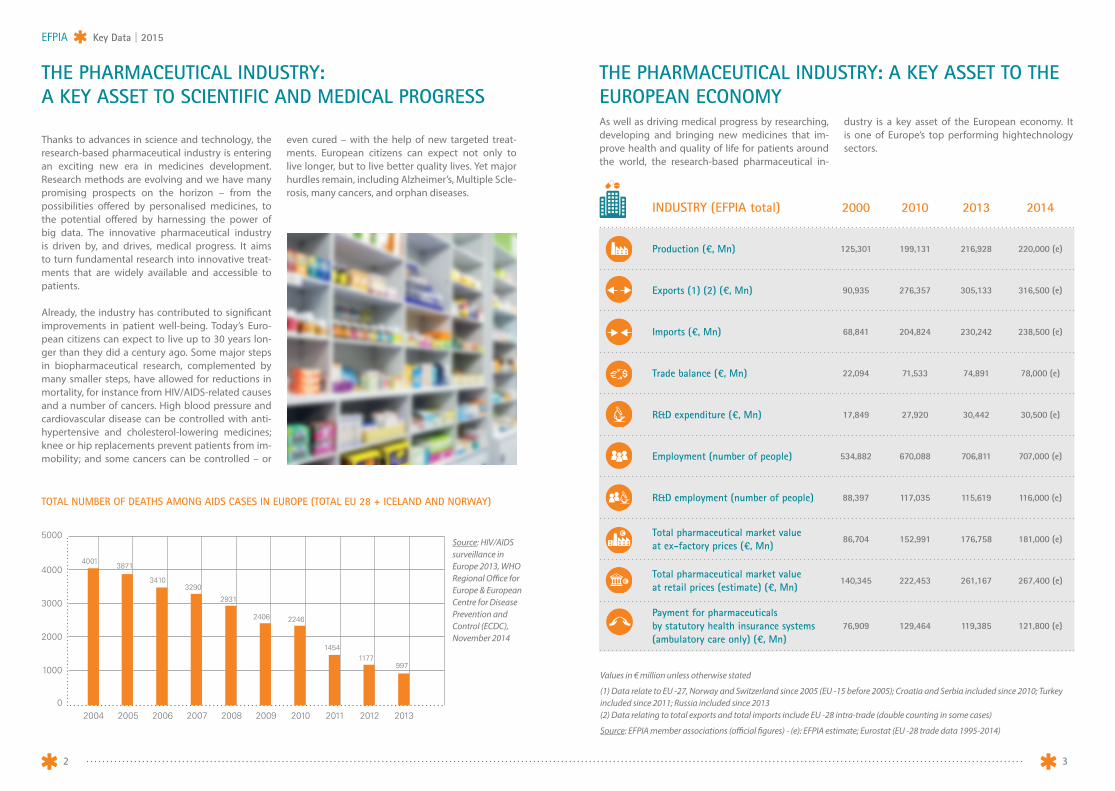
INDUSTRY (EFPIA total) 2000 2010 2013 2014
Production (€, Mn) 125,301 199,131 216,928 220,000 (e)
Exports (1) (2) (€, Mn) 90,935 276,357 305,133 316,500 (e)
Imports (€, Mn) 68,841 204,824 230,242 238,500 (e)
Trade balance (€, Mn) 22,094 71,533 74,891 78,000 (e)
R&D expenditure (€, Mn) 17,849 27,920 30,442 30,500 (e)
Employment (number of people) 534,882 670,088 706,811 707,000 (e)
R&D employment (number of people) 88,397 117,035 115,619 116,000 (e)
Total pharmaceutical market value at ex-factory prices (€, Mn)
86,704 152,991 176,758 181,000 (e)
Total pharmaceutical market value at retail prices (estimate) (€, Mn)
140,345 222,453 261,167 267,400 (e)
Payment for pharmaceuticals by statutory health insurance systems (ambulatory care only) (€, Mn)
76,909 129,464 119,385 121,800 (e)
THE PHARMACEUTICAL INDUSTRY: A KEY ASSET TO SCIENTIFIC AND MEDICAL PROGRESS
THE PHARMACEUTICAL INDUSTRY: A KEY ASSET TO THE EUROPEAN ECONOMY
Thanks to advances in science and technology, the research-based pharmaceutical industry is entering an exciting new era in medicines development. Research methods are evolving and we have many promising prospects on the horizon – from the possibilities offered by personalised medicines, to the potential offered by harnessing the power of big data. The innovative pharmaceutical industry is driven by, and drives, medical progress. It aims to turn fundamental research into innovative treat-ments that are widely available and accessible to patients.
Already, the industry has contributed to significant improvements in patient well-being. Today’s Euro-pean citizens can expect to live up to 30 years lon-ger than they did a century ago. Some major steps in biopharmaceutical research, complemented by many smaller steps, have allowed for reductions in mortality, for instance from HIV/AIDS-related causes and a number of cancers. High blood pressure and cardiovascular disease can be controlled with anti-hypertensive and cholesterol-lowering medicines; knee or hip replacements prevent patients from im-mobility; and some cancers can be controlled – or
even cured – with the help of new targeted treat-ments. European citizens can expect not only to live longer, but to live better quality lives. Yet major hurdles remain, including Alzheimer’s, Multiple Scle-rosis, many cancers, and orphan diseases.
As well as driving medical progress by researching, developing and bringing new medicines that im-prove health and quality of life for patients around the world, the research-based pharmaceutical in-
dustry is a key asset of the European economy. It is one of Europe’s top performing hightechnology sectors.
Source: HIV/AIDS surveillance in Europe 2013, WHO Regional Office for Europe & European Centre for Disease Prevention and Control (ECDC), November 2014
Values in € million unless otherwise stated
(1) Data relate to EU -27, Norway and Switzerland since 2005 (EU -15 before 2005); Croatia and Serbia included since 2010; Turkey included since 2011; Russia included since 2013 (2) Data relating to total exports and total imports include EU -28 intra-trade (double counting in some cases)
Source: EFPIA member associations (official figures) - (e): EFPIA estimate; Eurostat (EU -28 trade data 1995-2014)
TOTAL NUMBER OF DEATHS AMONG AIDS CASES IN EUROPE (TOTAL EU 28 + ICELAND AND NORWAY)
20040
5000
40013871
34103290
2931
2406 2246
14541177
9971000
2000
3000
4000
2005 2006 2007 2008 2009 2010 2011 2012 2013
EFPIA Key Data | 2015
54
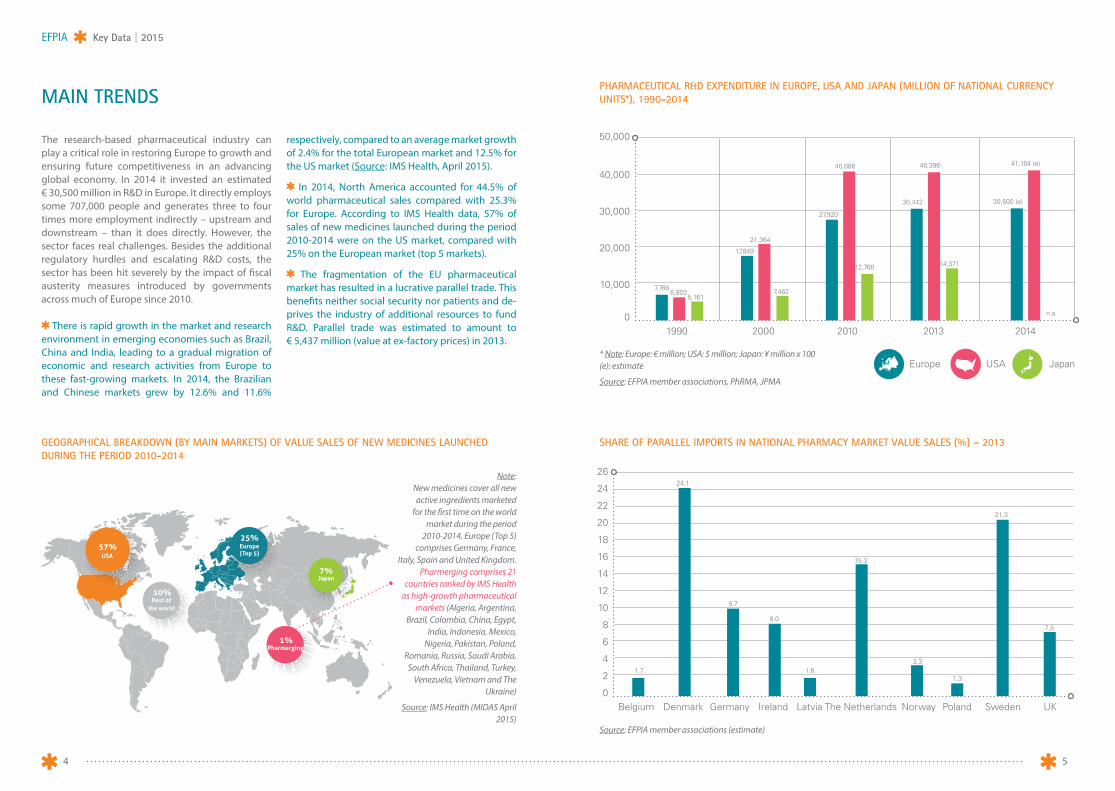
MAIN TRENDS
The research-based pharmaceutical industry can play a critical role in restoring Europe to growth and ensuring future competitiveness in an advancing global economy. In 2014 it invested an estimated € 30,500 million in R&D in Europe. It directly employs some 707,000 people and generates three to four times more employment indirectly – upstream and downstream – than it does directly. However, the sector faces real challenges. Besides the additional regulatory hurdles and escalating R&D costs, the sector has been hit severely by the impact of fi scal austerity measures introduced by governments across much of Europe since 2010.
There is rapid growth in the market and research environment in emerging economies such as Brazil, China and India, leading to a gradual migration of economic and research activities from Europe to these fast-growing markets. In 2014, the Brazilian and Chinese markets grew by 12.6% and 11.6%
respectively, compared to an average market growth of 2.4% for the total European market and 12.5% for the US market (Source: IMS Health, April 2015).
In 2014, North America accounted for 44.5% of world pharmaceutical sales compared with 25.3% for Europe. According to IMS Health data, 57% of sales of new medicines launched during the period 2010-2014 were on the US market, compared with 25% on the European market (top 5 markets).
The fragmentation of the EU pharmaceutical market has resulted in a lucrative parallel trade. This benefi ts neither social security nor patients and de-prives the industry of additional resources to fund R&D. Parallel trade was estimated to amount to € 5,437 million (value at ex-factory prices) in 2013.
GEOGRAPHICAL BREAKDOWN (BY MAIN MARKETS) OF VALUE SALES OF NEW MEDICINES LAUNCHED DURING THE PERIOD 2010-2014
PHARMACEUTICAL R&D EXPENDITURE IN EUROPE, USA AND JAPAN (MILLION OF NATIONAL CURRENCY UNITS*), 1990-2014
* Note: Europe: € million; USA: $ million; Japan: ¥ million x 100(e): estimate
Source: EFPIA member associations, PhRMA, JPMA
SHARE OF PARALLEL IMPORTS IN NATIONAL PHARMACY MARKET VALUE SALES (%) – 2013
Source: EFPIA member associations (estimate)
Page 5 - grille correcte - prête à l’emploi (checker les fautes)
Pharmaceutical R&D expenditure in Europe, USA and Japan (million of national currency units *), 1990-2014
Share of parallel imports in pharmacy market sales (%) – 2013
1990
Belgium Denmark Germany Ireland Latvia The Netherlands
2000 2010 2013 20140
0
50,000
20
22
24
26
2
4
6
8
10
12
14
16
18
7,7666,803
5,161
17,849
27,920
40,688
12,760
30,442
40,396
14,371
30,500 (e)
41,104 (e)
n.a.
21,364
7,46210,000
20,000
30,000
40,000
* Note: Europe: € million; USA: $ million; Japan: ¥ million x 100(e): estimateSource: EFP IA member associations, PhRMA, JPMA
1,7 %
24,1 %
9,7 %
1,6 %
8,0 %
15,3 %
Norway
3,3 %
Poland
1,3 %
Sweden
21,3 %
UK
7,5 %
Page 5 - grille correcte - prête à l’emploi (checker les fautes)
Pharmaceutical R&D expenditure in Europe, USA and Japan (million of national currency units *), 1990-2014
Share of parallel imports in pharmacy market sales (%) – 2013
1990
Belgium Denmark Germany Ireland Latvia The Netherlands
2000 2010 2013 20140
0
50,000
20
22
24
26
2
4
6
8
10
12
14
16
18
7,7666,803
5,161
17,849
27,920
40,688
12,760
30,442
40,396
14,371
30,500 (e)
41,104 (e)
n.a.
21,364
7,46210,000
20,000
30,000
40,000
* Note: Europe: € million; USA: $ million; Japan: ¥ million x 100(e): estimateSource: EFP IA member associations, PhRMA, JPMA
1,7
24,1
9,7
1,6
8,0
15,3
Norway
3,3
Poland
1,3
Sweden
21,3
UK
7,5
Note: New medicines cover all new active ingredients marketed
for the fi rst time on the world market during the period
2010-2014. Europe (Top 5) comprises Germany, France,
Italy, Spain and United Kingdom. Pharmerging comprises 21
countries ranked by IMS Health as high-growth pharmaceutical
markets (Algeria, Argentina, Brazil, Colombia, China, Egypt,
India, Indonesia, Mexico, Nigeria, Pakistan, Poland,
Romania, Russia, Saudi Arabia, South Africa, Thailand, Turkey,
Venezuela, Vietnam and The Ukraine)
Source: IMS Health (MIDAS April 2015)
Europe USA Japan
57%
10%
7%
1%
25%
Pharmerging
Japan
Europe(Top 5)
Rest ofthe world
USA

EFPIA Key Data | 2015
76
PHARMACEUTICAL INDUSTRY RESEARCH AND DEVELOPMENT IN EUROPE
All new medicines introduced into the market are the result of lengthy, costly and risky research and development (R&D) conducted by pharmaceutical companies:
By the time a medicinal product reaches the market, an average of 12-13 years will have elapsed since the first synthesis of the new active substance;
The cost of researching and developing a new chemical or biological entity was estimated at € 1,172 million in 2012 (Mestre-Ferrandiz et al, Office of Health Economics, December 2012) ($ 1,506 mil-lion in year 2011);
On average, only one to two of every 10,000 substances synthesised in laboratories will successfully pass all stages of development required to become a marketable medicine.
PHASES OF THE RESEARCH AND DEVELOPMENT PROCESS
PHARMACEUTICAL INDUSTRY RESEARCH AND DEVELOPMENT IN EUROPE
EFPIA 2013 € million € millionAustria 453
Belgium 2,493
Bulgaria n.a.
Croatia 40
Cyprus 85
Czech Republic 77
Denmark 1,411
Estonia n.a.
Finland 171
France 4,789
Germany 6,063
Greece 80
Hungary 158
Ireland 305
Italy 1,220
Latvia n.a.
Lithuania n.a.
Malta n.a.
Netherlands 642
Norway 124
Poland 203
Portugal 90
Romania 250
Serbia n.a.
Slovakia n.a.
Slovenia 165
Spain 885
Sweden 800
Switzerland 5,048
Turkey 83
United Kingdom 4,807
TOTAL 30,442
Note: The figures relate to the R&D carried out in each country. Czech Republic, Denmark, France, Hungary: 2012 data; Austria, Croatia, Netherlands: 2011 data Belgium, Croatia, Denmark, France, Germany, Greece, Ireland, Italy, Netherlands, Norway (LMI members), Poland, Romania, Slovenia, Sweden (LIF members), Switzerland (Interpharma members), Turkey: estimate
Source: EFPIA member associations (official figures)
Scre
enin
g (1
0,00
0 m
olec
ules
)
0 5 years
Patent applic
ation Pre-clin
ical
development
Clinical tr
ials
Acute toxity
Pharmacology
Chronic toxicity
Phase I
Phase II
Phase III
Price
Reimburse
ment
Pharmacovigila
nce
Registratio
n / Marketin
g authorisatio
n
10 years
10 years of R&D 2 to 3 years of administrative procedures
15 years 20 years patent expiry
25 years SPC (supplementary protection certificate) max. + 5 years
1 medicinal product

EFPIA Key Data | 2015
98
Pharmaceutical R&D expenditure - Annual growth rate (%)
Europe
USA
0
4
2
6
8
10
2000-2004
4.8
9.9
2005-2009
5.2
3.8
2010-2014
2.43.4
Allocation of R&D investments by function (%)
23.8
51.4
7.7
13.7
3.4
Pre-human/Pre-clinical
Approval
Pharmacovigilance (Phase IV)
Uncategorised
7.7
11.6
32.1
Phase I
Phase II
Phase III
Clinical Trials
Source: PhRMA, Annual Membership Survey 2014 (percentages calculated from 2012 data)
Allocation of R&D investments by function (%)
Number of new chemical or biological entities (1995-2014)
23.8
51.4
7.7
11.6
32.1
7.7
13.7
3.4
Pre-human/Pre-clinical
Phase I
Phase II
Phase III
Clinical Trials
Approval
Pharmacovigilance (Phase IV)
Europe USA Japan Others
Uncategorized
Source: PhRMA, Annual Membership Survey 2014 (percentages calculated from 2012 data)
1995-1999 2000-2004 2005-2009 2010-20140
100
89
57
70
25
10
52
73
83
29 30
66
17
11
77
36
5
20
40
60
80
Page 8
Source: PhRMA, Annual Membership Survey 2014 (percentages calculated from 2012 data)
Source: SCRIP – EFPIA calculations (according to nationality of mother company)
ALLOCATION OF R&D INVESTMENTS BY FUNCTION (%)
NUMBER OF NEW CHEMICAL OR BIOLOGICAL ENTITIES LAUNCHED (1995-2014)
IMPORTANCE OF PHARMACEUTICAL R&D
In 2013, the pharmaceutical industry invested more than € 30,400 million in R&D in Europe. A decade of strong US market dominance led to a shift of economic and research activity towards the US from 1995-2005. Additionally, Europe is now facing increasing compe-tition from emerging economies: rapid growth in the market and research environments in countries such as Brazil and China is contributing to the move of eco-nomic and research activities to non-European mar-kets. The geographical balance of the pharmaceutical market – and ultimately the R&D base – is likely to shift gradually towards emerging economies.
ESTIMATED FULL COST OF BRINGING A NEW CHEMICAL OR BIOLOGICAL ENTITY TO MARKET ($ MILLION, 2011 PRICES)
Source: J. Mestre-Ferrandiz, J. Sussex and A. Towse, The R&D cost of a new medicine, Office of Health Economics, December 2012 (Hansen, 1979; Wiggins, 1987; DiMasi et al, 1991; OTA, 1993; DiMasi et al, 2003; Mestre-Ferrandiz et al, 2012)
Source: EFPIA, PhRMA
01979
100
200
300
400
500
600
700
800
900
1,000
1,100
1,200
1,300
1,400
1,500
1987 1991 1993 2003 2012
199 226
451
625
1,031
1,506
PHARMACEUTICAL R&D EXPENDITURE - ANNUAL GROWTH RATE (%)

EFPIA Key Data | 2015
1110
RANKING OF INDUSTRIAL SECTORS BY OVERALL SECTOR R&D INTENSITY (R&D AS PERCENTAGE OF NET SALES – 2013)
According to EUROSTAT data, the pharmaceutical industry is the high technology sector with the hi-ghest added-value per person employed, signifi -cantly higher than the average value for hightech and manufacturing industries. The pharmaceutical
industry is also the sector with the highest ratio of R&D investment to net sales. According to the 2014 EU Industrial R&D Investment Scoreboard, the phar-maceuticals and biotechnology sector amounts to 18.0% of total business R&D expenditure worldwide.
PHARMACEUTICAL PRODUCTION
14.4%
10.4%
8.0%
7.3%
4.6%
4.3%
4.3%
4.2%
3.2%
2.8%
2.6%
2.2%
2.0%
1.8%
1.0%
0.3%
Software & computer services
Pharmaceuticals & biotechnology
Technology hardware & equipment
Leisure goods
Aerospace & defence
Automobiles & parts
Electronic & electrical equipment
Healthcare equipment & services
Total 40 industries
Industrial engineering
Chemicals
General industrials
Banks
Fixed line telecommunications
Construction & materials
Oil & gas producers
0 2 4 6 8 10 12 14 16
Graph 12
EFPIA 2013 € million € millionAustria 2,692
Belgium 8,034
Bulgaria 117
Croatia 617
Cyprus 180
Czech Republic n.a.
Denmark 8,725
Estonia n.a.
Finland 1,450
France 20,507
Germany 29,010
Greece 938
Hungary 2,629
Ireland 18,896
Italy 27,461
Latvia 120
Lithuania n.a.
Malta n.a.
Netherlands 6,180
Norway 745
Poland 2,710
Portugal 1,434
Romania 655
Russia 5,879
Serbia n.a.
Slovakia n.a.
Slovenia 1,903
Spain 14,486
Sweden 6,677
Switzerland 33,010
Turkey 3,690
United Kingdom 18,183
TOTAL 216,928
Note: All data based on SITC 54 Denmark, Hungary, Norway: 2012 data; Cyprus, Netherlands: 2010 data Croatia, Denmark, France, Ireland, Italy, Netherlands, Norway, Portugal, Slovenia, Spain, Sweden, Switzerland: estimate Bulgaria, Croatia, Cyprus, France, Germany, Hungary, Ireland, Latvia, Norway, Poland, Portugal, Romania, Slovenia: veterinary products excluded
Source: EFPIA member associations (offi cial fi gures) Graph 13 - à remplir
Austria
€ million
453
Belgium
Austria
Belgium2,493
€ million
453
2,493
216,928TOTAL
Efpia 2013
PHARMACEUTICAL PRODUCTION
Note: Data relate to the top 2,500 companies with registered offi ces in the EU (633), Japan (387), The USA (804) and the Rest of the World (676), ranked by total worldwide R&D investment (with R&D investment above €15.5 million)
Source: The 2014 EU Industrial R&D Investment Scoreboard, European Commission, JRC /DG RTD

EFPIA Key Data | 2015
1312
EMPLOYMENT IN THE PHARMACEUTICAL INDUSTRY
Note: Data includes Turkey (since 2011), Croatia and Lithuania (since 2010), Bulgaria, Estonia and Hungary (since 2009), Czech Republic (since 2008), Cyprus (since 2007), Latvia, Romania & Slovakia (since 2005), Malta, Poland and Slovenia (since 2004)
Source: EFPIA member associations (official figures) - (e): EFPIA estimate
Note: Data includes Greece & Lithuania (since 2013), Bulgaria and Turkey (since 2012), Poland (since 2010), Czech Republic, Estonia and Hungary (since 2009), Romania (since 2005) and Slovenia (since 2004) Croatia, Cyprus, Latvia, Malta, Serbia, Slovakia: data not available
Source: EFPIA member associations - (e): EFPIA estimate
EMPLOYMENT IN THE PHARMACEUTICAL INDUSTRY (1990-2014) (NUMBER OF PEOPLE)
EMPLOYMENT IN PHARMACEUTICAL R&D (1990-2014) (NUMBER OF PEOPLE)
The research-based pharmaceutical industry is one of Europe’s major high-technology industrial em-ployers. Recent studies in some countries showed that the research-based pharmaceutical industry generates three to four times more employment in-directly - upstream and downstream - than it does
directly. Further, a significant proportion of these are valuable skilled jobs, for instance in the fields of aca-demia or clinical science, which can help maintain a high-level knowledge base and prevent a European “brain drain”.
2014
2013
2010
2005
2000
1995
1990
100,0000 200,000 300,000 400,000 500,000 600,000 700,000 800,000
500,879
500,699
534,882
636,763
670,088
706,811
707,000 (e)
2014
2013
2010
2005
2000
1995
1990
20,0000 40,000 60,000 80,000 100,000 120,000
76,126
82,618
88,397
100,726
117,035
115,619
116,000 (e)
EFPIA 2013 number of people number of peopleAustria 12,226
Belgium 33,701
Bulgaria 9,900
Croatia 5,800
Cyprus 1,140
Czech Republic 14,800
Denmark 21,150
Estonia 400
Finland 5,465
France 93,209
Germany 110,036
Greece 13,200
Hungary 22,600
Ireland 25,441
Italy 62,300
Latvia 1,971
Lithuania 1,220
Malta 445
Netherlands 13,000
Norway 3,800
Poland 27,570
Portugal 8,000
Romania 23,500
Serbia n.a.
Slovakia 3,000
Slovenia 8,550
Spain 36,992
Sweden 11,482
Switzerland 40,913
Turkey 22,000
United Kingdom 73,000
TOTAL 706,811
Note: Austria, Hungary, Latvia, Netherlands, Portugal, Slovakia, United Kingdom: 2012 data; Malta: 2004 data Austria, Belgium, Bulgaria, Croatia, Estonia, France, Greece, Ireland, Italy, Malta, Netherlands, Norway, Poland, Romania, Slovenia, Sweden, Switzerland, Turkey, United Kingdom: estimate
Source: EFPIA member associations (official figures)

EFPIA Key Data | 2015
1514
PHARMACEUTICAL SALESPHARMACEUTICAL MARKET VALUE SALES (AT EX-FACTORY PRICES)
PRICE STRUCTURE
The world pharmaceutical market was worth an estimated € 651,500 million ($ 865,518 million) at ex-factory prices in 2014. The North American market (USA & Canada) remained the world’s largest market with a 44.5% share, well ahead of Europe and Japan.
Distribution margins, which are generally fi xed by governments, and VAT rates diff er signifi cantly from country to country in Europe. On average, approximately one third of the retail price of a medicine reverts to distributors (pharmacists and wholesalers) and the state.
Note: Europe includes Turkey and Russia
Source: IMS Health (MIDAS), April 2015 (data relate to the 2014 audited global retail pharmaceutical market at ex-factory prices)
Note: Non-weighted average for Europe (average estimate for 23 countries)
Source: EFPIA member associations
BREAKDOWN OF THE WORLD PHARMACEUTICAL MARKET – 2014 VALUE SALES
BREAKDOWN OF THE RETAIL PRICE OF A MEDICINE, 2013 (%)
Graph 17
Graph 18
Breakdown of the world pharmaceutical market – 2014 sales
Breakdown of the retail price of a medicine, 2013 (%)
North America (USA, Canada)
North America (USA, Canada)
Europe
44.5%25.3%
Japan8.9%
Latin America4.7%
66.1%Manufacturer
19.2%Pharmacist
4.9%Wholesaler
9.8%State (VAT and other taxes)
Africa, Asia &Australia
* Excluding Japan
16.6%
Graph 17
Graph 18
Breakdown of the world pharmaceutical market – 2014 sales
Breakdown of the retail price of a medicine, 2013 (%)
North America (USA, Canada)
North America (USA, Canada)
Europe
44.5%25.3%
Japan8.9%
North America North America (USA, Canada)(USA, Canada)North America (USA, Canada)(USA, Canada)North America (USA, Canada)(USA, Canada)North America (USA, Canada)(USA, Canada)North America (USA, Canada)(USA, Canada)North America (USA, Canada)North America (USA, Canada)North America (USA, Canada)North America (USA, Canada)North America (USA, Canada)North America (USA, Canada)North America (USA, Canada)North America (USA, Canada)North America (USA, Canada)North America (USA, Canada)North America (USA, Canada)North America (USA, Canada)North America (USA, Canada)North America (USA, Canada)North America (USA, Canada)North America (USA, Canada)North America (USA, Canada)North America (USA, Canada)North America (USA, Canada)North America (USA, Canada)North America (USA, Canada)North America (USA, Canada)North America (USA, Canada)North America (USA, Canada)North America (USA, Canada)North America (USA, Canada)North America (USA, Canada)North America (USA, Canada)North America (USA, Canada)North America (USA, Canada)North America (USA, Canada)North America (USA, Canada)North America (USA, Canada)North America (USA, Canada)North America (USA, Canada)North America (USA, Canada)North America (USA, Canada)North America (USA, Canada)North America (USA, Canada)North America (USA, Canada)North America (USA, Canada)North America (USA, Canada)North America (USA, Canada)North America (USA, Canada)North America (USA, Canada)North America (USA, Canada)North America (USA, Canada)North America (USA, Canada)North America (USA, Canada)North America (USA, Canada)North America (USA, Canada)North America (USA, Canada)North America (USA, Canada)North America (USA, Canada)North America (USA, Canada)North America (USA, Canada)North America (USA, Canada)
Latin America4.7%
66.1%Manufacturer
19.2%Pharmacist
4.9%Wholesaler
9.8%State (VAT and other taxes)
Africa, Asia &Australia
* Excluding Japan
16.6%
EFPIA 2013 € million € millionAustria 3,207
Belgium 4,432
Bulgaria 853
Croatia 647
Cyprus 198
Czech Republic 2,125
Denmark 2,095
Estonia 231
Finland 2,114
France 26,744
Germany 26,960
Greece 3,949
Hungary 2,010
Iceland 108
Ireland 1,788
Italy 20,941
Latvia 310
Lithuania 467
Malta 77
Netherlands 4,471
Norway 1,652
Poland 5,347
Portugal 2,804
Romania 2,659
Russia 13,736
Serbia 564
Slovakia 1,166
Slovenia 507
Spain 13,203
Sweden 3,653
Switzerland 4,124
Turkey 6,945
United Kingdom 16,671
TOTAL 176,758
Note: Medicinal products as defi ned by Directive 2001/83/EEC Cyprus, Denmark, Finland, Iceland, Latvia, Lithuania, Norway, Slovenia, Sweden: pharmaceutical market value at pharmacy purchasing prices Serbia: 2011 data; Malta: 2007 data Belgium, France, Germany, Ireland, Italy, Malta, Norway, Spain, United Kingdom: estimate
Source: EFPIA member associations (offi cial fi gures) – Hungary, Slovakia: IMS Health The fi gures above are for pharmaceutical sales, at ex-factory prices, through all distribution channels (pharmacies, hospitals, dispensing doctors, supermarkets, etc.), whether dispensed on prescription or at the patient’s request. Sales of veterinary medicines are excluded.

EFPIA Key Data | 2015
1716
VAT RATES APPLICABLE TO MEDICINES GENERICSThe table below shows the VAT rates applied to medicines in European countries as of 1 January 2015.
The term ‘generic’ is widely used, but its definition is not always consistent between countries. Generics are usually produced by a manufacturer who is not the inventor of the original product, and are marke-ted when intellectual property protection rights are
exhausted. In general, the market share of generics is significantly higher in newer EU Member States with historically low levels of intellectual property protection.
Country Standard VAT rate (%) VAT rates applied to medicines Prescription (%) OTC (%)
Austria 20.0 10.0 10.0Belgium 21.0 6.0 6.0Bulgaria 20.0 20.0 20.0Croatia 25.0 5.0 25.0Cyprus 19.0 5.0 5.0Czech Republic 21.0 10.0 10.0Denmark 25.0 25.0 25.0Estonia 20.0 9.0 9.0Finland 24.0 10.0 10.0France (1) 20.0 2.1 10.0Germany 19.0 19.0 19.0Greece 23.0 6.5 6.5Hungary 27.0 5.0 5.0Iceland 24.0 24.0 24.0Ireland (2) 23.0 0.0 - 23.0 0.0 – 23.0Italy 22.0 10.0 10.0Latvia 21.0 12.0 12.0Lithuania (3) 21.0 5.0 21.0Luxembourg 17.0 3.0 3.0Malta 18.0 0.0 0.0Netherlands 21.0 6.0 6.0Norway 25.0 25.0 25.0Poland 23.0 8.0 8.0Portugal 23.0 6.0 6.0Romania 24.0 9.0 9.0Russia 10.0 10.0 10.0Serbia 20.0 10.0 10.0Slovakia 20.0 10.0 10.0Slovenia 22.0 9.5 9.5Spain 21.0 4.0 4.0Sweden 25.0 0.0 25.0Switzerland 8.0 2.5 2.5Turkey 18.0 8.0 8.0United Kingdom 20.0 0.0 20.0
(1) France: reimbursable medicines 2.1%; non-reimbursable medicines 10.0% (2) Ireland: oral medication 0%; other medication 23% (3) Lithuania: reimbursable medicines 5.0%; non-reimbursable medicines 21.0%
Note: Croatia, Denmark, Estonia, Finland, Greece, United Kingdom: share of generics in pharmacy market sales Austria, Belgium, Bulgaria, France, Germany, Ireland, Italy, Portugal, Slovenia, Spain: share of generics in reimbursable pharmacy market sales Latvia, Lithuania, Netherlands, Poland, Romania, Russia, Sweden, Switzerland, Turkey: share of generics in total market sales Cyprus, Czech Republic, Hungary, Iceland, Malta, Norway, Serbia, Slovakia: 2013 data not available France: data relate only to those active substances listed on the official list of medicines Definition: ‘generic’ means a medicine based on an active substance that is out of patent and which is marketed under a different name from that of the original branded medicine
Source: EFPIA member associations
SHARE (ESTIMATE - IN %) ACCOUNTED FOR BY GENERICS IN PHARMACEUTICAL MARKET SALES VALUE (AT EX-FACTORY PRICES), 2013
36.0
14.6
38.0
45.0
27.7
20.8
23.0
18.6
34.3
15.1
18.0
41.5
45.9
34.1
12.7
54.8
22.6
25.9
26
24.1
18.5
21.1
11.5
39.6
27.0
0% 10% 20% 30% 40% 50% 60%
Austria
Belgium
Bulgaria
Croatia
Denmark
Estonia
Finland
France
Germany
Greece
Ireland
Italy
Latvia
Lithuania
Netherlands
Poland
Portugal
Romania
Russia
Slovenia
Spain
Sweden
Switzerland
Turkey
UK

EFPIA Key Data | 2015
1918
PHARMACEUTICAL EXPORTS PHARMACEUTICAL IMPORTS
EFPIA 2013 € million € millionAustria 7,574
Belgium 36,789
Bulgaria 695
Croatia 410
Cyprus 244
Czech Republic 1,490
Denmark 9,519
Estonia 55
Finland 909
France 28,553
Germany 56,952
Greece 1,051
Hungary 3,654
Ireland 21,239
Italy 18,777
Latvia 297
Lithuania 383
Luxembourg 257
Malta 258
Netherlands 18,935
Norway 585
Poland 2,383
Portugal 732
Romania 930
Russia 284
Slovakia 367
Slovenia 2,317
Spain 10,475
Sweden 6,500
Switzerland 46,934
Turkey 619
United Kingdom 24,966
TOTAL 305,133
EFPIA 2013 € million € millionAustria 6,787
Belgium 30,918
Bulgaria 919
Croatia 636
Cyprus 223
Czech Republic 2,960
Denmark 3,476
Estonia 306
Finland 1,831
France 22,418
Germany 35,243
Greece 2,752
Hungary 2,696
Ireland 4,506
Italy 18,792
Latvia 456
Lithuania 703
Luxembourg 446
Malta 120
Netherlands 13,123
Norway 1,468
Poland 4,479
Portugal 2,076
Romania 2,650
Russia 9,786
Slovakia 1,520
Slovenia 921
Spain 11,435
Sweden 3,475
Switzerland 18,048
Turkey 3,389
United Kingdom 21,684
TOTAL 230,242
Note: All data based on SITC 54 Norway: veterinary products excluded
Source: Eurostat (COMEXT database – December 2014) Norway: Statistics Norway; Switzerland: Swiss Federal Customs Administration
Note: All data based on SITC 54Norway: veterinary products excluded
Source: Eurostat (COMEXT database – December 2014)Norway: Statistics Norway; Switzerland: Swiss Federal Customs Administration

EFPIA Key Data | 2015
2120
EU exports
37.8%
30.0%
USA Others
16.5%
41.6%
Switzerland
35.5%
10.9%
ChinaRussia
6.5%
-
Japan
5.6% 5.4%
- 4.0%
India
2.1%
-
Singapore
4.1%
-
EU imports
EU exportsEU imports EU exportsEU imports
Graph 25
Graph 24
EU -28 trade balance - High technology sectors (€ million) - 2014
The European Union’s top 5 pharmaceutical trading partners - 2014
EU exports
10,000
20,000
30,000
40,000
50,000
60,000
0
55,337
33,611
-60,000
-50,000
-40,000
-30,000
-20,000
-10,000
-45,320-44,497
2,980
18,135
SITC 54 Pharmaceutical products
SITC 71 Power generating machinery and equipment
SITC 75 Office machines and computers
SITC 76 Telecommunication, sound, TV, video
SITC 77 Electrical machinery
SITC 87 Professional, scientific, controlling material
41.6%16.5%
Others
30.0%
USA
10.9%35.5
SWITZERLAND
5.6%JAPAN
5.4%
CHINA
6.5%RUSSIA
EU imports
37.8%
4.0%
SINGAPORE4.1%
INDIA2.1%
PHARMACEUTICAL TRADE BALANCE
Source: Eurostat, COMEXT database, April 2015
Source: Eurostat, COMEXT database, April 2015
EU-28 TRADE BALANCE - HIGH TECHNOLOGY SECTORS (€ MILLION) - 2014
THE EUROPEAN UNION’S TOP 5 PHARMACEUTICAL TRADING PARTNERS - 2014
EFPIA 2013 € million € millionAustria 787
Belgium 5,871
Bulgaria - 224
Croatia - 226
Cyprus 21
Czech Republic - 1,470
Denmark 6,043
Estonia - 251
Finland - 922
France 6,135
Germany 21,709
Greece - 1,701
Hungary 958
Ireland 16,733
Italy - 15
Latvia - 159
Lithuania - 320
Luxembourg - 189
Malta 138
Netherlands 5,812
Norway - 883
Poland - 2,096
Portugal - 1,344
Romania - 1,720
Russia -9,502
Slovakia - 1,153
Slovenia 1,396
Spain - 960
Sweden 3,025
Switzerland 28,886
Turkey - 2,770
United Kingdom 3,282
TOTAL 74,891
Note: All data based on SITC 54 Norway: veterinary products excluded
Source: Eurostat (COMEXT database – December 2014) Norway: Statistics Norway; Switzerland: Swiss Federal Customs Administration
Graph 25
Graph 24
EU -28 trade balance - High technology sectors (€ million) - 2014
The European Union’s top 5 pharmaceutical trading partners - 2014
EU exports
10,000
20,000
30,000
40,000
50,000
60,000
0
55,337
33,611
-60,000
-50,000
-40,000
-30,000
-20,000
-10,000
-45,320-44,497
2,980
18,135
SITC 54 Pharmaceutical products
SITC 71 Power generating machinery and equipment
SITC 75 Office machines and computers
SITC 76 Telecommunication, sound, TV, video
SITC 77 Electrical machinery
SITC 87 Professional, scientific, controlling material
41.6%16.5%
Others
30.0%
USA
10.9%35.5
SWITZERLAND
5.6%JAPAN
5.4%
CHINA
6.5%RUSSIA
EU imports
37.8%
4.0%
SINGAPORE4.1%
INDIA2.1%

EFPIA Key Data | 2015
2322
TOTAL SPENDING (PUBLIC AND PRIVATE) ON HEALTHCAREAS A PERCENTAGE OF GDP AT MARKET PRICES
PAYMENT FOR PHARMACEUTICALS BY COMPULSORY HEALTH INSURANCE SYSTEMS AND NATIONAL HEALTH SERVICES (ambulatory care only)
Country 1970 1980 1990 2000 2010 2012Austria 5.2 7.5 8.4 10.0 11.1 11.1
Belgium 3.9 6.3 7.2 8.1 10.6 10.9
Czech Republic - - 4.4 6.3 7.4 7.5
Denmark - 8.9 8.3 8.7 11.1 11.0
Estonia - - - 5.3 6.3 5.9
Finland 5.5 6.3 7.7 7.2 9.0 9.1
France 5.4 7.0 8.4 10.1 11.6 11.6
Germany 6.0 8.4 8.3 10.4 11.6 11.3
Greece 5.5 5.9 6.7 8.0 9.5 9.3
Hungary - - - 7.2 8.1 8.0
Iceland 4.7 6.3 7.8 9.5 9.3 9.0
Ireland 5.0 8.1 6.0 6.2 9.2 8.9
Italy - - 7.7 7.9 9.4 9.2
Luxembourg 3.1 5.2 5.4 7.5 7.6 7.1
Netherlands - 7.0 7.5 7.6 11.2 11.8
Norway 4.4 7.0 7.6 8.4 9.4 9.3
Poland - - 4.8 5.5 7.0 6.8
Portugal 2.3 4.9 5.6 8.6 10.2 9.5
Slovakia - - - 5.5 8.5 8.1
Slovenia - - - 8.3 9.1 9.4
Spain 3.5 5.3 6.5 7.2 9.6 9.3
Sweden 6.6 8.7 8.1 8.2 9.5 9.6
Switzerland 5.3 7.2 8.0 9.9 10.9 11.4
Turkey - 2.4 2.7 4.9 5.6 5.4
United Kingdom 4.5 5.6 5.8 6.9 9.4 9.3
Europe 4.7 6.6 6.8 7.7 9.3 9.2
USA 6.8 8.7 11.9 13.1 17.0 16.9
Japan 4.4 6.4 5.8 7.6 9.6 10.3
Note: Europe: non-weighted average (25 countries) – EFPIA calculations
Source: OECD Health Data 2014, November 2014
EFPIA 2013 € million € millionAustria 2,348
Belgium 3,597
Bulgaria 293
Croatia 462
Cyprus 44
Czech Republic 579
Denmark 734
Estonia 106
Finland 1,273
France 22,585
Germany 30,094
Greece 2,534
Hungary 1,095
Iceland 92
Ireland 1,443
Italy 8,863
Latvia 116
Lithuania 194
Malta n.a.
Netherlands 4,338
Norway 1,207
Poland 1,711
Portugal 1,160
Romania 1,137
Serbia 263
Slovakia 894
Slovenia 281
Spain 9,183
Sweden 2,030
Switzerland 4,082
Turkey 5,887
United Kingdom 10,760
TOTAL 119,385
Note: Hungary: 2012 data; Slovakia: 2011 dataFrance, Ireland, Netherlands, Norway, Sweden, United Kingdom: estimate
Source: EFPIA member associations (official figures)

EFPIA Key Data | 2015
2524
CAUSES OF DEATH BY MAJOR DISEASE AREAS IN EUROPE (EU-28)
THE ADDED VALUE OF MEDICINES IN HEALTHCARE
Data Source: Eurostat, data relate to year 2012 (non-disease directly related causes of deaths: EFPIA calculations), April 2015
Medicines constitute only a small part of healthcare costs with, on average, 16.9% of total health expen-diture in Europe being spent on pharmaceuticals and other medical non-durables. In costly diseases such as cancer and rheumatoid arthritis, medicines account for even less than 10% of the total disease costs. Medicines can also generate additional sa-vings, for example by substantially reducing costs in other areas of healthcare, including hospital stays and long-term care costs.
Source: OECD Health Data 2014, November 2014 – EFPIA calculations (non-weighted average for 21 EU & EFTA countries)
Source: Lichtenberg, F: Pharmaceutical innovation and longevity growth in 30 developing OECD and high-income countries, 2000-2009 (2012)
Life Expectancy (years)
BREAKDOWN OF TOTAL HEALTH EXPENDITURE IN EUROPE – 2012
CONTRIBUTION OF INNOVATIVE MEDICINES TO INCREASE IN LIFE EXPECTANCY (2000-2009)
Graph 28
Causes of death by major disease areas in Europe (EU-28)
Diseases of the circulatory system
Malignant neoplasms
Diseases of the respiratory system
Diseases of the digestive system
38.1%
9.4%
25.9%
8.0%
4.4%
3.6%
2.9%
3.2%
1.9%1.6%
0.5%0.3%
0.2%
Mental and behavioural disorders
Diseases of the genitourinary system
Certain infectious and parasitic diseases
Diseases of the blood(-forming organs) and immune mechanism disorders
Diseases of the skin and subcutaneous tissue
Others (non-disease directly related causes of deaths)
Diseases of the musculoskeletal system and connective tissues
Diseases of the nervous system and the sense organs
Endocrine, nutritional and metabolic diseases
Graph 29
Graph 30
Contribution of innovative medicines to increase in life expectancy (2000-2009)
Breakdown of total health expenditure in Europe – 2012
16.9%36.6%46.5%
Outpatient care & others
In-patient care (hospital)
Pharmaceuticals & other medical non-durables
2000 Other Contribution of InnovativeMedicines
2009
77.0
76.5
76.0
75.5
75.0
74.5
74.0
73.5
73.0
72.5
0
27%
73%
+ 1.74 years

EFPIA Key Data | 2015
2726
EFPIA MEMBER ASSOCIATIONS
ASSOCIATIONS WITH LIAISON STATUS
Austria Fachverband der Chemischen Industrie Österreichs (FCIO) Denmark Laegemiddelindustriforeningen The Danish Association of the Pharmaceutical Industry (Lif ) France Les Entreprises du Médicament (LEEM) Greece Hellenic Association of Pharmaceutical Companies (SFEE) Italy Associazione delle Imprese del Farmaco (Farmindustria) Norway Legemiddelindustriforeningen / Norwegian Association of Pharmaceutical Manufacturers (LMI)
Portugal Associação Portuguesa da Indústria Farmacêutica (Apifarma) Spain Asociación Nacional Empresarial de la Industria Farmacéutica (Farmaindustria) Switzerland Scienceindustries / Interpharma Belgium Association Générale de l’Industrie du Médicament (pharma.be) Finland Lääketeollisuus ry Pharma Industry Finland (PIF) Germany Verband Forschender Arzneimittelhersteller (VfA) Ireland Irish Pharmaceutical Healthcare Association (IPHA)
Netherlands Vereniging Innovatieve Geneesmiddelen Nederland (Nefarma) Poland Employers Union of Innovative Pharmaceutical Companies (Infarma) Russia Association of International Pharmaceutical Manufacturers (AIPM) Sweden Läkemedelsindustriföreningen The Swedish Association of the Pharmaceutical Industry (LIF) Turkey Arastirmaci Ilac Firmalari Dernegi (AIFD) United Kingdom The Association of the British Pharmaceutical Industry (ABPI)
Bulgaria: Association of Research-based Pharmaceutical Manufacturers in Bulgaria (ARPharM)
Croatia: Innovative Pharmaceutical Initiative (IF!)
Cyprus: Cyprus Association of Pharmaceutical Companies (KEFEA)
Czech Republic: Association of Innovative Pharmaceutical Industry (AIFP)
Estonia: Association of Pharmaceutical Manufacturers in Estonia (APME)
Hungary: Association of Innovative Pharmaceutical Manufacturers (AIPM)
Latvia: Association of International Research-based Pharmaceutical Manufacturers (AFA)
Lithuania: The Innovative Pharmaceutical Industry Association (IFPA)
Malta: Maltese Pharmaceutical Association (PRIMA)
Romania: Association of International Medicines Manufacturers (ARPIM)
Serbia: Innovative Drug Manufacturers’ Association (INOVIA)
Slovakia: Association of Innovative Pharmaceutical Industry (AIFP)
Slovenia: Forum of International Research and Development Pharmaceutical Industries (EIG)
Ukraine: Association of Pharmaceutical Research and Development (APRaD)
MEMBER COMPANIES
Full Members
AbbVie USA
Almirall Spain
Amgen USA
Astellas Pharma EMEA United Kingdom (Japan)
AstraZeneca (AZ) United Kingdom / Sweden
Baxter USA
Bayer HealthCare Germany
Biogen USA
Boehringer Ingelheim Germany
Bristol-Myers Squibb USA
Celgene USA
Chiesi Farmaceutici (Chiesi) Italy
Daiichi-Sankyo Europe Germany (Japan)
Eli Lilly (Lilly) USA
Genzyme USA
GlaxoSmithKline (GSK) United Kingdom
Grünenthal Germany
Ipsen France
Johnson & Johnson USA
Lundbeck Denmark
Menarini Italy
Merck Germany
Merck Sharp & Dohme (MSD) USA
Novartis Switzerland
Novo Nordisk Denmark
Pfizer USA
Roche Switzerland
Sanofi France
Servier France
Shire United Kingdom
Takeda Japan
UCB Belgium
Affiliate Members
Bial Portugal
Eisai Japan
Esteve Spain
Orion Pharma (Orion) Finland
Otsuka Japan
Recordati Italy
The Medicines Company USA
Vifor Pharma Switzerland

28
EFPIALeopold Plaza Building Rue du Trône 108
B-1050 Brussels BelgiumTel.: +32.(0)2.626.25.55
www.efpia.eu [email protected]
EFPIA (The European Federation of Pharmaceutical Industries and Associations) represents the research-based pharmaceutical industry operating in Europe.
Founded in 1978, its members comprise 33 national pharmaceutical industry associations and 40 leading pharmaceutical companies undertaking research, development and manufacturing of medicinal products
in Europe for human use.
Its mission is to promote pharmaceutical research and development and the best conditions in Europe for companies to bring to market medicines that improve human health and the quality of life around the
world. Through its membership, EFPIA represents the common views of more than 1,900 large, medium and small companies including the entire European research-based pharmaceutical sector whose interests also include an important part of the generics and biosimilars segments. Two specialised groups have been created within EFPIA to address specific issues relating to vaccines (Vaccines Europe, formerly EVM) and the
needs of biopharmaceutical companies (EBE - European Biopharmaceutical Enterprises).
Further details about the Federation and its activities can be obtained from: