Embed Size (px)
Citation preview
MATHEMATISCH-NATURWISSENSCHAFTLICHE FAKULTÄT
INSTITUT FÜR BIOCHEMIE UND BIOLOGIE
DISSERTATION
zur Erlangung des akademischen Grades
doctor rerum naturalium
THE ROLES OF SECONDARY METABOLITES IN
MICROCYSTIS INTER-STRAIN INTERACTIONS
vorgelegt von
A. Katharina Makower
Potsdam Golm, 02.02.2016

This work is licensed under a Creative Commons License: Attribution – Noncommercial 4.0 International To view a copy of this license visit http://creativecommons.org/licenses/by-nc/4.0/ Published online at the Institutional Repository of the University of Potsdam: URN urn:nbn:de:kobv:517-opus4-93916 http://nbn-resolving.de/urn:nbn:de:kobv:517-opus4-93916
0 - Abstract I
ABSTRACT
mong the bloom-forming and potentially harmful
cyanobacteria, the genus Microcystis represents a most
diverse taxon, on the genomic as well as on
morphological and secondary metabolite levels. Microcystis
communities are composed of a variety of diversified strains. The
focus of this study lies on potential interactions between
Microcystis representatives and the roles of secondary
metabolites in these interaction processes.
The role of secondary metabolites functioning as signaling
molecules in the investigated interactions is demonstrated
exemplary for the prevalent hepatotoxin microcystin. The
extracellular and intracellular roles of microcystin are tested in
microarray-based transcriptomic approaches. While an
extracellular effect of microcystin on Microcystis transcription is
confirmed and connected to a specific gene cluster of another
secondary metabolite in this study, the intracellularly occurring
microcystin is related with several pathways of the primary
metabolism. A clear correlation of a microcystin knockout and
the SigE-mediated regulation of carbon metabolism is found.
According to the acquired transcriptional data, a model is
proposed that postulates the regulating effect of microcystin on
transcriptional regulators such as the alternative sigma factor
SigE, which in return captures an essential role in sugar
catabolism and redox-state regulation.
For the purpose of simulating community conditions as found in
the field, Microcystis colonies are isolated from the eutrophic
A
0 - Abstract II
lakes near Potsdam, Germany and established as stably growing
under laboratory conditions. In co-habitation simulations, the
recently isolated field strain FS2 is shown to specifically induce
nearly immediate aggregation reactions in the axenic lab strain
Microcystis aeruginosa PCC 7806. In transcriptional studies via
microarrays, the induced expression program in PCC 7806 after
aggregation induction is shown to involve the reorganization of
cell envelope structures, a highly altered nutrient uptake balance
and the reorientation of the aggregating cells to a heterotrophic
carbon utilization, e.g. via glycolysis. These transcriptional
changes are discussed as mechanisms of niche adaptation and
acclimation in order to prevent competition for resources.
0 - Zusammenfassung III
ZUSAMMENFASSUNG
ie Gattung Microcystis stellt unter den blüten-
bildenden Cyanobakterien ein Taxon besonderer
Diversität dar. Dies gilt sowohl für die Genomstruktur
als auch für morphologische Charakteristika und
Sekundärmetabolite. Microcystis-Communities weisen eine
Zusammensetzung aus einer Vielzahl von diversifizierten
Stämmen auf. Das Hauptaugenmerk dieser Arbeit lag darauf,
potentielle Wechselwirkungen zwischen Microcystis-Vertretern
zu charakterisieren und die Rolle von Sekundärmetaboliten in
Interaktions-Prozessen zu untersuchen.
Die Rolle von Sekundärmetaboliten als Signalstoffe in
Microcystis-Interaktionen wurde exemplarisch für das
Hepatotoxin Microcystin demonstriert. Sowohl die
extrazelluläre als auch die intrazellulare Funktion von
Microcystin wurde anhand von Microarray-basierten
Transkriptomstudien getestet. Dabei konnte eine extrazelluläre
Wirkung von Microcystin bestätigt werden und mit der
Transkription eines spezifischen anderen Sekundärmetaboliten
in Verbindung gebracht werden. Intrazellulär vorkommendes
Microcystin wurde hingegen mit verschiedenen
Stoffwechselwegen des Primärstoffwechsels verknüpft. Es
konnte ein deutlicher Zusammenhang zwischen einem
Microcystin-Knockout und der SigE-vermittelten Regulation des
Kohlenstoffmetabolismus festgestellt werden. Anhand der
erworbenen Transkriptionsdaten wurde ein Modell
vorgeschlagen, das eine regulierende Wirkung von Microcystin
auf Transkriptionsfaktoren wie den alternativen Sigmafaktor
D
0 - Zusammenfassung IV
SigE postuliert, welcher seinerseits eine zentrale Rolle in
Zuckerabbauprozessen und zellulärer Redoxregulation
einnimmt.
Mit dem Ziel, Community-ähnliche Bedingungen zu simulieren,
wurden Microcystis-Freiland-Kolonien aus eutrophen
Gewässern in der Umgebung von Potsdam isoliert und ein
stabiles Wachstum unter Laborbedingungen etabliert. Es konnte
gezeigt werden, dass der frisch isolierte Freilandstamm FS2
spezifisch eine starke Zellaggregation in Microcystis aeruginosa
PCC 7806 (einem axenischen Labortstamm) auslösen konnte. In
Transkriptionsstudien mit Hilfe von Microarrays wurden
Expressionsprogramme gefunden, die sowohl einen Umbau von
Zellhüllstrukturen, als auch einen stark veränderten
transmembranen Nährstofftransport beinhalteten. Darüber
hinaus konnte in den aggregierenden PCC 7806-Zellen eine
Verlagerung zu heterotrophen Kohlenstoffabbauprozessen wie
der Glykolyse gefunden werden. Die transkriptionellen
Veränderungen wurden als Akklimationsmechanismen zur
Positionierung in ökologische Nischen diskutiert, um
Konkurrenzen um Ressourcen zu vermeiden.

0 - Declaration V
DECLARATION
This dissertation is the result of my own work. I assure I did not
use any other resources that the ones identified or referenced.
A. Katharina Makower
2016, University of Potsdam, Germany
0 - Abbreviations VI
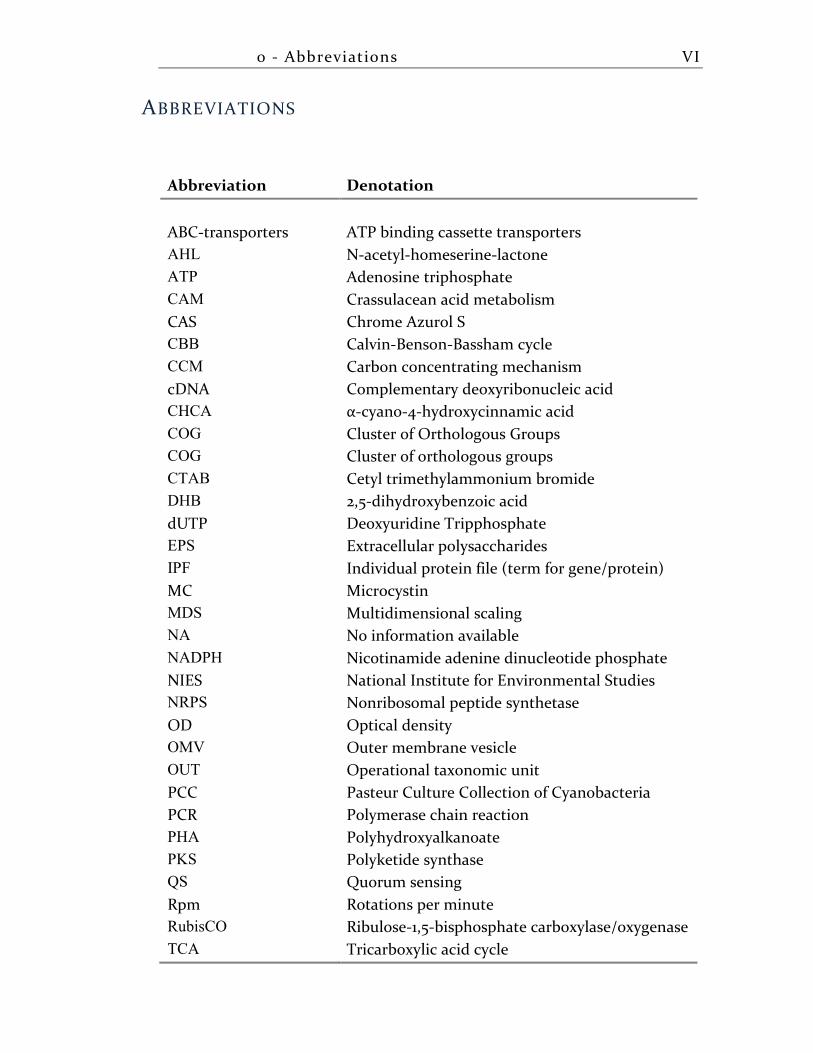
ABBREVIATIONS
Abbreviation Denotation
ABC-transporters ATP binding cassette transporters
AHL N-acetyl-homeserine-lactone
ATP Adenosine triphosphate
CAM Crassulacean acid metabolism
CAS Chrome Azurol S
CBB Calvin-Benson-Bassham cycle
CCM Carbon concentrating mechanism
cDNA Complementary deoxyribonucleic acid
CHCA α-cyano-4-hydroxycinnamic acid
COG Cluster of Orthologous Groups
COG Cluster of orthologous groups
CTAB Cetyl trimethylammonium bromide
DHB 2,5-dihydroxybenzoic acid
dUTP Deoxyuridine Tripphosphate
EPS Extracellular polysaccharides
IPF Individual protein file (term for gene/protein)
MC Microcystin
MDS Multidimensional scaling
NA No information available
NADPH Nicotinamide adenine dinucleotide phosphate
NIES National Institute for Environmental Studies
NRPS Nonribosomal peptide synthetase
OD Optical density
OMV Outer membrane vesicle
OUT Operational taxonomic unit
PCC Pasteur Culture Collection of Cyanobacteria
PCR Polymerase chain reaction
PHA Polyhydroxyalkanoate
PKS Polyketide synthase
QS Quorum sensing
Rpm Rotations per minute
RubisCO Ribulose-1,5-bisphosphate carboxylase/oxygenase
TCA Tricarboxylic acid cycle
0 - Contents VII
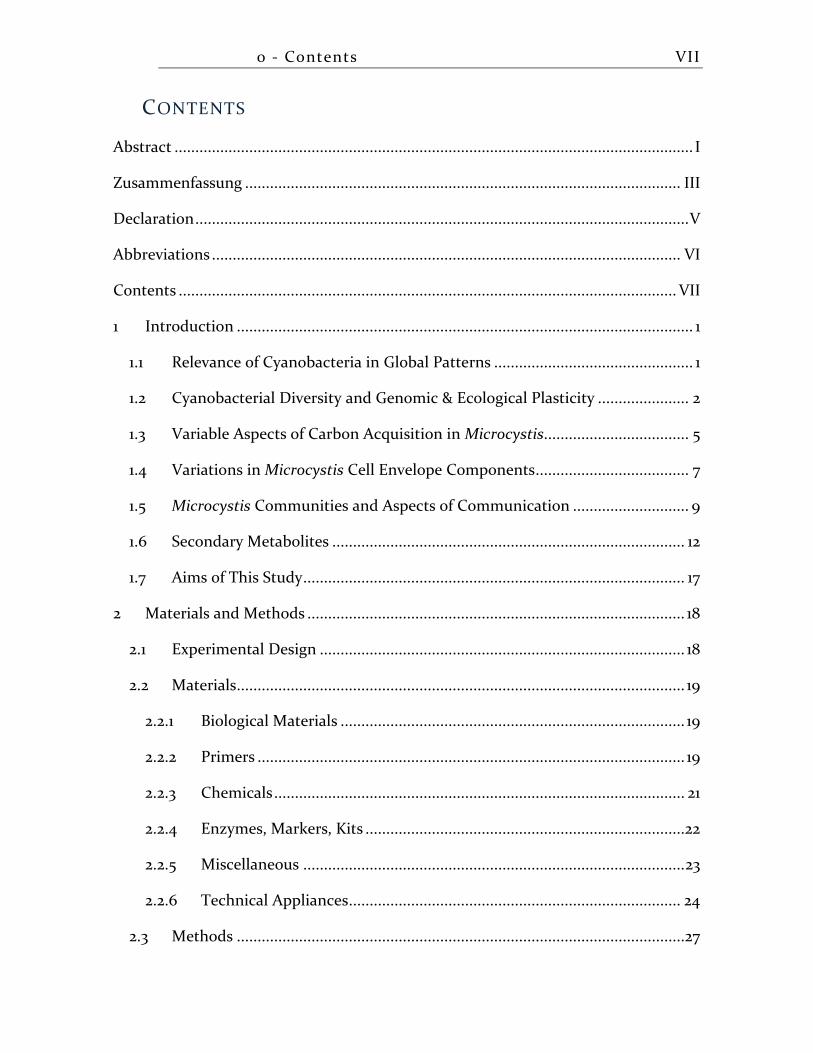
CONTENTS
Abstract ............................................................................................................................. I
Zusammenfassung ......................................................................................................... III
Declaration ....................................................................................................................... V
Abbreviations ................................................................................................................. VI
Contents ........................................................................................................................ VII
1 Introduction .............................................................................................................. 1
1.1 Relevance of Cyanobacteria in Global Patterns ................................................ 1
1.2 Cyanobacterial Diversity and Genomic & Ecological Plasticity ...................... 2
1.3 Variable Aspects of Carbon Acquisition in Microcystis................................... 5
1.4 Variations in Microcystis Cell Envelope Components ..................................... 7
1.5 Microcystis Communities and Aspects of Communication ............................ 9
1.6 Secondary Metabolites ..................................................................................... 12
1.7 Aims of This Study ............................................................................................ 17
2 Materials and Methods ........................................................................................... 18
2.1 Experimental Design ........................................................................................ 18
2.2 Materials ............................................................................................................ 19
2.2.1 Biological Materials ................................................................................... 19
2.2.2 Primers ....................................................................................................... 19
2.2.3 Chemicals ................................................................................................... 21
2.2.4 Enzymes, Markers, Kits .............................................................................22
2.2.5 Miscellaneous ............................................................................................ 23
2.2.6 Technical Appliances ................................................................................ 24
2.3 Methods ............................................................................................................27
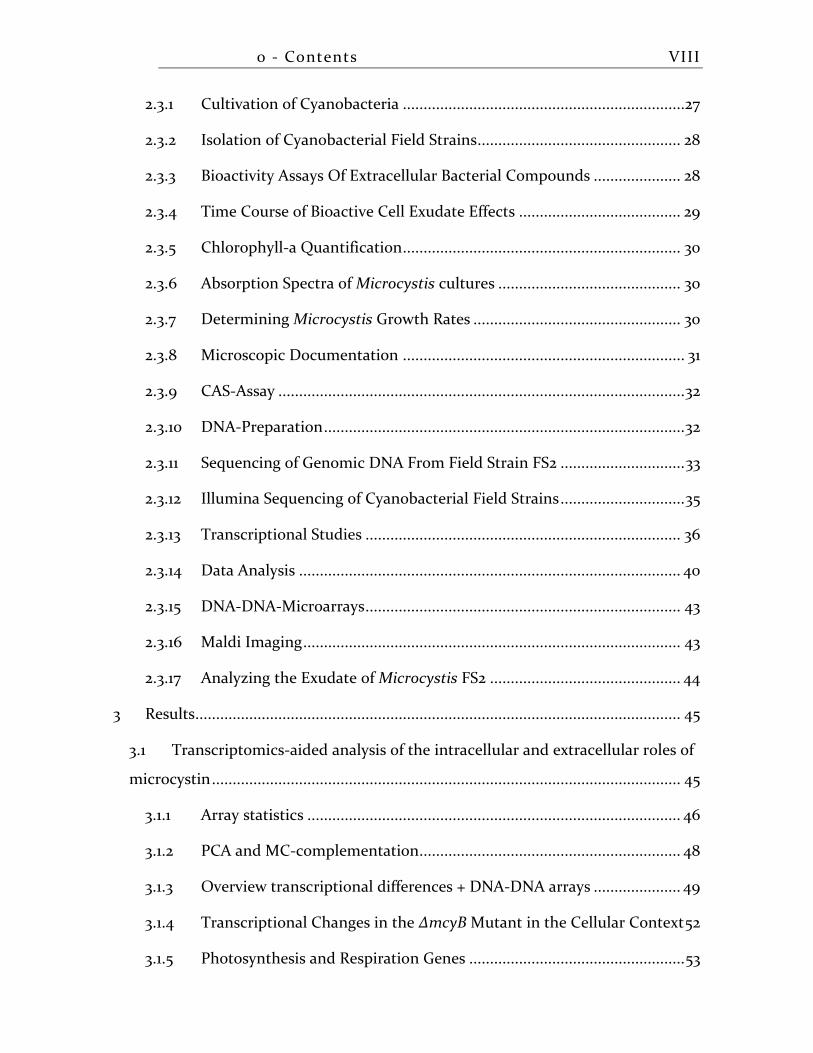
0 - Contents VIII
2.3.1 Cultivation of Cyanobacteria ....................................................................27
2.3.2 Isolation of Cyanobacterial Field Strains ................................................. 28
2.3.3 Bioactivity Assays Of Extracellular Bacterial Compounds ..................... 28
2.3.4 Time Course of Bioactive Cell Exudate Effects ....................................... 29
2.3.5 Chlorophyll-a Quantification ................................................................... 30
2.3.6 Absorption Spectra of Microcystis cultures ............................................ 30
2.3.7 Determining Microcystis Growth Rates .................................................. 30
2.3.8 Microscopic Documentation .................................................................... 31
2.3.9 CAS-Assay .................................................................................................. 32
2.3.10 DNA-Preparation ....................................................................................... 32
2.3.11 Sequencing of Genomic DNA From Field Strain FS2 .............................. 33
2.3.12 Illumina Sequencing of Cyanobacterial Field Strains .............................. 35
2.3.13 Transcriptional Studies ............................................................................ 36
2.3.14 Data Analysis ............................................................................................ 40
2.3.15 DNA-DNA-Microarrays ............................................................................ 43
2.3.16 Maldi Imaging ........................................................................................... 43
2.3.17 Analyzing the Exudate of Microcystis FS2 .............................................. 44
3 Results ..................................................................................................................... 45
3.1 Transcriptomics-aided analysis of the intracellular and extracellular roles of
microcystin ................................................................................................................. 45
3.1.1 Array statistics .......................................................................................... 46
3.1.2 PCA and MC-complementation ............................................................... 48
3.1.3 Overview transcriptional differences + DNA-DNA arrays ..................... 49
3.1.4 Transcriptional Changes in the ∆mcyB Mutant in the Cellular Context 52
3.1.5 Photosynthesis and Respiration Genes .................................................... 53
0 - Contents IX
3.1.6 Energy- & Central Intermediary Metabolism ........................................... 55
3.1.7 Single Noticeable Aspects of the Transcriptional State of ∆mcyB ......... 56
3.1.8 Secondary Metabolites .............................................................................. 57
3.2 Microcystis Community Interactions ............................................................. 63
3.2.1 Isolation and Characterization of Microcystis Strains From the Field .. 63
3.2.2 Analysis of the Bacterial Composition of Microcystis field isolate FS2 . 65
3.2.3 Effects of Spent Medium of Microcystis Field Strains on Established Lab
Strain 66
3.2.4 Genomic Characterization of the Microcystis Field Strain FS2.............. 69
3.2.5 Characterization of Sensitivities to Carbonate Supply in Mono and CO-
Cultivation of Microcystis PCC 7806 and FS2 ....................................................... 71
3.2.6 MALDI Imaging Analysis of the Microcystis Strains PCC 7806 and FS2
in Mono- and Co-Cultivation ................................................................................. 73
3.2.7 Analysis of the FS2 exudate ....................................................................... 75
3.2.8 The Transcriptional Response of PCC 7806 to the Exudate of FS2........ 76
4 Discussion............................................................................................................... 92
4.1 The Transcriptomic View into a ∆mcyB Mutant Cell .................................... 92
4.2 Discussing the Physiological Roles of Microcystin ........................................ 94
4.3 Cross-Talk Between Secondary Metabolites .................................................. 97
4.4 The Transcriptomic View into a PCC 7806 Cell After the Treatment with
Spent Medium of Microcystis FS2 ............................................................................. 99
4.5 The Ecological Niches of Two Microcystis Strains ....................................... 100
4.6 Bioactive Compounds in the Spent Medium of Microcystis Field Strain 2 . 102
4.7 Limitations to this Study and Future Outlook .............................................. 104
5 References.............................................................................................................. 107
0 - Contents X
6 Acknowledgements ................................................................................................ 121
7 Appendix ............................................................................................................... 122
7.1 Datasets ........................................................................................................... 122
7.2 List of figures .................................................................................................. 123
7.3 List of Tables ................................................................................................... 129
7.4 Publications .................................................................................................... 130
1 - Introduction 1
1 INTRODUCTION
1.1 RELEVANCE OF CYANOBACTERIA IN GLOBAL PATTERNS
s some of the oldest organisms in the earth’s history cyanobacteria
capture a vital role in geoecological equilibrium processes. Since the
first occurrence of cyanobacteria over 2.7 billion years ago (Brocks, et
al., 1999; Rasmussen, et al., 2008), these prokaryotic phototrophs have
undergone an extensive period of evolutionary adaptation, coping with partly
harsh environmental conditions and in turn shaping the face of the earth. The
most critical example of this being the creation of an oxygenic atmosphere
through O2-accumulation emerging as byproduct from oxygenic
photosynthesis (Berkner, et al., 1965).
Beyond that, cyanobacteria account for considerable proportions of biomass in
diverse ecosystems (Garcia-Pichel, et al., 2003). In aquatic systems, where mass
developments of single cyanobacterial representatives have been increasingly
observed over recent decades (Carmichael, 2008), cyanobacteria influence
nutrient cycles, as well as the ecological equilibrium and species composition
(Paerl, 2014). Cyanobacterial toxin production, associated with so called
cyanobacterial harmful algal blooms (CyanoHABs), poses a considerable threat
to human and animal health. Ingestion of substantial doses of cyanobacterial
toxins, for example through direct ingestion of contaminated drinking water
resources potentially turns out fatal (Crush, et al., 2008; Peuthert, et al., 2007;
Saqrane, et al., 2009; Yoshida, et al., 1997).
The ecological implications of mass cyanobacterial proliferation and the
potential for toxin production have given rise to a series of comprehensive
studies on bloom formation and correlated anthropogenic and natural impact
factors (Paerl, et al., 2013). While the role of abiotic factors such as high levels
of nitrogen (N), phosphorous (P), high temperatures and light intensities where
characterized as bloom-promoting in multiple studies (Elser, et al., 2007; Foy,
A
1 - Introduction 2
et al., 1976; Robarts, et al., 1987; Xu, et al., 2010), evidence for the role of biotic
factors is beginning to expand. Cyanobacterial blooms rarely represent a single
cyanobacterial taxon (Woodhouse, et al., 2015) and the production of signaling
molecules and their role in inter-species interactions are only at the beginning
to be understood (Briand, et al., 2015; Kaplan, et al., 2012). Understanding the
interactions of co-occurring cyanobacteria in blooms and the involvement and
interdependencies of cyanobacterial metabolites represents a novel strategy for
advancing our understanding of the ecological success of cyanobacteria.
1.2 CYANOBACTERIAL DIVERSITY AND GENOMIC & ECOLOGICAL
PLASTICITY
Over 2.7 billion years of evolution have enabled cyanobacteria to explore and
adapt to almost any habitat on earth. Representatives of this diverse group of
phototrophic gram negative bacteria can occur in aquatic as well as terrestrial
habitats, from polar to tropical climatic regions, in acidic, saline and limnic
waters and also in symbiotic life forms (Pankratova, et al., 1969; Seckbach, 2007;
Whitton, et al., 2002), (Figure 1-1 a-c). Adaptations to harsh environmental
conditions constitute a broad range of characteristics including protective cell
envelope structures (Kehr, et al., 2015), red-shift chlorophylls and other light
harvesting pigments (Chen, et al., 2010), UV-protective pigments (scytonemin,
etc.) (Dillon, et al., 2003), the production of secondary metabolites, and fine-
tuned nutrient uptake systems (Sandrini, et al., 2013). The morphological
diversity of cyanobacteria is immense encompassing both, unicellular and
multi-cellular filamentous forms (Figure 1-1 d, e). Additionally, differentiated
motile (hormogonia) or dormant (akinetes) forms, floating colonies or sessile
biofilms are frequently found in the field. Originally classified into five
subsections, based on these gross morphological characteristics, phylogenetic
analysis has since placed greater emphasis on sub-cellular characteristics
(Giovannoni, et al., 1988; Gugger, et al., 2004).
1 - Introduction 3
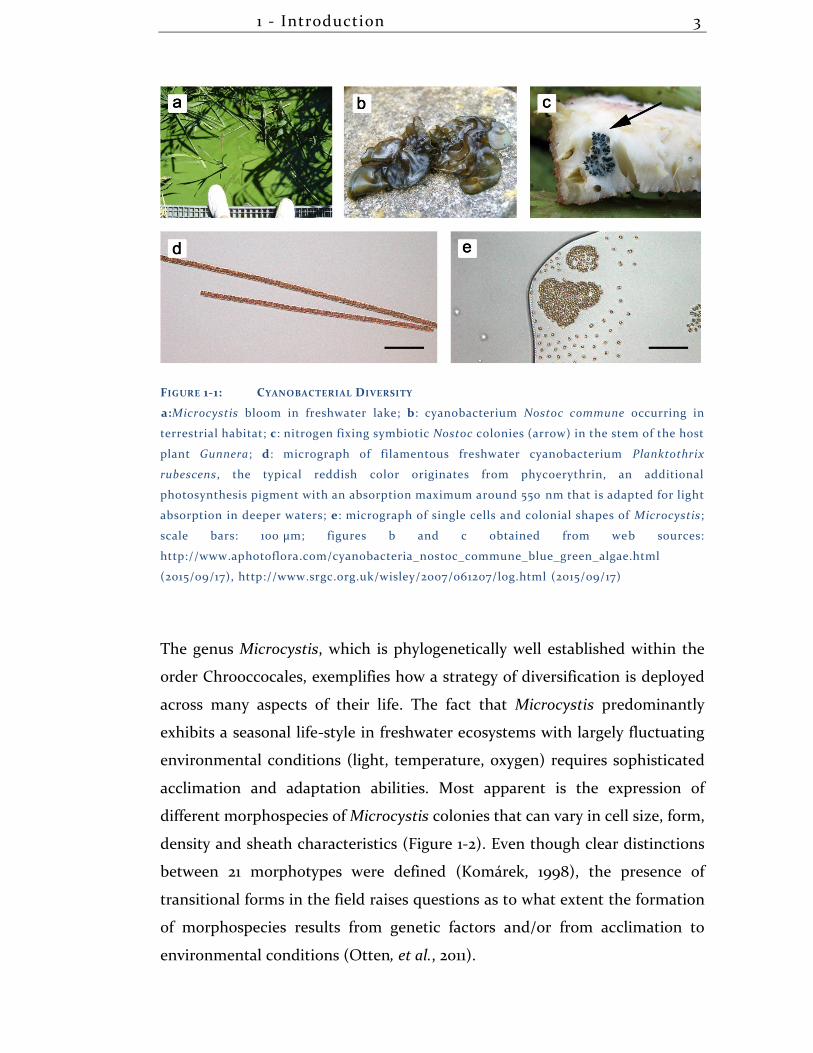
FIGURE 1-1: CYANOBACTERIAL DIVERSITY
a:Microcystis bloom in freshwater lake; b: cyanobacterium Nostoc commune occurring in
terrestrial habitat; c: nitrogen fixing symbiotic Nostoc colonies (arrow) in the stem of the host
plant Gunnera; d: micrograph of filamentous freshwater cyanobacterium Planktothrix
rubescens, the typical reddish color originates from phycoerythrin, an additional
photosynthesis pigment with an absorption maximum around 550 nm that is adapted for light
absorption in deeper waters; e: micrograph of single cells and colonial shapes of Microcystis;
scale bars: 100 µm; figures b and c obtained from web sources:
http://www.aphotoflora.com/cyanobacteria_nostoc_commune_blue_green_algae.html
(2015/09/17), http://www.srgc.org.uk/wisley/2007/061207/log.html (2015/09/17)
The genus Microcystis, which is phylogenetically well established within the
order Chrooccocales, exemplifies how a strategy of diversification is deployed
across many aspects of their life. The fact that Microcystis predominantly
exhibits a seasonal life-style in freshwater ecosystems with largely fluctuating
environmental conditions (light, temperature, oxygen) requires sophisticated
acclimation and adaptation abilities. Most apparent is the expression of
different morphospecies of Microcystis colonies that can vary in cell size, form,
density and sheath characteristics (Figure 1-2). Even though clear distinctions
between 21 morphotypes were defined (Komárek, 1998), the presence of
transitional forms in the field raises questions as to what extent the formation
of morphospecies results from genetic factors and/or from acclimation to
environmental conditions (Otten, et al., 2011).
1 - Introduction 4
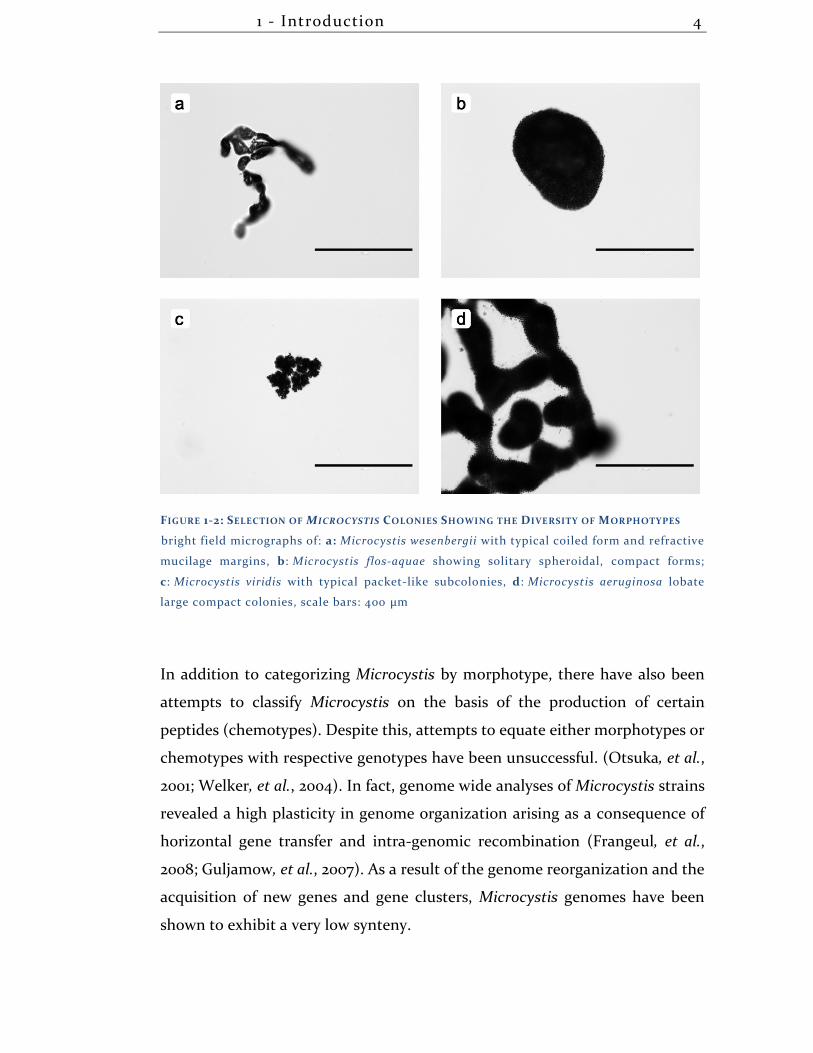
FIGURE 1-2: SELECTION OF MICROCYSTIS COLONIES SHOWING THE DIVERSITY OF MORPHOTYPES
bright field micrographs of: a: Microcystis wesenbergii with typical coiled form and refractive
mucilage margins, b: Microcystis flos-aquae showing solitary spheroidal, compact forms;
c: Microcystis viridis with typical packet-like subcolonies, d: Microcystis aeruginosa lobate
large compact colonies, scale bars: 400 µm
In addition to categorizing Microcystis by morphotype, there have also been
attempts to classify Microcystis on the basis of the production of certain
peptides (chemotypes). Despite this, attempts to equate either morphotypes or
chemotypes with respective genotypes have been unsuccessful. (Otsuka, et al.,
2001; Welker, et al., 2004). In fact, genome wide analyses of Microcystis strains
revealed a high plasticity in genome organization arising as a consequence of
horizontal gene transfer and intra-genomic recombination (Frangeul, et al.,
2008; Guljamow, et al., 2007). As a result of the genome reorganization and the
acquisition of new genes and gene clusters, Microcystis genomes have been
shown to exhibit a very low synteny.
1 - Introduction 5
The comparison of genome data from 12 Microcystis strains was used to classify
essential genes (found in all of the 12 sequenced Microcystis strains, such as
certain genes from energy metabolism) into the “core genome”. While the core
represents ~2,500 genes (~50% of the genome) the remaining variable and
strain specific genes are integrated in a large and open pan-genome numbered
greater than 12,000 genes. In contrast to the core, the flexible genes include
larger fractions of genes for DNA -replication, -modification and -repair (e.g.
transposases, restriction enzymes, etc.), secondary metabolites as well as genes
with predicted and unknown functions. The plasticity in the Microcystis
genome is higher than in other cyanobacterial genomes and is facilitated by a
huge number of transposases that are capable of mobilizing genomic regions
and inevitably have led to a high percentage of large repeat sequences
throughout the genome (Frangeul, et al., 2008; Humbert, et al., 2013). Even
though, it prevented any attribution of phylogenetic Microcystis subclades to
geographic regions, this plasticity and constant reorganization of the
Microcystis genome has provided the genus with the means for diversification
and niche adaptation and thus potentially for interactions between different
genotypes.
1.3 VARIABLE ASPECTS OF CARBON ACQUISITION IN
MICROCYSTIS
A well-established example for variety in Microcystis genomes was found
regarding the means of carbon acquisition. Recent genome comparisons
revealed differences in inorganic carbon (Ci)-uptake systems among Microcystis
strains (Sandrini, et al., 2013). In principle, there are two CO2-uptake systems
and three HCO3--uptake systems found in Microcystis with different substrate
affinities (Table 1-1) (Omata, et al., 1999; Price, et al., 2011; Price, et al., 2004;
Shibata, et al., 2002; Shibata, et al., 2001).
1 - Introduction 6
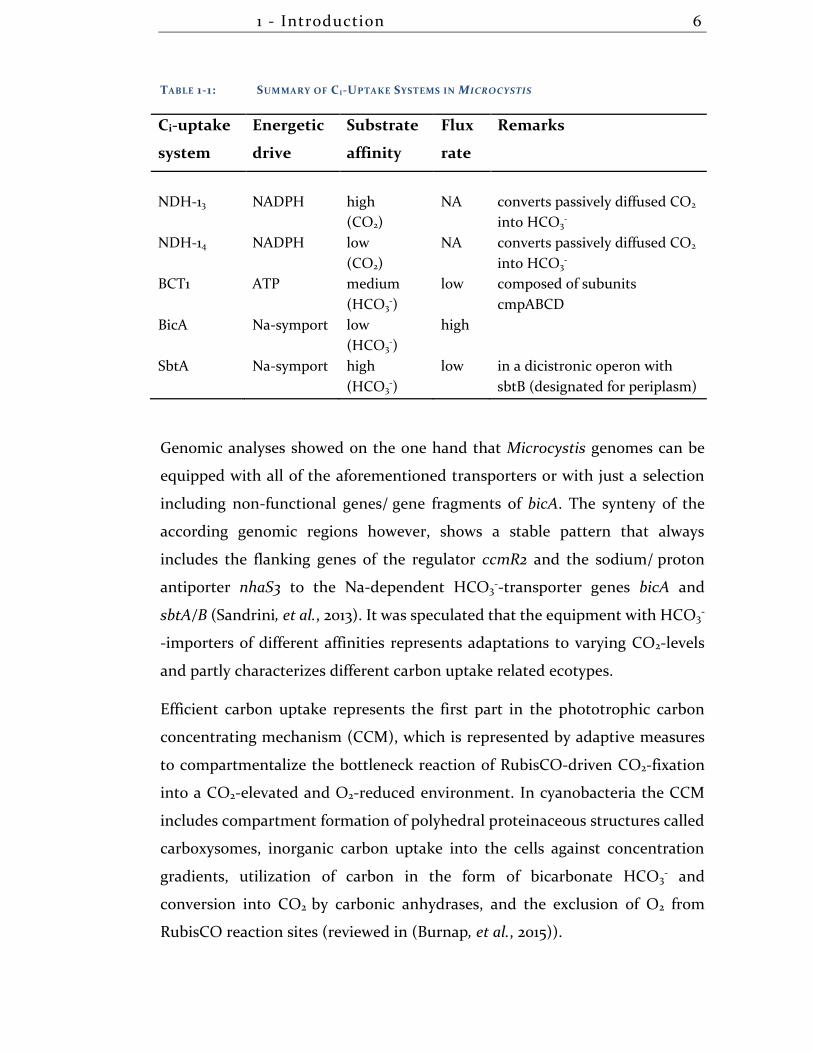
TABLE 1-1: SUMMARY OF CI-UPTAKE SYSTEMS IN MICROCYSTIS
Ci-uptake
system
Energetic
drive
Substrate
affinity
Flux
rate
Remarks
NDH-13 NADPH high
(CO2)
NA converts passively diffused CO2
into HCO3-
NDH-14 NADPH low
(CO2)
NA converts passively diffused CO2
into HCO3-
BCT1 ATP medium
(HCO3-)
low composed of subunits
cmpABCD
BicA Na-symport low
(HCO3-)
high
SbtA Na-symport high
(HCO3-)
low in a dicistronic operon with
sbtB (designated for periplasm)
Genomic analyses showed on the one hand that Microcystis genomes can be
equipped with all of the aforementioned transporters or with just a selection
including non-functional genes/ gene fragments of bicA. The synteny of the
according genomic regions however, shows a stable pattern that always
includes the flanking genes of the regulator ccmR2 and the sodium/ proton
antiporter nhaS3 to the Na-dependent HCO3--transporter genes bicA and
sbtA/B (Sandrini, et al., 2013). It was speculated that the equipment with HCO3-
-importers of different affinities represents adaptations to varying CO2-levels
and partly characterizes different carbon uptake related ecotypes.
Efficient carbon uptake represents the first part in the phototrophic carbon
concentrating mechanism (CCM), which is represented by adaptive measures
to compartmentalize the bottleneck reaction of RubisCO-driven CO2-fixation
into a CO2-elevated and O2-reduced environment. In cyanobacteria the CCM
includes compartment formation of polyhedral proteinaceous structures called
carboxysomes, inorganic carbon uptake into the cells against concentration
gradients, utilization of carbon in the form of bicarbonate HCO3- and
conversion into CO2 by carbonic anhydrases, and the exclusion of O2 from
RubisCO reaction sites (reviewed in (Burnap, et al., 2015)).
1 - Introduction 7
In addition to the assortment of Ci-uptake systems and the CCM, Microcystis
strains are furnished with gas vesicles as extra means to alter its depth in the
water column by which a changing supply with CO2 can be provided (Thomas,
et al., 1985; Walsby, 1972). This is accomplished by an accumulation of ballast
carbohydrates to sink into deeper positions after saturation with light and CO2
even to the point of light stress. On the other hand, increased buoyancy is
achieved after metabolizing carbohydrate reserves, thus decreasing ballast and
supplying gas fillings of CO2 for the vesicles. This vertical migration was
observed to occur in periodical rhythms to reach favorable light and CO2
conditions either on the water surface or in deeper layers (Rabouille, et al., 2003;
Visser, et al., 1997).
1.4 VARIATIONS IN MICROCYSTIS CELL ENVELOPE COMPONENTS
Microcystis diversity was shown among other aspects, to manifest in the
formation of different morphotypes (Figure 1-2, page 4). Extensive differences
in these morphological shapes and sheath characteristics of Microcystis
suggested an extensive variety in envelope structures, including proteinaceous,
lipopolysaccharide and extracellular polysaccharide (EPS) components.
The high variety in EPS in different Microcystis strains was described from
microscopic studies and is reflected in the genomic diversity of EPS biogenesis
genes among these Microcystis strains as well (Karlsson, et al., 1983; Kehr, et al.,
2015; Kessel, et al., 1975). The specificity that can be accomplished through a
diversity of monosaccharide components in polysaccharides, as well as bond
positon, branching options, and modifications with chemical functional groups,
is higher than in biological encoding of information by DNA or proteins (Werz,
et al., 2007).
1 - Introduction 8
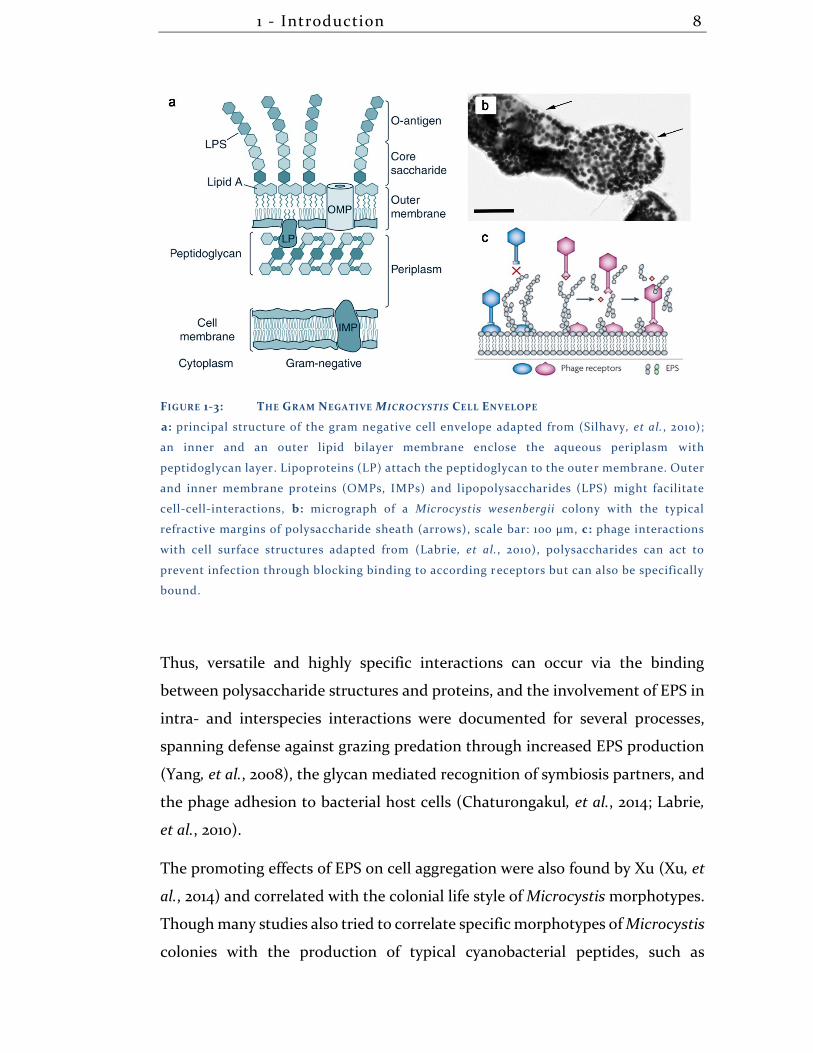
FIGURE 1-3: THE GRAM NEGATIVE MICROCYSTIS CELL ENVELOPE
a: principal structure of the gram negative cell envelope adapted from (Silhavy, et al., 2010);
an inner and an outer lipid bilayer membrane enclose the aqueous periplasm with
peptidoglycan layer. Lipoproteins (LP) attach the peptidoglycan to the outer membrane. Outer
and inner membrane proteins (OMPs, IMPs) and lipopolysaccharides (LPS) might facilitate
cell-cell-interactions, b: micrograph of a Microcystis wesenbergii colony with the typical
refractive margins of polysaccharide sheath (arrows), scale bar: 100 µm, c: phage interactions
with cell surface structures adapted from (Labrie, et al., 2010), polysaccharides can act to
prevent infection through blocking binding to according receptors but can also be specifically
bound.
Thus, versatile and highly specific interactions can occur via the binding
between polysaccharide structures and proteins, and the involvement of EPS in
intra- and interspecies interactions were documented for several processes,
spanning defense against grazing predation through increased EPS production
(Yang, et al., 2008), the glycan mediated recognition of symbiosis partners, and
the phage adhesion to bacterial host cells (Chaturongakul, et al., 2014; Labrie,
et al., 2010).
The promoting effects of EPS on cell aggregation were also found by Xu (Xu, et
al., 2014) and correlated with the colonial life style of Microcystis morphotypes.
Though many studies also tried to correlate specific morphotypes of Microcystis
colonies with the production of typical cyanobacterial peptides, such as
1 - Introduction 9
microcystin (Fastner, et al., 2001; Via-Ordorika, et al., 2004), results were not
hundred percent conclusive. Several studies however, showed that the
hepatotoxic peptide microcystin can have an impact on the abundance of
envelope proteins, which in turn can influence Microcystis cell aggregation
patterns (Kehr, et al., 2006; Zilliges, et al., 2008). In correlation to an increased
cell aggregation in cells with elevated expression of the o-glycosylated
extracellular protein MrpC, an involvement of this non-essential protein in cell-
cell-interactions and morphotype specification was suggested (Zilliges, et al.,
2008). Further evidence for protein-polysaccharide interactions in Microcystis
cell envelopes with regard to microcystin production was found after the
characterization of the lectin microvirin. This multivalent carbohydrate binding
protein was shown to facilitate Microcystis cell aggregations, and its
carbohydrate binding sites are believed to be responsible for this cross-linking
between the polysaccharide structures of different Microcystis cells (Kehr, et al.,
2006).
These studies exemplify that the Microcystis envelope structures represent
diversified reaction sites to the cell, encompassing varying protein and
polysaccharide structures depending on the genomic facilities of the respective
strain.
1.5 MICROCYSTIS COMMUNITIES AND ASPECTS OF
COMMUNICATION
In contrast to Microcystis strains cultured under axenic conditions, in its
natural environment Microcystis coexists with many other phototrophs
(eukaryotes and prokaryotes) as well as with a variety of heterotrophic bacteria
(Woodhouse, et al., 2015). In fact, it has been proposed that the typical colonial
morphology of Microcystis represents the community form of a floating biofilm
(Zhai, et al., 2012) with the characteristic assemblage of diverse organisms in a
mucilaginous matrix analogous to the typical hydrogel matrix of a biofilm (Hall-
1 - Introduction 10
Stoodley, et al., 2004). To heterotrophs the colonial polysaccharide sheath of
Microcystis (see section 1.4) represents an attractive micro-environment
presumably providing protection and supply with nutrients (Brunberg, 1999).
Since it was suspected that the heterotrophic community members might
influence harmful bloom formation, more research has been focused on
elucidating community structures as well as on interactions between the
community-forming species. Several studies have reported competition
between co-occurring bacteria with partly lethal effects such as lysing
competitor cells (Harel, et al., 2013; Ozaki, et al., 2008). In contrast, other
studies have uncovered tightly coupled population dynamics and mutually
beneficial effects of the bacterial community life style (Parveen, et al., 2013;
Shen, et al., 2011). Recent investigations comparing the community
compositions of free-living versus Microcystis-attached heterotrophs and of
different sampling sites from the Laurentian Lake Erie paint an interesting
picture of principles underlying community organization. Taxonomic
classification of community bacteria revealed a few very specific and individual
interacting partners on the one hand and a variety of more generalist bacteria
on the other. Furthermore, it could be deduced from deep sequencing data that
irrespective of the contributing bacterial species the same functions of
interacting partners were fulfilled in comparable communities by expression of
the same genes (Parveen, et al., 2013; Steffen, et al., 2015). This stresses the point
of dynamic community compositions with mutually benefitting roles of
Microcystis and accompanied heterotrophs.
While a large share of the previous studies has concentrated on associated
heterotrophic bacteria or interactions between two distinct species, like for
instance between the green algae Scenedesmus and Microcystis (Harel, et al.,
2013) or between Aphanizomenon and Microcystis (Miller, et al., 2013), recent
studies on Microcystis specific interactions suggest multifaceted relations and
emerging evidence for a role of secondary metabolites in them (Briand, et al.,
2015; Schatz, et al., 2007). As pointed out before, within the Microcystis genome
we find a huge potential for diversity, which may result for example from strain
specific metabolic pathways, varying sets of transporters with different
1 - Introduction 11
affinities, or the strain specific equipment with secondary metabolites
(Frangeul, et al., 2008; Humbert, et al., 2013). Interestingly, different Microcystis
genotypes exhibit spatial and temporal patterns of co-occurrence with genomic
diversity maintained over long periods of time. This level of diversity in the
Microcystis community represents the basis for any possible interaction.
In terms of molecular communication, most attention has been paid to the
broad variety of secondary metabolites in Microcystis as they are often found to
be released from the cells providing a mechanism for how they might carry
signals to surrounding organisms (Hudnell, et al., 2008; Wiedner, et al., 2003).
Indeed, recent studies confirm that different Microcystis strains in co-
cultivation (compartments separated by a membrane, thus sharing the same
medium and released medium factors) can influence each other’s growth rates,
morphologies, and specifically the expression of secondary metabolites, partly
by autoinduction processes (Briand, et al., 2015; Gan, et al., 2011; Schatz, et al.,
2007). Previous, co-cultivation experiments have demonstrated very strain
specific effects and more general responses like enhanced production of
extracellular polymeric substances (Shen, et al., 2011).
The mechanism’s underlying signal reception plus transduction are not yet
known in detail and suggestions, that Microcystis uses some form of quorum
sensing (QS) could not be fully confirmed, since typical QS signaling molecules
(AHL-like molecules: N-acetyl-homoserine-lactones) were identified but the
full signaling and subsequent processes of coordinated gene
expression/ repression were not elucidated (Zhai, et al., 2012). Although the
evidence for specific interactions and communication pathways among
Microcystis strains is accumulating, a comprehensive view on the organisms’
reactions and affected cellular processes is missing to date.
1 - Introduction 12
1.6 SECONDARY METABOLITES
Beyond the scope of sole survival and nutrition, organisms of all kingdoms of
life have developed the production of compounds, which would equip them
with evolutionary advantages. In general, these originally termed secondary
metabolites were defined as small molecules that do not belong to the primary
metabolisms and are not essential to the organism’s development, reproduction
and growth (Fraenkel, 1959). This notion has been reassessed with a stronger
focus on the role as supportive means in primary and secondary metabolism to
cope with challenging environmental conditions in the long run (Davies, 2013).
The denomination of this group of compounds as natural products or
specialized metabolites reflects the fields of interests in medical research and
investigations of their mechanisms of action.
Secondary metabolites have long since been recognized as promising source of
bioactive compounds with particular application in pharmaceuticals due to
their versatile activities, among others as antibiotic, antifungal, antiviral,
anticancer, or protease inhibitory agents. (Edelman, et al., 2003; Ishida, et al.,
1997; Larsen, et al., 1994; Neuhof, et al., 2005; Shin, et al., 1997)
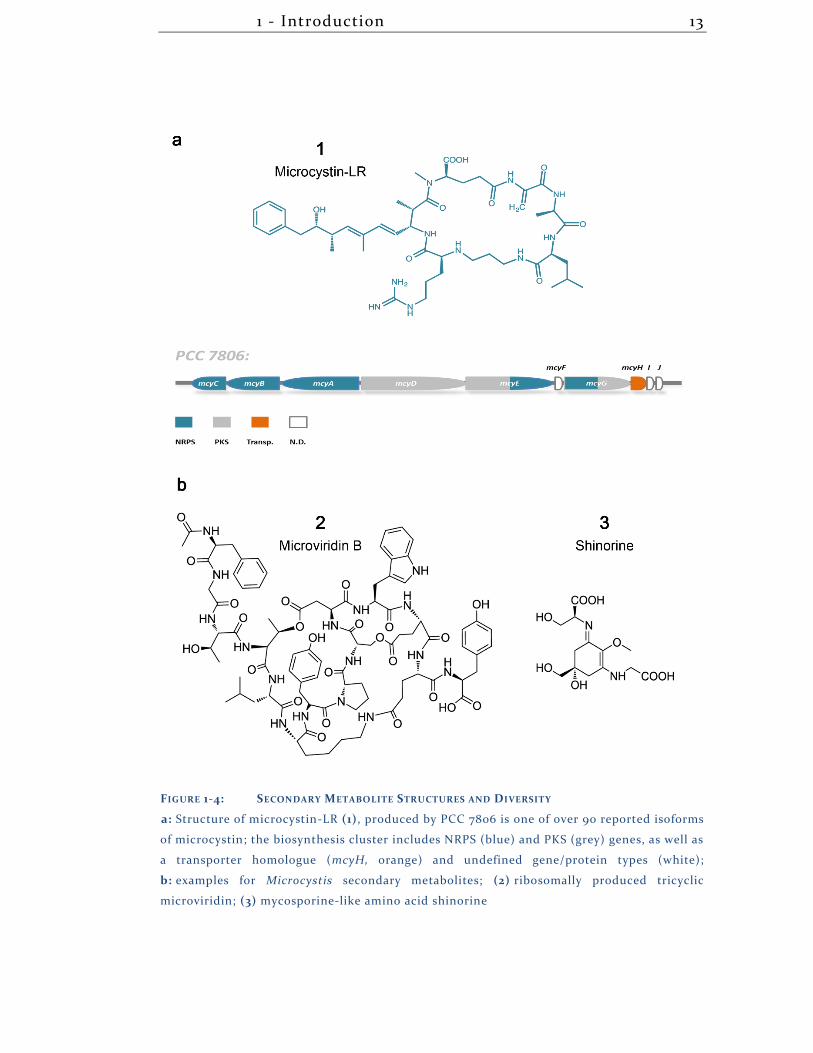
Cyanobacteria have emerged as surprisingly resourceful with over 1,100 reported
secondary metabolites from 39 genera. Of these 216 compounds alone are
attributed to Microcystis strains. These numbers already imply a high diversity
and indeed, the so far elucidated secondary metabolite structures include e.g.,
intricate multicyclic structures, highly modified peptides or alkaloids and
terpenes (Dittmann, et al., 2015). Microcystis was shown to mainly produce
peptidic secondary metabolites, which were classified into six families
(aeruginosins, anabaenopeptins, cyanobactins, cyanopeptolins, microgininins,
and microviridins; (Welker, et al., 2006)) primarily according to their structure.
1 - Introduction 13
FIGURE 1-4: SECONDARY METABOLITE STRUCTURES AND DIVERSITY
a: Structure of microcystin-LR (1), produced by PCC 7806 is one of over 90 reported isoforms
of microcystin; the biosynthesis cluster includes NRPS (blue) and PKS (grey) genes, as well as
a transporter homologue (mcyH, orange) and undefined gene/protein types (white);
b: examples for Microcystis secondary metabolites; (2) ribosomally produced tricyclic
microviridin; (3) mycosporine-like amino acid shinorine
1 - Introduction 14
In addition, secondary metabolite peptides can be classified according to the
mechanisms behind their biosynthesis. Predominantly they are categorized
into two types of biosynthesis mechanism. This includes a non-ribosomal
production of peptides (incorporation of proteinogenic and non-proteinogenic
amino acids) and a second mechanism, which is considered ribosome-
dependent with genomically encoded precursor peptides, that are restricted to
the proteinogenic amino acids as building blocks (Kehr, et al., 2011). Metabolites
from ribosome-dependent peptide biosynthesis show a high diversity that
derives from a multitude of post-translational modifications, including
methylation, oxidation, heterocyclization, or prenylation (Sivonen, et al., 2010).
One of the larger and more complex structures is found in microviridin (2), a
tricyclic depsipeptide featuring lactam and lactone rings (Ishitsuka, et al.,
1990)(Figure 1-4). Nonribosomal peptide synthesis on the other hand,
introduces tremendous diversity to the produced peptides by admitting about
300 different amino acids as components and being combined with additional
modifications, such as amino acid epimerization or tailoring enzymes
(Grunewald, et al., 2006). Furthermore, the synthesizing multi-domain
enzymes designated nonribosomal peptide synthetases (NRPS) can cooperate
with polyketide synthases (PKS) that utilize various carboxylic acids for
incorporation into the particular secondary metabolite (Kehr, et al., 2011).
Another example that demonstrates diversity in structure and biosynthesis of
cyanobacterial secondary metabolites is shinorine (3) an UV-light absorbing
mycosporine-like amino acid (Figure 1-4).
Within the genomes of cyanobacteria and numerous other bacterial and fungal
taxa the genes involved in the biosynthesis of secondary metabolites are
organized in coherent gene clusters. Recent genome analyses and genome
mining approaches describe that most cyanobacteria and Microcystis in
particular dedicate approximately 4-5 % (2-9 gene clusters) of their genome to
the encoding of secondary metabolite synthesis (Calteau, et al., 2014; Humbert,
et al., 2013). Considering the extent to which recombination occurs within the
genomes of Microcystis species (see section 1.2) in correlation with the
nonessential character, secondary metabolite gene clusters are subject to a vivid
1 - Introduction 15
evolutionary progression and we find almost every Microcystis subspecies
equipped with a unique combination of potentially very diverse secondary
metabolites and according biosynthesis gene clusters.
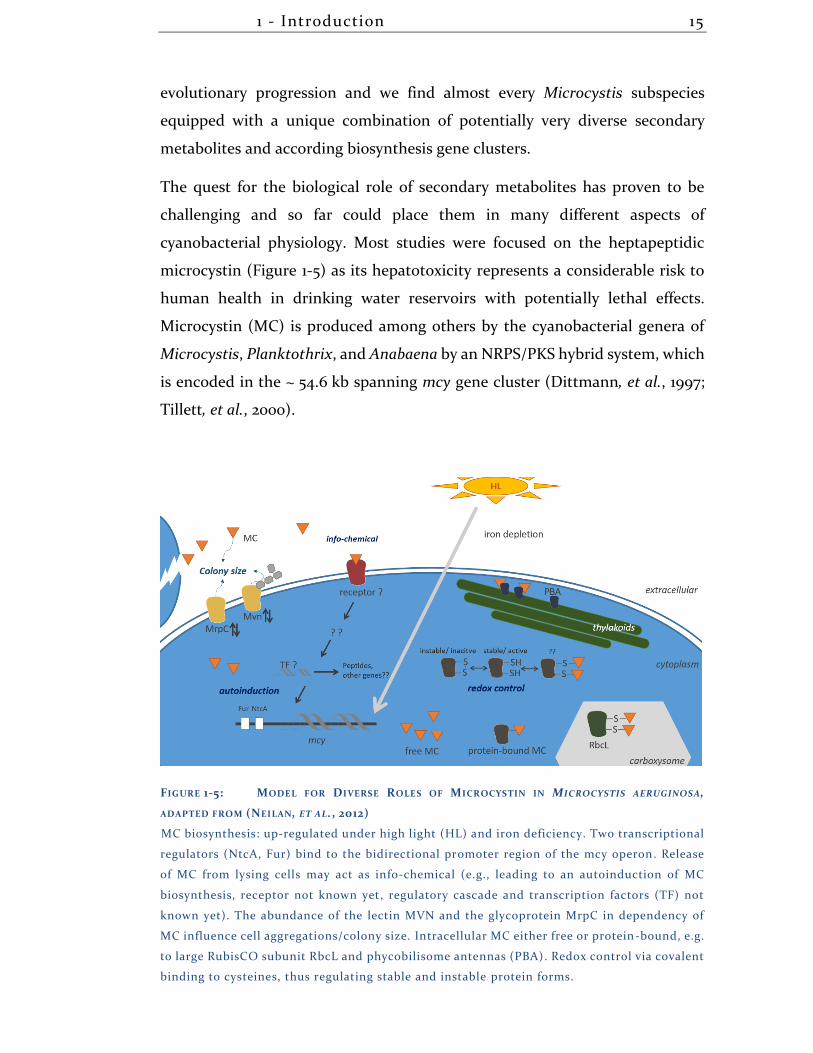
The quest for the biological role of secondary metabolites has proven to be
challenging and so far could place them in many different aspects of
cyanobacterial physiology. Most studies were focused on the heptapeptidic
microcystin (Figure 1-5) as its hepatotoxicity represents a considerable risk to
human health in drinking water reservoirs with potentially lethal effects.
Microcystin (MC) is produced among others by the cyanobacterial genera of
Microcystis, Planktothrix, and Anabaena by an NRPS/PKS hybrid system, which
is encoded in the ~ 54.6 kb spanning mcy gene cluster (Dittmann, et al., 1997;
Tillett, et al., 2000).
FIGURE 1-5: MODEL FOR DIVERSE ROLES OF MICROCYSTIN IN MICROCYSTIS AERUGINOSA,
ADAPTED FROM (NEILAN, ET AL., 2012)
MC biosynthesis: up-regulated under high light (HL) and iron deficiency. Two transcriptional
regulators (NtcA, Fur) bind to the bidirectional promoter region of the mcy operon. Release
of MC from lysing cells may act as info-chemical (e.g., leading to an autoinduction of MC
biosynthesis, receptor not known yet, regulatory cascade and transcription factors (TF) not
known yet). The abundance of the lectin MVN and the glycoprotein MrpC in dependency of
MC influence cell aggregations/colony size. Intracellular MC either free or protein-bound, e.g.
to large RubisCO subunit RbcL and phycobilisome antennas (PBA). Redox control via covalent
binding to cysteines, thus regulating stable and instable protein forms.
1 - Introduction 16
Targeted sequencing of the ten mcy genes (mcyA-J, see Figure 1-4) provided the
basis for transcriptional and related expression and functional studies of
microcystin. The presence of DNA binding motifs for the ferric iron uptake
transcriptional regulator FurA and the global nitrogen regulator NtcA in the
promoter region of the mcy cluster resulted in many studies examining the role
of microcystin production in responding to changes in the availability of
nutrients, including Fe and N. Studies on nutrient dependent microcystin
production as well as circadian studies however provided conflicting outcomes
(Harke, et al., 2013; Penn, et al., 2014; Sevilla, et al., 2010; Straub, et al., 2011).
Promising leads to its biological function emerged after showing that
microcystin was involved in protein protection through covalent binding to
RubisCO after high light stress and might also play a role in oxidative stress
responses (Zilliges, et al., 2011). The presumption that microcystin might
directly or indirectly affect CO2-fixation was reinforced by competition
experiments of microcystin producing and nonproducing strains, which
uncovered growth advantages of toxic strains under CO2-limited conditions
(Van de Waal, et al., 2011). While these cues to the microcystin function concern
intracellular processes, the frequently detected amounts of microcystin in the
surrounding extracellular medium point towards a potential role as
extracellular signal. Studies examining the extracellular functions of secondary
metabolites show influences on the production of a whole network of
metabolites (Briand, et al., 2015; Schatz, et al., 2007). Other studies have
proposed a signaling function of the toxin cylindrospermopsin that would
induce the production and excretion of alkaline phosphatase in other
phytoplankton species and thus increase phosphate levels under limited
conditions (Bar-Yosef, et al., 2010; Kaplan, et al., 2012). The mechanisms behind
intra- and extracellular secondary metabolite effects are only beginning to be
explored and comprehensive insights concerning which aspects of
cyanobacterial physiology and affected metabolite patterns are missing to date.
1 - Introduction 17
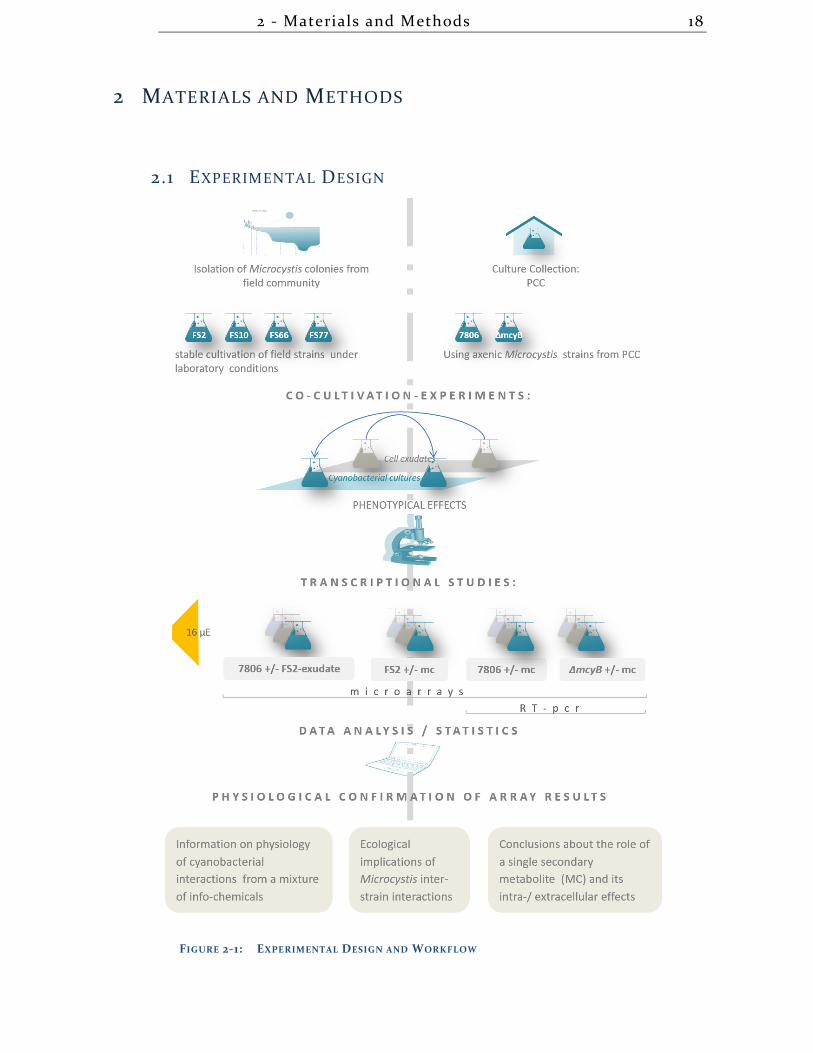
1.7 AIMS OF THIS STUDY
Recent genome sequencing projects of several Microcystis strains have
attributed approximately 50 % of the genome to flexible and strain specific
genes. The genomic and morphological diversity of this cyanobacterial genus
has been known for decades. The co-occurrence and annual persistence of
diverse strains within the same habitat has provoked the question, if and to
what outcome diverse Microcystis strains can interact. The characterization of
inter-strain interactions among the Microcystis genus is intended to obtain a
deeper understanding of the ecological and physiological principles of the
potentially harmful and mass proliferating cyanobacterium. In this respect, it
shall be focused on the role of Microcystis-derived info-chemicals as interaction
mediators. In particular, comprehensive comparative transcriptomic studies are
intended to correlate the intra- and extracellular role of the toxic secondary
metabolite microcystin to metabolic processes. The experimental design to
answer these questions includes the simulated co-habitation of Microcystis
field strains and axenic lab strains with subsequent transcriptomic and
physiological investigations (displayed below, section 2.1).
2 - Materials and Methods 18
2 MATERIALS AND METHODS
2.1 EXPERIMENTAL DESIGN
FIGURE 2-1: EXPERIMENTAL DESIGN AND WORKFLOW
2 - Materials and Methods 19
2.2 MATERIALS
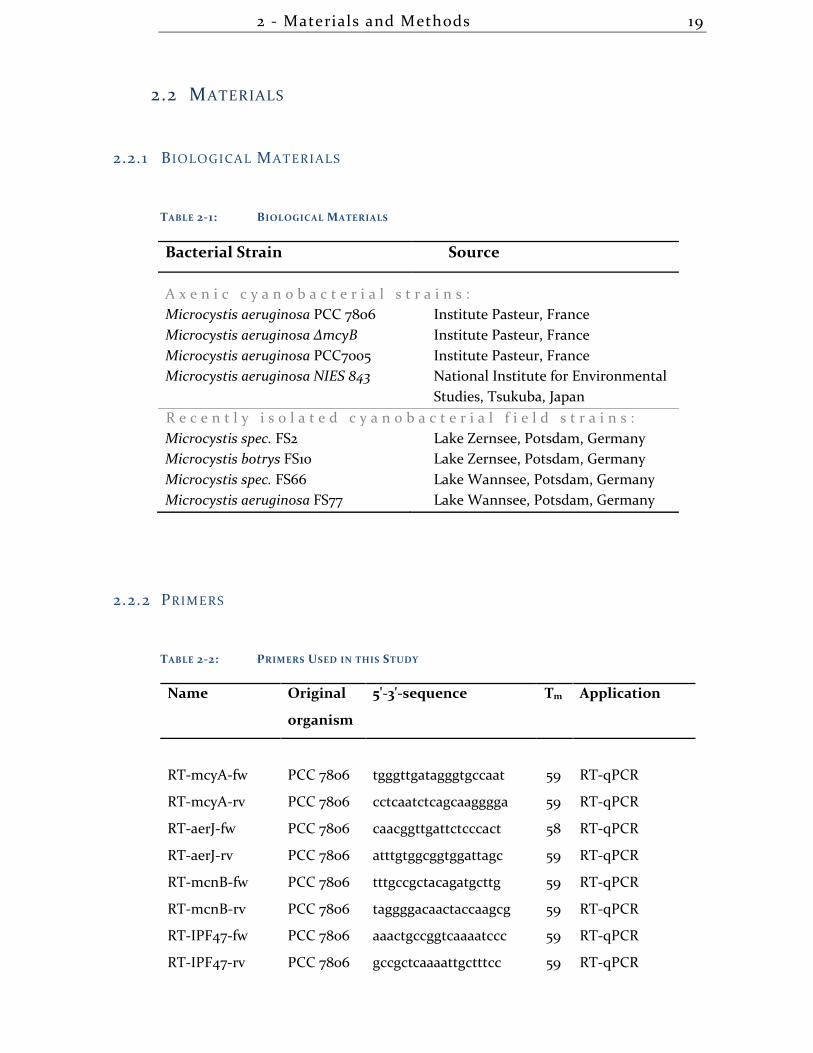
2.2.1 B IOLOGICAL MATERIALS
TABLE 2-1: BIOLOGICAL MATERIALS
Bacterial Strain Source
A x e n i c c y a n o b a c t e r i a l s t r a i n s :
Microcystis aeruginosa PCC 7806 Institute Pasteur, France
Microcystis aeruginosa ΔmcyB Institute Pasteur, France
Microcystis aeruginosa PCC7005 Institute Pasteur, France
Microcystis aeruginosa NIES 843 National Institute for Environmental
Studies, Tsukuba, Japan
R e c e n t l y i s o l a t e d c y a n o b a c t e r i a l f i e l d s t r a i n s :
Microcystis spec. FS2 Lake Zernsee, Potsdam, Germany
Microcystis botrys FS10 Lake Zernsee, Potsdam, Germany
Microcystis spec. FS66 Lake Wannsee, Potsdam, Germany
Microcystis aeruginosa FS77 Lake Wannsee, Potsdam, Germany
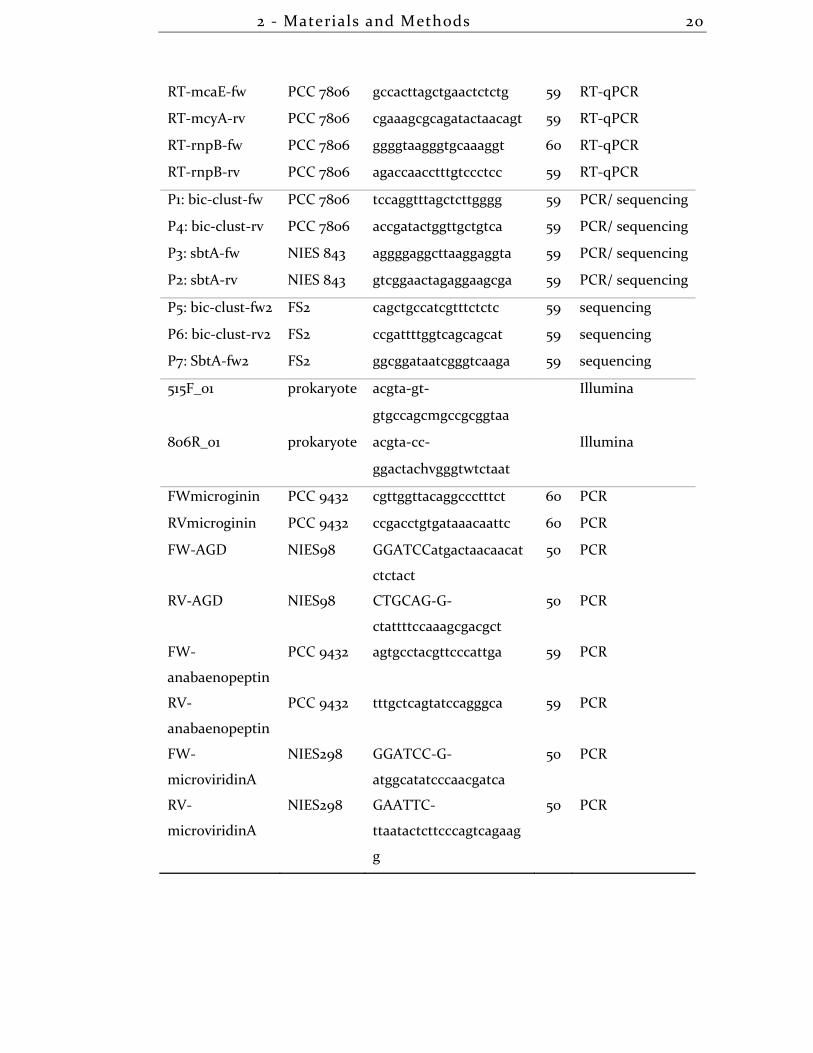
2.2.2 PRIMERS
TABLE 2-2: PRIMERS USED IN THIS STUDY
Name Original
organism
5'-3'-sequence Tm Application
RT-mcyA-fw PCC 7806 tgggttgatagggtgccaat 59 RT-qPCR
RT-mcyA-rv PCC 7806 cctcaatctcagcaagggga 59 RT-qPCR
RT-aerJ-fw PCC 7806 caacggttgattctcccact 58 RT-qPCR
RT-aerJ-rv PCC 7806 atttgtggcggtggattagc 59 RT-qPCR
RT-mcnB-fw PCC 7806 tttgccgctacagatgcttg 59 RT-qPCR
RT-mcnB-rv PCC 7806 taggggacaactaccaagcg 59 RT-qPCR
RT-IPF47-fw PCC 7806 aaactgccggtcaaaatccc 59 RT-qPCR
RT-IPF47-rv PCC 7806 gccgctcaaaattgctttcc 59 RT-qPCR
2 - Materials and Methods 20
RT-mcaE-fw PCC 7806 gccacttagctgaactctctg 59 RT-qPCR
RT-mcyA-rv PCC 7806 cgaaagcgcagatactaacagt 59 RT-qPCR
RT-rnpB-fw PCC 7806 ggggtaagggtgcaaaggt 60 RT-qPCR
RT-rnpB-rv PCC 7806 agaccaacctttgtccctcc 59 RT-qPCR
P1: bic-clust-fw PCC 7806 tccaggtttagctcttgggg 59 PCR/ sequencing
P4: bic-clust-rv PCC 7806 accgatactggttgctgtca 59 PCR/ sequencing
P3: sbtA-fw NIES 843 aggggaggcttaaggaggta 59 PCR/ sequencing
P2: sbtA-rv NIES 843 gtcggaactagaggaagcga 59 PCR/ sequencing
P5: bic-clust-fw2 FS2 cagctgccatcgtttctctc 59 sequencing
P6: bic-clust-rv2 FS2 ccgattttggtcagcagcat 59 sequencing
P7: SbtA-fw2 FS2 ggcggataatcgggtcaaga 59 sequencing
515F_01 prokaryote acgta-gt-
gtgccagcmgccgcggtaa
Illumina
806R_01 prokaryote acgta-cc-
ggactachvgggtwtctaat
Illumina
FWmicroginin PCC 9432 cgttggttacaggccctttct 60 PCR
RVmicroginin PCC 9432 ccgacctgtgataaacaattc 60 PCR
FW-AGD NIES98 GGATCCatgactaacaacat
ctctact
50 PCR
RV-AGD NIES98 CTGCAG-G-
ctattttccaaagcgacgct
50 PCR
FW-
anabaenopeptin
PCC 9432 agtgcctacgttcccattga 59 PCR
RV-
anabaenopeptin
PCC 9432 tttgctcagtatccagggca 59 PCR
FW-
microviridinA
NIES298 GGATCC-G-
atggcatatcccaacgatca
50 PCR
RV-
microviridinA
NIES298 GAATTC-
ttaatactcttcccagtcagaag
g
50 PCR
2 - Materials and Methods 21
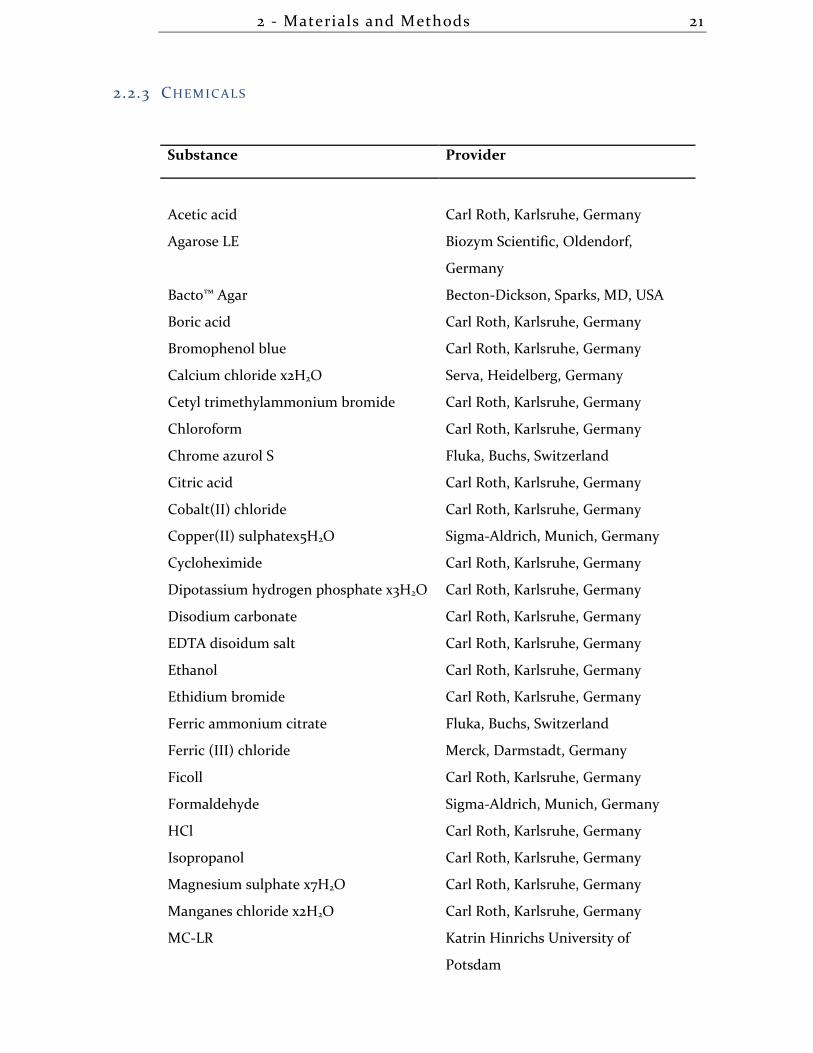
2.2.3 CHEMICALS
Substance Provider
Acetic acid Carl Roth, Karlsruhe, Germany
Agarose LE Biozym Scientific, Oldendorf,
Germany
Bacto™ Agar Becton-Dickson, Sparks, MD, USA
Boric acid Carl Roth, Karlsruhe, Germany
Bromophenol blue Carl Roth, Karlsruhe, Germany
Calcium chloride x2H2O Serva, Heidelberg, Germany
Cetyl trimethylammonium bromide Carl Roth, Karlsruhe, Germany
Chloroform Carl Roth, Karlsruhe, Germany
Chrome azurol S Fluka, Buchs, Switzerland
Citric acid Carl Roth, Karlsruhe, Germany
Cobalt(II) chloride Carl Roth, Karlsruhe, Germany
Copper(II) sulphatex5H2O Sigma-Aldrich, Munich, Germany
Cycloheximide Carl Roth, Karlsruhe, Germany
Dipotassium hydrogen phosphate x3H2O Carl Roth, Karlsruhe, Germany
Disodium carbonate Carl Roth, Karlsruhe, Germany
EDTA disoidum salt Carl Roth, Karlsruhe, Germany
Ethanol Carl Roth, Karlsruhe, Germany
Ethidium bromide Carl Roth, Karlsruhe, Germany
Ferric ammonium citrate Fluka, Buchs, Switzerland
Ferric (III) chloride Merck, Darmstadt, Germany
Ficoll Carl Roth, Karlsruhe, Germany
Formaldehyde Sigma-Aldrich, Munich, Germany
HCl Carl Roth, Karlsruhe, Germany
Isopropanol Carl Roth, Karlsruhe, Germany
Magnesium sulphate x7H2O Carl Roth, Karlsruhe, Germany
Manganes chloride x2H2O Carl Roth, Karlsruhe, Germany
MC-LR Katrin Hinrichs University of
Potsdam
2 - Materials and Methods 22
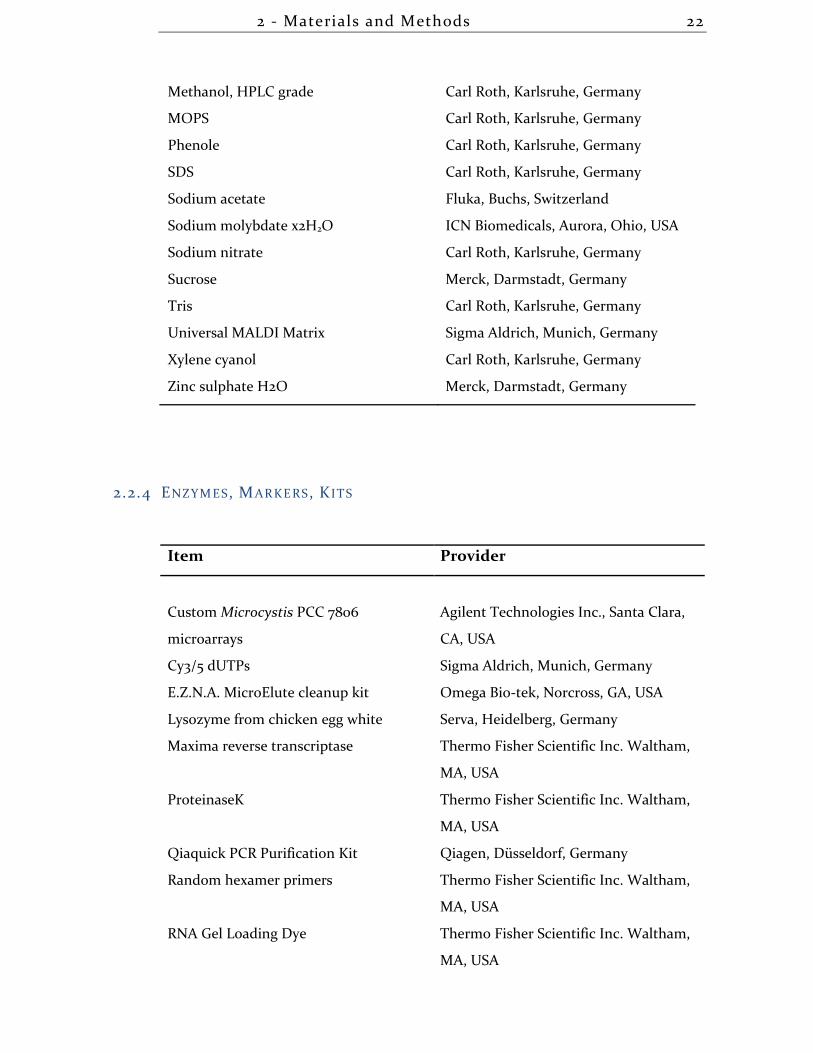
Methanol, HPLC grade Carl Roth, Karlsruhe, Germany
MOPS Carl Roth, Karlsruhe, Germany
Phenole Carl Roth, Karlsruhe, Germany
SDS Carl Roth, Karlsruhe, Germany
Sodium acetate Fluka, Buchs, Switzerland
Sodium molybdate x2H2O ICN Biomedicals, Aurora, Ohio, USA
Sodium nitrate Carl Roth, Karlsruhe, Germany
Sucrose Merck, Darmstadt, Germany
Tris Carl Roth, Karlsruhe, Germany
Universal MALDI Matrix Sigma Aldrich, Munich, Germany
Xylene cyanol Carl Roth, Karlsruhe, Germany
Zinc sulphate H2O Merck, Darmstadt, Germany
2.2.4 ENZYMES , MARKERS , K ITS
Item Provider
Custom Microcystis PCC 7806
microarrays
Agilent Technologies Inc., Santa Clara,
CA, USA
Cy3/5 dUTPs Sigma Aldrich, Munich, Germany
E.Z.N.A. MicroElute cleanup kit Omega Bio-tek, Norcross, GA, USA
Lysozyme from chicken egg white Serva, Heidelberg, Germany
Maxima reverse transcriptase Thermo Fisher Scientific Inc. Waltham,
MA, USA
ProteinaseK Thermo Fisher Scientific Inc. Waltham,
MA, USA
Qiaquick PCR Purification Kit Qiagen, Düsseldorf, Germany
Random hexamer primers Thermo Fisher Scientific Inc. Waltham,
MA, USA
RNA Gel Loading Dye Thermo Fisher Scientific Inc. Waltham,
MA, USA
2 - Materials and Methods 23
RNase A/T1 mix Thermo Fisher Scientific Inc. Waltham,
MA, USA
RNeasy® Mini Kit 50 Qiagen, Düsseldorf, Germany
SensiMix SYBR Low-ROX kit Bioline, Luckenwalde, Germany
Superscript II RT, Life Technologies, Carlsbad, CA, USA
Taq DNA Polymerase Qiagen, Düsseldorf, Germany
TRIzol Thermo Fisher Scientific Inc. Waltham,
MA, USA
TURBO DNase Thermo Fisher Scientific Inc. Waltham,
MA, USA
2.2.5 M ISCELLANEOUS
Item Provider
Syringes 1, 5, 20, 30 mL Omnifix B Braun, Melsungen, Germany
Sterile polypropylene tubes, 15 and
50 mL
Greiner Bio-One, Frickenhausen,
Germany
Pipettes 0.01-2, 0.5-10, 2-20, 10-200, 100-
1000 µL
PeqLab Biotechnology GmbH,
Germany
Petri dishes 92 x 16 mm w/o Sarstedt, Nümbrecht, Germany
Glass sample slides 76x26x1 mm Carl Roth, Karlsruhe, Germany
Cover slips 40x25x0.13-0.16 mm Carl Roth, Karlsruhe, Germany
Pipettor BrandTech® Scientific INC., Essex, CT,
USA
Polypropylene centrifuge tubes 15, 50 mL Greiner Bio-One, Frickenhausen
Plastibrand® Cuvettes PS, 1.5-3 mL Carl Roth, Karlsruhe, Germany
Rotiprotect® Nitril gloves Carl Roth, Karlsruhe, Germany
PARAFilm "M" Distensible plastic
sealing film
Pechiney Plastic Packaging, Chicago, Il,
USA
2 - Materials and Methods 24
Pipette tips, TipOne® 0.1-10, 1-200, 101-
1250 μL natural tips
Starlab, Ahrensburg, Germany
Safe Lock Tubes Polypropylene reaction
tubes, 500 μL, 1500 µL
Serological Pipettes 2 mL, 10 mL, 25 mL,
sterile
Eppendorf AG, Hamburg, Germany
Carl Roth, Karlsruhe, Germany
Greiner Bio-One, Frickenhausen
Syringe filter 4 mm, Acrodisc®, 0.45 μm
nylon membrane
PALL Life Sciences, USA
Syringe filter Whatman®, 0.2 μm sterile Whatman®, Maidstone, UK
Sep-Pak Plus C18 cartridge 55-105 μm Waters GmbH, Eschborn, Germany
2.2.6 TECHNICAL APPLIANCES
Item Provider
Master TL-D 58W/865 (Lamps) Philips, Eindhoven, Netherlands
KM-2-SWIP-VARIO Shaker Edmund Buhler, Germany
DOS-10L Shaker NeoLab, Migge, Heidelberg,
Germany
Multicultivator MC1000 Photon Systems
Instruments, Czech Republic
LI-193 Spherical Quantum Sensor LI-COR Biosciences, Lincoln, NE,
USA
LI-250A Light Meter LI-COR Biosciences, Lincoln, NE,
USA
PCE-PHD 1 mobile pH-meter PCE Instruments, Meschede,
Germany
Evos fl, Digital Inverted Microscope AMG of Thermo Fisher Scientific
Inc. Waltham, MA, USA
Stereomicroscope stemiDV4 Zeiss, Jena, Germany
2 - Materials and Methods 25
Milli-Q Reference A+ Merck Millipore, Darmstadt,
Germany
Haereus Pico 21 Microcentrifuge Thermo Fisher Scientific Inc.
Waltham, MA, USA
Perfect Spin 24R Microcentrifuge PeqLab Biotechnology GmbH,
Germany
200R 21 Microcentrifuge Hettich, Tuttlingen, Germany
Heraeus Multifuge 1S-R Thermo Fisher Scientific Inc.
Waltham, MA, USA
Sigma 6-16K Sartorius AG, Göttingen, Germany
Vortex Genie 2™, G560E Scientific Industries, Bohemia N.Y.,
USA
IKAMAG®RET Magnetic stirrer IKA GmbH & Co. Kg, Staufen,
Germany
Variomag mono Thermo Fisher Scientific Inc.
Waltham, MA, USA
Stirring bars Carl Roth, Karlsruhe, Germany
Thriller Thermo-shaker block PeqLab Biotechnology GmbH,
Germany
Heat block PeqLab Biotechnology GmbH,
Germany
Microwave NN-E209W Panasonic, Osaka, Japan
Sartorius Basic Balance Sartorius AG, Göttingen, Germany
Kern 572-37 Balance Kern & Sohn GmbH, Balingen,
Germany
FiveEasy™ FE 20 pH Meter Mettler Toledo AG, Schwerzenbach,
Switzerland
LE 409 pH electrode Mettler Toledo AG, Schwerzenbach,
Switzerland
UV-1800 Spectrophotometer Shimadzu, Japan
SpeedVac Vacuum concentrator Eppendorf, Hamburg, Germany
2 - Materials and Methods 26
MZ 2C Vacuum Pump Vacuubrand, Wertheim, Germany
PC 2004 Vario Vacuum Pump Vacuubrand, Wertheim, Germany
NanoDrop 2000 Spectrophotometer PeqLab Biotechnology GmbH,
Germany
C1000TM ThermoCycler Biorad, USA
Light Cycler C480 Roche, Basel, Switzerland
PowerPac Basic Biorad, USA
Electrophoresis chambers, combs
and accessories
PeqLab Biotechnology GmbH,
Germany
ChemiDoc™ XRS+ Imager BioRad, USA
2100 Bioanalyzer Agilent Technologies Inc., Santa
Clara, CA, USA
DNA microarray scanner G2565CA Agilent Technologies Inc., Santa
Clara, CA, USA
NimbleGen hybridization system 4 NimbleGen Roche Madison, WI,
USA
MALDI LTQ Orbitrap mass
spectrometer
2 - Materials and Methods 27
2.3 METHODS
2.3.1 CULTIVATION OF CYANOBACTERIA
tandard cultivation of cyanobacteria was arranged in semi continuous
liquid cultures in 500 mL Erlenmeyer flasks provided with BG-11 medium
(Rippka, et al., 1979) and constant illumination of
16 µmol photons * m- 2 * s-1 (Philips Master TL-D 58W/865) at 25 °C.
During the course of this study nutrient deficient and replete modifications to
the original BG-11 medium were used. In iron depleted medium ferric
ammonium citrate was entirely omitted from BG-11. Residual iron from
cultivation vessels was removed by acid washing with 10 % HCl thrice followed
by thorough rinsing until pH tests turned out neutral.
A different supply of carbon sources in BG-11 was arranged. That included
carbonate depleted medium and a tenfold increased carbon concentration. Due
to the close coupling of Na+/ HCO- import into cyanobacterial cells, sodium
sources were reduced in the C-depleted medium, as well (Table 2-3). These
adapted media were applied in plate cultivation on 0.7 % agar /BG-11.
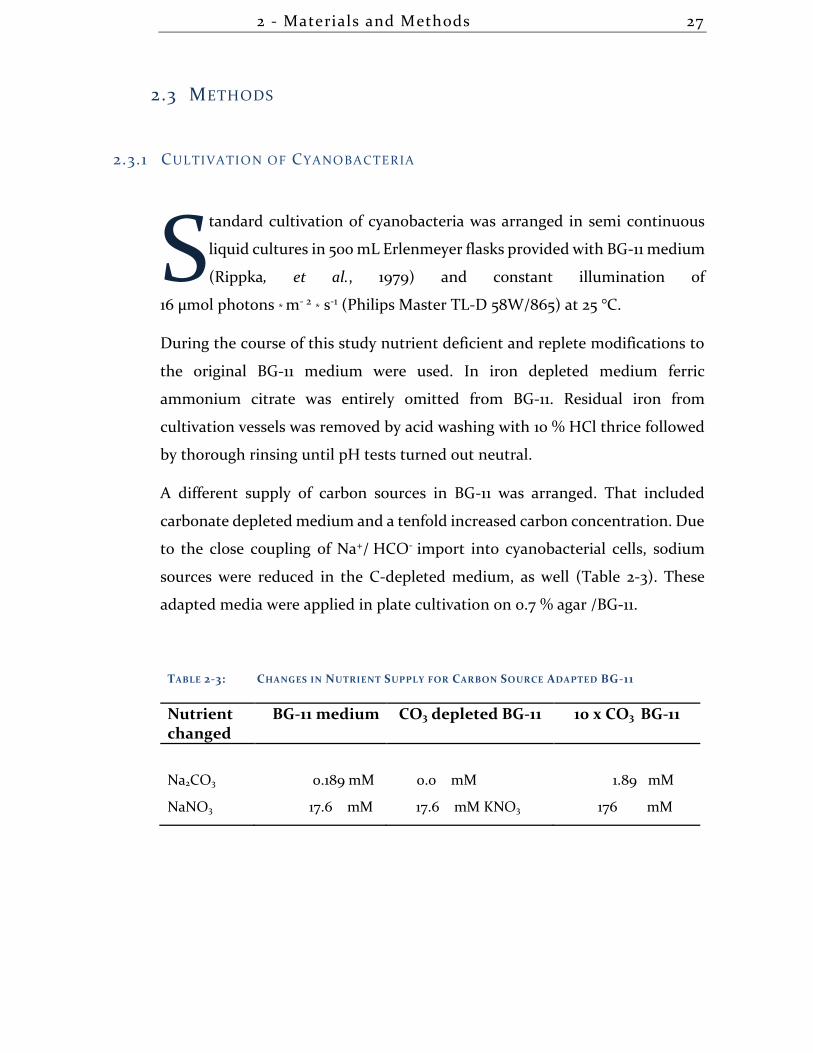
TABLE 2-3: CHANGES IN NUTRIENT SUPPLY FOR CARBON SOURCE ADAPTED BG-11
Nutrient changed
BG-11 medium CO3 depleted BG-11 10 x CO3 BG-11
Na2CO3 0.189 mM 0.0 mM 1.89 mM
NaNO3 17.6 mM 17.6 mM KNO3 176 mM
S
2 - Materials and Methods 28
2.3.2 ISOLATION OF CYANOBACTERIAL F IELD STRAINS
Havel water bodies around Potsdam, Germany were chosen during mid-bloom
event in August 2011 as sampling sites to isolate Microcystis colonies from the
field, which exhibit the original colonial morphology. Microcystis colonies were
isolated either via scoop sampling from the water surface or with the help of a
plankton net from depths down to 2 m. The subsequent separation of single
colonies from further biological material by stepwise dilution within BG-11
medium was followed by determining the colony’s morphotype after (Komárek,
1998).
In order to establish stable laboratory cultures, Microcystis field strains were
ensured to be uni-algal and free of contaminating eukaryotes by filtering and
re-selection/separation of Microcystis colonies and additionally, by temporary
addition of the eukaryote specific antibiotic cycloheximide to the cultivation
medium to a final concentration of 100 mg/L.
2.3.3 B IOACTIVITY ASSAYS OF EXTRACELLULAR BACTERIAL COMPOUNDS
Several compounds that accumulate in cyanobacterial growth medium during
cultivation or during bloom formation in the field were tested for bioactivity
and their respective effects on different Microcystis strains (Figure 2-1, page 18).
Two strategies for testing were applied. On the one hand, mixtures of
undifferentiated bacterial compounds from spent media were tested.
Microcystis strains (Table 2-1) were cultivated under standard conditions until
late exponential growth phase (OD750: 1.75) to allow for compound
accumulation. Subsequently, cell exudates were acquired by centrifuging
cultures (4,500 x g; 10 min) and removing residual cells from the obtained
supernatant by filtration through 0.45 µm pore sized PVDF syringe filters. Cell-
free Microcystis cell exudates were added promptly to other Microcystis strains
2 - Materials and Methods 29
in equal volumes. In contrast to a compound mixture, the effects of extracellular
microcystin as single metabolite were similarly tested. Microcystin-LR was
added to PCC 7806 and ΔmcyB cultures to a final concentration of 50 ng/mL.
The cultivation setup for Microcystis cultures to be treated with cell exudates/
microcystin comprised independent biological triplicate cultivation of the
respective strains under meticulously equal growth conditions. That was
achieved by the cultivation in a multicultivator (16 µmol photons * m-2 * s-1
constant illumination, 28 °C, light aeration) unto the exponential growth phase
(OD750: 0.75), when test substances (spent medium, microcystin) were applied.
Phenotypical changes were examined macro- and microscopically during an
incubation time of 1-120 h. The sampling of treated cell material for diverse
analyses was performed as described in the respective sections. The described
experimental setup was used for different downstream experiments, i.e. a time
course experiment, determination of growth rates and transcriptional analyses
in microarrays and RT-PCR.
2.3.4 TIME COURSE OF B IOACTIVE CELL EXUDATE EFFECTS
Recording of the effects of Microcystis cell exudates in a time dependent
manner was performed using the above described cultivation set up and
exudate preparation (2.3.3). Samples for image documentation of phenotypes,
chlorophyll-a quantification, and recording of absorption spectra were taken
each at 0; 0.5; 1; 2; 3; 4; 24; 48; and 96 hours.
2 - Materials and Methods 30
2.3.5 CHLOROPHYLL-A QUANTIFICATION
Chlorophyll-a amounts were considered as measure for cell counts and
chlorophyll-a differences for cyanobacterial growth, respectively. A primary
methanol extraction was performed by centrifugation of 5 mL culture volume
(4,500 x g; 10 min) and dissolving the resulting pellet in 90 % methanol. After
pipette mixing and vortexing the cell material was allowed to extract in the dark
overnight. Subsequently, the extracts were briefly centrifuged to pellet cellular
debris. Spectrophotometric absorption measurements of the resulting
supernatant at λ = 665 nm were used to calculate chlorophyll-a concentrations
based on the Beer-Lambert law (Beer, 1852) considering an absorption
coefficient of 78.74 L * g-1 * cm-1 for chlorophyll- a in 90 % methanol (Meeks, et
al., 1971).
2.3.6 ABSORPTION SPECTRA OF MICROCYSTIS CULTURES
In order to compare cellular contents of light absorbing components like
chlorophyll and other chromophores, absorption spectra were recorded
between 300-800 nm with the help of a SHIMADZU UV spectrophotometer
(UV-1800). Microcystis cultures in BG-11 were used without further processing
with cell densities between (OD750 = 0.5-0.8).
2.3.7 DETERMINING MICRO CYSTIS GROWTH RATES
Microcystis growth rates were determined in order to check for growth
influencing effects of the FS2 field strain exudate. The cultivation setup for
PCC 7806 and the microcystin deficient ΔmcyB mutant was arranged as
2 - Materials and Methods 31
described in section 2.3.3 with a few alterations. Instead of cultivation in aerated
multicultivator vessels, independent biological triplicate cultures with exactly
equal starting cell densities of OD750 = 0.35 were grown in Erlenmeyer flasks at
25 °C and 16 µmol photons * m-2 * s-1. After the treatment of cultures with FS2
exudate or BG-11 in control cultures, chlorophyll-a amounts were quantified
each day over a period of ten days. After five days the treatment was repeated
in order to keep the stimulus at sufficient levels. The calculation of growth rates
(µ) was based on the daily chlorophyll-a increase and followed the equation
below with successive sampling times t1, t2, etc.
µ = ln(𝑐ℎ𝑙𝑎2)−ln( 𝑐ℎ𝑙𝑎1)
𝑡2− 𝑡1
2.3.8 M ICROSCOPIC DOCUMENTATION
The visual documentation of cyanobacterial phenotypes in various experiments
combined microscopic and photographic means. Cyanobacterial morphotypes
and pictures of cells and aggregates, respectively, were acquired with a digital
inverted fluorescence Microscope (Evos fl, Digital Inverted Microscope, AMG).
For the applications in this study bright field transmitted light images were
recorded using the integrated microscope imaging software giving
monochromatic digital image output. Samples comprised Microcystis material
in their original growth medium without further preparation or fixation steps.
In order to document realistic morphological colony/ cell aggregate features,
microscopic examinations were conducted without cover slip, thereby avoiding
distortion.
Plate cultivation of Microcystis was documented photographically using up to
32-fold magnification of a stereomicroscope (stemiDV4, Zeiss) combined with
a digital camera (Panasonic DMC-FZ45 Lumix) attached to one ocular.
2 - Materials and Methods 32
2.3.9 CAS-ASSAY
In order to test for siderophore production of Microcystis field strain FS2 the
universal CAS (Chrome Azurol S) Assay developed by Schwyn and Neilands
(Schwyn, et al., 1987) was applied to FS2-exudates. Colorimetric changes of the
CAS dye from blue to orange due to the removal of iron from the dye-Fe-
complex by a strong chelator/ siderophore were measured in liquid media via
absorption values at 630 nm. The CAS dye solution (final concentrations: 40 µM
CAS; 0.18 µM Fe(III)Cl36H2O; 1.8 mM HCl; 4 mM CTAB) was prepared
according to the following instructions:
Stock A: 0.06 g CAS in 50 mL H2O
Stock B: 0.0027 g FeCl3 6H2O in 10 mL 10 mM HCl
Stock C: 0.073 g CTAB in 40 mL H2O
1 mL of stock A was combined with 9 mL of stock B before adding 40 mL of
stock C. The Dye solution was autoclaved and stored in the dark. Colorimetric
assays were performed by adding one volume of dye solution to the test medium
and spectrophotometric measurements at 630 nm after an incubation of 20
minutes. Test solutions were measured at their original pH and at an adjusted
pH of 5.6.
2.3.10 DNA-PREPARATION
DNA preparation was conducted as published by Hisbergues (Hisbergues, et al.,
2003). The preparation of genomic DNA of Microcystis strains after harvesting
the cell material (centrifugation: 10 min, 4,500 x g) followed the steps of
washing the pellet twice in TE-buffer (10 mM Tris-HCl, 1 mM EDTA),
resuspension and incubation in TES-buffer (25 % (w/v) sucrose, 50 mM Tris-
HCl, 100 mM EDTA, pH 8.0) on ice for 1 hour. The subsequent incubation with
2 - Materials and Methods 33
added lysozyme to a final concentration of 2 mg/ml for 1 hour at 37 °C was
followed by a proteinaseK digest plus the addition of 2 % SDS at 50 °C for 2-3
hours. Separation of nucleic acid molecules from proteins and other cellular
debris was achieved by a phenol chloroform extraction after Chomczynski and
Sacchi (Chomczynski, et al., 1987). After the precipitation of the yielded DNA
from an aqueous solution in 40 % final isopropanol concentration, and a
washing step in 70 % ethanol, DNA was resuspended in water for further
utilization and finally, residual RNA contaminations were removed by RNase
mix addition and incubation at 37 °C for 1 hour.
2.3.11 SEQUENCING OF GENOMIC DNA FROM F IELD STRAIN FS2
In order to determine the Microcystis genotype of field strain FS2 concerning
carbon uptake systems, genomic DNA was used for PCR amplification and its
products subsequently send for sequencing at GATC Biotech, Konstanz.
According to Sandrini (Sandrini, et al., 2013) the genomic region of bicarbonate
uptake transporters bicA and/or sbtA, sbtB in Microcystis was expected to be
flanked by a transcriptional regulator gene ccmR2 and the sodium/proton
antiporter gene NhaS3, which surround varying forms and combinations of bicA
and sbtA. To cover the genomic region for sequencing, PCRs were designed to
yield overlapping products and sequencing primers were deduced considering
a sequence overlap of at least 100 base pairs (Figure 2-2). The primer design was
based on PCC 7806 sequences for primers: P1: bic-clust-fw; P4: bic-clust-rv and
on NIES 843 sequences in case of primers P2: sbtA-rv, P3: sbtA-fw using the
online tool Primer3web (Koressaar, et al., 2007; Untergasser, et al.). PCRs were
conducted using the Qiagen Taq-polymerase and according buffer systems after
the manufacturer’s instructions. Subsequently, PCR products were purified
with the Quiaquick PCR Purification Kit (Qiagen) and assessed concerning
their concentrations (specific absorption measurements on a nanodrop).
2 - Materials and Methods 34
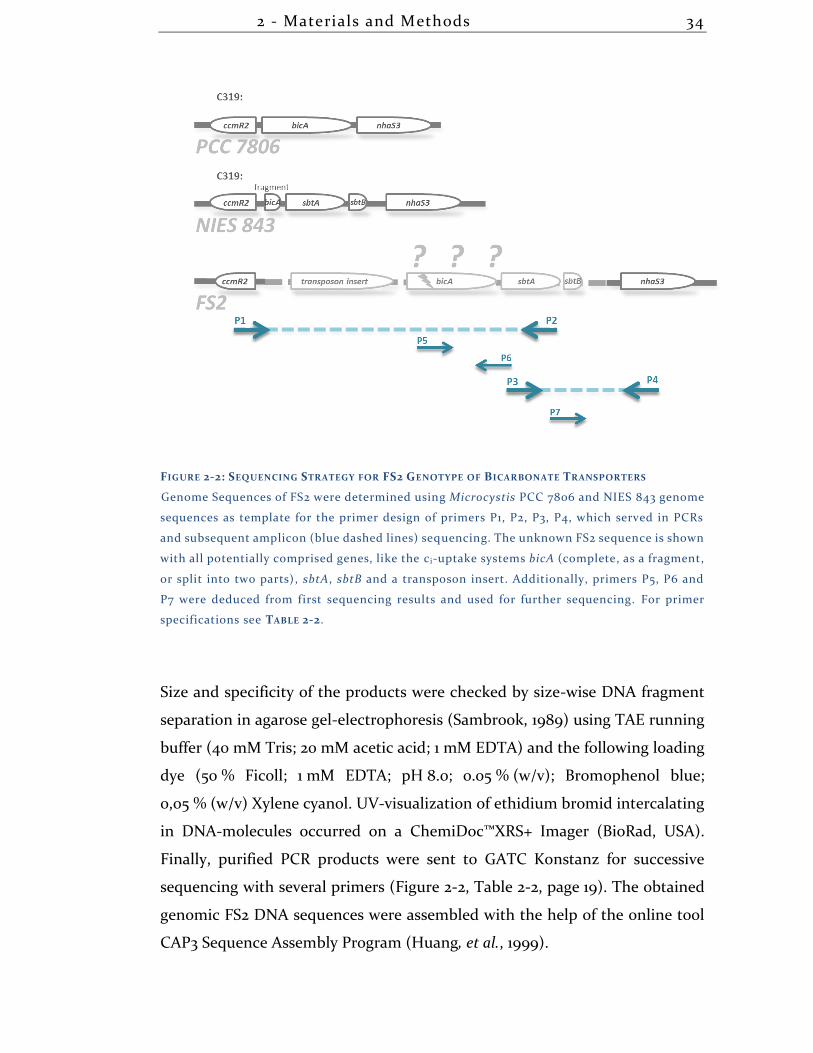
FIGURE 2-2: SEQUENCING STRATEGY FOR FS2 GENOTYPE OF BICARBONATE TRANSPORTERS
Genome Sequences of FS2 were determined using Microcystis PCC 7806 and NIES 843 genome
sequences as template for the primer design of primers P1, P2, P3, P4, which served in PCRs
and subsequent amplicon (blue dashed lines) sequencing. The unknown FS2 sequence is shown
with all potentially comprised genes, like the c i-uptake systems bicA (complete, as a fragment,
or split into two parts), sbtA, sbtB and a transposon insert. Additionally, primers P5, P6 and
P7 were deduced from first sequencing results and used for further sequencing. For primer
specifications see TABLE 2-2.
Size and specificity of the products were checked by size-wise DNA fragment
separation in agarose gel-electrophoresis (Sambrook, 1989) using TAE running
buffer (40 mM Tris; 20 mM acetic acid; 1 mM EDTA) and the following loading
dye (50 % Ficoll; 1 mM EDTA; pH 8.0; 0.05 % (w/v); Bromophenol blue;
0,05 % (w/v) Xylene cyanol. UV-visualization of ethidium bromid intercalating
in DNA-molecules occurred on a ChemiDoc™XRS+ Imager (BioRad, USA).
Finally, purified PCR products were sent to GATC Konstanz for successive
sequencing with several primers (Figure 2-2, Table 2-2, page 19). The obtained
genomic FS2 DNA sequences were assembled with the help of the online tool
CAP3 Sequence Assembly Program (Huang, et al., 1999).
2 - Materials and Methods 35
2.3.12 ILLUMINA SEQUENCING OF CYANOBACTERIAL F IELD STRAINS
The established uni-algal cyanobacterial field strain FS2 was analyzed for
potentially associated heterotrophic bacteria. Based on the Illumina MiSeq
technology, the hypervariable regions V4 of the 16 S rRNA were sequenced from
a DNA-mix of isolated field strains (isolation described in section 2.3.10). Primer
specifications are listed below comprising a 5 bp tag, a 2 bp linker and a 20 bp
primer sequence spanning a region of 291 bp (E. coli reference sequence). After
the sequencing was conducted by GATC Biotech, Konstanz, Germany, the
acquired raw data was analyzed by Dr. Fabian Horn from the section
Geomicrobiology of the GFZ German Research Centre for Geosciences,
Potsdam, Germany. The bioinformatics approach started with the quality
control of the sequencing library using the fastqc tool. (FastQC A Quality
Control tool for High Throughput Sequence Data
http://www.bioinformatics.babraham.ac.uk/projects/fastqc/ by S. Andrews).
Sequence reads were sorted according to their identifying barcodes, which were
detected and removed with the CutAdapt tool (Martin, 2011). The subsequent
steps included merging of reads using overlapping sequence regions (PEAR,
(Zhang, et al., 2014)), standardizing the nucleotide sequence orientation, and
trimming and filtering of low quality sequences (Trimmomatic, (Bolger, et al.,
2014)). After chimera removal, sequences were clustered into OTUs and
taxonomically assigned, employing the GreenGenes database with a cutoff of
97 % using the QIIME pipeline (Caporaso, et al., 2010). Resulting graphics were
created with the help of the open source krona toolkit
(http://sourceforge.net/projects/krona/).
Forward: 515F_01 ACGTA-GT-GTGCCAGCMGCCGCGGTAA
Reverse: 806R_01 ACGTA-CC-GGACTACHVGGGTWTCTAAT
2 - Materials and Methods 36
2.3.13 TRANSCRIPTIONAL STUDIES
The effects of extracellular Microcystis compounds (undifferentiated cell
exudates and 50 ng/mL microcystin-LR) on the physiological state of treated
Microcystis cultures (PCC 7806, ∆mcyB, FS2) were investigated on the
transcriptional level via microarrays and quantitative real time PCR (for
detailed experimental setup see Figure 2-1, page 18). Additionally, the
microarray studies allowed for a transcriptional comparison of the microcystin
deficient mutant ∆mcyB and the wild type PCC 7806.
The experimental and cultivation set up was conducted as described in section
2.3.3, using three biologically independent replicates of each test condition. To
provide robust transcriptional data, potential deviation in mRNA contents due
to technical mishandling was minimized by meticulously equal, as well as fast
and cool treatment of the samples.
2.3.13.1 RNA PREPARATION
Cell pellets of 40 mL cell culture obtained after the centrifugation (4,500 x g;
10 min) in ice-filled tubes were used for the preparation of total RNA according
to the single step method (Chomczynski, et al., 1987). Immediate fixation of cell
pellets in 1 mL of the phenol based TRIzol agent was followed by snap freezing
in liquid nitrogen. The RNA preparation was performed after TRIzol
manufacturer’s protocol including heating to 65 °C for 20 minutes while
shaking at 400 rpm. After addition of 200 µL chloroform, phase separation was
achieved through centrifugation (11,000 x g; 15 min) and the aqueous upper
phase was further used. This chloroform extraction step was repeated before
nucleic acid precipitation with 0.7 volumes of isopropanol for 5-30 minutes and
a following centrifugation at 11,000 x g for 10 minutes. After a wash step in
75 % ethanol (1 mL; 7,500 x g; 5 min) the resulting RNA pellet was dried and
dissolved in 30 µL H2O. Residual DNA was removed by TURBO DNase digest
2 - Materials and Methods 37
after the manufacturer’s protocol. An RNA clean up with RNeasy® Mini Kit 50
followed. RNA quality assessment included the determination of
concentrations, as well as protein and phenol contents based on nanodrop
absorption measurements at 230/260/280 nm, RNA agarose gel electrophoresis
for RNA degradation check, PCR giving negative results after complete DNA
digest, and in case of further use in microarrays an RNA integrity check with an
RNA 6000 Nano chip on a 2100 Bioanalyzer (Agilent Technologies). RNA
Samples were stored at -80 °C.
2.3.13.2 RNA AGAROSE GEL-ELECTROPHORESIS
Agarose gel-electrophoresis for RNA samples was conducted using a 1.5 %
agarose matrix in a MEN-buffer system. Agarose was melted in water by
microwave heating and allowed to cool down to approximately 50 °C before
adding 10 % of the final volume of 10 x MEN-buffer. Furthermore, formaldehyde
was added to a final concentration of 10 % vol. to reduce secondary structures
in nucleic acids. RNA samples were supplied with loading buffer containing
ethidium bromide for UV-visualization and denatured at 65 °C for 10 minutes
before loading and running the agarose gel at 50 V for 15 minutes and finally at
80 V for final size separation. Visualization was performed on a
ChemiDoc™XRS+ Imager (BioRad, USA).
MEN-buffer: 20 mM Mops; 1 mM EDTA; 5 mM sodium acetate; pH 8.0
2.3.13.3 QUANTITATIVE REAL TIME PCR
Transcription levels of the Microcystis PCC 7806 genes rnpB, mcyA, mcnB,
mcaA, aerJ, and IPF_47 (see Table 2-2) were determined in PCC 7806 wild type
cultures as well as ΔmcyB cultures with and without the application of external
2 - Materials and Methods 38
microcystin (50 ng/mL final concentration). Cultivation occurred at three
different light conditions (high light: 70 µmol photons * m-2 * s-1; low light:
16 µmol photons * m-2 * s-1; darkness: 0 µmol photons * m-2 * s-1) for biologically
independent triplicate batch cultures.
After RNA preparation and RNA quality assessment of these cultures as
described in 2.3.13.1 first strand cDNA was generated with random primers and
MAXIMA RT (Thermo Fisher Scientific Inc.) according to the manual
instructions and tested in technical triplicates of 100 ng template each, plus non
transcription control. RT-qPCR was conducted based on a SYBR green system
(SensiMix SYBR Low-ROX kit; Bioline) on the Light Cycler C480 (Roche) with
the following specifications: (95 °C: 10 min; 45 x [95 °C: 15 sec; 60 °C: 1 min];
melting curve: [95 °C: 5 sec; 65 °C: 1min; 97 °C: 1 sec]; 40 °C ∞).
Data analysis including baseline correction, linear regression, and threshold
cycle calculation, was performed by the LC480Conversion and LinRegPCR
software provided by the Heart Failure Research Centre (HFRC) in Amsterdam,
Netherlands.
Relative expression levels were determined according to (Pfaffl, 2001) including
corrections for the particular PCR efficiency and normalizing to the expression
of the housekeeping gene rnpB, a constitutively expressed component of
RNaseP.
Statistical significance was determined with the two tailed t-test after standard
error calculation of replicate groups and subsequent error propagation.
2.3.13.4 MICROARRAY CONDUCTION
The microarray hybridization was performed with the support and in the
facilities of the Microarray Department of the University of Amsterdam.
The RNA samples were reversely transcribed (Superscript II RT, Life
Technologies) into cDNA using random primers and incorporating Cy3- and
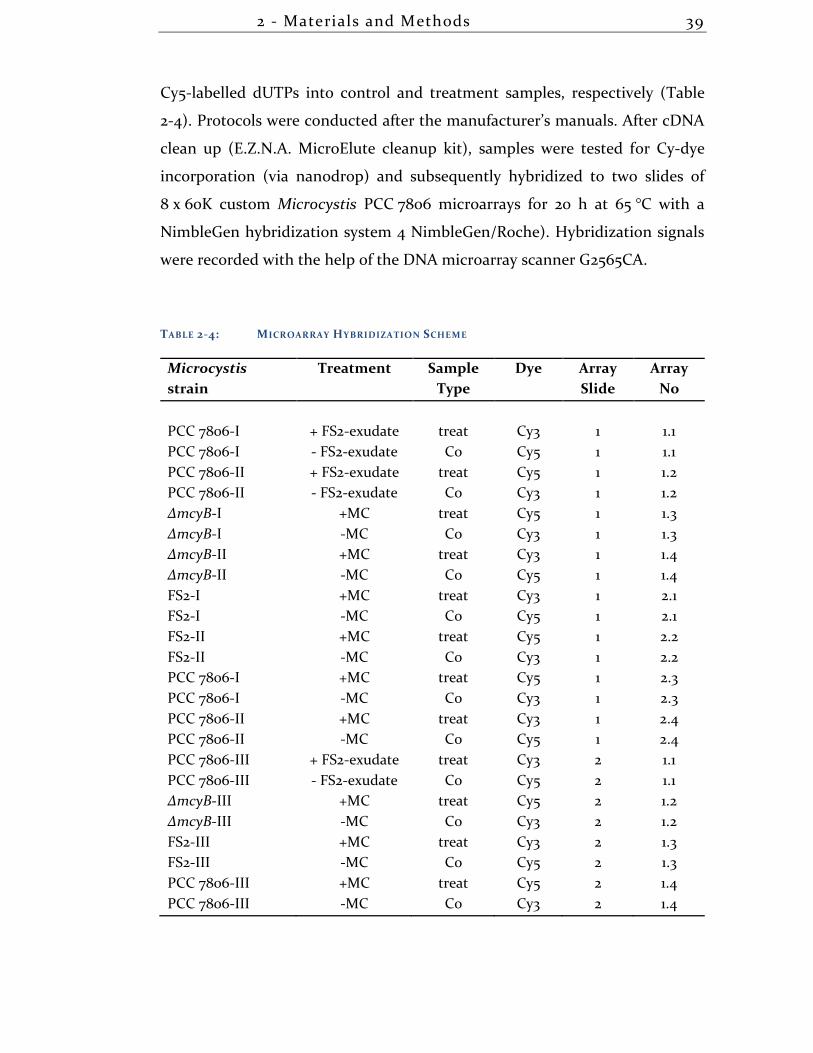
2 - Materials and Methods 39
Cy5-labelled dUTPs into control and treatment samples, respectively (Table
2-4). Protocols were conducted after the manufacturer’s manuals. After cDNA
clean up (E.Z.N.A. MicroElute cleanup kit), samples were tested for Cy-dye
incorporation (via nanodrop) and subsequently hybridized to two slides of
8 x 60K custom Microcystis PCC 7806 microarrays for 20 h at 65 °C with a
NimbleGen hybridization system 4 NimbleGen/Roche). Hybridization signals
were recorded with the help of the DNA microarray scanner G2565CA.
TABLE 2-4: MICROARRAY HYBRIDIZATION SCHEME
Microcystis
strain
Treatment Sample
Type
Dye Array
Slide
Array
No
PCC 7806-I + FS2-exudate treat Cy3 1 1.1
PCC 7806-I - FS2-exudate Co Cy5 1 1.1
PCC 7806-II + FS2-exudate treat Cy5 1 1.2
PCC 7806-II - FS2-exudate Co Cy3 1 1.2
ΔmcyB-I +MC treat Cy5 1 1.3
ΔmcyB-I -MC Co Cy3 1 1.3
ΔmcyB-II +MC treat Cy3 1 1.4
ΔmcyB-II -MC Co Cy5 1 1.4
FS2-I +MC treat Cy3 1 2.1
FS2-I -MC Co Cy5 1 2.1
FS2-II +MC treat Cy5 1 2.2
FS2-II -MC Co Cy3 1 2.2
PCC 7806-I +MC treat Cy5 1 2.3
PCC 7806-I -MC Co Cy3 1 2.3
PCC 7806-II +MC treat Cy3 1 2.4
PCC 7806-II -MC Co Cy5 1 2.4
PCC 7806-III + FS2-exudate treat Cy3 2 1.1
PCC 7806-III - FS2-exudate Co Cy5 2 1.1
ΔmcyB-III +MC treat Cy5 2 1.2
ΔmcyB-III -MC Co Cy3 2 1.2
FS2-III +MC treat Cy3 2 1.3
FS2-III -MC Co Cy5 2 1.3
PCC 7806-III +MC treat Cy5 2 1.4
PCC 7806-III -MC Co Cy3 2 1.4
2 - Materials and Methods 40
A hybridization scheme was developed that would account for impacts of dye
bias as well as for deviations in array quality. This was accomplished by avoiding
grouping samples of the same test conditions on the same array slides or using
the same dye for it. Intended for two-channel-detection per array, a control
sample and its treatment counterpart were labeled with Cy3 and Cy5,
respectively and hybridized to the same array. Triplicates were distributed over
2 slides of 8 arrays each with dye swaps for each genotype (Table 2-4).
2.3.13.5 MICROARRAY DESIGN
In this study custom Microcystis PCC 7806 oligonucleotide microarrays
provided by Agilent Technologies were used that were based on arrays of earlier
publications (Straub, et al., 2011) and modified by the Microarray Department
of the University of Amsterdam. 4,691 genes of the PCC 7806 genome (88.6 %)
were mapped on 60,000 spot arrays with an average of 5 probes per gene, while
each of the 60-mer oligonucleotides was printed in duplicate across one array,
thereby ensuring within-array replication and statistical computability. For
detailed probe information see data-set 1 in supplementary disc.
2.3.14 DATA ANALYSIS 1
The data processing and statistical analysis of the microarray data was
computed in the R environment (version R3.0.2 (R Core Team, 2013)), utilizing
the freely available Bioconductor software (Gentleman, et al., 2004), with the
limma package (Smyth, et al., 2003) for normalization. Statistical calculus was
performed in four groups of microarrays combining 1) WT samples treated with
1 This section is based on the Materials and Methods paragraph of the Publication Makower, et al. (see List of Publications) and might bear some identical text segments.
2 - Materials and Methods 41
FS2-supernatant; 2) FS2 samples treated with MC-LR; 3) WT and MT (mutant)
samples treated with MC-LR, and 4) DNA-microarrays of PCC 7806, ∆mcyB,
and FS2. Normalization employed within-array-normalization (loess method,
normexp background correction; offset: 50) and between-array-normalization
(aquantile method), followed by the separation of the two color channels. Due
to technical failure, one of the WT array triplicates, WT (± MC-LR), was omitted
from the statistical analysis. Reduced statistical power due to one missing
replicate was carefully considered during the interpretation of the data and
might have led to an overestimation of p-values in a few cases. Accordingly,
some genes just below the thresholds of differential expression were discussed,
nonetheless. Based on the obtained intensity lists for red (Cy5) and green (Cy3)
channels after normalization, hierarchical clustering (Euclidian),
multidimensional scaling (Cox, 2001), and principal component analysis (PCA)
(Groth, et al., 2012) were performed.
An analysis of variance (ANOVA) calculation provided probe-specific values of
fold changes, log2-scaled absolute expression, and p-values. In order to assess
differential gene expression, p-values for each of the 2 to 7 probes per gene had
to be combined into a single value that could be evaluated as being clearly below
or above the threshold of differential gene expression. This was achieved by
applying Fisher’s method (Mosteller, 1948), which considers each probe of a
gene as a replicate and additionally takes into account that similarly low p-
values of all probes per gene are not likely to occur due to chance but reflect a
more significant expression value than one value alone would show. Following
this, lists of differentially expressed genes were extracted, setting thresholds to
p ≤ 0.1 and log2-fold changes of ≥1 and ≤-1 (see data-sets 2 and 3 in
supplementary disc). For physiological interpretation of the array results,
assignments of functional gene categories (Table 2-5) to each gene were
conducted using both a Microcystis sp. strain PCC 7806 annotation and
Synechocystis sp. strain PCC 6803 annotation obtained from CyanoBase
(Kazusa genome resources; http://genome.microbedb.jp/cyanobase/).
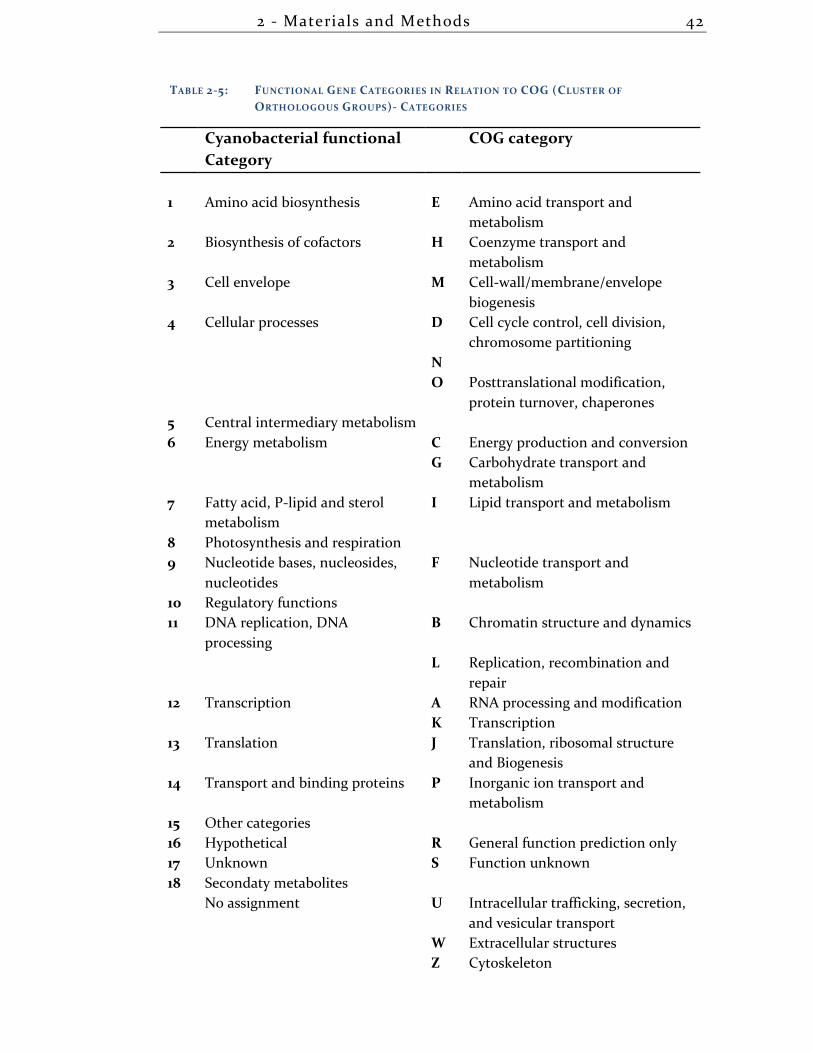
2 - Materials and Methods 42
TABLE 2-5: FUNCTIONAL GENE CATEGORIES IN RELATION TO COG (CLUSTER OF
ORTHOLOGOUS GROUPS)- CATEGORIES
Cyanobacterial functional
Category
COG category
1 Amino acid biosynthesis E Amino acid transport and
metabolism
2 Biosynthesis of cofactors H Coenzyme transport and
metabolism
3 Cell envelope M Cell-wall/membrane/envelope
biogenesis
4 Cellular processes D Cell cycle control, cell division,
chromosome partitioning
N
O Posttranslational modification,
protein turnover, chaperones
5 Central intermediary metabolism
6 Energy metabolism C Energy production and conversion
G Carbohydrate transport and
metabolism
7 Fatty acid, P-lipid and sterol
metabolism
I Lipid transport and metabolism
8 Photosynthesis and respiration
9 Nucleotide bases, nucleosides,
nucleotides
F Nucleotide transport and
metabolism
10 Regulatory functions
11 DNA replication, DNA
processing
B Chromatin structure and dynamics
L Replication, recombination and
repair
12 Transcription A RNA processing and modification
K Transcription
13 Translation J Translation, ribosomal structure
and Biogenesis
14 Transport and binding proteins P Inorganic ion transport and
metabolism
15 Other categories
16 Hypothetical R General function prediction only
17 Unknown S Function unknown
18 Secondaty metabolites
No assignment U Intracellular trafficking, secretion,
and vesicular transport
W Extracellular structures
Z Cytoskeleton
2 - Materials and Methods 43
T Signal transduction mechanism
V Defense mechanisms
Y Nuclear structure
2.3.15 DNA-DNA-M ICROARRAYS
Genomic DNA of the Microcystis strains PCC 7806, ∆mcyB and FS2 was used
for random DNA fragment amplification and subsequent fluorescent cyanine
dye labelling before the labelled fragments were hybridized to PCC 7806
custom microarrays that are described in detail in section 2.3.13.5. The
hybridization scheme is displayed in Table 2-4, page 39. Statistical evaluation
followed the same bioinformatics pipeline developed for the transcriptional
studies of this project.
TABLE 2-6: HYBRIDIZATION SCHEME OF DNA-MICROARRAYS
2.3.16 MALDI IMAGING
Thin-layer BG-11 agar plates of Microcystis aeruginosa PCC 7806 and FS2 field
strain mono- or co-cultures to study bacterial interactions were inoculated as
drop spots from fresh liquid cultures and incubated for 20 days. Further sample
processing and data-acquisition was carried out by Eric Helfrich at the ETH
Zurich, Switzerland. Sample preparation, matrix application, and dehydration
Microcystis strain Dye Array Slide Array No
PCC 7806-I Cy3 2 2.1
PCC 7806-I Cy5 2 2.1
ΔmcyB-I Cy3 2 2.2
ΔmcyB-I Cy5 2 2.2
FS2-I Cy3 2 2.3
FS2-I Cy5 2 2.3
2 - Materials and Methods 44
were conducted as described previously (Yang, et al., 2012). Agar pieces with
mono- or co-cultures were carefully transferred onto stainless steel MALDI
target plates and covered with a 1:1 mixture of 2,5-dihydroxybenzoic acid (DHB)
and α-cyano-4-hydroxycinnamic acid (CHCA), provided as Universal MALDI
Matrix (Sigma-Aldrich). The samples were dehydrated by incubation at 37 °C
overnight and subsequently stored in a desiccator. The data was acquired on a
MALDI LTQ Orbitrap mass spectrometer in positive mode with a resolution of
60.000, a laser energy of 35 µJ and a scan range between 100-2000 m/z. In order
to increase sensitivity, the scan range was split into two (100-950 and 900-
2000 m/z). The spatial resolution was set to 350 µm. Method optimization was
conducted using Thermo Tune Plus and Xcalibur. The data analysis was
performed with ImageQuest1.1. False colors were assigned to masses of interest
and superimposed onto an optical picture taken before matrix application.
Single spectra analysis on different spatial localizations for spectral comparison
was performed using ImageQuest.
2.3.17 ANALYZING THE EXUDATE OF MICROCYSTIS FS2
Spent media of Microcystis cultures were analyzed. Measurements of pH values,
and electric conductivity were conducted with a mobile pH-meter without
further preparation of the media. For mass spectrometer analysis FS2 exudates
were desiccated and sent to Eric Helfrich, ETH Zurich for testing.
For solid phase extraction, Sep-Pak Plus C18 cartridges were equilibrated with 2 mL
methanol, and rinsed with 2 mL H2O. Subsequently cell exudates were transferred to
cartridges and the flow-through was kept for activity tests. 2 mL of 5 % methanol
solution were applied on the cartridge, before dissolving bound compounds with 2 mL
100 % methanol. The solvent methanol was entirely evaporated in a vacuum
concentrator. For bioactivity tests the precipitate was solved in 200 µL of 100 %
methanol and diluted by additional 200 µL H2O. Additional dilution to 50 mL was
conducted with BG-11 for application in Microcystis cultures.
3 - Results 45
3 RESULTS
3.1 TRANSCRIPTOMICS-AIDED ANALYSIS OF THE INTRACELLULAR
AND EXTRACELLULAR ROLES OF MICROCYSTIN 2
n this first chapter of the experimental results, investigations regarding the
role of one distinct secondary metabolite, the heptapeptide microcystin,
are described. Microcystin, which is produced by only a fraction of
Microcystis strains, can be found in considerable amounts in the waters of
Microcystis habitats during mass proliferation events (Dittmann, et al., 2006).
The potential function of microcystin in the extracellular environment is under
debate (Kaplan, et al., 2012). Additionally, the physiological role of intracellular
microcystin is of great interest (D'Agostino, et al., 2015) and previous studies
have connected microcystin production to a broad range of physiological
aspects, including nutrient availability, light intensity and oxidative stress
(Jähnichen, et al., 2007; Kaebernick, et al., 2000; Zilliges, et al., 2011).
In order to investigate both, a potential extracellular function and the
intracellular role of microcystin, a comprehensive study was undertaken
concerning the transcriptomic states of the microcystin producer Microcystis
aeruginosa PCC 7806 and its ∆mcyB mutant, which is deficient in microcystin
production. This transcriptomic comparison enabled the identification of
physiological processes that were strongly influenced by the lack of microcystin
in the mutant. Furthermore, both strains were evaluated at the transcriptional
level in response to the presence of extracellular microcystin (50 ng/mL MC-
LR).
2 The data of this chapter was in large parts published in the journal of Applied and Environmental Microbiology in 2014 (see List of Publications).
I
3 - Results 46
3.1.1 ARRAY STATISTICS
The obtained microarray datasets for Microcystis wild type PCC 7806 (WT) and
microcystin deficient mutant ∆mcyB (MU) samples with their respective
treatments (BG-11 control and MC-LR addition) were assessed regarding the
quality of the output data. Normalized data exhibited comparable medium
log2-expression values, which were found to be in the same range among all
tested sample sets (Figure 3-1 a). The similarity between the complete datasets
of each replicate (characterized by the specific tested genotype, treatment and
array-chip number) was visualized by hierarchical clustering based on the
Euclidian distance matrix and by a multidimensional scaling (MDS) approach
(Figure 3-1 b, c). Both plots indicate that the overall similarity of transcriptional
datasets is very high within the same genotype and that in return, we find
pronounced expression differences between these two genotypes of the
microcystin producer and the non-producer. In the comparison of the complete
datasets however, the influence of extracellularly applied microcystin on gene
expression does not show in global similarity of the investigated
transcriptomes. However, this does not exclude a specific impact of
extracellular microcystin on individual genes and gene clusters.
Statistical robustness was demonstrated by the distribution of p-values that
assembles the majority of p-values for each gene/expression change within the
range of 0.0-0.1 (Figure 3-1 d). These preliminary results were used to define
thresholds for differential gene expression, which then were set to a log2-fold
change (lfc) of 1 ≤ lfc ≤-1 and p-values ≤ 0.1. Median log2-transformed
expression changes in the microcystin deficient mutant compared to the wild
type exhibited a Gaussian distribution (Figure 3-1 e) with a slight shift to the
negative values. This suggested that in the mutant more downregulated genes
are found relative to the wild type.
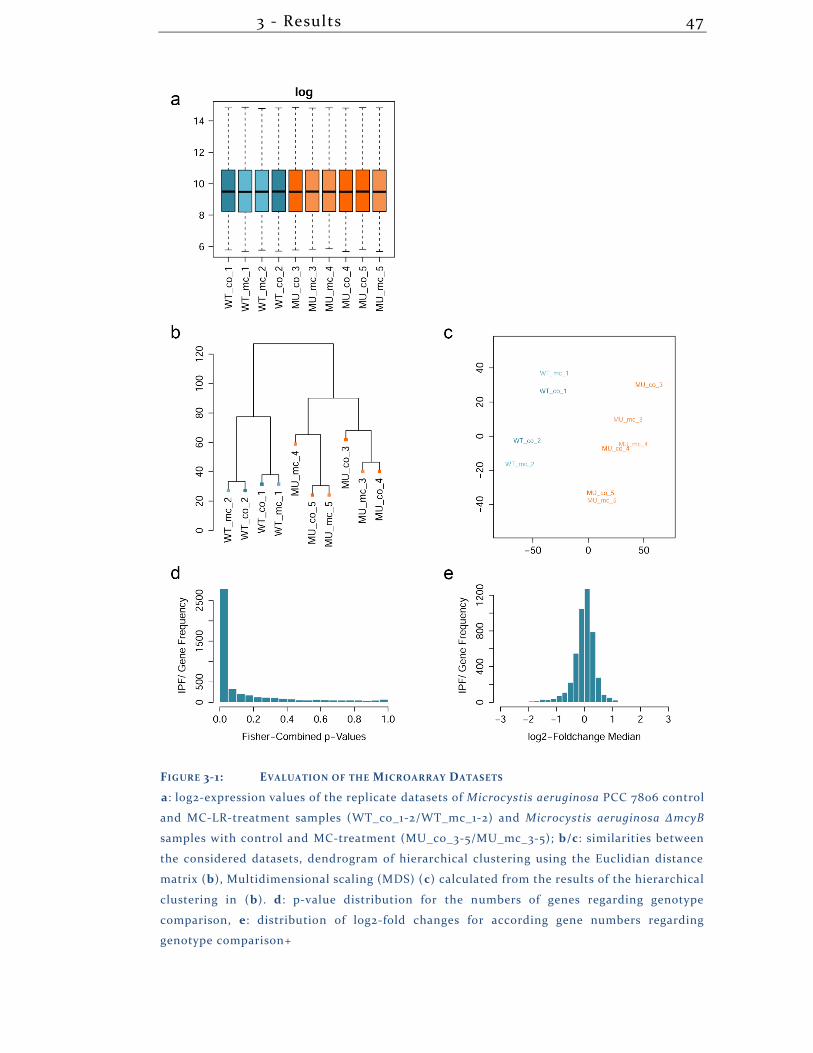
3 - Results 47
FIGURE 3-1: EVALUATION OF THE MICROARRAY DATASETS
a: log2-expression values of the replicate datasets of Microcystis aeruginosa PCC 7806 control
and MC-LR-treatment samples (WT_co_1-2/WT_mc_1-2) and Microcystis aeruginosa ∆mcyB
samples with control and MC-treatment (MU_co_3-5/MU_mc_3-5); b/c: similarities between
the considered datasets, dendrogram of hierarchical clustering using the Euclidian distance
matrix (b), Multidimensional scaling (MDS) (c) calculated from the results of the hierarchical
clustering in (b). d: p-value distribution for the numbers of genes regarding genotype
comparison, e: distribution of log2-fold changes for according gene numbers regarding
genotype comparison+
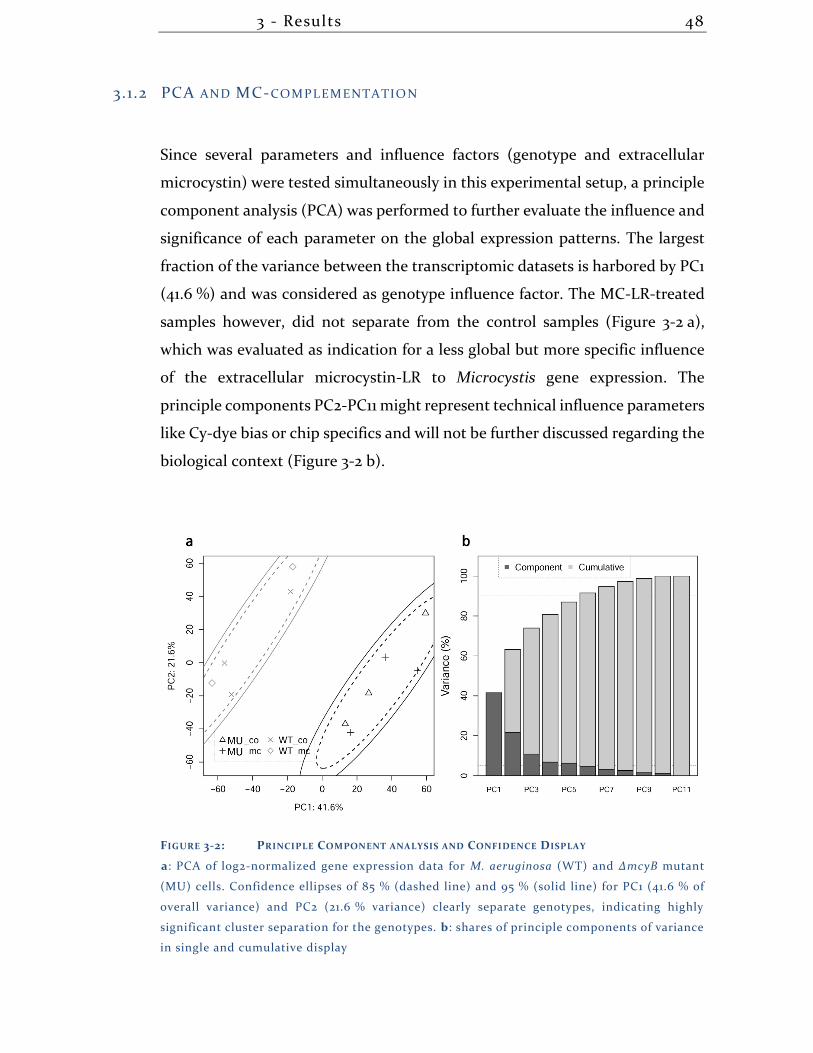
3 - Results 48
3.1.2 PCA AND MC-COMPLEMENTATIO N
Since several parameters and influence factors (genotype and extracellular
microcystin) were tested simultaneously in this experimental setup, a principle
component analysis (PCA) was performed to further evaluate the influence and
significance of each parameter on the global expression patterns. The largest
fraction of the variance between the transcriptomic datasets is harbored by PC1
(41.6 %) and was considered as genotype influence factor. The MC-LR-treated
samples however, did not separate from the control samples (Figure 3-2 a),
which was evaluated as indication for a less global but more specific influence
of the extracellular microcystin-LR to Microcystis gene expression. The
principle components PC2-PC11 might represent technical influence parameters
like Cy-dye bias or chip specifics and will not be further discussed regarding the
biological context (Figure 3-2 b).
FIGURE 3-2: PRINCIPLE COMPONENT ANALYSIS AND CONFIDENCE DISPLAY
a: PCA of log2-normalized gene expression data for M. aeruginosa (WT) and ∆mcyB mutant
(MU) cells. Confidence ellipses of 85 % (dashed line) and 95 % (solid line) for PC1 (41.6 % of
overall variance) and PC2 (21.6 % variance) clearly separate genotypes, indicating highly
significant cluster separation for the genotypes. b: shares of principle components of variance
in single and cumulative display
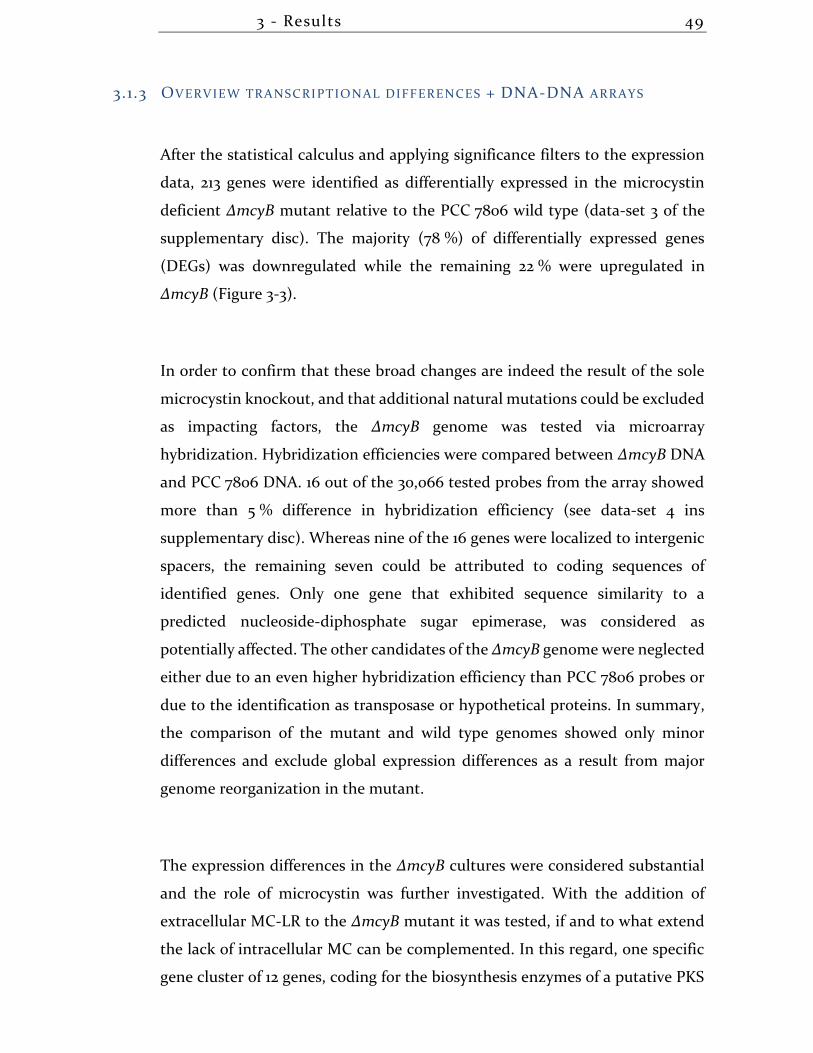
3 - Results 49
3.1.3 OVERVIEW TRANSCRIPTIO NAL DIFFERENCES + DNA-DNA ARRAYS
After the statistical calculus and applying significance filters to the expression
data, 213 genes were identified as differentially expressed in the microcystin
deficient ∆mcyB mutant relative to the PCC 7806 wild type (data-set 3 of the
supplementary disc). The majority (78 %) of differentially expressed genes
(DEGs) was downregulated while the remaining 22 % were upregulated in
∆mcyB (Figure 3-3).
In order to confirm that these broad changes are indeed the result of the sole
microcystin knockout, and that additional natural mutations could be excluded
as impacting factors, the ∆mcyB genome was tested via microarray
hybridization. Hybridization efficiencies were compared between ∆mcyB DNA
and PCC 7806 DNA. 16 out of the 30,066 tested probes from the array showed
more than 5 % difference in hybridization efficiency (see data-set 4 ins
supplementary disc). Whereas nine of the 16 genes were localized to intergenic
spacers, the remaining seven could be attributed to coding sequences of
identified genes. Only one gene that exhibited sequence similarity to a
predicted nucleoside-diphosphate sugar epimerase, was considered as
potentially affected. The other candidates of the ∆mcyB genome were neglected
either due to an even higher hybridization efficiency than PCC 7806 probes or
due to the identification as transposase or hypothetical proteins. In summary,
the comparison of the mutant and wild type genomes showed only minor
differences and exclude global expression differences as a result from major
genome reorganization in the mutant.
The expression differences in the ∆mcyB cultures were considered substantial
and the role of microcystin was further investigated. With the addition of
extracellular MC-LR to the ∆mcyB mutant it was tested, if and to what extend
the lack of intracellular MC can be complemented. In this regard, one specific
gene cluster of 12 genes, coding for the biosynthesis enzymes of a putative PKS
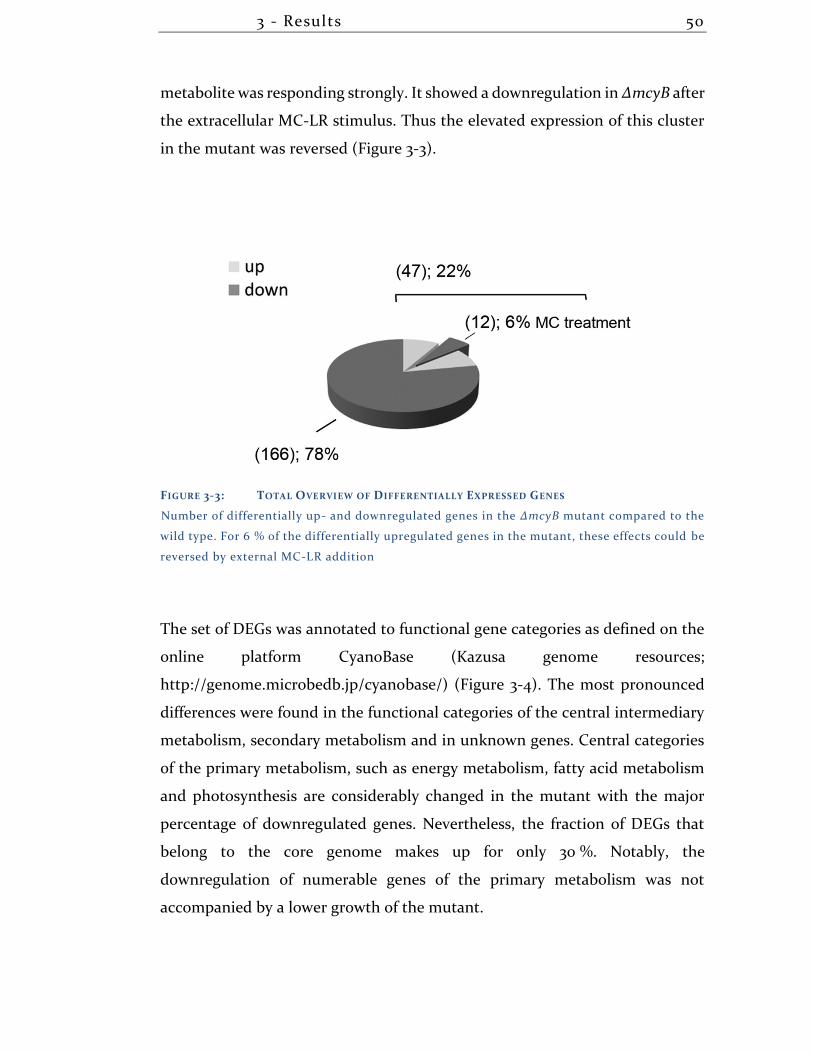
3 - Results 50
metabolite was responding strongly. It showed a downregulation in ∆mcyB after
the extracellular MC-LR stimulus. Thus the elevated expression of this cluster
in the mutant was reversed (Figure 3-3).
FIGURE 3-3: TOTAL OVERVIEW OF DIFFERENTIALLY EXPRESSED GENES
Number of differentially up- and downregulated genes in the ∆mcyB mutant compared to the
wild type. For 6 % of the differentially upregulated genes in the mutant, these effects could be
reversed by external MC-LR addition
The set of DEGs was annotated to functional gene categories as defined on the
online platform CyanoBase (Kazusa genome resources;
http://genome.microbedb.jp/cyanobase/) (Figure 3-4). The most pronounced
differences were found in the functional categories of the central intermediary
metabolism, secondary metabolism and in unknown genes. Central categories
of the primary metabolism, such as energy metabolism, fatty acid metabolism
and photosynthesis are considerably changed in the mutant with the major
percentage of downregulated genes. Nevertheless, the fraction of DEGs that
belong to the core genome makes up for only 30 %. Notably, the
downregulation of numerable genes of the primary metabolism was not
accompanied by a lower growth of the mutant.
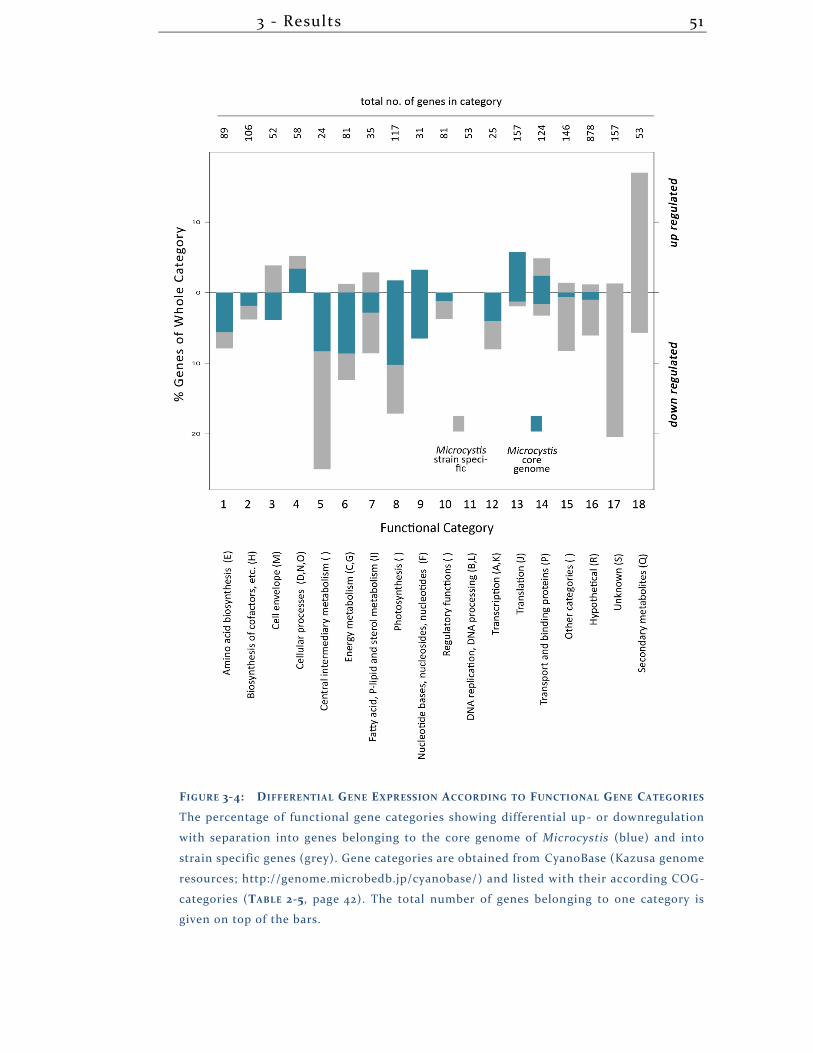
3 - Results 51
FIGURE 3-4: DIFFERENTIAL GENE EXPRESSION ACCORDING TO FUNCTIONAL GENE CATEGORIES
The percentage of functional gene categories showing differential up- or downregulation
with separation into genes belonging to the core genome of Microcystis (blue) and into
strain specific genes (grey). Gene categories are obtained from CyanoBase (Kazusa genome
resources; http://genome.microbedb.jp/cyanobase/) and listed with their according COG-
categories (TABLE 2-5, page 42). The total number of genes belonging to one category is
given on top of the bars.
3 - Results 52
Since the transcriptional changes were spanning a broad set of genes from all
categories of primary and secondary metabolism, it was focused on
differentially expressed regulators and their potential to alter comprehensive
transcriptional programs. A promising candidate was found in IPF_1434, an
HTH-type transcriptional regulator that was more than tenfold downregulated
in the mutant (lfc=-3.2). The function of this regulator has not been confirmed
yet. However, considering that it is not present in a number of toxic Microcystis
strain, speaks against a direct involvement with microcystin. A regulator,
conserved across Microcystis strains that was considerably downregulated in
the MC-deficient mutant, was identified as alternative circadian clock regulator
kaiB1. It acts in an opposing manner to the original kaiB gene from PCC 7806
and opens up speculation about the influence of MC on processes determined
by the circadian rhythm. Another lead to a correlation of the MC-knockout to
light related processes was found in the downregulation of the essential
response regulator Ycf27, which has been implicated in the transfer of excitation
energy from the phycobilisome to PSI (Ashby, et al., 2002). Additional DEGs
with regulating functions are mentioned in later sections in respect to their
biological contexts.
3.1.4 TRANSCRIPTIONAL CHANGES IN THE ∆MCYB MUTANT IN THE CELLULAR
CONTEXT
The transcriptional changes in the ∆mcyB mutant compared to the PCC 7806
wild type were analyzed in regard to their implications in metabolic and cellular
processes. An overview is displayed below (Figure 3-5, page 53). In the following
sections, differentially expressed genes are discussed in detail concerning their
involvement in photosynthesis, energy metabolism and secondary metabolites.
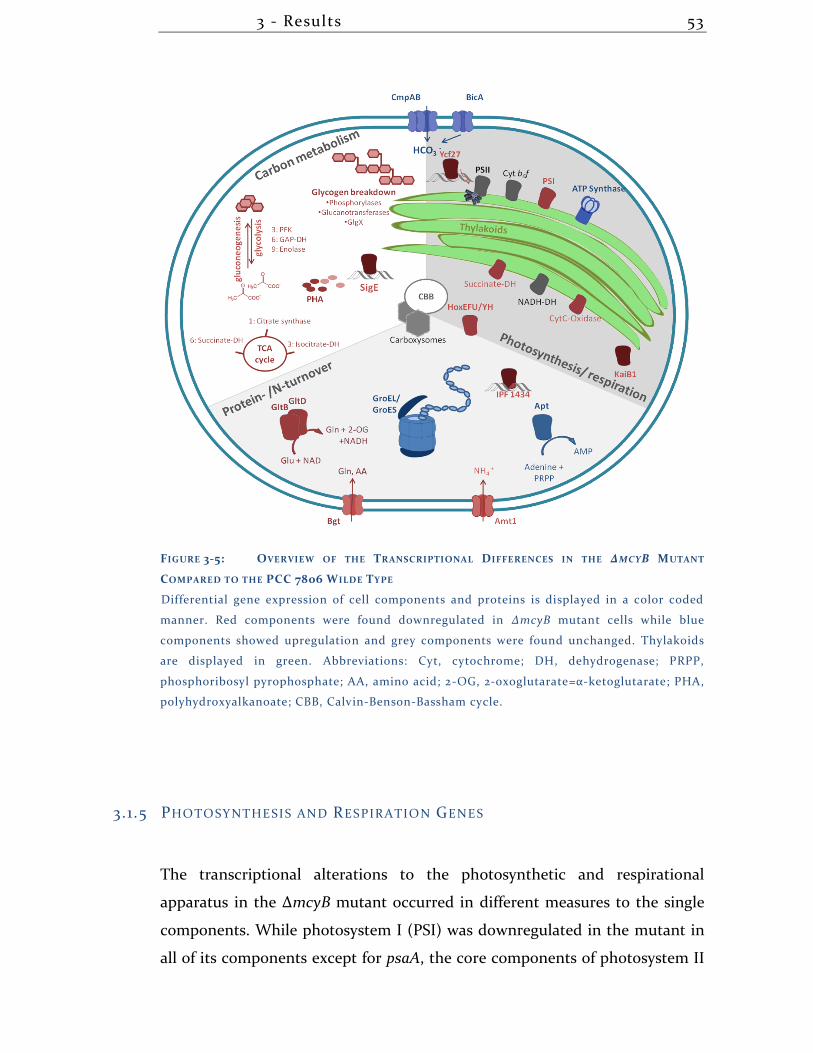
3 - Results 53
FIGURE 3-5: OVERVIEW OF THE TRANSCRIPTIONAL DIFFERENCES IN THE ∆MCYB MUTANT
COMPARED TO THE PCC 7806 WILDE TYPE
Differential gene expression of cell components and proteins is displayed in a color coded
manner. Red components were found downregulated in ∆mcyB mutant cells while blue
components showed upregulation and grey components were found unchanged. Thylakoids
are displayed in green. Abbreviations: Cyt, cytochrome; DH, dehydrogenase; PRPP,
phosphoribosyl pyrophosphate; AA, amino acid; 2-OG, 2-oxoglutarate=α-ketoglutarate; PHA,
polyhydroxyalkanoate; CBB, Calvin-Benson-Bassham cycle.
3.1.5 PHOTOSYNTHESIS AND RESPIRATION GENES
The transcriptional alterations to the photosynthetic and respirational
apparatus in the ∆mcyB mutant occurred in different measures to the single
components. While photosystem I (PSI) was downregulated in the mutant in
all of its components except for psaA, the core components of photosystem II
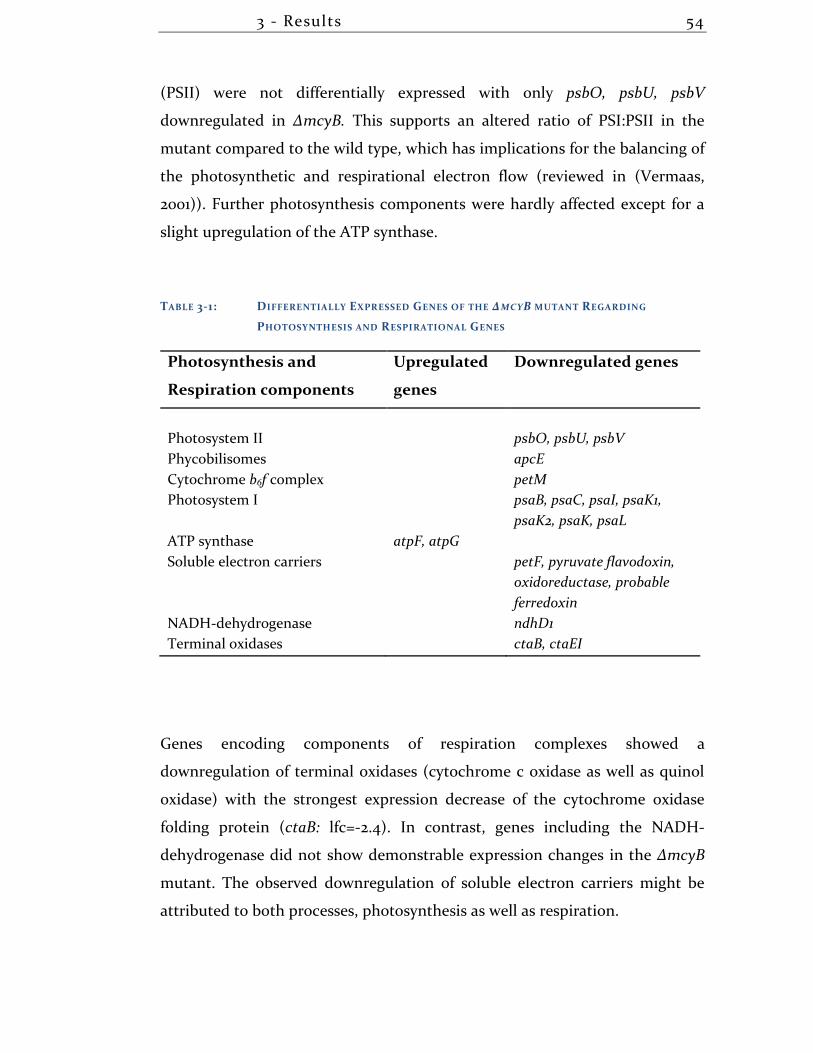
3 - Results 54
(PSII) were not differentially expressed with only psbO, psbU, psbV
downregulated in ∆mcyB. This supports an altered ratio of PSI:PSII in the
mutant compared to the wild type, which has implications for the balancing of
the photosynthetic and respirational electron flow (reviewed in (Vermaas,
2001)). Further photosynthesis components were hardly affected except for a
slight upregulation of the ATP synthase.
TABLE 3-1: DIFFERENTIALLY EXPRESSED GENES OF THE ∆MCYB MUTANT REGARDING
PHOTOSYNTHESIS AND RESPIRATIONAL GENES
Photosynthesis and
Respiration components
Upregulated
genes
Downregulated genes
Photosystem II psbO, psbU, psbV
Phycobilisomes apcE
Cytochrome b6f complex petM
Photosystem I psaB, psaC, psaI, psaK1,
psaK2, psaK, psaL
ATP synthase atpF, atpG
Soluble electron carriers petF, pyruvate flavodoxin,
oxidoreductase, probable
ferredoxin
NADH-dehydrogenase ndhD1
Terminal oxidases ctaB, ctaEI
Genes encoding components of respiration complexes showed a
downregulation of terminal oxidases (cytochrome c oxidase as well as quinol
oxidase) with the strongest expression decrease of the cytochrome oxidase
folding protein (ctaB: lfc=-2.4). In contrast, genes including the NADH-
dehydrogenase did not show demonstrable expression changes in the ∆mcyB
mutant. The observed downregulation of soluble electron carriers might be
attributed to both processes, photosynthesis as well as respiration.
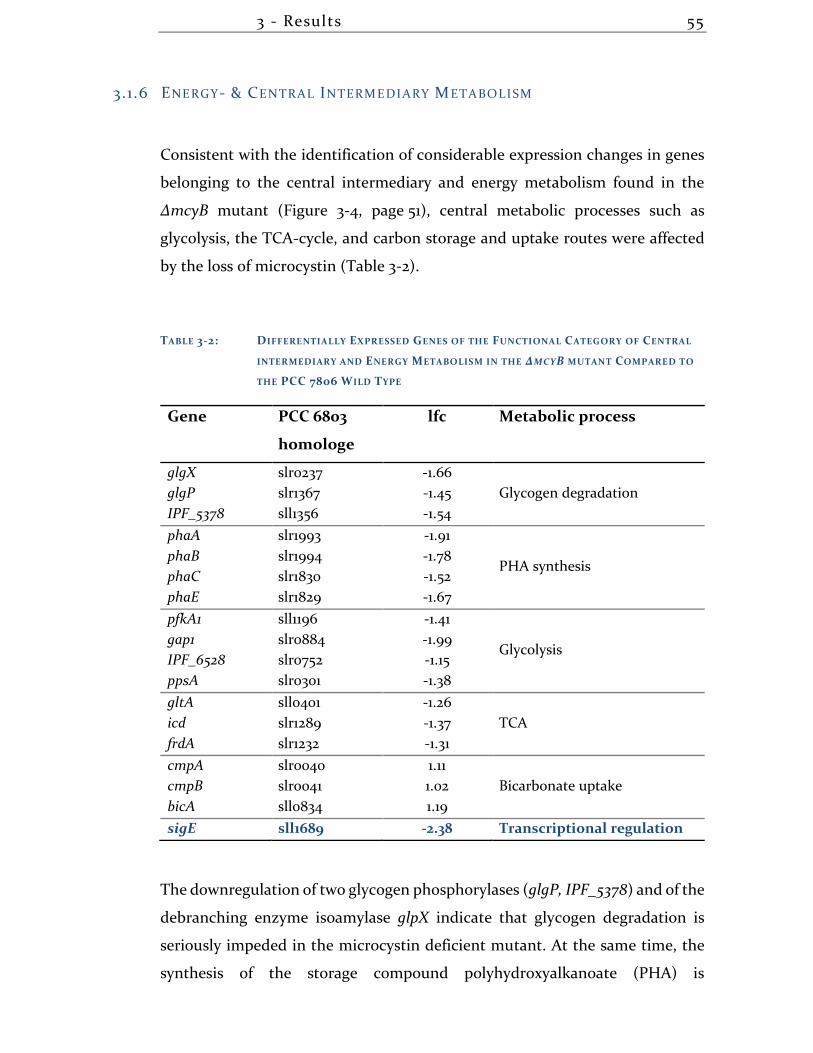
3 - Results 55
3.1.6 ENERGY- & CENTRAL INTERMEDIARY METABOLISM
Consistent with the identification of considerable expression changes in genes
belonging to the central intermediary and energy metabolism found in the
∆mcyB mutant (Figure 3-4, page 51), central metabolic processes such as
glycolysis, the TCA-cycle, and carbon storage and uptake routes were affected
by the loss of microcystin (Table 3-2).
TABLE 3-2: DIFFERENTIALLY EXPRESSED GENES OF THE FUNCTIONAL CATEGORY OF CENTRAL
INTERMEDIARY AND ENERGY METABOLISM IN THE ∆MCYB MUTANT COMPARED TO
THE PCC 7806 WILD TYPE
Gene PCC 6803
homologe
lfc Metabolic process
glgX slr0237 -1.66
Glycogen degradation glgP slr1367 -1.45
IPF_5378 sll1356 -1.54
phaA slr1993 -1.91
PHA synthesis phaB slr1994 -1.78
phaC slr1830 -1.52
phaE slr1829 -1.67
pfkA1 sll1196 -1.41
Glycolysis gap1 slr0884 -1.99
IPF_6528 slr0752 -1.15
ppsA slr0301 -1.38
gltA sll0401 -1.26
TCA icd slr1289 -1.37
frdA slr1232 -1.31
cmpA slr0040 1.11
Bicarbonate uptake cmpB slr0041 1.02
bicA sll0834 1.19
sigE sll1689 -2.38 Transcriptional regulation
The downregulation of two glycogen phosphorylases (glgP, IPF_5378) and of the
debranching enzyme isoamylase glpX indicate that glycogen degradation is
seriously impeded in the microcystin deficient mutant. At the same time, the
synthesis of the storage compound polyhydroxyalkanoate (PHA) is
3 - Results 56
downregulated in its biosynthesis genes (phaABCE). Furthermore, the
heterotrophic-like pathways of the glycolysis and the TCA-cycle are
downregulated in genes for key enzymes of these pathways. This included
phosphofructokinase (pfkA) glyceraldehyde 3-phosphate dehydrogenase (gap1)
and the phosphoenol-pyruvate synthase (ppsA) involved in the glycolytic
carbohydrate degradation, whereas the affected TCA-cycle genes comprise
citrate synthase (gltA), isocitrate-dehydrogenase (icd), and the succinate
dehydrogenase (frdA).
In this respect it is noteworthy, that carbon acquisition via the uptake of
bicarbonate seems to be increased by the upregulation of the two bicarbonate
uptake systems bicA and cmpAB.
The above mentioned set of genes, which is strongly involved in the sugar
catabolism, was shown to be positively transcriptionally regulated by the
alternative sigma factor SigE (Osanai, et al., 2011). sigE itself was strongly
downregulated in the microcystin deficient mutant
3.1.7 SINGLE NOTICEABLE ASPECTS OF THE TRANSCRIPTIONAL STATE OF
∆MCYB
In addition to implications of the aforementioned alternative sigma factor SigE
in the regulation of sugar catabolic processes, SigE was shown to have an impact
on the transcription of the hox genes (Osanai, et al., 2011) that encode for a
bidirectional Ni-Fe hydrogenase. The Ni-Fe has been suggested to play a
considerable part in regulation of the redox state of cyanobacterial cells
(Carrieri, et al., 2011). These target genes of SigE for the respective subunits of
the bidirectional hydrogenase are also downregulated in the ∆mcyB mutant
with log2 fold changes between -1.08 and -1.76.
Summarized within the topic of protein and nitrogen turnover, a few distinct
genes among the DEGs stand out. The chaperone components GroEL/GroES
3 - Results 57
belong to the smaller fraction of genes that are upregulated in the microcystin
deficient mutant indicating an increased need for protein folding. Glutamine
and basic amino acid transporters BgtA/B were down regulated. With a lfc<-2.1
the glutamate synthase genes gltB/D were strongly downregulated, thus mostly
stopping the reversible transformation between glutamate and glutamine.
The highest upregulation with an 18-fold higher expression in the ∆mcyB
mutant is the apt gene (adenine phosphoribosyltransferase), which catalyzes
the formation of AMP utilizing adenine and phosphoribosyl pyrophosphate as
substrates.
3.1.8 SECONDARY METABOLITES
The only gene cluster that was responding to an extracellular stimulus of
microcystin-LR belonged to the category of secondary metabolites. The
complete set of 12 genes of an orphan PKSI/III hybrid cluster (IPF_38-51) showed
a significant downregulation one hour after the treatment with MC-LR. This
observation in combination with earlier reports that had suggested
autoinduction of microcystin as well as crosstalk between secondary
metabolites (Schatz, et al., 2007) has led to a closer investigation of the
transcriptional reaction of the secondary metabolite gene category (Figure 3-6).
Six secondary metabolites and their respective biosynthesis gene clusters that
have been described and reviewed before (Humbert, et al., 2013), were in the
focus of this analysis. Four of these pathways have been attributed to the
production of the known metabolites microcystin, aeruginosin, cyanopeptolin,
and microcyclamide.
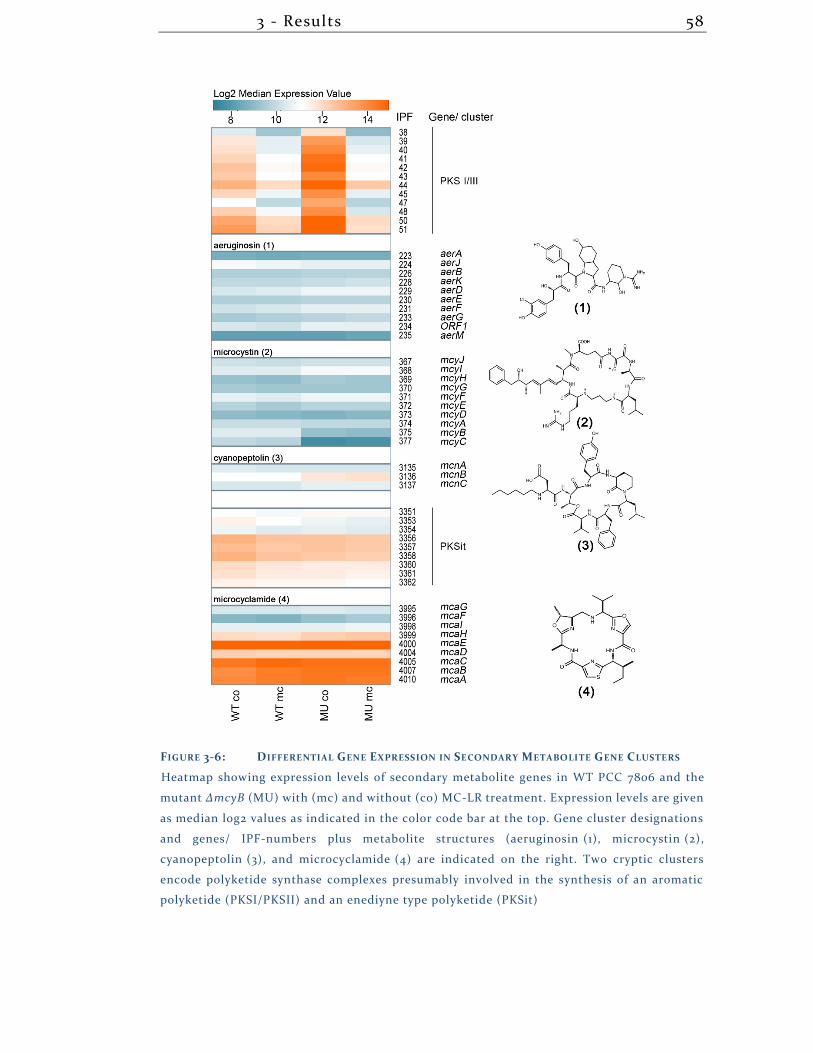
3 - Results 58
FIGURE 3-6: DIFFERENTIAL GENE EXPRESSION IN SECONDARY METABOLITE GENE CLUSTERS
Heatmap showing expression levels of secondary metabolite genes in WT PCC 7806 and the
mutant ∆mcyB (MU) with (mc) and without (co) MC-LR treatment. Expression levels are given
as median log2 values as indicated in the color code bar at the top. Gene cluster designations
and genes/ IPF-numbers plus metabolite structures (aeruginosin (1), microcystin (2),
cyanopeptolin (3), and microcyclamide (4) are indicated on the right. Two cryptic clusters
encode polyketide synthase complexes presumably involved in the synthesis of an aromatic
polyketide (PKSI/PKSII) and an enediyne type polyketide (PKSit)
3 - Results 59
The other two represent orphan gene clusters without identified metabolites.
Structural predictive tools like the online platform antiSMASH (Weber, et al.,
2015) helped to identify putative structural characteristics. This way the before
mentioned PKSI/III derived metabolite was suggested to exhibit aromatic
features introduced by a chalcone type PKSIII synthase (Frangeul, et al., 2008).
The iterative type PKSit cluster (IPF_3351-3362) on the other hand, supposedly
encodes for enzymes producing an enediyne type metabolite (Frangeul, et al.,
2008).
The microarray based transcriptional analysis of the biosynthesis gene clusters
for these secondary metabolites showed that the only cluster responding to
extracellular MC-LR under the tested conditions was the hybrid PKSI/III
cluster. The expression of genes from this cluster was significantly increased in
the mutant but this effect was complemented by the treatment of cultures with
extracellular microcystin. The decrease of gene transcription occurred to
similar final expression levels in the wild type and the mutant. Nevertheless,
other gene clusters for secondary metabolites showed expression differences in
the comparison between wild type and mutant. The transcription of
biosynthesis genes for, aeruginosin, cyanopeptolin, and microcyclamide are
slightly enhanced in ∆mcyB, although these differences were not significant.
Interestingly, the expression levels of the precursor gene (mcaE) of the
ribosomally produced microcyclamide was one of the highest throughout the
whole transcriptomic data set.
An autoinduction of microcystin, which had been reported before, could not be
confirmed under the conditions tested. The only transcriptional alterations
were seen in a lower transcript abundance of the mcyB and mcyC genes in the
microcystin deficient mutant. The lowered expression values most likely occur
due to the genetic engineering that had introduced an antibiotic resistance
cassette into the mcyB gene, thus either stopping transcription of both co-
transcribed genes or decreasing hybridization efficiencies on the microarray.
3 - Results 60
3.1.8.1 QUANTITATIVE EXPRESSION ANALYSIS OF SECONDARY METABOLITES
IN RESPONSE TO EXTRACELLULAR MICROCYSTIN UNDER THREE LIGHT
CONDITIONS
After the unexpected outcome of the transcriptional data that stated a less
pronounced autoinduction effected of microcystin, a comprehensive
transcriptional investigation of secondary metabolites was initiated, intended
to test the transcriptional response of five of the above discussed gene clusters
to extracellularly applied microcystin under three different light conditions.
Microcystis PCC 7806 wild type and ∆mcyB mutant cultures were grown in
three replicates to the late exponential phase (OD750=1.0) and then left for two
days in order to acclimate to the according light conditions of either total
darkness, or low light conditions of 16 µmol photons * m-2 * s-1, or high light
conditions of 70 µmol photons * m-2 * s-1. Treatment and control samples were
taken one hour after the subsequent addition of 50 ng/mL MC-LR and used for
quantitative real time PCR. One gene of each cluster was chosen as
representative for the production of the metabolite (microcystin: mcyA;
cyanopeptolin: mcnB; microcyclamide: mcaE; aeruginosin: aerJ; PKSI/III
metabolite: IPF_47).
The quantitative expression data revealed a strong impact of light intensities on
the transcription of all tested secondary metabolites (Figure 3-7). Consistent
with previous reports (Kaebernick, et al., 2000), mcyA transcription increased
with higher light intensities. Equal tendencies were observed for cyanopeptolin
and microcyclamide, but not for aeruginosin and the unknown PKSI/III
metabolite. Notably, each of the tested secondary metabolites tend to be
expressed at higher levels in the microcystin deficient mutant, unless they were
acclimated to darkness, when this effect appeared to be reversed. The trend of
elevated secondary metabolite transcripts in the mutant was partly seen in the
microarray studies as well and was confirmed by the RT-PCR results with more
pronounced expression differences.
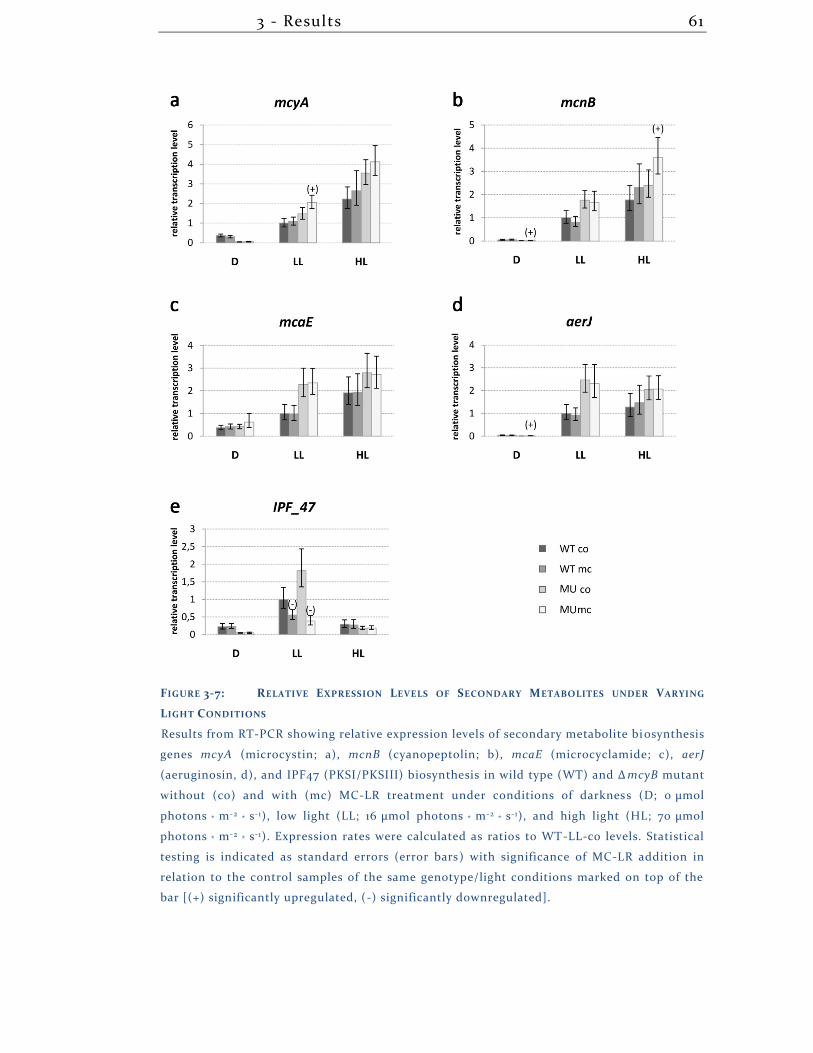
3 - Results 61
FIGURE 3-7: RELATIVE EXPRESSION LEVELS OF SECONDARY METABOLITES UNDER VARYING
LIGHT CONDITIONS
Results from RT-PCR showing relative expression levels of secondary metabolite biosynthesis
genes mcyA (microcystin; a), mcnB (cyanopeptolin; b), mcaE (microcyclamide; c), aerJ
(aeruginosin, d), and IPF47 (PKSI/PKSIII) biosynthesis in wild type (WT) and ∆ mcyB mutant
without (co) and with (mc) MC-LR treatment under conditions of darkness (D; 0 µmol
photons * m-2 * s-1), low light (LL; 16 µmol photons * m-2 * s-1), and high light (HL; 70 µmol
photons * m-2 * s-1). Expression rates were calculated as ratios to WT-LL-co levels. Statistical
testing is indicated as standard errors (error bars) with significance of MC-LR addition in
relation to the control samples of the same genotype/light conditions marked on top of the
bar [(+) significantly upregulated, (-) significantly downregulated].
3 - Results 62
The effect of extracellular microcystin does not show a systematic pattern.
Significant inducing effects of MC-LR on the expression of mcyA and mcnB were
seen only at low light conditions for mcyA and at high light conditions for mcnB
and only in the ∆mcyB mutant (Figure 3-7 a, b).
The transcriptional pattern of the IPF_47 gene represents a clear contrast to the
transcription of the four other tested secondary metabolites. Here, the highest
transcription occurs during low light cultivation. Furthermore, under these
light conditions microcystin addition was leading to significantly decreased
transcription of the IPF_47 gene in both, wildtype and mutant cultures. Thus,
this transcriptional behavior exhibits a reciprocal trend compared to mcyA and
mcnB in respect to light and is in perfect agreement with data acquired in the
microarray experiments.
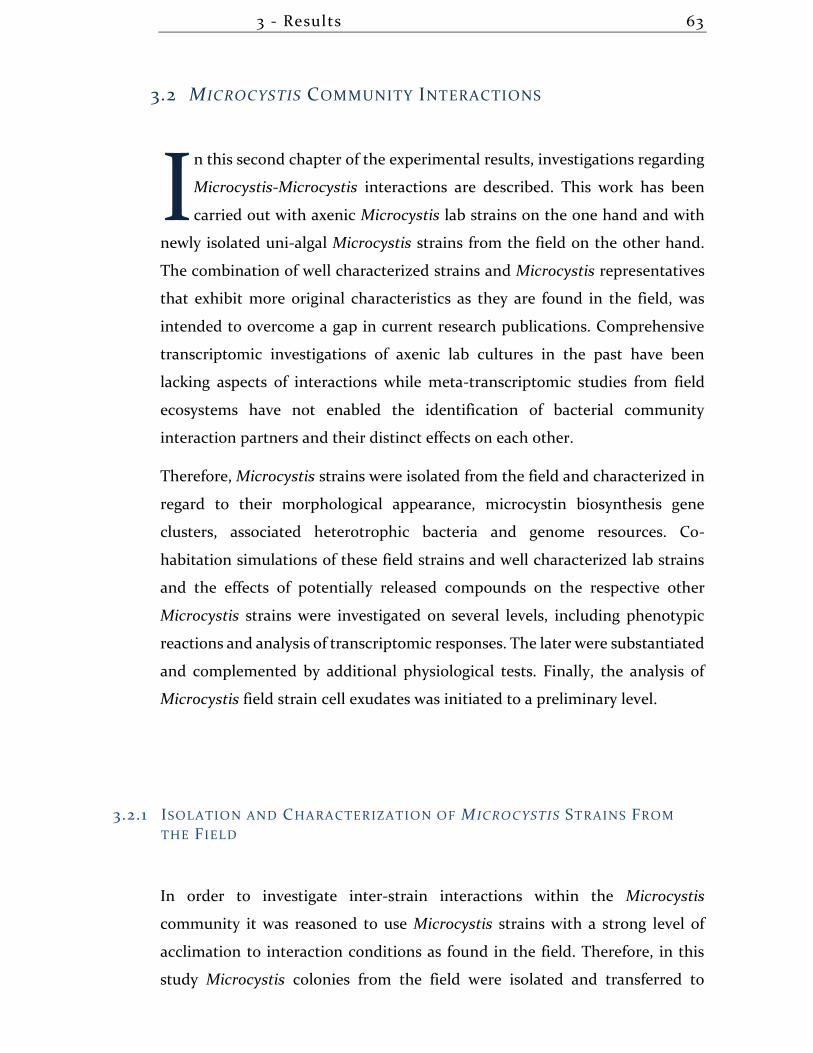
3 - Results 63
3.2 MICROCYSTIS COMMUNITY INTERACTIONS
n this second chapter of the experimental results, investigations regarding
Microcystis-Microcystis interactions are described. This work has been
carried out with axenic Microcystis lab strains on the one hand and with
newly isolated uni-algal Microcystis strains from the field on the other hand.
The combination of well characterized strains and Microcystis representatives
that exhibit more original characteristics as they are found in the field, was
intended to overcome a gap in current research publications. Comprehensive
transcriptomic investigations of axenic lab cultures in the past have been
lacking aspects of interactions while meta-transcriptomic studies from field
ecosystems have not enabled the identification of bacterial community
interaction partners and their distinct effects on each other.
Therefore, Microcystis strains were isolated from the field and characterized in
regard to their morphological appearance, microcystin biosynthesis gene
clusters, associated heterotrophic bacteria and genome resources. Co-
habitation simulations of these field strains and well characterized lab strains
and the effects of potentially released compounds on the respective other
Microcystis strains were investigated on several levels, including phenotypic
reactions and analysis of transcriptomic responses. The later were substantiated
and complemented by additional physiological tests. Finally, the analysis of
Microcystis field strain cell exudates was initiated to a preliminary level.
3.2.1 ISOLATION AND CHARACTERIZATION OF M ICRO CYSTIS STRAINS FROM
THE F IELD
In order to investigate inter-strain interactions within the Microcystis
community it was reasoned to use Microcystis strains with a strong level of
acclimation to interaction conditions as found in the field. Therefore, in this
study Microcystis colonies from the field were isolated and transferred to
I
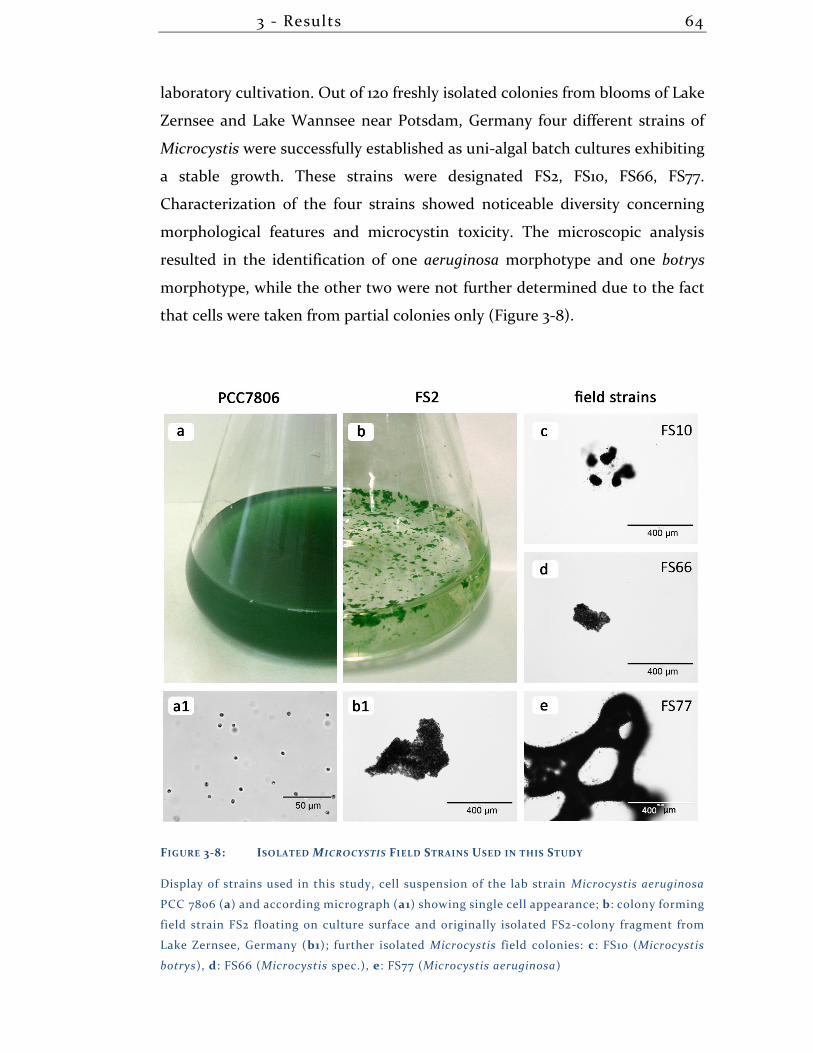
3 - Results 64
laboratory cultivation. Out of 120 freshly isolated colonies from blooms of Lake
Zernsee and Lake Wannsee near Potsdam, Germany four different strains of
Microcystis were successfully established as uni-algal batch cultures exhibiting
a stable growth. These strains were designated FS2, FS10, FS66, FS77.
Characterization of the four strains showed noticeable diversity concerning
morphological features and microcystin toxicity. The microscopic analysis
resulted in the identification of one aeruginosa morphotype and one botrys
morphotype, while the other two were not further determined due to the fact
that cells were taken from partial colonies only (Figure 3-8).
FIGURE 3-8: ISOLATED MICROCYSTIS FIELD STRAINS USED IN THIS STUDY
Display of strains used in this study, cell suspension of the lab strain Microcystis aeruginosa
PCC 7806 (a) and according micrograph (a1) showing single cell appearance; b: colony forming
field strain FS2 floating on culture surface and originally isolated FS2-colony fragment from
Lake Zernsee, Germany (b1); further isolated Microcystis field colonies: c: FS10 (Microcystis
botrys), d: FS66 (Microcystis spec.), e: FS77 (Microcystis aeruginosa)
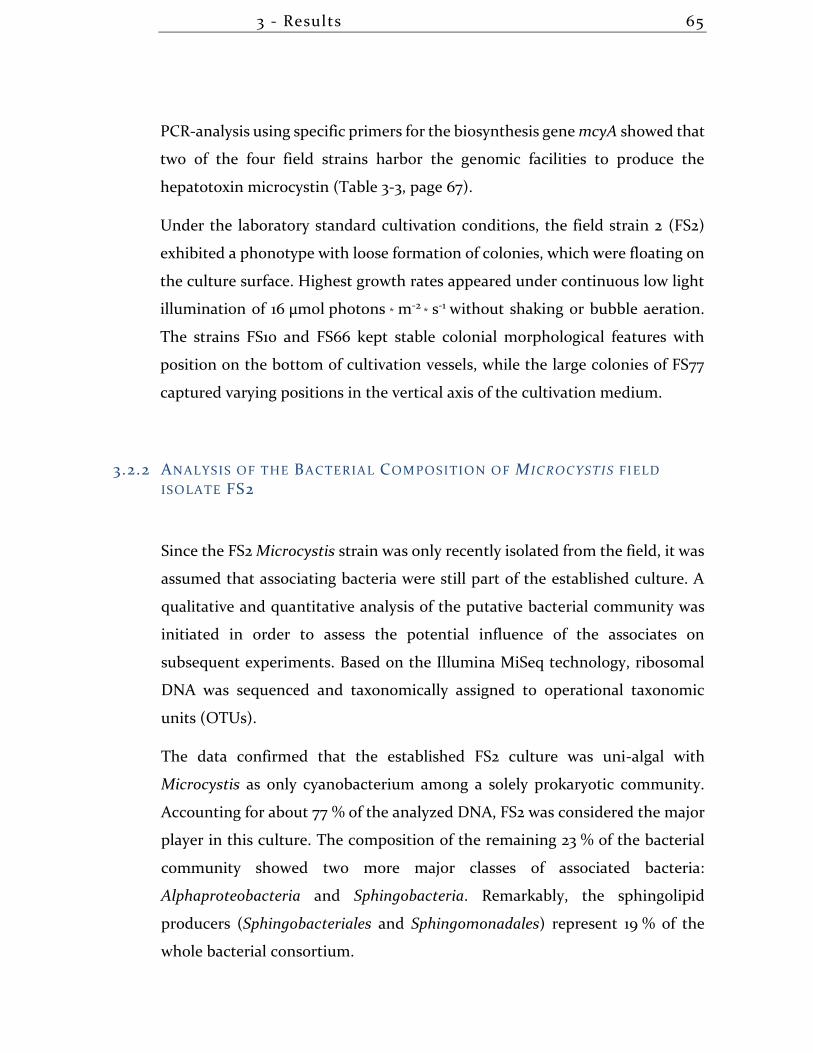
3 - Results 65
PCR-analysis using specific primers for the biosynthesis gene mcyA showed that
two of the four field strains harbor the genomic facilities to produce the
hepatotoxin microcystin (Table 3-3, page 67).
Under the laboratory standard cultivation conditions, the field strain 2 (FS2)
exhibited a phonotype with loose formation of colonies, which were floating on
the culture surface. Highest growth rates appeared under continuous low light
illumination of 16 µmol photons * m-2 * s-1
without shaking or bubble aeration.
The strains FS10 and FS66 kept stable colonial morphological features with
position on the bottom of cultivation vessels, while the large colonies of FS77
captured varying positions in the vertical axis of the cultivation medium.
3.2.2 ANALYSIS OF THE BACTERIAL COMPOSITION OF MICROCYSTIS FIELD
ISOLATE FS2
Since the FS2 Microcystis strain was only recently isolated from the field, it was
assumed that associating bacteria were still part of the established culture. A
qualitative and quantitative analysis of the putative bacterial community was
initiated in order to assess the potential influence of the associates on
subsequent experiments. Based on the Illumina MiSeq technology, ribosomal
DNA was sequenced and taxonomically assigned to operational taxonomic
units (OTUs).
The data confirmed that the established FS2 culture was uni-algal with
Microcystis as only cyanobacterium among a solely prokaryotic community.
Accounting for about 77 % of the analyzed DNA, FS2 was considered the major
player in this culture. The composition of the remaining 23 % of the bacterial
community showed two more major classes of associated bacteria:
Alphaproteobacteria and Sphingobacteria. Remarkably, the sphingolipid
producers (Sphingobacteriales and Sphingomonadales) represent 19 % of the
whole bacterial consortium.
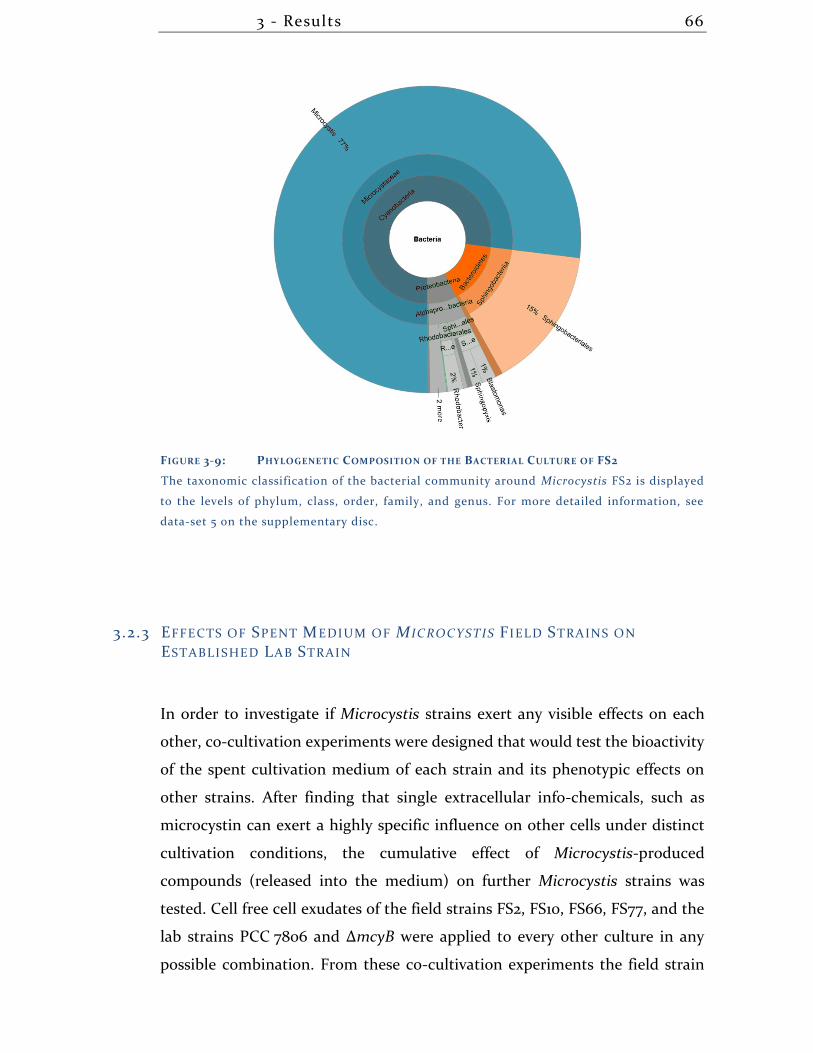
3 - Results 66
FIGURE 3-9: PHYLOGENETIC COMPOSITION OF THE BACTERIAL CULTURE OF FS2
The taxonomic classification of the bacterial community around Microcystis FS2 is displayed
to the levels of phylum, class, order, family, and genus. For more detailed information, see
data-set 5 on the supplementary disc.
3.2.3 EFFECTS OF SPENT MEDIUM OF MICROCYST IS F IELD STRAINS ON
ESTABLISHED LAB STRAIN
In order to investigate if Microcystis strains exert any visible effects on each
other, co-cultivation experiments were designed that would test the bioactivity
of the spent cultivation medium of each strain and its phenotypic effects on
other strains. After finding that single extracellular info-chemicals, such as
microcystin can exert a highly specific influence on other cells under distinct
cultivation conditions, the cumulative effect of Microcystis-produced
compounds (released into the medium) on further Microcystis strains was
tested. Cell free cell exudates of the field strains FS2, FS10, FS66, FS77, and the
lab strains PCC 7806 and ∆mcyB were applied to every other culture in any
possible combination. From these co-cultivation experiments the field strain
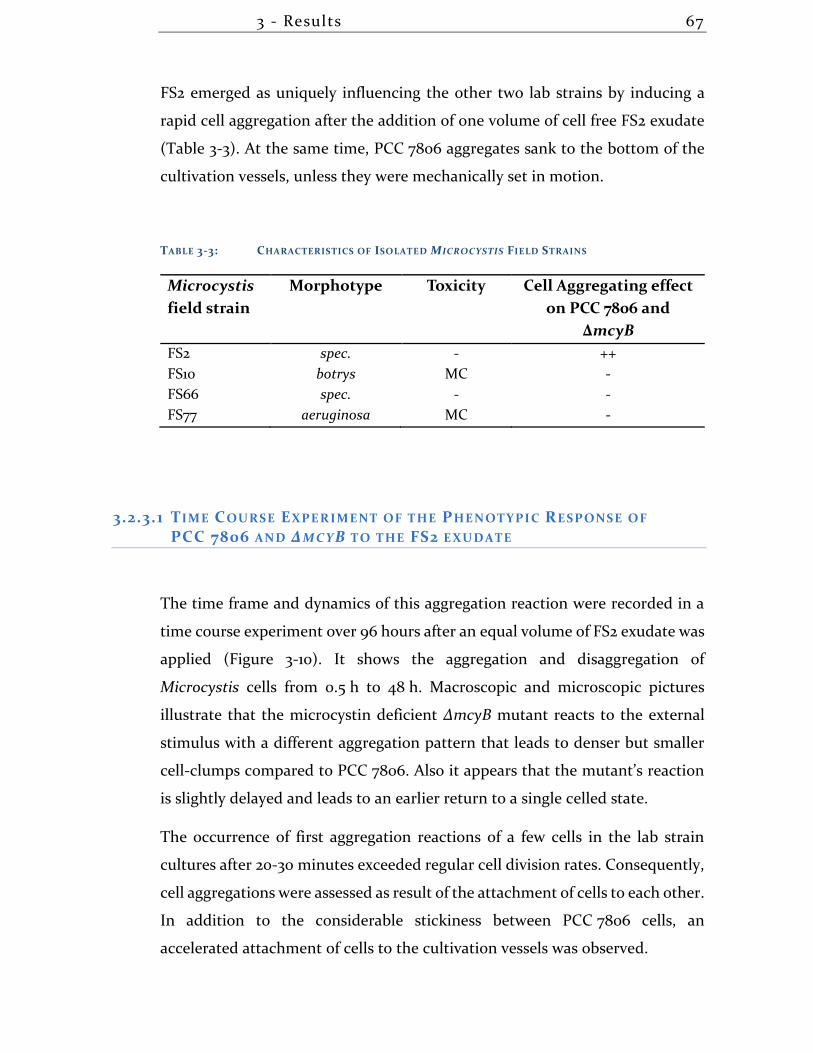
3 - Results 67
FS2 emerged as uniquely influencing the other two lab strains by inducing a
rapid cell aggregation after the addition of one volume of cell free FS2 exudate
(Table 3-3). At the same time, PCC 7806 aggregates sank to the bottom of the
cultivation vessels, unless they were mechanically set in motion.
TABLE 3-3: CHARACTERISTICS OF ISOLATED MICROCYSTIS FIELD STRAINS
Microcystis
field strain
Morphotype Toxicity Cell Aggregating effect
on PCC 7806 and
∆mcyB
FS2 spec. - ++
FS10 botrys MC -
FS66 spec. - -
FS77 aeruginosa MC -
3.2.3.1 TIME COURSE EXPERIMENT OF THE PHENOTYPIC RESPONSE OF
PCC 7806 AND ∆M CYB TO THE FS2 EXUDATE
The time frame and dynamics of this aggregation reaction were recorded in a
time course experiment over 96 hours after an equal volume of FS2 exudate was
applied (Figure 3-10). It shows the aggregation and disaggregation of
Microcystis cells from 0.5 h to 48 h. Macroscopic and microscopic pictures
illustrate that the microcystin deficient ∆mcyB mutant reacts to the external
stimulus with a different aggregation pattern that leads to denser but smaller
cell-clumps compared to PCC 7806. Also it appears that the mutant’s reaction
is slightly delayed and leads to an earlier return to a single celled state.
The occurrence of first aggregation reactions of a few cells in the lab strain
cultures after 20-30 minutes exceeded regular cell division rates. Consequently,
cell aggregations were assessed as result of the attachment of cells to each other.
In addition to the considerable stickiness between PCC 7806 cells, an
accelerated attachment of cells to the cultivation vessels was observed.
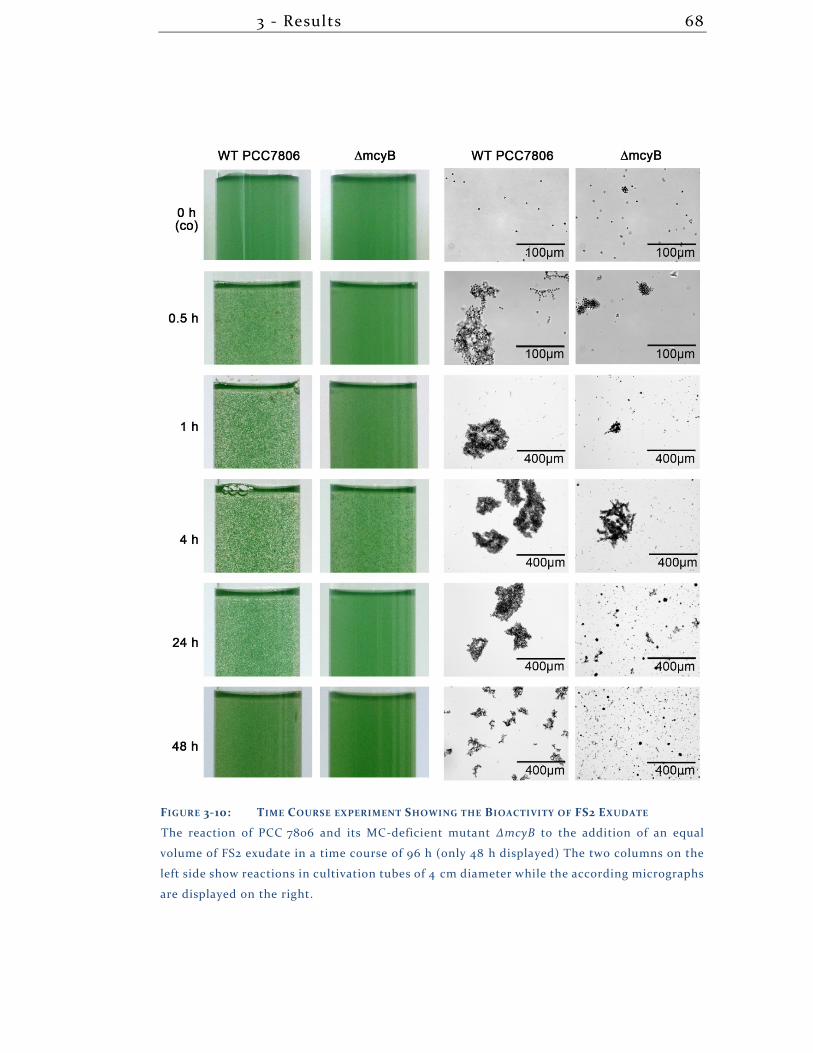
3 - Results 68
FIGURE 3-10: TIME COURSE EXPERIMENT SHOWING THE BIOACTIVITY OF FS2 EXUDATE
The reaction of PCC 7806 and its MC-deficient mutant ∆mcyB to the addition of an equal
volume of FS2 exudate in a time course of 96 h (only 48 h displayed) The two columns on the
left side show reactions in cultivation tubes of 4 cm diameter while the according micrographs
are displayed on the right.
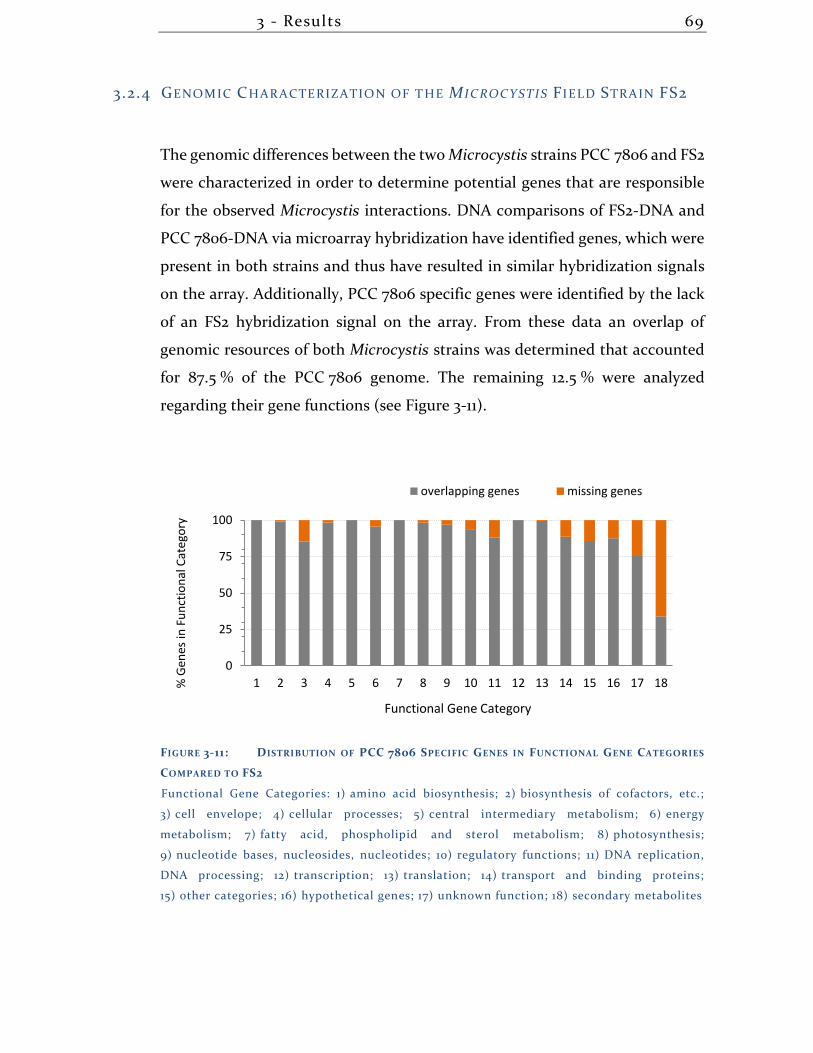
3 - Results 69
3.2.4 GENOMIC CHARACTERIZATION OF T HE MICROCYSTIS F IELD STRAIN FS2
The genomic differences between the two Microcystis strains PCC 7806 and FS2
were characterized in order to determine potential genes that are responsible
for the observed Microcystis interactions. DNA comparisons of FS2-DNA and
PCC 7806-DNA via microarray hybridization have identified genes, which were
present in both strains and thus have resulted in similar hybridization signals
on the array. Additionally, PCC 7806 specific genes were identified by the lack
of an FS2 hybridization signal on the array. From these data an overlap of
genomic resources of both Microcystis strains was determined that accounted
for 87.5 % of the PCC 7806 genome. The remaining 12.5 % were analyzed
regarding their gene functions (see Figure 3-11).
FIGURE 3-11: DISTRIBUTION OF PCC 7806 SPECIFIC GENES IN FUNCTIONAL GENE CATEGORIES
COMPARED TO FS2
Functional Gene Categories: 1) amino acid biosynthesis; 2) biosynthesis of cofactors, etc.;
3) cell envelope; 4) cellular processes; 5) central intermediary metabolism; 6) energy
metabolism; 7) fatty acid, phospholipid and sterol metabolism; 8) photosynthesis;
9) nucleotide bases, nucleosides, nucleotides; 10) regulatory functions; 11) DNA replication,
DNA processing; 12) transcription; 13) translation; 14) transport and binding proteins;
15) other categories; 16) hypothetical genes; 17) unknown function; 18) secondary metabolites
0
25
50
75
100
1 2 3 4 5 6 7 8 9 10 11 12 13 14 15 16 17 18% G
enes
in F
un
ctio
nal
Cat
ego
ry
Functional Gene Category
overlapping genes missing genes
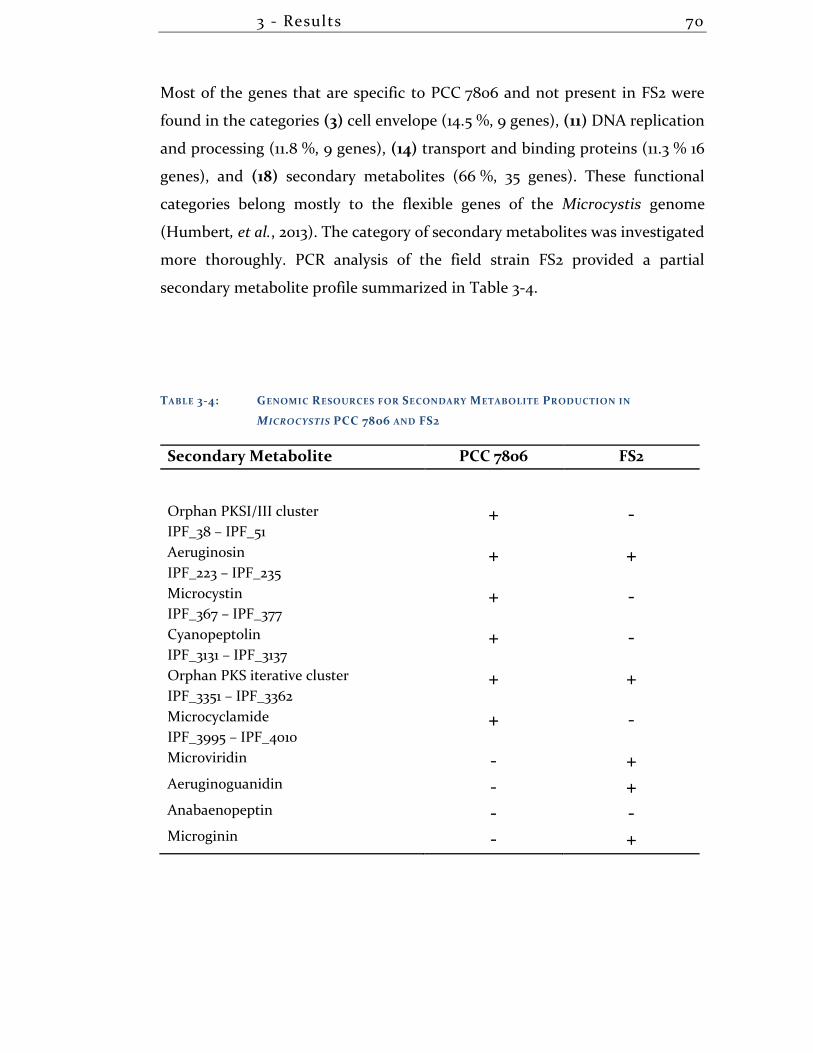
3 - Results 70
Most of the genes that are specific to PCC 7806 and not present in FS2 were
found in the categories (3) cell envelope (14.5 %, 9 genes), (11) DNA replication
and processing (11.8 %, 9 genes), (14) transport and binding proteins (11.3 % 16
genes), and (18) secondary metabolites (66 %, 35 genes). These functional
categories belong mostly to the flexible genes of the Microcystis genome
(Humbert, et al., 2013). The category of secondary metabolites was investigated
more thoroughly. PCR analysis of the field strain FS2 provided a partial
secondary metabolite profile summarized in Table 3-4.
TABLE 3-4: GENOMIC RESOURCES FOR SECONDARY METABOLITE PRODUCTION IN
MICROCYSTIS PCC 7806 AND FS2
Secondary Metabolite PCC 7806 FS2
Orphan PKSI/III cluster
IPF_38 – IPF_51 + -
Aeruginosin
IPF_223 – IPF_235 + +
Microcystin
IPF_367 – IPF_377 + -
Cyanopeptolin
IPF_3131 – IPF_3137 + -
Orphan PKS iterative cluster
IPF_3351 – IPF_3362 + +
Microcyclamide
IPF_3995 – IPF_4010 + -
Microviridin - + Aeruginoguanidin - + Anabaenopeptin - - Microginin - +
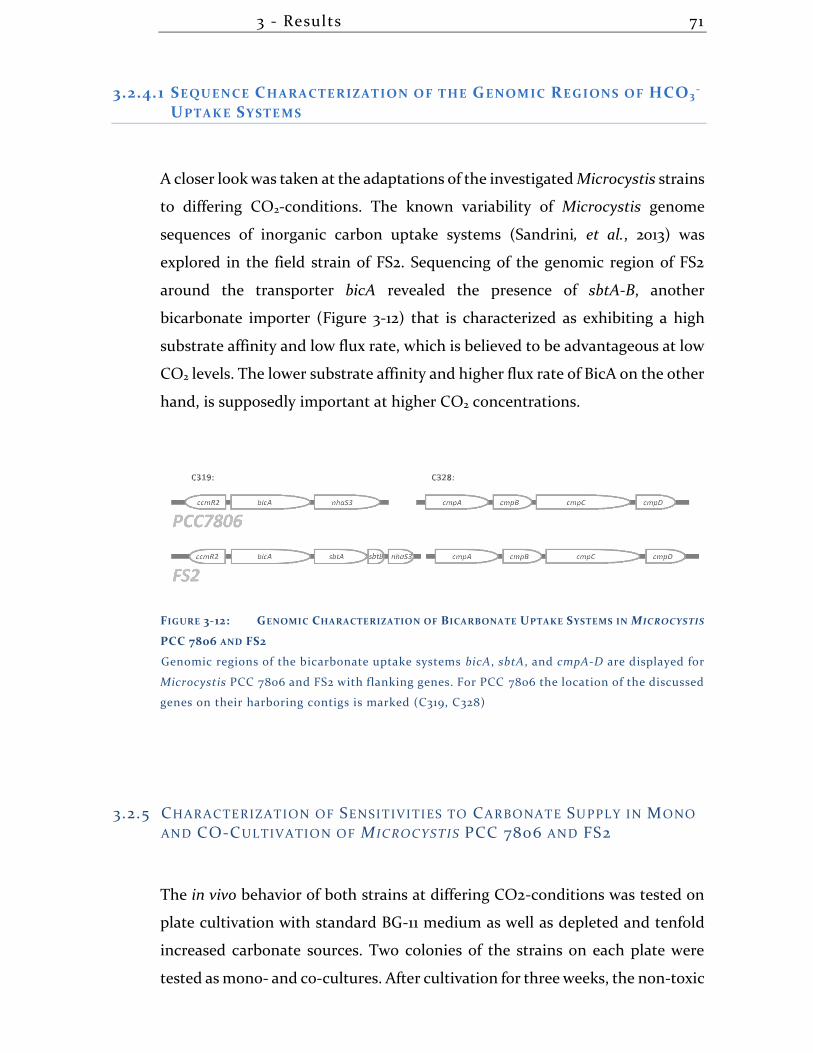
3 - Results 71
3.2.4.1 SEQUENCE CHARACTERIZATION OF T HE GENOMIC REGIONS OF HCO3-
UPTAKE SYSTEMS
A closer look was taken at the adaptations of the investigated Microcystis strains
to differing CO2-conditions. The known variability of Microcystis genome
sequences of inorganic carbon uptake systems (Sandrini, et al., 2013) was
explored in the field strain of FS2. Sequencing of the genomic region of FS2
around the transporter bicA revealed the presence of sbtA-B, another
bicarbonate importer (Figure 3-12) that is characterized as exhibiting a high
substrate affinity and low flux rate, which is believed to be advantageous at low
CO2 levels. The lower substrate affinity and higher flux rate of BicA on the other
hand, is supposedly important at higher CO2 concentrations.
FIGURE 3-12: GENOMIC CHARACTERIZATION OF BICARBONATE UPTAKE SYSTEMS IN MICROCYSTIS
PCC 7806 AND FS2
Genomic regions of the bicarbonate uptake systems bicA, sbtA, and cmpA-D are displayed for
Microcystis PCC 7806 and FS2 with flanking genes. For PCC 7806 the location of the discussed
genes on their harboring contigs is marked (C319, C328)
3.2.5 CHARACTERIZATION OF SENSITIVITIES TO CARBONATE SUPPLY IN MONO
AND CO-CULTIVATION OF MICROCYSTIS PCC 7806 AND FS2
The in vivo behavior of both strains at differing CO2-conditions was tested on
plate cultivation with standard BG-11 medium as well as depleted and tenfold
increased carbonate sources. Two colonies of the strains on each plate were
tested as mono- and co-cultures. After cultivation for three weeks, the non-toxic
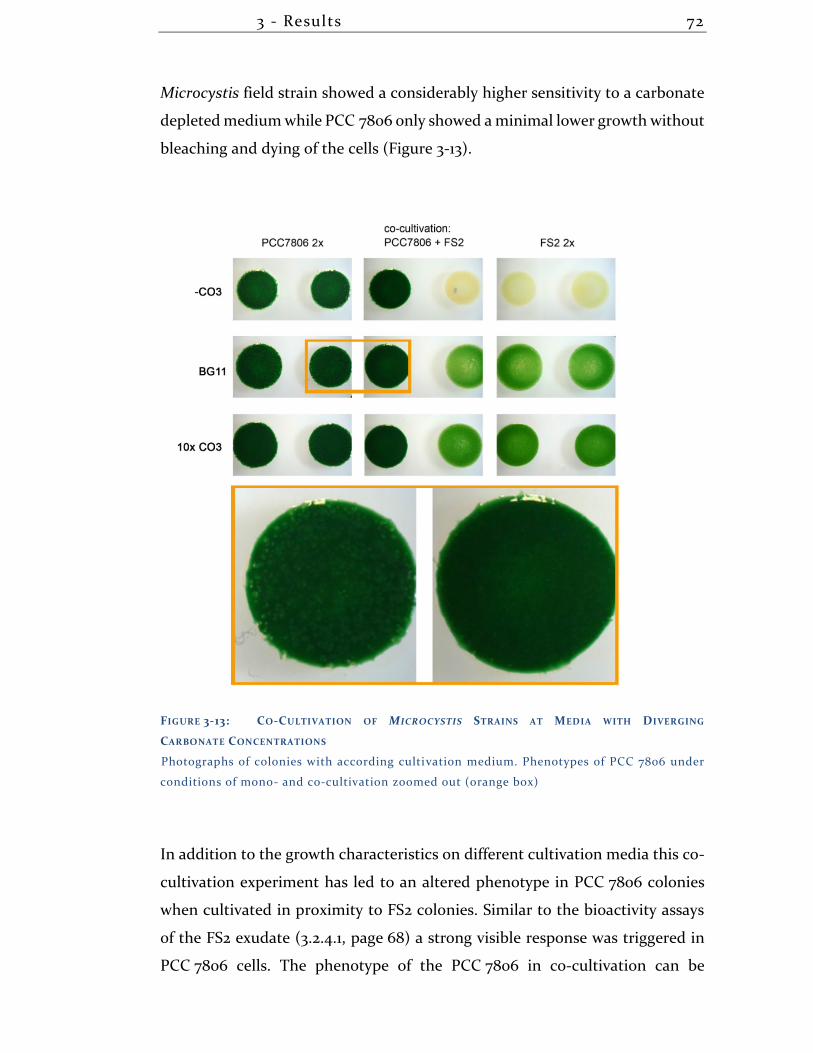
3 - Results 72
Microcystis field strain showed a considerably higher sensitivity to a carbonate
depleted medium while PCC 7806 only showed a minimal lower growth without
bleaching and dying of the cells (Figure 3-13).
FIGURE 3-13: CO-CULTIVATION OF MICROCYSTIS STRAINS AT MEDIA WITH DIVERGING
CARBONATE CONCENTRATIONS
Photographs of colonies with according cultivation medium. Phenotypes of PCC 7806 under
conditions of mono- and co-cultivation zoomed out (orange box)
In addition to the growth characteristics on different cultivation media this co-
cultivation experiment has led to an altered phenotype in PCC 7806 colonies
when cultivated in proximity to FS2 colonies. Similar to the bioactivity assays
of the FS2 exudate (3.2.4.1, page 68) a strong visible response was triggered in
PCC 7806 cells. The phenotype of the PCC 7806 in co-cultivation can be
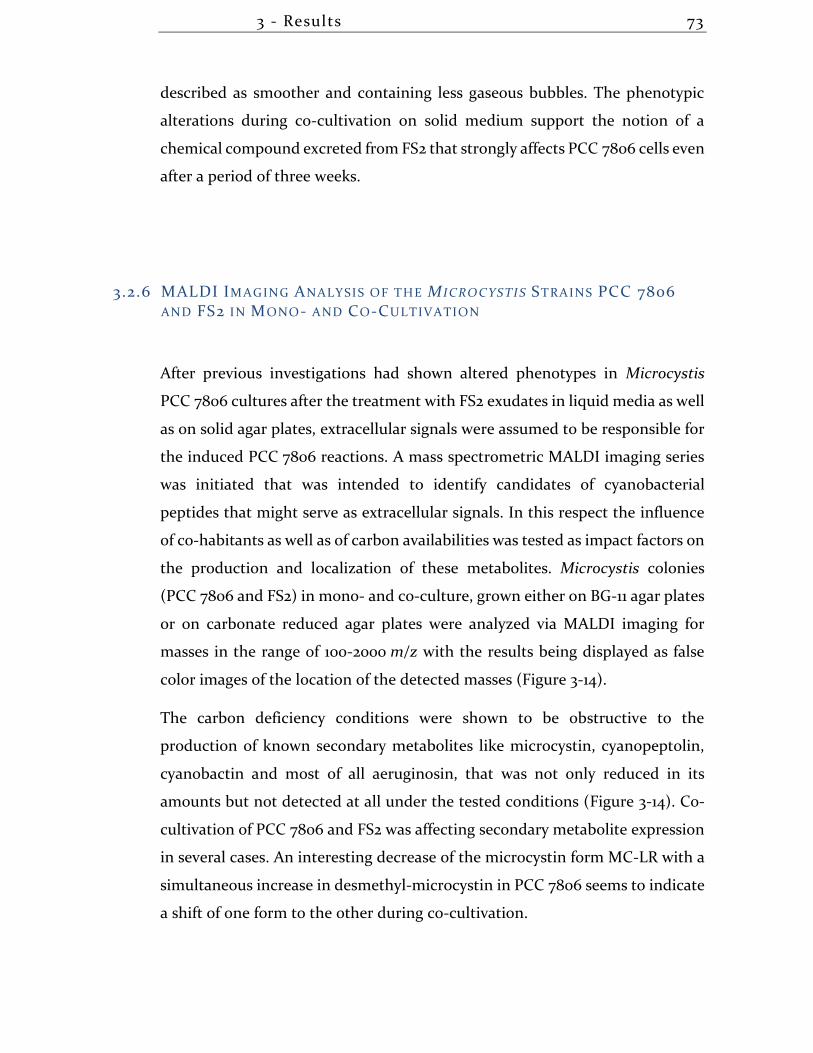
3 - Results 73
described as smoother and containing less gaseous bubbles. The phenotypic
alterations during co-cultivation on solid medium support the notion of a
chemical compound excreted from FS2 that strongly affects PCC 7806 cells even
after a period of three weeks.
3.2.6 MALDI IMAGING ANALYSIS OF THE MICRO CYSTIS STRAINS PCC 7806
AND FS2 IN MONO- AND CO-CULTIVATION
After previous investigations had shown altered phenotypes in Microcystis
PCC 7806 cultures after the treatment with FS2 exudates in liquid media as well
as on solid agar plates, extracellular signals were assumed to be responsible for
the induced PCC 7806 reactions. A mass spectrometric MALDI imaging series
was initiated that was intended to identify candidates of cyanobacterial
peptides that might serve as extracellular signals. In this respect the influence
of co-habitants as well as of carbon availabilities was tested as impact factors on
the production and localization of these metabolites. Microcystis colonies
(PCC 7806 and FS2) in mono- and co-culture, grown either on BG-11 agar plates
or on carbonate reduced agar plates were analyzed via MALDI imaging for
masses in the range of 100-2000 m/z with the results being displayed as false
color images of the location of the detected masses (Figure 3-14).
The carbon deficiency conditions were shown to be obstructive to the
production of known secondary metabolites like microcystin, cyanopeptolin,
cyanobactin and most of all aeruginosin, that was not only reduced in its
amounts but not detected at all under the tested conditions (Figure 3-14). Co-
cultivation of PCC 7806 and FS2 was affecting secondary metabolite expression
in several cases. An interesting decrease of the microcystin form MC-LR with a
simultaneous increase in desmethyl-microcystin in PCC 7806 seems to indicate
a shift of one form to the other during co-cultivation.
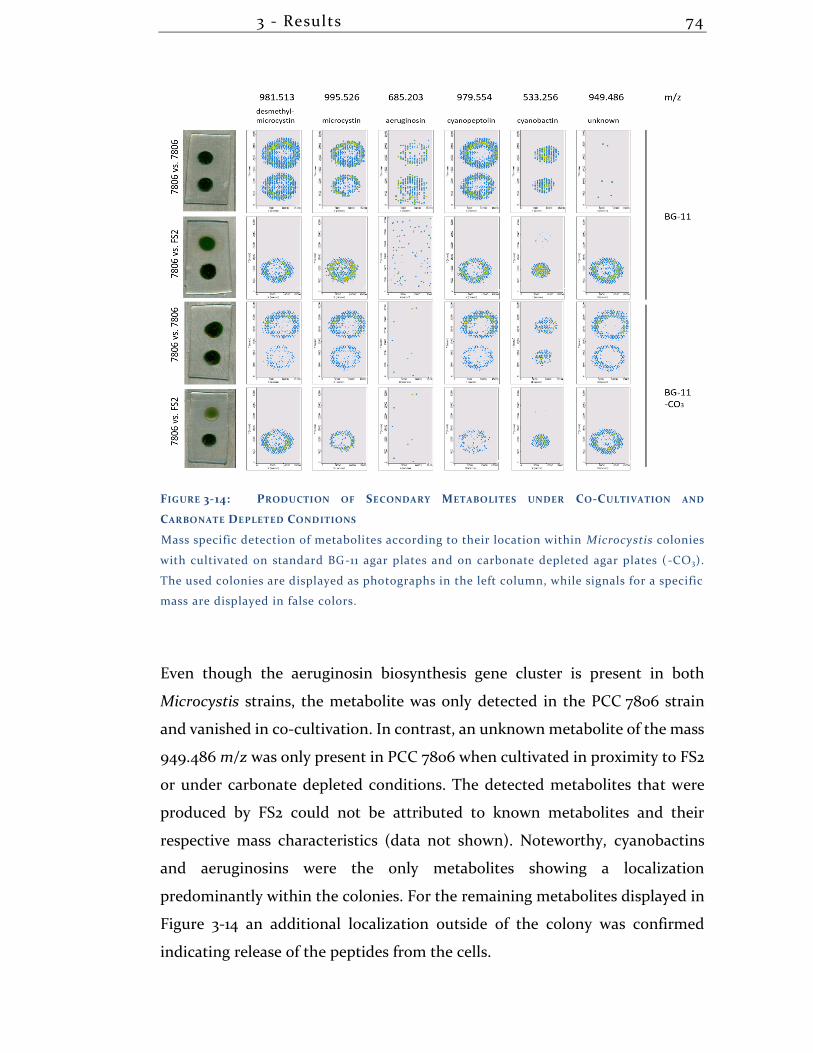
3 - Results 74
FIGURE 3-14: PRODUCTION OF SECONDARY METABOLITES UNDER CO-CULTIVATION AND
CARBONATE DEPLETED CONDITIONS
Mass specific detection of metabolites according to their location within Microcystis colonies
with cultivated on standard BG-11 agar plates and on carbonate depleted agar plates ( -CO3).
The used colonies are displayed as photographs in the left column, while signals for a specific
mass are displayed in false colors.
Even though the aeruginosin biosynthesis gene cluster is present in both
Microcystis strains, the metabolite was only detected in the PCC 7806 strain
and vanished in co-cultivation. In contrast, an unknown metabolite of the mass
949.486 m/z was only present in PCC 7806 when cultivated in proximity to FS2
or under carbonate depleted conditions. The detected metabolites that were
produced by FS2 could not be attributed to known metabolites and their
respective mass characteristics (data not shown). Noteworthy, cyanobactins
and aeruginosins were the only metabolites showing a localization
predominantly within the colonies. For the remaining metabolites displayed in
Figure 3-14 an additional localization outside of the colony was confirmed
indicating release of the peptides from the cells.
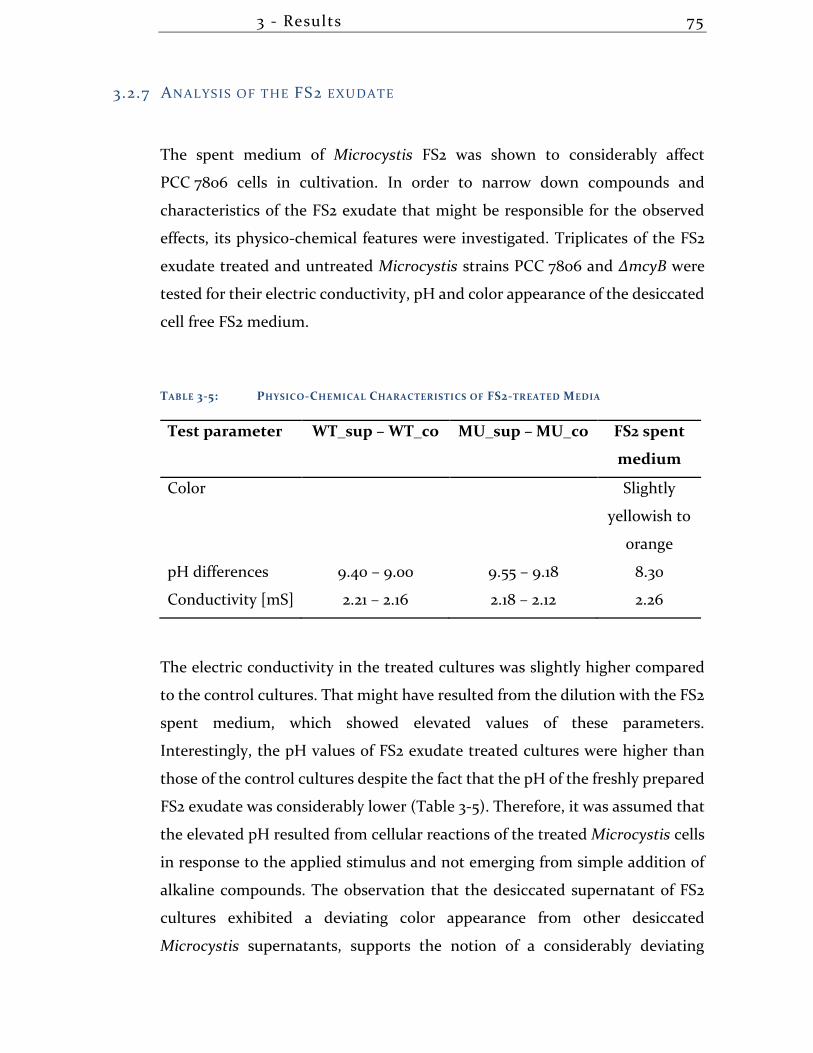
3 - Results 75
3.2.7 ANALYSIS OF THE FS2 EXUDATE
The spent medium of Microcystis FS2 was shown to considerably affect
PCC 7806 cells in cultivation. In order to narrow down compounds and
characteristics of the FS2 exudate that might be responsible for the observed
effects, its physico-chemical features were investigated. Triplicates of the FS2
exudate treated and untreated Microcystis strains PCC 7806 and ∆mcyB were
tested for their electric conductivity, pH and color appearance of the desiccated
cell free FS2 medium.
TABLE 3-5: PHYSICO-CHEMICAL CHARACTERISTICS OF FS2-TREATED MEDIA
Test parameter WT_sup – WT_co MU_sup – MU_co FS2 spent
medium
Color Slightly
yellowish to
orange
pH differences 9.40 – 9.00 9.55 – 9.18 8.30
Conductivity [mS] 2.21 – 2.16 2.18 – 2.12 2.26
The electric conductivity in the treated cultures was slightly higher compared
to the control cultures. That might have resulted from the dilution with the FS2
spent medium, which showed elevated values of these parameters.
Interestingly, the pH values of FS2 exudate treated cultures were higher than
those of the control cultures despite the fact that the pH of the freshly prepared
FS2 exudate was considerably lower (Table 3-5). Therefore, it was assumed that
the elevated pH resulted from cellular reactions of the treated Microcystis cells
in response to the applied stimulus and not emerging from simple addition of
alkaline compounds. The observation that the desiccated supernatant of FS2
cultures exhibited a deviating color appearance from other desiccated
Microcystis supernatants, supports the notion of a considerably deviating
3 - Results 76
chemical composition of the cell exudates. The origin and identity of the color
giving compounds however, was not further investigated.
A solid phase extraction via silica-based C18 Sep-Pak cartridges was conducted
to separate hydrophobic from hydrophilic phases of the FS2 spent medium.
Both phases were then tested for their bioactivity and effects on cell
aggregation. Cell aggregating activity from the FS2 exudate was thereby
distinctly attributed to its hydrophilic components.
3.2.8 THE TRANSCRIPTIONAL RESPONSE OF PCC 7806 TO THE EXUDATE OF
FS2
In microarray experiments the transcriptional response of the Microcystis strain
PCC 7806 to the FS2 exudate was measured in order to evaluate which cellular
processes were involved in the specific Microcystis inter-strain interactions,
that caused the strong observed aggregation effects. Three replicates of
PCC 7806 cultures treated with FS2 exudate were compared to three replicates
of the BG-11 -treated control samples. A sampling time of one hour after
treatment was chosen for the transcriptomic analysis. Considering that the
induced aggregation effects started occurring after 30 minutes and were
strongly visible after one hour (Figure 3-10, page 68), it was assumed that
differences in RNA-contents would be well detectable after one hour.
3.2.8.1 QUALITY ASSESSMENT OF TRANSCR IPTOMIC MICROARRAY DATA
The data analysis included an initial validation of the microarray quality. A
comparison of the complete transcriptome datasets representing a) samples of
the single replicates and b) the respective treatment samples, was conducted
(Figure 3-15).
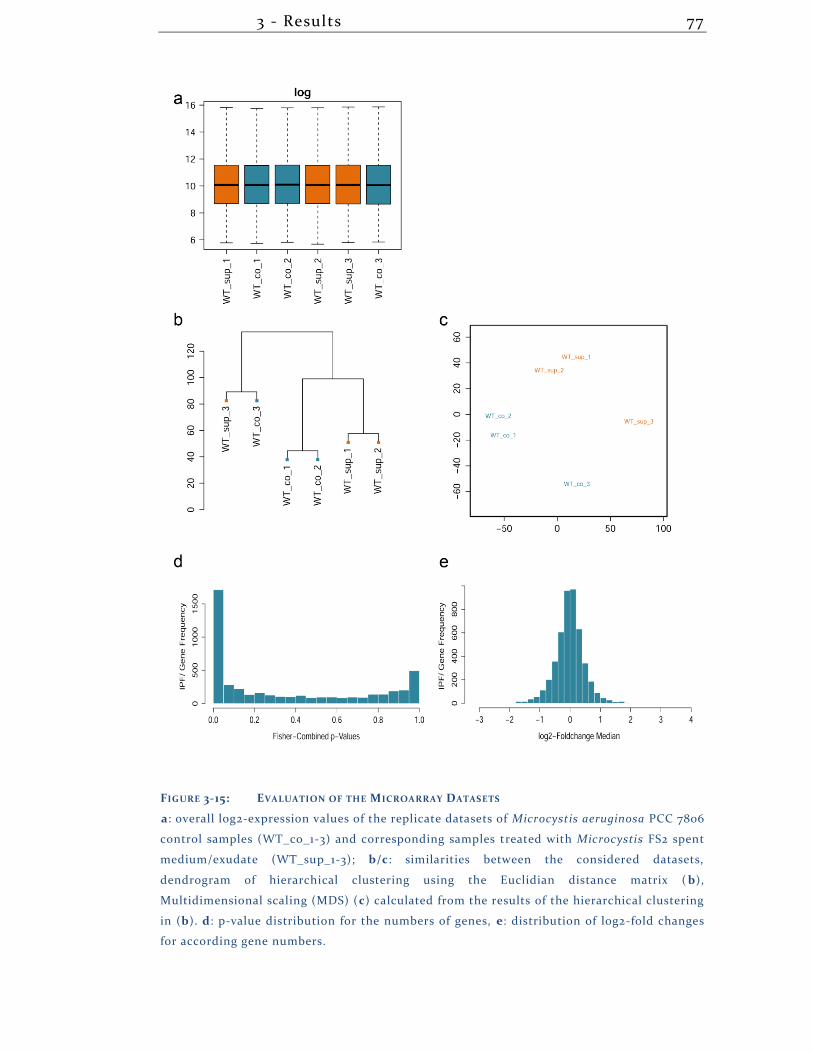
3 - Results 77
FIGURE 3-15: EVALUATION OF THE MICROARRAY DATASETS
a: overall log2-expression values of the replicate datasets of Microcystis aeruginosa PCC 7806
control samples (WT_co_1-3) and corresponding samples treated with Microcystis FS2 spent
medium/exudate (WT_sup_1-3); b/c: similarities between the considered datasets,
dendrogram of hierarchical clustering using the Euclidian distance matrix ( b),
Multidimensional scaling (MDS) (c) calculated from the results of the hierarchical clustering
in (b). d: p-value distribution for the numbers of genes, e: distribution of log2-fold changes
for according gene numbers.
3 - Results 78
The results show that the majority of log2-transformed transcription levels of
the treated and untreated replicates scatter around the same value in each
sample, indicating successful normalization and good comparability (Figure
3-15 a). Hierarchical clustering based on the Euclidian distance matrix was used
to display the overall similarity between datasets (Figure 3-15 b). These results
were further used for a multidimensional scaling analysis (MDS) (Figure 3-15 c).
Both plots visualize that expression in datasets of the replicates WT_co_3 and
WT_sup_3 vary from the other two pairs. The MDS plot however, indicates that
control datasets are similarly distant from the respective treatment datasets and
thus most likely result from similar physiological effects of the FS2-supernatant
on PCC 7806 gene expression. It can be assumed that the replicates designated
number 3 show a different overall expression pattern due to their measurement
on a different array slide which can have enormous impact on the acquired
datasets. Further statistical evaluation of the datasets confirmed robust
expression data. The determined log2-fold changes exhibited a Gaussian
distribution as expected with only minor deviations (Figure 3-15 e). The
majority of calculated p-values was found in the range between 0-0.1 confirming
a high likelihood for non-random expression results (Figure 3-15 d).
Considering these preliminary analyses, the threshold for differential gene
expression was set to a log2-fold change (lfc) of 1 ≤ lfc ≤-1 and p-values ≤ 0.1
which resulted in over two hundred differentially expressed genes in PCC 7806
after the addition of FS2-supernatant to the batch culture.
3.2.8.2 DIFFERENTIAL EXPRESSION ACCORDING TO FUNCTIONAL GENE
CATEGORIES
Of the 215 differentially expressed genes slightly more than 50 % were
downregulated (116) while 46 % (99 genes) were upregulated after the stimulus
of the FS2 exudate. The assignment of functional groups to every gene allowed
to determine functional hotspots of differential gene expression.
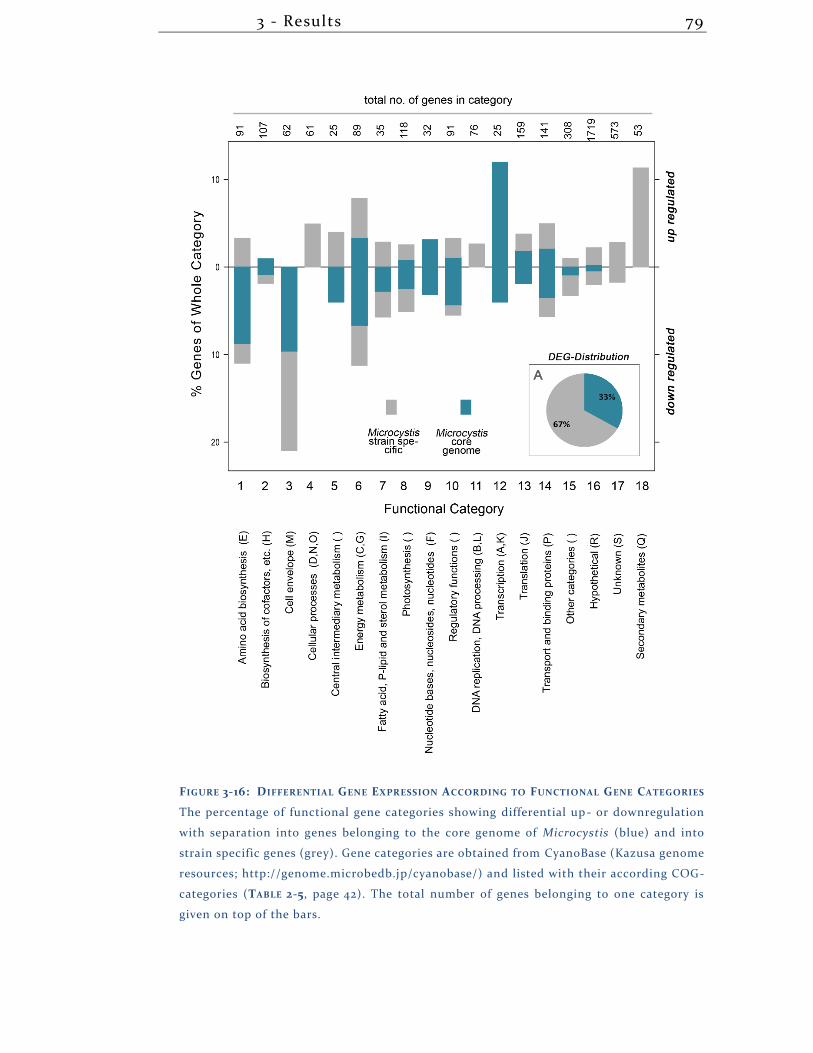
3 - Results 79
FIGURE 3-16: DIFFERENTIAL GENE EXPRESSION ACCORDING TO FUNCTIONAL GENE CATEGORIES
The percentage of functional gene categories showing differential up - or downregulation
with separation into genes belonging to the core genome of Microcystis (blue) and into
strain specific genes (grey). Gene categories are obtained from CyanoBase (Kazusa genome
resources; http://genome.microbedb.jp/cyanobase/) and listed with their according COG-
categories (TABLE 2-5, page 42). The total number of genes belonging to one category is
given on top of the bars.
3 - Results 80
Figure 3-16 shows the percentages of each assigned functional category that was
up- and down-regulated. The most affected categories comprised amino acid
biosynthesis, cell envelope related genes, energy metabolism, transcription,
transporter genes, and secondary metabolites. This general overview illustrates
that the addition of a Microcystis cell exudate can trigger comprehensive
transcriptional changes in PCC 7806 regarding the primary as well as the
secondary metabolism. Remarkably, the differentially expressed genes turned
out to belong to a great part of 67 % to a set of genes that is so far considered to
be strain specific to PCC 7806 and therefore are not part of the essential genes
of the core genome. Consequently, the reaction of PCC 7806 to the FS2 exudate
was considered highly specific and presumably is considerably different from
the response of other Microcystis strains to the same stimulus.
3.2.8.3 TRANSCRIPTIONAL CHANGES IN PCC 7806 CELLS AFTER FS2 EXUDATE
TREATMENT IN THE CELLULAR CONTEXT
The transcriptional changes of PCC 7806 cells are displayed in regard to the
involvement into metabolic processes and the cellular context (Figure 3-17,
page 81). Differentially expressed genes belonging to the functional gene
categories of transporters, regulators, energy metabolism, amino acid
biosynthesis and cell envelope structures as well as secondary metabolites will
be described in detail below.
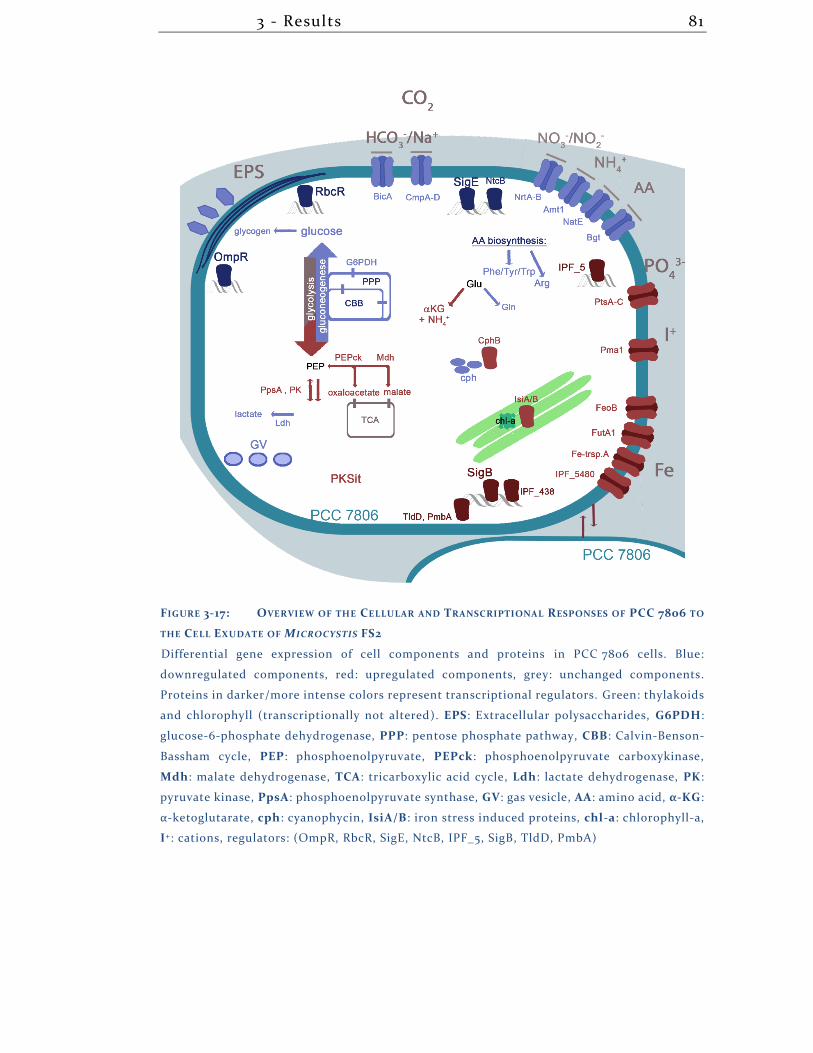
3 - Results 81
FIGURE 3-17: OVERVIEW OF THE CELLULAR AND TRANSCRIPTIONAL RESPONSES OF PCC 7806 TO
THE CELL EXUDATE OF MICROCYSTIS FS2
Differential gene expression of cell components and proteins in PCC 7806 cells. Blue:
downregulated components, red: upregulated components, grey: unchanged components.
Proteins in darker/more intense colors represent transcriptional regulators. Green: thylakoids
and chlorophyll (transcriptionally not altered). EPS: Extracellular polysaccharides, G6PDH:
glucose-6-phosphate dehydrogenase, PPP: pentose phosphate pathway, CBB: Calvin-Benson-
Bassham cycle, PEP: phosphoenolpyruvate, PEPck: phosphoenolpyruvate carboxykinase,
Mdh: malate dehydrogenase, TCA: tricarboxylic acid cycle, Ldh: lactate dehydrogenase, PK:
pyruvate kinase, PpsA: phosphoenolpyruvate synthase, GV: gas vesicle, AA: amino acid, α-KG:
α-ketoglutarate, cph: cyanophycin, IsiA/B: iron stress induced proteins, chl-a: chlorophyll-a,
I+: cations, regulators: (OmpR, RbcR, SigE, NtcB, IPF_5, SigB, TldD, PmbA)
3 - Results 82
3.2.8.4 NUTRIENT HOMEOSTASIS AND STRESS INDICATORS
The transcriptional data suggested that a striking, immediate change was
triggered concerning the nutrient flows across the cytoplasmic membrane of
the PCC 7806 cell. Several nitrogen uptake systems comprising transporters for
nitrate, nitrite, ammonium as well as for several amino acids (nrtA/B, amt1,
natE, bgt) were significantly downregulated after the FS2 exudate stimulus,
while phosphate transporters were less effected with only one transporter being
slightly upregulated.
3.2.8.4.1 IRON STRESS INDICATORS
In contrast, a group of genes involved in iron homeostasis was strongly
upregulated, suggesting some form of iron depletion signal. Four iron
transporters (feoB, futA1, IPF_14, IPF_54880) were upregulated in the range of a
fold change between 2.6 – 3.0 being in good accordance with the high
upregulation of the two iron stress indicators isiA and isiB (iron stress induced
chlorophyll binding protein A and flavodoxin). Following this strong lead of
putative iron limitation induced after the addition of FS2 exudate to PCC 7806
cultures, the confirmation of iron stress was sought on the physiological level,
as well. Spectral analysis of PCC 7806 cells were supposed to show on the
protein level if the IsiA-binding to chlorophyll induced the typical shift of the
chlorophyll absorption maximum to a lower wavelength (Andrizhiyevskaya, et
al., 2002).
During the time course experiment displayed in Figure 3-10 (page 68) samples
were taken to analyze the absorption changes of the PCC 7806 cultures after
FS2 exudate treatment. In Figure 3-18 the recorded spectra after 3 h and after
96 h after the treatment are shown for PCC 7806 and ∆mcyB cultures.
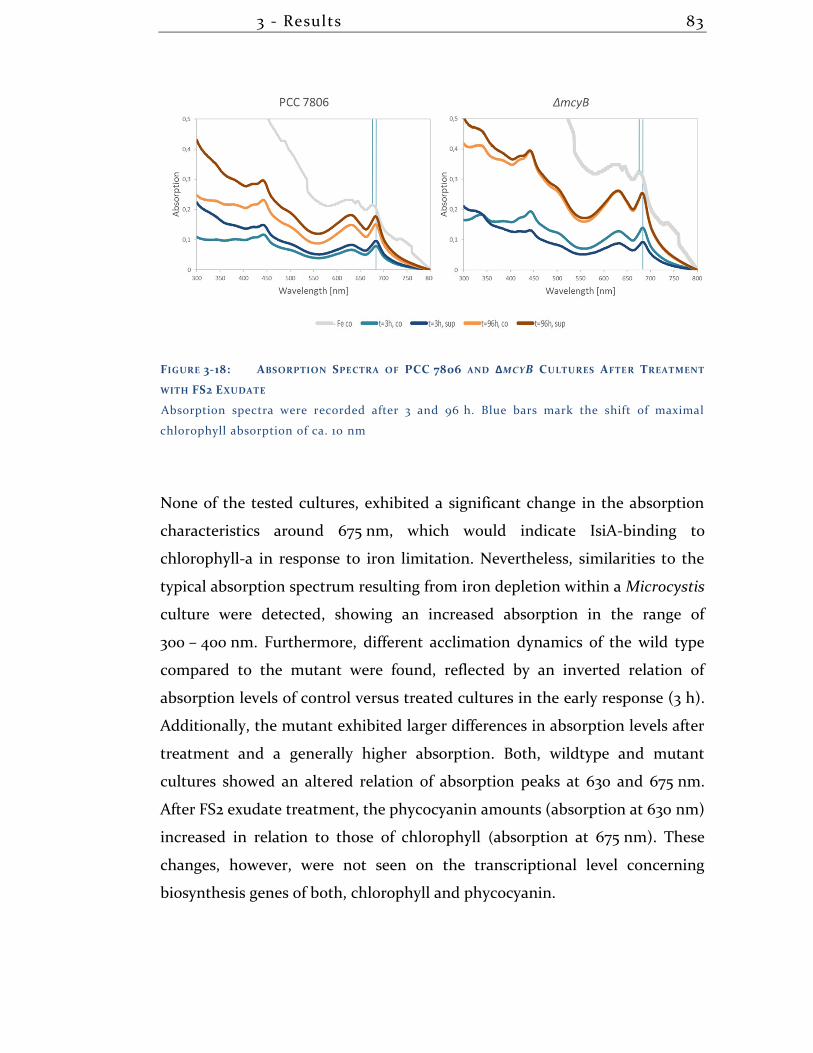
3 - Results 83
FIGURE 3-18: ABSORPTION SPECTRA OF PCC 7806 AND ∆MCYB CULTURES AFTER TREATMENT
WITH FS2 EXUDATE
Absorption spectra were recorded after 3 and 96 h. Blue bars mark the shift of maximal
chlorophyll absorption of ca. 10 nm
None of the tested cultures, exhibited a significant change in the absorption
characteristics around 675 nm, which would indicate IsiA-binding to
chlorophyll-a in response to iron limitation. Nevertheless, similarities to the
typical absorption spectrum resulting from iron depletion within a Microcystis
culture were detected, showing an increased absorption in the range of
300 – 400 nm. Furthermore, different acclimation dynamics of the wild type
compared to the mutant were found, reflected by an inverted relation of
absorption levels of control versus treated cultures in the early response (3 h).
Additionally, the mutant exhibited larger differences in absorption levels after
treatment and a generally higher absorption. Both, wildtype and mutant
cultures showed an altered relation of absorption peaks at 630 and 675 nm.
After FS2 exudate treatment, the phycocyanin amounts (absorption at 630 nm)
increased in relation to those of chlorophyll (absorption at 675 nm). These
changes, however, were not seen on the transcriptional level concerning
biosynthesis genes of both, chlorophyll and phycocyanin.
3 - Results 84
After a potential iron stress had not shown on the protein level after FS2 exudate
application, alternative causes for the transcriptional activation of iron stress
related genes were tested. A decreased extracellular iron availability through
the hypothetical Fe-scavenging by siderophores in the FS2 exudate and their
iron complexing features were tested via the CAS-assay (Schwyn, et al., 1987)
for liquid media. The assay was performed for the spent medium of FS2 and
compared to those of PCC 7806, ∆mcyB and FS66. Since the CAS assay is pH-
sensitive, cell exudates were tested with an adapted pH of 5.6 and with the
original pH in the range of 9.25-9.6. Neither of the tested exudates revealed
significant differences in the iron complexing characteristics. A siderophore
presence in the exudate of FS2 cultures of significant concentrations was hence
dismissed.
3.2.8.4.2 B ICARBONATE IMPORT
Returning to the differential gene expression of transporter genes after the
application of FS2 exudates to PCC 7806 cultures, two genes regarding
inorganic carbon uptake showed most pronounced expression changes. The
bicarbonate/sodium antiporter bicA and the associated sodium/proton
antiporter nhaS3 were downregulated to each 20 % and 10 % of the expression
levels of control samples. Another bicarbonate uptake system cmpA-D was
downregulated as well but to a lesser extent than bicA.
3.2.8.5 STRESS INDICATORS AND REGULATORY PROTEINS
Considering that inorganic carbon uptake is essential to phototrophic life, the
putative decrease of it was assumed to be implicated in cellular stress reactions.
Stress indicators (isiA, isiB) were already found transcriptionally upregulated
when investigating iron homeostasis. In addition to that, the observed
aggregation of Microcystis cells can be found under various stress conditions
3 - Results 85
(Kehr, et al., 2015; Wang, et al., 2010). Differentially expressed genes were thus
screened for further stress indicators and transcriptional regulators that might
provide hints to the cellular processes induced by the FS2 exudate.
TABLE 3-6: TRANSCRIPTIONAL CHANGES OF STRESS MARKERS AND TRANSCRIPTIONAL
REGULATORS
Gene PCC 6803
homologue
LFC Regulatory role (reference)
hspA (2x) sll1514 +1,09
+1,74
general stress
ompR slr0081 -1,13 acid stress (Tanaka, et al.)/ phosphate
sensing
SigB sll0306 +2,49 high salt stress (Allen, et al., 2008)/
high temperature (Tuominen, et al.,
2006)/ redox potential related
(Imamura, et al., 2003)
IPF_438 sll0474 +1,11 osmotic stress (Milkowski, et al., 1998)
pmbA
tldD
sll0887
slr1322
+1,14
+1,12
(metalloprotease regulating toxin-
antidote systems/proliferation in E. coli)
(Afif, et al., 2001; Allali, et al., 2002)
fabG sll0330 +1,28 Osmotic/ cold stress (Mikami, et al., 2002)
ompR sll1330 -1,55 Sugar catabolism (Tabei, et al., 2007)
cphB slr2001 +1,18 Supply with carbon-/nitrogen sources
SigE sll1689 +0,76 Sugar catabolism (Osanai, et al., 2011)/
nitrogen depletion
SigE/G slr1545 -1,42 NA
rbcR sll1594 -1,20 CCM activator (reviewed by (Burnap, et
al., 2015))
IPF_5 sll0594 +1,86 Phosphate depletion (Kopf, et al., 2015)
IPF_1434 slr0701 -1,35 NA
IPF_3831 sll0690 +1,04 Butanol resistance (Zhu, et al.)
3 - Results 86
Typical stress indicators like hspA and fabG are slightly upregulated while other
stress markers do not exceed the threshold, set for differential gene expression
(Table 3-6). Further leads to identifying stress conditions are found among the
transcriptional regulators, which are up or down regulated. Differentially
expressed regulators (Table 3-6) were classified into two topics. While most of
the regulators were implicated in responses to extracellular stimuli, like osmotic
stress, acid stress or butanol resistance, another group of regulators was related
to carbon availability, being in close correlation to the detected downregulation
of bicarbonate transporters. It should be noted, that the strongest upregulation
is seen for the alternative sigma factor SigB, which has been related to multiple
environmental conditions (see Table 3-6).
The transcriptional response to the FS2 exudate showed only limited stress
reactions and it was tested if the cultures themselves were impeded or on the
contrary supported in cell division and growth. Growth rates of PCC 7806 and
∆mcyB cultures treated with FS2 exudate and BG-11 aliquots in control cultures
were determined in a period of two weeks. The results showed only marginal
growth differences, which were not significant (Table 3-7) indicating that the
strong transcriptional response of PCC 7806 cells to the FS2 exudate did not
coincide with a stress induced growth impediment.
TABLE 3-7: GROWTH RATES OF PCC 7806 AND ∆MCYB AFTER FS2 EXUDATE TREATMENT
Strain Treatment Growth rate / day
PCC 7806 Control 0.12 ± 0.02
Fs2 exudate 0.11 ± 0.04
∆mcyB Control 0.12 ± 0.04
FS2 exudate 0.11 ± 0.06
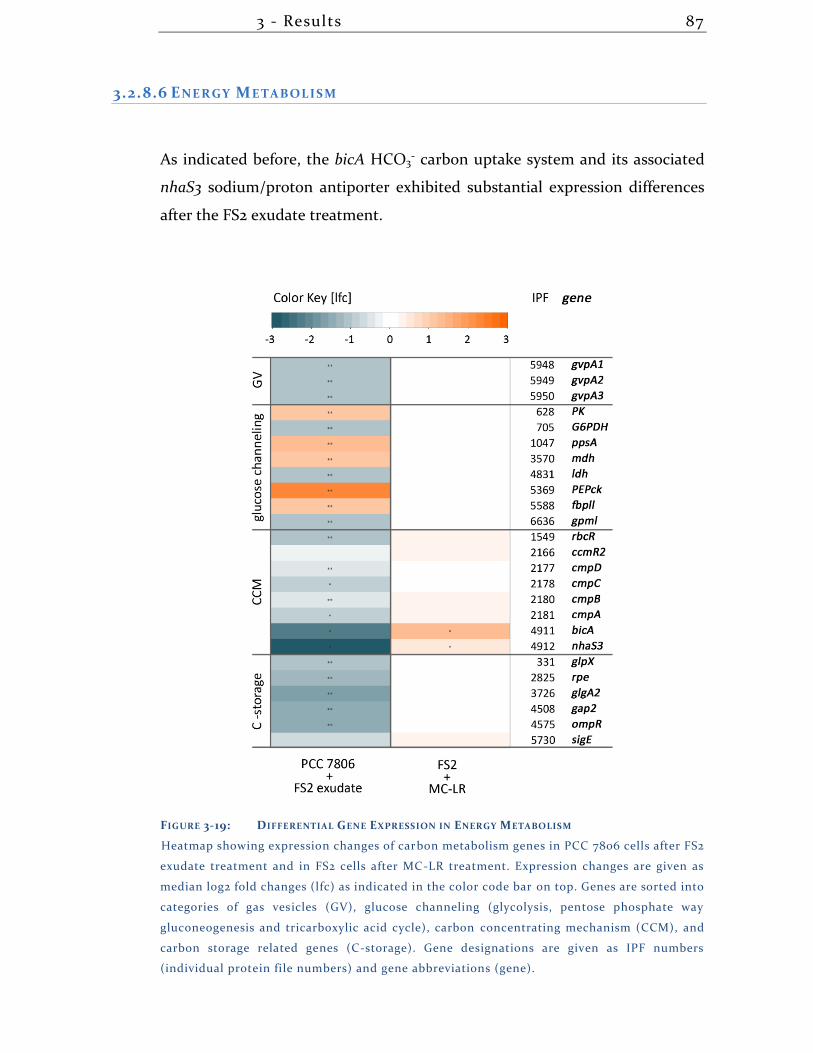
3 - Results 87
3.2.8.6 ENERGY METABOLISM
As indicated before, the bicA HCO3- carbon uptake system and its associated
nhaS3 sodium/proton antiporter exhibited substantial expression differences
after the FS2 exudate treatment.
FIGURE 3-19: DIFFERENTIAL GENE EXPRESSION IN ENERGY METABOLISM
Heatmap showing expression changes of carbon metabolism genes in PCC 7806 cells after FS2
exudate treatment and in FS2 cells after MC-LR treatment. Expression changes are given as
median log2 fold changes (lfc) as indicated in the color code bar on top. Genes are sorted into
categories of gas vesicles (GV), glucose channeling (glycolysis, pentose phosphate way
gluconeogenesis and tricarboxylic acid cycle), carbon concentrating mechanism (CCM), and
carbon storage related genes (C-storage). Gene designations are given as IPF numbers
(individual protein file numbers) and gene abbreviations (gene).
3 - Results 88
Considering that the lack of imported inorganic carbon might affect further
carbon processing pathways like carbon fixation during the Calvin Benson
Bassham cycle or storage and degradation of carbon compounds, a
comprehensive look was taken at affected genes belonging to the category of
energy metabolism and related pathways (Figure 3-19).
All genes that showed differential expression were attributed to categories of
the carbon concentrating meachnism (CCM), glucose channeling, and storage
compounds. Additionally to the bicA uptake system, other components of the
CCM were downregulated. This can be seen, for example in the downregulation
of the HCO3- uptake system cmpA-D. CCM regulating genes confirm the
tendency of downregulation, with the CCM activator rbcR being strongly
downregulated while the repressing regulator ccmR2 was only marginally
affected. Other known components of the CCM regarding carboxysome
synthesis or CO2-fixation did not show significant expression changes.
However, it should be noted that the CCM genes in question also showed an
altered expression in FS2 cells, when treated with an external addition of
50 ng/mL microcystin-LR. Regarding the CCM genes, the non-toxic FS2 thus
showed a reverse response to an external cyanobacterial peptide when
compared to the reaction of the toxic PCC 7806 to the exudate of FS2.
During the analysis of carbon metabolic genes, glycolysis regulators were found
slightly downregulated (sigE/IPF_5730 homologue to sll1689 of PCC 6803 shows
lfc=-0.75; ompR/IPF_4575/homologue of sll1330: lfc=-1.55) after the FS2 exudate
stimulus. The identified target genes of OmpR in glycolysis (glucokinase: glk
[sll0593]; phosphofructokinase: pfkA [sll1196], fructose 1,6-bisphosphate
aldolase: fbaA [sll0018]; phosphoglycerate mutase: gpmB [slr1124], and pyruvate
kinase pk [sll0587]) (Tabei, et al., 2007) were all marginally downregulated as
well, with the exception of the pyruvate kinase. In fact, the PK belongs to a
subcategory of glycolytic genes that showed most prominent upregulation.
Among them are the phosphoenolpyruvate carboxykinase (PEPck), the
pyruvate kinase (PK), and the phosphoenolpyruvate synthase (PpsA). Those
represent the passage between glycolysis and tricarboxylic acid cycle (TCA) and
thus might shift their reactions to one direction depending on the utilization of
3 - Results 89
their reaction products. Genes involved in the TCA hardly showed differences
in expression with the exception of the malate dehydrogenase, which is
upregulated under the tested conditions. Interestingly, the differentially
upregulated PEPck and PK in question are not well conserved among
cyanobacteria and the affected orthologues are only present in Microcystis and
a few Cyanothece species. Apart from the glycolytic genes, other carbon
processing channels appeared to be blocked by the downregulation of enzymes
in key positions. This includes the downregulation of glucose-6-phosphate
dehydrogenase as first step of the pentose phosphate pathway and
downregulation of the lactate dehydrogenase (Ldh), which might decrease the
reaction of pyruvate to lactate catalyzed by Ldh.
Among the genes related to carbon storage generation, a general pattern of
downregulation was induced after the treatment of PCC 7806 with FS2 spent
medium. This occurred for single genes on all levels that are involved in the
generation of carbon storage compounds. Genes of the primary carbon fixation
during the CBB (glpX) as well as genes of gluconeogenesis (gap2) (Koksharova,
et al., 1998) and glycogen synthesis genes (glgA2) are down regulated.
Due to the negative correlation between the accumulation of storage
compounds as ballast freight and gas vesicle mediated buoyance in vertical
migration of Microcystis, both parameters were compared regarding the
differential regulation of involved genes. The significant downregulation of gas
vesicle genes in the current transcriptional investigations was evaluated as
indicator for decreased buoyancy, whereas the reduced accumulation of storage
compounds would not support cell sinking tendencies. Nevertheless, PCC 7806
cells did sink to the bottom after the treatment with FS2 exudate and thus
captured the opposite position to the FS2 cells, which were floating at the
culture surface under standard cultivation conditions.
3 - Results 90
3.2.8.7 AMINO ACID BIOSYNTHESIS GENES
The analysis of the transcriptional data of PCC 7806 cells after the stimulus of
FS2 spent medium showed that genes of the amino acid biosynthesis gene
category were affected in 14 % of the genes. This includes exclusively genes of
the subcategories for the glutamate/nitrogen assimilation family, the serine
family, and the aromatic amino acid family. In detail, the data suggest that the
biosynthesis of the amino acids tryptophan, phenylalanine, and tyrosine as well
as arginine and glutamine was reduced via the downregulation of the genes
aroK (shikimate kinase), trpC (indole-3-glycerol phosphate synthase), argJ
(arginine biosynthesis bifunctional), and the two glutamate ammonia ligases
glnA, glnN. While all of these genes are downregulated with log2-fold changes
(lfc) between -1.05 and -1.67 one gene was 5.76-fold upregulated to an lfc of 2.4
(gdhA). The strongly upregulated glutamate dehydrogenase catalyzes the
reversible reaction of glutamate plus NAD(P)+ to α-ketoglutarate + NH4+. Thus,
its upregulation might indicate an increased utilization of the amino acid
glutamate to provide α-ketoglutarate and NH4+.
Due to the close connection between amino acid biosynthesis and nitrogen
metabolism, the down regulation of the regulator gene ntcB should be
mentioned here. The regulator NtcB was previously reported to be responsible
for nitrate assimilation in Synechocystis PCC 6803 (Aichi, et al., 2001). Its
downregulation and the downregulation of target genes like the above
mentioned transporters nrtA/B (section 3.2.8.4, page 82), and ferredoxin-
nitrite/nitrate reductase genes nirA and narB supports the notion of a decreased
nitrate assimilation in PCC 7806 cells after treatment with FS2 exudate.
3 - Results 91
3.2.8.8 CELL ENVELOPE RELATED EXPRESSION CHANGES
Over 20 % of the genes assigned to the functional category of the cell envelope
were differentially downregulated after the FS2 exudate stimulus. Enzymes of
the peptidoglycan biosynthesis and exopolysaccharide (EPS) biosynthesis were
affected most. Downregulated key players of the cell wall synthesis included
murA and murC genes as well as the D-alanine-D-alanine ligase ddlA and the
transpeptidase (D-alanyl-D-alanine carboxypeptidase) dacB. A strong impact
on cell division and arrest of cell growth however, was rejected, due to the fact
that growth rates did not differ significantly between FS2 exudate treated and
untreated PCC 7806 cultures. Production of L-rhamnose, a typical component
of released polysaccharides, which can shape cell surface characteristics
(Mandal, et al., 2014), was transcriptionally impeded via the downregulation of
the biosynthesis gene cluster rfbABCD.
3.2.8.9 SECONDARY METABOLITES
Among the secondary metabolite synthesis genes that showed differential
expression in response to the spent medium of FS2, genes belonging to an
orphan PKS synthesis cluster designated PKSit (IPF_3353-IPF_3362) (Frangeul,
et al., 2008) were found. The upregulation of the whole cluster was determined
in the range of a threefold higher expression (lfc=~1.65). In this respect it should
be noted, that an unknown metabolite was detected in MALDI imaging
approaches (949.486 m/z, Figure 3-14, page 74) in PCC 7806 in response to the
FS2 co-cultivation stimulus. Based on the current data, this metabolite might
represent a potential candidate for the unidentified PKSit-metabolite. Both
strains (PCC 7806 and FS2) contain the genomic resources for the production,
but FS2 did not produce the metabolite of the mass 949.486 m/z under the
tested conditions, neither in mono-cultivation nor in co-cultivation.
4 - Discussion 92
4 DISCUSSION
4.1 THE TRANSCRIPTOMIC VIEW INTO A ∆MCYB MUTANT CELL
he microcystin deficient ∆mcyB of the Microcystis aeruginosa wild type
strain PCC 7806 generated in 1997 (Dittmann, et al., 1997) has been
used in several comparative studies in order to gain deeper insights
into the biological role of microcystin. Additionally, distinct environmental
conditions that influence microcystin production such as nitrogen availability
or light conditions were under extensive investigation (Harke, et al., 2013;
Kaebernick, et al., 2000; Sevilla, et al., 2010; Straub, et al., 2011). Toxic and non-
toxic Microcystis strains showed different adaptation behaviors concerning
high light conditions, CO2-levels, or the proteinaceous cell envelope
composition (Kehr, et al., 2006; Van de Waal, et al., 2011; Zilliges, et al., 2011).
The transcriptomic profile of the mutant has for the first time provided a
comprehensive view on gene expression patterns in the mutant, which
represents complementary information to earlier proteomic and metabolomic
studies (Meissner, et al., 2014; Zilliges, et al., 2011). Implications of microcystin
within a broad variety of physiological aspects could also be found on the
transcriptomic level and revealed a comprehensive reprogramming concerning
central primary metabolic pathways (Figure 3-5, page 53).
In the microcystin deficient mutant cell, carbon turnover related processes
seem to be diminished to a great extent. While the synthesis of the storage
polyester PHA is shut down, the breakdown of glycogen is equally reduced in
the mutant. Subsequent heterotrophic carbon utilization pathways to generate
ATP, such as glycolysis, the TCA-cycle, and respirational oxidases show a similar
downregulation. At the same time, the extreme upregulation of the adenine
phosphoribosyltransferase gene (apt) in correlation with the upregulation of
ATP synthase subunits probably indicates a high demand for AMP in the
oxidative photosynthetic ATP generation. This implies an altered balance in the
photosynthetic electron flows of the ∆mcyB mutant cells, which is further
T
4 - Discussion 93
supported by a lower ratio of PSI to PSII expression. Similar changes in PSI
amounts relative to amounts of PSII were proposed in earlier comparative
studies of PCC 7806 and its non-toxic mutant under low light conditions as
means of stress acclimation (Hesse, et al., 2001). The role of PSI portions has
been strongly discussed in respect to capturing electrons that might otherwise
be channeled towards the plastoquinone pool and thus, potentially facilitate
photodamage (Baker, et al., 1996) or be shifted towards respirational terminal
oxidases, limiting CO2-fixation in photosynthesis (Vermaas, 2001). The reduced
PSI transcription found in the ∆mcyB mutant might therefore reflect a
transcriptional program that is based on a decreased need for photoprotection
and on non-occurring limitations of CO2-fixation. A reduced need for
photoprotection against oxidative stress might also be met by the
downregulation of the redox-state regulating bidirectional hydrogenase (hox
genes) found in the microcystin deficient mutant.
The transcriptional modifications within the ∆mcyB mutant cells appear to be
controlled through the regulatory actions of four transcription factors and
regulators. The major part in which is played by the alternative sigma factor
SigE. The target genes of SigE have been identified in an Synechocystis
PCC 6803 overexpression mutant (Osanai, et al., 2011) and comprise most of the
differentially expressed genes in the ∆mcyB mutant that are involved in carbon
catabolism. The regulon of SigE further includes the hox genes and the ycf27
regulator gene. Thus, Ycf27 is positioned downstream of SigE in the regulatory
cascade and in turn affects aspects of the photosynthesis and the transfer of
excitation energy from phycobilisomes to photosystem I (Ashby, et al., 2002).
This regulator might also be correlated with the KaiB1 expression, since a
correlation between Ycf27 and circadian clock output had been recently found
(Espinosa, et al., 2015). It can be assumed that the fourth of the regulators,
IPF_1434, which was found differentially expressed in the ∆mcyB mutant, is
operating either upstream of SigE or is independently addressed by another
regulating signal. Due to its immense downregulation, IPF_1434 is considered
to play a crucial role in microcystin related matters. The distinct mechanism
4 - Discussion 94
that causes the differential expression of SigE and others in the absence of
microcystin is so far unknown. A regulation through the covalent binding of
microcystin to transcription factors as shown for the binding to RubisCO
(Zilliges, et al., 2011) is theoretically conceivable and will require further testing.
The transcriptomic view on a microcystin deficient cell has shown
comprehensive reprogramming of genes regarding the primary metabolism.
Comparable results were found in proteomic studies (Zilliges, et al., 2011), where
microcystin was shown to influence enzymes from the CO2-fixation in the
Calvin-Benson-Bassham cycle, like RubisCO. A metabolomic comparison of the
∆mcyB mutant and the PCC 7809 wild type after high light stress revealed the
strongest differences in the accumulation of carbon storage and intermediate
metabolites (Meissner, et al., 2014). Regarding many genes, the transcripts,
found differentially expressed in this study did not coincide with expression
changes of the same proteins in comparative proteomic studies. These findings
indicate that microcystin has independent regulating effects on both levels,
influencing protein abundance by protective covalent binding, and influencing
transcriptional programs through a yet unknown mechanism. While single
candidates of differential transcripts, proteins and metabolites differ
considerably in their regulation between the ∆mcyB mutant and the wild type,
the majority of them is correlated with light dependent carbon channeling
processes.
4.2 DISCUSSING THE PHYSIOLOGICAL ROLES OF MICROCYSTIN
In complementation to other comparative studies between the ∆mcyB mutant
and the PCC 7806 wild type (Meissner, et al., 2014; Zilliges, et al., 2011), this
transcriptomic study was intended to obtain new insights into the physiological
roles of microcystin. The transcriptomic differences between the Microcystis
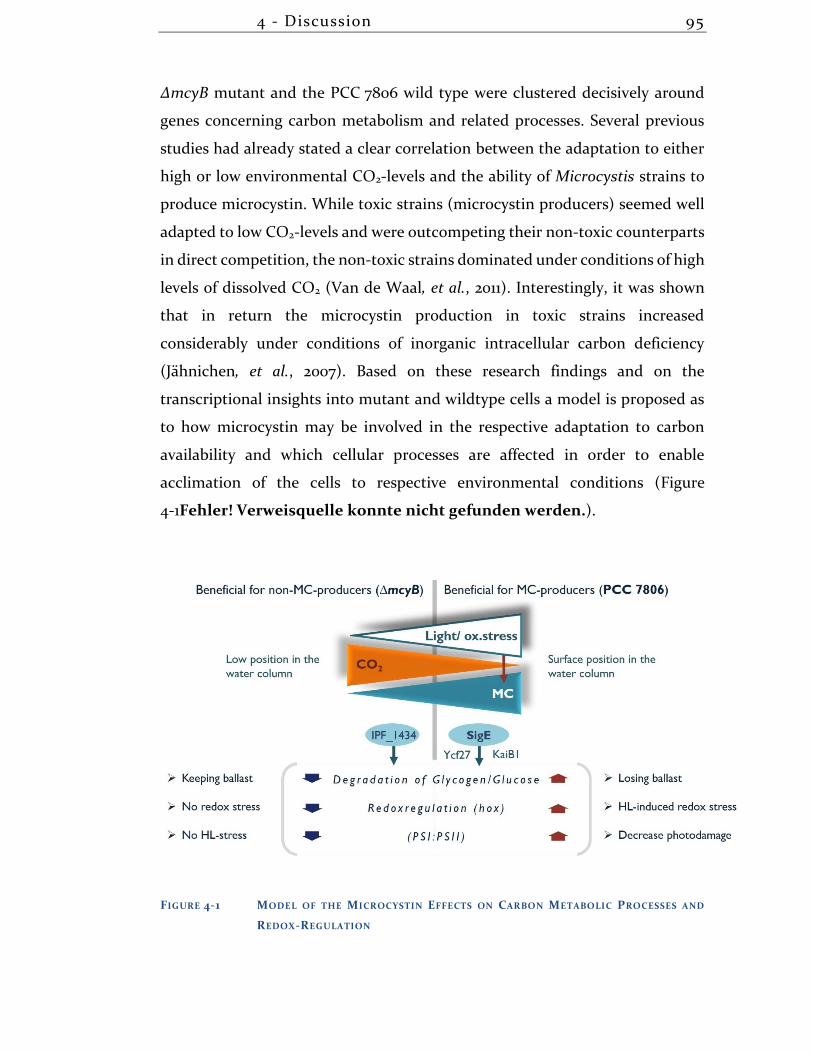
4 - Discussion 95
∆mcyB mutant and the PCC 7806 wild type were clustered decisively around
genes concerning carbon metabolism and related processes. Several previous
studies had already stated a clear correlation between the adaptation to either
high or low environmental CO2-levels and the ability of Microcystis strains to
produce microcystin. While toxic strains (microcystin producers) seemed well
adapted to low CO2-levels and were outcompeting their non-toxic counterparts
in direct competition, the non-toxic strains dominated under conditions of high
levels of dissolved CO2 (Van de Waal, et al., 2011). Interestingly, it was shown
that in return the microcystin production in toxic strains increased
considerably under conditions of inorganic intracellular carbon deficiency
(Jähnichen, et al., 2007). Based on these research findings and on the
transcriptional insights into mutant and wildtype cells a model is proposed as
to how microcystin may be involved in the respective adaptation to carbon
availability and which cellular processes are affected in order to enable
acclimation of the cells to respective environmental conditions (Figure
4-1Fehler! Verweisquelle konnte nicht gefunden werden.).
FIGURE 4-1 MODEL OF THE MICROCYSTIN EFFECTS ON CARBON METABOLIC PROCESSES AND
REDOX-REGULATION
4 - Discussion 96
The adaptation of toxic microcystin producers to low carbon availabilities
implies advantages in Microcystis blooms, where under high light intensities
CO2 is frequently depleted and high amounts of microcystin are produced
(Kaebernick, et al., 2000; Meissner, et al., 2013; Talling, 1976). The high light
intensities are at the same time implicated in oxidative stress and related
photodamage. While these conditions predominantly occur on surface
positions of aquatic habitats the opposing conditions are found in deeper water
layers, where non-toxic Microcystis variants thrive. The transcriptional data has
identified molecular processes that are underlying the preference to habitats of
toxic and non-toxic Microcystis strains. In this respect the lower degradation of
carbon storages, a decreased amount of photosystem I and a lesser expression
of redox-regulating hox-genes in the microcystin deficient mutant are named.
It might be speculated that altered mobilization of carbon storages greatly
influences buoyancy regulation, since these storage compounds also represent
ballast freight to the cell (Thomas, et al., 1985). Maintaining ballast freight by
reducing storage mobilization in the ∆mcyB mutant, thus, would keep the non-
toxic strain within deeper water layers that exhibit the environmental
conditions non-toxic Microcystis is suited best for. On the other hand, toxic
variants would stay afloat, with less carbon ballast, also exposed to high light
induced oxidative stress conditions. In this context, microcystin dependent
elevated levels of the redox-regulating bidirectional hydrogenase (hox)
probably serve the purpose of reducing redox stress. The same is true for the
increased transcription of PSI that was implicated in the protection from
photodamage (Baker, et al., 1996).
In accordance with this proposed model, the regulation of microcystin is partly
light dependent and its production is enhanced under high light exposure.
While factors such as light and carbon availability influence the production of
microcystin (Jähnichen, et al., 2007; Kaebernick, et al., 2000), the toxin itself
appears to be implicated in the regulation of essential transcriptional
regulators. The obtained data indicates that the alternative sigma factor SigE
and its regulons capture an essential role as microcystin target in oxidative
4 - Discussion 97
stress acclimation and that SigE may be influenced directly or indirectly by the
presence of microcystin. The suggested role of microcystin as regulating
mediator in light dependent oxidative stress responses represents an addition
to the protective effects that were shown in covalent protein binding as
protective measures against RubisCO degradation (Zilliges, et al., 2011). A role
of microcystin as global regulator has been considered before (Wilhelm, et al.,
2011) and the transcriptional data give a first support for this hypothesis.
4.3 CROSS-TALK BETWEEN SECONDARY METABOLITES
This study has focused on the effects of multiple extracellular factors in
Microcystis media as well as on the intra- and extracellular roles of a single
secondary metabolite. The results have confirmed that secondary metabolites
regularly capture roles as extracellular info-chemicals. Several of them were
proposed to be part of a sophisticated communication within the water body
(Kaplan, et al., 2012). In this study, many known secondary metabolites were
shown outside of Microcystis colonies in MALDI imaging approaches (Figure
3-14, page 74) and hence, might be placed in their location of action this way. A
very clear indication to an extracellular function of microcystin-LR in PCC 7806
was found after the extracellular application of microcystin-LR had specifically
induced the transcription of an unknown PKSI/III metabolite. While other
studies had reported an additional autoinduction effect of extracellular MC-LR
(Schatz, et al., 2007) suggesting a form of quorum sensing, the signaling effects
of microcystin were shown to be directed specifically to another metabolite
under the tested conditions. The data suggests that this effect is accomplished
by the extracellular perception of microcystin and signal transduction rather
than by an import of microcystin, which would presumably reverse more of the
transcriptional differences between the mutant and the wild type than the
regulation of a single gene cluster. The significant differences in secondary
metabolite transcription at different light or carbon supply conditions (Figure
4 - Discussion 98
3-13, page 72; Figure 3-7, page 61) illustrate that there are additional regulatory
stimuli to enhance the production of the respective secondary metabolite and
it can be assumed that several levels of regulation are in place. For instance, the
shift of MC-LR to a desmethylated microcystin variant was found under
Microcystis co-cultivation conditions and might have yet unidentified
downstream effects. The specific control of microcystin over the PKSI/III
metabolite finds parallels in similar interdependencies between secondary
metabolites. On the one hand, this is indicated by reciprocal expression
patterns of the metabolites cyanopeptolin, microcyclamide and aeruginosin
that are increased under conditions of eliminated microcystin production (in
∆mcyB mutant cells) (Figure 3-7, page 61). On the other hand, the changes of
metabolite amounts in response to extracellular signals from another
Microcystis strain (Figure 3-13, page 72), (Briand, et al., 2015) reflect comparable
regulating patterns. The numerous interdependencies of secondary metabolite
production in correlation to the particular wealth of secondary metabolites in
cyanobacteria (Dittmann, et al., 2015), might indicate a regulatory network and
intricate cross-talk among them.
This study also showed that single secondary peptides captured a highly specific
signaling role, when applied extracellularly. Under the tested conditions
microcystin did not cause global changes to Microcystis transcriptomes and
physiology. The role of distinct secondary signaling peptides as info-chemicals
might be more of an accumulative nature under field conditions and other
extracellular substances and stimuli potentially exert larger impacts on global
metabolic transitions in Microcystis cells. In this respect, Microcystis
interactions might encompass more versatile communication and signaling
processes than previously assumed.
4 - Discussion 99
4.4 THE TRANSCRIPTOMIC VIEW INTO A PCC 7806 CELL AFTER
THE TREATMENT WITH SPENT MEDIUM OF MICROCYSTIS FS2
After simulating a co-habitation of the axenic Microcystis lab strain PCC 7806
and the recently isolated uncharacterized Microcystis field strain FS2, by
incubating the lab strain with the spent medium of the field strain, it became
apparent that very strong effects were exerted on the lab strain PCC 7806. These
effects were visible on the phenotypic level and included a strongly elevated cell
aggregation with aggregates sinking to the bottom of the water column.
Furthermore, a broad transcriptional response was triggered involving 215 genes
from the primary and the secondary metabolism. The transcriptional changes
induced in PCC 7806 cells were summarized in Figure 3-17 (page 81), displaying
the reactions in a cellular and metabolic context.
From Figure 3-17 on page 81 it can be seen that the transcriptional response to
the extracellular stimulus of FS2 exudates induces a considerable reorganization
of the cell envelope, which affects the cell wall as well as extracellular
polysaccharides. It can be assumed that this reorganization of the cell envelope
contributes to the observed “sticky” aggregating phenotype induced in
PCC 7806. Cell aggregations and an altered EPS composition and mucilage
production has been reported in Microcystis before as acclimation mechanisms
to various physico-chemical stimuli and stress factors (Kehr, et al., 2015; Wang,
et al., 2010; Xu, et al., 2014).
In close connection to the altered envelope structures, an extensive shut down
of nutrient uptake system was observed after the treatment with FS2 exudates.
It might be speculated that both, the altered envelope structures and the
downregulation of transmembrane transporters were initiated as protective
measures against the added extracellular compounds from the FS2 exudates.
This assumption goes hand in hand with the observation that the entire set of
affected transcriptional regulators was shown to respond to extracellular
chemical stimuli (Table 3-6, page 85). At the same time, the transcriptional
results have shown a reduced production of the EPS compound L-rhamnose.
4 - Discussion 100
Considering the extensive shut down of HCO3-import, a cellular reaction that
decreases the use of carbon units for EPS-production, which were shown to
function as carbon sinks (Otero, et al., 2003) might be economically reasonable
for the cells. A decreased extracellular presence of saccharides was also
correlated to a reduced iron availability for phytoplankton (Hassler, et al., 2011)
due to acting as organic ligands, which might explain the strong transcriptional
induction of iron stress related genes in this study.
In the light of a strongly reduced nutrient uptake of carbon and nitrogen
sources, the broad transcriptional changes in carbon and amino acid
metabolism probably reflected adjustments to the new nutrient supply
situation. While the carbon metabolism was driven towards a more
heterotrophic energy acquisition through the TCA-cycle and reduced in any
other carbon processing (glycogen synthesis, pentose phosphate pathway,
lactate fermentation), amino acid biosynthesis seemed to be partly reduced
with a shift towards reactions that would accumulate α-ketoglutarate. Since α-
ketoglutarate is metabolically positioned at the interface between carbon and
nitrogen metabolism, this accumulation might have been related to the low
carbon situation within the cell. Similar metabolic fluxes were found in other
studies of low carbon effects (Schwarz, et al., 2014), and it was proposed that α-
ketoglutarate might also function as co-repressor of the CCM (Daley, et al.,
2012), which is in good accordance with the downregulation of CCM genes in
this study.
4.5 THE ECOLOGICAL NICHES OF TWO MICROCYSTIS STRAINS
In this study, the simulated co-habitation of two Microcystis strains has resulted
in substantial alterations of the morphological characteristics and
transcriptional programs in one of these strains. The genomic differences were
determined to make up at least 12.5 % of their genomes, which putatively
4 - Discussion 101
represents the potential for producing interaction mediators/compounds. The
response to the FS2-signals triggered differential gene expression mostly in the
fraction of genes that are not found in the core genome of Microcystis, but that
belong to the flexible and strain specific genes, thus, being a preferential target
in terms of responding to the signals of a fellow Microcystis representative.
Beyond the genomic differences between the two investigated strains, a few
apparent differences between PCC 7806 and FS2 might be used to attribute
certain ecotypes to each of them.
While the field strain FS2 captured positions at culture surface in colonial cell
forms, the Microcystis lab strain exhibited a single-celled phenotype under
standard cultivation conditions with cells being regularly dispersed throughout
the water column. In simulated co-cultivation, the lab strain was seemingly
forced into a deeper water layer, creating a local separation of both strains. In
this respect it is tempting to interpret the immense transcriptional changes in
PCC 7806, which include reprogramming of carbon utilization channels, as
further positioning of each strain within their respective ecological niche. The
reaction of PCC 7806 triggered a massive downregulation of gas vesicles
suggesting a decreased buoyancy, which resulted in the sinking of cells, thus,
occupying a position of putatively higher CO2-availability. Simultaneously,
energy acquisition was switched to the light independent more heterotrophic
pathways of glycolysis and the TCA. The described sinking of the cells
apparently worked without an accumulation of additional ballast glycogen,
which is part of the physiological vertical migration model (Thomas, et al.,
1985). Both, the accumulation of ballast and the buoyancy induction by gas
vesicles might be independently regulated and used with the descending of cells
being supported by the enlargement of aggregates as modelled for Microcystis
colonies (Visser, et al., 1997). As a consequence of the PCC 7806 sinking, the
upper water layers would be vacant for the low CO2-adapted strain FS2. This
hypothesis is supported by a genetic background of each strain with the
respective suitable HCO3- uptake systems (Sandrini, et al., 2013). Sequencing
results have attributed the high substrate affinity transporter gene sbtA only to
the FS2 strain.
4 - Discussion 102
Additionally, further experimental results were found that could support an
acclimation reaction of PCC 7806 to deeper water layers. An increased level of
phycocyanin was detected when cells were treated with FS2 exudates in this
study. Elevated levels of the antenna pigments of phycocyanin would enhance
photosynthetic light absorption in deeper water layers, where less light reaches
the cells.
Whether the local separation of both investigated strains is intended to avoid
competition or potential harm from PCC 7806 cannot be deduced from the data
of this study. However, the fact that the simulated co-habitation of the two
Microcystis strains did not result in the expression of known stress markers and
did not significantly affect growth rates in PCC 7806 after the FS2 exudate
treatment, suggested that both strains might not compete but rather find their
respective ecological niche and co-existence. In this respect, a confirmative
approach could show if one strain will outcompete the other, in case of direct
co-cultivation in the same habitat.
4.6 BIOACTIVE COMPOUNDS IN THE SPENT MEDIUM OF
MICROCYSTIS FIELD STRAIN 2
In this study the substantial effects of the cell exudate of one Microcystis strain
(FS2) on another (PCC 7806) were shown. The analysis of transcriptional
responses as well as other physiological reactions indicated that a
reprogramming of primary metabolism occurred as well as the directed
upregulation of a specific secondary metabolite. By using the undifferentiated
exudate of a bacterial culture a natural situation was simulated, resembling
conditions in the field. However, it must be assumed that the observed
bioactivity from the used cell exudate, might originate from a mixture of
multiple factors. In this respect, the transcriptional and physiological reactions
are considered to be of an accumulative nature and so far, it cannot be
4 - Discussion 103
distinguished if the differential regulation of single genes and regulons results
from several or just one factor.
In addition to that, the microbiome analysis of FS2 must be considered when
discussing the bioactivity of the spent medium of FS2. With 77 % of the FS2
culture being identified as Microcystis, it was assumed that the bioactive factors
of the spent FS2-medium originate from the Microcystis strain. Nevertheless,
the representatives of the remaining 23 % of the bacterial community might
provide a contributing effect. Most of the associating bacteria from the
Microcystis strain FS2 have been reported in other studies concerning
cyanobacterial communities before, which showed a strong diversity in the
heterotrophic bacterial composition in dependency of the associated
cyanobacterium (Berg, et al., 2009). With 15 % of the FS2-community belonging
to the order Sphingobacteriales and another 4 % belonging to the order
Sphingomonadales the majority of Microcystis FS2 associates is made up by
sphingolipid producers. Diverse roles of sphingolipids, for example in cell
recognition and signaling or in cell membrane rigidity, have been identified in
mammals (Brown, et al., 2000; Hakomori, et al., 1995). It can only be speculated
that one of these functions might be captured as well for either of the partners
in the community of Microcystis FS2 that was under investigation in this study.
The analytic data about the FS2 exudate and its bioactive fractions represents a
first step towards narrowing down which compound class might have induced
the strong transcriptional and physiological changes, observed in Microcystis
PCC 7806 in this project. The preliminary characterization of the active fraction
of the FS2 exudate was attributing the activity to a hydrophilic, water soluble
and putatively osmotically active compound or group of compounds. Previously
reported extracellular info-chemicals affecting other cyanobacteria were largely
attributed to the class of secondary metabolites and peptides (Briand, et al.,
2015; Kaplan, et al., 2012). The identified candidates from the FS2 exudate in this
compound class will need further evaluation and testing.
Recent research presents another option of extracellular signal and compound
transmission. The production of outer membrane vesicles (OMV) and
4 - Discussion 104
incorporated peptides, enzymes, saccharides, DNA and lipids can be involved
in intercellular communication, transport of contents and also in horizontal
gene transfer (Kulkarni, et al., 2014; Kulp, et al., 2010). While the implication of
OMVs in the current bacterial interactions might be worth testing, it does not
provide a direct lead regarding the identity and substance class of the bioactive
compounds in question.
A substance class that should not be neglected as potentially active signals is
constituted by polysaccharides. Numerous studies have indicated that EPS
quantities are responsible for Microcystis aggregation processes (Li, et al., 2012;
Xu, et al., 2014) and algal organic matter (AOM) or modified polysaccharides
such as chitosan are being employed for the induced flocculation and
subsequent removal of cyanobacterial bloom materials from eutrophic systems
(Henderson, et al., 2010; Zou, et al., 2006). Beyond the application in
environmental and economic concerns, a biological context and severe
morphological effects have been demonstrated when Microcystis EPS
production could be related to specific growth phases (Li, et al., 2012) or were
involved in species interactions with heterotrophic bacteria (Shen, et al., 2011).
The acquired insight into the comprehensive transcriptional responses in
aggregation processes and related physiological parameters opens a new
perspective on the biological and ecological implications
4.7 LIMITATIONS TO THIS STUDY AND FUTURE OUTLOOK
This study was initiated with the intention to investigate Microcystis
interactions as well as the role of involved info-chemicals. By choosing recently
isolated non-axenic Microcystis strains for this work, the possibility of
associated bacteria influencing experimental results persisted. So far, the
possibility remains that described effects in co-cultivation experiments,
attributed to Microcystis (FS2), were originally caused by the heterotrophic
4 - Discussion 105
associates, and confirmative control experiments are needed. The isolation of
the major players among associated heterotrophic bacteria and testing for
bioactivity of their spent medium and released compounds might provide
certainty in this respect. The ecological implications of two different
Microcystis strains that exhibit very different and nearly opposing ecotypes
within the same medium however, is fascinating nonetheless. A hypothetical
influence originating from associated bacteria that triggers the observed
comprehensive transcriptional reprogramming leading to opposing ecological
niche acclimation, would indicate a closer symbiotic relation, which has not
been reported before to this extent.
So far, the identification of the bioactive substance(s) in the spent medium of
Microcystis FS2 remains on a very preliminary level. Further experiments,
narrowing down the observed bioactivity to a substance class, size range and
eventually the structure and the exact mass through mass spectrometric
investigations will supply valuable information concerning the nature of the
detected interactions. In turn, it might also provide leads to the producing
organism.
Information about the FS2 genome were acquired by DNA-DNA microarrays
that only provided the identity of genes present in both genomes, in PCC 7806
and in FS2. This rough comparison between the two putatively interacting
Microcystis strains revealed most differences between PCC 7806 and FS2 among
flexible genes, as could have been expected. Currently, the comprehensive
genome sequencing of FS2 is being conducted. It is supposed to give a detailed
characterization of the strain FS2 including the genomic resources that are only
possessed by FS2 and that might be responsible for the strong effects imposed
on PCC 7806.
A major part of the experimental results from this study is based on
transcriptomic investigations via microarrays. The transcriptomic state was
analyzed one hour after a distinct stimulus and therefore represents a snapshot
of the transcriptional responses. A timeline, covering up to 24 h might have
4 - Discussion 106
given additional information, providing insights into early and late responses
and determining the severity of the applied stimulus.
Despite these open questions, the present study has gathered new insights into
Microcystis interactions that can occur between two strains without further
biotic and abiotic influencing factors usually found in meta-transcriptomic
studies. The detailed cellular processes that are involved in ecological
implications and cell-cell communications were discussed in detail. A non-
competitive niche acclimation strategy among Microcystis strains was
suggested that allows for different ecotypes of Microcystis in the same habitats,
being in good accordance with the observed diversity within Microcystis
communities.
For the first time a comprehensive transcriptional comparison between the
microcystin deficient ∆mcyB mutant and the microcystin producing wild type
PCC 7806 was obtained, which could identify cellular processes that are affected
by the intra and extracellular presence of microcystin. In that respect the
essential role of the transcription factor SigE was recognized and it remains to
be elucidated which molecular mechanisms are underlying the observed
regulatory network which is responding to the presence and absence of
microcystin.
As an unexpected byproduct, the present investigations have also delivered
information about secondary metabolites that belong to orphan gene clusters
with unidentified metabolite structures. The discovery of distinct conditions
that lead to expression of these metabolites provides the means for their
identification and structural characterization. Secondary metabolites have
proven to show interesting bioactivities in many cases and their utilization in
pharmaceuticals is of great interest, requiring the basic research and
identification, which can be facilitated through the discovery of inducible
expression conditions.
5 - References 107
5 REFERENCES
1. Afif, H., Allali, N., Couturier, M., Van Melderen, L., (2001) The ratio between CcdA and CcdB modulates the transcriptional repression of the ccd poison-antidote system. Mol Microbiol 41, 73-82; mmi2492 [pii]
2. Aichi, M., Takatani, N., Omata, T., (2001) Role of NtcB in activation of nitrate assimilation genes in the cyanobacterium Synechocystis sp. strain PCC 6803. J Bacteriol 183, 5840-5847; 10.1128/JB.183.20.5840-5847.2001
3. Allali, N., Afif, H., Couturier, M., Van Melderen, L., (2002) The highly conserved TldD and TldE proteins of Escherichia coli are involved in microcin B17 processing and in CcdA degradation. J Bacteriol 184, 3224-3231;
4. Allen, J., Gantt, E., Golbeck, J., Osmond, B., Pollari, M., Tyystjärvi, T., in Photosynthesis. Energy from the Sun. (Springer Netherlands, 2008), pp. 1351-1353. 10.1007/978-1-4020-6709-9_291
5. Andrizhiyevskaya, E. G., Schwabe, T. M., Germano, M., D'Haene, S., Kruip, J., van Grondelle, R., Dekker, J. P., (2002) Spectroscopic properties of PSI-IsiA supercomplexes from the cyanobacterium Synechococcus PCC 7942. Biochim Biophys Acta 1556, 265-272; S0005272802003717 [pii]
6. Ashby, M. K., Houmard, J., Mullineaux, C. W., (2002) The ycf27 genes from cyanobacteria and eukaryotic algae: distribution and implications for chloroplast evolution. FEMS Microbiol Lett 214, 25-30; S0378109702008340 [pii]
7. Baker, N., Andersson, B., Barber, J., in Photosynthesis and the Environment. (Springer Netherlands, 1996), vol. 5, pp. 101-121. 10.1007/0-306-48135-9_4
8. Bar-Yosef, Y., Sukenik, A., Hadas, O., Viner-Mozzini, Y., Kaplan, A., (2010) Enslavement in the water body by toxic Aphanizomenon ovalisporum, inducing alkaline phosphatase in phytoplanktons. Curr Biol 20, 1557-1561; S0960-9822(10)00934-6 [pii] 10.1016/j.cub.2010.07.032
9. Beer, A., in Annalen der Physik und Chemie. (1852), vol. 86, pp. 78-88. 10. Berg, K. A., Lyra, C., Sivonen, K., Paulin, L., Suomalainen, S., Tuomi, P.,
Rapala, J., (2009) High diversity of cultivable heterotrophic bacteria in association with cyanobacterial water blooms. ISME J 3, 314-325; ismej2008110 [pii] 10.1038/ismej.2008.110
11. Berkner, L. V., Marshall, L. C., (1965) On the Origin and Rise of Oxygen Concentration in the Earth's Atmosphere. Journal of the Atmospheric Sciences 22, 225-261; 10.1175/1520-0469(1965)022<0225:otoaro>2.0.co;2
12. Bolger, A. M., Lohse, M., Usadel, B., (2014) Trimmomatic: a flexible trimmer for Illumina sequence data. Bioinformatics 30, 2114-2120; btu170 [pii] 10.1093/bioinformatics/btu170
13. Briand, E., Bormans, M., Gugger, M., Dorrestein, P. C., Gerwick, W. H., (2015) Changes in secondary metabolic profiles of Microcystis aeruginosa
5 - References 108
strains in response to intraspecific interactions. Environ Microbiol, 10.1111/1462-2920.12904
14. Brocks, J. J., Logan, G. A., Buick, R., Summons, R. E., (1999) Archean molecular fossils and the early rise of eukaryotes. Science 285, 1033-1036; 7752 [pii]
15. Brown, D. A., London, E., (2000) Structure and function of sphingolipid- and cholesterol-rich membrane rafts. J Biol Chem 275, 17221-17224; 10.1074/jbc.R000005200 R000005200 [pii]
16. Brunberg, A.-K., (1999) Contribution of bacteria in the mucilage of Microcystis spp. (Cyanobacteria) to benthic and pelagic bacterial production in a hypereutrophic lake. FEMS Microbiology Ecology 29, 13-22; 10.1111/j.1574-6941.1999.tb00594.x
17. Burnap, R. L., Hagemann, M., Kaplan, A., (2015) Regulation of CO2 Concentrating Mechanism in Cyanobacteria. Life (Basel) 5, 348-371; life5010348 [pii] 10.3390/life5010348
18. Calteau, A., Fewer, D. P., Latifi, A., Coursin, T., Laurent, T., Jokela, J., Kerfeld, C. A., Sivonen, K., Piel, J., Gugger, M., (2014) Phylum-wide comparative genomics unravel the diversity of secondary metabolism in Cyanobacteria. BMC Genomics 15, 977; 1471-2164-15-977 [pii] 10.1186/1471-2164-15-977
19. Caporaso, J. G., Kuczynski, J., Stombaugh, J., Bittinger, K., Bushman, F. D., Costello, E. K., Fierer, N., Pena, A. G., Goodrich, J. K., Gordon, J. I., Huttley, G. A., Kelley, S. T., Knights, D., Koenig, J. E., Ley, R. E., Lozupone, C. A., McDonald, D., Muegge, B. D., Pirrung, M., Reeder, J., Sevinsky, J. R., Turnbaugh, P. J., Walters, W. A., Widmann, J., Yatsunenko, T., Zaneveld, J., Knight, R., (2010) QIIME allows analysis of high-throughput community sequencing data. Nat Methods 7, 335-336; nmeth.f.303 [pii] 10.1038/nmeth.f.303
20. Carmichael, W., (2008) A world overview--one-hundred-twenty-seven years of research on toxic cyanobacteria--where do we go from here? Adv Exp Med Biol 619, 105-125; 10.1007/978-0-387-75865-7_4
21. Carrieri, D., Wawrousek, K., Eckert, C., Yu, J., Maness, P. C., (2011) The role of the bidirectional hydrogenase in cyanobacteria. Bioresour Technol 102, 8368-8377; S0960-8524(11)00462-7 [pii] 10.1016/j.biortech.2011.03.103
22. Chaturongakul, S., Ounjai, P., (2014) Phage-host interplay: examples from tailed phages and Gram-negative bacterial pathogens. Front Microbiol 5, 442; 10.3389/fmicb.2014.00442
23. Chen, M., Schliep, M., Willows, R. D., Cai, Z. L., Neilan, B. A., Scheer, H., (2010) A red-shifted chlorophyll. Science 329, 1318-1319; science.1191127 [pii] 10.1126/science.1191127
5 - References 109
24. Chomczynski, P., Sacchi, N., (1987) Single-step method of RNA isolation by acid guanidinium thiocyanate-phenol-chloroform extraction. Anal Biochem 162, 156-159; 10.1006/abio.1987.9999 0003-2697(87)90021-2 [pii]
25. Cox, M. A. A. C. a. T. F., Multidimensional Scaling. (Chapman and Hall, ed. 2, 2001),
26. Crush, J. R., Briggs, L. R., Sprosen, J. M., Nichols, S. N., (2008) Effect of irrigation with lake water containing microcystins on microcystin content and growth of ryegrass, clover, rape, and lettuce. Environ Toxicol 23, 246-252; 10.1002/tox.20331
27. D'Agostino, P. M., Woodhouse, J. N., Makower, A. K., Yeung, A. C., Ongley, S. E., Micallef, M. L., Moffitt, M. C., Neilan, B. A., (2015) Advances in genomics, transcriptomics and proteomics of toxin-producing cyanobacteria. Environ Microbiol Rep, 10.1111/1758-2229.12366
28. Daley, S. M., Kappell, A. D., Carrick, M. J., Burnap, R. L., (2012) Regulation of the cyanobacterial CO2-concentrating mechanism involves internal sensing of NADP+ and alpha-ketogutarate levels by transcription factor CcmR. PLoS One 7, e41286; 10.1371/journal.pone.0041286 PONE-D-12-10646 [pii]
29. Davies, J., (2013) Specialized microbial metabolites: functions and origins. J Antibiot (Tokyo) 66, 361-364; ja201361 [pii] 10.1038/ja.2013.61
30. Dillon, J. G., Castenholz, R. W., (2003) The synthesis of the UV-screening pigment, scytonemin, and photosynthetic performance in isolates from closely related natural populations of cyanobacteria (Calothrix sp.). Environ Microbiol 5, 484-491; 436 [pii]
31. Dittmann, E., Gugger, M., Sivonen, K., Fewer, D. P., (2015) Natural Product Biosynthetic Diversity and Comparative Genomics of the Cyanobacteria. Trends Microbiol 23, 642-652; S0966-842X(15)00157-2 [pii] 10.1016/j.tim.2015.07.008
32. Dittmann, E., Neilan, B. A., Erhard, M., von Dohren, H., Borner, T., (1997) Insertional mutagenesis of a peptide synthetase gene that is responsible for hepatotoxin production in the cyanobacterium Microcystis aeruginosa PCC 7806. Mol Microbiol 26, 779-787;
33. Dittmann, E., Wiegand, C., (2006) Cyanobacterial toxins--occurrence, biosynthesis and impact on human affairs. Mol Nutr Food Res 50, 7-17; 10.1002/mnfr.200500162
34. Edelman, M. J., Gandara, D. R., Hausner, P., Israel, V., Thornton, D., DeSanto, J., Doyle, L. A., (2003) Phase 2 study of cryptophycin 52 (LY355703) in patients previously treated with platinum based chemotherapy for advanced non-small cell lung cancer. Lung Cancer 39, 197-199; S0169500202005111 [pii]
35. Elser, J. J., Bracken, M. E., Cleland, E. E., Gruner, D. S., Harpole, W. S., Hillebrand, H., Ngai, J. T., Seabloom, E. W., Shurin, J. B., Smith, J. E., (2007) Global analysis of nitrogen and phosphorus limitation of primary
5 - References 110
producers in freshwater, marine and terrestrial ecosystems. Ecol Lett 10, 1135-1142; ELE1113 [pii] 10.1111/j.1461-0248.2007.01113.x
36. Espinosa, J., Boyd, J. S., Cantos, R., Salinas, P., Golden, S. S., Contreras, A., (2015) Cross-talk and regulatory interactions between the essential response regulator RpaB and cyanobacterial circadian clock output. Proc Natl Acad Sci U S A 112, 2198-2203; 1424632112 [pii] 10.1073/pnas.1424632112
37. Fastner, J., Erhard, M., von Dohren, H., (2001) Determination of oligopeptide diversity within a natural population of Microcystis spp. (cyanobacteria) by typing single colonies by matrix-assisted laser desorption ionization-time of flight mass spectrometry. Appl Environ Microbiol 67, 5069-5076; 10.1128/AEM.67.11.5069-5076.2001
38. Foy, R. H., Gibson, C. E., Smith, R. V., (1976) The influence of daylength, light intensity and temperature on the growth rates of planktonic blue-green algae. British Phycological Journal 11, 151-163; 10.1080/00071617600650181
39. Fraenkel, G. S., (1959) The raison d'etre of secondary plant substances; these odd chemicals arose as a means of protecting plants from insects and now guide insects to food. Science 129, 1466-1470;
40. Frangeul, L., Quillardet, P., Castets, A. M., Humbert, J. F., Matthijs, H. C., Cortez, D., Tolonen, A., Zhang, C. C., Gribaldo, S., Kehr, J. C., Zilliges, Y., Ziemert, N., Becker, S., Talla, E., Latifi, A., Billault, A., Lepelletier, A., Dittmann, E., Bouchier, C., de Marsac, N. T., (2008) Highly plastic genome of Microcystis aeruginosa PCC 7806, a ubiquitous toxic freshwater cyanobacterium. BMC Genomics 9, 274; 1471-2164-9-274 [pii] 10.1186/1471-2164-9-274
41. Gan, N., Xiao, Y., Zhu, L., Wu, Z., Liu, J., Hu, C., Song, L., (2011) The role of microcystins in maintaining colonies of bloom-forming Microcystis spp. Environ Microbiol 14, 730-742; 10.1111/j.1462-2920.2011.02624.x
42. Garcia-Pichel, F., Belnap, J., Neuer, S., Schanz, F., (2003) Estimates of global cyanobacterial biomass and its distribution. Algological Studies 109, 213-227;
43. Gentleman, R. C., Carey, V. J., Bates, D. M., Bolstad, B., Dettling, M., Dudoit, S., Ellis, B., Gautier, L., Ge, Y., Gentry, J., Hornik, K., Hothorn, T., Huber, W., Iacus, S., Irizarry, R., Leisch, F., Li, C., Maechler, M., Rossini, A. J., Sawitzki, G., Smith, C., Smyth, G., Tierney, L., Yang, J. Y., Zhang, J., (2004) Bioconductor: open software development for computational biology and bioinformatics. Genome Biol 5, R80; gb-2004-5-10-r80 [pii] 10.1186/gb-2004-5-10-r80
44. Giovannoni, S. J., Turner, S., Olsen, G. J., Barns, S., Lane, D. J., Pace, N. R., (1988) Evolutionary relationships among cyanobacteria and green chloroplasts. J Bacteriol 170, 3584-3592;
45. Groth, D., Hartmann, S., Klie, S., Selbig, J., (2012) Principal components analysis. Methods Mol Biol 930, 527-547; 10.1007/978-1-62703-059-5_22
5 - References 111
46. Grunewald, J., Marahiel, M. A., (2006) Chemoenzymatic and template-directed synthesis of bioactive macrocyclic peptides. Microbiol Mol Biol Rev 70, 121-146; 70/1/121 [pii] 10.1128/MMBR.70.1.121-146.2006
47. Gugger, M. F., Hoffmann, L., (2004) Polyphyly of true branching cyanobacteria (Stigonematales). Int J Syst Evol Microbiol 54, 349-357; 10.1099/ijs.0.02744-0
48. Guljamow, A., Jenke-Kodama, H., Saumweber, H., Quillardet, P., Frangeul, L., Castets, A. M., Bouchier, C., Tandeau de Marsac, N., Dittmann, E., (2007) Horizontal gene transfer of two cytoskeletal elements from a eukaryote to a cyanobacterium. Curr Biol 17, R757-759; S0960-9822(07)01632-6 [pii] 10.1016/j.cub.2007.06.063
49. Hakomori, S., Igarashi, Y., (1995) Functional role of glycosphingolipids in cell recognition and signaling. J Biochem 118, 1091-1103;
50. Hall-Stoodley, L., Costerton, J. W., Stoodley, P., (2004) Bacterial biofilms: from the natural environment to infectious diseases. Nat Rev Microbiol 2, 95-108; 10.1038/nrmicro821
51. Harel, M., Weiss, G., Lieman-Hurwitz, J., Gun, J., Lev, O., Lebendiker, M., Temper, V., Block, C., Sukenik, A., Zohary, T., Braun, S., Carmeli, S., Kaplan, A., (2013) Interactions between Scenedesmus and Microcystis may be used to clarify the role of secondary metabolites. Environ Microbiol Rep 5, 97-104; 10.1111/j.1758-2229.2012.00366.x
52. Harke, M. J., Gobler, C. J., (2013) Global transcriptional responses of the toxic cyanobacterium, Microcystis aeruginosa, to nitrogen stress, phosphorus stress, and growth on organic matter. PLoS One 8, e69834; 10.1371/journal.pone.0069834 PONE-D-13-10764 [pii]
53. Hassler, C. S., Schoemann, V., Nichols, C. M., Butler, E. C., Boyd, P. W., (2011) Saccharides enhance iron bioavailability to Southern Ocean phytoplankton. Proc Natl Acad Sci U S A 108, 1076-1081; 1010963108 [pii] 10.1073/pnas.1010963108
54. Henderson, R. K., Parsons, S. A., Jefferson, B., (2010) The impact of differing cell and algogenic organic matter (AOM) characteristics on the coagulation and flotation of algae. Water Res 44, 3617-3624; S0043-1354(10)00256-3 [pii] 10.1016/j.watres.2010.04.016
55. Hesse, K., Dittmann, E., Börner, T., (2001) Consequences of impaired microcystin production for light-dependent growth and pigmentation of Microcystis aeruginosa PCC 7806. FEMS Microbiology Ecology 37, 39-43; http://dx.doi.org/10.1016/S0168-6496(01)00142-8
56. Hisbergues, M., Christiansen, G., Rouhiainen, L., Sivonen, K., Borner, T., (2003) PCR-based identification of microcystin-producing genotypes of different cyanobacterial genera. Arch Microbiol 180, 402-410; 10.1007/s00203-003-0605-9
5 - References 112
57. Huang, X., Madan, A., (1999) CAP3: A DNA sequence assembly program. Genome Res 9, 868-877;
58. Hudnell, H. K., Boyer, G., in Cyanobacterial Harmful Algal Blooms: State of the Science and Research Needs. (Springer New York, 2008), vol. 619, pp. 153-165. 10.1007/978-0-387-75865-7_7
59. Humbert, J. F., Barbe, V., Latifi, A., Gugger, M., Calteau, A., Coursin, T., Lajus, A., Castelli, V., Oztas, S., Samson, G., Longin, C., Medigue, C., de Marsac, N. T., (2013) A tribute to disorder in the genome of the bloom-forming freshwater cyanobacterium Microcystis aeruginosa. PLoS One 8, e70747; 10.1371/journal.pone.0070747 PONE-D-13-09234 [pii]
60. Imamura, S., Asayama, M., Takahashi, H., Tanaka, K., Shirai, M., (2003) Antagonistic dark/light-induced SigB/SigD, group 2 sigma factors, expression through redox potential and their roles in cyanobacteria. FEBS Lett 554, 357-362; S0014579303011888 [pii]
61. Ishida, K., Matsuda, H., Murakami, M., Yamaguchi, K., (1997) Kawaguchipeptin B, an antibacterial cyclic undecapeptide from the cyanobacterium Microcystis aeruginosa. J Nat Prod 60, 724-726; 10.1021/np970146k np970146k [pii]
62. Ishitsuka, M. O., Kusumi, T., Kakisawa, H., Kaya, K., Watanabe, M. M., (1990) Microviridin. A novel tricyclic depsipeptide from the toxic cyanobacterium Microcystis viridis. Journal of the American Chemical Society 112, 8180-8182; 10.1021/ja00178a060
63. Jähnichen, S., Ihle, T., Petzoldt, T., Benndorf, J., (2007) Impact of inorganic carbon availability on microcystin production by Microcystis aeruginosa PCC 7806. Appl Environ Microbiol 73, 6994-7002; AEM.01253-07 [pii] 10.1128/AEM.01253-07
64. Kaebernick, M., Neilan, B. A., Borner, T., Dittmann, E., (2000) Light and the transcriptional response of the microcystin biosynthesis gene cluster. Appl Environ Microbiol 66, 3387-3392;
65. Kaplan, A., Harel, M., Kaplan-Levy, R. N., Hadas, O., Sukenik, A., Dittmann, E., (2012) The languages spoken in the water body (or the biological role of cyanobacterial toxins). Front Microbiol 3, 138; 10.3389/fmicb.2012.00138
66. Karlsson, B., Vaara, T., Lounatmaa, K., Gyllenberg, H., (1983) Three-dimensional structure of the regularly constructed surface layer from Synechocystis sp. strain CLII. J Bacteriol 156, 1338-1343;
67. Kehr, J. C., Dittmann, E., (2015) Biosynthesis and function of extracellular glycans in cyanobacteria. Life (Basel) 5, 164-180; life5010164 [pii] 10.3390/life5010164
68. Kehr, J. C., Gatte Picchi, D., Dittmann, E., (2011) Natural product biosyntheses in cyanobacteria: A treasure trove of unique enzymes. Beilstein J Org Chem 7, 1622-1635; 10.3762/bjoc.7.191
5 - References 113
69. Kehr, J. C., Zilliges, Y., Springer, A., Disney, M. D., Ratner, D. D., Bouchier, C., Seeberger, P. H., de Marsac, N. T., Dittmann, E., (2006) A mannan binding lectin is involved in cell-cell attachment in a toxic strain of Microcystis aeruginosa. Mol Microbiol 59, 893-906; MMI5001 [pii] 10.1111/j.1365-2958.2005.05001.x
70. Kessel, M., Eloff, J., (1975) The ultrastructure and development of the colonial sheath of Microcystis marginata. Archives of Microbiology 106, 209-214; 10.1007/bf00446525
71. Koksharova, O., Schubert, M., Shestakov, S., Cerff, R., (1998) Genetic and biochemical evidence for distinct key functions of two highly divergent GAPDH genes in catabolic and anabolic carbon flow of the cyanobacterium Synechocystis sp. PCC 6803. Plant Mol Biol 36, 183-194;
72. Komárek, J., Suesswasserflora von Mitteleuropa Bd. 19/1: Cyanoprokaryota I. Chroococcales. (Spektrum Akademischer Verlag, 1998),
73. Kopf, M., Klahn, S., Scholz, I., Hess, W. R., Voss, B., (2015) Variations in the non-coding transcriptome as a driver of inter-strain divergence and physiological adaptation in bacteria. Sci Rep 5, 9560; srep09560 [pii] 10.1038/srep09560
74. Koressaar, T., Remm, M., (2007) Enhancements and modifications of primer design program Primer3. Bioinformatics 23, 1289-1291; btm091 [pii] 10.1093/bioinformatics/btm091
75. Kulkarni, H. M., Jagannadham, M. V., (2014) Biogenesis and multifaceted roles of outer membrane vesicles from Gram-negative bacteria. Microbiology 160, 2109-2121; mic.0.079400-0 [pii] 10.1099/mic.0.079400-0
76. Kulp, A., Kuehn, M. J., (2010) Biological functions and biogenesis of secreted bacterial outer membrane vesicles. Annu Rev Microbiol 64, 163-184; 10.1146/annurev.micro.091208.073413
77. Labrie, S. J., Samson, J. E., Moineau, S., (2010) Bacteriophage resistance mechanisms. Nat Rev Microbiol 8, 317-327; nrmicro2315 [pii] 10.1038/nrmicro2315
78. Larsen, L. K., Moore, R. E., Patterson, G. M., (1994) beta-Carbolines from the blue-green alga Dichothrix baueriana. J Nat Prod 57, 419-421;
79. Li, M., Zhu, W., Gao, L., Lu, L., (2012) Changes in extracellular polysaccharide content and morphology of Microcystis aeruginosa at different specific growth rates. Journal of Applied Phycology 25, 1023-1030; 10.1007/s10811-012-9937-7
80. Makower, A. K., Schuurmans, J. M., Groth, D., Zilliges, Y., Matthijs, H. C., Dittmann, E., (2014) Transcriptomics-aided dissection of the intracellular and extracellular roles of microcystin in Microcystis aeruginosa PCC 7806. Appl Environ Microbiol 81, 544-554; AEM.02601-14 [pii] 10.1128/AEM.02601-14
81. Mandal, S., Rath, J., Extremophilic Cyanobacteria For Novel Drug Development. (Springer International Publishing, 2014),
82. Martin, M., (2011) Cutadapt removes adapter sequences from high-throughput sequencing reads. EMBnet.journal 17, 10.14806/ej.17.1.200
5 - References 114
pp. 10-12 83. Meeks, J. C., Castenholz, R. W., (1971) Growth and photosynthesis in an
extreme thermophile, Synechococcus lividus (Cyanophyta). Arch Mikrobiol 78, 25-41;
84. Meissner, S., Fastner, J., Dittmann, E., (2013) Microcystin production revisited: conjugate formation makes a major contribution. Environ Microbiol 15, 1810-1820; 10.1111/1462-2920.12072
85. Meissner, S., Steinhauser, D., Dittmann, E., (2014) Metabolomic analysis indicates a pivotal role of the hepatotoxin microcystin in high light adaptation of Microcystis. Environ Microbiol, 10.1111/1462-2920.12565
86. Mikami, K., Kanesaki, Y., Suzuki, I., Murata, N., (2002) The histidine kinase Hik33 perceives osmotic stress and cold stress in Synechocystis sp PCC 6803. Mol Microbiol 46, 905-915; 3202 [pii]
87. Milkowski, C., Quinones, A., Hagemann, M., (1998) A DNA fragment from the cyanobacterium Synechocystis sp. PCC 6803 mediates gene expression inducible by osmotic stress in E. coli. Curr Microbiol 37, 108-116;
88. Miller, T. R., Beversdorf, L., Chaston, S. D., McMahon, K. D., (2013) Spatiotemporal molecular analysis of cyanobacteria blooms reveals Microcystis--Aphanizomenon interactions. PLoS One 8, e74933; 10.1371/journal.pone.0074933 PONE-D-13-18487 [pii]
89. Mosteller, F. a. F., R. A., (1948) Questions and Answers. The American Statistician 2, pp. 30-31; 10.2307/2681650
90. Neilan, B. A., Pearson, L. A., Muenchhoff, J., Moffitt, M. C., Dittmann, E., (2012) Environmental conditions that influence toxin biosynthesis in cyanobacteria. Environ Microbiol 15, 1239-1253; 10.1111/j.1462-2920.2012.02729.x
91. Neuhof, T., Schmieder, P., Preussel, K., Dieckmann, R., Pham, H., Bartl, F., von Dohren, H., (2005) Hassallidin A, a glycosylated lipopeptide with antifungal activity from the cyanobacterium Hassallia sp. J Nat Prod 68, 695-700; 10.1021/np049671r
92. Omata, T., Price, G. D., Badger, M. R., Okamura, M., Gohta, S., Ogawa, T., (1999) Identification of an ATP-binding cassette transporter involved in bicarbonate uptake in the cyanobacterium Synechococcus sp. strain PCC 7942. Proc Natl Acad Sci U S A 96, 13571-13576;
93. Osanai, T., Oikawa, A., Azuma, M., Tanaka, K., Saito, K., Hirai, M. Y., Ikeuchi, M., (2011) Genetic engineering of group 2 sigma factor SigE widely activates expressions of sugar catabolic genes in Synechocystis species PCC 6803. J Biol Chem 286, 30962-30971; M111.231183 [pii] 10.1074/jbc.M111.231183
94. Otero, A., Vincenzini, M., (2003) Extracellular polysaccharide synthesis by Nostoc strains as affected by N source and light intensity. J Biotechnol 102, 143-152; S0168165603000221 [pii]
95. Otsuka, S., Suda, S., Shibata, S., Oyaizu, H., Matsumoto, S., Watanabe, M. M., (2001) A proposal for the unification of five species of the cyanobacterial genus Microcystis Kutzing ex Lemmermann 1907 under the
5 - References 115
rules of the Bacteriological Code. Int J Syst Evol Microbiol 51, 873-879; 10.1099/00207713-51-3-873
96. Otten, T. G., Paerl, H. W., (2011) Phylogenetic inference of colony isolates comprising seasonal Microcystis blooms in Lake Taihu, China. Microb Ecol 62, 907-918; 10.1007/s00248-011-9884-x
97. Ozaki, K., Ohta, A., Iwata, C., Horikawa, A., Tsuji, K., Ito, E., Ikai, Y., Harada, K., (2008) Lysis of cyanobacteria with volatile organic compounds. Chemosphere 71, 1531-1538; S0045-6535(07)01494-4 [pii] 10.1016/j.chemosphere.2007.11.052
98. Paerl, H. W., (2014) Mitigating harmful cyanobacterial blooms in a human- and climatically-impacted world. Life (Basel) 4, 988-1012; life4040988 [pii] 10.3390/life4040988
99. Paerl, H. W., Otten, T. G., (2013) Harmful cyanobacterial blooms: causes, consequences, and controls. Microb Ecol 65, 995-1010; 10.1007/s00248-012-0159-y
100. Pankratova, E. M., Vakhrushev, A. S., (1969) [Utilization by higher plants of nitrogen fixed from the atmosphere by blue-green algae]. Mikrobiologiia 38, 1080-1084;
101. Parveen, B., Ravet, V., Djediat, C., Mary, I., Quiblier, C., Debroas, D., Humbert, J. F., (2013) Bacterial communities associated with Microcystis colonies differ from free-living communities living in the same ecosystem. Environ Microbiol Rep 5, 716-724; 10.1111/1758-2229.12071
102. Penn, K., Wang, J., Fernando, S. C., Thompson, J. R., (2014) Secondary metabolite gene expression and interplay of bacterial functions in a tropical freshwater cyanobacterial bloom. ISME J 8, 1866-1878; ismej201427 [pii] 10.1038/ismej.2014.27
103. Peuthert, A., Chakrabarti, S., Pflugmacher, S., (2007) Uptake of microcystins-LR and -LF (cyanobacterial toxins) in seedlings of several important agricultural plant species and the correlation with cellular damage (lipid peroxidation). Environ Toxicol 22, 436-442; 10.1002/tox.20266
104. Pfaffl, M. W., (2001) A new mathematical model for relative quantification in real-time RT-PCR. Nucleic Acids Res 29, e45;
105. Price, G. D., Shelden, M. C., Howitt, S. M., (2011) Membrane topology of the cyanobacterial bicarbonate transporter, SbtA, and identification of potential regulatory loops. Mol Membr Biol 28, 265-275; 10.3109/09687688.2011.593049
106. Price, G. D., Woodger, F. J., Badger, M. R., Howitt, S. M., Tucker, L., (2004) Identification of a SulP-type bicarbonate transporter in marine cyanobacteria. Proc Natl Acad Sci U S A 101, 18228-18233; 0405211101 [pii] 10.1073/pnas.0405211101
107. R Core Team, R. F. f. S. C., (2013) R: A Language and Environment for Statistical Computing.
108. Rabouille, S., Thebault, J. M., Salencon, M. J., (2003) Simulation of carbon reserve dynamics in Microcystis and its influence on vertical migration with Yoyo model. C R Biol 326, 349-361;
5 - References 116
109. Rasmussen, B., Fletcher, I. R., Brocks, J. J., Kilburn, M. R., (2008) Reassessing the first appearance of eukaryotes and cyanobacteria. Nature 455, 1101-1104; nature07381 [pii] 10.1038/nature07381
110. Rippka, R., Deruelles, J., Waterbury, J. B., Herdman, M., Stanier, R. Y., (1979) Generic Assignments, Strain Histories and Properties of Pure Cultures of Cyanobacteria. J Gen Microbiol 111, 1-61; 10.1099/00221287-111-1-1
111. Robarts, R. D., Zohary, T., (1987) Temperature effects on photosynthetic capacity, respiration, and growth rates of bloom―forming cyanobacteria. New Zealand Journal of Marine and Freshwater Research 21, 391-399; 10.1080/00288330.1987.9516235
112. Sambrook, J. F., E. F. (Edward F.); Maniatis, Tom; Cold Spring Harbor Laboratory, Molecular cloning : a laboratory manual. (Cold Spring Harbor Laboratory Press, New York, ed. 2nd, 1989),
113. Sandrini, G., Matthijs, H. C., Verspagen, J. M., Muyzer, G., Huisman, J., (2013) Genetic diversity of inorganic carbon uptake systems causes variation in CO2 response of the cyanobacterium Microcystis. ISME J 8, 589-600; ismej2013179 [pii] 10.1038/ismej.2013.179
114. Saqrane, S., Oudra, B., (2009) CyanoHAB occurrence and water irrigation cyanotoxin contamination: ecological impacts and potential health risks. Toxins (Basel) 1, 113-122; 10.3390/toxins1020113 toxins-01-00113 [pii]
115. Schatz, D., Keren, Y., Vardi, A., Sukenik, A., Carmeli, S., Borner, T., Dittmann, E., Kaplan, A., (2007) Towards clarification of the biological role of microcystins, a family of cyanobacterial toxins. Environ Microbiol 9, 965-970; EMI1218 [pii] 10.1111/j.1462-2920.2006.01218.x
116. Schwarz, D., Orf, I., Kopka, J., Hagemann, M., (2014) Effects of Inorganic Carbon Limitation on the Metabolome of the Synechocystis sp. PCC 6803 Mutant Defective in glnB Encoding the Central Regulator PII of Cyanobacterial C/N Acclimation. Metabolites 4, 232-247; metabo4020232 [pii] 10.3390/metabo4020232
117. Schwyn, B., Neilands, J. B., (1987) Universal chemical assay for the detection and determination of siderophores. Anal Biochem 160, 47-56; 0003-2697(87)90612-9 [pii]
118. Seckbach, J., Algae and Cyanobacteria in Extreme Environments. (Springer Netherlands, 2007),
119. Sevilla, E., Martin-Luna, B., Vela, L., Bes, M. T., Peleato, M. L., Fillat, M. F., (2010) Microcystin-LR synthesis as response to nitrogen: transcriptional analysis of the mcyD gene in Microcystis aeruginosa PCC7806. Ecotoxicology 19, 1167-1173; 10.1007/s10646-010-0500-5
120. Shen, H., Niu, Y., Xie, P., Tao, M. I. N., Yang, X. I., (2011) Morphological and physiological changes in Microcystis aeruginosa as a result of interactions with heterotrophic bacteria. Freshwater Biology 56, 1065-1080; 10.1111/j.1365-2427.2010.02551.x
5 - References 117
121. Shibata, M., Katoh, H., Sonoda, M., Ohkawa, H., Shimoyama, M., Fukuzawa, H., Kaplan, A., Ogawa, T., (2002) Genes essential to sodium-dependent bicarbonate transport in cyanobacteria: function and phylogenetic analysis. J Biol Chem 277, 18658-18664; 10.1074/jbc.M112468200 M112468200 [pii]
122. Shibata, M., Ohkawa, H., Kaneko, T., Fukuzawa, H., Tabata, S., Kaplan, A., Ogawa, T., (2001) Distinct constitutive and low-CO2-induced CO2 uptake systems in cyanobacteria: genes involved and their phylogenetic relationship with homologous genes in other organisms. Proc Natl Acad Sci U S A 98, 11789-11794; 10.1073/pnas.191258298 191258298 [pii]
123. Shin, H. J., Matsuda, H., Murakami, M., Yamaguchi, K., (1997) Aeruginosins 205A and -B, Serine Protease Inhibitory Glycopeptides from the Cyanobacterium Oscillatoria agardhii (NIES-205). The Journal of Organic Chemistry 62, 1810-1813; 10.1021/jo961902e
124. Silhavy, T. J., Kahne, D., Walker, S., (2010) The bacterial cell envelope. Cold Spring Harb Perspect Biol 2, a000414; cshperspect.a000414 [pii] 10.1101/cshperspect.a000414
125. Sivonen, K., Leikoski, N., Fewer, D. P., Jokela, J., (2010) Cyanobactins-ribosomal cyclic peptides produced by cyanobacteria. Appl Microbiol Biotechnol 86, 1213-1225; 10.1007/s00253-010-2482-x
126. Smyth, G. K., Speed, T., (2003) Normalization of cDNA microarray data. Methods 31, 265-273; S1046202303001555 [pii]
127. Steffen, M. M., Belisle, B. S., Watson, S. B., Boyer, G. L., Bourbonniere, R. A., Wilhelm, S. W., (2015) Metatranscriptomic evidence for co-occurring top-down and bottom-up controls on toxic cyanobacterial communities. Appl Environ Microbiol 81, 3268-3276; AEM.04101-14 [pii] 10.1128/AEM.04101-14
128. Straub, C., Quillardet, P., Vergalli, J., de Marsac, N. T., Humbert, J. F., (2011) A day in the life of microcystis aeruginosa strain PCC 7806 as revealed by a transcriptomic analysis. PLoS One 6, e16208; 10.1371/journal.pone.0016208
129. Tabei, Y., Okada, K., Tsuzuki, M., (2007) Sll1330 controls the expression of glycolytic genes in Synechocystis sp. PCC 6803. Biochem Biophys Res Commun 355, 1045-1050; S0006-291X(07)00354-3 [pii] 10.1016/j.bbrc.2007.02.065
130. Talling, J. F., (1976) The Depletion of Carbon Dioxide from Lake Water by Phytoplankton. Journal of Ecology 64, 79-121; 10.2307/2258685
131. Tanaka, Y., Kimura, M., Moriyama, A., Kubo, Y., Sambe, M., Uchiyama, J., Ohta, H., in Photosynthesis Research for Food, Fuel and the Future. (Springer Berlin Heidelberg), pp. 593-595. 10.1007/978-3-642-32034-7_128
132. Thomas, R. H., Walsby, A. E., (1985) Buoyancy Regulation in a Strain of Microcystis. Microbiology 131, 799-809; doi:10.1099/00221287-131-4-799
133. Tillett, D., Dittmann, E., Erhard, M., von Dohren, H., Borner, T., Neilan, B. A., (2000) Structural organization of microcystin biosynthesis in Microcystis aeruginosa PCC7806: an integrated peptide-polyketide synthetase system. Chem Biol 7, 753-764; S1074-5521(00)00021-1 [pii]
5 - References 118
134. Tuominen, I., Pollari, M., Tyystjarvi, E., Tyystjarvi, T., (2006) The SigB sigma factor mediates high-temperature responses in the cyanobacterium Synechocystis sp. PCC6803. FEBS Lett 580, 319-323; S0014-5793(05)01471-7 [pii] 10.1016/j.febslet.2005.11.082
135. Untergasser, A., Cutcutache, I., Koressaar, T., Ye, J., Faircloth, B. C., Remm, M., Rozen, S. G., (2012) Primer3--new capabilities and interfaces. Nucleic Acids Res 40, e115; gks596 [pii] 10.1093/nar/gks596
136. Van de Waal, D. B., Verspagen, J. M., Finke, J. F., Vournazou, V., Immers, A. K., Kardinaal, W. E., Tonk, L., Becker, S., Van Donk, E., Visser, P. M., Huisman, J., (2011) Reversal in competitive dominance of a toxic versus non-toxic cyanobacterium in response to rising CO2. ISME J 5, 1438-1450; ismej201128 [pii] 10.1038/ismej.2011.28
137. Vermaas, W. F. J., in eLS. (John Wiley & Sons, Ltd, 2001). 10.1038/npg.els.0001670
138. Via-Ordorika, L., Fastner, J., Kurmayer, R., Hisbergues, M., Dittmann, E., Komarek, J., Erhard, M., Chorus, I., (2004) Distribution of microcystin-producing and non-microcystin-producing Microcystis sp. in European freshwater bodies: detection of microcystins and microcystin genes in individual colonies. Syst Appl Microbiol 27, 592-602; S0723-2020(05)70298-8 [pii] 10.1078/0723202041748163
139. Visser, P., Passarge, J., Mur, L., (1997) Modelling vertical migration of the cyanobacterium Microcystis. Hydrobiologia 349, 99-109; 10.1023/a:1003001713560
140. Walsby, A. E., (1972) Gas-filled structures providing buoyancy in photosynthetic organisms. Symp Soc Exp Biol 26, 233-250;
141. Wang, Y. W., Zhao, J., Li, J. H., Li, S. S., Zhang, L. H., Wu, M., (2010) Effects of calcium levels on colonial aggregation and buoyancy of Microcystis aeruginosa. Curr Microbiol 62, 679-683; 10.1007/s00284-010-9762-7
142. Weber, T., Blin, K., Duddela, S., Krug, D., Kim, H. U., Bruccoleri, R., Lee, S. Y., Fischbach, M. A., Muller, R., Wohlleben, W., Breitling, R., Takano, E., Medema, M. H., (2015) antiSMASH 3.0-a comprehensive resource for the genome mining of biosynthetic gene clusters. Nucleic Acids Res 43, W237-243; gkv437 [pii] 10.1093/nar/gkv437
143. Weiz, A. R., Ishida, K., Makower, K., Ziemert, N., Hertweck, C., Dittmann, E., (2011) Leader peptide and a membrane protein scaffold guide the biosynthesis of the tricyclic peptide microviridin. Chem Biol 18, 1413-1421; S1074-5521(11)00352-8 [pii] 10.1016/j.chembiol.2011.09.011
144. Welker, M., Brunke, M., Preussel, K., Lippert, I., von Dohren, H., (2004) Diversity and distribution of Microcystis (Cyanobacteria) oligopeptide chemotypes from natural communities studied by single-colony mass spectrometry. Microbiology 150, 1785-1796; 10.1099/mic.0.26947-0
5 - References 119
150/6/1785 [pii] 145. Welker, M., von Dohren, H., (2006) Cyanobacterial peptides - nature's own
combinatorial biosynthesis. FEMS Microbiol Rev 30, 530-563; FMR022 [pii] 10.1111/j.1574-6976.2006.00022.x
146. Werz, D. B., Ranzinger, R., Herget, S., Adibekian, A., von der Lieth, C. W., Seeberger, P. H., (2007) Exploring the structural diversity of mammalian carbohydrates ("glycospace") by statistical databank analysis. ACS Chem Biol 2, 685-691; 10.1021/cb700178s
147. Whitton, B., Potts, M., Vincent, W., in The Ecology of Cyanobacteria. (Springer Netherlands, 2002), pp. 321-340. 10.1007/0-306-46855-7_12
148. Wiedner, C., Visser, P. M., Fastner, J., Metcalf, J. S., Codd, G. A., Mur, L. R., (2003) Effects of light on the microcystin content of Microcystis strain PCC 7806. Appl Environ Microbiol 69, 1475-1481;
149. Wilhelm, S. W., Boyer, G. L., (2011) Ecology: Healthy competition. Nature Clim. Change 1, 300-301;
150. Woodhouse, J. N., Kinsela, A. S., Collins, R. N., Bowling, L. C., Honeyman, G. L., Holliday, J. K., Neilan, B. A., (2015) Microbial communities reflect temporal changes in cyanobacterial composition in a shallow ephemeral freshwater lake. ISME J, ismej2015218 [pii] 10.1038/ismej.2015.218
151. Xu, H., Jiang, H., Yu, G., Yang, L., (2014) Towards understanding the role of extracellular polymeric substances in cyanobacterial Microcystis aggregation and mucilaginous bloom formation. Chemosphere 117, 815-822; S0045-6535(14)01246-6 [pii] 10.1016/j.chemosphere.2014.10.061
152. Xu, H., Paerl, H. W., Qin, B., Zhu, G., Gaoa, G., (2010) Nitrogen and phosphorus inputs control phytoplankton growth in eutrophic Lake Taihu, China. Limnology and Oceanography 55, 420-432; 10.4319/lo.2010.55.1.0420
153. Yang, J. Y., Phelan, V. V., Simkovsky, R., Watrous, J. D., Trial, R. M., Fleming, T. C., Wenter, R., Moore, B. S., Golden, S. S., Pogliano, K., Dorrestein, P. C., (2012) Primer on agar-based microbial imaging mass spectrometry. J Bacteriol 194, 6023-6028; JB.00823-12 [pii] 10.1128/JB.00823-12
154. Yang, Z., Kong, F., Shi, X., Zhang, M., Xing, P., Cao, H., (2008) CHANGES IN THE MORPHOLOGY AND POLYSACCHARIDE CONTENT OF MICROCYSTIS AERUGINOSA (CYANOBACTERIA) DURING FLAGELLATE GRAZING1. Journal of Phycology 44, 716-720; 10.1111/j.1529-8817.2008.00502.x
155. Yoshida, T., Makita, Y., Nagata, S., Tsutsumi, T., Yoshida, F., Sekijima, M., Tamura, S., Ueno, Y., (1997) Acute oral toxicity of microcystin-LR, a cyanobacterial hepatotoxin, in mice. Nat Toxins 5, 91-95; 10.1002/1522-7189(1997)5:3<91::AID-NT1>3.0.CO;2-H
156. Zhai, C., Zhang, P., Shen, F., Zhou, C., Liu, C., (2012) Does Microcystis aeruginosa have quorum sensing? FEMS Microbiol Lett 336, 38-44; 10.1111/j.1574-6968.2012.02650.x
5 - References 120
157. Zhang, J., Kobert, K., Flouri, T., Stamatakis, A., (2014) PEAR: a fast and accurate Illumina Paired-End reAd mergeR. Bioinformatics 30, 614-620; btt593 [pii] 10.1093/bioinformatics/btt593
158. Zhu, H., Ren, X., Wang, J., Song, Z., Shi, M., Qiao, J., Tian, X., Liu, J., Chen, L., Zhang, W., Integrated OMICS guided engineering of biofuel butanol-tolerance in photosynthetic Synechocystis sp. PCC 6803. Biotechnol Biofuels 6, 106; 1754-6834-6-106 [pii] 10.1186/1754-6834-6-106
159. Zilliges, Y., Kehr, J. C., Meissner, S., Ishida, K., Mikkat, S., Hagemann, M., Kaplan, A., Borner, T., Dittmann, E., (2011) The cyanobacterial hepatotoxin microcystin binds to proteins and increases the fitness of microcystis under oxidative stress conditions. PLoS One 6, e17615; 10.1371/journal.pone.0017615
160. Zilliges, Y., Kehr, J. C., Mikkat, S., Bouchier, C., de Marsac, N. T., Borner, T., Dittmann, E., (2008) An extracellular glycoprotein is implicated in cell-cell contacts in the toxic cyanobacterium Microcystis aeruginosa PCC 7806. J Bacteriol 190, 2871-2879; JB.01867-07 [pii] 10.1128/JB.01867-07
161. Zou, H., Pan, G., Chen, H., Yuan, X., (2006) Removal of cyanobacterial blooms in Taihu Lake using local soils. II. Effective removal of Microcystis aeruginosa using local soils and sediments modified by chitosan. Environ Pollut 141, 201-205; S0269-7491(05)00446-X [pii]
10.1016/j.envpol.2005.08.042
6 - Acknowledgements 121
6 ACKNOWLEDGEMENTS
any people have contributed to this study and provided great
support. First and foremost, Elke Dittmann has provided scientific
guidance, optimism and creativity, has opened opportunities,
chances and the scientific world.
During several cooperations I have encountered supporting people who took
the time for teaching and who provided their invaluable knowhow. Hans
Matthijs, Merijn Schuurmans, and Wim Ensink have introduced me into the
world of microarrays, and haven given me a friendly welcome in Amsterdam.
Detlef Groth’s support and teaching in questions of bioinformatics and statistics
created the groundwork for this study. Eric Helfrich has enthusiastically carried
out MALDI imaging experiments at the ETH Zurich and supplied his great
expertise. I also thank Fabian Horn from the GFZ Potsdam for his professional
analysis of acquired microbiome data.
A big thanks goes to the Neilan-Lab in Sydney and all lab members who warmly
welcomed me and shared their knowledge, equipment and, most of all, their
time with me.
This thesis has grown and evolved through the help, the input and new
perspective after proofreading. Thanks for your priceless help: Sven, Sarah,
Jason, and Jenny.
Starting this paragraph brings a smile to my face, because the thankyou to my
lab buddies from the whole Dittmann-Group makes me remember the help,
time, laughter, friendship, parties, cakes, mensa-mensa-mensa, and inspiration
in any aspect of life (Annika, Anne, Arthur, Chen-Lin, Douglas, Emmanuel, Eva,
Jan, Katrin, Niklas, Sabine, Sandra, Sophie, Sven)
The following people shall be thanked for being the rocks and eternal loves of
my private life: Mom and Dad, the Hallelujahs Toni, Cindy, Jenny and many
more, whose friendship makes each and every one of my days.
M
7 - Appendix 122
7 APPENDIX
7.1 DATASETS
Data-set 1: File: “data-set 1_PCC7806_All_probes_indexfile”
Detailed Information on hybridization probes used in PCC 7806-
specific microarrays
Data-set 2: File: “data-set 2_FS2-related_microarray_data”
Expression values, log2-foldchenges, and p-values obtained from
microarrays with related gene information regarding
comparisons between the Microcystis ∆mcyB mutant and the
wild type PCC 7806 and externally applied microcystin-LR
Data-set 3: File: “data-set 3_microcystin-related_microarray_data”
Expression values, log2-foldchenges, and p-values obtained from
microarrays with related gene information regarding
comparisons between FS2-exudate treated and control samples of
PCC 7806, as well as MC-treated FS2 materials, and FS2-DNA
hybridization data
Data-set 4: File: “data-set 4_mcyB-mutant_DNA_hybridization_check”
Microarray data from DNA DNA hybridization of the ∆mcyB
mutan, listing deviations between ∆mcyB and PCC 7806
Data-set 5: File: “data-set 5_microbiome_FS2”
OTU counts and taxonomic composition of the bacterial
community in the Culture of Microcystis sp. FS2
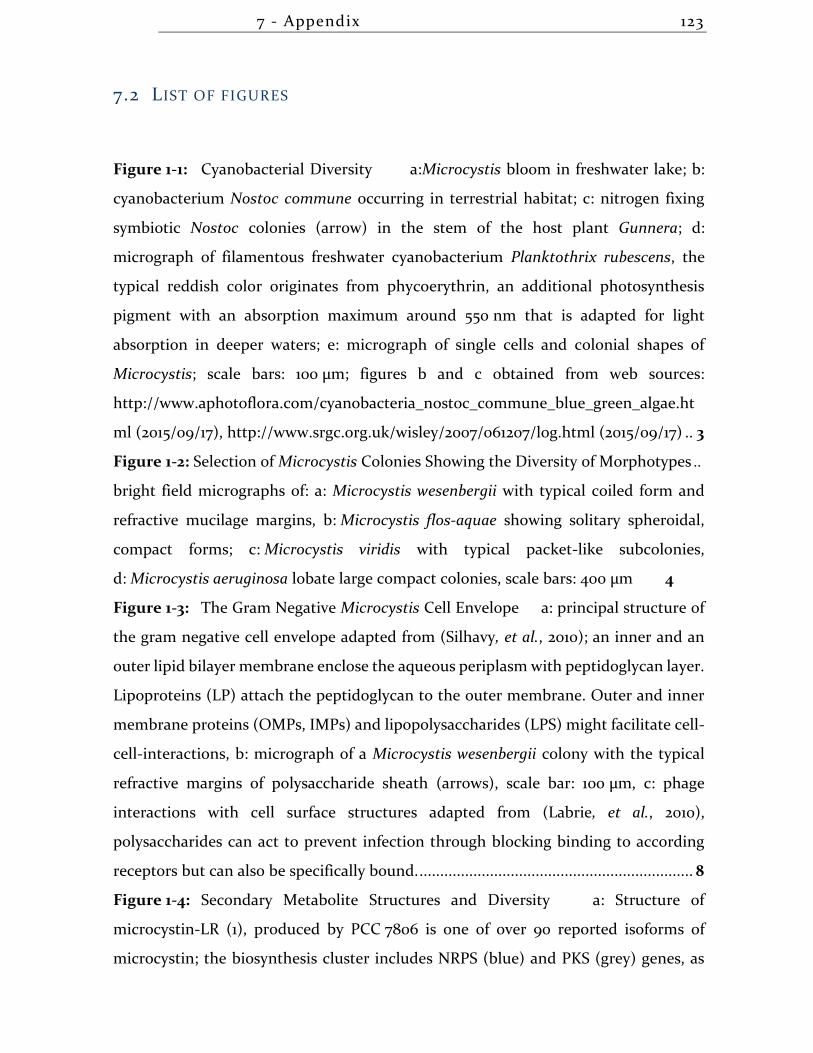
7 - Appendix 123
7.2 LIST OF FIGURES
Figure 1-1: Cyanobacterial Diversity a:Microcystis bloom in freshwater lake; b:
cyanobacterium Nostoc commune occurring in terrestrial habitat; c: nitrogen fixing
symbiotic Nostoc colonies (arrow) in the stem of the host plant Gunnera; d:
micrograph of filamentous freshwater cyanobacterium Planktothrix rubescens, the
typical reddish color originates from phycoerythrin, an additional photosynthesis
pigment with an absorption maximum around 550 nm that is adapted for light
absorption in deeper waters; e: micrograph of single cells and colonial shapes of
Microcystis; scale bars: 100 µm; figures b and c obtained from web sources:
http://www.aphotoflora.com/cyanobacteria_nostoc_commune_blue_green_algae.ht
ml (2015/09/17), http://www.srgc.org.uk/wisley/2007/061207/log.html (2015/09/17) .. 3
Figure 1-2: Selection of Microcystis Colonies Showing the Diversity of Morphotypes ..
bright field micrographs of: a: Microcystis wesenbergii with typical coiled form and
refractive mucilage margins, b: Microcystis flos-aquae showing solitary spheroidal,
compact forms; c: Microcystis viridis with typical packet-like subcolonies,
d: Microcystis aeruginosa lobate large compact colonies, scale bars: 400 µm 4
Figure 1-3: The Gram Negative Microcystis Cell Envelope a: principal structure of
the gram negative cell envelope adapted from (Silhavy, et al., 2010); an inner and an
outer lipid bilayer membrane enclose the aqueous periplasm with peptidoglycan layer.
Lipoproteins (LP) attach the peptidoglycan to the outer membrane. Outer and inner
membrane proteins (OMPs, IMPs) and lipopolysaccharides (LPS) might facilitate cell-
cell-interactions, b: micrograph of a Microcystis wesenbergii colony with the typical
refractive margins of polysaccharide sheath (arrows), scale bar: 100 µm, c: phage
interactions with cell surface structures adapted from (Labrie, et al., 2010),
polysaccharides can act to prevent infection through blocking binding to according
receptors but can also be specifically bound. .................................................................. 8
Figure 1-4: Secondary Metabolite Structures and Diversity a: Structure of
microcystin-LR (1), produced by PCC 7806 is one of over 90 reported isoforms of
microcystin; the biosynthesis cluster includes NRPS (blue) and PKS (grey) genes, as
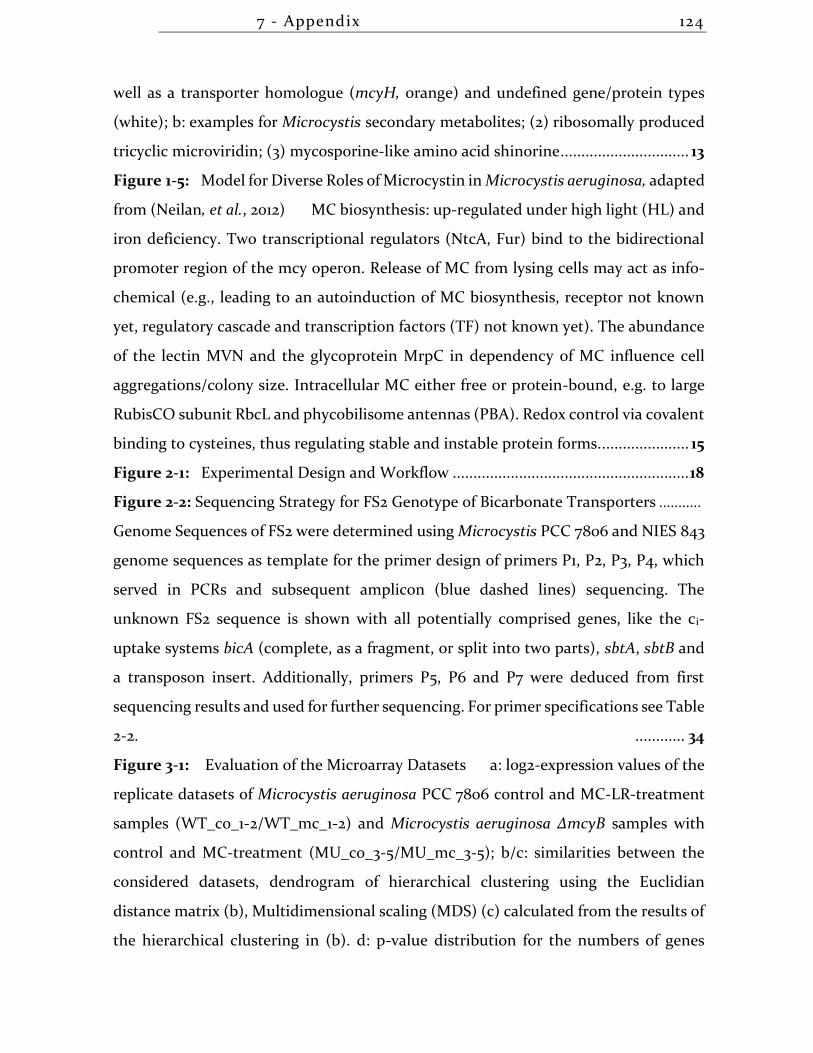
7 - Appendix 124
well as a transporter homologue (mcyH, orange) and undefined gene/protein types
(white); b: examples for Microcystis secondary metabolites; (2) ribosomally produced
tricyclic microviridin; (3) mycosporine-like amino acid shinorine ............................... 13
Figure 1-5: Model for Diverse Roles of Microcystin in Microcystis aeruginosa, adapted
from (Neilan, et al., 2012) MC biosynthesis: up-regulated under high light (HL) and
iron deficiency. Two transcriptional regulators (NtcA, Fur) bind to the bidirectional
promoter region of the mcy operon. Release of MC from lysing cells may act as info-
chemical (e.g., leading to an autoinduction of MC biosynthesis, receptor not known
yet, regulatory cascade and transcription factors (TF) not known yet). The abundance
of the lectin MVN and the glycoprotein MrpC in dependency of MC influence cell
aggregations/colony size. Intracellular MC either free or protein-bound, e.g. to large
RubisCO subunit RbcL and phycobilisome antennas (PBA). Redox control via covalent
binding to cysteines, thus regulating stable and instable protein forms. ..................... 15
Figure 2-1: Experimental Design and Workflow ......................................................... 18
Figure 2-2: Sequencing Strategy for FS2 Genotype of Bicarbonate Transporters ...........
Genome Sequences of FS2 were determined using Microcystis PCC 7806 and NIES 843
genome sequences as template for the primer design of primers P1, P2, P3, P4, which
served in PCRs and subsequent amplicon (blue dashed lines) sequencing. The
unknown FS2 sequence is shown with all potentially comprised genes, like the ci-
uptake systems bicA (complete, as a fragment, or split into two parts), sbtA, sbtB and
a transposon insert. Additionally, primers P5, P6 and P7 were deduced from first
sequencing results and used for further sequencing. For primer specifications see Table
2-2. ............ 34
Figure 3-1: Evaluation of the Microarray Datasets a: log2-expression values of the
replicate datasets of Microcystis aeruginosa PCC 7806 control and MC-LR-treatment
samples (WT_co_1-2/WT_mc_1-2) and Microcystis aeruginosa ∆mcyB samples with
control and MC-treatment (MU_co_3-5/MU_mc_3-5); b/c: similarities between the
considered datasets, dendrogram of hierarchical clustering using the Euclidian
distance matrix (b), Multidimensional scaling (MDS) (c) calculated from the results of
the hierarchical clustering in (b). d: p-value distribution for the numbers of genes
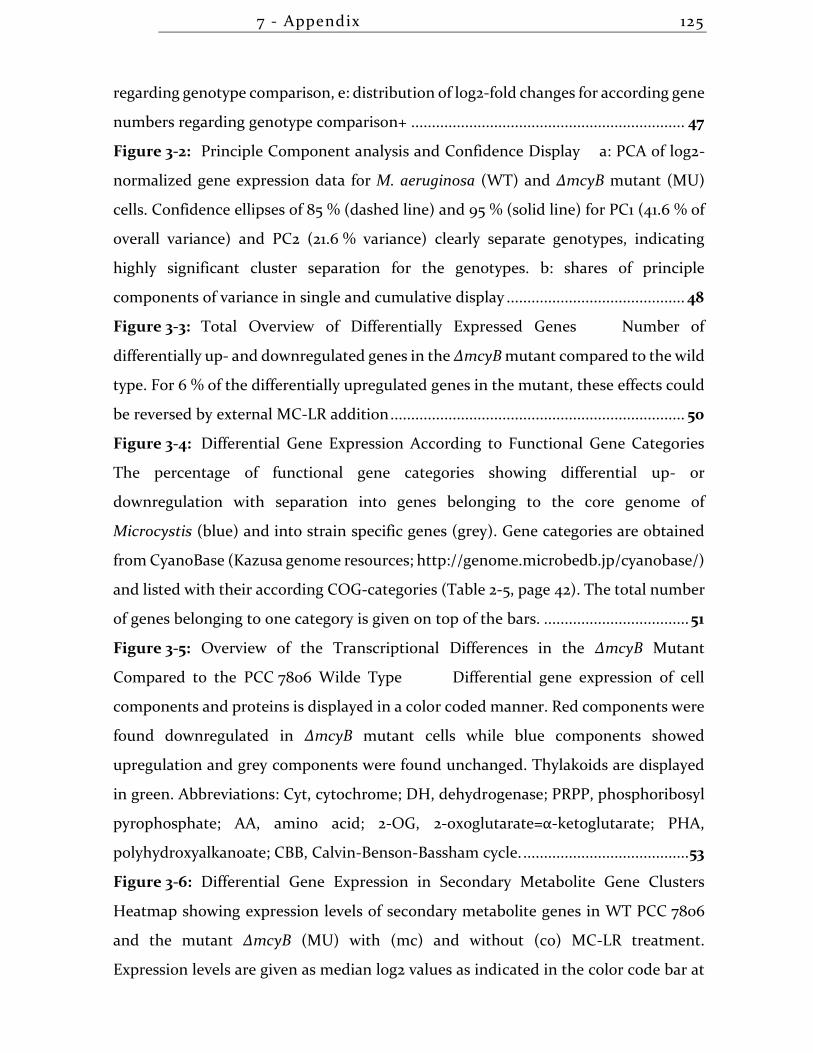
7 - Appendix 125
regarding genotype comparison, e: distribution of log2-fold changes for according gene
numbers regarding genotype comparison+ .................................................................. 47
Figure 3-2: Principle Component analysis and Confidence Display a: PCA of log2-
normalized gene expression data for M. aeruginosa (WT) and ∆mcyB mutant (MU)
cells. Confidence ellipses of 85 % (dashed line) and 95 % (solid line) for PC1 (41.6 % of
overall variance) and PC2 (21.6 % variance) clearly separate genotypes, indicating
highly significant cluster separation for the genotypes. b: shares of principle
components of variance in single and cumulative display ........................................... 48
Figure 3-3: Total Overview of Differentially Expressed Genes Number of
differentially up- and downregulated genes in the ∆mcyB mutant compared to the wild
type. For 6 % of the differentially upregulated genes in the mutant, these effects could
be reversed by external MC-LR addition ....................................................................... 50
Figure 3-4: Differential Gene Expression According to Functional Gene Categories
The percentage of functional gene categories showing differential up- or
downregulation with separation into genes belonging to the core genome of
Microcystis (blue) and into strain specific genes (grey). Gene categories are obtained
from CyanoBase (Kazusa genome resources; http://genome.microbedb.jp/cyanobase/)
and listed with their according COG-categories (Table 2-5, page 42). The total number
of genes belonging to one category is given on top of the bars. ................................... 51
Figure 3-5: Overview of the Transcriptional Differences in the ∆mcyB Mutant
Compared to the PCC 7806 Wilde Type Differential gene expression of cell
components and proteins is displayed in a color coded manner. Red components were
found downregulated in ∆mcyB mutant cells while blue components showed
upregulation and grey components were found unchanged. Thylakoids are displayed
in green. Abbreviations: Cyt, cytochrome; DH, dehydrogenase; PRPP, phosphoribosyl
pyrophosphate; AA, amino acid; 2-OG, 2-oxoglutarate=α-ketoglutarate; PHA,
polyhydroxyalkanoate; CBB, Calvin-Benson-Bassham cycle. ........................................ 53
Figure 3-6: Differential Gene Expression in Secondary Metabolite Gene Clusters
Heatmap showing expression levels of secondary metabolite genes in WT PCC 7806
and the mutant ∆mcyB (MU) with (mc) and without (co) MC-LR treatment.
Expression levels are given as median log2 values as indicated in the color code bar at
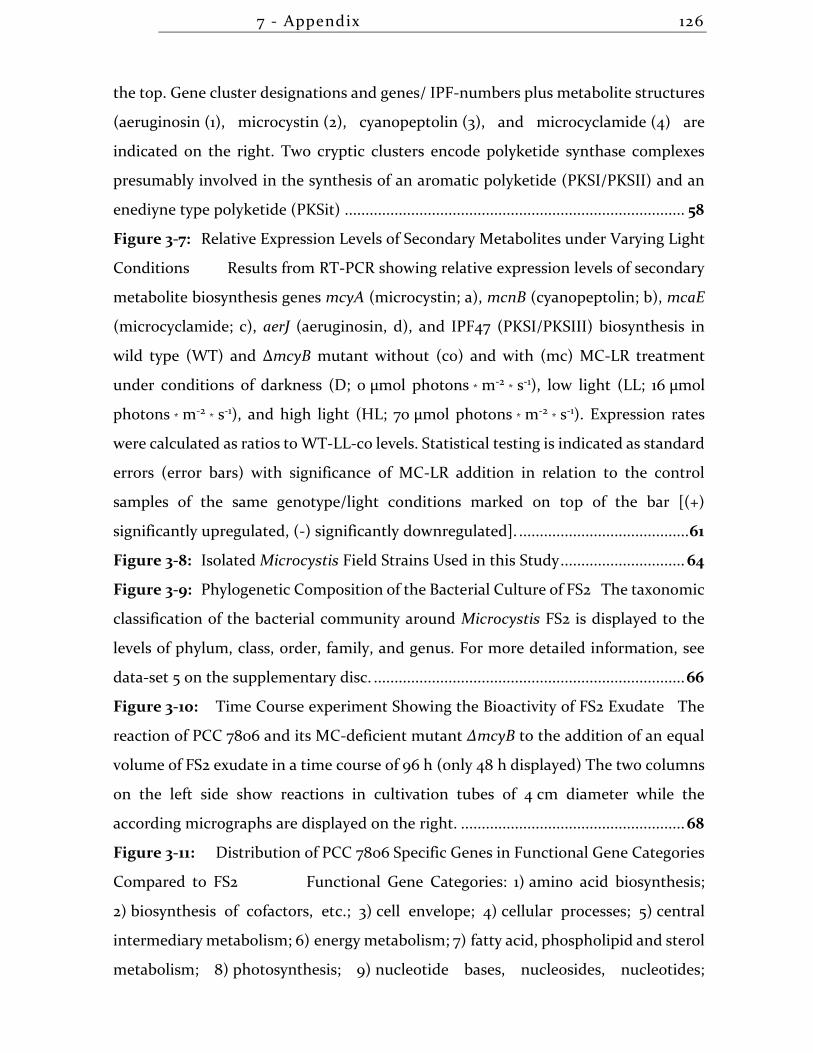
7 - Appendix 126
the top. Gene cluster designations and genes/ IPF-numbers plus metabolite structures
(aeruginosin (1), microcystin (2), cyanopeptolin (3), and microcyclamide (4) are
indicated on the right. Two cryptic clusters encode polyketide synthase complexes
presumably involved in the synthesis of an aromatic polyketide (PKSI/PKSII) and an
enediyne type polyketide (PKSit) .................................................................................. 58
Figure 3-7: Relative Expression Levels of Secondary Metabolites under Varying Light
Conditions Results from RT-PCR showing relative expression levels of secondary
metabolite biosynthesis genes mcyA (microcystin; a), mcnB (cyanopeptolin; b), mcaE
(microcyclamide; c), aerJ (aeruginosin, d), and IPF47 (PKSI/PKSIII) biosynthesis in
wild type (WT) and ∆mcyB mutant without (co) and with (mc) MC-LR treatment
under conditions of darkness (D; 0 µmol photons * m-2 * s-1), low light (LL; 16 µmol
photons * m-2 * s-1), and high light (HL; 70 µmol photons * m-2 * s-1). Expression rates
were calculated as ratios to WT-LL-co levels. Statistical testing is indicated as standard
errors (error bars) with significance of MC-LR addition in relation to the control
samples of the same genotype/light conditions marked on top of the bar [(+)
significantly upregulated, (-) significantly downregulated]. ......................................... 61
Figure 3-8: Isolated Microcystis Field Strains Used in this Study .............................. 64
Figure 3-9: Phylogenetic Composition of the Bacterial Culture of FS2 The taxonomic
classification of the bacterial community around Microcystis FS2 is displayed to the
levels of phylum, class, order, family, and genus. For more detailed information, see
data-set 5 on the supplementary disc. ........................................................................... 66
Figure 3-10: Time Course experiment Showing the Bioactivity of FS2 Exudate The
reaction of PCC 7806 and its MC-deficient mutant ∆mcyB to the addition of an equal
volume of FS2 exudate in a time course of 96 h (only 48 h displayed) The two columns
on the left side show reactions in cultivation tubes of 4 cm diameter while the
according micrographs are displayed on the right. ...................................................... 68
Figure 3-11: Distribution of PCC 7806 Specific Genes in Functional Gene Categories
Compared to FS2 Functional Gene Categories: 1) amino acid biosynthesis;
2) biosynthesis of cofactors, etc.; 3) cell envelope; 4) cellular processes; 5) central
intermediary metabolism; 6) energy metabolism; 7) fatty acid, phospholipid and sterol
metabolism; 8) photosynthesis; 9) nucleotide bases, nucleosides, nucleotides;
7 - Appendix 127
10) regulatory functions; 11) DNA replication, DNA processing; 12) transcription;
13) translation; 14) transport and binding proteins; 15) other categories;
16) hypothetical genes; 17) unknown function; 18) secondary metabolites ................. 69
Figure 3-12: Genomic Characterization of Bicarbonate Uptake Systems in
Microcystis PCC 7806 and FS2 Genomic regions of the bicarbonate uptake systems
bicA, sbtA, and cmpA-D are displayed for Microcystis PCC 7806 and FS2 with flanking
genes. For PCC 7806 the location of the discussed genes on their harboring contigs is
marked (C319, C328) ........................................................................................................ 71
Figure 3-13: Co-Cultivation of Microcystis Strains at Media with Diverging
Carbonate Concentrations Photographs of colonies with according cultivation
medium. Phenotypes of PCC 7806 under conditions of mono- and co-cultivation
zoomed out (orange box) ............................................................................................... 72
Figure 3-14: Production of Secondary Metabolites under Co-Cultivation and
Carbonate Depleted Conditions Mass specific detection of metabolites according
to their location within Microcystis colonies with cultivated on standard BG-11 agar
plates and on carbonate depleted agar plates (-CO3). The used colonies are displayed
as photographs in the left column, while signals for a specific mass are displayed in
false colors. ................................................................................................................. 74
Figure 3-15: Evaluation of the Microarray Datasets a: overall log2-expression
values of the replicate datasets of Microcystis aeruginosa PCC 7806 control samples
(WT_co_1-3) and corresponding samples treated with Microcystis FS2 spent
medium/exudate (WT_sup_1-3); b/c: similarities between the considered datasets,
dendrogram of hierarchical clustering using the Euclidian distance matrix (b),
Multidimensional scaling (MDS) (c) calculated from the results of the hierarchical
clustering in (b). d: p-value distribution for the numbers of genes, e: distribution of
log2-fold changes for according gene numbers. ............................................................ 77
Figure 3-16: Differential Gene Expression According to Functional Gene Categories
The percentage of functional gene categories showing differential up- or
downregulation with separation into genes belonging to the core genome of
Microcystis (blue) and into strain specific genes (grey). Gene categories are obtained
from CyanoBase (Kazusa genome resources; http://genome.microbedb.jp/cyanobase/)
7 - Appendix 128
and listed with their according COG-categories (Table 2-5, page 42). The total number
of genes belonging to one category is given on top of the bars. .................................. 79
Figure 3-17: Overview of the Cellular and Transcriptional Responses of PCC 7806 to
the Cell Exudate of Microcystis FS2 Differential gene expression of cell components
and proteins in PCC 7806 cells. Blue: downregulated components, red: upregulated
components, grey: unchanged components. Proteins in darker/more intense colors
represent transcriptional regulators. Green: thylakoids and chlorophyll
(transcriptionally not altered). EPS: Extracellular polysaccharides, G6PDH: glucose-6-
phosphate dehydrogenase, PPP: pentose phosphate pathway, CBB: Calvin-Benson-
Bassham cycle, PEP: phosphoenolpyruvate, PEPck: phosphoenolpyruvate
carboxykinase, Mdh: malate dehydrogenase, TCA: tricarboxylic acid cycle, Ldh: lactate
dehydrogenase, PK: pyruvate kinase, PpsA: phosphoenolpyruvate synthase, GV: gas
vesicle, AA: amino acid, α-KG: α-ketoglutarate, cph: cyanophycin, IsiA/B: iron stress
induced proteins, chl-a: chlorophyll-a, I+: cations, regulators: (OmpR, RbcR, SigE,
NtcB, IPF_5, SigB, TldD, PmbA) ..................................................................................... 81
Figure 3-18: Absorption Spectra of PCC 7806 and ∆mcyB Cultures After Treatment
with FS2 Exudate Absorption spectra were recorded after 3 and 96 h. Blue bars
mark the shift of maximal chlorophyll absorption of ca. 10 nm ................................... 83
Figure 3-19: Differential Gene Expression in Energy Metabolism Heatmap showing
expression changes of carbon metabolism genes in PCC 7806 cells after FS2 exudate
treatment and in FS2 cells after MC-LR treatment. Expression changes are given as
median log2 fold changes (lfc) as indicated in the color code bar on top. Genes are
sorted into categories of gas vesicles (GV), glucose channeling (glycolysis, pentose
phosphate way gluconeogenesis and tricarboxylic acid cycle), carbon concentrating
mechanism (CCM), and carbon storage related genes (C-storage). Gene designations
are given as IPF numbers (individual protein file numbers) and gene abbreviations
(gene). ................................................................................................................. 87
Figure 4-1 Model of the Microcystin Effects on Carbon Metabolic Processes and
Redox-Regulation ........................................................................................................... 95
7 - Appendix 129
7.3 LIST OF TABLES
Table 1-1: Summary of Ci-Uptake Systems in Microcystis ......................................... 6
Table 2-1: Biological Materials .................................................................................... 19
Table 2-2: Primers Used in this Study ......................................................................... 19
Table 2-3: Changes in Nutrient Supply for Carbon Source Adapted BG-11 .............. 27
Table 2-4: Microarray Hybridization Scheme ........................................................... 39
Table 2-5: Functional Gene Categories in Relation to COG (Cluster of Orthologous
Groups)- Categories ........................................................................................................ 42
Table 2-6: Hybridization Scheme of DNA-Microarrays ............................................ 43
Table 3-1: Differentially Expressed Genes of the ∆mcyB mutant Regarding
Photosynthesis and Respirational Genes ....................................................................... 54
Table 3-2: Differentially Expressed Genes of the Functional Category of Central
intermediary and Energy Metabolism in the ∆mcyB mutant Compared to the
PCC 7806 Wild Type ........................................................................................................55
Table 3-3: Characteristics of Isolated Microcystis Field Strains ............................... 67
Table 3-4: Genomic Resources for Secondary Metabolite Production in Microcystis
PCC 7806 and FS2 ........................................................................................................... 70
Table 3-5: Physico-Chemical Characteristics of FS2-treated Media ......................... 75
Table 3-6: Transcriptional Changes of Stress Markers and Transcriptional
Regulators 85
Table 3-7: Growth Rates of PCC 7806 and ∆mcyB After FS2 Exudate Treatment ... 86
7 - Appendix 130
7.4 PUBLICATIONS
1) (Weiz, et al., 2011)
Weiz, A. R., Ishida, K., Makower, K., Ziemert, N., Hertweck, C., Dittmann, E., (2011) Leader peptide and a membrane protein scaffold guide the biosynthesis of the tricyclic peptide microviridin. Chem Biol 18, 1413-1421; S1074-5521(11)00352-8 [pii]
2) (Makower, et al., 2014)
Makower, A. K., Schuurmans, J. M., Groth, D., Zilliges, Y., Matthijs, H. C., Dittmann, E., (2014) Transcriptomics-aided dissection of the intracellular and extracellular roles of microcystin in Microcystis aeruginosa PCC 7806. Appl Environ Microbiol 81, 544-554; AEM.02601-14 [pii]
3) (D'Agostino, et al., 2015)
D'Agostino, P. M., Woodhouse, J. N., Makower, A. K., Yeung, A. C., Ongley, S. E., Micallef, M. L., Moffitt, M. C., Neilan, B. A., (2015) Advances in genomics, transcriptomics and proteomics of toxin-producing cyanobacteria. Environ Microbiol Rep, 10.1111/1758-2229.12366
4) A manuscript titled “Multifaceted Interactions between a toxic and a
non-toxic Microcystis strain” is shortly to be submitted.
5) Other:
Audio contribution to DLF radio report on cyanobacterial toxins:
http://bit.ly/1KOekVR
7 - Appendix 131
6) Contributions in Conferences:
Date Conference Contribution
2016 ISPP
15th International
Symposium on
Phototrophic
Prokaryotes
Poster presentation: “The
Microcystis Network -
Multifaceted roles of
intercellular communication
in Microcystis”
2014 VAAM workshop
"Biology of natural
products-producing
microorganisms"
Talk: “Transcriptomic
Dissection of the
Intracellular and the
Extracellular role of
Microcystin in M.
aeruginosa PCC 7806”
2013 ESF-EMBO Symposium
“Molecular Bioenergetics
Of Cyanobacteria:
Shaping The
Environment”
Poster presentation:
“Communication and
Heterogeneity among
Microcystis colonies”
2011
8th European Workshop
on Molecular Biology of
Cyanobacteria
Poster presentation:
“Understanding Microcystis
Colony Formation
Regarding Molecular and
Ecological Aspects”
2011 ESF-EMBO Symposium
Molecular Bioenergetics
of Cyanobacteria: From
Cell to Community
Poster presentation:
“Secondary Metabolite
Expression-Regulatory
Aspects of the Depsipeptide
Microviridin”