Embed Size (px)
Citation preview

Vol.18 No.1 JOURNAL OF TROPICAL METEOROLOGY March 2012
Article ID: 1006-8775(2012) 01-0081-08
THE STATISTICAL CHARACTERISTICS OF IMPACT OF THE WESTWARD-GOING TROPICAL CYCLONES ON RAINFALL IN YUNNAN
PLATEAU
GUO Rong-fen (郭荣芬)1, XIAO Zi-niu (肖子牛)
2, LI Ying (李 英)
3, SHI Wen-jing (石文静)
4
(1. Yunnan Meteorological Observatory, Kunming 650034 China; 2. China Meteorological Administration Training Centre, Beijing 100081 China; 3. Chinese Academy of Meteorological Sciences, Beijing 100081
China; 4. Nanjing Institute of Information Engineering, Nanjing 210044 China)
Abstract: Using data available from the Retrieval System Based on Yearbooks of Tropical Cyclones over the Western North Pacific, NCEP/NCAR reanalysis daily data and observed precipitation data for 1959 to 2007 in Yunnan, a province located in a low-latitude plateau, this work analyzes the climatic characteristics and the corresponding large-scale circulation patterns related to the western North Pacific westward moving TCs (WMTCs). Its impacts on the rainfall in the Yunnan Plateau are studied. Results show that WMTCs happen almost every year, mainly from July to September. It shows a downward trend in decadal variation. Nearly the entire Yunnan area is affected by them but the eastern part experiences the most severe influences. Most of the WMTCs migrate from the South China Sea, primarily make landfall in Hainan and Guangdong and enter the Northern Bay. The tracks of these typhoons can be classified into five categories, in which the most significant impact results from those making landfall in Guangdong. All categories of the tropical cyclones can induce province-wide heavy rainfall in Yunnan. Super typhoons bring about the heaviest and most extensive rainfall over the low-latitude plateau while the associated circulation pattern is marked with a dominant 500 hPa meridional circulation at middle latitudes, an active monsoon depression and Intertropical Convection Zone (ITCZ) at low latitudes and a westward-located South Asia High at 100 hPa, which is favorable for tropical cyclones to travel westward. WMTCs tend to go westward into the interior part of China if the subtropical high extends its westernmost ridge point to the northeast of Yunnan, or expands its periphery anti-cyclonic circulation to the Tibetan Plateau, or merges with the Qinghai-Tibetan high.
Key words: westward moving TCs; precipitation in Yunnan; statistical characteristics; circulation background
CLC number: P444 Document code: A doi: 10.3969/j.issn.1006-8775.2012.01.009
Received 2010-12-25; Revised 2011-12-02; Accepted 2012-01-15 Foundation item: Key National Project for Fundamental Research and Development (2009CB421504); National Science Foundation of China (40975032); Special Project for Forecasters in Yunnan Meteorological Bureau (YB200901) Biography: GUO Rong-fen, senior engineer, M.S., primarily undertaking short-term forecasting and research on mesoscale meteorology. Corresponding author: GUO Rong-fen, e-mail: [email protected]
1 INTRODUCTION
Though located in the interior plateau, Yunnan province is one of the lands to suffer the impact of the tropical cyclones (TCs) from the western North Pacific (including the South China Sea, the same below) every year. In many studies[1-9], the interannual variations, seasonal distribution, intensity distribution, track types and source locations of these TCs have been analyzed climatologically. Lei et al.[10] studied latitudinal distribution of their activity. Some literature presented the climatological statistics of the TCs that made landfall in China and the relationship between TCs and precipitation[11-13]. Wavelet analysis was conducted for the annual frequency of the TCs
that made landfall in Guangdong, as well as the climatological pattern of the first dates of landfall each year (Liu[14]). The related studies also investigated the thermal structure of the western North Pacific warm pool, the air-sea couplings and the impacts of sea surface temperature on TCs. The works listed above have described basically all aspects of the spatial and temporal characteristics of the TCs in the western North Pacific, but none of them specifically focuses on those affecting the precipitation in Yunnan.
At present, most of the research on TCs affecting Yunnan is case study on TCs traveling westward from the South China Sea and with statistics spanning from

82 Journal of Tropical Meteorology Vol.18
82
1970 to 1980[18], lacking systematic study on their weather and climate patterns. Following a new standard on TC categories issued by the China Meteorological Administration, this paper performs a statistical study on the TCs of the western North Pacific over the past 50 years that affected the precipitation in Yunnan to understand their climatological features.
2 DATA AND METHODS
For statistical determination of the frequency of these TCs over the period 1959-2007, their total number, as determined from the “Retrieval System Based on Yearbooks of Tropical Cyclones over the Western North Pacific”—edited by Shanghai Typhoon Institute of China Meteorological Administration (CMA), is used. To maintain the reliability and completeness of rainfall data for Yunnan, datasets of daily surface rainfall (covering the time from preceding 2000 Beijing Standard Time (BST) to current 2000 BST, the same below) from weather stations across the province from 1959 to 2007 are based to identify severe rain events. For diagnostics of the circulation, the daily 2.5°×2.5° reanalysis from National Centers for Environmental Prediction/National Center for Atmospheric Research (NCEP/NCAR, USA) flow and geopotential height fields at 100 hPa and 500 hPa are used.
The six levels of TC strength issued by CMA lately are used to categorize the TCs that affect the precipitation in Yunnan. Following relevant specifications of Yunnan Meteorological Observatory, province-wide heavy rains are defined to take place if 22 or more weather stations across the province measure this amount and unusually heavy rains are said to occur across the province if they are reported at nine or more weather stations.
3 SPATIAL AND TEMPORAL DISTRIBUTION OF THE TCS
3.1 Interdecadal distribution
According to a general survey, there are a total of 1652 TCs generated over the western North Pacific from 1959 to 2007, or a yearly average of 33.5, and 147 of the TCs affected Yunnan, or a yearly average of 3. TCs generated over the western North Pacific affect Yunnan every year, with 1989 being the year of most influence (7 TCs) and 1999, 2000, 2002 and 2004 being the years without any impacts from the TCs. For the interdecadal distribution (Figure 1), the overall number of the TCs generated in this region tends to decrease, with the 1960s being the decade with the most cyclogenesis and a corresponding peak of influence for Yunnan and the 2000s being the one with the least cyclogenesis and a corresponding valley
of influence for Yunnan.
401368
325 304
222
39 33 35 20 180
200
400
600
1960 1970 1980 1990 2000
Total TC number TC number with influence
Figure 1. Frequency of interdecadal distribution of the TCs affecting the precipitation in Yunnan from 1959 to 2007. The abscissa stands for the decade.
3.2 Monthly and sub-monthly distribution
Like most synoptic systems, the TC is characterized with obvious seasonality. Over the 49-year period, it occurs in every month (Table 1), with the level of activity being mild from January to May, increasingly active from March to November, staying at a high level from June to September (and September sees the most TCs), and increasingly inactive from October to December. For those that affect Yunnan, they only occur from June to October over a cycle marked by four stages of low, rising, high, and decreasing rates. Broken down according to the level of influence, the affecting TC is mild in the first two thirds of June, increasingly active in the last third of June through the second third of July, highly active in the last third of July through the last third of August, and increasingly inactive in September and October. July through September is a period of high-frequency impacts, taking up 82.7% of the total number of TCs, while October is the month with the least influence, accounting for just 3.5% of the total. On a monthly basis, the Yunnan-influencing TCs occur less often in the first two thirds of the month than in the last third of the month.
Table 1. Monthly distribution of TCs and times of precipitation being affected by them in Yunnan from 1959 to 2007.
Month Jan. Feb. Mar. Apr. May Jun.Number of TCs 32 17 26 42 70 122
Affecting times 0 0 0 0 0 20
Month 7 8 9 10 11 12 Number of TCs 263 377 299 221 135 75
Affecting times 46 45 31 5 0 0
3.3 Geographic distribution
The precipitation affected by these TCs covers 16 prefectures of the province. Severe Typhoon Georgette (8611) is the TC that has the largest domain of influence and rain rate of all. Except for Diqing and Xishuangbanna, 15 prefectures were affected by it, with 11 of them measuring their extreme rainfall in history. Figure 2 shows that Wenshan and Honghe in the southeast part and Puer and Xishuangbanna in the
No.1 GUO Rong-fen (郭荣芬), XIAO Zi-niu (肖子牛) et al. 83
83
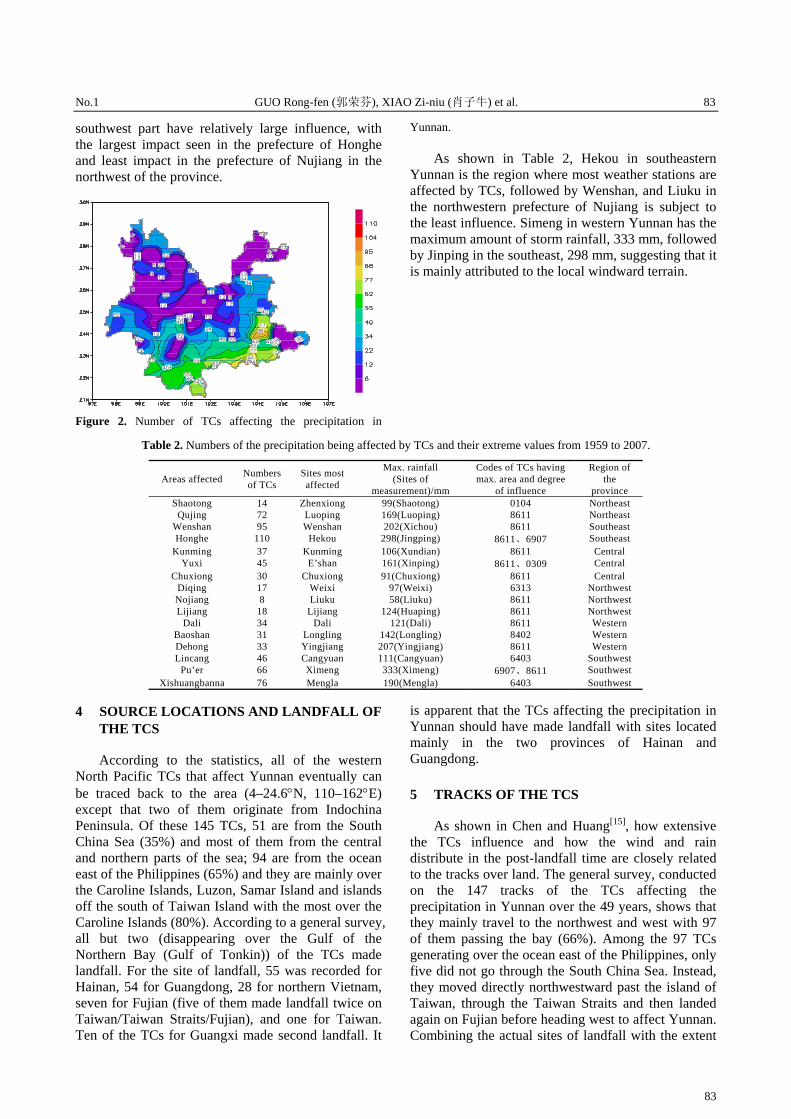
southwest part have relatively large influence, with the largest impact seen in the prefecture of Honghe and least impact in the prefecture of Nujiang in the northwest of the province.
Figure 2. Number of TCs affecting the precipitation in
Yunnan.
As shown in Table 2, Hekou in southeastern Yunnan is the region where most weather stations are affected by TCs, followed by Wenshan, and Liuku in the northwestern prefecture of Nujiang is subject to the least influence. Simeng in western Yunnan has the maximum amount of storm rainfall, 333 mm, followed by Jinping in the southeast, 298 mm, suggesting that it is mainly attributed to the local windward terrain.
Table 2. Numbers of the precipitation being affected by TCs and their extreme values from 1959 to 2007.
Areas affected Numbers of TCs
Sites most affected
Max. rainfall (Sites of
measurement)/mm
Codes of TCs having max. area and degree
of influence
Region of the
province Shaotong 14 Zhenxiong 99(Shaotong) 0104 Northeast
Qujing 72 Luoping 169(Luoping) 8611 Northeast Wenshan 95 Wenshan 202(Xichou) 8611 Southeast Honghe 110 Hekou 298(Jingping) 8611、6907 Southeast
Kunming 37 Kunming 106(Xundian) 8611 Central Yuxi 45 E’shan 161(Xinping) 8611、0309 Central
Chuxiong 30 Chuxiong 91(Chuxiong) 8611 Central Diqing 17 Weixi 97(Weixi) 6313 Northwest Nojiang 8 Liuku 58(Liuku) 8611 Northwest Lijiang 18 Lijiang 124(Huaping) 8611 Northwest
Dali 34 Dali 121(Dali) 8611 Western Baoshan 31 Longling 142(Longling) 8402 Western Dehong 33 Yingjiang 207(Yingjiang) 8611 Western Lincang 46 Cangyuan 111(Cangyuan) 6403 Southwest
Pu’er 66 Ximeng 333(Ximeng) 6907、8611 Southwest Xishuangbanna 76 Mengla 190(Mengla) 6403 Southwest
4 SOURCE LOCATIONS AND LANDFALL OF THE TCS
According to the statistics, all of the western North Pacific TCs that affect Yunnan eventually can be traced back to the area (4–24.6°N, 110–162°E) except that two of them originate from Indochina Peninsula. Of these 145 TCs, 51 are from the South China Sea (35%) and most of them from the central and northern parts of the sea; 94 are from the ocean east of the Philippines (65%) and they are mainly over the Caroline Islands, Luzon, Samar Island and islands off the south of Taiwan Island with the most over the Caroline Islands (80%). According to a general survey, all but two (disappearing over the Gulf of the Northern Bay (Gulf of Tonkin)) of the TCs made landfall. For the site of landfall, 55 was recorded for Hainan, 54 for Guangdong, 28 for northern Vietnam, seven for Fujian (five of them made landfall twice on Taiwan/Taiwan Straits/Fujian), and one for Taiwan. Ten of the TCs for Guangxi made second landfall. It
is apparent that the TCs affecting the precipitation in Yunnan should have made landfall with sites located mainly in the two provinces of Hainan and Guangdong.
5 TRACKS OF THE TCS
As shown in Chen and Huang[15], how extensive the TCs influence and how the wind and rain distribute in the post-landfall time are closely related to the tracks over land. The general survey, conducted on the 147 tracks of the TCs affecting the precipitation in Yunnan over the 49 years, shows that they mainly travel to the northwest and west with 97 of them passing the bay (66%). Among the 97 TCs generating over the ocean east of the Philippines, only five did not go through the South China Sea. Instead, they moved directly northwestward past the island of Taiwan, through the Taiwan Straits and then landed again on Fujian before heading west to affect Yunnan. Combining the actual sites of landfall with the extent

84 Journal of Tropical Meteorology Vol.18
84
of influence on the precipitation in Yunnan, the authors classified the TC tracks into five patterns (Figure 3).
Figure 3. Moving tracks of the TCs that affect the precipitation of Yunnan.
(1) Pattern of southern tracks (P1). Thirty-nine TCs have this pattern of tracks, taking up 26% of the total. With this pattern, the TCs mainly affect Honghe and Wenshan in the south of the province and cause moderate to heavy rain there. A few typhoon-scale TCs could continue to travel to the northwest to come close to the southeast of the province and result in precipitation over most parts of Yunnan.
(2) Pattern of Hainan landfall (P2). Twenty-three TCs have this pattern of tracks, taking up 16%. With this pattern, the TCs mainly affect Wenshan, Honghe, Xishuanbanna and Puer in the south of the province, resulting in heavy rain over most areas and usually heavy rain in some locations.
(3) Pattern of Straits and Peninsula (P3). Seventeen TCs have this pattern of tracks, taking up about 12%. With this pattern, the TCs mainly affect the southern Qujing, Honghe and Xishuangbanna. When they are relatively intense or follow a more northward track, there will be precipitation over most parts of the province.
(4) Pattern of landfalling in Guangdong (P4). Fifty-three TCs have this pattern of tracks, taking up 36%. Having the largest influence on Yunnan, the TCs usually cause intense rainfall across the province, particularly for Wenshan, Honghe, Yuxi, Puer, Xishuangbanna, and Lincang, where heavy- to very-heavy rain occurs.
(5) Pattern of landfalling in Taiwan and Fujian (P5). Seven TCs have this pattern of tracks, taking up 4.8%. With this pattern, the TCs are mainly super typhoons and most of them stop moving in Guangxi or southeastern Yunnan. Some of them weaken to form inverse troughs, affecting eastern and southeast Yunnan, even northeastern and central Yunnan.
In addition, there are other irregular tracks, such as looping, parabolic and recurvature. With this
pattern of tracks, the TCs usually cause light rain with moderate or heavy rain in some parts of the southeastern Yunnan. 5.4% of the TCs belong to this pattern.
According to other statistics (figure omitted), TCs of all patterns of tracks can result in intense rainfall across Yunnan. P1 has the most number of impacts on the province, but it causes only 5% of the intense rain. Though with a small probability of occurrence, the TCs of P5 are associated with the largest probability (57%) of the intense rain. TCs with the irregular tracks take up 25% and have probabilities of intense rain that are higher than those of P1 and P2. It can be concluded that the westward going TCs from the western North Pacific are one of the main regimes to cause intense precipitation in Yunnan.
6 TRACKS AND CATEGORIES OF THE TCS
As shown in the statistics, the 147 TCs that influence the precipitation of Yunnan include 38 super typhoons, 29 severe typhoons, 34 typhoons, 30 severe tropical storms, 9 tropical storms, and 7 tropical depressions. In other words, super typhoons are the most while tropical depressions are the least. Regardless of the intensity, all TCs can result in intense rain across the province (Table 3), with super typhoons taking up the most (33.3%) and tropical depressions the least (1.3%). Besides, however they move, all TCs can produce intense rain across the province, with P4 having the most times (44%), as shown in Table 4. Table 3. Distribution of different categories of TCs affecting the intense rain in Yunnan from 1959 to 2007.
TC categories Times of occurrence Percentage (%)
Tropical depression 4 5.3 Tropical storm 1 1.3
Severe tropical storm 15 20.0 Typhoon 17 22.7
Severe typhoon 13 17.3 Super typhoon 25 33.4
Sum 75 100.0
Table 4. Same as Table 3 but for different patterns of TC tracks.
TC track patterns Times of occurrence Percentage(%)
Southern (P1) 11 14.7 Hainan Is. (P2) 14 18.7
Strait-peninsula (P3)) 7 9.3 Landfall in Guangdong (P4) 33 44.0 Taiwan-Fujian landfall (P5) 6 8.0
Others 4 5.3 Sum 75 100.0
7 CIRCULATION BACKGROUND OF WESTWARD GOING TCS AFFECTING THE PRECIPITATION OF YUNNAN PLATEAU
Ⅴ
Ⅳ
Ⅲ
Ⅱ
Ⅰ

No.1 GUO Rong-fen (郭荣芬), XIAO Zi-niu (肖子牛) et al. 85
85
The movement of TCs is mainly subject to steering air flows. There have been some works on the relationships between large-scale circulation and TC activity and the rain it brings about[19, 20]. To better understand the background circulation field of the precipitation associated with TCs affecting the Yunnan plateau, this paper conducted a composite analysis of the circulation background for the first 24 hours of influence for Yunnan with five patterns of TC tracks to determine five associated patterns of upper-level circulation.
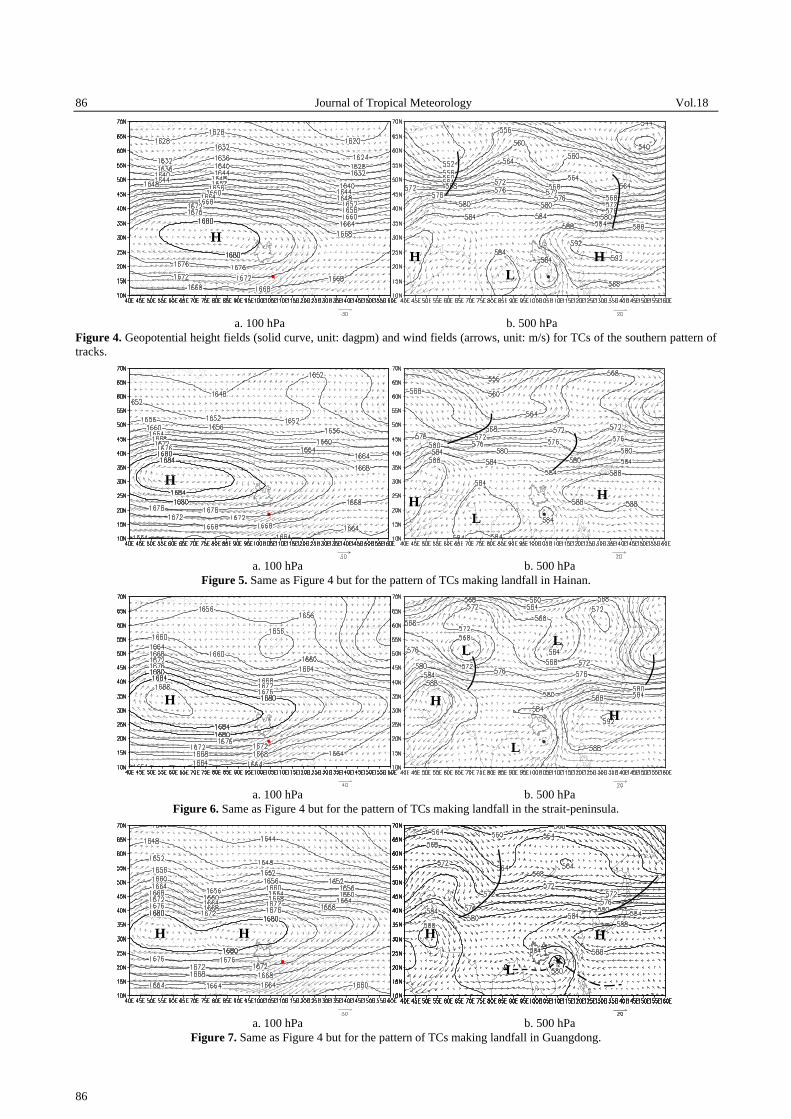
(1) Southern pattern (P1). On the 100 hPa height field (Figure 4a), the center of the South Asia high is located at the central and southern part of Tibetan Plateau and there is northeast-by-east wind larger than 25 m/s over the Indochina Peninsula and Bay of Bengal. On 500 hPa (Figure 4b), two troughs coexist with a trough in the middle and higher latitudes of Eurasian continent while the westernmost point of the subtropical high is around 105°E and its ridge between 25°N and 30°N. There is monsoon-depression circulation over the Indian Peninsula-Bay of Bengal region and circulation of westward going TCs over Indochina. It is usual for the Intertropical Convection Zone to connect the two circulations.
(2) Hainan-landfall pattern (P2). On 100 hPa (Figure 5a), the center of the South Asia high is over the Iranian Plateau (60°E, 33°N) with the value of the central circulation circle increased to 1684 dagpm, a northeast-by-east jet stream is larger than 28 m/s over the central and southern Yunnan, Indochina Peninsula and Bay of Bengal, and the upper-level easterly jet stream is more northward than with P1. On 500 hPa (Figure 5b), the circulation is mainly zonal in the middle and higher latitudes of Eurasian continent with the westernmost point of the subtropical high ridge around 115°E and the ridge near 25°N. A high-pressure circulation of 592 dagpm is located more eastward (over the East China Sea) and the Tibetan high pressure is mostly westward. A circulation of monsoon depression is present over the Indian Peninsula-Bay of Bengal while a circulation of west-traveling TCs exists over Indochina Peninsula.
(3) Straits-peninsula landfalling pattern (P3). On 100 hPa (Figure 6a), the South Asia high is westward at the western part of the Iranian Plateau with the value of the central circulation circle increased to 1688 dagpm and the coverage extended in a northeast-southwest direction. The high is both stronger and more extensive than with P1 and P2. Correspondingly in the area south of 26°N, a northeast-by-east jet stream is greater than 30 m/s and more intense than with P1 and P2. On 500 hPa (Figure
6b), three troughs are with two ridges in the middle and higher latitudes of Eurasian continent with the westernmost point of the subtropical high around 110–115°E. The rear portion of the high is usually with a closed high of 592 dagpm that centers on the East China Sea and Okinawa, Japan. A strong Iranian high extends east to the western portion of the Indian Peninsula, a monsoon trough is active over the Bay of Bengal and circulations of west-going TCs are found over the Indochina.
(4) Guangdong landfalling pattern (P4). On 100 hPa (Figure 7a), the South Asia high has two centers, one over the western part of the Iranian Plateau and the other over the southeastern part of the Tibetan Plateau, with a circulation circle of 1680 dagpm distributing east-west and the coverage and intensity both smaller than those of P3. An east-northeast jet stream located south of the high (28°N) is greater than 30 m/s. On 500 hPa (Figure 7b), there are two troughs and one ridge over the middle and higher latitudes of the Eurasian continent and the westernmost point of the subtropical high retreats to 120°E. While the Tibetan Plateau high is mostly 584 dagpm strong, a circulation of monsoon depressions is seen for the Indian Peninsula and Bay of Bengal. At this time, TCs are usually active over the ocean east of the Philippines to form a circulation of twin TCs or multiple TCs, together with cloud regimes developing on the ITCZ.
(5) Taiwan-Fujian landfalling pattern (P5). On 100 hPa (Figure 8a), there are two centers for the South Asia high, one being over the western part of the Iranian Plateau and the other over the southeastern Tibetan Plateau. Being 1684 dagpm strong, the circulation extends its circle slightly in a northeast-southwest direction. The pattern has greatest intensity and coverage of all the five landfalling patterns. An east-northeast jet stream, with wind speed greater than 30 m/s, originates from the Bay of Bengal and extends north to reach the central part of Sichuan Basin. On 500 hPa (Figure 8b), two troughs and two ridges distribute in the middle and higher latitudes of the Eurasian continent, a stripe-like subtropical high is between 30°N and 40°N with its westernmost point at 125°E, the Iranian high is relatively strong, monsoon depressions or troughs are active over the Indian Peninsula and Bay of Bengal, and typhoon depressions or inverted troughs, which are formed from weakened TCs, move with an westward-extending and intensifying subtropical high to affect Yunnan, along with other systems.
86 Journal of Tropical Meteorology Vol.18
86
a. 100 hPa b. 500 hPa
Figure 4. Geopotential height fields (solid curve, unit: dagpm) and wind fields (arrows, unit: m/s) for TCs of the southern pattern of tracks.
a. 100 hPa b. 500 hPa
Figure 5. Same as Figure 4 but for the pattern of TCs making landfall in Hainan.
a. 100 hPa b. 500 hPa
Figure 6. Same as Figure 4 but for the pattern of TCs making landfall in the strait-peninsula.
a. 100 hPa b. 500 hPa
Figure 7. Same as Figure 4 but for the pattern of TCs making landfall in Guangdong.
H H H H
L
H H
L
H
H HH
L L
L
H L
H H

No.1 GUO Rong-fen (郭荣芬), XIAO Zi-niu (肖子牛) et al. 87
87
a. 100 hPa b. 500 hPa
Figure 8. Same as Figure 4 but for the pattern of TCs making landfall in the strait-peninsula.
It is suggested from the analysis above that a more westward-located 100 hPa South Asia high makes it more likely for the westward-going western North Pacific TCs to affect the lower-latitude Yunnan Plateau. As an upper-level easterly jet stream of the southeastern Tibetan high is over the southeastern Tibetan Plateau, Yunnan, Indochina and Bay of Bengal, intense convergence is formed. When the South Asia high has a single center that is over the Iranian Plateau, the stronger and more westward it is, the more westward the TC makes landfall. When it has twin centers, the more eastward the center of the high in southeastern Tibetan Plateau and the stronger the high, the more eastward the TC makes landfall.
On 500 hPa, the middle latitudes are predominant with zonal circulation and moderately intense westerly troughs while the low-latitude tropics are characteristic of monsoon depressions and active ITCZ. As the subtropical high is the key system that steers TCs to move to the west, the extension of the westernmost ridge point to the northeastern part of Yunnan, the expansion of its periphery anti-cyclonic circulation to the Tibetan Plateau, or the merger of the subtropical high with the Tibetan high will all be conducive to TCs going westward to the interior part of China to affect Yunnan. The site of TC landfall is more to the west when the ridge of the subtropical high is south of 30N; the former is more to the east when the latter is north of 30N.
8 CONCLUSIONS
(1) Almost every year, Yunnan is being affected by TCs traveling from the western North Pacific. Showing a general trend of interdecadal decline, the TC effect happens only in June to October that fluctuates from low, rising, high and falling levels.
(2) The impact of TCs on the precipitation of Yunnan can be seen over most of the province, with southern Yunnan having relatively larger share and Honghe having the most.
(3) The TCs that influence Yunnan mainly come
from the ocean around Caroline Islands east off the Philippines, central and northern South China Sea. Most of these TCs go through the Northern Bay. Super typhoons produce the most processes of intense rainfall.
(4) All of the five patterns of TC tracks can cause intensive province-wide rain in Yunnan with P4 exerting the most frequent and extensive influence. The probability for P5 and other patterns to make landfall is small but they bring about a relatively high frequency of intense rainfall.
(5) A westward-located South Asia high and a stable and powerful subtropical high act as main backgrounds of circulation for the TCs to go westward and make landfall.
REFERENCES:
[1] WANG Ji-zhi. Activities of Typhoons in Western North Pacific over the Past 100 Years [M]. Beijing: Ocean Press, 1991. [2] CHAN J C, SHI J E. Long-term trends and international and annual variability in tropical cyclone activity over the western north Pacific [J]. Geophy. Res. Lett., 1996, 23(1): 2765-2767. [3] CHEN Min, ZHENG Yong-guang, TAO Zu-yu. An analysis on tropical cyclones climatic feature in the western north Pacific for 1949-1996 [J]. J. Trop. Meteor., 1999, 15(1): 10-16. [4] MU Hai-zhen, TU Qi-pu. Climatological characteristics of tropical cyclone activities in the west Pacific [J]. J. Nanjing Inst. Meteor., 2000, 23(1): 81-86. [5] DONG Mei-ying, XUE Gen-yuan, ZHENG Pei-qun. Study on the characteristics of tropical cyclones activity over the western North Pacific in 2004 and the cause of formation [J]. J. Trop. Meteor., 2006, 22(5): 498-504. [6] ZHU Qian-geng, CHEN Min. Statistical characteristics of landfalling tropical cyclones in western North Pacific[C]// Proceedings of abstracts for the 12th National Seminar on Tropical Cyclone Science. Beijing: Chinese Academy of Meteorological Sciences, 2002: 15-17. [7] YU Yu-bin, YAO Xiu-ping. A statistical analysis on intensity change of tropical cyclone over the western North Pacific [J]. J. Trop. Meteor., 2006, 22(6): 521-526. [8] YU Hui. Climatological Analysis of Intensity Change in Post-Landfall Tropical Cyclones: Tropical Cyclones
H H
HH

88 Journal of Tropical Meteorology Vol.18
88
Disappearing after Landfall [C]// Proceedings of abstracts for the 12th National Seminar on Tropical Cyclone Science. Beijing: Chinese Academy of Meteorological Sciences. Beijing: Chinese Academy of Meteorological Sciences, 2002: 33-35. [9] SHAO Li-min, YANG Ji-li, YI Hai-qi, et al. Climatic analysis for TC in the Northwest Pacific from 1949 to 2006 [J]. Ocean Technol., 2007, 26(4): 83-105. [10] LEI Xiao-tu, CHEN Lian-shou. The latitudinal distribution of climatic characteristics on tropical cyclone activities in the WNP [J]. Quart. J. Appl. Meteor., 2002, 13(2): 218-227. [11] LIANG Jian-yin. Study of diurnal variations of tropical cyclone landfall time in China [J]. J. Trop. Meteor., 2003, 19(suppl.): 160-165. [12] LI Ying; CHEN Lian-shou; ZHANG Sheng-jun. Statistical characteristics of tropical cyclone making landfalls on China [J]. J. Trop. Meteor., 2004, 20(1): 14-23. [13] ZHUO Ga, XIE Jin-nan, MA Jing-xian. Statistical relations between typhoon activity and precipitation in China [J]. Plateau Meteor., 2000, 19(2): 260-264. [14] LIU Chun-xia. The wavelet analysis of annual variation of tropical cyclone in Guangdong [J]. J. Trop. Meteor., 2001, 17(4): 381-390.
[15] CHEN Guang-hua, HUANG Rong-hui. The effect of warm pool thermal states on tropical cyclone in west northwest Pacific [J]. J. Trop. Meteor., 2006, 22(6): 527-532. [16] HUANG Yong, LI Chong-yin, WANG Ying. The Pacific meridional mode of coupled ocean-atmosphere and the connection with frequency of tropical cyclones activity over the western north Pacific [J]. J. Trop. Meteor., 2009, 25(2): 169-174. [17] HUANG Yong, LI Chong-Yin, WANG Ying. Further study on the characteristics of frequency variation of tropical cyclones activity over western north Pacific and the relationship with sea surface temperature [J]. J. Trop. Meteor., 2009, 25(3): 273-280. [18] QIN Jian, JU Jian-hua, XIE Ming-en. Weather and Climate in a Low-latitude Plateau [M]. Beijing: China Meteorological Press, 1997: 84-85; 51-52. [19] CHEN Lian-shou, DING Yi-hui. Introduction to Typhoons in Western North Pacific [M]. Beijing: Science Press, 1979: 325-328; 227-261. [20] ZENG Su-juan, GUO Xiu-ying. South Asian high and tracks of typhoons [J]. Meteor. Mon., 1986(5): 32-33.
Citation: GUO Rong-fen, XIAO Zi-niu and LI Ying. The statistical characteristics of impact of the westward-going tropical cyclones on rainfall in Yunnan Plateau. J. Trop. Meteor., 2012, 18(1): 81-88.