Embed Size (px)
Citation preview

Advanced Computing: An International Journal (ACIJ), Vol.4, No.6, November 2013
DOI : 10.5121/acij.2013.4601 1
THE STUDY ABOUT THE ANALYSIS OF
RESPONSIVENESS PAIR CLUSTERING TOSOCIAL
NETWORK BIPARTITE GRAPH
Akira Otsuki 1 and Masayoshi Kawamura
2
1 Tokyo Institute of Technology, Tokyo, Japan
2MK future software, Ibaraki, Japan
ABSTRACT In this study, regional (cities, towns and villages) data and tweet data are obtained from Twitter, and
extract information of "purchase information (Where and what bought)" from the tweet data by
morphological analysis and rule-based dependency analysis. Then, the "The regional information" and the
"Theinformation of purchase history (Where and what bought information)" are captured as bipartite
graph, and Responsiveness Pair Clustering analysis (a clustering using correspondence analysis as
similarity measure) is conducted. In this study, since it was found to be difficult to analyze a network such
as bipartite graph having limitations in links by using modularity Q, responsiveness is used instead of
modularity Q as similarity measure. As a result of this analysis, "regional information cluster" which refers
to similar "Theinformation of purchase history" nodes group is generated. Finally, similar regions are
visualized by mapping the regional information cluster on the map. This visualization system is expected to
contribute as an analytical tool for customers’ purchasing behaviour and so on.
KEYWORDS Big Data analysis, customers’ purchasing behaviour analysis, Data Mining, Database
1. INTRODUCTION
"Big data" is not just meaning the size of the capacity simply.For example, it is real-time data or
nonstructural data, like the SNS (Social Networking Service) data.Big data is being used in
various fields as environmental biology [1], physics simulation [2], seismology, meteorology,
economics, and management information science.
Foreign countriesare making efforts aggressive towards big data utilization already according to
the data of Ministry of Internal Affairs and Communications [3].OSTP (Office of Science and
Technology Policy) in the US government released the "Big Data Research and Development
Initiative" at March2013.Other hand,FI-PPP (Future Internet Public-Private Partnership) program
is being implemented by EU at 2011. FI-PPP is a Public-Private-Partnership programme for
Internet-enabled innovation.In this manner, the study of Big Data is being implemented actively
worldwide as a recent trend. Therefore, it is conceivable that the study of Big Data is very
important.
We[4-6] did propose many Big Data analysis methods thus far. These are the methods based on
Bibliometrics and clustering (Newman Method).We will do Study about the Analysis of
"Responsiveness Pair Clustering" of Bipartite Graph of Regional/Purchase Big Data in this
paper.Concretely, first will get the Regional (Ex: cities, towns and villages)data and purchase data
from Twitter. Next,will do "Responsiveness Pair Clustering Analysis" about bipartite graph of

Advanced Computing: An International Journal (ACIJ), Vol.4, No.6, November 2013
regional and purchase data.Although former clustering method used the structure of the link as
the similarity measure of clustering,
method using the responsiveness
cluster that purchasing behaviour is the
similar area (cities, towns and villages) will be visualization by mapping these clusters on the
map. This visualization system is expected to contribu
purchasing behaviour and so on.
2. RELATED WORK AND B
2.1. Bibliometrics
Bibliometrics is the analysis method of citation relationship
analyse citation relation as a target of Journal papers
relation analysis as shown in ①-
①①①① Direct Citation
As shown inFig1,Papers A and B are cited in Paper C, In this case, direct citation deems
that there are links between Papers A/B and Paper C and further links between Paper C.
As a result, there are three nodes and two links in the network. When direct citation is used,
a certain paper is deemed to have links with all papers that cite the pertinent paper.
②②②② Co-Citation
This was proposed by Small
Paper C. In this case, co-
thus, there are two nodes and one
citation was used, i.e., all papers contained in the list of cited literature of a certain paper,
there is a link between the paired papers.
Computing: An International Journal (ACIJ), Vol.4, No.6, November 2013
Although former clustering method used the structure of the link as
the similarity measure of clustering, the "Responsiveness Pair Clustering Analysis" is the analysis
method using the responsiveness [7-9]of the data as the similarity measure of clusterin
cluster that purchasing behaviour is the same is created after the result of this analysis
similar area (cities, towns and villages) will be visualization by mapping these clusters on the
This visualization system is expected to contribute as an analytical tool for customers’
BASIC TECHNOLOGY OF BIG DATA ANALYSIS
analysis method of citation relationship proposed by Garfield
citation relation as a target of Journal papers. There are three techniquesin
-③following.
Papers A and B are cited in Paper C, In this case, direct citation deems
links between Papers A/B and Paper C and further links between Paper C.
As a result, there are three nodes and two links in the network. When direct citation is used,
a certain paper is deemed to have links with all papers that cite the pertinent paper.
Figure 1. Direct Citation
This was proposed by Small[14].As shown inFig2, both Paper A and Paper B are cited in
-citation deems that there is a link between Paper A and Paper B;
thus, there are two nodes and one link in the network. For pairs of papers in which co
citation was used, i.e., all papers contained in the list of cited literature of a certain paper,
there is a link between the paired papers.
Figure 2. Co-Citation
Computing: An International Journal (ACIJ), Vol.4, No.6, November 2013
2
Although former clustering method used the structure of the link as
is the analysis
of the data as the similarity measure of clustering. The
created after the result of this analysis. Then
similar area (cities, towns and villages) will be visualization by mapping these clusters on the
te as an analytical tool for customers’
NALYSIS
proposed by Garfield [10-13].It
in the citation
Papers A and B are cited in Paper C, In this case, direct citation deems
links between Papers A/B and Paper C and further links between Paper C.
As a result, there are three nodes and two links in the network. When direct citation is used,
a certain paper is deemed to have links with all papers that cite the pertinent paper.
, both Paper A and Paper B are cited in
citation deems that there is a link between Paper A and Paper B;
link in the network. For pairs of papers in which co-
citation was used, i.e., all papers contained in the list of cited literature of a certain paper,

Advanced Computing: An International Journal (ACIJ), Vol.4, No.6, November 2013
� Bibliographic coupling
It is a technique proposed by Kessler [15]. As shown in Fig3, both Paper D and Paper E
cited Paper C. In this case, this technique deems that there is a link between Paper D and
Paper E; thus, there are two nodes and one link in the network. When bibliographic
coupling is used for pairs of papers that cite a certain paper, it is deemed that there is a link
between the paired papers.
2.2. Clustering method based
Clustering method is based on the graph theory.Clustering is a technique used to divide a large
volume of data like academic papers.
the overall structure of complex data and understand it more direct
few techniques at Clustering Methods
A) Newman Method [16-18
This technique is the clustering
does the clustering by optimizing the Modularity
B) GN Method [19]
This technique proposed by
clustering by using betweenness of the edge
C) CNM Method [20]
This technique proposed by
technique is the faster technique
Fig4 is the citation map by Newman
of data like academic papers about "Data Mining".
structure of complex data and understand it more directly and thoroughly by using clustering
method.
Computing: An International Journal (ACIJ), Vol.4, No.6, November 2013
technique proposed by Kessler [15]. As shown in Fig3, both Paper D and Paper E
Paper C. In this case, this technique deems that there is a link between Paper D and
Paper E; thus, there are two nodes and one link in the network. When bibliographic
pling is used for pairs of papers that cite a certain paper, it is deemed that there is a link
between the paired papers.
Figure 3. Bibliographic coupling
Clustering method based on the ModularityQ
Clustering method is based on the graph theory.Clustering is a technique used to divide a large
academic papers. According to common features by clustering can simplify
the overall structure of complex data and understand it more directly and thoroughly.
s at Clustering Methods as shown in A) -C)below.
8]
This technique is the clustering technique proposed by M. E. J. Newman.This technique
does the clustering by optimizing the Modularity Q.
proposed by M.E.J.Newman and M.Girvan. This technique does the
clustering by using betweenness of the edge.
proposed by Aaron Clauset, M.E.J.Newman and Cristopher Moore
hnique is the faster technique than Newman method.
Fig4 is the citation map by Newman Method.Fig4 is the example that did divide a large volume
of data like academic papers about "Data Mining". In this way, will be able to simplify the overall
f complex data and understand it more directly and thoroughly by using clustering
Computing: An International Journal (ACIJ), Vol.4, No.6, November 2013
3
technique proposed by Kessler [15]. As shown in Fig3, both Paper D and Paper E
Paper C. In this case, this technique deems that there is a link between Paper D and
Paper E; thus, there are two nodes and one link in the network. When bibliographic
pling is used for pairs of papers that cite a certain paper, it is deemed that there is a link
Clustering method is based on the graph theory.Clustering is a technique used to divide a large
ccording to common features by clustering can simplify
ly and thoroughly. There are a
This technique
This technique does the
M.E.J.Newman and Cristopher Moore. This
Fig4 is the example that did divide a large volume
In this way, will be able to simplify the overall
f complex data and understand it more directly and thoroughly by using clustering

Advanced Computing: An International Journal (ACIJ), Vol.4, No.6, November 2013
Figure 4. E
2.3. The Problem of the Modularity
The modularity Qcan handle the network there is no
For example, "Akira, O.2000" has appeared in two both the column at the Table1
there is no restrictionon the link.
is restrictionon the linklike as shown in Table2.
both two columns in the Table 2.
Table 1.
Paper Name
Akira, O.
Akira, O.
Akira, O.
Masayoshi, K.
Masayoshi, K.
Masayoshi, K.
Author, E
Table 2
Purchases
Electrical appliances
Electrical appliances
Dress
Accessories
Cake
Computing: An International Journal (ACIJ), Vol.4, No.6, November 2013
Example of the clustering (using Newman Method)
roblem of the Modularity Q in the Bipartite Graph
can handle the network there is no restrictionon the link as shown in Table1.
"Akira, O.2000" has appeared in two both the column at the Table1.This means that
on the link.Butmodularity Qcan’t handle the network (Bipartite Graph)
like as shown in Table2.For example, there is no the data that appear in
.This means that there is restrictionon the link.
Table 1. There is no restriction on the link of network
Paper Name Cited PapersName
Akira, O.2000 Author, A2013
Akira, O.2000 Author, B2011
Akira, O.2000 Author, C2012
Masayoshi, K.1995 Author, D2012
Masayoshi, K.1995 Akira, O.2000
Masayoshi, K.1995 Author, E2012
Author, E2012 Author, F2012
2. There is restriction on the link of network
Purchases Item Purchases Place
lectrical appliances Electrical appliance store
lectrical appliances Electrical appliance store
Department store
Department store
Supermarket
Computing: An International Journal (ACIJ), Vol.4, No.6, November 2013
4
on the link as shown in Table1.
This means that
te Graph) there
is no the data that appear in

Advanced Computing: An International Journal (ACIJ), Vol.4, No.6, November 2013
5
2.4. Related Work
There are many studies that apply modularity Qto bipartite graph. Q
Bis the bipartite modularity
proposed by Barber[21].QB is shown as formula (1):
(1)
Pijshowsthe probability there are the link to the Vi and Vjon therandom bipartite graph. Pijis
shown as formula (2): (2)
Aijshows the element of adjacency matrix.Aijis shown as formula (3):
(3)
Barber proposed the method of community divide at the maximum Q.
Takeshi, M.[22] did proposed bipartite Modularity QM
by giving the correspondence relation to
the difference community sets.
(4)
QMis evaluatethe link densitythe most corresponds community.But it’s mean that Q
Mcan
only evaluate about the one community.
Kazunari, I.[23] proposed the bipartite modularity in order to address this issue. is
shown as formula (5).
(5)
is a partitioning algorithm known as the Weakest Pair (WP) algorithm. This separates the
weakest pairs of bloggers and webpages, respectively, using co-citation information.
Finally, Keiu, H. [24] proposed a new bipartite modularity QH which is a measure to evaluate
community structure considering correspondence of the community relation quantitatively.
(6)

Advanced Computing: An International Journal (ACIJ), Vol.4, No.6, November 2013
6
He showedC=CA CBas a bipartite graph community when each part communities are CA and
CB.(eij-aiaj)compute the difference between the expected value of link density and the density of
links between communities, like Modularity Q. But QHcan evaluate the relationship between
communities, but can’t evaluate relationship between nodes in the communities.
3. PROPOSED METHOD OF THIS STUDY
This study will propose the analysis method of responsiveness pair clustering tosocial network
bipartite graph.Then, will do implementation the social network bipartite graph visualization
system as a target to twitter data.This system is expected as a marketing system about customer
purchase behaviour.
3.1.Acquisition of the Target Data
We used our own script, to which the twitter API is applied, to obtain information from tweeted
comments about what commercial items consumers purchased during the Christmas period and
where, in order to use it as analysis data. Specifically, we acquired tweets and position
(latitude/longitude) information on from December 22 to 25, 2012. About 750 pieces of
information were obtained. Fig5 shows an example of formatted information.
(1) Tue, 22 Dec 2012,
(2) twitter_User_ID,
(3) I bought the clothes by **department store.(@ **Department storew/7 others),
(4) [35.628227, 139.738712]
Figure 5. Example of obtained information’s (tweeted comments and position information)
3.2.Morphological Analysisand Dependency Parsing
We'll explain analysis method about obtained information using morphological analysis and
dependency parsing in this section.
First, Geocoding was applied to extract the names of cities, towns and villages (position data)
from the latitude and longitude shown in (4) of Fig5. We then extracted information about what
items were purchased by consumers and where from their tweets {(3) of fig5}. As for the
shopping location, the part “@ so-and-so department” in (3) was automatically extracted. A
morphological analysis was performed on the information of (3) using ChaSen [25], and then a
rule-based Dependency Parsing [26] was done to extract information of purchased items. As a
result, a"clothes" was extracted in the case of Fig5. We manually extracted these information if
had not been extracted automatically. Dependency parsing is the method of analyse relation
words about each words as shown in Fig6.
Advanced Computing: An International Journal (ACIJ), Vol.4, No.6, November 2013
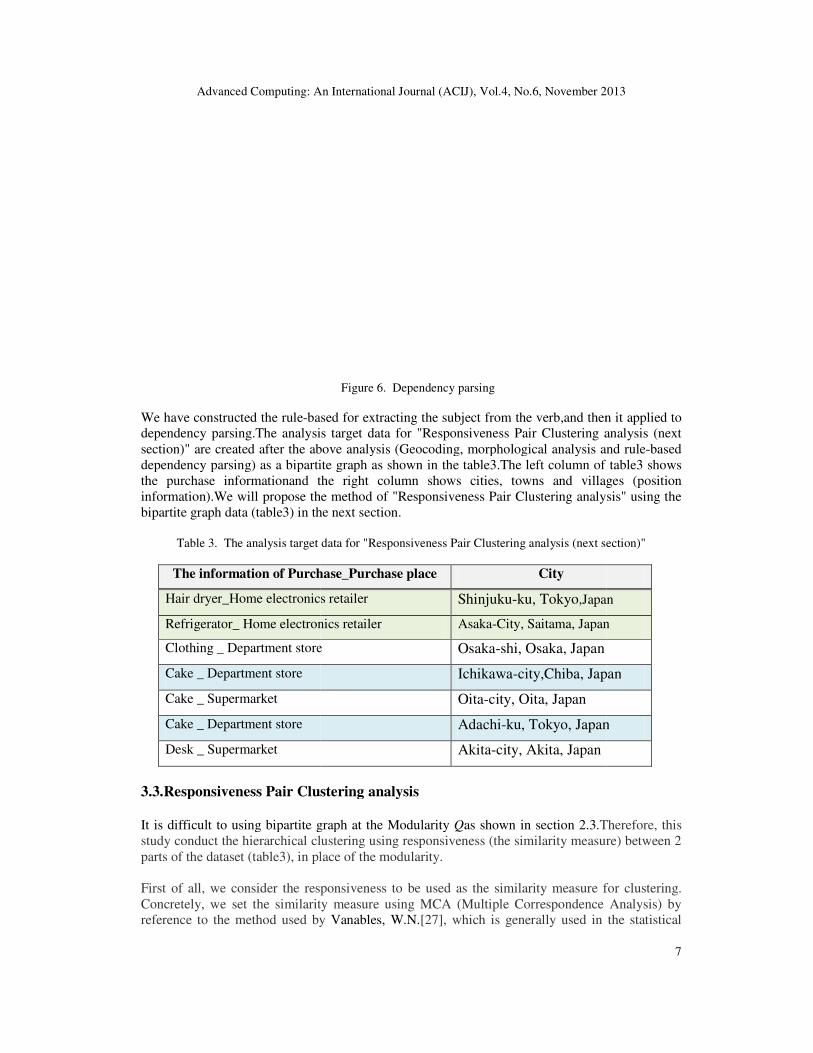
We have constructed the rule-based for extracting
dependency parsing.The analysis target data for "Responsiveness Pair Clustering analysis (next
section)" are created after the above analysis (Geocoding, morphologi
dependency parsing) as a bipartite graph as shown in the table3.
the purchase informationand the right column shows
information).We will propose the
bipartite graph data (table3) in the next section
Table 3. The analysis target data for "Responsiveness Pair Clustering analysis (next section)"
The information of Purchase
Hair dryer_Home electronics retailer
Refrigerator_ Home electronics retailer
Clothing _ Department store
Cake _ Department store
Cake _ Supermarket
Cake _ Department store
Desk _ Supermarket
3.3.Responsiveness Pair Clustering analysis
It is difficult to using bipartite graph at the Modularity
study conduct the hierarchical clustering using responsiveness
parts of the dataset (table3), in place of the modularity.
First of all, we consider the responsiveness to be used as the similarity measure
Concretely, we set the similarity measure
reference to the method used by
Computing: An International Journal (ACIJ), Vol.4, No.6, November 2013
Figure 6. Dependency parsing
based for extracting the subject from the verb,and then
The analysis target data for "Responsiveness Pair Clustering analysis (next
section)" are created after the above analysis (Geocoding, morphological analysis and rule
dependency parsing) as a bipartite graph as shown in the table3.The left column of table3
and the right column shows cities, towns and villages (position
We will propose the method of "Responsiveness Pair Clustering analysis
in the next section.
he analysis target data for "Responsiveness Pair Clustering analysis (next section)"
nformation of Purchase_Purchase place City
ome electronics retailer Shinjuku-ku, Tokyo,Japan
ome electronics retailer Asaka-City, Saitama, Japan
Department store Osaka-shi, Osaka, Japan
Ichikawa-city,Chiba, Japan
Oita-city, Oita, Japan
Adachi-ku, Tokyo, Japan
Akita-city, Akita, Japan
Responsiveness Pair Clustering analysis
difficult to using bipartite graph at the Modularity Qas shown in section 2.3.Therefore, this
conduct the hierarchical clustering using responsiveness (the similarity measure
, in place of the modularity.
First of all, we consider the responsiveness to be used as the similarity measure for clustering.
the similarity measure using MCA (Multiple Correspondence Analysis)
reference to the method used by Vanables, W.N.[27], which is generally used in the statistical
Computing: An International Journal (ACIJ), Vol.4, No.6, November 2013
7
and then it applied to
The analysis target data for "Responsiveness Pair Clustering analysis (next
cal analysis and rule-based
of table3 shows
cities, towns and villages (position
Responsiveness Pair Clustering analysis" using the
he analysis target data for "Responsiveness Pair Clustering analysis (next section)"
,Japan
City, Saitama, Japan
, Japan
ku, Tokyo, Japan
Therefore, this
similarity measure) between 2
for clustering.
MCA (Multiple Correspondence Analysis) by
[27], which is generally used in the statistical

Advanced Computing: An International Journal (ACIJ), Vol.4, No.6, November 2013
8
software "R". Then, the binary cross tabulation of (m×n) should be set as an initial matrix for
MCA,which can be expressed as the below formula.
(7)
I and J represent the set of alternatives for the items of each row and column as expressed below.
I={1,2,…,m}, J={1,2,…,n} (8)
The concept for profile is assumed as the patterns of relative ratio of the rows or columns of the
cross tabulations as indicated as shown in the below (9) and (10).
(The profile of row) (9) (The profile of column) (10)
Secondly, we considering about MCA. If the variables are dichotomized, the binary cross
tabulation should be set as an initial matrix, then that matrix should be made firstly toapplyxij,
then the below (11) and (12) as its elements.
(11) (12)
Subsequently, the elements of xij can be expressed as below, and it is the basic matrix for MCA.
(13)
Thirdly, we think about the component score of responsiveness pair analysis.Formula (14) and
(15) are the component scores of purchase information and regional information.The component
score of the k-th for the purchase node iis as the below formula.
(14)
The component score of the k-th for the regional node j is as the below formula.
(15)
Then, The relationship of probability matrix and the component scores of I and J are shown in
table4.

Advanced Computing: An International Journal (ACIJ), Vol.4, No.6, November 2013
9
Table 4. The relationship of probability matrix and the component scores of I and J
J
I
1 2 … J … n Row
sum
1
f11 f12 … f1j … f1n f1+
2
f21 f22 … f2j … f2n f2+
…
…
…
…
…
…
…
…
I
fi1 fi2 … fij … fin fi+
…
…
…
…
…
…
m
fm1 fm2 … fmj … fmn fm+
Column
sum
f+1 f+2 … f+j … f+n f++
The component scores (zik, zjk)calculated as above (14) and (15) are used as the coordinates of
matrix for hierarchical clustering.
Next, we will consider the hierarchical clustering. Generally in case of 2 variables, the
hierarchical clustering generates the clusters by merging those whose Euclidian distances are
shorter by calculating it between i and j.Then, 2 clusters that indicated the shortest distances
between each other are sequentially merged,so that it can obtain the hierarchical structure by
repeated integration of all subjects into the final one cluster. In case of 2 variables, the Euclidian
distance between the subjects i and j can be expressed as below,if the coordinate between i and j
is set as (xi1,xj1).
(16)
Also for multivariate cases, it should be defined as below by extending the formula (16).
(17)
By applying above zik and zjk to the multivariate coordinates of the formula (17),we can calculate
the Euclidian distance by using the correspondence relation as the similarity measure. This should
be expressed as the next formula.

Advanced Computing: An International Journal (ACIJ), Vol.4, No.6, November 2013
10
(18)
Next, there are a many methods of measuring the inter-cluster as shown in the following.
� Nearest neighbor method
(19)
� Furthest neighbor method
(20)
� Group average method
(21)
� Ward method
(22)
By means other than Ward’s method, there are the cases to obtain the reduced distances after
merging clusters by median point.That is to say, it cannot ensure the monotonicity of distance.
Therefore, we will use Ward method with measuring the inter-cluster.
3.4.Visualization System of Purchase and Position Information
We were implementation the visualization system based on the above methods (section3.3) as
shown in the Fig7."PurchaseInformation Network Map of Shinjuku-City" in the Fig7 is the
example of PurchaseInformation Network Map. The colour classification of the nodes expresses
difference of purchase and position information. This system canvisualizethe relationship to
other Cities, Towns and Villages by this colour classification.

Advanced Computing: An International Journal (ACIJ), Vol.4, No.6, November 2013
11
Japan Map Cities, Towns and Villages PurchaseInformation
Network Map of Shinjuku-
City
Figure 7. Visualization System of Purchase and Position Information
4. EVALUATION EXPERIMENT
4.1.Outline of Evaluation Experiment
We will compare the Harada's method (QH, Section2.4) and our method using actual SNS
data(about 700) in this evaluation experiment.We have set the correct community divided (Rn) as
an index of this evaluation experiment.The n of Rnshows the node, and we had compared the QH
and our method while increasing increments of 100 nodes.Rnis defined like follows (1. – 4.).
1. If "The information of Purchase _ Purchase place" is the same, these nodes will set at the
same community (table3).
2. If "The information of Purchase" is the same, these nodes will set at the same community.
It is to be done for the rest nodes ofabove 1.
3. If "Purchase place" is the same, these nodes will set at the same community. It is to be
done for the rest nodes of above 2.
4. Finally, if it does not match with everything node, it will be treated as a single
community.
By increasing the number of nodes in the 1 to 4 work by the hundred, changes in cluster numbers
are estimated, an estimate called Rn.
Fig8 shows the result of Rn, QH and our method. As found in Fig8, the proposed method shows a
similar pattern to Rn. In contrast, until the number of nodes reaches 400, the number of
community for QH is far larger than that for Rn.The Q
Hcommunity number, however, is much
smaller than that of Rn after the number of nodes exceeds 400.
If selected the Tokyo If selected the Shinjuku-City

Advanced Computing: An International Journal (ACIJ), Vol.4, No.6, November 2013
Figure 8. Comparison of community number of
Then, A t-test is conducted to determine how much difference there is between the proposed
approach and QH in terms of the community
on the difference between the mean values of the two data sets when the numbe
is between 100 and 700. If the null hypothesis is that there is no difference between the mean
values of the proposed approach and
It has thus been found that there is a st
4.2.Discussion of Evaluation Experiment
This section will discuss the above evaluation experiment.
social networking purchase data, as shown in the
very likely to increase according to the number of nodes.
corresponding number itself decreasing is not possible, since the corresponding number among
nodes would accumulate proportionally to the increase of nodes.
The QH community number, however, is much smaller than that of
exceeds 400.The cause of this is considered as follows.
modularityQ.Modularity Q is something that carries out division in a condition where the
connections within the same community are at the most dense yet
communities are at the least.In other words, since modularity has the characteristics of becoming
more coherent as the number of similar references increases, this result in the division being
carried out with smaller number of
this experiment after the number of nodes exceeded 400.
takes into account this correspondence
transition of community number similar to that of
0
50
100
150
200
250
100 200
N
u
m
b
e
r
o
f
c
l
u
s
t
e
r
Computing: An International Journal (ACIJ), Vol.4, No.6, November 2013
Comparison of community number ofRn, QH and Proposal Method
test is conducted to determine how much difference there is between the proposed
in terms of the community-number mean value. More specifically, the t
on the difference between the mean values of the two data sets when the number of nodes in
is between 100 and 700. If the null hypothesis is that there is no difference between the mean
values of the proposed approach and QH, the t-test result is: 0.046<0.05, the level of significance.
It has thus been found that there is a statistically significant difference between the two.
of Evaluation Experiment
This section will discuss the above evaluation experiment. If communities are created based on
social networking purchase data, as shown in the Rn definition, the number of communities are
very likely to increase according to the number of nodes.The reason for this is because the
corresponding number itself decreasing is not possible, since the corresponding number among
rtionally to the increase of nodes.
community number, however, is much smaller than that of Rnafter the number of nodes
he cause of this is considered as follows.QHis realized in the form of expanding
is something that carries out division in a condition where the
connections within the same community are at the most dense yet the connection
In other words, since modularity has the characteristics of becoming
coherent as the number of similar references increases, this result in the division being
carried out with smaller number of communities.This trait appears to have become prominent in
this experiment after the number of nodes exceeded 400.However, as the proposed technique
this correspondence while carrying out clustering, the result has shown
transition of community number similar to that of Rn.
300 400 500 600 700
Number of Node
Rn
QH
Proposal Method
Computing: An International Journal (ACIJ), Vol.4, No.6, November 2013
12
and Proposal Method
test is conducted to determine how much difference there is between the proposed
number mean value. More specifically, the t-test is
r of nodes in Fig8
is between 100 and 700. If the null hypothesis is that there is no difference between the mean
test result is: 0.046<0.05, the level of significance.
atistically significant difference between the two.
If communities are created based on
definition, the number of communities are
The reason for this is because the
corresponding number itself decreasing is not possible, since the corresponding number among
after the number of nodes
is realized in the form of expanding
is something that carries out division in a condition where the
he connections to other
In other words, since modularity has the characteristics of becoming
coherent as the number of similar references increases, this result in the division being
to have become prominent in
proposed technique
while carrying out clustering, the result has shown
Proposal Method

Advanced Computing: An International Journal (ACIJ), Vol.4, No.6, November 2013
13
4. CONCLUSION
In this study, Collecting regional information and purchase information from Twitter and
representing them as bipartite graph, a technique to analyse "Responsiveness Pair Clustering" has
been proposed. The modularity Q can’t handle the network if there is restriction on the link. This
study was solved this problem by using the "Responsiveness Pair Clustering"instead of the
Modularity Q.Then we confirmed predominance of our method than QH by result of evaluation
experiment. Furthermore, we constructed the visualization system of customer purchase based on
this method.This visualization system is expected to contribute as an analytical system for
customers’ purchasing behaviour and so on.
REFERENCES
[1] Reichman,O.J., Jones, M.B., and Schildhauer, M.P.: Challenges and Opportunities of Open Data in
Ecology. Science 331(6018): 703-705, 2011.
[2] Sandia sees data management challenges spiral. HPC Projects Aug. 4, 2009.
[3] Ministry of Internal Affairs and Communications: Efforts of other countries towards the strategic use
of Big Data, 2012.
[4] Akira, O.: Dynamic Extraction of Key Paper from the Cluster Using Variance Values of Cited
Literature, International Journal of Data Mining & Knowledge Management Process (IJDKP),
Volume 3, Number 5, pp.71-82, 2013.
[5] Akira, O., Masayoshi,K.: The Study of the Role Analysis Method of Key Papers in the Academic
Networks, The International Journal of Transactions on Machine Learning and Data Mining, 2013.
[6] Akira, O., Masayoshi, K.: GV-Index: Scientific Contribution Rating Index That Takes into Account
the Growth Degree of Research Area and Variance Values of the Publication Year of Cited Paper,
International Journal of Data Mining & Knowledge Management Process (IJDKP), Volume 3,
Number 5, pp.1-13, 2013.
[7] Greenacre, M.J.: Theory and applications of correspondence analysis. Academic Press, 1984.
[8] Greenacre, M.J.: Correspondence analysis in practice. Academic Press, 1993.
[9] K Tekeuchi, H Yanai, B N Mukherjee: The foundations of multivariate analysis. A unified approach
by means of projection onto linear subspecies, Halsted (Wiley), New York, 1982.
[10] Garfield, E. "Citation Indexes for Science: A New Dimension in Documentation through Association
of Ideas." Science, 122(3159), p.108-11, July 1955. (htmlversion) Reprinted in Readings in
Information Retrieval, p.261-274, (H.S. Sharp. Ed.), The Scarecrow Press, Inc. 1964 (book in EG's
office).
[11] Garfield, E. "Citation Indexes for Science." Science, 123(3184), pp.61-62, 1956. Comments in
response to a letter by UH Schoenbach in the same issue of Science.
[12] Garfield, E. "From bibliographic coupling to co-citation analysis via algorithmic historio-
bibliography", A citationist's tribute to Belver C. Griffith, presented at Drexel University, Philadelphia,
PA. November 27, 2001.
[13] Garfield E, Pudovkin AI, Paris S. "A bibliometric and historiographic analysis of the work of Tony
van Raan: a tribute to a scientometrics pioneer and gatekeeper" Research Evaluation 19(3), September
2010.
[14] H. Small: Macro-level changes in the structure of co-citation clusters: 1983–1989, Scientometrics,
Volume 26, Issue 1, pp.5-20, 1993.
[15] M. M. Kessler: Bibliographic coupling between scientific papers, Journal of the American Society for
Information Science and Technology, Volume 14, Issue 1, pages 10–25, January 1963.
[16] M. E. J. Newman: A measure of betweenness centrality based on random walks, Social Networks,
Vol. 27, No.1, pp. 39-54, 2005.
[17] M. E. J. Newman: Fast algorithm for detecting community structure in networks, Phys. Rev. E, Vol.
69, 2004.
[18] M.E.J.Newman: Fast algorithm for detecting community structure in networks. Phys. Rev. E 69,
066133, 2004.
[19] M.E.J.Newman and M.Girvan: Finding and evaluating community structure in networks. Phys. Rev. E
69, 026113, 2004.

Advanced Computing: An International Journal (ACIJ), Vol.4, No.6, November 2013
14
[20] Aaron Clauset: M.E.J.Newman and Cristopher Moore, Finding community structure in very large
networks. Phys. Rev. E 70, 066111, 2004.
[21] Barber, M.J.: Modularity and community detection in bipartite networks, Phys. Rev. E 76, 066102,
pp.1-9, 2007.
[22] Takeshi, M: The Modularity at the bipartite network, JWEIN08, pp.30-35, 2008.
[23] Kazunari, I:A Partitioning Algorithm for Bipartite Graphs to Extract Latent Weblog Communities,
SIG-SWO-A404-01, pp.1-10, 2005.
[24] Keiu, H., Ikuo, S., Masato, Y., Masashi, F.:The Community Divided by Bipartite Modularity
Considered the Correspondence Between the Community, Computer Software, Japan Society for
Software Science and Technology,Vol.28, No.1, pp.127-134.
[25] http://chasen-legacy.sourceforge.jp/
[26] Sandra Kubler, Ryan McDonald,Joakim Nivre: Dependency Parsing (Synthesis Lectures on Human
Language Technologies),Synthesis Lectures on Human Langage Techhnology, 2009.
[27] Vanables, W.N. and Ripley, B.D.: Modern Applied Statistics with S Fourth edition, Springer, 2002.
Authors
Akira Otsuki
Received his Ph.D. in engineering from Keio University (Japan), in 2012. He is
currently associate professor at Tokyo institute of technology (Japan) and Officer at
Japan society of Information and knowledge (JSIK). His research interests include
Analysis of Big Data, Data Mining, Academic Landscape, and new knowledge
creation support system. Received his Best paper award 2012 at JSIK. And received
his award in Editage Inspired Researcher Grant, in 2012.
MasayoshiKawamura
Masayoshi Kawamura is a system engineer (Japan). He received M.S. degree from
Kyoto Institute of Technology (Japan) in 1998. His research interests include image
processing, digital signal processing, and statistical data analysis.