Embed Size (px)
Citation preview

THE URBAN BOUNDARY-LAYER FIELD CAMPAIGN IN
MARSEILLE (UBL/CLU-ESCOMPTE): SET-UP AND FIRST RESULTS
P. G. MESTAYER,1,* P. DURAND2, P. AUGUSTIN14, S. BASTIN6,J. -M. BONNEFOND11, B. BENECH3, B. CAMPISTRON3, A. COPPALLE4,
H. DELBARRE14, B. DOUSSET5, P. DROBINSKI6, A. DRUILHET3,E. FREJAFON15, C. S. B. GRIMMOND7, D. GROLEAU8, M. IRVINE11,
C. KERGOMARD9, S. KERMADI10, J. -P. LAGOUARDE11, A. LEMONSU2,F. LOHOU3, N. LONG1, V. MASSON2, C. MOPPERT3, J. NOILHAN2,
B. OFFERLE7, T. R. OKE12, G. PIGEON2, V. PUYGRENIER3, S. ROBERTS12,J. -M. ROSANT1, F. SAID3, J. SALMOND12, M. TALBAUT4 and J. VOOGT14
1Laboratoire de Mecanique des Fluides, CNRS – Ecole Centrale de Nantes, France; 2CentreNational de Recherches Meteorologiques, CNRS – Meteo-France, Toulouse, France; 3Labora-toire d’Aerologie, OMP – UPS, Toulouse, France; 4CORIA CNRS – Universite-INSA deRouen, France; 5Laboratoire Geomer, CNRS – UBO, Brest, France and University of Hawaii,
Honolulu, U.S.A.; 6Service d’Aeronomie, IPSL, Paris, France; 7Indiana University, Blooming-ton, U.S.A.; 8Laboratoire CERMA CNRS – Ecole d’Architecture de Nantes, France;9Laboratoire de Geographie des Milieux Anthropises, Universite des Sciences et Technologies de
Lille, France; 10ESO, CNRS – Universite du Maine, Le Mans, France; 11Unite de Bioclima-tologie, INRA, Villenave d’Ornon, France; 12University of British Columbia, Vancouver,Canada; 13University of Western Ontario, London, Canada; 14Laboratoire de Physico-Chimie de
l’Atmosphere, CNRS – Universite du Littoral, France; 15INERIS, Verneuil en Halatte, France
(Received in final form 12 March 2004)
Abstract. The UBL/CLU (urban boundary layer/couche limite urbaine) observation andmodelling campaign is a side-project of the regional photochemistry campaign ESCOMPTE.UBL/CLU focuses on the dynamics and thermodynamics of the urban boundary layer of
Marseille, on the Mediterranean coast of France. The objective of UBL/CLU is to documentthe four-dimensional structure of the urban boundary layer and its relation to the heat andmoisture exchanges between the urban canopy and the atmosphere during periods of low windconditions, from June 4 to July 16, 2001. The project took advantage of the comprehensive
observational set-up of the ESCOMPTE campaign over the Berre–Marseille area, especiallythe ground-based remote sensing, airborne measurements, and the intensive documentation ofthe regional meteorology. Additional instrumentation was installed as part of UBL/CLU.
Analysis objectives focus on (i) validation of several energy balance computational schemessuch as LUMPS, TEB and SM2-U, (ii) ground truth and urban canopy signatures suitable forthe estimation of urban albedos and aerodynamic surface temperatures from satellite data, (iii)
high resolution mapping of urban land cover, land-use and aerodynamic parameters used inUBL models, and (iv) testing the ability of high resolution atmospheric models to simulate thestructure of the UBL during land and sea breezes, and the related transport and diffusion ofpollutants over different districts of the city. This paper presents initial results from such
analyses and details of the overall experimental set-up.
� E-mail: [email protected]
Boundary-Layer Meteorology (2005) 114: 315–365 � Springer 2005

Keywords: Energy balance, Mapping land cover, Radiative fluxes, Thermal remote sensing,Turbulent fluxes, Urban boundary layer, Urban meteorology.
1. Introduction
The assessment of air quality within an urban area requires that numericalmodels be able to simulate pollutant transport-diffusion and chemical trans-formations with fine spatial and temporal resolution, finer than the scale of thedistricts themselves. High resolution atmospheric boundary-layer models, inturn, require dedicated urban schemes and pre-processors, due to the specialcharacteristics of the urban environment: artificial surface materials, anthro-pogenic sources of heat and water, and the presence of buildings. Together thebuilding and vegetation elements found in cities form an open ‘canopy’ layerwhere airflow is channelled and flow re-circulation is common, where solarradiation is trapped due to multiple reflections between vertical and horizontalsurfaces, and the escape of infrared radiation to the sky is hindered. Inaddition, the building surfaces themselves are heterogeneous, comprising alarge range of materials with different radiative, thermodynamic and rough-ness properties. Furthermore, building-atmosphere exchanges are affected bythe ventilation, heating, and air-conditioning systems of the buildings.
Two converging co-operative research efforts were launched in France in2000, focused on the dynamics and thermodynamics of the urban atmosphere:UBL/CLU (CLU, couche limite urbaine, translates to urban boundary layer,and TUE (the French acronym for environmental urban remote sensing). Thepurpose of the TUE program is the assessment of methods and algorithms toderive parameters and data needed as inputs for urban atmospheric modelsfrom remote sensing data. TUE aims to address simultaneously both thedevelopment of physical models to predict urban canopy responses to short-wave and longwave radiation, and algorithms to evaluate surface and canopyparameters from satellite data. Initial efforts focus on the ability to use thevisible, near infrared (NIR), and thermal infrared (TIR) wavebands todetermine urban land cover, structure, surface albedo, surface temperature,and the convective sensible heat flux. This dovetails nicely with recent ini-tiatives to model the urban energy balance: the physically-based Town EnergyBalance scheme (TEB) of Masson (2000), the Local-Scale Urban Meteoro-logical Parameterisation Scheme (LUMPS) of Grimmond and Oke (2002),and the Sub-Meso Soil Model – Urban (SM2-U) of Dupont et al. (2000). TheCLU program aims to improve understanding of interactions between thelower atmosphere and urban systems, to better specify the vertical structure ofthe urban atmospheric boundary layer and its relation to city structure andmeteorological conditions, and to further develop and evaluate models andalgorithms to simulate the urban atmosphere at high spatial resolution. In
P. G. MESTAYER ET AL.316

addition to the urban schemes already noted, these include the Frenchmesoscale models Meso-NH (Lafore et al., 1998) and SUBMESO (Mestayer,1996; Anquetin et al., 1999), their sub-models, and pre-processors.
The ESCOMPTE campaign is part of a continuing coordinated effort tosupport the development of urban pollution models, focused mainly on theunderstanding and prediction of photochemical episodes (ESCOMPTE is theFrench acronym for a field experiment to constrain the models of pollutionemission transport). The ESCOMPTE aims to construct a reference data basefor model validation, based on an extensive regional emissions inventory, adense permanent air quality monitoring network, and an experimental cam-paign, in a region with episodes of high peak ozone pollution (Cros et al., 2004;medias.obs-mip.fr/escompte). The field campaign was run from June 4 to July16, 2001, in the Provence region of southern France. In addition to permanentpollution networks, about thirty ground- or sea-based stations, and six air-borne platforms to document the chemistry and transport of the emittedgaseous and particle pollutants, of ozone, its precursors and by-products, wereimplemented. Taking advantage of this opportunity, UBL/CLU sought todocument the urban boundary layer of Marseille during periods of highinsolation and low wind conditions characteristic of land/sea-breeze regimes.
Apart from the field studies at the scale of a street or a few buildings for airquality and comfort purposes (for example, Vachon et al., 2002), previousurban observation projects usually consist of either ‘point’ assessments of theenergy balance at the local scale of select land use categories, or evaluationsof the meteorological influence of an urban area at the mesoscale (e.g. theurban ‘plume’). These experiments and their relation to model validationhave been reviewed by, for example, Oke (1987, 1998), Mestayer and An-quetin (1994), Mestayer (1998), Rotach et al. (2002), Grimmond and Oke(2002), Piringer et al. (2002) and Arnfield (2003). The aim of the UBL/CLUproject is to integrate climatological and meteorological experimental ap-proaches at multiple scales. In particular it seeks to document urban energyexchanges and impacts on the atmosphere at scales extending from those ofthe urban canopy layer up to the scale of the city. This was achieved bycomplementing the ESCOMPTE regional field program with an assessmentof the three-dimensional structure and time evolution of wind, temperatureand humidity fields, especially the UBL depth, surface temperatures andenergy balance fluxes at the urban surface and near the top of the UBL. Theproject had four principal objectives: (i) to evaluate existing urban energy fluxschemes, (ii) to test/validate algorithms to compute the urban albedo, surfacetemperature and convective sensible heat flux using satellite data, (iii) toevaluate the ability of high resolution atmospheric models to simulate theurban boundary layer, and (iv) to provide reference datasets of the dynamicfields and diurnal cycles for further studies of urban atmospheric physics andchemistry (Mestayer and Durand, 2002).
URBAN BOUNDARY-LAYER CAMPAIGN UBL/CLU-ESCOMPTE 317

The present paper describes first the nature of the Marseille area usingdetailed mapping analyses (Section 2), the experimental set-up (Section 3 andTable I) and instrument intercomparisons (Section 4). This is followed byoverviews of the objectives, experimental rationale, measurement details andpreliminary results of each of the field project facets: the surface energybalance of the city centre (Section 5), the variability of air temperature andhumidity in the urban canopy (Section 6), the three-dimensional (3-D)structure of the UBL documented by airborne and ground-based remotesensing systems (Section 7), and the visible and thermal infrared measure-ments from ground, aircraft and satellites (Section 8).
2. Marseille Area
Marseille is located on the Mediterranean coast in an arena of hills rising to400–650 m above sea level (asl); between the hills small valleys convergetowards the ancient harbour ‘Vieux Port’ and the Prado beach, which arethemselves separated by a steep hill about 200 m high. The city faces the seaon the west (Figure 1), in the southern part of a large bay (scale of �100 km),with the sea to the south-south-west. This combination of orientations isimportant when analysing sea-breeze episodes as well as when the weather isdominated by the mistral (the wind exiting from the Rhone valley in thenorth and turning towards the east when reaching the coast).
2.1. SURFACE DATABASE
Numerical databases necessary for the calculation of aerodynamic andthermodynamic features of urban areas for use in planning field projects, oras input to models, rarely exist with sufficient detail. In this project, twomethods have been used in parallel to obtain geo-referenced databases ofsurface materials and morphology: firstly, high resolution satellite observa-tions, and secondly, urban and geographic elevation databases.
2.1.1. SPOT 4 Image Analyses
Two multi-spectral and panchromatic images obtained from Spot 4 on June17, 2000 have been analysed to map the surface cover of the city. The two setsof data were combined, the image re-sampled at a resolution of 10 m and asite-adapted classification was created. This involved the use of numericalmasks and the creation of two classifications; the first from the multi-spectraldata for ‘built/mineral’ surfaces (rocks, bare soil, pavement, roofs); the sec-ond for vegetated surfaces based on the Normalized Differential VegetationIndex (NDVI) and Soil Adjusted Vegetation Index (SAVI). The combinedclassifications were vectorized and integrated into a Geographical Informa-
P. G. MESTAYER ET AL.318

TABLE
IInstruments
attheurbansites.
Site
Variable
Instrument
Model
z(m
)
VAL
u,v,
w,u�,
QH,T,s
Sonic
anem
ometer
Metek
USA-1
10
U,V,C
2 T,r w
,Tv
SodarRASS
Metek
DSDPA
90-24
50–500
O3,Extinction
UV
lidar
Elight510M
250–2500
PM,C
2 n,U
rLidar
TWL
1,000–6,000
STJ
u,v,
w,u�,
QH,T,s
Sonic
anem
ometer
Metek
USA-1,Gill
25,22.5
H2O
Kryptonhygrometer
CampbellKH
2O
25
Psychrometer
Dry
andwet
thermocouples
22.5,r
K#;K";L#;L"
Radiometer
KippandZonen
CM7
and8,Crouzet,EppleyPIR
22.5,r
Tprofile
Thermocouple
T-type(C
u-constantan)36awg
4levels
Surface
temperature
Thermocouple
T-type(C
u-constantan)36awg
r,4places
Composite
radiativeT
Infrared
radiation-thermometer
Barnes,Mirage
r
U,V,W,C
2 T,rw
Sodar
Rem
tech
PA1
70–350
OBS
u,v,
w,u�,
QH,T,s
Sonic
anem
ometer
CampbellCSAT3
12
H2O
Kryptonhygrometer
CampbellKH
2O
12
TThermocouple
12
K#;K";L#;L"
Radiometer
KippandZonen
CM3,CG3
12,r
GHeatstoragein
ground
HFP-01
0
U,W,C
2 n,e
UHF
radar
LA
100–2,000
T,RH,O
3Tethered
balloon
20–300
URBAN BOUNDARY-LAYER CAMPAIGN UBL/CLU-ESCOMPTE 319

TABLE
I(C
ontinued).
Site
Variable
Instrument
Model
z(m
)
CAA
u,v,
w,u�,
QH,T,s
Sonic
anem
ometer
RM
Young81000
44,38
CO
2,H
2O
Infraredgasanalyser
Licor-7500
44,38
K#;K";L#;L",
Q*
Radiometer
KippandZonen
CNR1
38,0
T(profile
andsurface)
Thermocouple
OmegaT-type36awg
9·
T,RH
Airtemperature/R
Hsensor
Vaisala
HMP35C
Gill
radiationshield
38
Surface
moisture
Weiss-type
r
Surface
temperature
Infraredradiation-thermometer
Everest,various
various
C2 T
Scintillometers
LAS
30
GLM
u,v,
w,u�,
QH,T,s
Sonic
anem
ometer
Gill,RM
Young81000
30,18
H2O
Kryptonhygrometer
CampbellKH
2O
30,18
K#;L#
Radiometer
KippandZonen
CM5,
EppleyPIR
r
U,V,W,C
2 T,r w
Sodar
Aerovironment
10–150
r=
rooflevel,seetext.
P. G. MESTAYER ET AL.320

tion System (GIS) (Figure 2). Some urban elements were difficult to distin-guish from each other. For example, dense housing and industrial areas;herbaceous vegetation of the city edges and parks, gardens and lawns withinthe city; and bare soil, limestone hills or burned areas. This problem has beenencountered in other urban areas (Armand, 1995). Results can be improvedby the use of an image taken during the spring, when stronger contrastsbetween urban vegetation and surrounding mineral surfaces may be ex-pected. The classification was used to create grids with 100-m and 200-mresolution of the percentage of each land cover class.
2.1.2. BDTopo Analysis
The BDTopo database of the French National Geographic Institute (IGN)contains information on ground cover, including different types of vegeta-tion, buildings, the river and stream network, and the road/street network.
Figure 1. Map of Marseille city and its vicinity (analysed section of the BDTopo). The Etoileridge lies immediately north of the map limit. The map indicates the limits of the main built-up
area (Long, 2003), the stars – the positions of UBL/CLU measurement stations; the diamonds– the T-RH network, and the straight lines – the scintillometer paths.
URBAN BOUNDARY-LAYER CAMPAIGN UBL/CLU-ESCOMPTE 321

Each element in the database is a polygon with geographic coordinates(Lambert III) and an accuracy <1 m. Topographic points/contours andaltitudes of building roofs and tops of trees are included (Figure 1). DFMapsoftware, developed by Long et al. (2002), was used to convert the vectordata to raster and to compute spatial statistics such as average buildingheights (Figure 3), volumes, perimeters, compactness (the surface-to-perim-eter ratio compared to that of a circle*), plan area fractions of buildings,vegetation, water bodies, and pavement, building number per cell(40,000 m2), mean street width, and aspect (street height:width) ratio. Theroughness length and the zero-plane displacement height for momentumwere calculated using the Raupach (1994), Bottema (1997) and Macdonaldet al. (1998) methods with direction-dependent frontal and lateral surfaceindices. The cell size and model parameters can be chosen by the user.
2.1.3. Marseille Area Analysis
Initial comparisons between the data within BDTopo, the cadastral databaseof the City’s geographic and environmental service, the Spot satellite imagesand the derived maps of urban land cover properties demonstrate severallimitations for each approach (Long et al., 2003a). For example, BDTopostrongly underestimates the vegetation cover in the city centre.
Figure 2. Land use in Marseille area derived from initial Spot 4 data analysis (no correction
for vegetation cover).
� Compactness C ¼ (Sc/Pc)/(Sb/Pb), with Sc ¼ Sb, where S is surface and P perimeter, andwhere indices c and b indicate circle and building.
P. G. MESTAYER ET AL.322

The minimum cell size having both aerodynamic and statistical signifi-cances has been shown to be �200 m (Long, 2003). A k-means automaticclassification (nuees dynamiques, Diday et al., 1982) of the urban fabricbased on 10 morphological and land cover parameters (see above) obtainedwith DFMap were used to classify the urban area into relatively homoge-neous areas from both morphologic and aerodynamic viewpoints. Ninedistrict types were identified: centre (Figure 1), pericentre (Figure 1), i.e., thequarters immediately around the centre with mostly 3-storey row buildingsand long industrial buildings, residential buildings, small residential build-ings, high density individual housing (Figure 1), low density individualhousing (Figure 1), sparse individual housing, residual individual housing,and the big buildings. This last district type covers only eight cells withatypical buildings.
The population of the metropolitan area is about one million. Except in thecity centre, the harbour area and the outskirts of the city, buildings are mostoften composed of a mix of single or row houses and small ensembles of 4- to10-story apartment buildings. In the city centre, roughly within a circle 2 kmin radius around the Vieux Port, the street pattern is relatively regular and thebuildings form a dense canopy averaging 15 m in height, with a few higher,isolated buildings (centre in Figure 1). Around the harbour is a 0.5- to 1-kmwide strip of relatively low warehouse and industrial buildings and large openpaved surfaces that extend along the coast north of Vieux Port (pericentre inFigure 1). The outskirts of the city are mainly composed of individual houseswith gardens, of varying density, in relatively small lots spread over the hill
Figure 3. Average building heights (m) in the city centre around the CAA site, as computedwith DFMap. Here the grid size is 100 m, showing artificial variability due to a too small
number of buildings per grid cell.
URBAN BOUNDARY-LAYER CAMPAIGN UBL/CLU-ESCOMPTE 323

slopes (high density suburbs and low density suburbs in Figure 1). The wholearea is interspersed with small groups of large residential buildings (blocks offlats). The city contains few isolated high-rise towers.
3. Experimental Set-Up
3.1. SURFACE-LAYER MEASUREMENTS IN THE URBAN AREA
In the urban area, five stations were equipped with micrometeorologicalmasts, aligned along a north–south axis, roughly parallel to the shoreline(indicated with stars in Figure 1). Continuous measurements of radiation andturbulent fluxes necessary to monitor the local-scale surface energy balancewere made at three urban stations GLM, CAA and STJ. At these sites mastsextended 12–25 m above the top of the urban canopy and turbulent fluxeswere measured at two levels (Section 4).
The central site (CAA) was located in the 19th century portion of the citycentre that is relatively and uniformly dense (Grimmond et al., 2002); atelescoping mast was installed on the roof of the Cour d’Appel Adminis-trative (CAA) (43.29� N, 5.38� E, 13 m asl). Details of the sensors andmeasurement heights are given in Sections 4 and 5 and Table I. This site wasalso equipped with an array of up to 19 infrared radiation thermometers(IRTs), either fixed to monitor the surface temperature of selected surfaceelements, or hand-held to evaluate surface temperature distributions withinstreet canyons during intense observation periods (Roberts et al., 2003). Airtemperature differences between the interior and exterior of buildings duringsome periods were also monitored.
Two large aperture scintillometers (LAS) were installed over the city centrebetween June 12 and July 10; each is of 0.152 m diameter and operates at0.93 lm. Transmitters and receivers were placed on the terraces of threebuildings (Paradis, Nedelec and Timone Hospital) giving path lengths of 1785,1878 (black straight lines in Figure 1) and 2308 m (double line in Figure 1).The average height of the optical beam above the estimated zero-plane dis-placement height was about 30 m (Irvine et al., 2002; Lagouarde et al., 2002b).
The STJ station was located at the Technical University Institute (IUT)St Jerome (43.34� N, 5.41� E, 130 m asl), in a heterogeneous suburban areacomprising a mixture of small individual villas with gardens and 4-storeyapartment houses. Within an approximate 1 km radius of the tower themean building height is 6.6 m with a standard deviation of 4.8 m. In thesouthern sector (university campus) and the northern direction, buildingheights vary between 13 and 17 m, while to the west there was no buildingwithin 500 m of the station. The building plan area density was low, about0.1–0.2, except in the northern direction (maximum of 0.58) and immediately
P. G. MESTAYER ET AL.324

to the west 0.35–0.4. The turbulence flux sensors (Table I) were mounted attwo levels on a 12-m mast, installed on the flat roof of a 13-m high building,with the upper level at the top of the mast and the other 2.5 m lower. TwoIRTs monitored the composite surface temperatures immediately north andsouth of the site.
The GLM site was located 2.5 km east of the sea in the southern part ofthe city, in the grounds of a research campus (43.25� N, 5.40� E, 32 m asl).The immediate neighbourhood is mainly residential, including tall buildings,with moderate plan area densities; the mean building height is 10.5 m with astandard deviation of 7.5 m. A 30-m pneumatic tower was installed on theground between buildings (Coppalle and Talbaut, 2002), and was equippedat two-levels, at the top of the mast and at 18 m above ground level (agl).
The Observatoire site (OBS) (43.30� N, 5.39� E, 70 m asl) was located inthe observatory gardens on the hill of the Palais Longchamp park and zoo,2 km north-east of the CAA site. To the west and north is the main trainstation with large sheds and workshops. In the other directions there wereresidential areas similar to those in the city centre at the central site (CAA).Within about 1 km of the station the mean building height was about 11.4 mwith a standard deviation of 4.7 m. The turbulence sensors were mounted ona 10-m high mast erected on a grass site at the top of the hill.
The northern station Vallon Dol (VAL) (43.36� N, 5.40� E, 285 m asl)was located at the edge of the urban area, 2.5 km further north from the STJstation, in the vicinity of a small water reservoir 450 m in diameter(220 m asl). The terrain slopes upward to the Etoile ridge, with an averageslope of 15%. Except for a dense housing estate located about 0.7 km to thesouth-east, and a scattered settlement to the south, the area around the siteis covered with sparse scrubland. Flux measurements were obtained using a3-D sonic anemometer at the top of a 10-m mast.
The spatial and temporal structure of the air temperature and moisturefields in the canopy layer were documented with a network of 20 automaticstations (T-RH network). Air temperature and moisture were recorded every10 min using platinum resistance thermometers for air temperature, andcapacitance probes for moisture. The instruments were installed in meteo-rological shields on 2-m horizontal booms fixed to street light poles, generallyat a height of approximately 2/3 of the mean surrounding building height.
3.2. GROUND-BASED VERTICAL PROFILE MEASUREMENTS
The two suburban sites (STJ and GLM) were equipped with Doppler sodarsto measure the wind profile in the atmospheric surface layer (Coppalle andTalbaut, 2002). The OBS site hosted a wind profiler UHF radar, a tetheredballoon that was used to measure thermodynamic and ozone profiles from
URBAN BOUNDARY-LAYER CAMPAIGN UBL/CLU-ESCOMPTE 325

20 to 300 m occasionally, and a radiosonde balloon-launching system. TheVAL site included a RASS-sodar vertical sounder for temperature and windcomponents and two lidars that scanned horizontally and vertically out toa distance of about 10 km: a UV angular lidar (Elight, model 510M) forozone concentration, and a 10-lm Doppler lidar (called TWL, Transport-able Wind Lidar) for the radial wind component. Both lidars providedinformation on the aerosol content in the scanned volume, and were ope-rated in parallel to generate tomographic observations of the urbanboundary layer (Section 7).
3.3. INTENSIVE OBSERVATIONAL PERIOD MEASUREMENTS
Most of the above-mentioned measurements were recorded continuouslyduring the six weeks of the campaign, with the exception of the sodars thatoccasionally operated at reduced power during nights and week-ends, and thelidars and the tethered balloon that were mainly restricted to the intensiveobservation periods (IOPs).
During the campaign, two types of IOPs were conducted (Table II): (1) thefive ESCOMPTE IOPs (called 1, 2a, 2b, 3 and 4, lasted a combined total of15 days) during situations with land/sea breezes and high insolation, mixedwith a light mistral during IOPs 2a and 4. During these periods an airplaneflew over Marseille, measuring the atmospheric composition and the windand turbulence within or near the top of the boundary layer. IOP 3 wasfollowed by a three-day period during which the atmospheric boundary layer(ABL) was also documented by the aircraft (ABL IOP); (2) the four thermal
TABLE IICalendar of the UBL/CLU-ESCOMPTE campaign.
Events Date (2001)
Intercomparison June 4–8
IOP 1 June 14–15
IOP 2a June 21–23
IOP 2b June 23–26
TIR day 1 June 26
TIR day 2 June 30
IOP 3 July 2–4
ABL IOP July 5–7
IOP 4 July 10–13
TIR day 3 July 10
TIR day 4 July 12
P. G. MESTAYER ET AL.326

infrared (TIR) IOPs, when a light airplane equipped with a TIR scannerrecorded images of the urban canopy at different times of the day.
The combined influence of the sensor viewing angles and the sun illumi-nation geometry on the surface temperature measurements were documentedby flying sequentially in eight different directions with respect to the sun overthree typical areas of the city, including the city centre around the CAA sitewith its array of IRTs (Section 8). Radiosondes were launched from the OBSsite during these IOPs, and air temperature was also monitored at the 2-mlevel with the ‘T-RH Clio’, a car equipped with shielded air temperature andhumidity sensors at 2-m height, driven under the flight paths. During thelight aircraft overflights, there was also additional sampling of surface tem-peratures in the downtown area using: (a) teams of observers equipped withhand-held IRTs who conducted detailed sampling of temperatures frombuilding walls and streets; (b) a thermal scanner mounted on the roof of a tallbuilding to sample detailed images of street-canyon temperatures (includingsome roof temperatures).
3.4. COMPLEMENTARY DATASETS
Satellite images from the observation period were collected from a variety ofsensors and platforms (Section 8). A series of 159 images were acquired fromthe Advanced Very High Resolution Radiometer (AVHRR) on board sat-ellites NOAA-12, NOAA-14 and NOAA-16, giving an average of fourimages per day, each with a resolution of 1.1 km in the visible, NIR and TIRwavebands. Sixty-six images from the MODIS sensor on board the TERRAsatellite were also obtained from the NASA/EOSDIS data centre. In addi-tion, the UBL/CLU dataset comprises the SPOT 4 multi-spectral and pan-chromatic images acquired during two flights, with a 15-m resolution, and the‘physiographic’ maps obtained from the analyses described in Section 2(Long et al., 2002).
As a companion project, GPS-ESCOMPTE, a network of 18 GlobalPositioning System (GPS) receivers was deployed from June 6 to June 27 tocontinuously monitor the integrated depth of water vapour and the hori-zontal and vertical moisture gradients via a tomographic technique (Bocket al., 2004; Walpersdorf et al., 2004). Of the receiver array, 12 were locatedinside the Marseille urban area, and are used to describe the structure andevolution of the water vapour field in the urban boundary layer.
The UBL experimental set-up described here does not include pollutantchemistry measurements since they were part of the ESCOMPTE fieldcampaign and are described elsewhere (Cros et al., 2004) All data obtainedduring the campaign are included in the ESCOMPTE comprehensive data-base, now freely accessible (medias.obs-mip.fr/escompte).
URBAN BOUNDARY-LAYER CAMPAIGN UBL/CLU-ESCOMPTE 327

4. Data Quality Issues
4.1. INTERCOMPARISON OF FLUX INSTRUMENTS
The deployment of multiple dynamic, thermodynamic and chemical sensorsand analysers during the ESCOMPTE campaign necessitated careful atten-tion to instrument intercomparison. Here we restrict consideration to thesurface energy flux instruments deployed at twelve rural and urban surfacestations. The intercomparison was conducted from June 5–7 at a site locatedin the semi-arid part of La Crau. This plain, west of Marseille (43� 34¢ N, 04�49¢ E, 10 m asl), extends over more than 108 m2 and consists of a flat, uni-form, almost bare soil surface composed of clay and stones, with sparsegrass. The site is characterized by a fetch greater than 1 km in all directionsand a roughness length of about 0.015 m. The wind blew from the south onJune 5 (180�, 7 m s)1) whereas the mistral prevailed on June 6 (330�, 8–9 m s)1). The net radiation peaked between 500 and 600 W m)2 at noon onboth days, being interrupted only by small fair weather cumuli.
Ten masts were installed on an area of about 104 m2, with separationsranging from 20 to 100 m (Table III). Flux measurement at one station wasbased on the simplified aerodynamic method, whereas all the others usedfast-response sensors (10 or 20 Hz) and the eddy-covariance method. Elevensonic anemometers from five different companies, one Li-cor 6262 and eightkrypton KH2O hygrometers were operated during the comparison. Most ofthe sonic anemometers were mounted at 5–6 m agl, except for one at 2 m andone at 8 m. Given the fetch and site character, these measurement heightsshould all lie in the constant flux layer.
Participating research groups analysed their own data using their ownmethods; all used 15-min block averages. Therefore, the following compar-isons integrate the uncertainties of both measurement and data processing.The results presented here are restricted to the heat and moisture fluxes, w0T0
and w0q0, and the friction velocity u� ¼ ð�u0w0Þ1=2, where u0, w0, T 0 and q0 arethe instantaneous deviations of the streamwise and vertical wind compo-nents (m s)1), temperature (�C), and absolute humidity (g m)3), from theirrespective 15-min means. The temperature measured by the sonic ane-mometers is nearly the virtual temperature and requires correctionfor moisture influences; this could easily be performed when the specifichumidity was also measured close by (Larsen et al., 1993), but unfortunatelythis was not available at some stations. However, given the low values of themoisture flux during these 2 days, the flux correction did not exceed 2%,except when the sensible heat fluxes were very low. Therefore the resultsbelow are unlikely to be significantly affected. The mean parameters mea-sured at 6 m agl have also been compared. The differences between theindividual measurements and the averaged values of wind speed and tem-
P. G. MESTAYER ET AL.328

perature are less than 5%, while wind direction measurements were within ±20� from the mean direction.
Figure 4 shows a comparison between the time series of w0T 0, w0q0 and u�obtained from each station. The number of estimates varied with time be-cause some groups were unable to participate through the entire period, andthe number of participating systems ranged from 2 to 9 for w0T 0, 2 to 6 forw0q0, and 2 to 10 for u�. The hourly means and standard deviations are alsogiven. Between 0800 and 1600 UTC, the uncertainty for w0T 0 and u� is in therange of 10–20% (Figure 4a and c), whereas w0q0 estimates are more scatteredand their uncertainty lies between 20% and 40%. Linear regressions betweenthe results of each station and the average of all other stations were calcu-lated for each station (Figure 5). For w0T 0 and w0q0, only daytime (0700–1800UTC) data are taken into account since the fluxes were very small at night.
TABLE III
Research groups and sensors involved in the flux intercomparison (italics indicate stations that
did not measure latent heat flux).
Laboratory Sensors Measurement height (m)
CNRM Simplified aerodynamic method
Cup anemometers PT1000 W0.9 and 2.5
Sonic: Gill
Campbell krypton KH2O
6
CORIA Sonic: Young
Campbell krypton KH2O
5.57
Sonic: Gill
Campbell krypton KH2O
5.54
ECN/CSTB Sonic: METEK USA-1
Campbell krypton KH2O
5.19
Sonic: Gill
Krypton KH2O
5.43
LA Sonic: CSAT3 Campbell
Campbell krypton KH2O
6.63
Sonic: Gill
Campbell krypton KH2O
8.50
INRA Grignon Sonic: Gill 1012
Licor 6262 (H2O/CO2)
5.80
INRA Bordeaux Sonic: Young 81100 firmware 2.5 2.15
Indiana University Sonic: R.M. Young Model A 5.92
Sonic: Applied Technology
Instruments SWSW-211/3K
5.28
URBAN BOUNDARY-LAYER CAMPAIGN UBL/CLU-ESCOMPTE 329
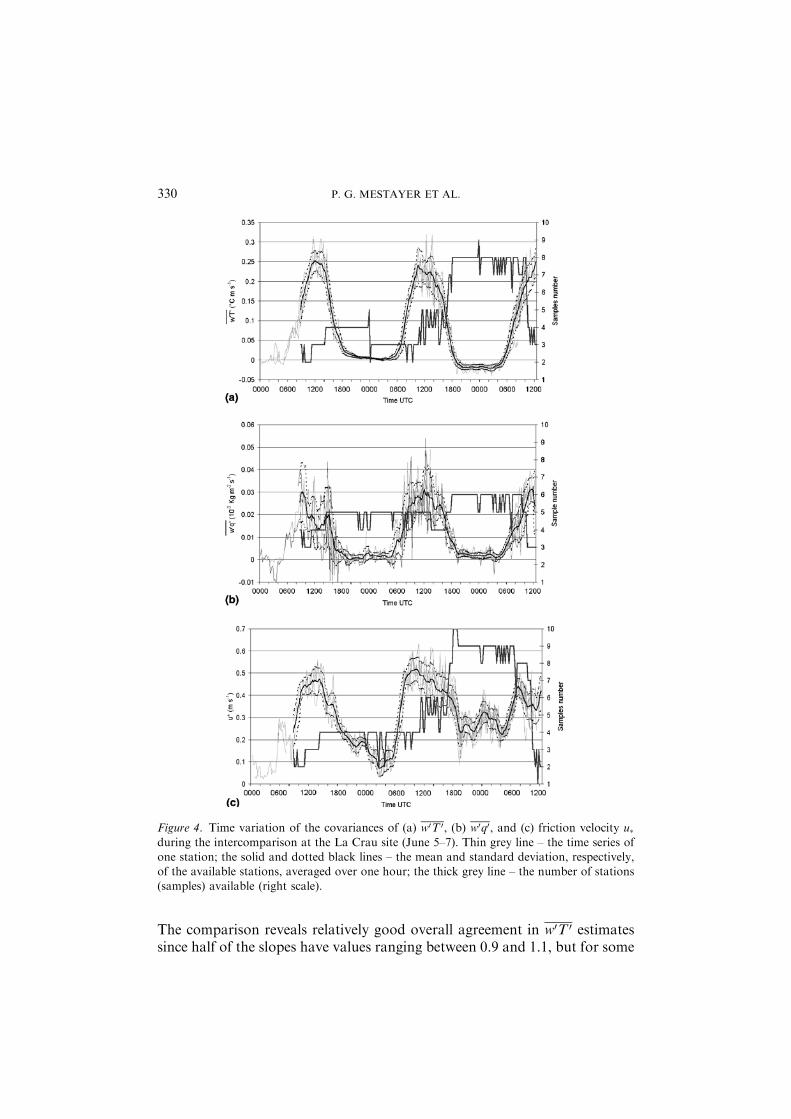
The comparison reveals relatively good overall agreement in w0T 0 estimatessince half of the slopes have values ranging between 0.9 and 1.1, but for some
Figure 4. Time variation of the covariances of (a) w0T 0, (b) w0q0, and (c) friction velocity u�during the intercomparison at the La Crau site (June 5–7). Thin grey line – the time series ofone station; the solid and dotted black lines – the mean and standard deviation, respectively,of the available stations, averaged over one hour; the thick grey line – the number of stations(samples) available (right scale).
P. G. MESTAYER ET AL.330

stations the slope may vary up to 0.7 or 1.3 (Figure 5a) corresponding to a30% difference in the flux. Similar results are obtained for the friction velocity(Figure 5c). The w0q0 results (Figure 5b) show large discrepancies between theslopes and intercepts (evident in the observations of Figure 4b), the scatterbeing partly due to the sensitive calibration of Krypton hygrometers, whichcan vary over time.
In conclusion, the time series of the various covariance estimates agreequite well for w0T 0 and u�, but are more scattered for w0q0. The regression
Figure 5. Intercepts and slopes of the linear regressions of individual station measurements
versus averages of the available stations: (a) w0T 0 (b), w0q0, and (c) u�. The circle diameters andthe associated numbers represent the number of measurements used in the regression.
URBAN BOUNDARY-LAYER CAMPAIGN UBL/CLU-ESCOMPTE 331

analysis indicates that about half of the stations show bias that is not neg-ligible but could be corrected for, at least in part. Such corrections are notapplied to the data presented here.
4.2. INTERCOMPARISON OF SENSORS USED IN THE THERMODYNAMIC NETWORK
Before the campaign, the 20 sensors of the T-RH network were compared intheir shields, yielding a standard deviation of 0.08 �C for temperature, and0.75% for relative humidity; the observed maximum average differences be-tween two sensors were 0.40 �C and 3.2%. The network operated continu-ously during the campaign with no missing data. It must be noted that datafrom instruments such as psychrometers could not be used, since a rapiddegradation of sensor performance due to urban pollution was observed.Also, instruments such as the KH2O hygrometer required frequent cleaningduring the 6-week period.
4.3. MEASUREMENT ISSUES AT THE URBAN STATIONS
The scientific study of urban atmospheres demands meteorological mea-surements that are representative of urban surface conditions at the localscale. Given the structure of the urban canopy and its considerable hetero-geneity this is not an easy task (Oke, 1998). Conceptually, the ‘surface’ re-ferred to here is that of the top of a volume extending from the measurementplane down to a depth in the ground at which vertical fluxes are zero over theperiod of observation (this concept is described in Oke, 1988). The volumeitself therefore contains air, built features, trees and soil. This can be achievedby placing instruments in the inertial sub-layer, i.e., above the roughness sub-layer, where their source areas (radiative and turbulent) are sufficiently largeto ‘see’ a large enough portion of the surface and hence be representative of it(Schmid, 1997). To be in the inertial sub-layer instruments need to bemounted at 1.5 to about 3 times the average building height HB although thespacing of the buildings also is important (Raupach et al., 1980). However,since the fetch requirement increases with height above the ground, the sitemust be sufficiently homogeneous and horizontally extensive to providerepresentative source areas, which usually means evaluating the detailednature of the neighbourhood around the site out to a radius of 1–2 km.Setting the instrumentation on top of a building is convenient for security,but to provide spatially representative data requires careful siting due to theinfluences of the building itself: wind flow distortion, upward radiationsensors view factor, footprint variation with height. Ground-based masts alsoencounter problems of representativeness, mainly due to the presence of‘obstacles’ such as neighbouring buildings.
P. G. MESTAYER ET AL.332

The micrometeorological instrumentation operated at the five urban sitesis specified in Table I. Component fluxes of the radiation balance, viz:downward and upward fluxes of shortwave radiation (visible and UV), K#and K", respectively, and longwave (infrared) radiation, L# and L",respectively were monitored. The turbulent fluxes of momentum, sensibleheat (QH), and water vapour (E, or latent heat QE ¼ LVE, LV being the latentheat of vaporization) were obtained from eddy covariance measurementsusing a sampling rate of 10 or 20 Hz. Hence the energy balance:
K# �K" þL# �L"¼ Q� ¼ QH þQE þ DQS ð1Þ
was evaluated where Q* is the net all-wave radiation, and DQS includes heatstorage in the ground, building materials, vegetation and canopy air volume.
The turbulent and radiation fluxes were all processed using 15- or 30-minblock averages. Since the CAA, STJ and GLM stations were designed toprovide reference data for the energy balance above typical urban and sub-urban districts, assessment of data representativeness required specialattention in addition to the sensor intercalibration.
4.3.1. City Centre Station (CAA)
Eddy covariance instruments and radiometers were mounted on a HilomastNX30 pneumatic tower. The base of the tower was 20.7 m agl and the towerwas operated at two heights depending upon the wind speed. When the towerwas fully extended, in position ‘Up’, the topflux sensors (Level 1)weremountedat 43.9 m agl, while they were at 34.6 m agl in the lower position (‘Down’). Alower set of sensors (Level 2) was mounted 6 m lower i.e. at 37.9 and 28.6 m inthe ‘Up’ and ‘Down’ modes respectively (Grimmond et al., 2002). The averageheight of the surrounding buildings was 15.6 m. The buildings in the area werequite homogeneous and of high density, resulting in good measurement rep-resentativeness of the city centre (Grimmond et al., 2002).
4.3.2. North Suburban Station (STJ)
The STJ experimental set-up potentially poses a problem related to theinfluence of the building itself on the measurements, since the wind impact onbuilding faces generates wakes that alter the flow above the roof. The mastwas located on the western part of the building roof, and wake effects wereexpected when the wind was from the east, essentially parallel to the long-axisof the building. The mean vertical velocity, analysed as a function of winddirection, showed that measurements made when the wind direction was inthe sector 75–170� were influenced by the wake. The influence of onetall building wake also appeared in the 310–350� sector. These effects wereobserved only for wind velocities higher than 5 m s)1. Although these flow
URBAN BOUNDARY-LAYER CAMPAIGN UBL/CLU-ESCOMPTE 333

perturbations may be corrected, data from these wind directions are rejected(16%) for the present study. Comparison of the momentum and heat fluxesobtained at the two levels suggests that the turbulence sensors were thenwithin the constant flux layer (Figure 6).
4.3.3. South Suburban Station (GLM)
The area surrounding this site is quite heterogeneous resulting in a varietyof flux footprints as a function of wind direction; this means that specialcare is needed when using these data for applications such as assessing
0
1
2
3
0 1 2 3
ρu*2 (N m-2) - lower level
ρu*2
(N
m-2
) - u
pper
leve
l
(a)
-200
-100
0
100
200
300
400
500
-200 -100 0 100 200 300 400 500
QH (W m-2 ) - lower level
QH (
W m
-2 )
- upp
er le
vel
(b)
Figure 6. Comparison of the turbulent (a) momentum, and (b) sensible heat fluxes measured
at two levels of the St Jerome suburban station (STJ). Squares are the data used in furtheranalyses, and crosses are those discarded due to building wake effects.
P. G. MESTAYER ET AL.334

energy exchange models. The lower sensors, at 18 m agl, were approximatelyat the roof level of the closest buildings, implying that the sonic datawere perturbed by building wakes when the wind was from the south andeast. For westerly winds, especially during sea-breeze conditions, nosystematic difference between the turbulent fluxes measured at the two levelswas observed (Figure 7) although there is greater dispersion than at STJ(Figure 6). Data from the different wind directions should therefore beanalysed differently.
0.0
0.5
1.0
1.5
0.0 0.5 1.0 1.5 (a)
-100
0
100
200
300
400
500
-100 0 100 200 300 400 500(b)
ρu*2
(N
m-2
) - u
pper
leve
l
ρu*2 (N m-2) - upper level
QH (W m-2 ) - upper level
QH
(W
m-2
) - u
ppee
r lev
el
Figure 7. Comparison of the turbulent (a) momentum, and (b) sensible heat fluxes obtainedduring one week at two levels of the GLM suburban station. Superimposed squares indicate
data with westerly winds.
URBAN BOUNDARY-LAYER CAMPAIGN UBL/CLU-ESCOMPTE 335

5. Surface Energy Balance Fluxes in the City Centre
5.1. SURFACE ENERGY BALANCE
Surface energy balance fluxes were measured for a total of 28 days (June 16–July 14) at the CAA site. Hourly values are presented in Figure 8 for the
Flu
x de
nsity
(W
m-2
)
Time (UTC, DOY)
Q*QHQE
(a)
-100
0
100
200
300
400
500
600
700
172 173 174 175 176 177 178
-200
-100
0
100
200
300
400
500
600
0 0400 0800 1200 1600 2000
Flu
x de
nsity
(W
m-2
)
Time (UTC)
Q*QHQE
QS
(b)
Figure 8. (a) Observed surface energy balance fluxes for the six days of IOP 2a and 2b (days172–178, June 21–26) at CAA and (b) ensemble mean for the period including the storage heat
flux determined as the residual of the observed terms.
P. G. MESTAYER ET AL.336

6-day period of intensive observations IOPs 2a and 2b. The tower was fullyextended throughout this period, with the top sensors at 43.9 m agl.
Results (Figure 8) show that the turbulent sensible heat flux is the dom-inant mode of heat transfer away from the surface during the middle ofthe day. As found at other densely developed urban sites in other cities theconvective sensible heat flux remains positive throughout the night, sus-tained by large releases of heat stored in the urban fabric from the previousday (Oke, 1988; Grimmond and Oke, 1999, 2002). As expected, giventhe absence of vegetation cover at this site and the dry conditions duringthe measurement period, the latent heat fluxes are small. As found inother urban areas (Grimmond and Oke, 1999), DQS peaks before solar noonand turns negative a couple of hours before the net all-wave radiation (Q*).Heat storage at this site has been investigated in detail by Roberts et al.(2003).
5.2. SENSIBLE HEAT FLUXES ESTIMATED USING SCINTILLOMETERS
Line-averaged QH from the LASs was computed over 15-min periods usingtwo methods (De Bruin et al., 1995; McAneney et al., 1995). The first method(M1 in Figure 9) combines the scintillometer-derived temperature scale T�with the friction velocity u�, determined independently, to estimateQH ¼ �qcpu�T�, where q is the air density and cp the specific heat of air at
Figure 9. Comparison of the turbulent sensible heat flux derived from scintillometer mea-
surements (LAS) using the mixed and free convection methods (M1 and M2, respectively) andthe eddy covariance measurements (EC) from the city centre mast at CAA, for the period June16–21. The short integration time (15 min) explains some of the variability observed in the EC
values.
URBAN BOUNDARY-LAYER CAMPAIGN UBL/CLU-ESCOMPTE 337

constant pressure. The second method (M2) assumes free convection and QH
is computed directly from the measured structure parameter for temperature,C2
T. The very good agreement found between both methods and the eddycovariance (EC) measurements on the CAA central mast (Figure 9) illus-trates the promising potential of scintillometry for urban areas where spatialheterogeneity is large (Lagouarde et al., 2002a).
To evaluate the possible spatial variability of QH, one scintillometer wasmoved between two transects during the experiment (double line, in Fig-ure 1); the observed differences from the scintillometers reached 15%. Thelocation of the flux footprint of each scintillometer has not been calculated,yet this could help determine whether these differences are due to variationsin the surface area upwind of the optical paths, and how these differencesvary according to the wind direction. Spectral analysis of the optical scin-tillations has also been undertaken to evaluate the refraction and absorptioncomponents in the signal, so as to ensure the final quality of the data (Irvineet al., 2002).
5.3. PRELIMINARY EVALUATION OF TEB USING MEASURED SURFACE ENERGY
FLUXES
The Town Energy Balance (TEB) scheme of Masson (2000) parameterisesenergy exchanges between the urban surface and the atmospheric boundarylayer. TEB has been evaluated off-line using observations of local scale fluxesand surface temperatures from Mexico City and Vancouver (Masson et al.,2002), and with the Meso-NH atmospheric model for Paris (Lemonsu andMasson, 2002). In this study, the TEB scheme is used for built areas and theISBA (Interaction Soil-Biosphere-Atmosphere) scheme (Noilhan and Plan-ton, 1989) for vegetated areas. The two models are combined using the planareas of built and vegetated surfaces as the weighting. The performance ofthe combined model is evaluated for the city centre of Marseille using theobserved temperatures and surface fluxes.
Here a static modelling domain was defined for the area within a 500-mradius centred on the CAA site. The TEB input parameters (surface coverfractions and geometric dimensions of the streets) were derived from theanalysis of aerial photographs (Grimmond et al., 2002) and the databaseof building heights (Section 2). Thermal properties of materials were as-signed based on published sources (ASHRAE, 1981; EDF and Atelier duPatrimoine de la ville de Marseille, 1983; Oke, 1987). Given the importanceof traffic in the city centre, an anthropogenic heat flux was estimatedfollowing the method of Grimmond (1992). In off-line mode the TEB-ISBAmodels are forced by observations of air temperature, humidity, wind speed,
P. G. MESTAYER ET AL.338

and incoming solar and longwave radiation at the top of the tower. ForMarseille, TEB-ISBA is being evaluated using measurements of air tem-perature from within the street canyons, the surface temperatures of roads,roofs and walls (Section 8), and fluxes from the CAA tower and the LASscintillometers (Lemonsu et al., 2004). It is assumed that the amount ofenergy leaving the top of the canopy does not change with height, as in aclassical ‘constant flux’ atmospheric surface layer, which can be true only fora horizontal spatial average, since vertical and horizontal flux divergenceprevails in the roughness sublayer. Only heat flux comparisons are shownhere and they are simulated well (Figure 10). The model succeeds in pro-ducing a positive turbulent sensible heat flux at night, and the correct dailycycle of heat storage (Table IV). High resolution, 3-D simulations areplanned, using the non-hydrostatic, mesoscale atmospheric model Meso-NH(Lafore et al., 1998) with TEB-ISBA parameters as defined here for the citycentre.
Figure 10. Comparison between observed and simulated surface energy balance fluxes in the
city centre, averaged over 21 days. Black crosses – observed eddy covariance fluxes; contin-uous line – simulated fluxes using TEB, which are an average of the fluxes from roads, walls,roofs and natural surface cover. Grey stars in the turbulent sensible heat flux graph arecalculated from the scintillometer data using the free-convection method (from Lemonsu
et al., 2004).
TABLE IV
Comparison between observed (CAA) and simulated (TEB) surface energy fluxes over the city
centre (RMSE=root-mean-squared error).
Flux Bias (simulated–observed)
(W m)2)
RMSE
(W m)2)
Q* )7.2 28.8
QH )14.5 61.2
QE )7.4 42.3
DQS +13.5 66.2
URBAN BOUNDARY-LAYER CAMPAIGN UBL/CLU-ESCOMPTE 339

6. Temperature and Moisture Variability in the Urban Canopy
6.1. INSTRUMENTAL SET-UP
The T-RH network sites were chosen after considering the patterns producedby high-resolution, numerical simulations with the Meso-NH model includ-ing the TEB urban scheme. The nested-grid runs, with horizontal resolutionsfrom 4 km to 250 m, simulated the so-called ESCOMPTE IOP 0; situationsobserved during the preliminary campaign from June 29 to July 1, 2000. Thethermodynamic fields over the Marseille area were simulated for a north-westerly flow (June 29), a westerly breeze (June 30), and a southerly breeze
Figure 11. Example of a shielded T-RH sensor assembly at a site in the city centre.
P. G. MESTAYER ET AL.340

(July 1), corresponding to flows expected during the full 2001 campaign.Analysis of these preliminary simulations, using empirical orthogonal func-tions, was used to define the most appropriate measurement locations so asto detect the main features of the urban heat island and humidity distribution(Pigeon et al., 2002). In addition, the sensor locations were chosen to doc-ument the thermodynamic response of a variety of urban landscape types(dense centre, suburban, city outskirts), and to include a range of distancesfrom the shoreline according to the observed mean flows (Figure 1). Ameasurement height of 8 m was chosen and the sensors were exposed in themiddle of the street (Figure 11). This position minimized potentially con-fusing microscale influences from the ground and building walls, especially inthe dense city centre.
6.2. THERMODYNAMIC MEASUREMENTS IN THE URBAN CANOPY
Here analysis is restricted to three stations aligned along a south-west tonorth-east axis at distances ranging from 2.5 km (dense urban, city centrearea) to 12.5 km (near-rural area) from the coast The mean daily variation ofpotential air temperature and specific humidity at these stations was com-puted for two characteristic meteorological situations: days with north-wes-terly continental mistral wind (4 days, Figure 12), and those with a weak
Figure 12. Diurnal cycles of average potential air temperature and specific humidity during
mistral (north-westerly wind) conditions, at dense urban, suburban and rural sites.
URBAN BOUNDARY-LAYER CAMPAIGN UBL/CLU-ESCOMPTE 341

synoptic flow and a westerly sea breeze (24 days, Figure 13). Interpretationsare complicated by the competing and augmenting effects of distance fromthe coast, intensity of urban development and elevation.
In mistral conditions the specific humidity is relatively uniform across thewhole urban area, but there is a decrease through the daytime as the air massdries in these windy conditions. The air temperature observations show aweak heat island effect, with a temperature difference of about +1 �C be-tween the rural and downtown sites during the first half of the night, whilethe rural and suburban station differences are small. During the daytime,only small temperature differences between the stations are observed.
Thermodynamic differences between stations are more prominent in thecase of sea-breeze days (Figure 13); there is always a moisture gradient:moisture decreases with increasing distance from the sea. The nocturnal ur-ban heat island magnitude reaches about 2.5 �C only, though the urban heatisland, whilst favoured by low winds, may be reduced by the vicinity of thesea. The height of measurement may also play a role in the observed tem-perature differences since microclimatic effects decrease with height above thesurface. The pattern of warming in the morning is very different at the threesites: from 0500 to 0700 UTC, the temperature increases from 17 to 23 �C atthe rural stations, while it increases only from 19 to 22 �C in the city centre.After this warming period, the inland rural station is warmer than the othersby about 1–2 �C, due to the impact of the sea breeze, while the dense citycentre is slightly cooler than the suburban areas by about 1 �C. Another
Figure 13. Same as Figure 12, but for land/sea-breeze conditions with weak synoptic wind.
P. G. MESTAYER ET AL.342

striking difference between Figures 12 and 13 is the steady temperature in-crease from 0500 to 1500 UTC during mistral days, whereas on sea-breezedays temperature varies by less than 1 �C between 1000 and 1600 UTC.These general features demonstrate the influence of mesoscale flows, that issea breezes or the mistral, on the temperature and humidity fields in the areaof Marseille; their patterns are a mix of the three influences: coast, city, andrelief.
7. Urban Boundary Layer 3-D Structure
The 3-D structure of the urban boundary layer was documented with the helpof airborne measurements, radiosondes, and remote sensing with lidars, so-dars and UHF radar. This 3-D exploration was mainly designed to study, (i)the mesoscale flow circulation linked to the sea breeze, the mistral, and slopewinds, and (ii) the vertical structure of the ABL to assess the urban influenceon the lower troposphere.
7.1. REMOTE SENSING FROM THE GROUND
7.1.1. UHF Radar
A five-beam UHF wind profiler was operated continuously at the OBS sta-tion for the whole campaign. Profiles of horizontal wind, vertical velocity,reflectivity (C2
n), and Doppler spectral width were obtained in clear air every5 min from 100 m agl up to about 2 km (depending on atmospheric condi-tions), with a 75-m vertical resolution. The instrument and processing tech-niques are described by Jacoby-Koaly et al. (2002).
Figure 14 presents time–height sections of UHF observations in the lowest1000 m during the June 25 sea-breeze episode. The continuous black/whiteline shows the top of the ABL deduced from the maximum reflectivity level inFigure 14b. The 1-h averaged dissipation rate of turbulent kinetic energy e(Figure 14c) is deduced from the Doppler spectral width. The morning ascentof the ABL top culminates at 750 m agl at around 1400 UTC; after 1500UTC the ABL starts to collapse when the wind strengthens from the south(Figure 14a), indicating sea-breeze reinforcement. A large fraction of the heatflux is used to warm the relatively cool and humid marine air advectedinland, at the expense of ABL vertical development. The weakness of thebuoyancy flux explains the shallowness of the ABL in the morning and itscollapse early in the afternoon. As shown in Figure 14c, the turbulence,concentrated within the ABL, is rather weak with e values lower than10)3 m2 s)3.
URBAN BOUNDARY-LAYER CAMPAIGN UBL/CLU-ESCOMPTE 343

Figure 14. Time–height sections of UHF profiler observations at the Observatoire (OBS) onJune 25. (a) Horizontal wind velocity (b), C2
n reflectivity, and (c) dissipation rate of turbulentkinetic energy e. The superimposed black or white line is the top of the ABL as deduced from
the maximum UHF reflectivity.
P. G. MESTAYER ET AL.344

7.1.2. Sodars
Three sites were equipped with sodars and mini-sodars, two within the city(GLM and STJ) and the third one at VAL (Table V), the last being equippedwith a Radio Acoustic Sounding System (RASS) that provides profiles of‘sonic’ temperature (see Section 4.1).
Figure 15 displays time–height sections of ‘sonic’ temperature, wind speed,and Doppler spectral width obtained from the RASS sodar at VAL on June25; the ABL-top curve obtained from the UHF profiler is added. There isfairly good agreement between wind fields measured by the sodar (Fig-ure 15a) and the radar (Figure 14a). The sodar Doppler spectral width(Figure 15c), which is related in part to turbulence, shows a similar diurnalpattern to that of e derived from the UHF profiler (Figure 14c). In particular,the region of the widest Doppler spectrum and of large e values is confinedwithin the ABL and below 500 m. Finally, it also appears that the RASSobservations provide a good representation of the diurnal temperature cycle(Figure 15b).
Figure 16 shows variations of wind speed and direction observed up to150 m during the afternoon of June 25, using the mini-sodar at the GLMsuburban station. On each profile, the wind direction and speed were rela-tively constant up to 100 m (Figure 16a), however, the wind direction rotatedduring the afternoon from west to south. The fine vertical resolution of the
TABLE VSodars and their characteristics.
Instrument type Sodar Remtech PA1 Mini-sodaraerovironment
Sodar RASS MetekDSDPA 90-24
Operator ECN/CSTB CORIA Alliance Technologies
Location STJ GLM VAL
Parameters measured U, V, W, C2T, rw U, V, C2
T, rw U, V, C2T, rw, Tv
Meas. range
(min–max)
70–350 m agl 10–150 m arl 50–500 m agl
Vertical resolution (m) 20 5 25
Time resolution (min) 15 15 15
Period of operation
Measurement time
June 20–July 13
Daytime (0700–
1700 UTC).
June 15–July 13
Daytime (0600–
)2100 UTC)
June 13–July 16
Continuous
Operation mode No operation
on week-ends andat night
Low power on
week-ends andnights
Some interruptions
from July 10–16
C2T = structure coefficient (reflectivity); rw = rms vertical wind velocity; Tv = virtual
temperature; agl = above ground level; arl = above roof level; CSTB = Centre Scientifique
et Technique du Batiment, Nantes, France.
URBAN BOUNDARY-LAYER CAMPAIGN UBL/CLU-ESCOMPTE 345

Figure 15. Time–height sections of sodar-RASS observations at Vallon Dol (VAL) on June
25. (a) Horizontal wind velocity, (b) virtual temperature, and (c) sodar Doppler spectral width.The superimposed black or white line is the top of the ABL as deduced from the maximumUHF reflectivity (see Figure 14).
P. G. MESTAYER ET AL.346
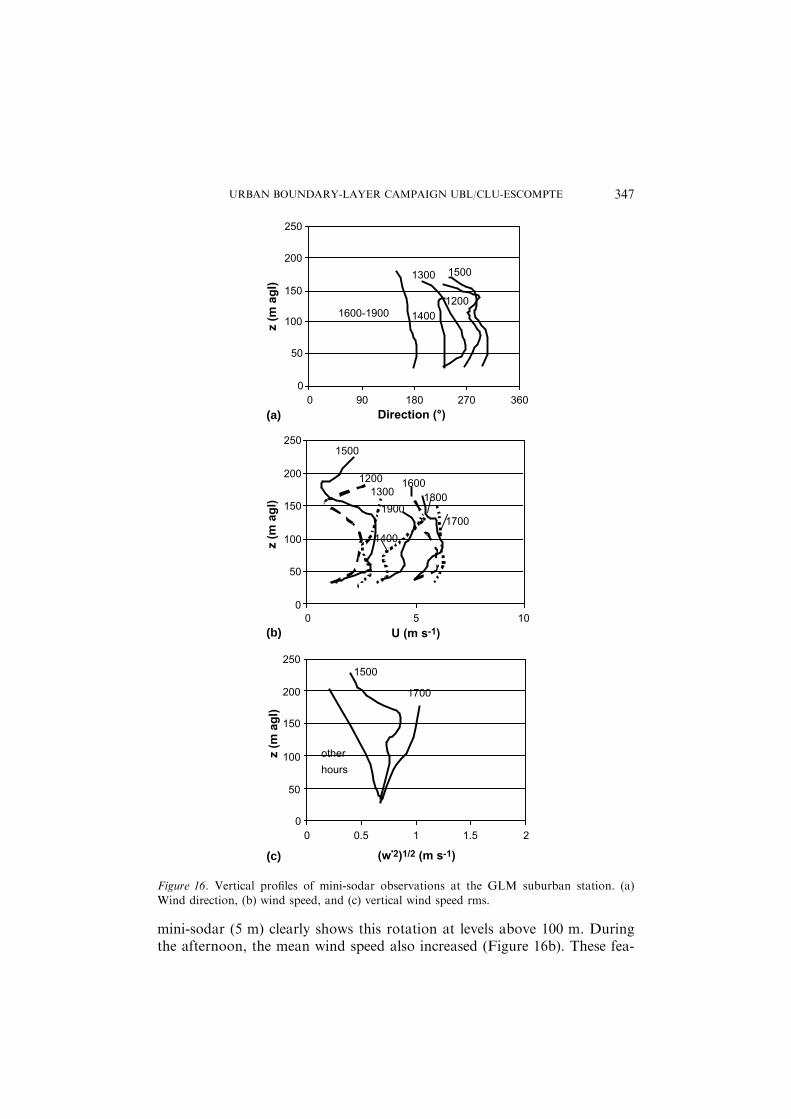
mini-sodar (5 m) clearly shows this rotation at levels above 100 m. Duringthe afternoon, the mean wind speed also increased (Figure 16b). These fea-
0
50
100
150
200
250
0 90 180 270 360Direction (°)
z (m
agl
)
12001600-1900
1500
1400
1300
0
50
100
150
200
250
0 5 10U (m s-1)
z (m
agl
)
1600
1900
1400
1500
1300
1700
1800
1200
0
50
100
150
200
250
0 0.5 1 1.5 2
(w'2)1/2 (m s-1)
1500
otherhours
1700
z (m
agl
)
(a)
(b)
(c)
Figure 16. Vertical profiles of mini-sodar observations at the GLM suburban station. (a)Wind direction, (b) wind speed, and (c) vertical wind speed rms.
URBAN BOUNDARY-LAYER CAMPAIGN UBL/CLU-ESCOMPTE 347

tures reveal a well-established sea breeze from the west during the day and aweaker one growing from the south later in the afternoon. The verticalvelocity variance profiles (Figure 16c) show irregular behaviour above 50 mthat requires further analysis.
7.1.3. Lidars
Two lidars were operated jointly in scanning modes at the south-west edge ofthe VAL site, a location that overlooks most of the city from 285 m asl. TheUV angular lidar measured angular profiles of ozone concentration with dual286.3–282.4 nm wavelengths, and the total extinction coefficient with the286.3 nm wavelength. Angular scans were obtained over a 30-min period perscan, giving 100-m spatial resolution, and 250–2500 m range in each mea-surement direction. The atmospheric total extinction includes Rayleighscattering, large size aerosol interactions (e.g., Mie) and molecular absorp-tion. However, the extinction is only slightly affected by ozone concentrationand the correction for ozone absorption did not show major changes in theresults; the observed stratification may be correlated to aerosol concentra-tion. The extinction coefficient a at the radial distance r is extracted from thebackscattered signal power P using the slope method:
aðrÞ ¼ �1=2d n½r2PðrÞ�=dr: ð2Þ
Although this technique assumes slow spatial variation of the backscattercoefficient, it is sufficient, as a first step, to examine the atmospheric strati-fication.
Figure 17 is a vertical cross-section of the extinction along the 185� azi-muth and illustrates the atmospheric stratification during the sea breeze of
Figure 17. Vertical cross-section of the optical extinction retrieved by the Elight angular lidar
at Vallon Dol, June 25 at about 1100 UTC.
P. G. MESTAYER ET AL.348

June 25 (1100 UTC). The lower layer below 685 m asl is in the sea-breezeflow. While the ABL top has been observed at about 700 m asl aboveMarseille (Section 7.1.1), the observed layer between 685 and 1100 m showsthe ABL top at approximately 1100 m asl at the VAL site, which is located atan altitude of 285 m asl. At higher altitude, above 1100 m, the observedplumes are under investigation by intercomparing the set of lidar measure-ments covering the whole ESCOMPTE region.
The flow circulation around VAL was documented by the transportablewind lidar (TWL) within a semi-sphere of radius ranging from 6 to 15 km,depending on the aerosol content in the ABL and the refractive index ofturbulence (Drobinski et al., 1999). The TWL operated in the infrared at10.6 lm and was sensitive to 1-lm size particles that are excellent tracers offlows in the troposphere. The TWL provided radial velocity measurementsalong the line-of-sight, and the pulse repetition frequency was 2 Hz. Theaccuracy was about 0.3 m s)1 for 10 accumulated shots (Dabas et al., 1999)and the radial range resolution was about 200 m. The TWL previouslyproved its ability to document phenomena such as thermal winds and oro-graphic flows (Drobinski et al., 2001, 2003), as well as the structure of tur-bulence in an urban zone (Drobinski et al., 1998).
Vertical cross-sections with elevations from )90� to 90� from zenith wereswept with an increment of 3�, at azimuth angles equally spaced by 30�. Anexample of a radial velocity vertical cross-section is shown in Figure 18, forelevations between 0� and 90� and an azimuth of 110� (i.e., towards east andsouth-east) at about 1000 UTC on June 25. Negative (positive) radialvelocities correspond to air flowing towards (away from) the TWL. Here, thesea breeze moves inland (i.e., away from the TWL) in a 1-km deep layer,approximately 90� from the coastline (see arrows in Figure 18), with a returnflow aloft between 1 and 1.5 km asl. In the eastern suburbs of Marseille, areverse flow in the opposite direction is observed. That flow may originatefrom an urban breeze induced by the thermal gradient between Marseille(26 �C) and Gemenos (16 �C), the rural area about 20 km east of Marseille,similar to the observations of Ohashi and Kida (2002).
Figure 18. Vertical cross section of the radial velocity observed at Vallon Dol with the TWL
pointing eastward towards land (azimuth 110�). Arrows indicate flow directions in the section.
URBAN BOUNDARY-LAYER CAMPAIGN UBL/CLU-ESCOMPTE 349

The ESCOMPTE set-up included an ozone and aerosol lidar (Elight,Ozone Profiler) at a station 60 km north of Marseille that was closed duringthe last week of the campaign. This stand-alone vertical ozone profiler wasfirst moved to the OBS site (July 10–15) and then to the VAL site (July 15–16), collocated on both sites with wind profilers. The objective was to obtaincontinuous observations of the urban boundary layer by measuring thevertical profiles of ozone concentration and extinction coefficient to retrievethe aerosol concentration and deduce the mixing height. The profiles rangedfrom 100 to 2500 m agl, with a spatial resolution better than 100 m and atime resolution of 3 min. Figure 19 shows an example of the height–timesection of ozone concentration and atmospheric extinction obtained betweenJuly 12 and 14 at the OBS site. During this period the meteorological con-ditions were cloud-free, high air temperature, and a steady westerly windfrom July 12 to the late afternoon of July 13. The preliminary quality controlon altitude ozone measurements suggest a global uncertainty of less than15%. The diurnal cycle of ozone concentration in the ABL shows a vertical
Figure 19. (a) Vertical profiles of ozone concentration, in lg m)3, and (b) atmosphericextinction, in km�1, obtained with the stand-alone vertical ozone/aerosol lidar between July 12
and 14 at the Observatoire.
P. G. MESTAYER ET AL.350

stratification that is relatively permanent except in the convective late after-noon of the second day. Within this stratification pattern convection may beobserved during the first day to average the ozone concentration up to1000 m. During both nights the surface ozone consumption (traffic, deposi-tion) decreases the concentrations close to ground level, thus inducing aresidual ozone layer at higher altitude, though still below the main stratifi-cation. It is interesting to note that the largest amount of aerosol is notsystematically observed in the daytime polluted ABL (Figure 19b). Duringthe late evening of July 13, the westerly wind decrease may be related to thevertical development of atmospheric extinction when convection processesbecome dominant.
Data obtained in the UV at 300 nm with the two Elight lidars, and thoseobtained in the IR at 10 lm with the TWL, can be combined to evaluate thespectral dependency of aerosol scattering and the spatial distribution of theurban aerosol size spectrum. First results show different aerosol verticalstratification, which may be evidence of an aerosol size-height dependencywithin the urban boundary layer.
7.2. AIRCRAFT MEASUREMENTS
Of the seven aircraft involved in the ESCOMPTE experiment, the Merlin IV(Meteo France) performed six dedicated flights in the UBL with the aim ofstudying the variability of dynamic and thermodynamic properties by mea-suring turbulence along transects across the town (the aircraft equipment isdescribed by Cros et al., 2004). The flight tracks are shown in Figure 20.Superimposed horizontal legs were performed at 3000, 1050, 750 and500 m asl from turning points C1 to C3 and C4 to C5, in order to documentconditions in two vertical planes crossing over the city centre.
Along the lower three legs, turbulence intensity was estimated from thelocal dissipation rates of turbulent kinetic energy (Figure 21), since theproximity of the sea-shore and the complex geometry, roughness and surfaceenergy balance of the city, and the relief prohibited a classical computation ofturbulence moments using the eddy covariance method. Furthermore length-averaged moments would have smoothed turbulence variability. Thereforethe dissipation rate of turbulent kinetic energy was computed using a narrowfrequency window around 3 Hz (circa 30-m wavelength) and provided anindication of turbulence intensity with a 2-km resolution, chosen to be closeto the grid-mesh size of the mesoscale models. Figure 21 shows the flight ofJune 26, from 0930 to 1230 UTC, with a south to south-east wind: it showslow values of the dissipation rate over the sea, with a significant increasenorth of the Calanques ridge of hills. At all levels the values are highest northof 43.5�N, while they show horizontal and vertical variability over the city
URBAN BOUNDARY-LAYER CAMPAIGN UBL/CLU-ESCOMPTE 351
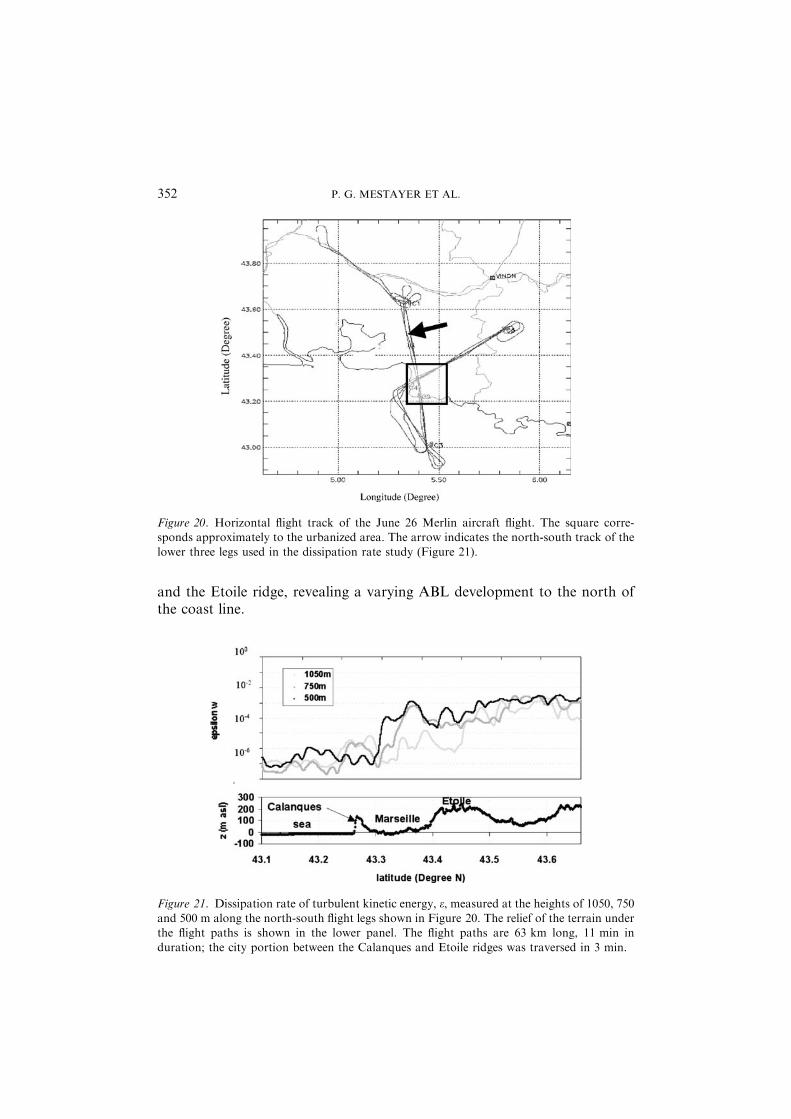
and the Etoile ridge, revealing a varying ABL development to the north ofthe coast line.
Figure 20. Horizontal flight track of the June 26 Merlin aircraft flight. The square corre-sponds approximately to the urbanized area. The arrow indicates the north-south track of the
lower three legs used in the dissipation rate study (Figure 21).
Figure 21. Dissipation rate of turbulent kinetic energy, e, measured at the heights of 1050, 750and 500 m along the north-south flight legs shown in Figure 20. The relief of the terrain underthe flight paths is shown in the lower panel. The flight paths are 63 km long, 11 min in
duration; the city portion between the Calanques and Etoile ridges was traversed in 3 min.
P. G. MESTAYER ET AL.352

8. Visible and Thermal Infrared Signatures over the City
Remote sensing and satellite observation of urban areas may provide surfaceparameters such as land cover and structure, land-use, building density,height, etc. that can be used as input to urban energy exchange and atmo-spheric mesoscale models. Remote sensing can also provide surface variablessuch as albedo, emissivity and temperature at various spatial resolutions. Animportant component of the ESCOMPTE – UBL/CLU campaign was themulti-scale thermal remote observation of the Marseille urban area(Figure 22). The data acquired included satellite (AVHRR, ASTER), aircraft(Inframetrics 760 and PRT5 thermal sensors), and ground-based observa-tions using both fixed and mobile infrared radiation thermometers (IRTs).Particular attention was paid to TIR directional effects due to the three-dimensional structure of the urban canopy, in order to allow multi-scaleassessment of urban surface temperature and its relation to canopy-level airtemperature, and to provide data to validate surface-atmosphere exchangemodels.
8.1. SATELLITE DATA
Images of land surface brightness temperature (LST) and NDVI were derivedfrom the AVHRR data at 1.1-km resolution. A temporal resolution of up tofour images per day allowed analysis of diurnal variations, and the con-struction of statistical averages. For example, the image of July 10 (Fig-ure 22) shows differences in brightness temperature of up to 5 �C betweenrural and urban-industrial areas of Marseille and Marignane. High temper-atures closely follow the contours of built surfaces, and low ones those ofmarshlands, vegetated and mountain areas. Temperatures are highest (34 �C)in the industrial zone of Marignane, and lowest over coastal waters (20 �C)
Figure 22. An illustration of the TIR multiscale images. Data for July 10, (left) NOAA-
AVHRR channel 4, (centre) airborne TIR Inframetrics 760 camera, and (right) ground-basedwith the FLIR ThermaCam SC500 scanner. Brightness temperature (without atmosphericcorrection) scales are 17.5–32.5, 29.0–43.0 and 20.0–50.0 �C, respectively.
URBAN BOUNDARY-LAYER CAMPAIGN UBL/CLU-ESCOMPTE 353

and the Etang de Berre (22 �C). In Marseille, surface temperatures reach31 �C in the densely built-up areas, with small parks cooler by 1.5–3.5 �C.Temperatures are lower in residential areas (29 �C), due to their greatervegetation cover.
The NDVI was mapped from the NOAA AVHRR to analyse its relationto surface temperature. Figure 23 displays the scatter plot of surface tem-perature versus NDVI for the same AVHRR image. The dots with lowesttemperatures (around 20 �C) and negative NDVI correspond to water, theothers to rural and urban areas. The white dots represent a 4 · 15 km2 striporiented from south-east to north-west over the city and suburbs of Mar-seille, and show strong negative correlation (slope )0.03) between surfacetemperature and NDVI. This confirms the well-known significance of vege-tation in the partition of surface heat fluxes (Dousset, 1991; Grimmond andOke, 2002; Dousset and Gourmelon, 2003).
Statistical averages of surface temperature and its diurnal cycle were con-structed over the five stations shown on Figure 1. The largest temperaturedifference between stations OBS and VAL is 2 �C at night, and 3 �C in theafternoon. The amplitudes of the diurnal course are 15 and 15.5 �C overstations STJ and OBS, respectively, 13.5 �C over suburban stations VAL andGLM, and 13 �C over the urban station CAA nearest the sea. These arecomparable to the air surface temperatures given in Section 5.2. Surface
Figure 23. Scatter plot between afternoon NOAA-AVHRR LST and NDVI over the entire
area in Figure 22 left (black dots), and over a subset of pixels near the city centre (white dots).
P. G. MESTAYER ET AL.354

emissivities can be derived from ASTER imagery using the TemperatureEmissivity Separation method of Gillespie et al. (1998); no results are givenhere.
The albedo of urban surfaces is assumed to be quite sensitive to sun-angleconditions due to building geometry, and relatively little is known about thiseffect. The NOAA-AVHRR imagery archived during this campaign provideatmosphere-corrected visible and near-IR reflectance data including a largerange of sun angles and satellite-view conditions. These data can be used toevaluate the bi-directional reflectance distribution function over the differentdistricts of Marseille as a first step to better knowledge of the sun-angledependence of urban albedo.
8.2. AIRCRAFT DATA
The thermal dataset includes airborne measurements: a TIR camera (IN-FRAMETRICS model 760, 7.5–13 lm spectral window) aboard a PA28aircraft provided directional measurements, and a PRT5 Barnes radiometer(8–14 lm) aboard the Merlin 4 aircraft provided nadir surface brightnesstemperature measurements during its flights over Marseille.
The TIR camera was equipped with 80� wide-angle lenses and inclinedabout 20� backward. Flying several flight lines that cross over the city pro-vided TIR measurements in a )60� to +60� range of zenith view angles, andin all azimuth directions (Lagouarde et al., 2000). This enabled character-ization of the TIR directional effect as the difference between oblique andnadir measurements of radiative surface temperature, similar to the ‘effectiveanisotropy’ observed by Voogt and Oke (1997, 1998). Flights were performedat different times and dates (June 26, 29, July 10, and 12) over three con-trasting parts of the urban area: the densely built-up city centre, a built/vegetated mixture of small houses and gardens (St Barnabe suburb), and anensemble of large, modern, slab-like buildings (La Rose suburb). An exampleof the first results for the city centre reveals an important ‘hot spot’ withtemperature variations reaching an amplitude of 6 �C along the principalsolar plane (Figure 24). Analysis of the whole dataset will allow evaluation ofthe combined effects of the solar illumination geometry (time of day) and thestructure of the district on the position and intensity of the hot spot.
8.3. GROUND-BASED DATA
Stationary infrared thermometers were installed at three sites in the citycentre. These were chosen to be representative of the characteristic streetorientation, canyon geometry and surface materials of this district. Contin-
URBAN BOUNDARY-LAYER CAMPAIGN UBL/CLU-ESCOMPTE 355
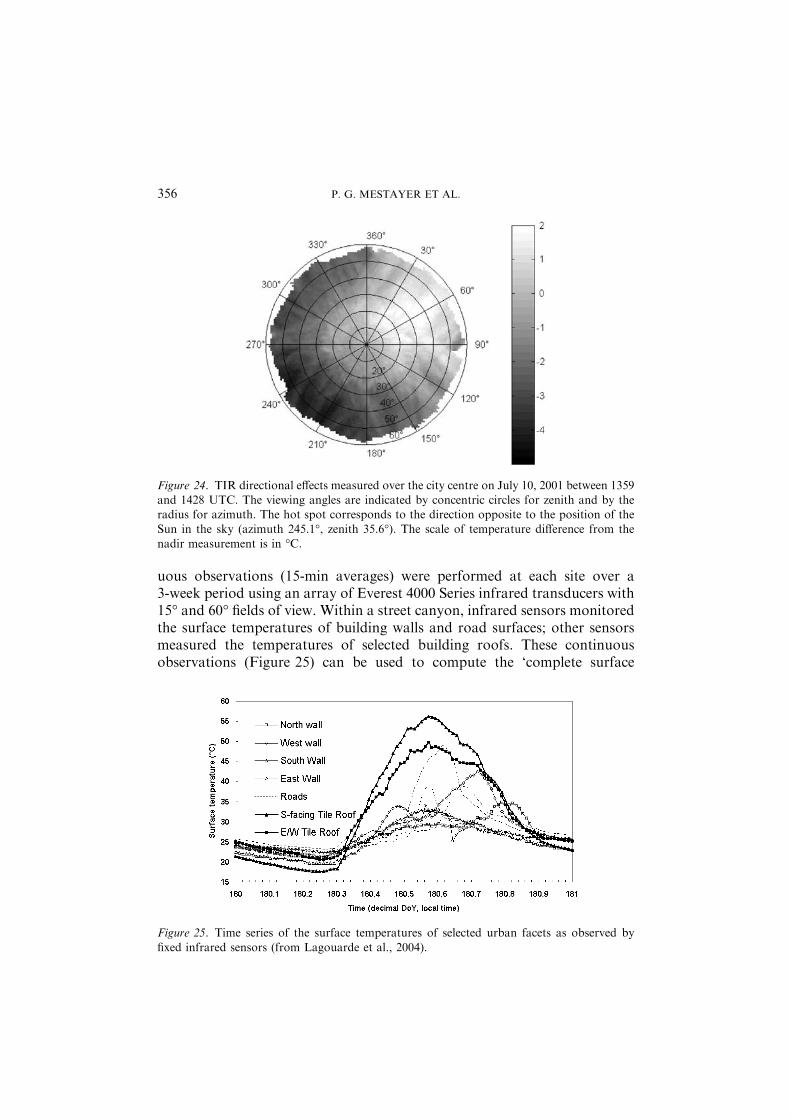
uous observations (15-min averages) were performed at each site over a3-week period using an array of Everest 4000 Series infrared transducers with15� and 60� fields of view. Within a street canyon, infrared sensors monitoredthe surface temperatures of building walls and road surfaces; other sensorsmeasured the temperatures of selected building roofs. These continuousobservations (Figure 25) can be used to compute the ‘complete surface
Figure 24. TIR directional effects measured over the city centre on July 10, 2001 between 1359and 1428 UTC. The viewing angles are indicated by concentric circles for zenith and by theradius for azimuth. The hot spot corresponds to the direction opposite to the position of theSun in the sky (azimuth 245.1�, zenith 35.6�). The scale of temperature difference from the
nadir measurement is in �C.
Figure 25. Time series of the surface temperatures of selected urban facets as observed by
fixed infrared sensors (from Lagouarde et al., 2004).
P. G. MESTAYER ET AL.356

temperature’ of the urban surface (Voogt and Oke, 1997), and to supportenergy balance studies (Section 5) including assessment of the storage heatflux.
These fixed continuous measurements were supplemented by mobile sam-pling of canyon surface temperatures during the aircraft and satellite over-flights, by surveys conducted on foot using hand-held infrared thermometers(Minolta/Land Cyclops Compac 3). Temperatures of the walls (includingwindows and facades) and the canyon floor (road and sidewalks) were ob-served. Additional annotations indicated whether the target surface was di-rectly sunlit or in shade. Sampling was performed in teams of two andprovided coverage of four street canyons (two in each of two orthogonal streetdirections) centred on the time of the over-flight. The results (Figure 26) showthat, with the exception of the most directly irradiated wall, wall surfaces havefairly similar temperatures, and even the distinction between sunlit and sha-ded components of the walls is muted. This is probably because the relativelydeep urban canyons at this site limit solar access, and the massive constructionof the walls provides a large thermal mass to store heat, and thus offset rapidchanges in surface temperature. These findings, and the similarity of buildingmaterials used in the study area, suggest that the fixed IRT measurements ofwall temperatures made in select urban canyons can be considered to bereasonably representative of the study area. Road surface temperatures (bothsunlit and shaded components) show the greatest variability because of rapid
Figure 26. Composite plot of surface temperatures derived from the three observing systems
in the downtown study area during the time of an aircraft overflight (June 26, 2001, 1340–1430UTC). Symbols represent the mean value for the period. Error bars where plotted are onestandard deviation for measurements made during the period.
URBAN BOUNDARY-LAYER CAMPAIGN UBL/CLU-ESCOMPTE 357

temporal changes in the spatial pattern of sunlit and shaded areas. There aresignificant differences in road surface temperature with street orientation thatmay be important to the pattern of urban thermal anisotropy. This variabilityis more easily captured by the mobile and thermal scanner data than by thefixed IRT data that monitor a spatial average across the road surface. Rooftemperature variability is also large mainly due to variations in the slope andaspect of the largely tile-covered roofs.
A thermal scanner (FLIR SC500) was used during the over-flights to pro-vide detailed surface temperature information for the wide range of surfacetypes and orientations visible from the roof-top of a tall building (Figure 27).Temperatures from selected surfaces on these images are extracted using im-age analysis to supplement the fixed and mobile instrument arrays at thesetimes (Figure 26). This provides additional comparative data for the assess-ment of model output, and provides input data for models of the directionalvariation of the upwelling longwave radiative flux over urban areas.
8.4. MODELLING
Two modelling approaches are followed, both based on the use of 3-Dmodels of urban fragments (Figure 28) built using the BDTopo data baseprovided by IGN. The first uses the SOLENE model (Vinet and Groleau,2000), which computes the energy balances of all facets of the urban 3-Dsurface. Visible and TIR radiative balances are computed for every surfacefacet and simplified equations for convective exchanges in the air and con-duction through the walls allow the turbulent sensible heat flux and heatstorage to be estimated (Groleau et al., 2003). SOLENE can be used toproduce surface temperature fields, such as the block in the city centreillustrated in Figure 29. Possible applications include estimation of upwelling
Figure 27. Thermal image of a portion of the central city study area.
P. G. MESTAYER ET AL.358

longwave fluxes, or the simulation of directional measurements of the surfacetemperature of the urban canopy.
The second approach is a simplified one specifically devoted to modellingangular variations of TIR. It is based on the assumption that six averagecomponent temperatures may be defined, for sunlit or shaded roofs, wallsand ground. Directional radiative temperatures are computed by combiningthem with the proportions of sunlit and shadowed areas determined for allazimuth and zenith viewing angles from images generated with Pov-Ray
Figure 28. Three-dimensional representation of the city centre around the Prefecture and
CAA site. The horizontal distance between left and right limits is 430 m.
Figure 29. Simulation of the surface temperatures of an urban block in the city centre quarter
using the SOLENE model at different times of the day (1000, 1200, 1500, and 1700 UTC, June26). Temperature scale in �C.
URBAN BOUNDARY-LAYER CAMPAIGN UBL/CLU-ESCOMPTE 359

software and the 3-D model (Lagouarde et al., 2002a). This approach istested because it is potentially attractive as an inversion technique and shouldhelp to define the combined configurations of TIR measurements best suitedto the retrieval of the constituent temperatures of thermal scenes.
9. Conclusions
We have described the overall design, experimental set-up and initial resultsof the Marseille Urban Boundary-Layer observation and modelling project.UBL/CLU benefited significantly from the larger-scale observational cam-paign in the Marseille–Berre region undertaken as part of ESCOMPTE. Thisarrangement permitted concurrent monitoring using air and ground-basedremote-sensing systems, with embedded ‘local’ and ‘regional’ sensor arrays,together with surface micrometeorological flux stations at multiple sites. Thisallows intercomparison of different methods/approaches and the analysis ofurban microscale and local-scale processes in the context of larger scaleobservations (especially intermediate between the local and synoptic scales).
Good agreement was observed between scintillometer and eddy covariancesensible heat flux measurements, illustrating the potential of scintillometryfor urban areas where spatial heterogeneity is large. Moreover, sensible heatfluxes were simulated well by the linked TEB/ISBA model with positivesensible heat flux at night and the correct daily cycle of heat storage bothcorrectly simulated.
The different effects of the mistral and land-breeze and sea-breeze windregimes on air temperature and humidity patterns in Marseille were docu-mented. For mistral conditions the specific humidity is homogeneous overthe whole urban area, but the average daily course reveals a decrease inmoisture, a signature of air mass drying during these windy conditions. Forsea-breeze conditions, a moisture gradient along the breeze direction is ob-served at all times, and there is an increase of mean humidity from morningto evening. During the land/sea-breeze regime the periods of weakest flowwere associated with the largest nocturnal urban heat islands.
The 3-D structure of the urban boundary layer was documented with thehelp of airborne measurements, radiosondes, and remote sensing with lidars,sodars and a UHF radar. The morning ascent of the atmospheric boundary-layer top was shown to culminate at a height of 750 m agl in the earlyafternoon, and under well-developed sea-breeze conditions subsequently tocollapse. A large fraction of the heat flux is consumed to warm the relativelycool and humid marine air advected inland, at the expense of ABL verticaldevelopment. The lidars reveal complex regional flow patterns, with the seabreeze moving inland in a 1-km deep layer, approximately 90� from thecoastline, with a return flow aloft between 1 and 1.5 km asl. In the eastern
P. G. MESTAYER ET AL.360

suburbs of Marseille, a reverse flow in the opposite direction may also occur.This may originate from an urban breeze induced by the thermal gradientbetween Marseille and the surrounding rural area.
Remote sensing and satellite observations have been used to providesurface parameters such as land cover and structure, land use, buildingdensities and heights, and also important insight into Marseille’s surfacethermal regime. The integration of geographical, meteorological, thermo-dynamic, dynamic, and chemical observations in a unique comprehensivedatabase offers a great opportunity for in-depth analysis of non-linear cou-pling between atmospheric processes in urban areas.
Acknowledgements
Through the cooperative projects CLU and TUE, the UBL/CLU-ESCO-MPTE experiment was funded by the CNRS programmes for atmosphericdynamics (PATOM) and remote sensing from space (PNTS). Bernard Crosand the ESCOMPTE committees deserve warm thanks. As an associateproject it also benefited from ESCOMPTE funding. Part of the funding ofthe North American participants was provided by the National ScienceFoundation (NSF), the Natural Sciences and Engineering Research Councilof Canada (NSERC) and the Canadian Foundation for Climate andAtmospheric Science (CFCAS). The BDTopo urban database was providedby the Institut Geographique National (IGN). The RASS-sodar profiler andone sonic anemometer were made available by Alliance Technologies, andthe stand-alone Vertical Ozone Profiler by Elight Laser System GmbH.Trade and company names are given for the benefit of the reader and do notimply endorsement of the product or company by the authors. The authorswould like to thank A. Delaval, G. Beffrey, M. Chiriaco, C. Boitel, P. Del-ville, and B. Romand for their assistance with the TWL; F. Parmigiani(University of Modena) who collected the NOAA-AVHRR images; P.Jackson and C. Walsh for field assistance at the CAA site; J. Jagoury, Y.Lorin and D. Gaudin (ECN), Y. Tetard and Y. Queveau (CSTB); and Sir-iatech (Villeneuve d’Ascq, France) for assistance and support.
The project benefited from two major cooperative exchange arrangements:SATURN, the urban sub-project of EUROTRAC-2 (Moussiopoulos, 2003)and COST action 715 (Piringer et al., 2002; Fisher et al., 2001).
References
Anquetin, S., Chollet, J. P., Coppalle, A., Mestayer, P. and Sini, J. F.: 1999, ‘The Urban
Atmosphere Model SUBMESO’, in P. M. Borrel and P. Borrel (eds.), EUROTRACSymposium ’98, WIT Press Southampton, pp. 750–757.
URBAN BOUNDARY-LAYER CAMPAIGN UBL/CLU-ESCOMPTE 361

Armand, M.: 1995, Teledetection, urbanisme et amenagement, Cahiers Pedagogiques duGDTA, GDTA, Toulouse, 150 pp.
Arnfield, J. A.: 2003, ‘Two Decades of Urban Climate Research: A Review of TurbulenceExchanges of Energy and Water, and the Urban Heat Island’, Int. J. Climatol. 23, 1–23.
ASHRAE: 1981, ASHRAE Handbook 1981, Fundamentals, American Society of Heating,
Refrigerating and Air-conditioning Engineers, Atlanta.Bock, O., Doerflinger, E., Masson, F., Walpersdorf, A., Van-Baelen, J., Tarniewicz, J.,
Troller, M., Somieski, A., Geiger, A., and Burki, B.: 2004, ‘GPS Water Vapor ProjectAssociated with the ESCOMPTE Programme: Description and First Results of the Field
Experiment’, Phys. Chem. Earth 29, 149–157.Bottema, M.: 1997, ‘Urban Roughness Modelling in Relation to Pollutant Dispersion’, Atmos.
Environ. 31, 3059–3075.
Coppalle, A. and Talbaut, M.: 2002, ‘Observations of the Wind Speed Profile Close to theGround Using a Mini-Sodar, Results of the UBL/CLU-ESCOMPTE Campaign overMarseille City’, in Proceedings, 4th Conference on Urban Environment, Norfolk, U.S.A.,
20–24 May 2002, American Meteorological Society, 45 Beacon St., Boston, MA, pp. 211–212.
Cros, B., Durand, P., Cachier, H., Drobinski, Ph., Frejafon, E., Kottmeıer, C., Perros, P. E.,
Ponche, J. L., Robin, D., Saıd, F., Toupance, G., and Wortham, H.: 2004, ‘The ESCO-MPTE Program: An Overview’, Atmos. Res., 69, 241–279.
Dabas, A., Drobinski, P., and Flamant, P. H.: 1999, ‘Adaptive Filters for Frequency Estimateof Heterodyne Doppler Lidar Returns: Recursive Implementation and Quality Control’, J.
Atmos. Oceanic Tech. 16, 361–372.De Bruin, H. A. R., Van den Hurk, B. J. J. M., and Kohsiek, W.: 1995, ‘The Scintillation
Method Tested over a Dry Vineyard Area’, Boundary-Layer Meteorol. 76, 25–40.
Diday, E., Lemaire, J., Pouget, J., and Testu, F.: 1982, Elements d’analyse de donnees, Dunod– Bordas Editions, Paris, France, 464 pp.
Dousset, B.: 1991, ‘Surface Temperature Statistics over Los Angeles: The Influence of Land
Use’, in Proceedings of International Geophysics and Remote Sensing Symposium 91, Hel-sinki, Finland, July 1991, I.E.E.E., pp. 367–371.
Dousset, B. and Gourmelon, F.: 2003, ’Satellite Multi-Sensor Data Analysis of Urban Surface
Temperatures and Landcover’, ISPRS J. Photogram Remote Sens. 58, 43–54.Drobinski, P., Brown, R. A., Flamant, P. H., and Pelon, J.: 1998, ‘Evidence of Organised
Large Eddies by Ground–Based Doppler Lidar, Sonic Anemometer and Sodar’, Boundary-Layer Meteorol. 88, 343–361.
Drobinski, P., Dabas, A. M., Delville, P., Flamant, P. H., Pelon, J., and Hardesty, R. M.:1999, ‘Refractive Index Structure Parameter in the Planetary Boundary Layer: A Com-parison of Measurements Taken by a 10.6 lm-Coherent Lidar, a 0.9 lm-Scintillometer
and In Situ Sensors’, Appl. Opt. 38, 1648–1656.Drobinski, P., Dabas, A. M., Haeberli, C., and Flamant, P. H.: 2001, ‘On the Small-Scale
Dynamics of Flow Splitting in the Rhine Valley during a Shallow Foehn Event’, Boundary-
Layer Meteorol. 99, 277–296.Drobinski, P., Haeberli, C., Richard, E., Lothon, M., Dabas, A. M., Flamant, P. H., Furger,
M., and Steinacker, R.: 2003, ‘Scale Interaction Processes during MAP-IOP 12 SouthFoehn Event in the Rhine Valley’, Quart. J. Roy. Meteorol. Soc. 129, 729–754.
Dupont, S., Guilloteau, E., and Mestayer, P. G.: 2000, ‘Energy Balance and Surface Tem-peratures of Urban Quarters’, in Proceedings, 3rd Conference on Urban Environment,Davis, CA, 14–18 August 2000, American Meteorological Society, 45 Beacon St., Boston,
MA, pp. 149–150.
P. G. MESTAYER ET AL.362

EDF and Atelier du patrimoine de la ville de Marseille: 1983, ‘Le Bati ancien a Marseille’, coll.Connaissance de l’habitat existant, EDF, DER, Paris, France (In french), 144 pp.
Fisher, B. E. A., Kukkonen, J., and Schatzmann, M.: 2001, ‘Meteorology Applied to UrbanAir Pollution Problems COST 715’, in Proceedings 6th International Conference on Har-monisation within Atmospheric Dispersion Modelling for Regulatory Purposes, 11–14
October, 1999, Rouen, France, Int. J. Environ. Pollut. 16, 560–570.Gillespie, A., Rokugawa, S., Matsunaga, T., Cothern, J. S., Hook, S., and Kahle, A. B.: 1998,
‘A Temperature and Emissivity Separation Algorithm for Advanced Spaceborne ThermalEmission and Reflection Radiometer (ASTER) Images’. IEEE Trans. Geosci. Remote Sens.
36, 1113–1126.Grimmond, C. S. B.: 1992, ‘The Suburban Energy Balance: Methodological Considerations
and Results for a Mid-Latitude West Coast City under Winter and Spring Conditions’, Int.
J. Climatol. 12, 481–497.Grimmond, C. S. B. and Oke, T. R.: 1999, ‘Heat Storage in Urban Areas: Local-Scale
Observations and Evaluation of a Simple Model’, J. Appl. Meteorol. 38, 922–940.
Grimmond, C. S. B. and Oke, T. R.: 2002, ‘Turbulent Heat Fluxes in Urban Areas: Obser-vations and a Local-Scale Urban Meteorological Parameterization Scheme (LUMPS)’, J.Appl. Meteorol. 41, 792–810.
Grimmond, C. S. B., Salmond, J., Offerle, B. D., and Oke, T. R.: 2002, ‘Local-Scale SurfaceFlux Measurements at a Downtown Site in Marseille during the ESCOMPTE FieldCampaign’, in Proceedings, 4th Conference on Urban Environment, Norfolk, U.S.A., 20–24May 2002, American Meteorological Society, 45 Beacon St., Boston, MA, pp. 21–22.
Groleau, D., Fragnaud, F., and Rosant, J- M.: 2003, Simulation of the Radiative Behaviour ofan Urban Quarter of Marseille with the SOLENE Model’, in CD Proceedings, 5th Inter-national Conference on Urban Climate, Lodz, Poland, 1–5 September 2003, O.19.3, 4
pp.Irvine, M., Lagouarde, J. -P., Bonnefond, J. -M., Grimmond, C. S. B., and Oke, T. R.: 2002,
‘Spectral Analyzes of Optical Scintillation: Refraction and Absorption Components in a
Urban Zone’, in Proceedings, 4th Conference on Urban Environment, Norfolk, U.S.A., 20–24 May 2002, American Meteorological Society, 45 Beacon St., Boston, MA, pp. 217–218.
Jacoby-Koaly, S., Campistron, B., Bernard, S., Benech, B., Ardhuin-Girard, F., Dessens, J.,Dupont, E., and Carissimo, B.: 2002, ‘Turbulent Dissipation Rate in the Boundary Layervia UHF Profiler Doppler Spectral Width Measurements’, Boundary-Layer Meteorol. 103,361–389.
Lafore, J., Stein, J., Ascencio, N., Bougeault, P., Ducrocq, V., Duron, J., Fischer, C., Hereil,P., Mascart, P., Masson, V., Pinty, J. P., Redelsperger, J. L., Richard, E., and Vila-Gueraude Arellano, J.: 1998, ‘The Meso-NH Atmospheric Simulation System. Part I: Adiabatic
Formulation and Control Simulations’, Ann. Geophys. 16, 90–109.Lagouarde, J. P., Ballans, H., Moreau, P., Guyon, D., and Coraboeuf, D.: 2000, ‘Experi-
mental Study of Brightness Surface Temperature Angular Variations of Maritime Pine
(Pinus Pinaster) Stands’, Remote Sens. Environ. 72, 17–34.Lagouarde, J.-P., Moreau, P., Solliec, F., Groleau, D., Irvine, M., Bonnefond, J.-M., and
voogt J.: 2002a, ‘Etude experimentale et modelisation des effets directionnels dans l’IRT enzone urbaine’, in Proceedings Atelier de Modelisation de l’Atmosphere 2002, Meteo France,
Toulouse, 17–19 December 2002, Meteo France, Avenue Gustave Coriolis, Toulouse,France, pp. 111–114.
Lagouarde, J. -P., Irvine, M., Bonnefond, J. -M., Grimmond, C. S. B., Long, N., Oke, T. R.,
Salmond, J., and Offerele, B.: 2002b, ‘Sensible Heat Flux Estimated over the City ofMarseille, Using a LAS Scintillometer’, in Proceedings, 4th Conference on Urban Envi-
URBAN BOUNDARY-LAYER CAMPAIGN UBL/CLU-ESCOMPTE 363

ronment, Norfolk, U.S.A., 20–24 May 2002, American Meteorological Society, 45 BeaconSt., Boston, MA, pp. 215–216.
Lagouarde, J. -P., Moreau, P., Irvine, M., Bonnefond, J. -M., Voogt, J., and Solliec, F.: 2004,‘Airborne Experimental Measurements of the Angular Variations in Surface Temperatureover Urban Areas: Case Study of Marseille (France)’, Remote Sens. Environ., in press
Larsen, S. E., Edson, J. B., Fairall, C. W., and Mestayer, P. G.: 1993, ‘Measurement ofTemperature Spectra by a Sonic Anemometer’, J. Atmos. Oceanic Tech. 10, 345–354.
Lemonsu, A. and Masson, V.: 2002, ‘Simulation of a Summer Urban Breeze over Paris’.Boundary-Layer Meteorol. 104, 463–490.
Lemonsu, A., Grimmond, C. S. B., and Masson, V.: 2004, ‘Modelling the Surface EnergyBalance of an Old Mediterranean City Core’, J. Appl. Meteorol. 43, 312–327.
Long, N.: 2003, ‘Analyses morphologiques et aerodynamiques du tissus urbain: Application a
la micro-climatologie de marseille pendant la campagne ESCOMPTE’, Doctoral thesis (inFrench), Universite des Sciences et Techniques de Lille, France, 297 pp.
Long, N., Kermadi, S., Kergomard, C., Mestayer, P. G., and Trebouet, A.: 2003a, ‘Urban
Cover Modes and Thermodynamic Parameters from Urban Data Base and Satellite Data:A Comparison for Marseille during ESCOMPTE’, in CD Proceedings, 5th InternationalConference on Urban Climate, Lodz, Poland, 1–5 September 2003, P.8.3 (4 pp.).
Long, N., Mestayer, P., and Kergomard, C.: 2003b, ‘Urban Database Analysis for MappingMorphology and Aerodynamic Parameters: The Case of St Jerome Sub-Urban Area, inMarseille during ESCOMPTE’, in CD Proceedings, 5th International Conference on UrbanClimate, Lodz, Poland, 1–5 September 2003, O.31.3 (4 pp.).
Long, N., Mestayer P. G., and Kergomard, C.: 2002, ‘Development of Software to Describethe City Morphology and to Compute Aerodynamic Parameters from an Urban DataBase’, in Proceedings, 4th Conference on Urban Environment, Norfolk, U.S.A., 20–24 May
2002, American Meteorological Society, 45 Beacon St., Boston, MA, pp. 31–32.Macdonald, R. W., Griffiths, R. F., and Hall, D. J.: 1998, ‘An Improved Method for the
Estimation of Surface Roughness of Obstacle Arrays’, Atmos. Environ. 32, 1857–1864.
Masson, V.: 2000, ‘A Physically-Based Scheme for the Urban Energy Budget in AtmosphericModels’, Boundary-Layer Meteorol. 98, 357–397.
Masson, V., Grimmond, C. S. B., and Oke, T. R.: 2002: ‘Evaluation of the Town Energy
Balance (TEB) Scheme with Direct Measurements from Dry Districts in Two Cities’, J.Appl. Meteorol. 41, 1011–1026.
McAneney, K. J., Green, A. E., and Astill, M. S.: 1995, ‘Large-Aperture Scintillometry: TheHomogeneous Case’. Agric. For. Meteorol. 76, 149–162.
Mestayer, P. G.: 1996, ‘Development of the French Communal Model SUBMESO for Sim-ulating Dynamics, Physics and Photochemistry of the Urban Atmosphere’, in P. M.Borrell, P. Borrel, T. Cvitas, K. Kelly, and W. Seiler (eds.), EUROTRAC Symposium’96,
25–29 March 1996, Garmisch-Partenkirchen, Germany, Computational Mechanics Pub-lic., Southampton, pp. 539–544.
Mestayer, P. G.: 1998, ‘Urban Scale Models’, in J. Fenger, O. Hertel, and F. Palmgren (eds.),
Urban Air Pollution – European Aspects, Kluwer Academic Publishers, Dordrecht, pp. 197–222.
Mestayer, P. G. and Anquetin, S.: 1994, ‘Climatology of Cities’, in A. Gyr and F.-S. Rys(eds.), Diffusion and Transport of Pollutants in Atmospheric Mesoscale Flow Fields, ER-
COFTAC Series, Kluwer Academic Publishers, Dordrecht, pp. 165–189.Mestayer, P. and Durand, P.: 2002, ‘The UBL/CLU-Escompte Experiment: Description and
First Results’, in Proceedings, 4th Conference on Urban Environment, Norfolk, USA, 20–24
May 2002, American Meteorological Society, 45 Beacon St., Boston, MA, pp. 19–20.Moussiopoulos, N. (ed.): 2003, Air Quality in Cities, Springer-Verlag, Berlin, 298 pp.
P. G. MESTAYER ET AL.364

Noilhan, J. and Planton, S.: 1989, ‘A Simple Parameterization of Land Surface Processes forMeteorological Models’. Mon. Wea. Rev. 117, 536–549.
Ohashi, Y. and Kida, H.: 2002, ‘Numerical Experiments on the Weak-Wind Region FormedAhead of the Sea-Breeze Front’, J. Meteorol. Soc. Jpn. 80, 519–527.
Oke, T. R.: 1987, ‘Boundary Layer Climates’, 2nd edn., Methuen, London, 435 pp.
Oke, T. R.: 1988, ‘The Urban Energy Balance’, Progr. Phys. Geog. 12, 471–508.Oke, T. R.: 1998, ‘Observing Urban Weather and Climate’, WMO Technical Conference on
Meteorological and Environmental Instruments and Methods of Observation, WMO/TD –No. 877, World Meteorological Organisation, Geneva, pp. 1–8.
Pigeon, G., Lemonsu, A., Durand, P., and Masson, V.: 2002 ‘Urban Surface Network inMarseille: Network Optimisation Using Numerical Simulations and Results’, in Proceed-ings, 4th Conference on Urban Environment, Norfolk, U.S.A., 20–24 May 2002, American
Meteorological Society, 45 Beacon St., Boston, MA, pp. 23–24.Piringer, M., Grimmond, C. S. B., Joffre, S. M., Mestayer, P. G., Rotach, M. W., Baklanov,
A., De Ridder, K., Ferreira, J., Guilloteau, E., Karppinen, A., Martilli, A., Masson, V.,
Middleton, D. R., and Tombrou, M.: 2002, ‘Investigating the Surface Energy Budget inUrban Areas – Recent Advances and Future Needs’. Water Air Soil Pollut.: Focus 2, 1–16.
Raupach, M. R.: 1994, ‘Simplified Expressions for Vegetation Roughness Length and Zero-
plane Displacement Height as Functions of Canopy Height and Area Index’, Boundary-Layer Meteorol. 71, 211–216.
Raupach, M. R., Thom, A. S., and Edwards, I.: 1980, ‘A Wind Tunnel Study of TurbulentFlow Close to Regularly Arrayed Rough Surfaces’, Boundary-Layer Meteorol. 18, 373–397.
Roberts, S. M., Oke, T. R., Voogt, J. A., Grimmond, C. S. B., and Lemonsu, A.: 2003,‘Energy Storage in a European City Center’. in CD Proceedings, 5th International Con-ference on Urban Climate, Lodz, Poland, 1–5 September 2003,. O.12.1 (4 pp.).
Rotach, M. W., Fisher, B., and Piringer, M.: 2002, ‘COST 715 Workshop on Urban BoundaryLayer Parameterizations’, Bull. Amer. Meteorol. Soc. 83, 1501–1504.
Schmid, H. P.: 1997, ‘Experimental Design for Flux Measurements: Matching Scales of
Observations and Fluxes’, Agric. For. Meteorol. 87, 179–200.Vachon, G., Louka, P., Rosant, J. -M., Mestayer, P. G., and Sini, J. -F.: 2002, ‘Measurements
of Traffic-Induced Turbulence within a Street Canyon during the Nantes ‘99 Experiment’,
Water Air Soil Pollut.: Focus 2 (5–6), 127–140.Vinet, J. and Groleau, D.: 2000: ‘La modelisation des transferts radiatifs dans le logiciel
SOLENE. Applications au microclimat urbain et au confort thermique en espace ouvert’,IBPSA France 2000 Modelisation et simulation des batiments Qualite environnementale des
batiments et simulation, IBPSA, Sophia-Antipolis, France, pp. 29–35.Voogt, J. A. and Oke, T. R.: 1997, ‘Complete Urban Surface Temperatures’, J. Appl. Mete-
orol. 36, 1117–1132.
Voogt, J. A. and Oke, T. R.: 1998, ‘Effects of Surface Geometry on Remotely-Sensed SurfaceTemperature’, Int. J. Remote Sens. 19, 895–920.
Walpersdorf, A., Bock, O., Doerflinger, E., Masson, F., Van Baelen, J., Somieski, A., and
Burki, B.: 2004, ‘Data Analysis of a Dense GPS Network Operated during the ESCO-MPTE Campaign: First Results’, Phys. Chem. Earth 29, 201–211.
URBAN BOUNDARY-LAYER CAMPAIGN UBL/CLU-ESCOMPTE 365