Embed Size (px)
Citation preview

중앙대학교융합공학부나노소재전공
윤성훈
Theoretical consideration of electrochemical
impedance spectroscopy based on 2-D
transmission line model in the porous
electrodes and its application into various
mesoporous carbon materials

I. 수퍼캐패시터 특성 분석을 위한 transient 방법 EDLC analysis Pseudocapacitor analysis

Schematic Presentation of Composite Electrode
• Inter-particle macropore
– Ionic movement similar to that of bulk phase(similar resistivity)
– Small contribution to total ESR
• Intra-particle meso and micropore
– Ionic movement different from that of bulk phase(high resistivity ~ 108Wcm)
– Major contribution to ESR
macropore
meso and micropore
Rbulk
Reference Electrode
Working Electrode
Porous Carbon Particle
Current Collector

Description of Electrochemical Capacitor Electrodes
Flat and smooth
electrodes
1-D transmission
line model (TLM)
2-D transmission
line model
R1-C1 series R1-C1 trans. R1-C1 trans.
/R2-C2 trans.
Oversimplification
bulk behavior of E-Cap.
Resistance
- R1 : ESR (Rb + Re+ Rct+ Rp)
- Rp : total pore resistance
C1: total capacitance
Easy to measure
: simple equations
Representative pores
: Intra-particle pores
Total capacitance
Complicate equations
: analytical solution exists
Representative pores
: Intra-particle pores +
Inter-particle pores
Capacitance at inner pores
: disregard cap. at outer pores
Very complicate equations
: very hard to acquire analytical
solution
Time/s
0 5 10 15
Curr
ent d
ensity/m
Acm
-2
0
1
2
3
4
5
6
7
8
MSC25-7%KBNMC
ESR =
Relec trode
Rbulk
Rpore
ESR C
I(t) = (E/R) e -t/
r
c
r
c
r
c
Ri
Ri
Ri
electron
ion
Carbon

Electrodes
carbon
current collector
Flat electrode
: simple RC circuit
Thin electrode
Pores: parallel connection
1-D TLM
Common electrode
Pores : not parallel connection
2-D TLM
thin composite
electrode thicker electrode

Impedance of electrode
carbon
current collector
Thin electrodePores: parallel connection
1-D TLM
Z
Z
Z
Z
p
p
p
( )( )
1coth 2 j
2
p
p
Z fZ f
N
Rf
m n fj
pore
r
c
r
c
r
c
(a) (b)
(c)
Rs
Zp : impedance of one pore
Np: total pore number
m : particle number
n : pore number of one particle

• Initial condition
– V(y,0) = 0 : zero initial over-potential
• Boundary condition
– dV(y,t)/dyy=1 = 0 : no potential gradient at y = 1 (end of pore)
– Different resulting equations according to individual BCs (potential/current step)
• In Laplace domain
r
c
r
c
r
c
t
tyV
y
tyV
),(),(2
2
y = l/lp, = RpCp
Rp = r x lp, Cp = c x lp
]coth[)(
)()( s
s
R
sI
sVsZ
p
p
Differential equation for pore impedance
lp : length of pore
: time constant
Rp : pore resistance
Cp: pore capacitance
Ref) R. de Levie, in Advances in Electrochemistry and Electrochemical Engineering, Vol. VI, P. Delahay, Editor, p. 329, John Wiley & Sons, New York, 1967.

Nyquist plot of ac-impedance experiment
]coth[)(
jj
RZ
2cos2cosh
2sin2sinh
2
RZreal
2cos2cosh
2sin2sinh
2
RZimag
f 2 RC

Zreal
*
0.0 0.2 0.4
-Zim
ag
*
0.0
0.2
0.4
0.6
0.8
1.0
Nyquist Plot of Simple TLM
Z’ = Rp/345o slope: Warburg like behavior
Z’
jj
RjZ coth)(

Imaginary Capacitance Analysis
2cos2cosh
2sin2sinh
2)(
CCim
)(
1)(
ZjC
2cos2cosh
2sin2sinh
2)(
CCreal

Imaginary capacitance plot (Cim): s-TLM
• fpeak
– Related with time constant
• Peak area (A)
– Proportional to capacitance
(Ctot)f/Hz
0.001 0.01 0.1 1 10 100 1000 10000
Cim
(f)
0.0
0.1
0.2
0.3
0.4
0.5
peak frequency (fpeak)
p p
peak
0.4p C R
f
im tot( ) log 0.682A C f d f C
2cos2cosh
2sin2sinh
2)(
CCim
Ref) Jong H. Jang, Songhun Yoon, Bok H. Ka, and Seung M. Oh*, Journal of the Electrochemical Society 152 A1418 (2005).
II. 2-D TLM- Theoretical consideration
of Nyquist plot

Double TLM for Composite Electrode
Zp
Zp
Zp
Zp
Re
Re
Re
Re
Parallel connection : Ztot = (Zp + Re)/m
Complicate connection: Ztot = f(Zp,Re,t)/m
thickness increase
Zp Zp
Re Re
t=2
Zp Zp
Re Re
Zp
Re
t=3t=1
m=4

Theoretical Development for Double TLM
here, A = (k2+4k+2-(k+2)(k2+4k)2)/2
p = Zp(k +(k2+4k)1/2)/2, q = Zp(k-(k2+4k)1/2) /2,
k = Re/Zp
t : number of particles (thickness)
t
t
ptot
A
qAptZfZ
1),R,( e
k : governing factor to determine Ztot k(Re/Rp)
Governing Equation

Double TLM Simple TLM
Breakage of parallel connection with thickness increase
– Critical thickness (tc) ?
Zp Zp
Re Re
Zp
Re
Zp
Re
Zp Zp ZpZp
When Re << Rp
Ztot= f(Zp, Re, t) complicate connection
: too complicate for fitting
Ztot = Zp/t parallel connection
: general consideration
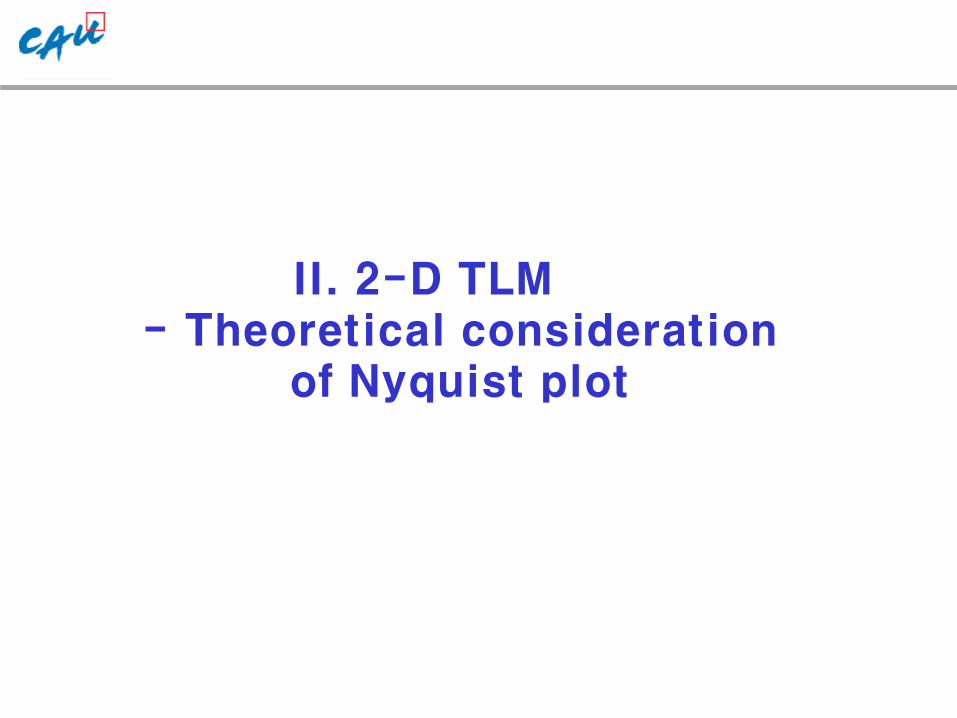
Simulation of Effects by Electrode Thickness
Effects of electrode thickness on the ionic resistancer = 1, R = 0.01 ~ 100
number of paticles
0 2 4 6 8 10 12
Resis
tance
0.0
0.5
1.0
1.5
2.0
2.5
Ze =0.01
0.1
1
Ze ~ Zpt : similar pore resistance to bulk
less decrease of resistance
Zpt = 1
2D Graph 4
Zreal
0 100 200 300 400
-Zim
ag
0
100
200
300
400
500
t = 1
t = 2
t = 3
Ze << Zpt : larger pore resistance than bulk
distinct decrease of resistance No change with thicknessZe : independent of thickness

Zreal
*
0.0 0.2 0.4
-Zim
ag
*
0.0
0.2
0.4
0.6
0.8
1.0
Nyquist Plot of Simple TLM
Z’ = Rp/345o slope: Warburg like behavior
Z’
jwjw
RjwZ
p
coth)(
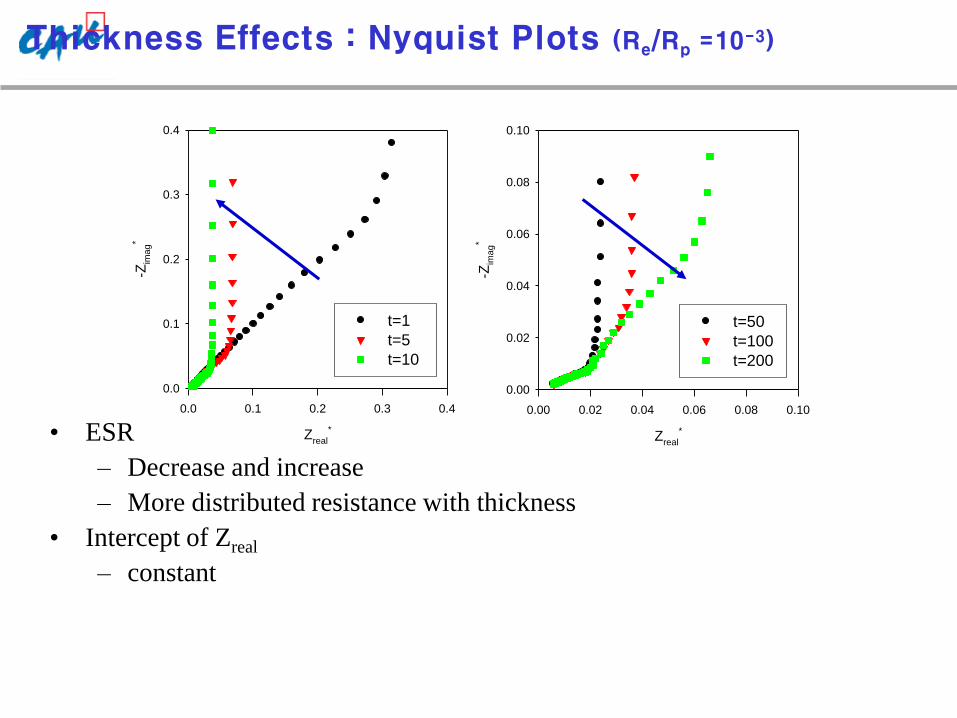
Thickness Effects : Nyquist Plots (Re/Rp =10-3)
Zreal
*
0.0 0.1 0.2 0.3 0.4
-Zim
ag
*
0.0
0.1
0.2
0.3
0.4
t=1
t=5
t=10
Zreal
*
0.00 0.02 0.04 0.06 0.08 0.10
-Zim
ag
*
0.00
0.02
0.04
0.06
0.08
0.10
t=50
t=100
t=200
• ESR
– Decrease and increase
– More distributed resistance with thickness
• Intercept of Zreal
– constant

Critical thickness (tc)
• t < tc
– Parallel connection : Ztot = Zp /t
• t > tc
– Non-parallel connection : Ztot = f(Zp, Re,t)
Thickness(t)
20 40 60 80 100 120 140
Zre
al(f=
10
-3)
0.00
0.02
0.04
0.06
0.08
0.10
Thickness(t)
20 40 60 80 100 120 140
t xZ
real(f=
10
-3)
0
2
4
6
8
10
12
14
16
tc

II. 2-D TLM- Imaginary capacitance
analysis- CMK-3 carbon analysis
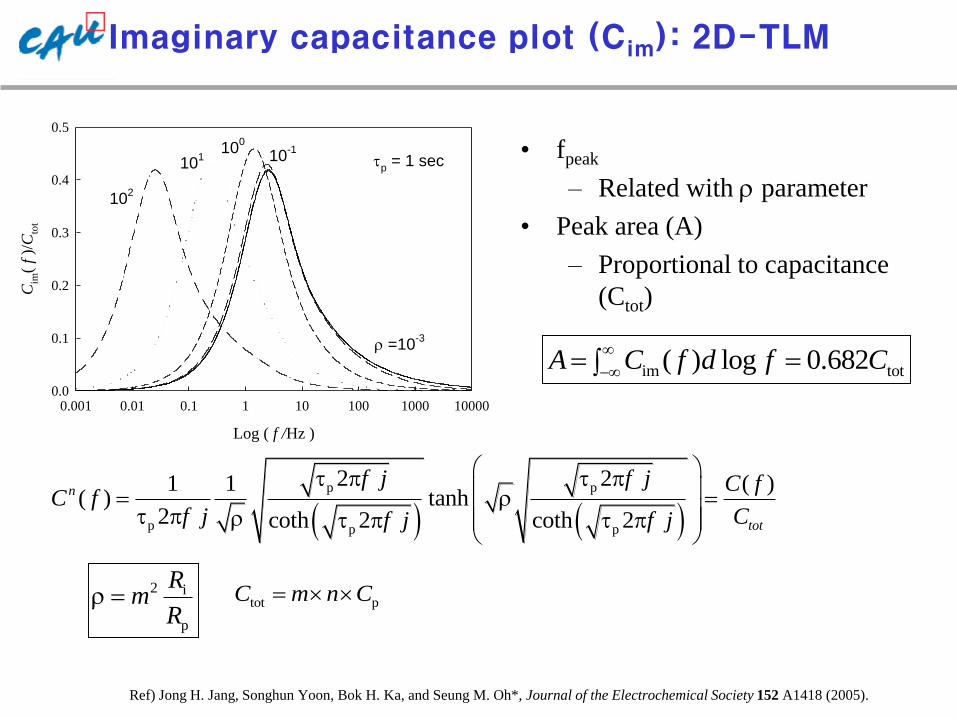
• fpeak
– Related with r parameter
• Peak area (A)
– Proportional to capacitance
(Ctot)
Imaginary capacitance plot (Cim): 2D-TLM
Log ( f /Hz )
0.001 0.01 0.1 1 10 100 1000 10000
Cim
( f
)/C
tot
0.0
0.1
0.2
0.3
0.4
0.5
r =10-3
10-110
0
101
102
p = 1 sec
p p
p p p
2 21 1 ( )( ) tanh
2 coth 2 coth 2
r r
n
tot
f j f j C fC f
f j Cf j f j
2 i
p
Rm
Rr tot p C m n C
im tot( ) log 0.682A C f d f C
Ref) Jong H. Jang, Songhun Yoon, Bok H. Ka, and Seung M. Oh*, Journal of the Electrochemical Society 152 A1418 (2005).

Peak frequency (fp) and peak area (A)
r
0 10 20 30 40 50 60
1/(
1 f
p)
0
50
100
150
1 p
0.41
f r
im 0( ) log 0.682A C f d f C
Empirical relation
between fp and r
Relation between A and C0
by numerical integration

Resulting equations using m parameter
• Calculation of m and n
– Possible for carbons having well-defined pore structure
• Separation between R0 and Ri
– R0 : decrease, Ri : increase according to increase of electrode thickness (m)
• Separation between 1 and 2
– Find dominant factor affecting tot by experiments !
2
pore pore inter pore
p
tot 0 1 2 tot
0.4
R C R C mf
R C
pore intertot 0 i
R mRR R R
m n n
0 pore C m n C 1 0 0 R C 2 i 0 R C

Description of electrode
a0
Current
collector HMC particle
R
CA
Rinter
Z0=
Intra-particle
pore
Inter-particle
pore
interinter 0
0
pore
0 1
1
1( ) ( ) coth
( )
( ) coth 22
RZ f R Z f m
n Z f
RZ f j f
j f
Describing equation
m = 10, n = 4 case
Ref) Songhun Yoon, Jong H. Jang, Bok H. Ka, and Seung M. Oh, Electrochimica Acta 50 2255-2262 (2005).

CMK-3 pore structure
100 nm
100 nm
(b)
(a)
ao
b /2
HMC particle
lpore
Carbon rodIntra-particle pore
Carbon wire
ao (nm) 10.7
ABET ( m2g-1 ) 943
b (nm) 6.7
lpore (mm) 2.5
(b)
5 mm
(a)
10 mm
2 /degree
1 2 3 4 5
Inte
nsity/
A.U
.
Pore diameter/nm
5 10 15 20
dV
dD
-1 /cm
3g
-1
0.0
0.5
1.0
1.5
S. Yoon, J. H. Jang, B. H. Ka, S. M. Oh*, Electrochim. Acta 50 2255-2262 (2005). (29 times cited)
lpore
a0
t (t
hic
kness)
Aelectrode
Current collector 0
(electrode thickness)m
a
electrode
0 pore
(1 )A
na l
m ( number of intra-particle pores in electrode layer)
n ( number of independent electric paths )
27
• SBA-15 templated OMC
– Model electrode material for EDLC

Analysis of CMK-3 electrodes
• According to increase of
thickness
– Increase of A
– Decrease of fp
– Coincide to theoretical
prediction
log ( f /Hz)
0.01 0.1 1 10 100
Cim
( f
)/F
-0.3
-0.2
-0.1
0.0
44 mm
71 mm90 mm
148 mm
m2/10
8
0.0 0.2 0.4 0.6 0.8 1.0 1.2 1.4 1.6 1.8 2.0 2.2
1/
f p
0.0
0.5
1.0
1.5
2.0
2.5
3.0
2
pore pore inter pore
p
0.4R C R C m
f
14
pore
12
pore
5
inter
(2.0 0.1) 10 F
(3.6 0.9) 10
(2.9 0.1) 10
C
R
R
W
W
• From least square fitting
– Cpore : (2.0±0.1) x 10-14 F
– Rpore : (3.6±0.9) x 1012 W
– Rinter : (2.9±0.1) x 105 W
From
2
pore pore inter pore
p
0.4 R C R C m
f
0pore
CC
m n
28S. Yoon*, C. W. Lee and S. M. Oh, J. Power Sources. 195 4391-4399 (2010). (6 times cited)

Analysis of Rtot with thickness
Thickness/mm
20 40 60 80 100 120 140 160 180
Re
sis
tan
ce
/W
0.0
0.2
0.4
0.6
0.8
1.0
R0
Ri
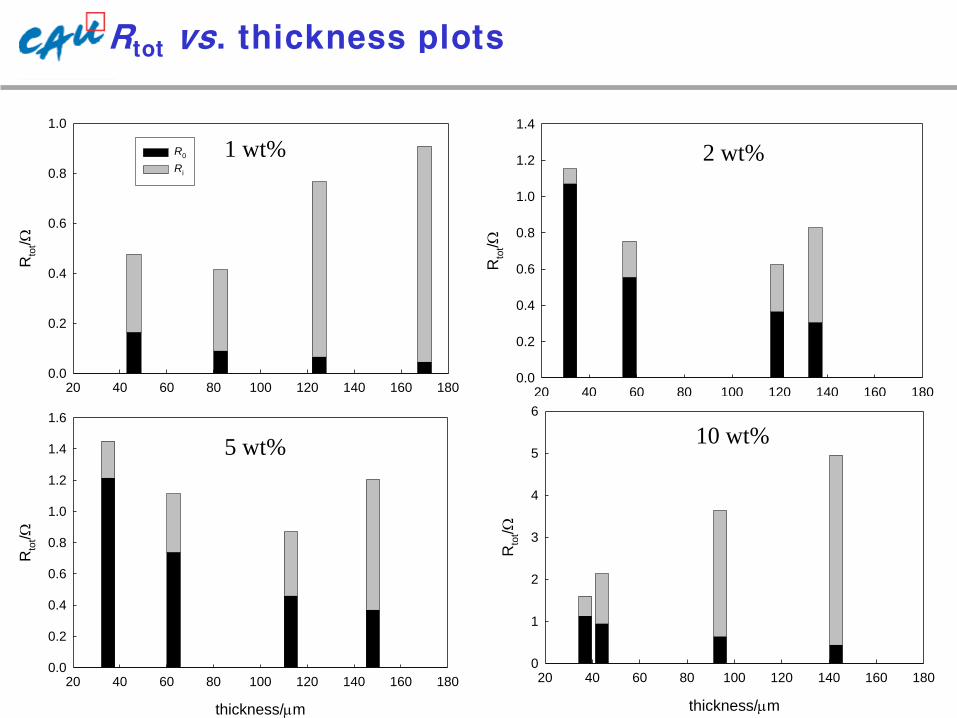
• R0
– Decrease with thickness
– Increase of pore number
• Ri
– Increase with thickness
– Extension of inter-particle
pore length
– Dominant factor in Rtot for
thick electrode

Analysis of tot with thickness
• 1
– Constant
– Reflect properties of
intra-particle pores
• 2
– Increase with thickness
– Dominant factor in tot for
thick electrode
Thickness/mm
20 40 60 80 100 120 140 160 180
tim
e c
on
sta
nt/
s
0.0
0.2
0.4
0.6
0.8
1.0
1.2
1.4
1
2

II. Analysis of pore length effect

MCM-41 synthetic mechanism
CTAB in solution rod-like SSM formation
agglomeration MCM41 formation
~ a few hours Above several hours
CTAB
TEOS
pH >14
lengthening
~ a few min
SSM in solution : template (porogen)
ref) J. Zhang, Z. Luz, H. Zimmermann and D. Goldfarb, J. Phys. Chem. B, 104, 279 (2000).

Control of pore length
Concentration of CTAB : 1, 2, 5 and 10 wt%
at 40 oC, 5 hr reaction time
Low concentration
1) RF adding 2) carbonization3) silica etchig
CTAB in solution
CTAB
High concentration
TEOS
pH >14
5 hr
5 hr
SSM
S. Yoon*, S. M. Oh, C. W. Lee, J.-W. Lee, Journal of the Electrochemical Society, 157, A1229-A1235 (2010)

TEM of carbons
• Highly mesoporous and wormhole-like pore morphology
– Similar pore morphology irrespective of CTAB concentration
50 nm
10 wt%1 %1 wt%
100 nm

PSD of carbons
• Similar pore size : ~ 3 nm
– Pore size : depend on reaction
time of SSM
– SSM reaction time : fixed as 5 hr
– Dominant pores
0.05
D/nm
0 2 4 6 8 10 12 14
dV
/dD
10 %
5 %
2 %
1 %
CTAB concentration / wt%
0 2 4 6 8 10
BE
T s
rufa
ce a
rea/m
2g
-1
500
550
600
650

Imaginary capacitance analysis
f/Hz
0.01 0.1 1 10 100
Cim
(f)/
F
0.00
0.05
0.10
0.15
0.20
0.25
0.30
0.35
46 mm
170 mm
125 mm
83 mm
f/Hz
0.01 0.1 1 10 100
Cim
(f)/
F
0.0
0.1
0.2
0.3
32 mm
135 mm
119 mm
57 mm
f/Hz
0.01 0.1 1 10 100
Cim
(f)/
F
0.0
0.1
0.2
0.3
35 mm
148 mm
113 mm
63 mm
f/Hz
0.01 0.1 1 10 100
Cim
(f)/
F
0.0
0.1
0.2
0.3
37 mm
143 mm
94 mm44 mm
1 wt%
10 wt%5 wt%
2 wt%

Estimation of 1
t2/(10mm)
2
0 5 10 15 20 25 30 35
tot/s
0.0
0.1
0.2
0.3
0.4
0.5
0.6
t2/(10mm)
2
0 2 4 6 8 10 12 14 16 18 20
tot/s
0.1
0.2
0.3
0.4
0.5
t2/(10mm)
2
0 5 10 15 20 25
tot/s
0.1
0.2
0.3
0.4
0.5
0.6
t2/(10mm)
2
0 5 10 15 20 25
tot/s
0.0
0.5
1.0
1.5
1 = 0.028 s 1 = 0.15 s
1 = 0.30 s1 = 0.18 s
1 wt%
10 wt%5 wt%
2 wt%
2
1 tot
p
0.4 kt
f

1 vs. CTAB concentration
• Increase of CTAB
concentration
– Pore length increase
– 1 increase
CTAB concentration/wt%
0 2 4 6 8 10 12
tim
e c
onsta
nt o
f in
tra p
art
icle
pore
s (
1)/
s
0.00
0.05
0.10
0.15
0.20
0.25
0.30
0.35
1 1>
thickness/mm
20 40 60 80 100 120 140 160 180
Rto
t/W
0.0
0.2
0.4
0.6
0.8
1.0
1.2
1.4
thickness/mm
20 40 60 80 100 120 140 160 180
Rto
t/W
0
1
2
3
4
5
6thickness/mm
20 40 60 80 100 120 140 160 180
Rto
t/W
0.0
0.2
0.4
0.6
0.8
1.0
R0
Ri
thickness/mm
20 40 60 80 100 120 140 160 180
Rto
t/W
0.0
0.2
0.4
0.6
0.8
1.0
1.2
1.4
1.6
Rtot vs. thickness plots
1 wt%
10 wt%5 wt%
2 wt%

Control of pore size
Reaction time of silicate : 2, 5, 7 and 16 hr
at 40 oC, 10 wt% CTAB
CTAB in solutionrod-like SSM formation
and lengtheningSSM condensation MCM41 formation
~ a few hours Above several hours
CTAB
1) RF adding 2) carbonization3) silica etchig
TEOS
pH >14
Songhun Yoon*, Seung M. Oh and Chulwee Lee, Material Research Bulletin, 44, 1663-1669 (2009).

SEM images of carbons
• Multi-faceted tubule
morphology
• Inhomogeneous
morphology after 7 hr
5 hr2 hr
16 hr7 hr
Scale bar: 5 mm
7 hr

TEM images of carbons
• Wormhole-like pores
• Increase of pore size
5 hr
16 hr
2 hr
7 hr
Scale bar: 50 nm

f/Hz
0.01 0.1 1 10 100
Cim
(f)/
F
0.0
0.1
0.2
0.3
37 mm
94 mm
143 mm
44 mm
f/Hz
0.01 0.1 1 10 100
Cim
(f)/
F
0.0
0.1
0.2
0.3
61 mm
112 mm
120 mm 86 mm
f/Hz
0.01 0.1 1 10 100
Cim
(f)/
F
0.00
0.05
0.10
0.15
0.20
0.25
0.30
0.35
47 mm
81 mm118 mm
66 mm
f/Hz
0.01 0.1 1 10 100
Cim
(f)/
F
0.0
0.1
0.2
0.3
50 mm
99 mm110 mm
70 mm
Imaginary capacitance analysis
2 hr
16 hr7 hr
5 hr
t2/(10mm)
2
0 2 4 6 8 10 12 14 16
tot/s
0.0
0.2
0.4
0.6
t2/(10mm)
2
0 5 10 15 20 25
tot/s
0.0
0.5
1.0
1.5
t2/(10mm)
2
0 2 4 6 8 10 12 14
tot/s
0.0
0.1
0.2
0.3
0.4
0.5
0.6
0.7
t2/(10mm)
2
2 4 6 8 10 12 14 16
tot/s
0.0
0.2
0.4
0.6
0.8
1.0
1.2
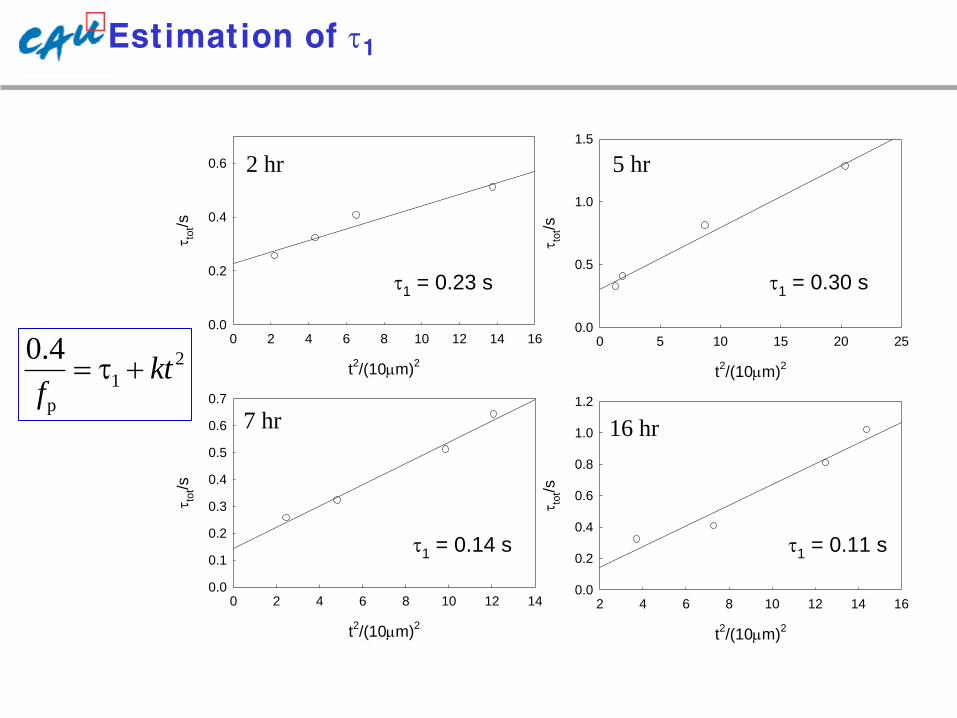
1 = 0.23 s 1 = 0.30 s
1 = 0.11 s1 = 0.14 s
Estimation of 1
2 hr
16 hr7 hr
5 hr
2
1
p
0.4 kt
f

1 vs. reaction time
• 1 increase until 5 hr
– Pore length increase
– SSM lengthening
• 1 decrease after 5 hr
– Pore size increase
– SSM agglomeration
Reaction time/hr
0 2 4 6 8 10 12 14 16 18
tim
e c
onsta
nt
of in
tra
pa
rtic
le p
ore
s (
1)/
s
0.00
0.05
0.10
0.15
0.20
0.25
0.30
0.35
1 1<

thickness/mm
0 20 40 60 80 100 120 140 160
Rto
t/W
0
1
2
3
4
5
6
thickness/mm
20 40 60 80 100 120 140 160
Rto
t/W
0
1
2
3
4
5thickness/mm
20 40 60 80 100 120 140 160
Rto
t/W
0.0
0.2
0.4
0.6
0.8
1.0
1.2
R0
Ri
thickness/mm
20 40 60 80 100 120 140 160
Rto
t/W
0.0
0.5
1.0
1.5
2.0
2.5
Rtot vs. thickness plots
2 hr
16 hr7 hr
5 hr

Conclusions
I. 1-D TLM
I. Simple and easy to use
II. Application into very thin electrode case
II. 2-D TLM
I. Consideration of inter-particle electrolyte
resistance with thickness increase
II. Higher contribution in total ESR for thick electrode
III. More versatile equation in ICA than Nyquist form
III. Application into LIB electrode simulation
I. Advanced TLM model !!


![½ Î$% $.)º*í )º }(½*í )e ½ = Y ù & ] } ¥ Ý e)½ $% $.cadcam.or.kr/UploadData/Editor/BBS1/201401/B15C3D...2-3 bpm기반의 조선 선체 생산설계 업무할당 49 손명조,](https://img.pdfslide.tips/doc/110x75/60219361130df45cb658d586/-e-y-e-2-3-bpmee.jpg)