Embed Size (px)
Citation preview

Ju
ComNee
une 30,
mmunityeds Asse
, 2015
y Healthessment
h t

2 | P a g e
TableofContents�Executive Summary .......................................................................................................................................... 3
Community Health Needs ............................................................................................................................. 4
Key Contributors ........................................................................................................................................... 8
Assessment Methodology ............................................................................................................................. 9
THHBD Community Definition ................................................................................................................. 12
Community Health Needs Assessment ....................................................................................................... 15
Public Participation ................................................................................................................................. 15
NRC The Heart Hospital Baylor Denton Service Area Survey (Executive Summary) .......................... 16
Regional Healthcare Partnership Region 9 (Executive Summary) ......................................................... 17
Appendix A ................................................................................................................................................. 18
Appendix B ................................................................................................................................................. 56

3 | P a g e
Executive Summary The Heart Hospital Baylor Denton (THHBD) is committed to serving all the neighborhoods in its service area and recognizes the importance of keeping a local focus in effectively meeting community needs. This Community Health Needs Assessment (CHNA) was conducted during the tax year ending June 30, 2015. Its purpose is to identify the health needs of the communities served by THHBD and meet the requirements for community benefit planning as set forth in state and federal laws, including, but not limited to, Internal Revenue Code Section 501(r).
About the Hospital THHBD is the first and only freestanding, full-service hospital in Denton County dedicated solely to heart and vascular care. The 22 bed hospital has a medical staff of 315 physicians, with 140 being physician partners comprised of cardiovascular physicians and surgeons including multiple specialties to support the health care needs of North Texas residents. Of the 22 private inpatient suites, nine are cardiac universal beds, allowing the guest to receive the current level of care needed in-suite, without the need for transfer to a different unit to receive various levels of care during recovery. The hospital includes a 12 bed ambulatory surgical unit and a 12 bed post anesthesia care unit, a 24-hour, five bed emergency department, two cardiac catheterization labs, one electrophysiology lab, one hybrid operating room, and two cardiovascular operating suites.
About Baylor Scott & White Health THHBD is an affiliate of Baylor Scott & White Health (BSWH) the largest faith based not-for-profit health care system in Texas (System). THHBD primarily serves the communities located in the North Texas Region of the System which is comprised of various legal entities including: philanthropic foundations; a research institute; a physician network; acute care hospitals; short-stay hospitals; specialty hospitals; ambulatory surgery centers; senior centers and other health care providers serving the needs of the 13 county Dallas-Fort Worth Metroplex area through a network of more than 360 access points. All these entities work together to meet the community’s health needs.
CHNA Summary Creating healthy communities requires a high level of mutual understanding and collaboration with individuals and partner groups. This CHNA brings together information from community health leaders and providers, along with local residents, for the purpose of researching, prioritizing and documenting the health needs of the geographic area served by THHBD. It serves as the foundation for implementing community health improvements for the community.
The CHNA brings together information from a variety of sources. This assessment consolidates information from the recent community health needs assessments conducted for the Texas’ Regional Healthcare Partnership Region 9 (Region 9 RHP) and the Consumer Health Report conducted by the National Research Corporation (NRC) for THHBD. Each of these reports was developed with input from people representing the broad interest of the community and people with special knowledge or expertise in public health.
The importance and benefit of compiling information from other recognized assessments are as follows:

1. Inc2. Cre3. En4. Pro
can5. Pro
the6. Cre7. Pro
ben
CommuniAnalysis ocommunity
Ac
Mu
Ch
Ca
Be
creases knoweates a commhances relatiovides a basin contribute ovides ratione communityeates opportuovides the honefit program
ity Health Nof the Regiony health nee
ccess to Careo The com
supportCommuconventhe dempercentcare).
ultiple Chrono Compa
several o Similar
diagnosmay alsconditiomanage
o The NRfor the migrain
hronic Diseaso Compa
for ciga
apacity–Primo RHP 9
exceedsehavioral Hea
o Behaviosubstanat capac
Despite o The pre
increase
wledge regarmon understaionships andis upon whicto improving
nale for currey. unities for coospital with gms to best m
Needs n 9 RHP repods in the TH
e for Low Incmmunity suftive post-acuunity health ient access. E
mographic. Intage of respo
nic Conditiored to the rechronic con
r to national tses of chroniso affect otheons (MCC). ement. RC consumerTSA when c
nes. se–Adult andred to Health
arette smokin
mary and Speidentified ths available palth–Adult, Poral health–e
ntial patient city. this, behavio
esence of a ced case seve
ding commuanding of thd mutual undch communitg the healthent and futur
ollaborationguidance aseet needs.
ort and the CHHBD servic
come Populaffers a lack oute care serviand patient-Enrollment in the consumondents utiliz
ns gion, state a
nditions. trends, total ic conditionser body systeThe presenc
r survey idencompared to
d Pediatric hy People 20ng, high bloo
cialty Carehat the demanphysicians inPediatric andeither as a prvolume and
oral health ro-occurringerity of medi
unity health ne community
derstanding bty stakeholdof the comm
re financers t
in the deliveto how it ca
Consumer Hece area.
ation of preventiveices that procentered mein health ins
mer survey foze hospital se
and nation, th
service areas. It is commems, resultince of MCCs
ntified the fothe region, s
010 targets,od pressure a
nd for priman these areasd Jail Popularimary or sec
d costs for he
emains a subbehavioral hical encounte
needs and rey's prioritiesbetween and
ders can makmunity. to support ef
ery of servican align its se
ealth Report
e health careomote the heaedical home lsurance progor the hospitervices for “
he communit
a (TSA) residmon that theng in co-occuadds a layer
ollowing chrstate or natio
the hospital and obesity.
ary and specis, thus limitinations condary con
ealth care pro
bstantial unmhealth conditers and a 36
esources. s as it relatesd among stakke decisions a
fforts to imp
ces to the comervices and c
t revealed th
e, quality mealth of its relocations ma
grams is incotal’s service “routine care
ty is at a hig
dents exhibitpathology furrence or m
r of complex
ronic condition: allergies
service area
ialty care serng health car
ndition–accouoviders, and
met need in ttion is associpercent incr
4
s to health nekeholders. about how th
prove the hea
mmunity. community
e following
edical care ansidents. ay not promoonsistent acro
area, a signie” (i.e. prima
gher risk for
t increasingfor one condimultiple chroxity to diseas
ions as high, diabetes, an
a exceeded g
rvices re access.
unts for is often util
the populatioiated with rease in the
| P a g e
eeds.
hey
alth of
nd
ote oss ificant ary
ition onic se
risk nd
goals
ized
on.

Pat
Em
o averageadmitteindividuhowevemental were unand 3 p
o The strusubstancommuMedicainstead NorthST60,000 has greainfrastruthat thestarted 50th in served i
o The numand 27 behavio
tient Safety ao Hospita
are paraprovide
o The Da1,706 aLegionncontrol events s
mergency Deo ED visi
inpatieno An anal
accessinpatient’uninsur
e charges- ped patients hauals incurreder, only one-health or sub
ninsured, whercent were
ucture of the nce abuse) inunity. Unlike aid and indig
of the traditTAR provideMedicaid enatly expandeucture challe
e funding perin 1999 and mental healtin RHP 9 is mber of Nortpercent of al
oral health se
and Hospitalals in the regamount for aers is neededallas Fort Woadverse hospnaires, iatrogissues and c
specified by epartment (Eits are on thent capacity alysis of ED eng EDs for b’s lack of unred/underinsuOver the momost volumlow back paFurther assepercent of eeither non-e
er-encounterad a co-occud more thanfifth of theirbstance abus
hile 24 perceinsured.
behavioral hn RHP 9 strumost of Tex
gent patientsional Local es both mentnrollees anded access to cenges. The gr person servis half that oth funding namong the lothSTAR enrll bookings tervices.
l-acquired Cgion addressany health cad to improveorth Hospitaital events ingenic pneumclostridium dCenters forD) Usage an
e rise, and EDand impairedencounters dboth urgent aderstandingured status. ost recent fou
me of care waain, hypertenessment demncounters fo
emergent or e
r. In RHP 9,urring behav$26 million
r hospital emse issue. Sixnt were on M
health systemuggles to meexas, the majo
s are delivereMental Heatal health anindigent unicare, it has sgrowth in enved is 30 perof the state avationwide, aowest in therollees booketo the Dallas
Conditions patient safet
are entity. Anpatient safetl Council Fon 2010. Thes
mothorax, deldifficile–nonMedicaid an
nd ReadmissDs are becom
d patient flowdemonstratesand non-urgeof their medThe RHP 9 fur quarters o
as provided innsion, pain/jo
monstrates thaor the top primemergent/pri
, 100 percenvioral healthn in costs betmergency depxty- one percMedicaid, 1
m (includinget the demanority of behaed through thalth Authoritynd substanceinsured annustruggled wit
nrollment hasrcent less thaaverage for oand therefore
nation. ed into jail hs County Jail
ty and care qn ongoing, cty and qualit
oundation’s (se events inclirium, blood
ne of which and Medicaresions ming overcrow. s that many ment conditiondical conditiofinds the fol
of available dn an emerge
oint aching, cat, with the emary healthimary care tr
nt of the 10 mdiagnosis. T
tween 2007 apartment viscent of those2 percent we
mental healtnd of patientsavioral healthhe NorthSTAy (LMHA) s
e abuse treatmually. While th funding ans outpaced fuan when the other LMHAe the fundin
has been steal are currentl
quality on a coordinated ety throughou(DFWHCF) cluded air emd incompatibare included e Service (CM
owded due t
members of tns. This is mons, and/or llowing relatdata, conditioency outpatiechronic bronexception of conditions l
reatable, mea
5
most frequentThese 10 and 2011; sits were fore 10 individuaere on Medic
th and s in the h services fo
AR programsystem. ment to overNorthSTAR
nd unding suchprogram
As. Texas isng per person
adily increasily referred to
daily basis. Teffort amongut the region77 hospitals
mbolism, bility, glycemin the 10 ad
MS).
to reduced
the populatiomostly due to
ted to ED usaons for whichent setting wnchitis and as
asthma, ovelisted above waning that th
| P a g e
tly
a als care
or
R
n
ing, o jail
They g . s had
mic dverse
on are the
age: h the ere: sthma. er 68 were
he care

Pre
Sm
Hig
The identfrom BSWmethodoassigned
Ne
eventive Heao Accord
prevento Howev
TSA ex
o Preventbelow t
moking Cessao The He
of age asmoker
gh Blood Pro The He
with higreport h
tified commWH senior llogy establisas follows: eds identifie
could have bFor ED encohealth condiweak/failingWhen reviewand Medica
alth Screeninding to Healttive health mer, preventiv
xceed the maBlood pressEye exams Dental examMammogramCardiovascuBody mass Mental healPre-natal caSmoking ceCarotid arte
tive health bthe market avCholesterol Routine phyFlu shots Diabetes scrPap smear Hearing testChild immuColon screeWeight lossOsteoporosiation
ealthy Peopleand older. Inrs. essure
ealthy Peoplegh blood prehigh blood p
munity health eadership. Inshed in the c
ed as Top Pri
been provideounters that itions by volg kidneys, chwing by payid.
ngs thy People 20
metrics. ve health beharket averagesure testing
ms ms ular stress teindex screenlth screeningare essation ery screeningehavior servverage in thescreenings
ysical exams
reenings
ts unizations ening s programs is screening
e 2010 goal n the hospital
e 2010 goal essure to 16 pressure, mee
needs as oun prioritizingollaborated C
iorities in the
ed effectivelyresulted in alume were sthronic broncyer type, diab
010, the com
havior service in the follo
sting ning g
g vices for unde following a
s
is to reducel’s TSA, 26
is to reducepercent. In theting the goa
utlined belowg the needs oCHNAs used
e each of the
y in a primara hospital admtroke, diabetchitis and heabetes is the to
mmunity has
ces for underowing areas:
derserved houareas:
smoking to percent of re
the percentathe hospital’sal.
w were reviewof the commd for this ass
e collaborate
ry care settinmission, the tes, congestivart attack. op condition
not achieved
rserved hous
useholds in t
12 percent oespondents i
age of the ads TSA, 16 pe
wed and priomunity BSWH
sessment. Pr
ed CHNAs a
6
ng. most comm
ve heart failu
n for the unin
d several nat
seholds in th
the TSA fall
of adults 18 yidentified as
dult populatioercent of res
oritized withH adopted thriority will
are assigned H
| P a g e
mon ure,
nsured
tional
he
l
years being
on sidents
h input he be
High

Pri Ne
Me Ne
Pri
In developithat aggregcommunity
High Prio
AcMu
Medium P
Be
Pat
Em
Low Prior
PreHe
iority for BSeds identifieedium Priorieds identifieiority for BS
ing a plan to gating the neey health impl
ority
ccess to Careultiple Chron
Priority
havioral Hea
tient Safety a
mergency De
rity
eventive Heaealth Care In
WH. ed as Top Priity for BSWHed as Top PriWH.
address all ideds allows foementation p
e for Low Incnic Condition
alth
and Hospital
epartment an
alth Screeninfrastructure
iorities in moH. iorities in on
dentified comor significant,plan organize
come Populans
l-acquired C
d Urgent Ca
ngs
ore than one
nly one of the
mmunity heal, crosscuttings the aggrega
ation
Conditions
are
e of the colla
e collaborate
lth needs, theg initiatives. Tated, prioritiz
aborated CHN
ed CHNAs a
e Hospital andTherefore, thzed needs as
7
NAs are assi
are assigned
d the Systemhe Hospital’sfollows:
| P a g e
igned
Low
m found

Regional H
Healthcare
Baylor Sco
Children’s
Dallas Cou
Dallas Fort
HCA North
Lakes Regi
Methodist H
North Texa
Parkland H
Texas Heal
Texas Scot
University
Partnership
ott & White H
Medical Cen
unty Medical
t Worth Hosp
h Texas
ional MHMR
Health Syste
as Behaviora
Health and Ho
lth Resource
tish Rite Ho
of Texas So
Key C
p Region 9
Heal th
nter
l Society
pital Counci
R
em
al Authority
ospital Syste
es
spital for Ch
outhwestern M
Contributo
il
em
hildren
Medical Cen
ors
nter
8 | P a g e
9 | P a g e
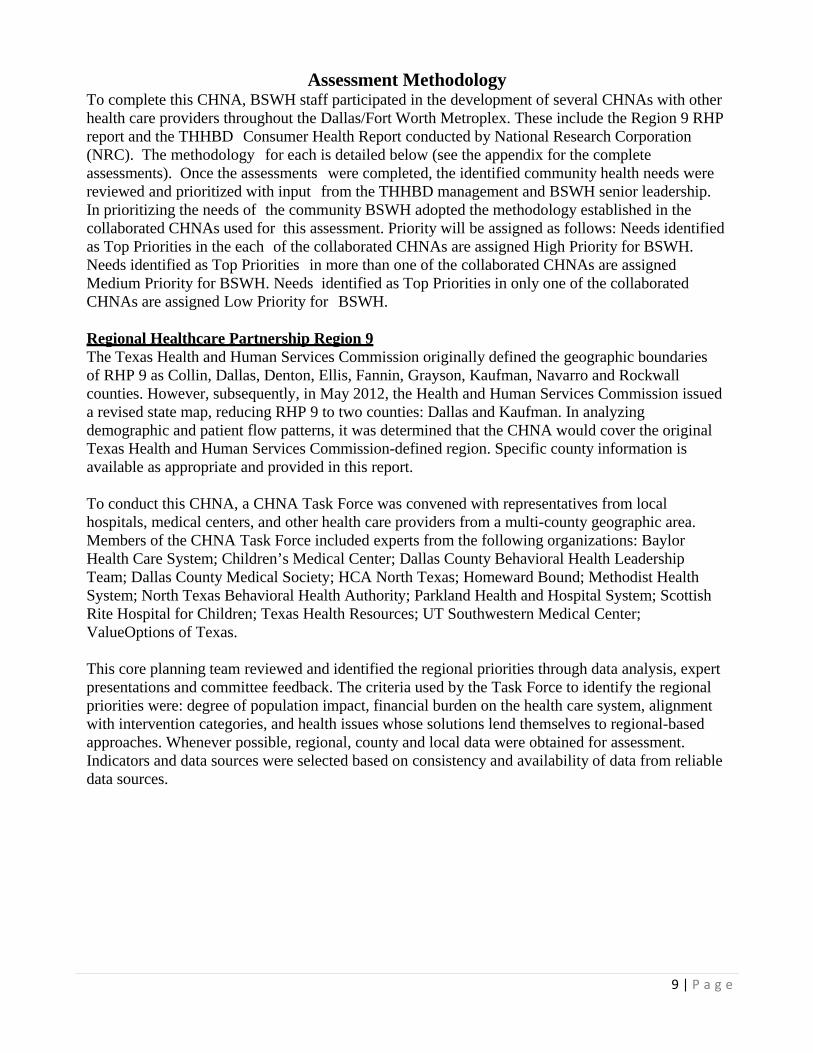
Assessment Methodology To complete this CHNA, BSWH staff participated in the development of several CHNAs with other health care providers throughout the Dallas/Fort Worth Metroplex. These include the Region 9 RHP report and the THHBD Consumer Health Report conducted by National Research Corporation (NRC). The methodology for each is detailed below (see the appendix for the complete assessments). Once the assessments were completed, the identified community health needs were reviewed and prioritized with input from the THHBD management and BSWH senior leadership. In prioritizing the needs of the community BSWH adopted the methodology established in the collaborated CHNAs used for this assessment. Priority will be assigned as follows: Needs identified as Top Priorities in the each of the collaborated CHNAs are assigned High Priority for BSWH. Needs identified as Top Priorities in more than one of the collaborated CHNAs are assigned Medium Priority for BSWH. Needs identified as Top Priorities in only one of the collaborated CHNAs are assigned Low Priority for BSWH.
Regional Healthcare Partnership Region 9 The Texas Health and Human Services Commission originally defined the geographic boundaries of RHP 9 as Collin, Dallas, Denton, Ellis, Fannin, Grayson, Kaufman, Navarro and Rockwall counties. However, subsequently, in May 2012, the Health and Human Services Commission issued a revised state map, reducing RHP 9 to two counties: Dallas and Kaufman. In analyzing demographic and patient flow patterns, it was determined that the CHNA would cover the original Texas Health and Human Services Commission-defined region. Specific county information is available as appropriate and provided in this report.
To conduct this CHNA, a CHNA Task Force was convened with representatives from local hospitals, medical centers, and other health care providers from a multi-county geographic area. Members of the CHNA Task Force included experts from the following organizations: Baylor Health Care System; Children’s Medical Center; Dallas County Behavioral Health Leadership Team; Dallas County Medical Society; HCA North Texas; Homeward Bound; Methodist Health System; North Texas Behavioral Health Authority; Parkland Health and Hospital System; Scottish Rite Hospital for Children; Texas Health Resources; UT Southwestern Medical Center; ValueOptions of Texas.
This core planning team reviewed and identified the regional priorities through data analysis, expert presentations and committee feedback. The criteria used by the Task Force to identify the regional priorities were: degree of population impact, financial burden on the health care system, alignment with intervention categories, and health issues whose solutions lend themselves to regional-based approaches. Whenever possible, regional, county and local data were obtained for assessment. Indicators and data sources were selected based on consistency and availability of data from reliable data sources.

10 | P a g e
The Heart Hospital Baylor Denton Service Area Survey The NRC Consumer Health Report provides a detailed summary of the health needs, health status, behaviors and perceptions of residents within THHBD’s community. The NRC Consumer Health Report is conducted annually across communities in more than 200 of the nation's largest metropolitan statistical areas (MSAs). State and national surveys also are conducted.
Sample Size The THHBD TSA sample for 2011 was comprised of 481 households. The standard error range for the sample was ± 4.5 percent at the 95 percent confidence level.
Benchmarks The Dallas-Fort Worth-Arlington CBSA sample for 2011 was comprised of 5,694 households. The standard error range for the sample was ± 1.3 percent at the 95 percent confidence level.
The Texas sample for 2011 was comprised of 20,075 households. The standard error range for the sample was ± 0.7 percent at the 95 percent confidence level.
The national sample for 2011 was comprised of 278,824 households, which includes the largest 180 MSAs within the U.S. The standard error range for the sample was ± 0.2 percent at the 95 percent confidence level.
Survey Instrument The survey document was an Internet-based questionnaire that respondents received through Internet invitations. The questionnaires were developed utilizing NRC’s experience in the design and implementation of hundreds of consumer research studies. Questions were designed to meet the objectives as determined by the combined input of health care marketing directors and strategic planners nationwide.
The questions were presented in a clear and concise manner, in an easy-to-understand format, and the questionnaire was thoroughly pre-tested in an actual field situation to ensure respondents’ question comprehension.
Survey Timing Beginning in May 2008, ongoing data collection was implemented for the survey. Internet survey invitations were sent on the first of each month. The 22nd of each month was the completion deadline.
The Respondent The respondent was the individual in the household who is most often the target for health care communications—the primary health care decision-maker. This individual most often selects the hospitals, physicians, and health care products and services utilized by household members.

The SampSurvey invnational ba
U.SAgPop
The surveythorough t
WeightingTo ensure according
AgAreRaHoPreMa
Weightingexample, i24 years o24 years o
ple vitations weralancing crit
S. census regge of head ofpulation den
y data was eabulation sp
g the Data proper sampto a number
ge of head ofea populatioce
ousehold incoesence of chiarital status
g ensured thaf 20 percentld, then 20 pld. This weig
re sent to houteria included
gions f household nsity
lectronicallyecification p
ple representr of key dem
f household on
ome ildren
at the sampleof househol
percent of thghting patter
useholds thad:
y coded and tplan.
tation withinographic var
e was represelds within the sample warn was held c
at were repre
tabulated by
n each tabulariables:
entative of thhe market areas comprisedconsistent ac
esentative of
y the NRC ac
ated market a
he populatioea were headd of heads ofcross all vari
f the 48 conti
ccording to a
area, the data
on being survded by a famf householdsiables.
11
iguous states
an innovativ
a was weigh
veyed. For mily members who were 1
| P a g e
s. The
e and
hted
18 to 18 to

12 | P a g e
THHBDCommunityDefinition�
�
BSWH North Texas Division affiliated hospitals serve a 13 county area known as the Dallas/Fort Worth Metroplex. BSWH divides its service areas into three regions: the Eastern Region, the Central Region and the Western Region. BSWH’ health care services are provided through a network of more than 360 access points, including 30 owned/operated/ventured/affiliated hospitals, joint ventured ambulatory surgical centers, satellite outpatient locations, senior centers and more than 180 HealthTexas Provider Network physician clinics. BSWH uses the health care industry’s standard “80 percent” rule to define each hospital service areas.
80 Percent Rule = 50 percent of inpatient volume from Primary Service Area (PSA) + 30
percent inpatient volume from Secondary Service Area (SSA)–both of which make up the Total Service Area (TSA)
The following steps were taken to assure true representation of the area served:
Outlier zip codes were removed. Missing zip codes adjacent to the facility were included

13 | P a g e
Zip codes needed to complete the contiguous service area were included.
Located in Denton County, THHBD serves the Eastern Region of the System, and its TSA includes ZIP codes from Denton, Frisco and Lewisville. The service area comprises:
An urban/suburban geographic area Service Area Population: 534,819 Service Area Ethnicity: White Non Hispanic = 62.7 percent; Black Non Hispanic = 8.6 percent;
Hispanic = 21.4 percent; Asian and Pacific Islanders Non-Hispanic = 4.6 percent; All Others = 2.7 percent.
Service Area Household Average Income = $82,203 Service Area living below the Federal Poverty Level (FPL): 4.3 percent (compared to 9.7
percent living below the FPL in the Dallas/Fort Worth Metroplex, and 9.4 percent living below the FPL in the United States).
Number of other hospitals serving the community: 10 hospitals other than The Heart Hospital Baylor Denton
Medically Underserved: The Heart Hospital Baylor Denton service area does not contain any medically underserved areas or populations.
Service Area Education: Less than High School = 4.4 percent; Some High School = 5.7 percent; High School Diploma = 22.2 percent; Some College/Associates Degree = 34.8 percent; Bachelor’s Degree or Greater = 32.9 percent
Service Area male population = 264,185; Service Area female population = 270,634 Service Area Age: 0-14 = 21.3 percent; 15-17 = 4.3 percent; 18-24 = 11.0 percent; 25-34 =
15.4 percent; 35-54 = 28.0 percent; 55-64 = 10.3 percent; 65+ = 9.8 percent Service Area Payer Mix: Managed Care = 47.9 percent; Medicaid = 11.3 percent; Medicare =
30.3 percent; Self Pay/Charity = 10.2 percent; Other = 0.4 percent
Baylor Medical Center at Carrollton Service Area Providers
Hospitals Baylor Emergency Medical Center - Aubrey Baylor Institute for Rehabilitation at Frisco Baylor Medical Center at Carrollton Baylor Medical Center at Frisco Baylor Medical Center at Trophy Club The Heart Hospital Baylor Denton Continuum Rehabilitation Hospital of North Texas Forest Park Medical Frisco Integrity Transitional Hospital Denton Regional Medical Center Medical Center of Lewisville Select Rehabilitation Hospital of Denton Select Specialty Hospital - Dallas Texas Health Presbyterian Hospital Denton Texas Health Presbyterian Hospital Flower Mound Mayhill Hospital Atrium Medical Center at Corinth

14 | P a g e
Ambulatory Surgery Centers Baylor Surgicare at Carrollton Children’s Ambulatory Surgery Center at Southlake Day Surgery Center at Denton Regional Medical Center Denton Surgicare Dba Baylor Surgicare at Denton Faith Surgical Center IHeart Denton Lewisville Surgery Center Surgery Center of Lewisville Texas Health Orthopedic Surgery Center - Flower Mound Texas Health Surgery Center Denton Freestanding ER Elite Care Emergency Center Elite Care Emergency Center ERCA Little Elm LLC First Choice Emergency Room First Choice Emergency Room First Choice Emergency Room First Choice Emergency Room First Choice Emergency Room Southlake Emergency Care Center Psychiatric Facilities Carrollton Springs University Behavioral Health Of Denton
15 | P a g e
CommunityHealthNeedsAssessment�
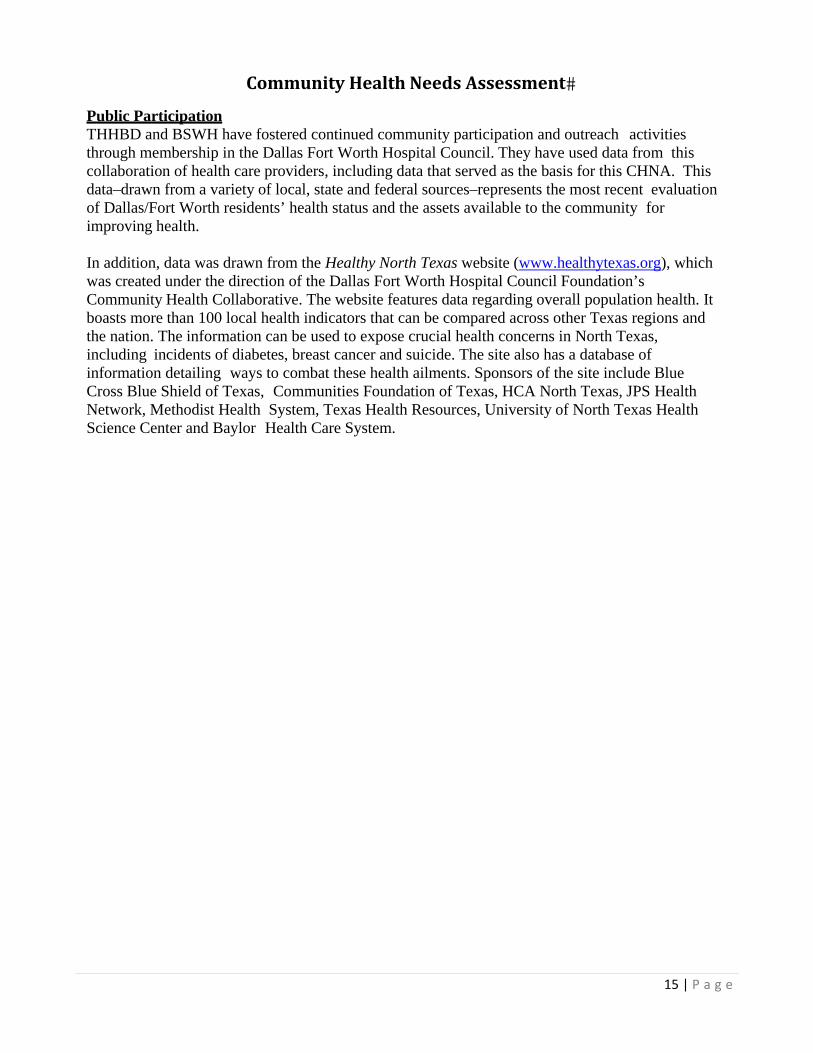
Public Participation THHBD and BSWH have fostered continued community participation and outreach activities through membership in the Dallas Fort Worth Hospital Council. They have used data from this collaboration of health care providers, including data that served as the basis for this CHNA. This data–drawn from a variety of local, state and federal sources–represents the most recent evaluation of Dallas/Fort Worth residents’ health status and the assets available to the community for improving health.
In addition, data was drawn from the Healthy North Texas website (www.healthytexas.org), which was created under the direction of the Dallas Fort Worth Hospital Council Foundation’s Community Health Collaborative. The website features data regarding overall population health. It boasts more than 100 local health indicators that can be compared across other Texas regions and the nation. The information can be used to expose crucial health concerns in North Texas, including incidents of diabetes, breast cancer and suicide. The site also has a database of information detailing ways to combat these health ailments. Sponsors of the site include Blue Cross Blue Shield of Texas, Communities Foundation of Texas, HCA North Texas, JPS Health Network, Methodist Health System, Texas Health Resources, University of North Texas Health Science Center and Baylor Health Care System.

NRC The
The Commas commun
PrimarSpeciaidentiffacilityconditi
Multipcommumigrain
Healthy Pfor improvover time i
A. EnB. EmC. Me
Smokiadults
High Bpressur
PediatrThe prpercen
Prevenmetric
Heart Hosp
munity Assesnity health n
ry care: Fiftyalty care, parfied Parklandy was only idions, a higheple Chronic Cunity when cnes.
People 2010 ving the healin order to:
courage collmpower indiveasure the im
ing Cessation18 years plu
Blood Pressure. ric services arenatal goals nt early and antive Health
goals.
pital Baylor
ssment condneeds (see Ap
y-two percenrticularly for d as a facilitydentified by er percentageConditions: Scompared to
Targets: Heth of all Am
laborations aviduals towampact of prev
n: The commus. ure: The com
and prenatal of 90 percen
adequate preScreenings:
r Denton Se
ducted by NRppendix for
nt of respondpatients lack
y providing s8 percent ofe of the loweSeveral chrothe region,
ealthy Peoplmericans. It h
across commard making invention activ
munity excee
mmunity exce
care: Childhnt care begin-natal care aThe commu
rvice Area S
RC on behalfmore detail)
dents soughtking of coveservice for thf respondentser income poonic conditiostate or natio
le provides sas establishe
munities and snformed heavities.
eds the cigar
eeds the goa
hood immunnning in the are not beingunity is well
Survey (Exe
f of THHBD).
access to rouerage: Thirtyhose unables. When lookopulation is aons are idention. The high
science-baseded benchmar
sectors. alth care deci
rette smoking
al of 16 perce
nizations arefirst trimeste
g met. below sever
ecutive Sum
D identified t
utine care. y-seven perceto pay. The king at severat risk. ified as high
hest are allerg
d, 10-year nrks and mon
isions.
g goal of 12
ent of adults
below the ger of pregnan
ral national p
16
mmary)
the followin
ent of responnext closestral chronic
h risk for thegies, diabete
ational objecitored progre
percent amo
s with high b
goal of 80 pency and 90
preventive he
| P a g e
ng
ndents
es, and
ctives ess
ong
blood
ercent.
ealth

17 | P a g e
Regional Healthcare Partnership Region 9 (Executive Summary)
To develop the Community Needs Assessment, a regional Task Force was convened by representatives from the following organizations: Baylor Health Care System, Children’s Medical Center, Dallas County Medical Society, Dallas County Behavioral Health Leadership Team, HCA North Texas, Methodist Health System, North Texas Behavioral Health Authority, Parkland Health & Hospital System, Scottish Rite Hospital for Children, Texas Health Resources, UT Southwestern Medical Center, and ValueOptions of Texas.
This Task Force reviewed and identified the regional needs through data analysis, expert presentations, and committee discussions. The major criteria used to identify and rank regional priorities included population impact, alignment with intervention categories, and whether solutions lend to regional based approaches. The following priorities were identified as the region’s major community health needs:
Capacity - Primary and Specialty Care The demand for primary and specialty care services exceeds that of available physicians in these areas, thus limiting health care access.
Behavioral Health - Adult, Pediatric and Jail Populations Behavioral health, either as a primary or secondary condition, accounts for substantial volume and costs for health care providers, and is often utilized at capacity, while still leaving a substantial unmet need in the population.
Chronic Disease - Adult and Pediatric Many individuals in North Texas suffer from chronic diseases that present earlier in life. They also are becoming more prevalent and result in health complications.
Patient Safety and Hospital-acquired Conditions Hospitals in the region address patient safety and care quality on a daily basis. It is a continuous process and always at the forefront of any strategy of a health care entity. An ongoing coordinated effort among providers is needed to improve patient safety and quality throughout the region.
Emergency Department Usage and Readmissions Emergency departments are treating high volumes of patients with preventable conditions or conditions that could be addressed in a primary care setting. Additionally, readmissions are higher than desired, particularly for those with severe chronic disease or behavioral health issues.
Palliative Care Overall, costs are higher in skilled nursing facilities, long-term care facilities, hospice and home health sectors, and slightly higher in physician services.
Oral Health In Texas, preventive dental visits are below the recommended levels, and access can be a problem for minorities, the elderly, children on Medicaid and other low-income children. Compounding the problem is the shortage of dentists in Texas, which stands at approximately 60 percent of the national ratio of dentists-to-population.

18 | P a g e
Appendix A
Baylor University Medical Center Service Area Survey (Source: 2011 NRC Healthcare Market Guide, National Research Corporation)
Study Objectives National Research Corporation (NRC) Consumer Health Report is a valuable resource in determining the health status, health risk/chronic conditions, preventive health behaviors, physician access and community perceptions of healthcare in BAYLOR - BUMC TSA.
The Consumer Health Report provides a tool to enable organizations to strengthen the health of their community by assisting in the following:
1. Measurement and evaluation of health status and healthcare utilization within the community. 2. Identification of the prevalence of chronic conditions within various demographic and
geographic segments within the community. 3. Profiling of high-risk populations. 4. Identification of gaps in care and preventive health behaviors among various demographic and
geographic segments within the community.

19 | P a g e
Executive Summary Consumer Health Report Card
THHBD TSA
Overall Household Health Status
Source: 2011 NRC Healthcare Market Guide, National Research Corporation
THHBD TSA Dallas-Fort Worth-Arlington, TX CBSA
State of TEXAS National

20 | P a g e
Executive Summary Consumer Health Report Card
THHBD TSA
Your Consumers' Access to Healthcare
• Purpose of Physician Visit (force ranked high to low):
• Days to Appointment for Routine Care
Your Community's Trust and Confidence in Healthcare

21 | P a g e
Community Demographics
Provided below is a presentation of four key demographic factors for THHBD TSA respondents within the annual Healthcare Consumer Health Report survey. The majority of questions within the Consumer Health Report can be analyzed across any one of these factors.
THHBD TSA Demographics

22 | P a g e
Consumer Perception of Best Community Health Programs
This section reports consumer perception of community health programs by hospital name. THHBD TSA respondents were asked to name the hospital/facility they perceive has the Best Community Health Programs in their area.
Hospital/Facility with Best Community Health Programs THHBD TSA, TX
(% of Respondents Naming Facility)

23 | P a g e
Providers to Those Unable to Pay
THHBD TSA respondents were asked to name the hospital/facility they perceive provides care to those unable to pay.
Top of Mind Hospital/Facility Provides Care to Those Unable to Pay THHBD TSA, TX
(% of Respondents Naming Facility)
Health Status and Utilization This section reports the various self-reported measures of the general physical health among THHBD TSA residents, including information regarding healthcare service utilization.

24 | P a g e
Overall Health Status Health status within the NRC Consumer Health Report is measured by asking residents to individually rate the health status of themselves and each member of their household, and creating a household score.
Household Health Status
Within the national sample , with a score of 0%, represent the lowest percentage who responded their health status was either "Fair or Poor"
THHBD TSA Household Health Status by Income Bottom 2 Box (Fair and Poor)

25 | P a g e
Healthcare Service Utilization
THHBD TSA Service Utilization Last 36 Months by Income
26 | P a g e
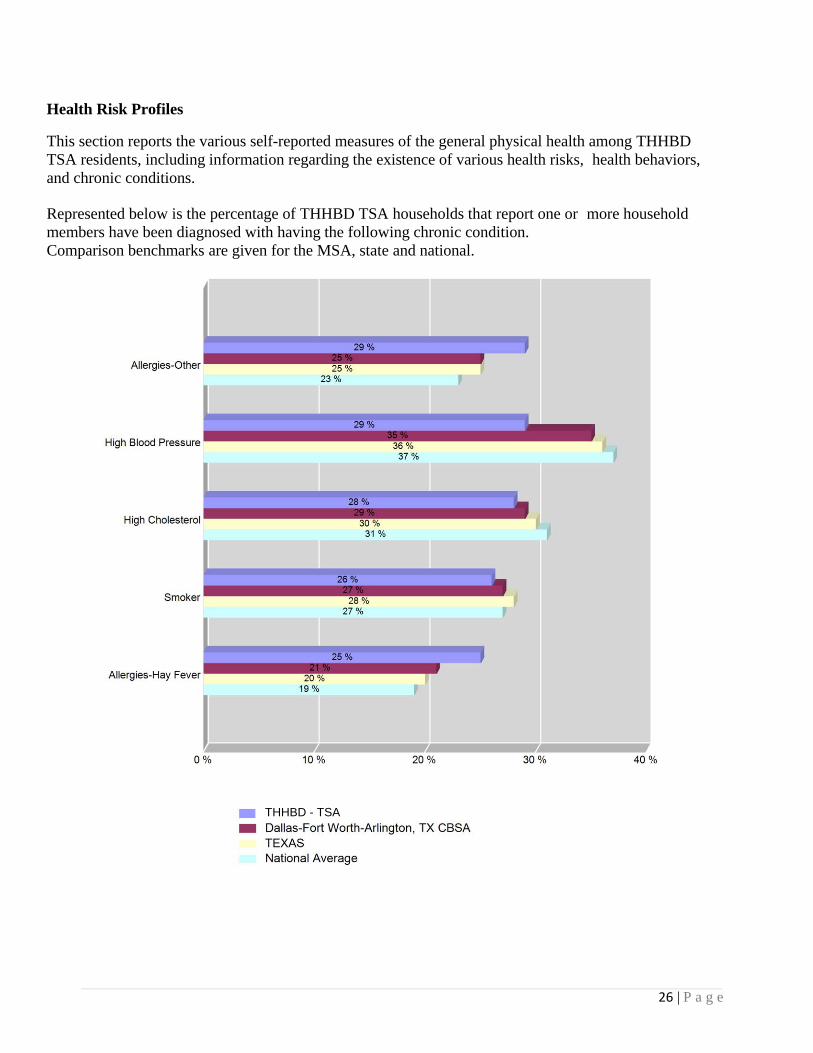
Health Risk Profiles
This section reports the various self-reported measures of the general physical health among THHBD TSA residents, including information regarding the existence of various health risks, health behaviors, and chronic conditions.
Represented below is the percentage of THHBD TSA households that report one or more household members have been diagnosed with having the following chronic condition. Comparison benchmarks are given for the MSA, state and national.
THHBD - TSA

27 | P a g e
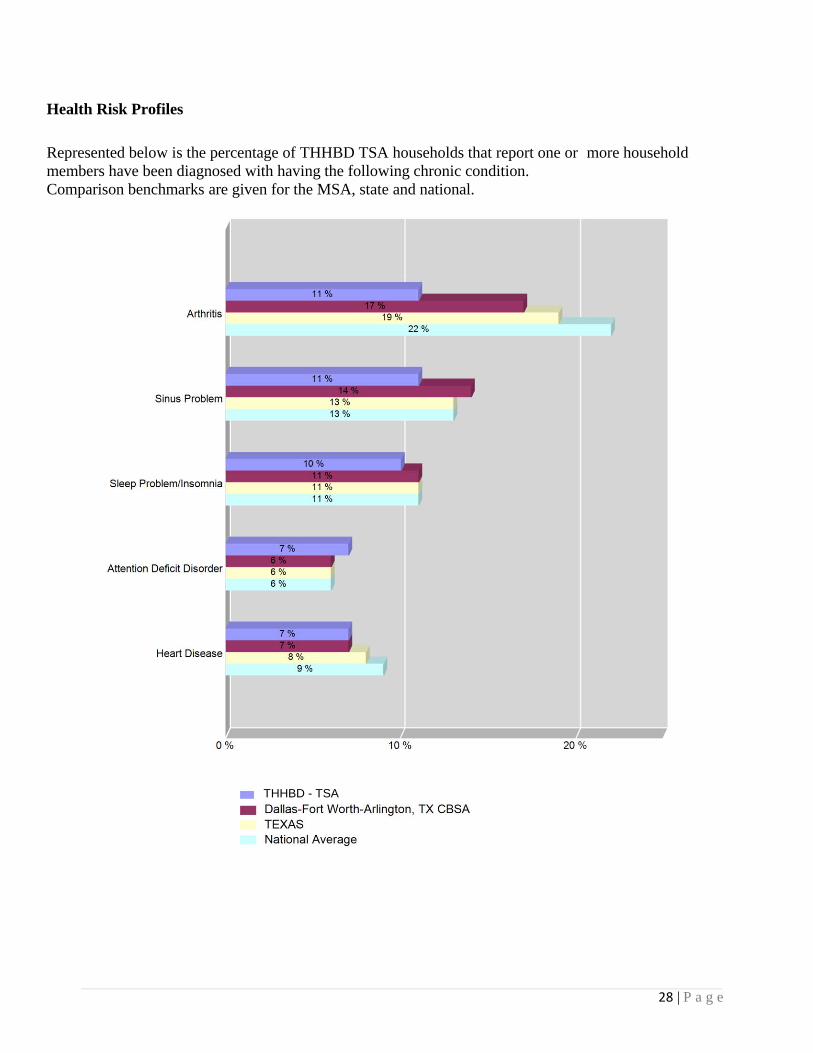
Health Risk Profiles
Represented below is the percentage of THHBD TSA households that report one or more household members have been diagnosed with having the following chronic condition. Comparison benchmarks are given for the MSA, state and national.
THHBD - TSA
28 | P a g e
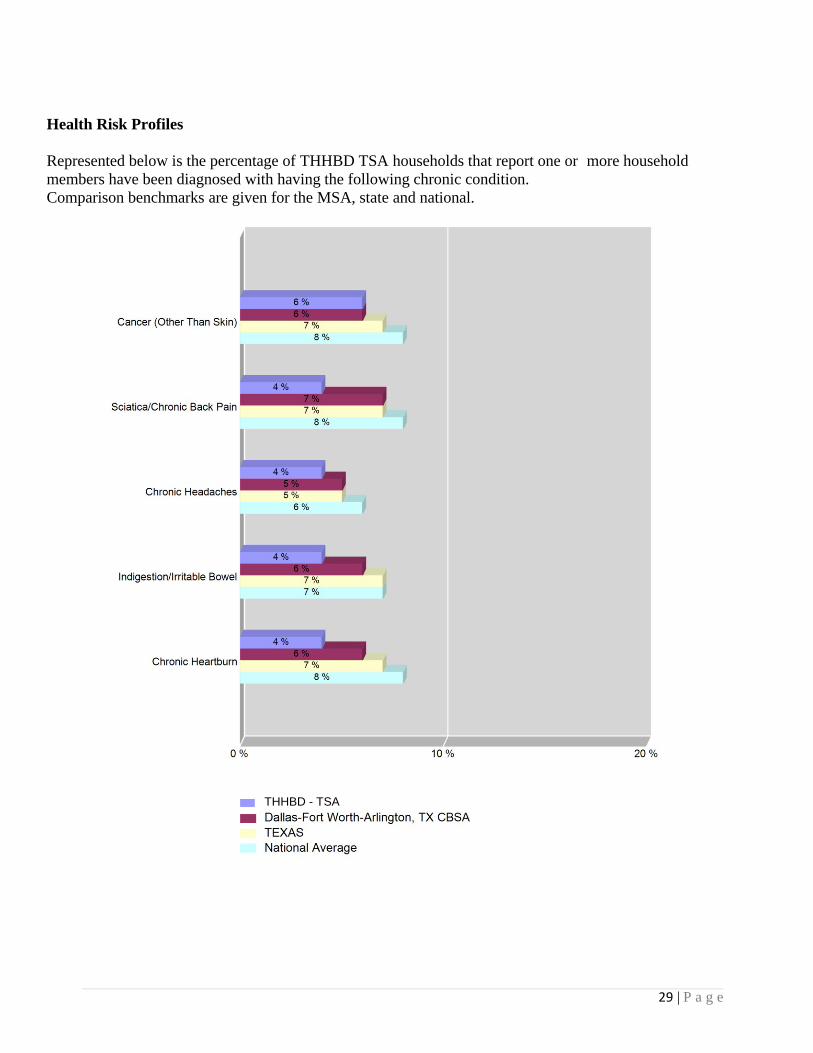
Health Risk Profiles
Represented below is the percentage of THHBD TSA households that report one or more household members have been diagnosed with having the following chronic condition. Comparison benchmarks are given for the MSA, state and national.
THHBD - TSA
29 | P a g e
Health Risk Profiles Represented below is the percentage of THHBD TSA households that report one or more household members have been diagnosed with having the following chronic condition. Comparison benchmarks are given for the MSA, state and national.
THHBD - TSA

30 | P a g e
Health Risk Profiles
Represented below is the percentage of THHBD TSA households that report one or more household members have been diagnosed with having the following chronic condition. Comparison benchmarks are given for the MSA, state and national.
THHBD - TSA

31 | P a g e
Health Risk Profiles Compared to Healthy People 2010
Healthy People 2010 Target:
• 8% adults 50 years plus as measured by bone mineral density test had the disease.
THHBD - TSA

32 | P a g e
Health Risk Profiles Compared to Healthy People 2010
Healthy People 2010 Target:
• Reduce cigarette smoking to 12% among adults 18 years plus.
THHBD - TSA

33 | P a g e
Health Risk Profiles Compared to Healthy People 2010
Healthy People 2010 Target:
• Reduce the proportion of adults with high blood pressure to 16%.
THHBD - TSA

34 | P a g e
Health Risk Profiles Compared to Healthy People 2010
Healthy People 2010 Target:
• Reduce the proportion of adults who are obese by 15%.
THHBD - TSA

35 | P a g e
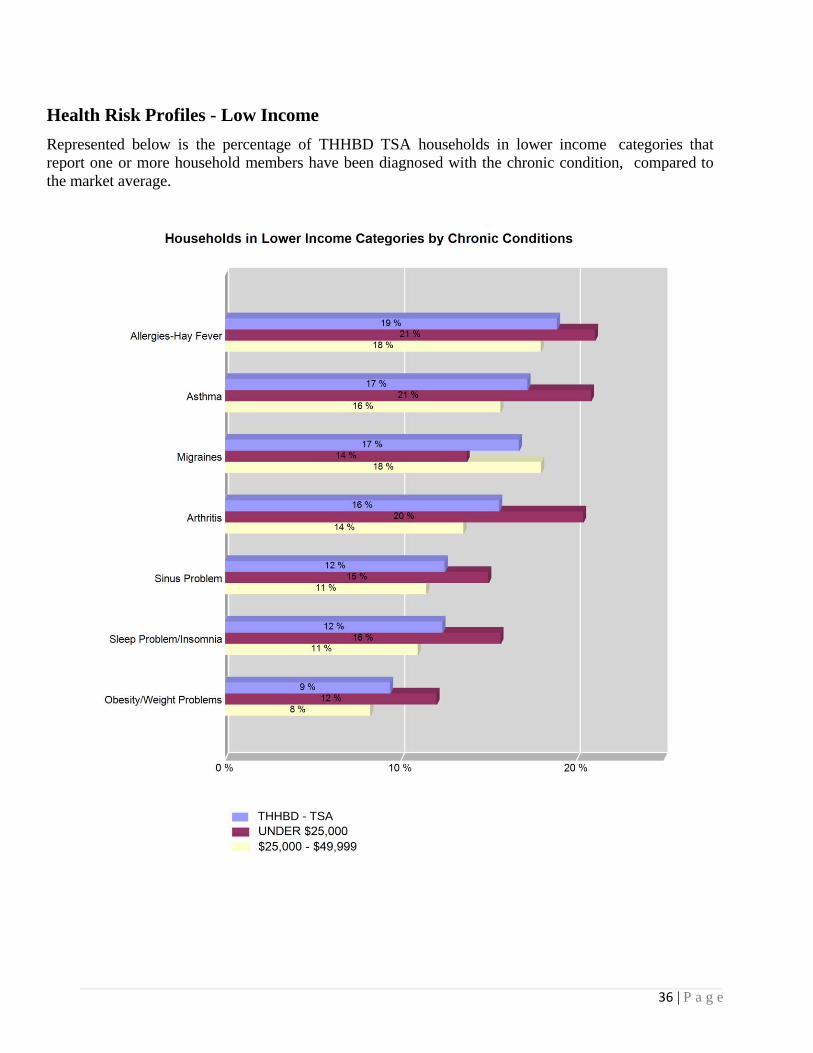
Health Risk Profiles - Low Income
Represented below is the percentage of THHBD TSA households in lower income categories that report one or more household members have been diagnosed with the chronic condition, compared to the market average.
THHBD - TSA
36 | P a g e
Health Risk Profiles - Low Income
Represented below is the percentage of THHBD TSA households in lower income categories that report one or more household members have been diagnosed with the chronic condition, compared to the market average.
THHBD - TSA

37 | P a g e
Health Risk Profiles - Low Income
Represented below is the percentage of THHBD TSA households in lower income categories that report one or more household members have been diagnosed with the chronic condition, compared to the market average.
THHBD - TSA

38 | P a g e
Health Risk Profiles - Low Income
Represented below is the percentage of THHBD TSA households in lower income categories that report one or more household members have been diagnosed with the chronic condition, compared to the market average.
THHBD - TSA

39 | P a g e
Preventive Health Behaviors Compared to Healthy People 2010
Child Immunizations among Households with Children
Healthy People 2010 Target:
• Increase the proportion of young children and adolescents who receive all vaccines that have been recommended or universal administration for at least 5 years to 80%.
THHBD - TSA

40 | P a g e
Preventive Health Behaviors Compared to Healthy People 2010
Mammograms among Households with a Female 40 Years Plus
Healthy People 2010 Target:
• 70% women 40 years plus have had mammogram within past 2 years.
THHBD - TSA

41 | P a g e
Preventive Health Behaviors Compared to Healthy People 2010
Osteoporosis Testing among Households with an Adult 50 Years Plus
Healthy People 2010 Target:
• 8% adults 50 years plus as measured by bone mineral density test had the disease.
THHBD - TSA

42 | P a g e
Preventive Health Behaviors Compared to Healthy People 2010
Pap Smear Test among Households with a Female 18 Years Plus
Healthy People 2010 Target:
• 97% women 18 years plus have had pap smear test.
THHBD - TSA

43 | P a g e
Preventive Health Behaviors Compared to Healthy People 2010
Pre-Natal Care among Households with a Female 15 Years Plus
Healthy People 2010 Target:
• 90% care beginning in the first trimester of pregnancy. • 90% early and adequate pre-natal care.
THHBD - TSA

44 | P a g e
Preventive Health Behaviors Compared to Healthy People 2010
Stop Smoking Program among Households with an Adult 18 Years Plus
Healthy People 2010 Target:
• Increase smoking cessation attempts to 75% by adult smokers.
THHBD - TSA
45 | P a g e
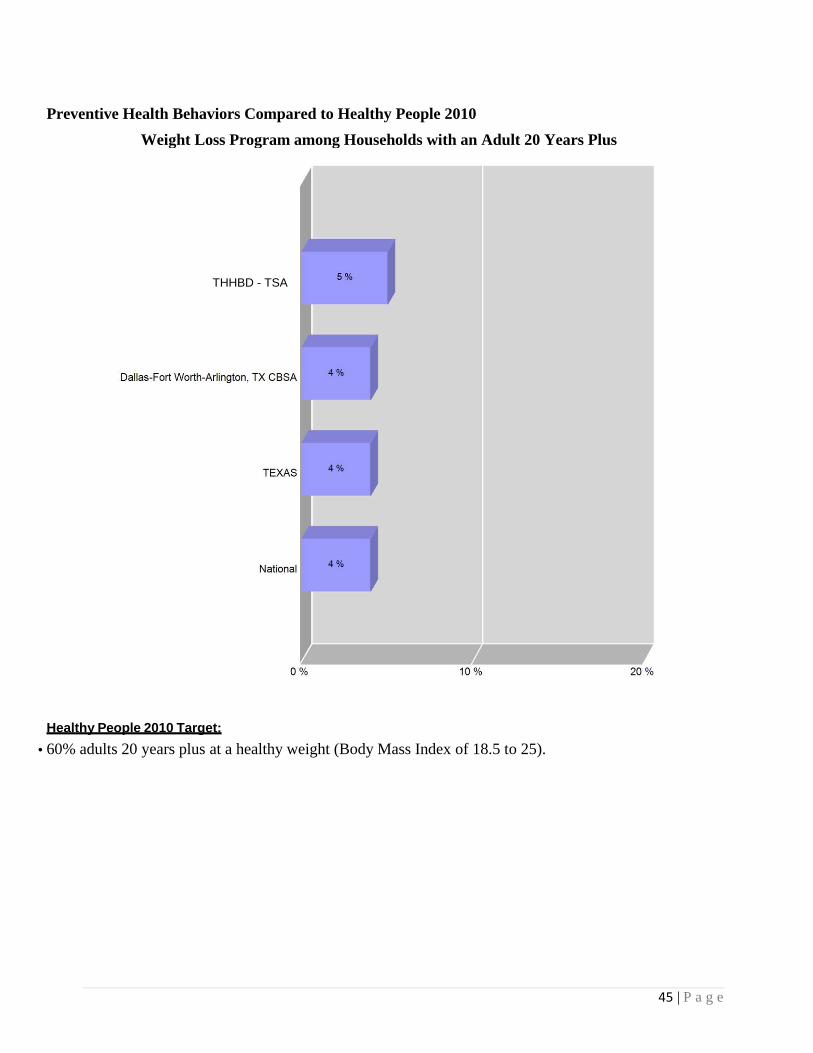
Preventive Health Behaviors Compared to Healthy People 2010
Weight Loss Program among Households with an Adult 20 Years Plus
Healthy People 2010 Target:
• 60% adults 20 years plus at a healthy weight (Body Mass Index of 18.5 to 25).
THHBD - TSA

46 | P a g e
Preventive Health Behaviors Compared to Healthy People 2010
Colon Screening among Households with an Adult 50 Years Plus
Healthy People 2010 Target:
• Increase the proportion of adults who receive a colorectal cancer screening examination to 50%
THHBD - TSA
47 | P a g e
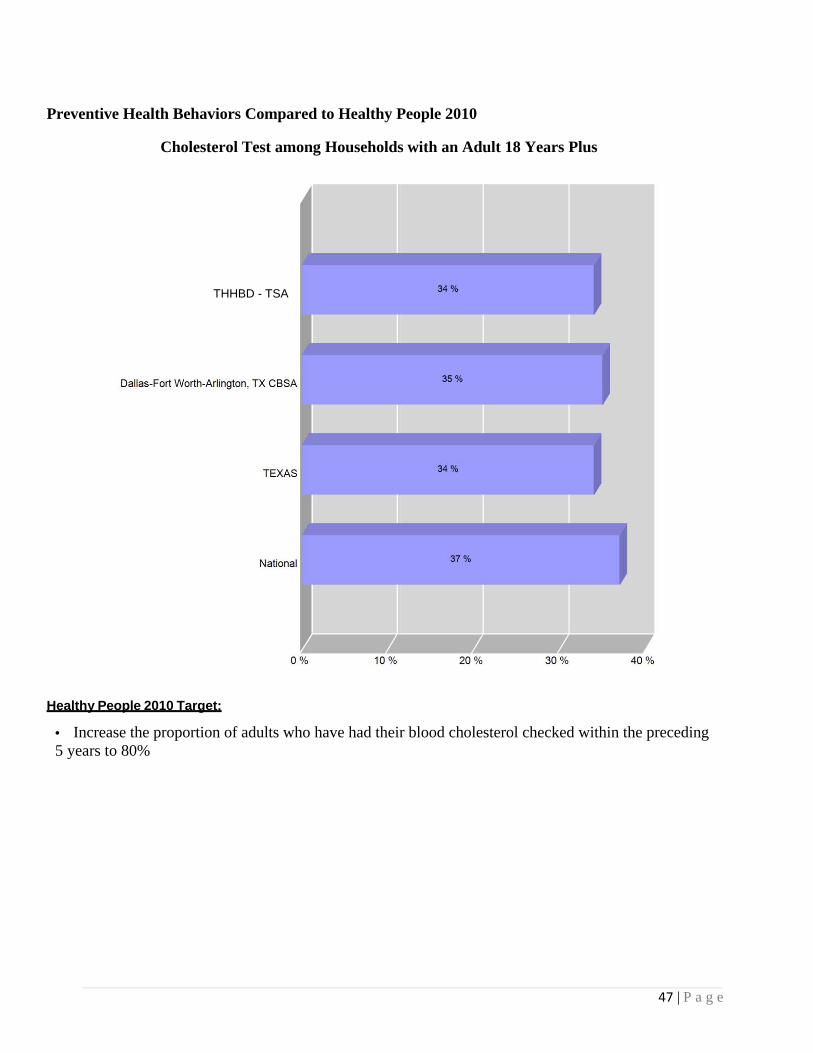
Preventive Health Behaviors Compared to Healthy People 2010
Cholesterol Test among Households with an Adult 18 Years Plus
Healthy People 2010 Target:
• Increase the proportion of adults who have had their blood cholesterol checked within the preceding 5 years to 80%
THHBD - TSA

48 | P a g e
Preventive Health Behaviors Compared to Healthy People 2010
Dental Exam among Households with Children
Healthy People 2010 Target:
• Increase the proportion of children and adults who use the oral health care system each year by 56%
THHBD - TSA

49 | P a g e
Preventive Health Behaviors - Low Income
Represented below is the percentage of THHBD TSA households in lower income categories that have had the following preventive healthcare services or tests in the last 12 months, compared to the market average.
THHBD - TSA

50 | P a g e
Preventive Health Behaviors - Low Income
Represented below is the percentage of THHBD TSA households in lower income categories that have had the following preventive healthcare services or tests in the last 12 months, compared to the market average.
THHBD - TSA

51 | P a g e
Preventive Health Behaviors - Low Income
Represented below is the percentage of THHBD TSA households in lower income categories that have had the following preventive healthcare services or tests in the last 12 months, compared to the market average.
THHBD - TSA

52 | P a g e
Physician Visit Usage and Access
This section outlines the household's last physician visit usage and days to appointment access, including purpose of visit.
Purpose of Physician Visit by Income THHBD TSA

53 | P a g e
Physician Visit Usage and Access
No Physician Visit
• Within the national sample has the highest percentage of households at 0% who reported they have not seen a physician within the last two years.
• Within the national sample has the lowest percentage of households at 0% who reported they have not seen a physician within the last two years.
THHBD - TSA

54 | P a g e
Community Trust and Confidence in Healthcare
This section reports the various self-reported measures regarding the communities trust and confidence in healthcare, including measurements of trust in doctors, nurses, and health plans.
Level of Trust and Confidence - "Very High"
Market/Trust in THHBD TSA Dallas-Fort Worth-
Arlington, TX CBSA
TEXAS
National
Hospital 22 % 21 % 21 % 20 %
Doctors 25 % 25 % 25 % 25 %
Nurses 26% 24 % 26 % 26 %
Health Plans 9 % 10 % 11 % 10 %
Pharmacists 0 % 0 % 0 % 0 %
THHBD - TSA

55 | P a g e
Community Trust and Confidence in Healthcare
"Very High" Trust/Confidence in Lower Income Categories
THHBD TSA

56 | P a g e
Appendix B
Regional Healthcare Partnership Region 9 Community Needs Assessment

57 | P a g e
SectionIII.CommunityNeedsAssessment�To develop the Community Needs Assessment, a regional Task Force was convened by representatives from the following organizations: Baylor Health Care System, Children’s Medical Center, Dallas County Medical Society, Dallas County Behavioral Health Leadership Team, HCA North Texas, Methodist Health System, North Texas Behavioral Health Authority, Parkland Health & Hospital System, Scottish Rite Hospital for Children, Texas Health Resources, UT Southwestern Medical Center, and ValueOptions of Texas.
This Task Force reviewed and identified the regional needs through data analysis, expert presentations, and committee discussions. The major criteria used to identify and rank regional priorities included population impact, alignment with intervention categories, and whether solutions lend to regional based approaches. The following priorities were identified as the region’s major community health needs:
Capacity ‐ Primary and Specialty Care ‐ The demand for primary and specialty care services exceeds that of available medical physicians in these areas, thus limiting healthcare access.
Behavioral Health ‐ Adult, Pediatric and Jail Populations ‐ Behavioral health, either as a primary or secondary condition, accounts for substantial volume and costs for existing healthcare providers, and is often utilized at capacity, despite a substantial unmet need in the population.
Chronic Disease ‐ Adult and Pediatric ‐ Many individuals in North Texas suffer from chronic diseases that present earlier in life, are becoming more prevalent, and exhibit complications.
Patient Safety and Hospital Acquired Conditions – Hospitals in the region address patient safety and care quality on a daily basis. It is a continuous improvement initiative and is always at the forefront of any strategy for a health care entity. An ongoing coordinated effort among providers is needed to improve patient safety and quality throughout the region.
Emergency Department Usage and Readmissions ‐ Emergency departments are treating high volumes of patients with preventable conditions, or conditions that are suitable to be addressed in a primary care setting. Additionally, readmissions are higher than desired, particularly for those with severe chronic disease or behavioral health.
Palliative Care ‐ Overall, costs are high in skilled nursing facilities, long term care facilities, hospice and home health sectors, and slightly higher in physician services.
Oral Health ‐ In Texas, preventive dental visits are below the recommended levels, and access can be a problem for minorities, the elderly, children on Medicaid, and other low income children. Compounding the issue is the shortage of dentists in Texas at approximately 60% of the national ratio of dentists to the population.

Demograp
Based on ppeople. Fr9.7% increDallas, Dedemograpdemonstrato Dallas C
In the Nor4,611,612age group While 15.adults hav
White nonHispanicsare New Aare undocu239 langunew to the
3 US Census D4 ibid. 5 DFW Intern
phics and R
population arom 2000 to ease nationaenton, Ellis, hics were co
ated in FigurCounty for h
rth Texas RH and is expecis 35-54 yea1% of adults
ve at least a h
n-Hispanics r, Asians, and
Americans (dumented. Enages are spo
e region.5
Data, Thompso
ational Commu
Regional Des
alone, Texas 2010, Texaslly. OriginaFannin, Gray
onsidered to bre 3 below, thhealth care se
HP 9 region (cted to growars (27.6%), s have less thhigh school d
represent 48d others, respdefined as eitnglish is not
oken in the N
Figure
on Reuters/Clar
unity Alliance.
scription
is the secons experiencelly, the Nortyson, Kaufmbe representhere is consiervices.
(original defw by 9.5% by
followed byhan some higdegree.
.1% of the ppectively.4 Ather foreign bthe language
North Texas A
e 1: Regiona
ritas Market Ex
2010 North Te
d largest statd a 20% gro
th Texas RHman, Navarrotative of the nderable in- m
finition), the y 2016 to 5,0y the 0-14 aggh school lev
population, foApproximateborn or the ce spoken in 3Area, with m
al Demograp
xpert Data Extr
exas Progress R
te in the natiowth in popu
HP 9 Region wo, and Rockwnarrower finmigration fro
2011 popula048,283 residge group (20.vel of educat
ollowed by Hely 44% of Dchildren of fo32% of hom
more than 1/3
phic Snapsh
ract, 2012.
Report.
ion with morulation, as cowas defined wall countiesnal RHP bounom the origin
ation is estimdents.3 The m2%). tion, approxi
Hispanics, BDallas-Fort Wforeign born)
mes in North 3 reflecting A
hot
58 | P
re than 25 mompared to o
to include Cs. The broadndaries and anal RHP cou
mated to be most prevale
imately 85%
Black non- Worth residen) of which 46Texas and o
African cultu
P a g e
million nly a
Collin, der as
unties
ent
% of
nts 6% ver
ures

Within Daand 15.8%
Health De
Data analyreceive heaccount fopopulationpopulation
Figure 3: Delivery SPatients w20119
The locatiare shownwarranted relate to thpresents stassessmen
6 US Census D7 Communitie8 DFWHC Fo9 ibid
allas County % of adults be
elivery Syste
ysis identifieealthcare servor 75% of then, Dallas Coun, respective
InterconneSystem: Dalwith Adjace
ions of charitn on the map
to determinhe locations trong justificnt.
Data. www.cenes Foundation ooundation, Infor
specificallyetween 18 toFigure 2: S
em and Pati
ed patient mivices in neare outpatient unty residently.8
ctedness of llas County nt County o
table clinics below. Ade the causal of clinics/othcation to con
nsus.gov, 2011.of Texas, Assetrmation and Qu
, 29.6% of co 64 years livSummary of
ient Migrati
igration patterby counties.services andts account fo
HealthcareEncounters
of Residence
in Dallas Codditional anal
factors of thher service s
nsider a broad
ts and Opportunuality Services
hildren undeve below thef Uninsured
ion Patterns
erns within m In the pedia
d 74% of theor 77% and 7
s from e,
ounty lysis is
he patient flowsites in the reder geograph
nities Profile. FData Warehou
er 18 live bele federal povd in Dallas C
s
multiple RHPatric populatinpatient ser
73% of the o
w and migraegion. It is ahic area for t
February 2012.use, 2011
low the fedeerty level.6
County7
P regions. Mtion, Dallas Crvices. In the
outpatient an
ation patternapparent thouthe purposes
59 | P
eral poverty l
Many individCounty reside adult
nd inpatient
s and how thugh that the ds of this
P a g e
level
duals dents
hey data
Regional H
Physician RHP 9 is athe Healthincreased tdemonstraphysician physiciansnon-emerghigher vol
Medical EDallas Coumedical ceannually. providing
MedicallyA Health Ppopulationas defined 10 Parkland11 Health Pr2011. 12 ibid.
Health Care
Supply and affected by thh Professionsto a current s
ated a physicneed is expe
s, which is digent treatmenumes of prev
Education unty is homeenter that traiMany traininan importan
y UnderserveProfessional n group with d by a popula
d Health & Hosprofessions Reso
Fig
e Capacity
Availability he limited phs Resource Cstatewide rat
cian need in eected to be 50isparately wont in emergeventable and
e to the Univins over 100ng and resid
nt source of p
d and ShortaShortage Ara shortage o
ation-to-prim
pital System. Cource Center, C
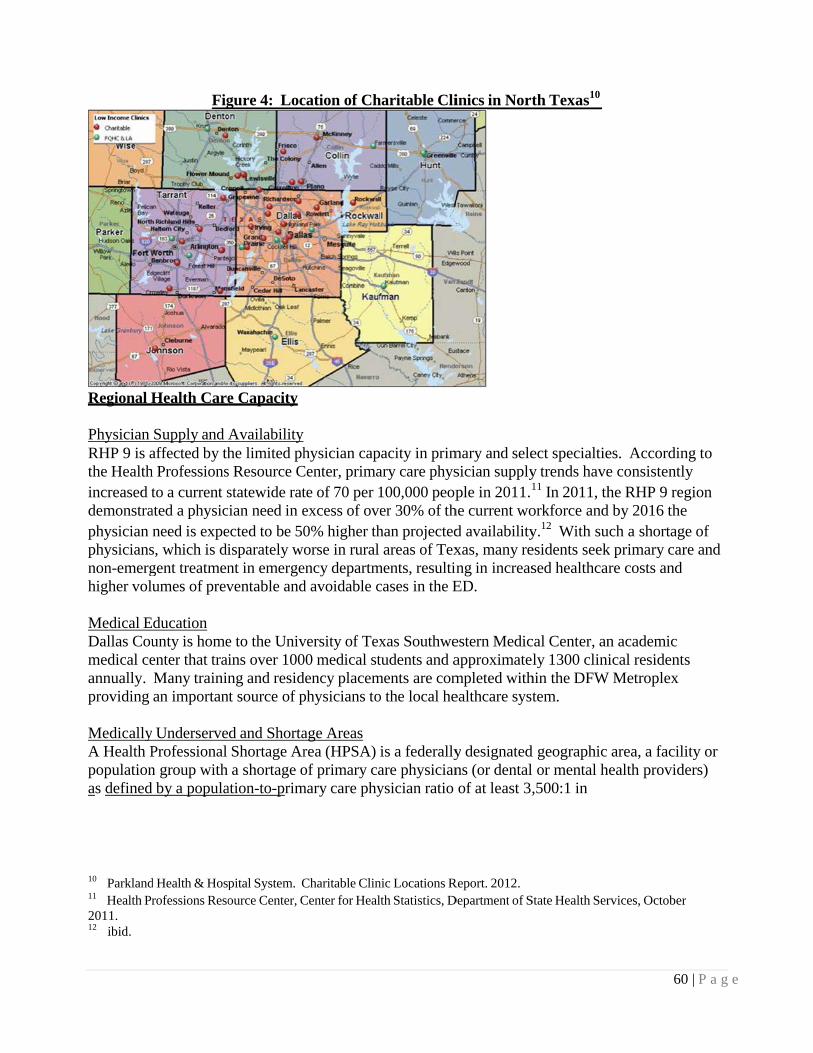
gure 4: Loc
hysician capCenter, primate of 70 per 1excess of ove0% higher thorse in rural
ency departmd avoidable c
versity of Tex00 medical stdency placemphysicians to
age Areas rea (HPSA) of primary ca
mary care phy
Charitable ClinCenter for Heal
cation of Ch
acity in primary care phys100,000 peoper 30% of thhan projectedareas of Tex
ments, resultincases in the E
xas Southwetudents and a
ments are como the local he
is a federallyare physicianysician ratio
nic Locations Rth Statistics, D
haritable Cli
mary and selesician supplyple in 2011.1
he current wod availabilityxas, many reng in increasED.
estern Medicapproximatempleted withealthcare syst
y designatedns (or dentalof at least 3,
Report. 2012. Department of S
inics in Nort
ect specialtiey trends have11 In 2011, thorkforce andy.12 With suesidents seeksed healthcar
cal Center, anly 1300 clini
hin the DFWtem.
d geographic l or mental h,500:1 in
State Health Ser
th Texas10
60
es. Accordine consistentlhe RHP 9 reg
d by 2016 theuch a shortagk primary carre costs and
n academicical resident
W Metroplex
area, a faciliealth provid
rvices, October
0 | P a g e
ng to ly gion e ge of re and
s
ity or ders)
r

61 | P a g e
addition to other requirements designated by the U.S. Department of Health and Human Services.13
Poverty rate, infant mortality rate, fertility rate and physical distance from care are all considerations in scoring for HPSA designation.
Medically Underserved Areas or Populations (MUA/MUP) are generally defined by the federal government to include areas of populations with a shortage of personal health care services or groups of people who may have cultural or linguistic barriers to health care. In RHP 9, Dallas County has significant HPSA and MUA regions that overlap and Kaufman County is a county- level HPSA with no MUAs.
Children/Youth The impact of the limited primary and specialty care is profound for children and families in the region. The current pediatric need is more than 80% of the current supply in the region. In Dallas County alone, over 36.2% of children were enrolled in Medicaid in 2010, exacerbating the issue of availability of pediatric primary care access and treatment.14 Data also indicates that many of the pediatric specialists have limited capacity, creating a backlogged pipeline for those needing specialty services after seeking primary care.
Behavioral Health
Behavioral Health System Structure and Funding The behavioral health system (including mental health and substance use) in RHP 9 differs from that of the rest of the state in that the majority of behavioral services for Medicaid and indigent patients are delivered through the NorthSTAR program instead of the traditional Local Mental Health Authority (LMHA) system. It is a managed behavioral healthcare carve-out program, administered by ValueOptions of Texas under a Medicaid 1915(b) waiver under the oversight of the North Texas Behavioral Health Authority (NTBHA), and it provides both mental health and substance use treatment to over 60,000 Medicaid enrollees and indigent uninsured annually.
Over the past decade, the NorthSTAR program has greatly expanded access to care. However, this high level of access results in funding and infrastructure challenges. Since the program’s inception, the growth in enrollment has outpaced funding such that the funding per person served is 30% less than when the program started in 1999 and is half that of the state average for other LMHAs15. Given that Texas is 50th in mental health funding nationwide16, the funding per person served in RHP 9 is among the lowest in the nation.
Mortality Trends in the Behavioral Health Population An inadequate supply of behavioral health services is one of the most significant unmet health needs of RHP 9. A recent study in Texas found that NorthSTAR was one of only four LMHAs in which age-adjusted mortality rates were significantly higher for the mental health population compared to the general population. Consistent with the NASMHPD study, the majority of
13 US Department of Health and Human Services. 2012. 14 Children’s Medical Center. Beyond ABC Report, 2011. 15 TriWest/Zia Partners. Assessment of the Community Behavioral Health Delivery System in Dallas County, 2010. 16 National Alliance on Mental Illness. State Mental Health Cuts: The Continuing Crisis. March 2011

62 | P a g e
deaths in this region were due to medical illness, and most of those were due cardiovascular disease.17 The NorthSTAR system differs from the rest of the state in that it includes patients with primary diagnoses of substance use disorders, a preliminary analysis of death records showed similar mortality rates between the mental health and substance abuse populations.18
Cost Trends in the Behavioral Health Population The financial implications of caring for those with behavioral health conditions are substantial and impact resources within the healthcare institutions of RHP 9. Analysis of DFW Hospital Council Foundation data demonstrates that charges associated with the care of mental health patients more than doubles from $50,000,000 to over $100,000,000 between the ages of 17 through 21. Charges continue to rise through adulthood, and between the ages of 47-65, the estimated charges for mental health encounters are higher than those of all other conditions combined. When substance abuse encounters are included, this difference is even greater.19
Figure 5: Age and Charge Distribution by Mental Health and Substance Abuse Encounter
(2010Q3-2011Q3)20
In RHP 9, the presence of a co-occurring behavioral health condition is associated with increased case severity of medical encounters and a 36% increase in the average charges per encounter. In RHP 9, 100% of the 10 most frequently admitted patients had a co-occurring behavioral health diagnosis depicted in Figure 5. These 10 individuals incurred a cost of more than $26 million between 2007 and 2011; however only 1/5 of their hospital emergency department visits were for a mental health or substance abuse issue. Sixty-one percent were uninsured (24% Medicaid, 12% Medicare, and 3% Insured).
17 Mortality of Public Mental Health clients treated at the Local Mental Health Authorities of Texas, 2012. 18 Personal communication between EA Becker and M Balfour
19 Dallas Fort Worth Hospital Council Foundation, Readmission Patterns by Mental Health & Substance Abuse, 2012 20 DFWHC Foundation, Information and Quality Services Data Warehouse, 2012.

Figure 7: TIntegratio
The percenbehavioralaverage ofCounty, isprimary caresources, An analysimedicationantipsychocompared
21 TriWest/Balfour, MEServices Ann
Fig
Top Ten Highn ‐ Behavior
ntage of resil healthcare if 37.1%.21 Ps not a Northare settings aas well as co
is of the diabns from the Notics, which to those rece
/Zia Partners. AE et al. Highlighnual Meeting, 2
gure 6: Men
h Emergencyral Health an
dents below in primary c
Parkland, the hSTAR proviare referred toordination obetic populatNorthSTAR adversely afeiving antips
Assessment of thting High Utili2011.
ntal Health a
y Departmennd Primary C
200% Federare settings ilargest prim
ider and consto NorthSTAof care issuetion at Parklasystem were
ffect metabolsychotics fro
the Communityizers: How can
and Substan
nt Utilizers: MCare
ral Poverty Lis 19.8% wh
mary care prosequently, so
AR. This mayes for those wand revealede twice as liklic indicatorsom the Parkla
y Behavioral Hn our systems be
nce Abuse: I
Mental Hea
Level in Dallhich is signifiovider to lowome who ma
ay result in diwith high comd that diabetikely to receivs associatedand pharmac
Health Deliveryetter meet their
Intersection
lth and Subs
las County wficantly lowerw-income popay be succesilution of limmplexity co-ics receivingve second-gewith poor dicy.22
y System in Dalr needs? Institu
63
n
stance Abuse
who receiver than the napulations in Dsfully served
mited NorthS-occurring il
g antipsychoteneration iabetes outco
llas County, 20ute on Psychiatr
| P a g e
e
ational Dallas d in STAR llness. tic
omes,
10. 22
ric

64 | P a g e
The funding challenges combined with the complexity of the behavioral health system may adversely impact sub-populations with the highest needs. The number of NorthSTAR enrollees booked into jail has been steadily increasing as shown below in Figure 823, and 27% of all book- ins to the Dallas County Jail are currently referred to jail behavioral health services.24 Homeless individuals with behavioral health conditions cost three times as much and are booked into jail twice as often as the general NorthSTAR population.25 Among high utilizers, these relationships are magnified, as illustrated below.
Figure 8: Behavioral Health Patient Factors for Top 20% Utilizers of NorthSTAR, Dallas
County Jail, and Terrell State Hospital, 2010
Figure 9: Behavioral Health Costs for Top 20% Utilizers of NorthSTAR, Dallas County Jail,
and Terrell State Hospital, 2010
23 Ron Stretcher and Jill Reese, Dallas County Criminal Justice Department
24 Communication between Wassem Ahmed, Medical Director-Parkland Jail Behavioral Health and M. Balfour, MD 25 Balfour, ME. Homelessness, Criminal Justice, and the NorthSTAR Top 200 Report, 2011.

Children/YThe numbfrom 2000emotional5% of thosages of 12
Cultural anHispanics there is a lcharacteriz
Demand fFollowingat Green Othere has bcompared both regulreduction
In additionorder to prexists but Leadership“wraparoudriven serv
Chronic D
Similar to including adults with
Figure 10Diabetes
In an assestypes that are those f
26 TriWest/Zia27 ValueOption
Youth ber of Dallas 0 to 2010. In disturbancese children e
2-17, 7.2% ha
nd Linguisticomprise 40
lack of servicze the extent
for Behaviorag the economOaks Hospitabeen a sharpto Dec 2011
latory oversiin funding fo
n to hospitalrevent the nethere are onlp Team has iund” servicesvices to enga
Disease
national trenheart diseasehin the Dalla
0: Dallas Co
ssment of EDwere most fr
for chronic c
a Partners. Assens of Texas
County chiln Dallas Coue or addictiveexperiencingave experien
c Minorities0% of the poces availablet of the need
al Health Sermic downturnal, mostly acspike in 23-
1 (and 25% hght limiting
for outpatient
-type serviceeed for thesely 21 beds foidentified ths to reduce thage clients e
nds, North Te, cancer andas County M
unty Adults
D utilizationfrequent and conditions of
essment of the C
dren receivinunty, the nume disorder hag a significannced a major
s opulation bute and written, because da
rvices n in 2009, thecounted for-hour observhigher compathe capacityt services in
es, there is ale high-cost seor the entire e highest neehe 20% 30-darly in order
Texas is exped stroke. Als
Metropolitan S
s with Asthm
n, the five encof highest vo
f asthma, chr
Community Be
ng publicly fmber of childas increased tnt impairmen
depressive e
t only 25% on materials avata on primar
ere was a 17%by new enro
vation utilizatared to Feb 2
y of Parklandthe NorthST
lso a need foervices. A suNorthSTARed for servicday readmissr to prevent c
eriencing incso there are iStatistical A
ma and
counter olume ronic bronch
ehavioral Health
funded mentdren identifieto approxim
nt as a result.episode.
of the NorthSvailable in Sry language i
% increase iollees to Nortation, with Fe2011).27 Thi
d’s PsychiatrTAR system.
or less-acute ub-acute cris
R region. Thece developmesion rate to ccrisis episod
creasing ratesincreasing ra
Area as shown
hitis, pain/ach
th Delivery Sys
tal health sered with a dia
mately 142,00. Among you
STAR populSpanish, it is is not collect
in 23-hour obrthSTAR. Meb 2012 visitis increase c
ric ED by 50.
levels of behsis residentiae Behavioralent to be posrisis serviceses.
s of many chates of asthmn below.
hing of
stem in Dallas C
65 | P
rvices has trignosable
00 children wuth between
lation.26 Whdifficult to
ted.
bservation vMore recently
ts 26% highecoincided wit% and a
havioral careal level of cal Health st-crisis s, and peer-
hronic diseasma and diabet
County, 2010.
P a g e
ipled
with the
hile
isits y, er th
e in are
ses, tes in
66 | P a g e
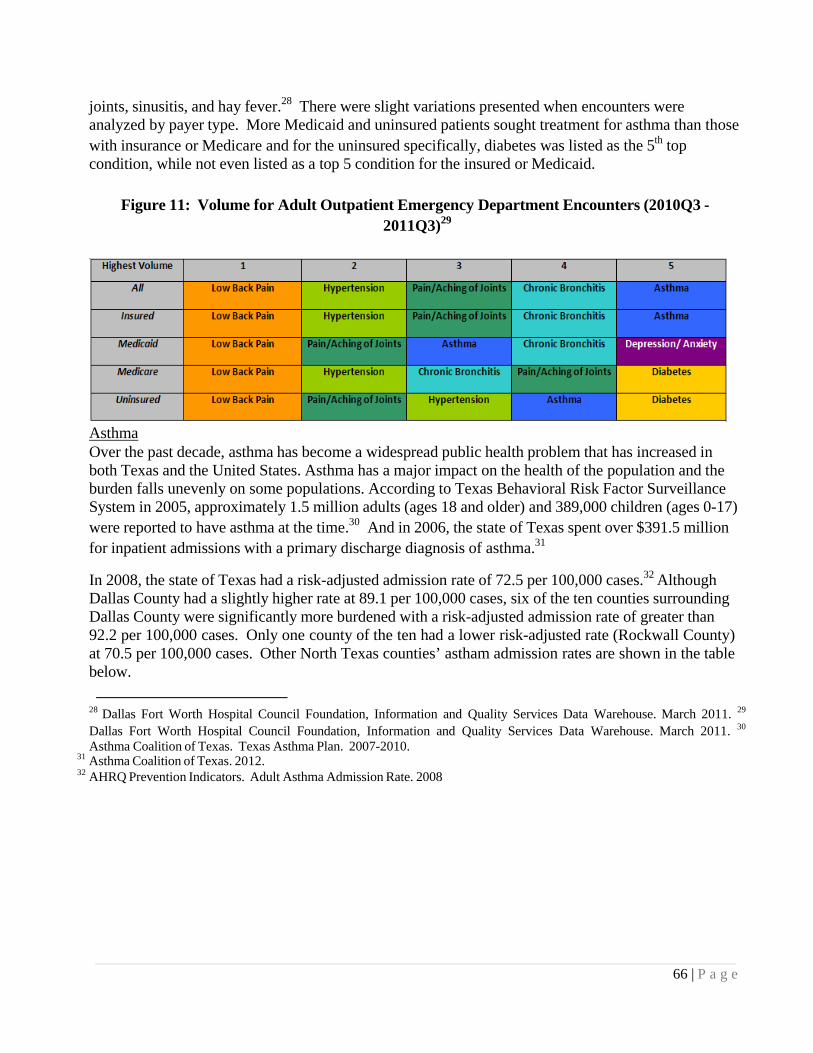
joints, sinusitis, and hay fever.28 There were slight variations presented when encounters were analyzed by payer type. More Medicaid and uninsured patients sought treatment for asthma than those with insurance or Medicare and for the uninsured specifically, diabetes was listed as the 5th top condition, while not even listed as a top 5 condition for the insured or Medicaid.
Figure 11: Volume for Adult Outpatient Emergency Department Encounters (2010Q3 -
2011Q3)29
Asthma Over the past decade, asthma has become a widespread public health problem that has increased in both Texas and the United States. Asthma has a major impact on the health of the population and the burden falls unevenly on some populations. According to Texas Behavioral Risk Factor Surveillance System in 2005, approximately 1.5 million adults (ages 18 and older) and 389,000 children (ages 0-17) were reported to have asthma at the time.30 And in 2006, the state of Texas spent over $391.5 million for inpatient admissions with a primary discharge diagnosis of asthma.31
In 2008, the state of Texas had a risk-adjusted admission rate of 72.5 per 100,000 cases.32 Although Dallas County had a slightly higher rate at 89.1 per 100,000 cases, six of the ten counties surrounding Dallas County were significantly more burdened with a risk-adjusted admission rate of greater than 92.2 per 100,000 cases. Only one county of the ten had a lower risk-adjusted rate (Rockwall County) at 70.5 per 100,000 cases. Other North Texas counties’ astham admission rates are shown in the table below.
28 Dallas Fort Worth Hospital Council Foundation, Information and Quality Services Data Warehouse. March 2011. 29
Dallas Fort Worth Hospital Council Foundation, Information and Quality Services Data Warehouse. March 2011. 30
Asthma Coalition of Texas. Texas Asthma Plan. 2007-2010. 31 Asthma Coalition of Texas. 2012. 32 AHRQ Prevention Indicators. Adult Asthma Admission Rate. 2008

67 | P a g e
Diabetes Diabetes affects 11.4% of the population in Dallas County, which is above both the state average of 10% and the national average of 8%. In patients seen throughout the regional healthcare system and who are residents of Dallas County, the top five primary diagnoses, those patients with an underlying condition of diabetes were 29% for pneumonia, 39% for septicemia, 31% for other rehabilitation, 34% of urinary tract infection and 45% of acute kidney failure.33 Those with diabetes had a higher mortality percentage than those without in four of the five top inpatient diagnoses revealing that a co-morbidity of diabetes increases your risk for mortality.
Dallas County’s top seven diagnoses for ER patients were Acute URI Unspecified, Otitis Media, abdominal pain, chest pain unspecified, urinary tract infection, headache and other chest pain. Within those top seven diagnoses, 20%-45% had an underlying condition of diabetes. Specifically, of all patients who came to the ER with chest pain as a diagnosis, 21%-25% had a comorbidity of diabetes. Of patients presenting with abdominal pain, urinary tract infections and headache, 10% also had diabetes.
33 Doughty, P. et al. Diabetes in Dallas County: Provider Report. 2011

68 | P a g e
Figure 12: Prevalence of Co-Occurring Diabetes, Dallas County 2009-2010
Children/Youth. Between 2000 and 2010, the number of Children’s Medical Center admissions of youth with a primary or secondary diagnosis of diabetes increased by 34%. With the association of diabetes and obesity, there is also cause for concern of the future trajectory as low income preschool obesity within the Dallas Metropolitan Statistical Area was 17.2% in 2009, placing many young children at higher rates of developing diabetes in later years.34
Cost/Charge. Isolation of a specific “direct cost” is complicated. However, it is understood that the societal burden for this condition is extremely large and has manifestations in healthcare service utilization due to increases complexity and severity of other co-occurring medical conditions. Additionally, there are important societal costs of lower economic productivity of individuals with severe diabetic complications. The magnitude of the issues is only projected to increase as more people begin to develop diabetes at earlier in life.
Patient Safety and Quality and Hospital Acquired Conditions
The DFWHC Foundation’s 77 hospitals had 1,706 adverse hospital events in 2010. These events included air embolism, Legionnaires, Iatrogenic Pneumothorax, delirium, blood incompatibility, glycemic control issues and Clostridium difficile, which are not part of the ten adverse events specified by CMS. A significant portion was made up of Medicare patients (46%) and insured (54%) according to the claims data within the DFWHC Foundation claims data warehouse.
Emergency Department Usage and Readmissions
An analysis of the emergency department encounters demonstrates that many in the population are accessing emergency departments for both urgent and non-urgent conditions. Over the most recent four quarters of data, the conditions for which the most volume of care
34 Children’s Medical Center. Beyond ABC Report, 2012 was provided in an emergency outpatient setting were: low back pain, hypertension, pain/joint

69 | P a g e
aching, chronic bronchitis, and asthma.Further assessment demonstrates that, with the exception of asthma, over 68% of the encounters for the top primary health conditions listed above were either non-emergent or emergent/primary care treatable, in that the care could have been provided effectively in a primary care setting. For asthma, approximately 98.1% of all encounters were emergent, however the condition could have been potentially avoidable or preventable if effective ambulatory care could have been received during the illness episode.35
For emergency department encounters that resulted in a hospital admission, the most common health conditions by volume include stroke, diabetes, congestive heart failure, weak/failing kidneys, chronic bronchitis and heart attack. When reviewing by payer type, diabetes is the top condition for the uninsured and Medicaid and the 5th top condition for those who are insured.
Figure 14: Adult Inpatient Emergency Department Encounters (2010Q3 - 2011Q3)36
Specific to children, the high volume ED encounters includes asthma, diabetes, pain/aching joints, and arthritis most frequently. Regardless of payer type, asthma and diabetes are the top conditions for ER and inpatient admissions.
Figure 15: Pediatric Inpatient Emergency Department Encounters (2010Q3 - 2011Q3)37
35 DFWHC Foundation, Information and Quality Services Data Warehouse, 2011. 36 Ibid. 37 Ibid.

In North Tthe incidenare workinheart failu
As evidencrelationshimental hea
Figure
Cost/CharFrom quaremergencytotal chargcharge var
Palliative
Palliative reimbursempercentile palliative cvariability1.17 when
Oral Heal
Tooth decof Texas cnational av
38 DFWHC Fou
Texas, all-caunt encounter ng to continure, acute my
ced by an asip between ralth or substa
16: Top Te
rge rter 3 of 2010y outpatient ges increase triation across
Care
care is an imments to proin the countcare services
y of the percen compared t
lth
ay (dental cachildren repoverage and l
undation, Infor
use readmissof any type
ue improvemyocardial infa
ssessment of eadmissionsance abuse h
n High Eme
0 to quarter 3encounters wto $2,076,77s insured, M
mportant factooviders in Datry during a ps being provientage of deao the nationa
aries) is the morted to havelower within
rmation and Qu
sions as definhas demonst
ment in this ararction, and p
f 10 individuas and behaviohistory over t
ergency Dep
3 of 2011, thwas $312,81678,420. For
Medicaid, Med
or in the careallas Countypatient’s lastided. Even waths occurrinal average.
most commo teeth in exc
n all age, sex,
uality Services D
ned by a subtrated a dowrea, specificapneumonia.
al high utilizoral health. Ethe course of
partment UtAbuse
he estimated6,490 and foemergency idicare, and U
e delivery syare higher th
t two years owithin the heng within hos
on chronic chcellent or ver, and racial/e
Database, 2010
bsequent admwnward trend
ally for readm
zers in the reEach patientf their encou
tilizers: Me
charges assoor emergencyinpatient encUninsured pa
ystem of RHPhan average
of life signifyealth servicespitals, rangi
hildhood disery good condethnic subgro
0.
mission withid since 2008.dmission rela
egion, there it has some counter history.
ental Health
ociated with y inpatient encounters, theayer types.
P 9. Overalland higher t
ying a large v area of RHPing from 0.6
ease. In 2003dition was looups.
70 |
in 30 days fr.38 Many hos
ated to conge
s a strong omponent of.
and Substa
all regionalncounters, there was little
l, Medicarethan the 50th
volume of P 9, there is
69 percent to
3, the proporower than the
P a g e
rom spitals estive
f
ance
he
rtion e

71 | P a g e
Figure 17: Oral Health – Condition of Teeth for Texas Children (2003)
Condition of Teeth: Excellentor very good
Preventive Dental Care: ≥ 1 Visitwithin Past Year
US% Texas% US% Texas %
Age Group
All children 0–17 64.3 57.6 67.6 61.6
Age (years) 1–5 75.8 70.7 46.8 48.4
6–11 61.7 50.9 83.4 74.8
12–17 67.4 61.2 79.4 69.7
Socioeconomic status
0–99% Federal poverty level 45.4 40.7 54.1 56.0
100–199% Federal poverty level 56.5 48.9 61.6 52.6
200–399% Federal poverty level 71.2 66.7 73.0 67.4
≥400% Federal poverty level 78.1 78.3 77.8 73.3
Race/ethnicity
White 69.3 65.4 70.6 64.4
Black 57.4 53.4 62.6 64.9
Dental problems in adults are equally problematic. According to the U.S. Surgeon39 most adults in the U.S. show signs of periodontal or gingival diseases and severe periodontal disease affects 14 percent of adults (ages 45–54 years). However, a little less than two-thirds of adults report visiting a dentist within the past 12 months, and those with incomes at or above the poverty level are twice as likely to report a dental visit in the past 12 months as those below the poverty level. The American Dental Association cited the major reason for not accessing regular oral health care is the high cost of dental care. And the number of individuals who lack dental insurance is more than 2.5 times the number of those who lack medical insurance.
Effective health policies intended to expand access, improve quality, or contain costs must consider the supply, distribution, preparation, and utilization of the workforce. According to the National Health Service Corps, Texas needs 784 additional dentists to achieve the recommended ratio of one dentist for every 3,000 residents. The overall supply of dentists in Texas has been consistently below the national average of 59-60 dentists per 100,000 for many years.40 In 2006, Texas had 36.0 dentists per 100,000 and it has been declining since.
39 National Institute of Health. National Institute of Dental and Craniofacial Research. “Oral Health in America: A Report of the Surgeon General. 2000. 40 State Department of Health & Human Services, Center for Health Statistics Health Professions Resource Center. Publication No. 25-12581. E-Publication No. E25-12581. March 2007.
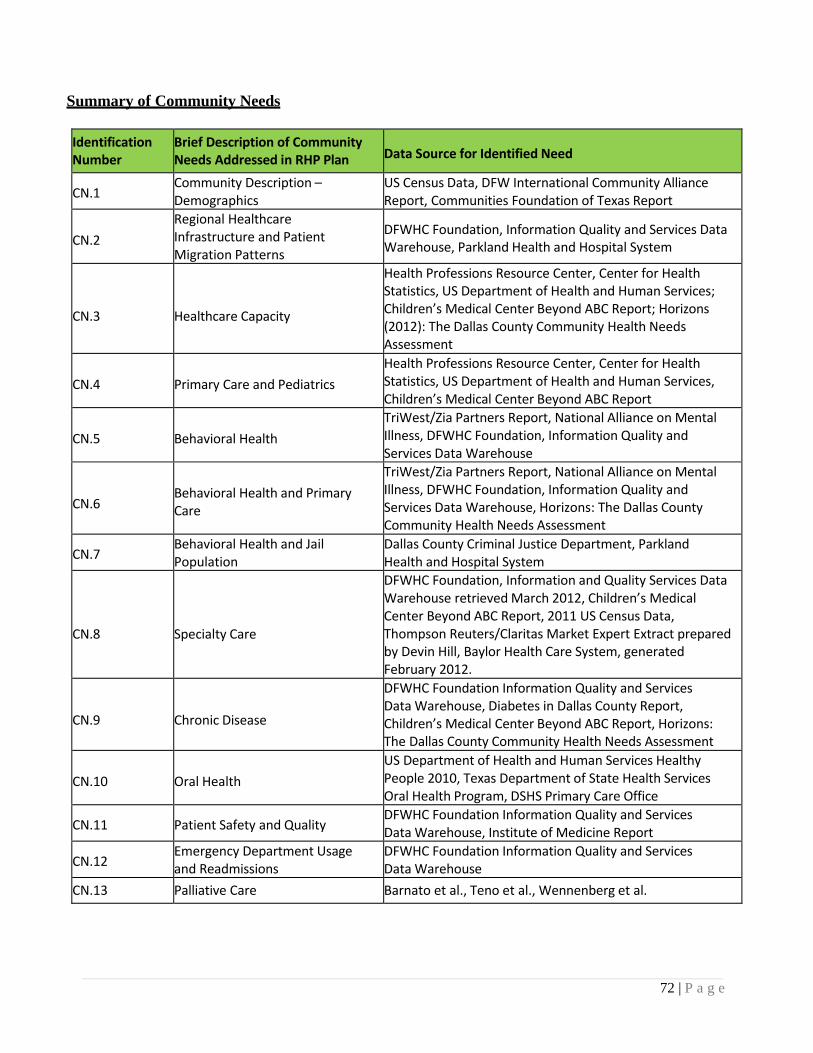
72 | P a g e
Summary of Community Needs
Identification Number
Brief Description of Community Needs Addressed in RHP Plan
Data Source for Identified Need
CN.1 Community Description – Demographics
US Census Data, DFW International Community Alliance Report, Communities Foundation of Texas Report
CN.2
Regional Healthcare Infrastructure and Patient Migration Patterns
DFWHC Foundation, Information Quality and Services Data Warehouse, Parkland Health and Hospital System
CN.3
Healthcare Capacity
Health Professions Resource Center, Center for HealthStatistics, US Department of Health and Human Services; Children’s Medical Center Beyond ABC Report; Horizons (2012): The Dallas County Community Health Needs Assessment
CN.4
Primary Care and Pediatrics
Health Professions Resource Center, Center for Health Statistics, US Department of Health and Human Services, Children’s Medical Center Beyond ABC Report
CN.5
Behavioral Health
TriWest/Zia Partners Report, National Alliance on Mental Illness, DFWHC Foundation, Information Quality and Services Data Warehouse
CN.6
Behavioral Health and Primary Care
TriWest/Zia Partners Report, National Alliance on MentalIllness, DFWHC Foundation, Information Quality and Services Data Warehouse, Horizons: The Dallas County Community Health Needs Assessment
CN.7 Behavioral Health and Jail Population
Dallas County Criminal Justice Department, Parkland Health and Hospital System
CN.8
Specialty Care
DFWHC Foundation, Information and Quality Services Data Warehouse retrieved March 2012, Children’s Medical Center Beyond ABC Report, 2011 US Census Data, Thompson Reuters/Claritas Market Expert Extract prepared by Devin Hill, Baylor Health Care System, generated February 2012.
CN.9
Chronic Disease
DFWHC Foundation Information Quality and ServicesData Warehouse, Diabetes in Dallas County Report, Children’s Medical Center Beyond ABC Report, Horizons: The Dallas County Community Health Needs Assessment
CN.10
Oral Health
US Department of Health and Human Services Healthy People 2010, Texas Department of State Health Services Oral Health Program, DSHS Primary Care Office
CN.11 Patient Safety and Quality DFWHC Foundation Information Quality and Services DataWarehouse, Institute of Medicine Report
CN.12 Emergency Department Usage and Readmissions
DFWHC Foundation Information Quality and Services DataWarehouse
CN.13 Palliative Care Barnato et al., Teno et al., Wennenberg et al.

73 | P a g e
References
1. TriWest Group, Zia Partners, and Dallas County Behavioral Health System Redesign Task Force. “Assessment of the Community Behavioral Health Delivery System in Dallas County: Detailed Report.” Dallas, TX. September 30, 2010.
2. Dallas Fort Worth Hospital Council Foundation. Information and Quality Services (IQSC) Data Warehouse. Irving, TX. Retrieved, March 2012.
3. Dallas Fort Worth Hospital Council Foundation. Healthy North Texas: Community Health Website. www.healthyntexas.org. Irving, TX. Retrieved, March 2012.
4. Institute of Medicine. “For the Public’s Health: Investing in a Healthier Future.” Washington D.C., April 10, 2012
5. Parkland Health and Hospital System. 6. Public Health Institute. ”Best Practices for Community Health Needs Assessment and Implementation
Strategy Development: A Review of Scientific Methods, Current Practices, and Future Potential. Report of Proceedings from a Public Forum and Interview of Experts.” Atlanta, GA. July 11‐13, 2011.
7. The Center for Health and Public Service Research, Robert F. Wagner Graduate School of Public Service. New York University. NYU ED Algorithm wagner.nyu.edu/chpsr/index.html?p=25. Retrieved, April 2012.
8. Doughty, P and Jones, J. Dallas Fort Worth Hospital Council Foundation. “Diabetes in Dallas County: Provider Report.” September, 2011.
9. North Texas Behavioral Health Authority. Data Book. www.ntbha.org/reports.aspx. Retrieved, April, 2012. 10. Communities Foundation of Texas. Assets and Opportunities Profile, North Texas.
http://www.cftexas.org/netcommunity/page.aspx?pid=953. February 16, 2012. 11. US Census Bureau. www.census.gov Retrieved April, 2012. 12. Pickens, S. Parkland Health and Hospital System. Charitable Clinics in North Texas: Presentation.
March 2012 13. Anderson, G.F. Medicare and chronic conditions. New England Journal of Medicine. 353(3): 305‐209. 2005. 14. deVries E.N., Ramrattan M.A., Smorenburg, S.M., Gouma, D.J., Boermeester, M.A. The incidence and nature
of in‐hospital adverse events: a systematic review. Quality and Safety in Healthcare. 2008. 17(30): 216‐223. 15. Institute of Medicine. Living Well with Chronic Illness: A Call for Public Health Action.
Committee on Living Well with Chronic Disease: Public Health Action to Reduce Disability and Improve Functioning and Quality of Life. February 2012.
16. Children’s Medical Center. Beyond ABC: Assessing Children’s Health in Dallas County. 2011. 17. US Census Data. Thompson Reuters/Claritas Market Expert Extract. Prepared by Devin Hill, Baylor Health
Care System. Generated, February 2012. 18. DFW International Community Alliance. 2010 North Texas Progress Report. www.dfwinternational.org.
Retrieved, February 2012. 19. US Census Data. www.census.gov. Retrieved, March 2012. 20. National Alliance on Mental Illness. State Mental Health Cuts: The Continuing Crisis.
http://www.nami/org/Template.cf.?Section=state_budget_cuts_report. March 2011. 21. Parks J., Svedsen D. (eds). Morbidity and Mortality in People with Serious Mental Illness.
Alexandria, VA. The National Association of State Mental Health Program Directors, 2006. http://www.nasmhpd.org/general_files/publications/med_directors_pubs/Technical%20Report
%20n%20Morbidity%20and%20Mortality%20‐%20Final%2011‐06.pfd

74 | P a g e
22. Reynolds, R.J, Shafer, A.B., and Becker, E.A. Mortality of Public Mental Health Clients treated at the Local Mental Health Authorities of Texas. Texas Public Health Association Journal. 2012. Apr 64(2):35‐40.
23. JEN Associates. Beneficiary Risk Management: Prioritizing High Risk SMI Patients for Case Management/Coordination. February 2010. www.dhcs.ca.gov/progovpart/documents/high%20Priority%20SMI%20Application%20Exec%202 4Feb2010v2.pfd
24. Balfour, M.E., Van der Feltz‐Cornelis C., Rosen L.A., Cline C.A., Moffic S. Highlighting High Utilizers: How can or systems better meet their needs? Institute on Psychiatric Services Annual Meeting. Workshop 3. San Francisco, CA. October 2011.
25. Balfour M.E. Homelessness, Criminal Justice, and the NorthSTAR Top 200. Report to the Dallas County Behavioral Health Leadership Team. February 2011. http://www.dallasbhlt.org/index.php?option=com_content&view=article&id=95
26. Value Options of Texas. 27. Edwards, J., Pickens, S., Schultz, L., Erickson, N., Dykstra, D. (2012). Horizons: The Dallas County
Community Health Needs Assessment. Dallas, TX: Dallas County Health and Human Services and Parkland Health and Hospital System.
28. Cook Children’s Center for Children’s Health Data Website. http://www.centerforchildrenshealth.org/en‐ us/Resources/Pages/Resources.aspx Accessed October 2012.
29. United Way Denton County. Assets and Needs Assessment Report for Denton County. August 2011.