Embed Size (px)
Citation preview

Quarterly Management Report
Third Quarter 2010

1 Interim Management Discussion and Analysis |
INTERIM MANAGEMENT DISCUSSION and ANALYSIS For the Nine Months Ended September 30, 2010 This interim Management Discussion and Analysis (“MD&A”) dated November 5, 2010 should be read in conjunction with Newfoundland Power Inc.’s (the “Company” or “Newfoundland Power”) interim unaudited financial statements and notes thereto for the nine months ended September 30, 2010 and the MD&A and annual audited financial statements for the year ended December 31, 2009. The MD&A has been prepared in accordance with National Instrument 51-102 - Continuous Disclosure Obligations. Financial information herein, all of which is unaudited, reflects Canadian dollars and Canadian generally accepted accounting principles (“Canadian GAAP”), including certain accounting practices unique to rate regulated entities. These accounting practices, which are disclosed in Notes 2 and 4 to the Company’s 2009 annual audited financial statements, result in the recognition of revenues, expenses, regulatory assets and regulatory liabilities which would not occur in the absence of rate regulation and which affect the Company’s reported earnings, cash flows and financial position. Certain information herein is forward-looking and reflects management’s current expectations regarding the Company’s future financial and related performance. The words “anticipates”, “believes”, “budgets”, “could”, “estimates”, “expects”, “forecasts”, “intends”, “may”, “might”, “plans”, “projects”, “schedule”, “should”, “will”, “would” and similar expressions are often intended to identify the forward-looking information, although not all forward-looking information contains these identifying words. The forward-looking information reflects management’s current beliefs and is based on information currently available to the Company’s management. Certain material factors, estimates and assumptions, which are subject to inherent risks and uncertainties surrounding future expectations generally, have been applied in drawing the conclusions contained in the forward-looking statements. These are related to, but are not limited to, regulation; energy supply; competition; general economic conditions; health, safety and the environment; interest rates; insurance; weather; labour relations; licences and permits; capital resources and liquidity. Readers are cautioned to not place undue reliance on forward-looking statements because actual results could differ materially from the results discussed or implied in those statements. The Company undertakes no obligation to revise or update any forward-looking information as a result of new information, future events or otherwise. Additional information, including the Company’s quarterly and annual financial statements and MD&A, annual information form and management information circular, is available on SEDAR at www.sedar.com. OVERVIEW The Company Newfoundland Power is a regulated electricity utility that owns and operates an integrated generation, transmission and distribution system throughout the island portion of the Province of Newfoundland and Labrador. All the Company’s common shares are owned by Fortis Inc. (“Fortis”), which is principally a diversified, international holding company for electricity and gas distribution utilities. Newfoundland Power’s primary business is electricity distribution. It generates approximately 8 per cent of its electricity needs and purchases the remainder from Newfoundland and Labrador Hydro (“Hydro”). Newfoundland Power serves over 242,000 customers comprising about 86 per cent of all electricity consumers in the Province. Newfoundland Power’s vision is to be a leader among North American electricity utilities in terms of safety, reliability, customer service and efficiency. The key goals of the Company are to operate sound electricity distribution systems, deliver safe reliable electricity to customers at the lowest reasonable cost and conduct business in an environmentally and socially responsible manner. Regulation Newfoundland Power is regulated by the Newfoundland and Labrador Board of Commissioners of Public Utilities (the “PUB”). The Company operates under cost of service regulation whereby it is entitled the opportunity to recover, through customer rates, all reasonable and prudent costs incurred in providing electricity service to its customers, including a just and reasonable return on its rate base. The rate base is the value of the net assets required to provide electricity service.
2 Interim Management Discussion and Analysis |
Between general rate hearings, customer rates are established annually through an automatic adjustment formula (the “Formula”). The Formula sets an appropriate rate of return on common equity (“ROE”) which is used to determine the rate of return on rate base. Pursuant to the 2010 General Rate Application (“2010 GRA”), the Company’s rate of return on rate base for ratemaking purposes was set at 8.23 per cent, with a range of 8.05 per cent to 8.41 per cent, for 2010. This reflects a regulated ROE of 9.00 per cent for 2010 compared to 8.95 per cent for 2009. Customer rates increased by an average of approximately 3.5 per cent effective January 1, 2010. The 2010 GRA provided for revenue and costs changes as well as the amortization of certain regulatory assets and liabilities and the creation of a pension expense variance deferral account (“PEVDA”). The PEVDA deals with differences between defined benefit pension expense calculated in accordance with Canadian GAAP and pension expense approved by the PUB for rate setting purposes. On March 12, 2010, the Company submitted an application to the PUB with proposed changes to the existing Formula. In this application, Newfoundland Power proposed use of the Consensus Forecasts in determining the risk-free rate for calculating the forecast cost of equity to be used in the Formula for 2011 and 2012. The application received PUB approval on April 20, 2010. The previous approach used a 10-day observation of long-term Canada Bond yields as the forecast risk-free rate. The 2010 general rate order is expected to yield earnings and cash flows that will enable the Company to maintain its investment grade credit ratings. Financial Highlights
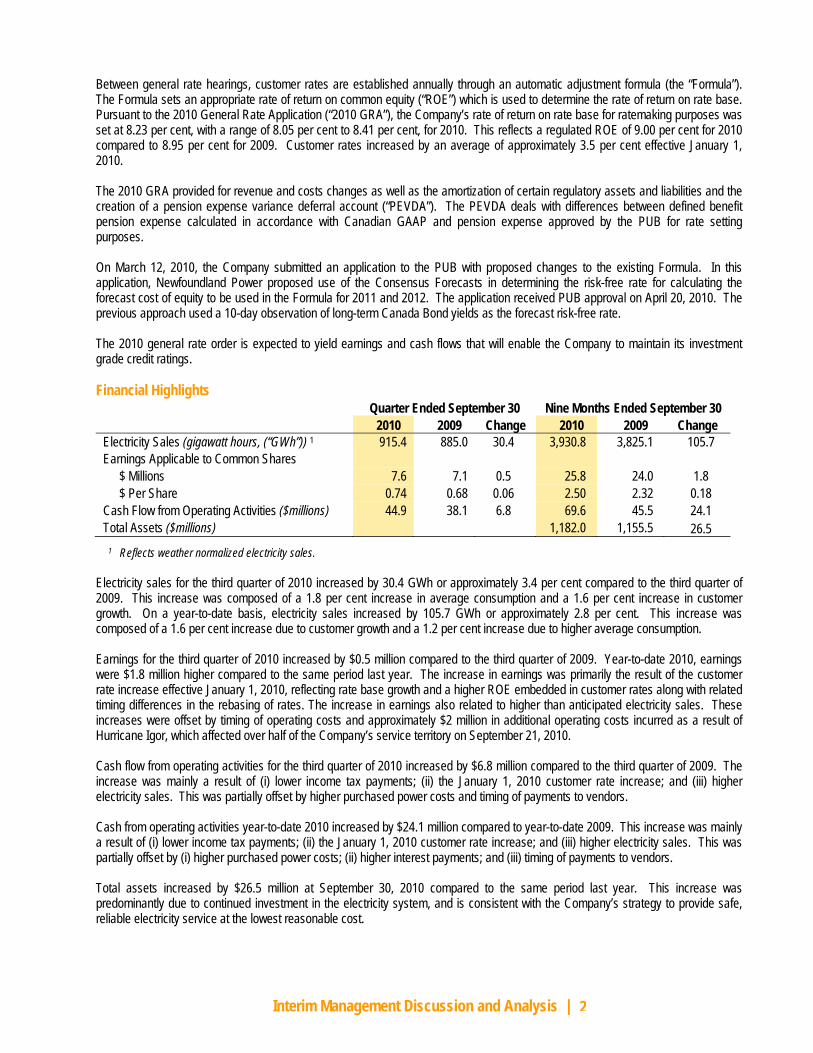
Quarter Ended September 30 Nine Months Ended September 30 2010 2009 Change 2010 2009 Change Electricity Sales (gigawatt hours, (“GWh”)) 1 915.4 885.0 30.4 3,930.8 3,825.1 105.7 Earnings Applicable to Common Shares
$ Millions 7.6 7.1 0.5 25.8 24.0 1.8 $ Per Share 0.74 0.68 0.06 2.50 2.32 0.18
Cash Flow from Operating Activities ($millions) 44.9 38.1 6.8 69.6 45.5 24.1 Total Assets ($millions) 1,182.0 1,155.5 26.5
1 Reflects weather normalized electricity sales.
Electricity sales for the third quarter of 2010 increased by 30.4 GWh or approximately 3.4 per cent compared to the third quarter of 2009. This increase was composed of a 1.8 per cent increase in average consumption and a 1.6 per cent increase in customer growth. On a year-to-date basis, electricity sales increased by 105.7 GWh or approximately 2.8 per cent. This increase was composed of a 1.6 per cent increase due to customer growth and a 1.2 per cent increase due to higher average consumption. Earnings for the third quarter of 2010 increased by $0.5 million compared to the third quarter of 2009. Year-to-date 2010, earnings were $1.8 million higher compared to the same period last year. The increase in earnings was primarily the result of the customer rate increase effective January 1, 2010, reflecting rate base growth and a higher ROE embedded in customer rates along with related timing differences in the rebasing of rates. The increase in earnings also related to higher than anticipated electricity sales. These increases were offset by timing of operating costs and approximately $2 million in additional operating costs incurred as a result of Hurricane Igor, which affected over half of the Company’s service territory on September 21, 2010. Cash flow from operating activities for the third quarter of 2010 increased by $6.8 million compared to the third quarter of 2009. The increase was mainly a result of (i) lower income tax payments; (ii) the January 1, 2010 customer rate increase; and (iii) higher electricity sales. This was partially offset by higher purchased power costs and timing of payments to vendors. Cash from operating activities year-to-date 2010 increased by $24.1 million compared to year-to-date 2009. This increase was mainly a result of (i) lower income tax payments; (ii) the January 1, 2010 customer rate increase; and (iii) higher electricity sales. This was partially offset by (i) higher purchased power costs; (ii) higher interest payments; and (iii) timing of payments to vendors. Total assets increased by $26.5 million at September 30, 2010 compared to the same period last year. This increase was predominantly due to continued investment in the electricity system, and is consistent with the Company’s strategy to provide safe, reliable electricity service at the lowest reasonable cost.
3 Interim Management Discussion and Analysis |
RESULTS OF OPERATIONS Revenue:
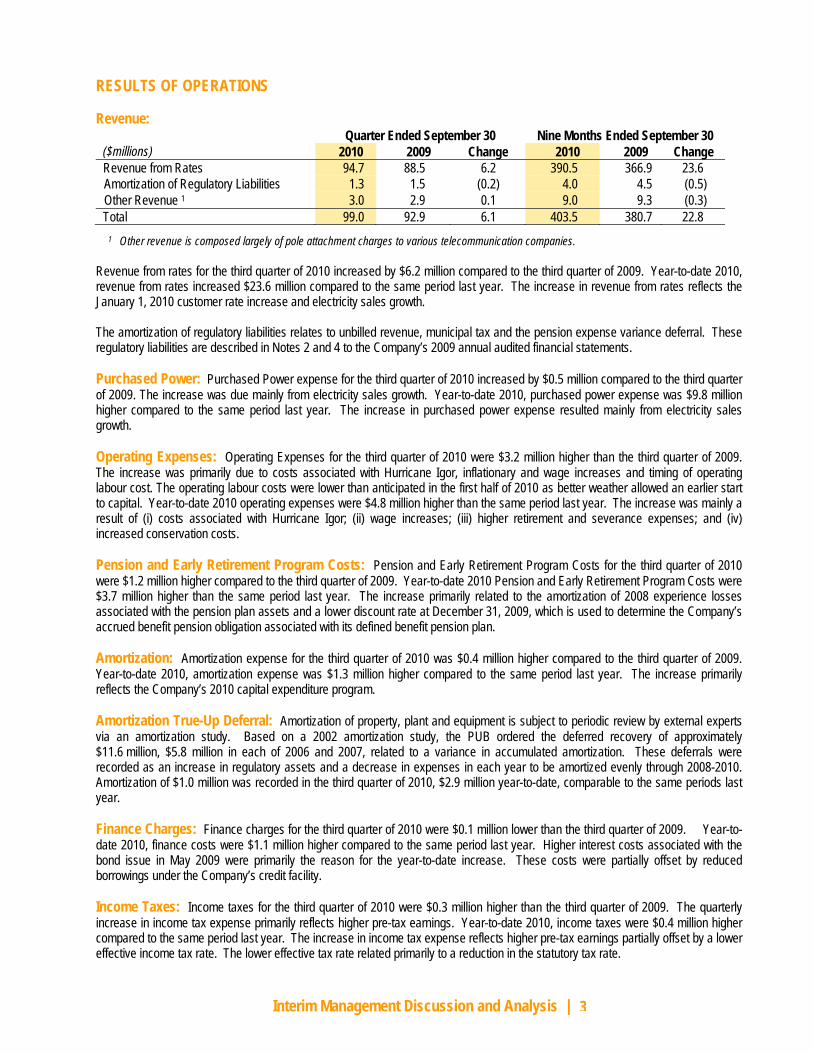
Quarter Ended September 30 Nine Months Ended September 30 ($millions) 2010 2009 Change 2010 2009 Change Revenue from Rates 94.7 88.5 6.2 390.5 366.9 23.6 Amortization of Regulatory Liabilities 1.3 1.5 (0.2) 4.0 4.5 (0.5) Other Revenue 1 3.0 2.9 0.1 9.0 9.3 (0.3) Total 99.0 92.9 6.1 403.5 380.7 22.8
1 Other revenue is composed largely of pole attachment charges to various telecommunication companies.
Revenue from rates for the third quarter of 2010 increased by $6.2 million compared to the third quarter of 2009. Year-to-date 2010, revenue from rates increased $23.6 million compared to the same period last year. The increase in revenue from rates reflects the January 1, 2010 customer rate increase and electricity sales growth. The amortization of regulatory liabilities relates to unbilled revenue, municipal tax and the pension expense variance deferral. These regulatory liabilities are described in Notes 2 and 4 to the Company’s 2009 annual audited financial statements. Purchased Power: Purchased Power expense for the third quarter of 2010 increased by $0.5 million compared to the third quarter of 2009. The increase was due mainly from electricity sales growth. Year-to-date 2010, purchased power expense was $9.8 million higher compared to the same period last year. The increase in purchased power expense resulted mainly from electricity sales growth. Operating Expenses: Operating Expenses for the third quarter of 2010 were $3.2 million higher than the third quarter of 2009. The increase was primarily due to costs associated with Hurricane Igor, inflationary and wage increases and timing of operating labour cost. The operating labour costs were lower than anticipated in the first half of 2010 as better weather allowed an earlier start to capital. Year-to-date 2010 operating expenses were $4.8 million higher than the same period last year. The increase was mainly a result of (i) costs associated with Hurricane Igor; (ii) wage increases; (iii) higher retirement and severance expenses; and (iv) increased conservation costs. Pension and Early Retirement Program Costs: Pension and Early Retirement Program Costs for the third quarter of 2010 were $1.2 million higher compared to the third quarter of 2009. Year-to-date 2010 Pension and Early Retirement Program Costs were $3.7 million higher than the same period last year. The increase primarily related to the amortization of 2008 experience losses associated with the pension plan assets and a lower discount rate at December 31, 2009, which is used to determine the Company’s accrued benefit pension obligation associated with its defined benefit pension plan. Amortization: Amortization expense for the third quarter of 2010 was $0.4 million higher compared to the third quarter of 2009. Year-to-date 2010, amortization expense was $1.3 million higher compared to the same period last year. The increase primarily reflects the Company’s 2010 capital expenditure program. Amortization True-Up Deferral: Amortization of property, plant and equipment is subject to periodic review by external experts via an amortization study. Based on a 2002 amortization study, the PUB ordered the deferred recovery of approximately $11.6 million, $5.8 million in each of 2006 and 2007, related to a variance in accumulated amortization. These deferrals were recorded as an increase in regulatory assets and a decrease in expenses in each year to be amortized evenly through 2008-2010. Amortization of $1.0 million was recorded in the third quarter of 2010, $2.9 million year-to-date, comparable to the same periods last year. Finance Charges: Finance charges for the third quarter of 2010 were $0.1 million lower than the third quarter of 2009. Year-to-date 2010, finance costs were $1.1 million higher compared to the same period last year. Higher interest costs associated with the bond issue in May 2009 were primarily the reason for the year-to-date increase. These costs were partially offset by reduced borrowings under the Company’s credit facility. Income Taxes: Income taxes for the third quarter of 2010 were $0.3 million higher than the third quarter of 2009. The quarterly increase in income tax expense primarily reflects higher pre-tax earnings. Year-to-date 2010, income taxes were $0.4 million higher compared to the same period last year. The increase in income tax expense reflects higher pre-tax earnings partially offset by a lower effective income tax rate. The lower effective tax rate related primarily to a reduction in the statutory tax rate.
4 Interim Management Discussion and Analysis |
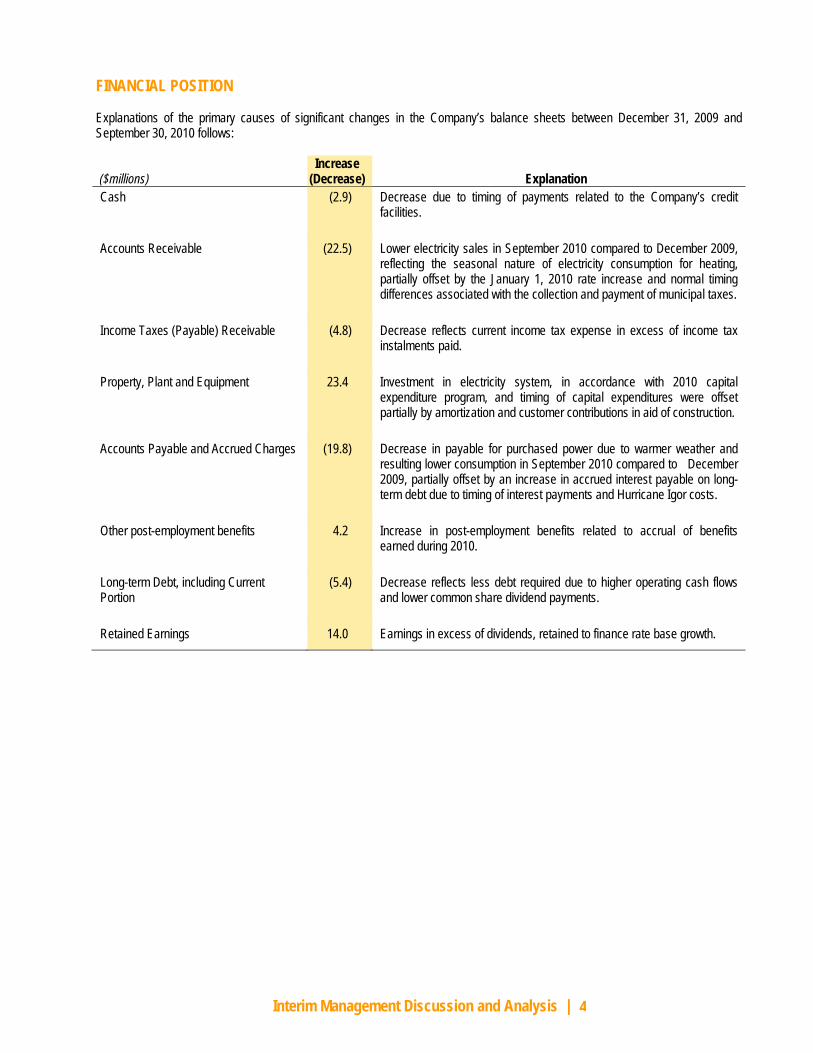
FINANCIAL POSITION Explanations of the primary causes of significant changes in the Company’s balance sheets between December 31, 2009 and September 30, 2010 follows: ($millions)
Increase (Decrease)
Explanation
Cash (2.9) Decrease due to timing of payments related to the Company’s credit facilities.
Accounts Receivable (22.5) Lower electricity sales in September 2010 compared to December 2009, reflecting the seasonal nature of electricity consumption for heating, partially offset by the January 1, 2010 rate increase and normal timing differences associated with the collection and payment of municipal taxes.
Income Taxes (Payable) Receivable (4.8) Decrease reflects current income tax expense in excess of income tax instalments paid.
Property, Plant and Equipment 23.4 Investment in electricity system, in accordance with 2010 capital expenditure program, and timing of capital expenditures were offset partially by amortization and customer contributions in aid of construction.
Accounts Payable and Accrued Charges (19.8)
Decrease in payable for purchased power due to warmer weather and resulting lower consumption in September 2010 compared to December 2009, partially offset by an increase in accrued interest payable on long-term debt due to timing of interest payments and Hurricane Igor costs.
Other post-employment benefits 4.2 Increase in post-employment benefits related to accrual of benefits earned during 2010.
Long-term Debt, including Current Portion
(5.4) Decrease reflects less debt required due to higher operating cash flows and lower common share dividend payments.
Retained Earnings 14.0 Earnings in excess of dividends, retained to finance rate base growth.
5 Interim Management Discussion and Analysis |
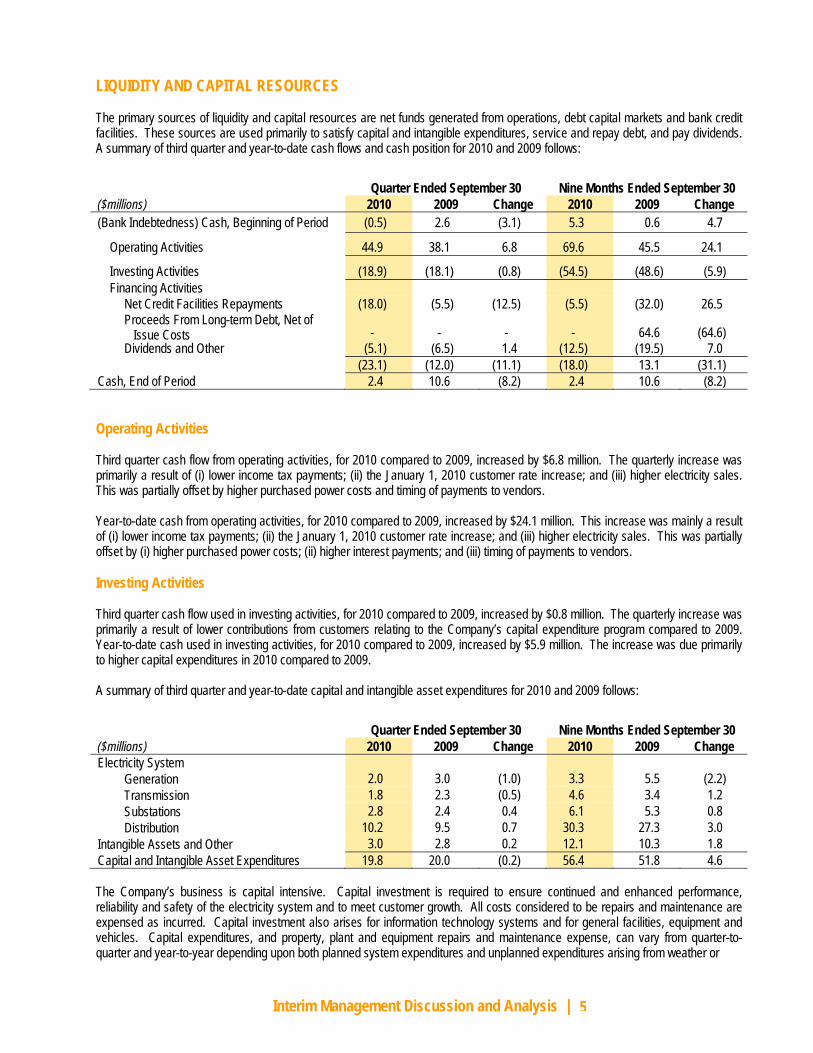
LIQUIDITY AND CAPITAL RESOURCES The primary sources of liquidity and capital resources are net funds generated from operations, debt capital markets and bank credit facilities. These sources are used primarily to satisfy capital and intangible expenditures, service and repay debt, and pay dividends. A summary of third quarter and year-to-date cash flows and cash position for 2010 and 2009 follows: Quarter Ended September 30 Nine Months Ended September 30 ($millions) 2010 2009 Change 2010 2009 Change (Bank Indebtedness) Cash, Beginning of Period (0.5) 2.6 (3.1) 5.3 0.6 4.7 Operating Activities 44.9 38.1 6.8 69.6 45.5 24.1 Investing Activities (18.9) (18.1) (0.8) (54.5) (48.6) (5.9) Financing Activities Net Credit Facilities Repayments (18.0) (5.5) (12.5) (5.5) (32.0) 26.5 Proceeds From Long-term Debt, Net of Issue Costs - - - - 64.6 (64.6) Dividends and Other (5.1) (6.5) 1.4 (12.5) (19.5) 7.0 (23.1) (12.0) (11.1) (18.0) 13.1 (31.1) Cash, End of Period 2.4 10.6 (8.2) 2.4 10.6 (8.2) Operating Activities Third quarter cash flow from operating activities, for 2010 compared to 2009, increased by $6.8 million. The quarterly increase was primarily a result of (i) lower income tax payments; (ii) the January 1, 2010 customer rate increase; and (iii) higher electricity sales. This was partially offset by higher purchased power costs and timing of payments to vendors. Year-to-date cash from operating activities, for 2010 compared to 2009, increased by $24.1 million. This increase was mainly a result of (i) lower income tax payments; (ii) the January 1, 2010 customer rate increase; and (iii) higher electricity sales. This was partially offset by (i) higher purchased power costs; (ii) higher interest payments; and (iii) timing of payments to vendors. Investing Activities Third quarter cash flow used in investing activities, for 2010 compared to 2009, increased by $0.8 million. The quarterly increase was primarily a result of lower contributions from customers relating to the Company’s capital expenditure program compared to 2009. Year-to-date cash used in investing activities, for 2010 compared to 2009, increased by $5.9 million. The increase was due primarily to higher capital expenditures in 2010 compared to 2009. A summary of third quarter and year-to-date capital and intangible asset expenditures for 2010 and 2009 follows: Quarter Ended September 30 Nine Months Ended September 30 ($millions) 2010 2009 Change 2010 2009 Change Electricity System Generation 2.0 3.0 (1.0) 3.3 5.5 (2.2) Transmission 1.8 2.3 (0.5) 4.6 3.4 1.2 Substations 2.8 2.4 0.4 6.1 5.3 0.8 Distribution 10.2 9.5 0.7 30.3 27.3 3.0 Intangible Assets and Other 3.0 2.8 0.2 12.1 10.3 1.8 Capital and Intangible Asset Expenditures 19.8 20.0 (0.2) 56.4 51.8 4.6 The Company’s business is capital intensive. Capital investment is required to ensure continued and enhanced performance, reliability and safety of the electricity system and to meet customer growth. All costs considered to be repairs and maintenance are expensed as incurred. Capital investment also arises for information technology systems and for general facilities, equipment and vehicles. Capital expenditures, and property, plant and equipment repairs and maintenance expense, can vary from quarter-to-quarter and year-to-year depending upon both planned system expenditures and unplanned expenditures arising from weather or
6 Interim Management Discussion and Analysis |
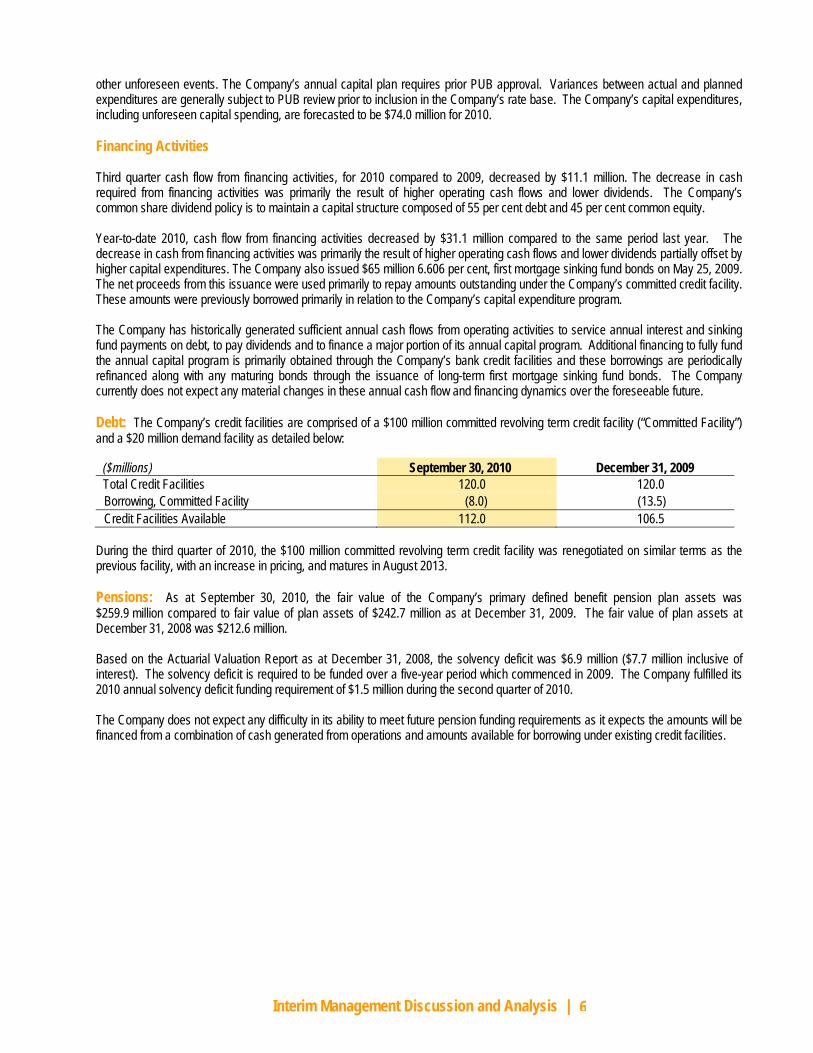
other unforeseen events. The Company’s annual capital plan requires prior PUB approval. Variances between actual and planned expenditures are generally subject to PUB review prior to inclusion in the Company’s rate base. The Company’s capital expenditures, including unforeseen capital spending, are forecasted to be $74.0 million for 2010. Financing Activities Third quarter cash flow from financing activities, for 2010 compared to 2009, decreased by $11.1 million. The decrease in cash required from financing activities was primarily the result of higher operating cash flows and lower dividends. The Company’s common share dividend policy is to maintain a capital structure composed of 55 per cent debt and 45 per cent common equity. Year-to-date 2010, cash flow from financing activities decreased by $31.1 million compared to the same period last year. The decrease in cash from financing activities was primarily the result of higher operating cash flows and lower dividends partially offset by higher capital expenditures. The Company also issued $65 million 6.606 per cent, first mortgage sinking fund bonds on May 25, 2009. The net proceeds from this issuance were used primarily to repay amounts outstanding under the Company’s committed credit facility. These amounts were previously borrowed primarily in relation to the Company’s capital expenditure program. The Company has historically generated sufficient annual cash flows from operating activities to service annual interest and sinking fund payments on debt, to pay dividends and to finance a major portion of its annual capital program. Additional financing to fully fund the annual capital program is primarily obtained through the Company’s bank credit facilities and these borrowings are periodically refinanced along with any maturing bonds through the issuance of long-term first mortgage sinking fund bonds. The Company currently does not expect any material changes in these annual cash flow and financing dynamics over the foreseeable future. Debt: The Company’s credit facilities are comprised of a $100 million committed revolving term credit facility (“Committed Facility”) and a $20 million demand facility as detailed below:
($millions) September 30, 2010 December 31, 2009 Total Credit Facilities 120.0 120.0 Borrowing, Committed Facility (8.0) (13.5) Credit Facilities Available 112.0 106.5
During the third quarter of 2010, the $100 million committed revolving term credit facility was renegotiated on similar terms as the previous facility, with an increase in pricing, and matures in August 2013. Pensions: As at September 30, 2010, the fair value of the Company’s primary defined benefit pension plan assets was $259.9 million compared to fair value of plan assets of $242.7 million as at December 31, 2009. The fair value of plan assets at December 31, 2008 was $212.6 million. Based on the Actuarial Valuation Report as at December 31, 2008, the solvency deficit was $6.9 million ($7.7 million inclusive of interest). The solvency deficit is required to be funded over a five-year period which commenced in 2009. The Company fulfilled its 2010 annual solvency deficit funding requirement of $1.5 million during the second quarter of 2010. The Company does not expect any difficulty in its ability to meet future pension funding requirements as it expects the amounts will be financed from a combination of cash generated from operations and amounts available for borrowing under existing credit facilities.
7 Interim Management Discussion and Analysis |
Contractual Obligations: Details, as at September 30, 2010, of all contractual obligations over the subsequent five years and thereafter, follow:
($millions) Total Due Within
1 Year Due in
Years 2 & 3 Due in
Years 4 & 5 Due After 5 Years
Credit Facilities (unsecured) 8.0 - 8.0 - - First Mortgage Sinking Fund Bonds 1 468.9 5.2 10.4 39.0 414.3 Pension Solvency Deficit 2 4.7 1.2 3.1 0.4 - Total 481.6 6.4 21.5 39.4 414.3
1 First mortgage sinking fund bonds are secured by a first fixed and specific charge on property, plant and equipment owned or to be acquired by the
Company and carry customary covenants. 2 Pension funding requirements based on the Actuarial Valuation Report associated with the Company’s Defined Benefit Pension Plan, completed as at
December 31, 2008. This does not include routine funding requirements for current service cost.
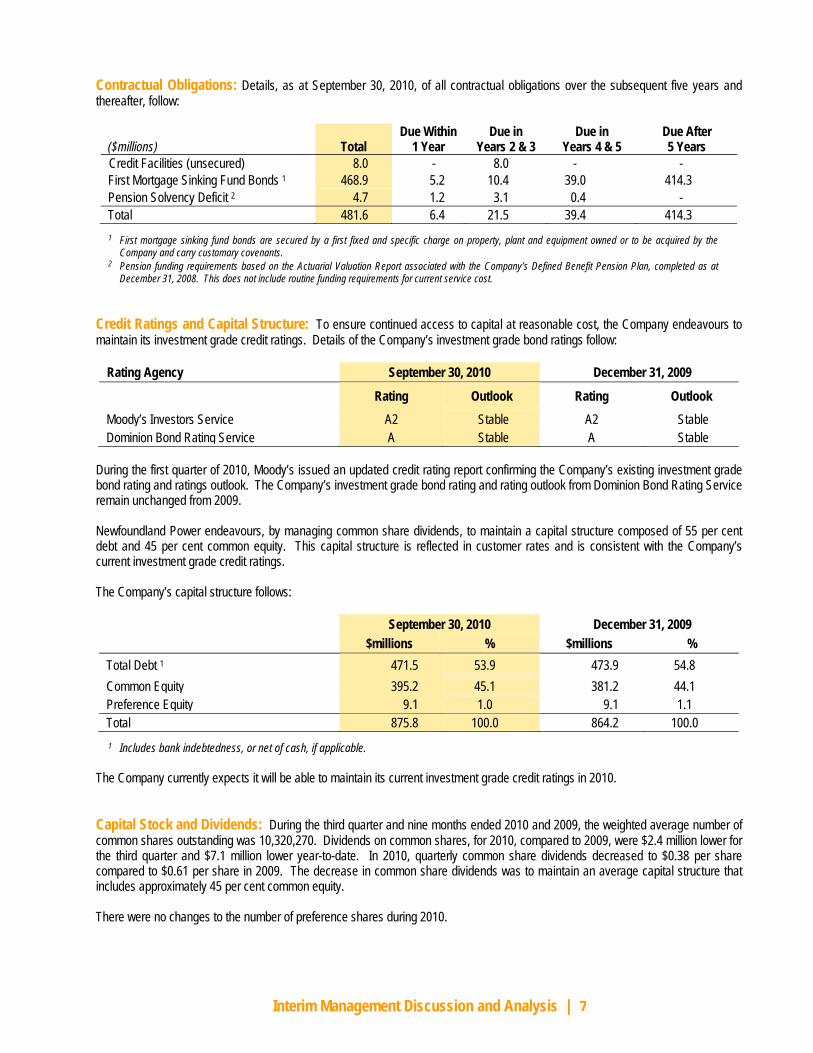
Credit Ratings and Capital Structure: To ensure continued access to capital at reasonable cost, the Company endeavours to maintain its investment grade credit ratings. Details of the Company’s investment grade bond ratings follow:
Rating Agency September 30, 2010 December 31, 2009
Rating Outlook Rating Outlook Moody’s Investors Service A2 Stable A2 Stable Dominion Bond Rating Service A Stable A Stable
During the first quarter of 2010, Moody’s issued an updated credit rating report confirming the Company’s existing investment grade bond rating and ratings outlook. The Company’s investment grade bond rating and rating outlook from Dominion Bond Rating Service remain unchanged from 2009. Newfoundland Power endeavours, by managing common share dividends, to maintain a capital structure composed of 55 per cent debt and 45 per cent common equity. This capital structure is reflected in customer rates and is consistent with the Company’s current investment grade credit ratings. The Company’s capital structure follows:
September 30, 2010 December 31, 2009 $millions % $millions % Total Debt 1 471.5 53.9 473.9 54.8 Common Equity 395.2 45.1 381.2 44.1 Preference Equity 9.1 1.0 9.1 1.1 Total 875.8 100.0 864.2 100.0
1 Includes bank indebtedness, or net of cash, if applicable.
The Company currently expects it will be able to maintain its current investment grade credit ratings in 2010. Capital Stock and Dividends: During the third quarter and nine months ended 2010 and 2009, the weighted average number of common shares outstanding was 10,320,270. Dividends on common shares, for 2010, compared to 2009, were $2.4 million lower for the third quarter and $7.1 million lower year-to-date. In 2010, quarterly common share dividends decreased to $0.38 per share compared to $0.61 per share in 2009. The decrease in common share dividends was to maintain an average capital structure that includes approximately 45 per cent common equity. There were no changes to the number of preference shares during 2010.
8 Interim Management Discussion and Analysis |
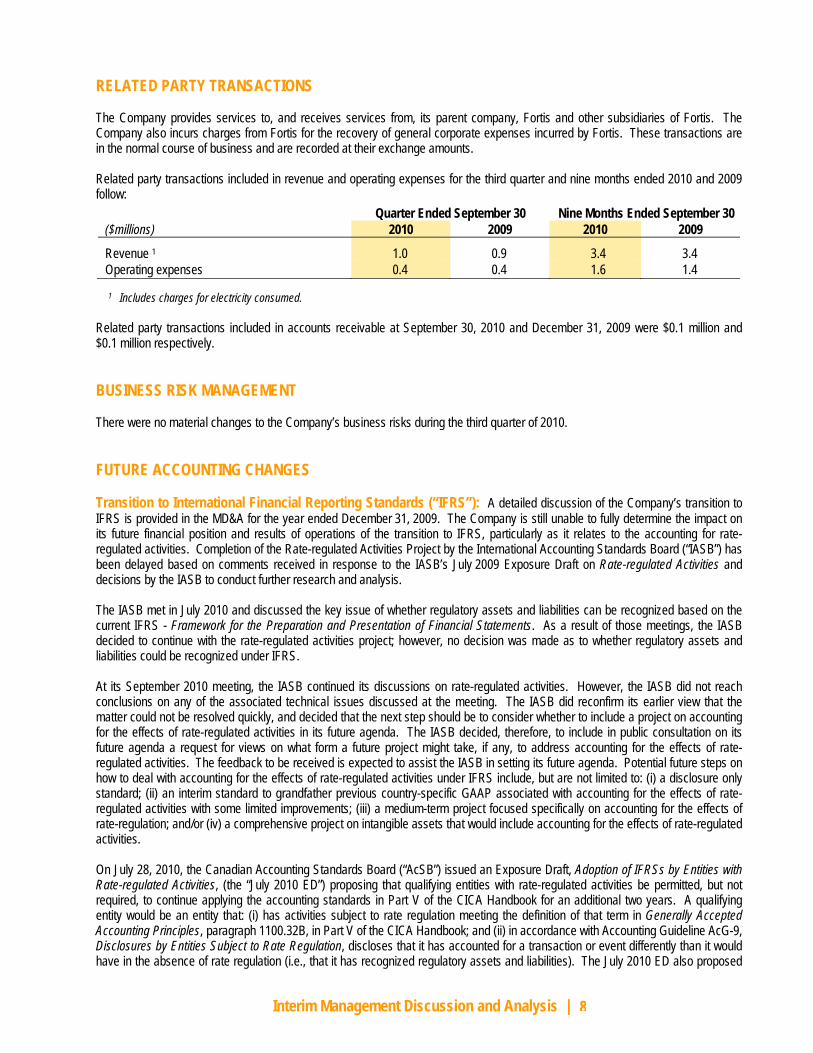
RELATED PARTY TRANSACTIONS The Company provides services to, and receives services from, its parent company, Fortis and other subsidiaries of Fortis. The Company also incurs charges from Fortis for the recovery of general corporate expenses incurred by Fortis. These transactions are in the normal course of business and are recorded at their exchange amounts. Related party transactions included in revenue and operating expenses for the third quarter and nine months ended 2010 and 2009 follow:
Quarter Ended September 30 Nine Months Ended September 30 ($millions) 2010 2009 2010 2009
Revenue 1 1.0 0.9 3.4 3.4 Operating expenses 0.4 0.4 1.6 1.4
1 Includes charges for electricity consumed.
Related party transactions included in accounts receivable at September 30, 2010 and December 31, 2009 were $0.1 million and $0.1 million respectively. BUSINESS RISK MANAGEMENT There were no material changes to the Company’s business risks during the third quarter of 2010. FUTURE ACCOUNTING CHANGES Transition to International Financial Reporting Standards (“IFRS”): A detailed discussion of the Company’s transition to IFRS is provided in the MD&A for the year ended December 31, 2009. The Company is still unable to fully determine the impact on its future financial position and results of operations of the transition to IFRS, particularly as it relates to the accounting for rate-regulated activities. Completion of the Rate-regulated Activities Project by the International Accounting Standards Board (“IASB”) has been delayed based on comments received in response to the IASB’s July 2009 Exposure Draft on Rate-regulated Activities and decisions by the IASB to conduct further research and analysis. The IASB met in July 2010 and discussed the key issue of whether regulatory assets and liabilities can be recognized based on the current IFRS - Framework for the Preparation and Presentation of Financial Statements. As a result of those meetings, the IASB decided to continue with the rate-regulated activities project; however, no decision was made as to whether regulatory assets and liabilities could be recognized under IFRS. At its September 2010 meeting, the IASB continued its discussions on rate-regulated activities. However, the IASB did not reach conclusions on any of the associated technical issues discussed at the meeting. The IASB did reconfirm its earlier view that the matter could not be resolved quickly, and decided that the next step should be to consider whether to include a project on accounting for the effects of rate-regulated activities in its future agenda. The IASB decided, therefore, to include in public consultation on its future agenda a request for views on what form a future project might take, if any, to address accounting for the effects of rate-regulated activities. The feedback to be received is expected to assist the IASB in setting its future agenda. Potential future steps on how to deal with accounting for the effects of rate-regulated activities under IFRS include, but are not limited to: (i) a disclosure only standard; (ii) an interim standard to grandfather previous country-specific GAAP associated with accounting for the effects of rate-regulated activities with some limited improvements; (iii) a medium-term project focused specifically on accounting for the effects of rate-regulation; and/or (iv) a comprehensive project on intangible assets that would include accounting for the effects of rate-regulated activities. On July 28, 2010, the Canadian Accounting Standards Board (“AcSB”) issued an Exposure Draft, Adoption of IFRSs by Entities with Rate-regulated Activities, (the “July 2010 ED”) proposing that qualifying entities with rate-regulated activities be permitted, but not required, to continue applying the accounting standards in Part V of the CICA Handbook for an additional two years. A qualifying entity would be an entity that: (i) has activities subject to rate regulation meeting the definition of that term in Generally Accepted Accounting Principles, paragraph 1100.32B, in Part V of the CICA Handbook; and (ii) in accordance with Accounting Guideline AcG-9, Disclosures by Entities Subject to Rate Regulation, discloses that it has accounted for a transaction or event differently than it would have in the absence of rate regulation (i.e., that it has recognized regulatory assets and liabilities). The July 2010 ED also proposed
9 Interim Management Discussion and Analysis |
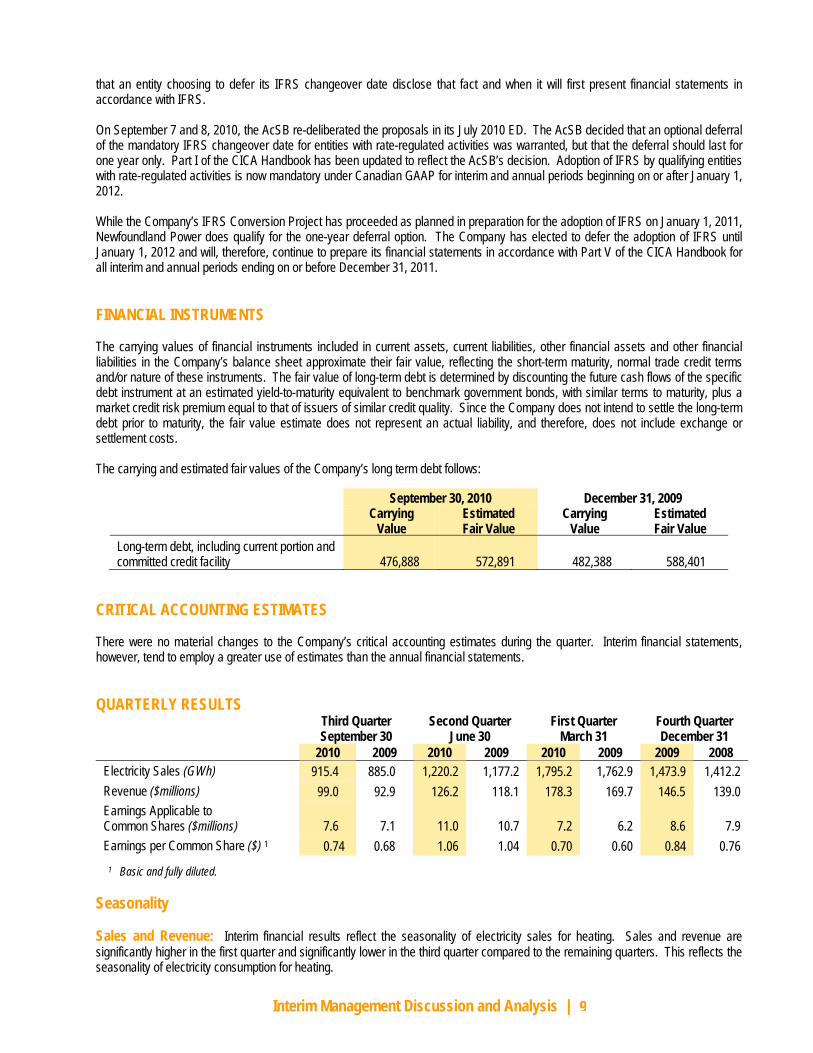
that an entity choosing to defer its IFRS changeover date disclose that fact and when it will first present financial statements in accordance with IFRS. On September 7 and 8, 2010, the AcSB re-deliberated the proposals in its July 2010 ED. The AcSB decided that an optional deferral of the mandatory IFRS changeover date for entities with rate-regulated activities was warranted, but that the deferral should last for one year only. Part I of the CICA Handbook has been updated to reflect the AcSB’s decision. Adoption of IFRS by qualifying entities with rate-regulated activities is now mandatory under Canadian GAAP for interim and annual periods beginning on or after January 1, 2012. While the Company’s IFRS Conversion Project has proceeded as planned in preparation for the adoption of IFRS on January 1, 2011, Newfoundland Power does qualify for the one-year deferral option. The Company has elected to defer the adoption of IFRS until January 1, 2012 and will, therefore, continue to prepare its financial statements in accordance with Part V of the CICA Handbook for all interim and annual periods ending on or before December 31, 2011. FINANCIAL INSTRUMENTS The carrying values of financial instruments included in current assets, current liabilities, other financial assets and other financial liabilities in the Company’s balance sheet approximate their fair value, reflecting the short-term maturity, normal trade credit terms and/or nature of these instruments. The fair value of long-term debt is determined by discounting the future cash flows of the specific debt instrument at an estimated yield-to-maturity equivalent to benchmark government bonds, with similar terms to maturity, plus a market credit risk premium equal to that of issuers of similar credit quality. Since the Company does not intend to settle the long-term debt prior to maturity, the fair value estimate does not represent an actual liability, and therefore, does not include exchange or settlement costs. The carrying and estimated fair values of the Company’s long term debt follows:
September 30, 2010 December 31, 2009
Carrying
Value Estimated Fair Value
Carrying Value
Estimated Fair Value
Long-term debt, including current portion and committed credit facility 476,888 572,891 482,388 588,401
CRITICAL ACCOUNTING ESTIMATES There were no material changes to the Company’s critical accounting estimates during the quarter. Interim financial statements, however, tend to employ a greater use of estimates than the annual financial statements. QUARTERLY RESULTS
Third Quarter September 30
Second Quarter June 30
First Quarter March 31
Fourth Quarter December 31
2010 2009 2010 2009 2010 2009 2009 2008 Electricity Sales (GWh) 915.4 885.0 1,220.2 1,177.2 1,795.2 1,762.9 1,473.9 1,412.2 Revenue ($millions) 99.0 92.9 126.2 118.1 178.3 169.7 146.5 139.0 Earnings Applicable to Common Shares ($millions) 7.6 7.1 11.0 10.7 7.2 6.2 8.6 7.9 Earnings per Common Share ($) 1 0.74 0.68 1.06 1.04 0.70 0.60 0.84 0.76
1 Basic and fully diluted.
Seasonality Sales and Revenue: Interim financial results reflect the seasonality of electricity sales for heating. Sales and revenue are significantly higher in the first quarter and significantly lower in the third quarter compared to the remaining quarters. This reflects the seasonality of electricity consumption for heating.
10 Interim Management Discussion and Analysis |
Earnings: Beyond the seasonality of electricity consumption for heating, quarterly earnings are impacted by the purchased power rate structure. The Company pays more, on average, for each kilowatt hour (“kWh”) of purchased power in the winter months and less, on average, for each kWh of purchased power in the summer months. These sales, revenue and cost dynamics are expected to yield lower earnings in the first quarter compared to remaining quarters within any given year. Trending Sales and Revenue: Year-over-year quarterly electricity sales increases primarily reflect modest customer growth. Earnings: Beyond the impact of expected moderate sales growth, future quarterly earnings and earnings per share are expected to trend with the ROE reflected in customer rates and rate base growth. OUTLOOK Newfoundland Power expects to maintain its investment grade credit ratings in 2010. On August 31, 2010, the Company filed an application with the PUB requesting the deferred recovery of expected increased costs in 2011 of $2.4 million due to expiring regulatory amortizations. The application is currently under review by the PUB. The Company is currently assessing the necessary regulatory action to respond to the additional costs resulting from Hurricane Igor. The Company’s strategy will remain unchanged. Customer Rates: Effective July 1, 2010, there was an overall average increase in electricity rates charged to customers of approximately 1.7 per cent. The increase is a result of the normal annual operation of Hydro’s Rate Stabilization Plan. Variances in the cost of fuel used to generate electricity Hydro sells to Newfoundland Power are captured and flowed-through to the Company’s customers through the operation of the Rate Stabilization Plan. In 2009, the price of oil required for electricity generation by Hydro was higher than forecasted resulting in the increase. The increase in customer rates will have no impact on earnings for Newfoundland Power. Capital Plan: On July 15, 2010, the Company filed an application with the PUB requesting approval for its 2011 capital expenditure plan totalling $73.0 million. The application is currently under review by the PUB. Joint Use Agreement: On June 25, 2010, the Company received notice from Bell Aliant of its intention not to renew the Joint Use Facilities Partnership Agreement (“JUFPA”) with Newfoundland Power which expires December 31, 2010. In 2001, the Company entered into the JUFPA with Bell Aliant (previously Aliant Telecom Inc.) where Newfoundland Power acquired approximately 70,000 joint use distribution poles from Bell Aliant for a book based value of approximately $40 million. Bell Aliant owned approximately 40% of all joint use poles in Newfoundland Power’s service territory at that time. Bell Aliant has rented space on these poles from Newfoundland Power since 2001. Under the current arrangement, following the initial 10-year term, Bell Aliant had the right to repurchase 40% of all joint use poles from Newfoundland Power for a book based value. The disposition of joint use poles to Bell Aliant will require PUB approval. Upon purchase, Bell Aliant will also have the obligation to install and maintain 40% of the joint use poles on an ongoing basis. The Company is currently working with Bell Aliant regarding the future operational and financial aspects of this transaction. The Company will be able to assess the impact on its results of operations, cash flows and financial position once the final terms and conditions have been negotiated. Other Post Employment Benefits: During the second quarter of 2010, the Company completed a review of its other post employment benefits (“OPEBs”) provided to employees upon retirement. This review resulted in changes to the OPEBs plan relating to medical benefits and life insurance coverage, which will be effective January 1, 2011. Changes to the plan are expected to reduce the Company’s OPEBs obligation and annual OPEBs costs. On June 30, 2010, the Company submitted a proposal to the PUB relating to the accounting for, and recovery of, OPEBs costs. The Company recommended that it (i) adopt the accrual method of accounting for OPEBs costs effective January 1, 2011; (ii) recover the transitional balance or regulatory asset, associated with adoption of accrual accounting over a 15-year period; and (iii) adopt a deferral account to capture differences in OPEBs costs arising from changes in assumptions associated with the valuation of OPEBs obligations. The proposal is currently under review by the PUB.

11 Interim Management Discussion and Analysis |
CORPORATE INFORMATION All of the common shares of Newfoundland Power are owned by Fortis. Fortis Inc. is the largest investor-owned distribution utility in Canada. With total assets of $12.5 billion and fiscal 2009 revenue totalling $3.6 billion, the Corporation serves approximately 2,100,000 gas and electricity customers. Its regulated holdings include electric distribution utilities in five Canadian provinces and three Caribbean countries and a natural gas utility in British Columbia. Fortis owns and operates non-regulated generation assets across Canada and in Belize and Upper New York State. It also owns and operates hotels and commercial office and retail space primarily in Atlantic Canada. Fortis Inc. shares are listed on the Toronto Stock Exchange and trade under the symbol FTS. Additional information can be accessed at www.fortisinc.com or www.sedar.com. For further information, contact: Jocelyn Perry, Vice President, Finance & CFO Newfoundland Power Inc. P.O. Box 8910, St. John’s, NL A1B 3P6 Tel: (709) 737-2812 Fax: (709) 737-5300 email: [email protected] Share Transfer Agent and Registrar: Computershare Trust Company of Canada 1500 University Street, Suite 700 Montreal, QC H3A 3S8 Tel: (514) 982-7888 Fax: (514) 982-7635 www.computershare.com Website: www.newfoundlandpower.com
12
Interim Financial Statements |
Unaudited Statements of Earnings For the Three and Nine Month Periods Ended September 30 (in thousands of Canadian dollars, except per share amounts)
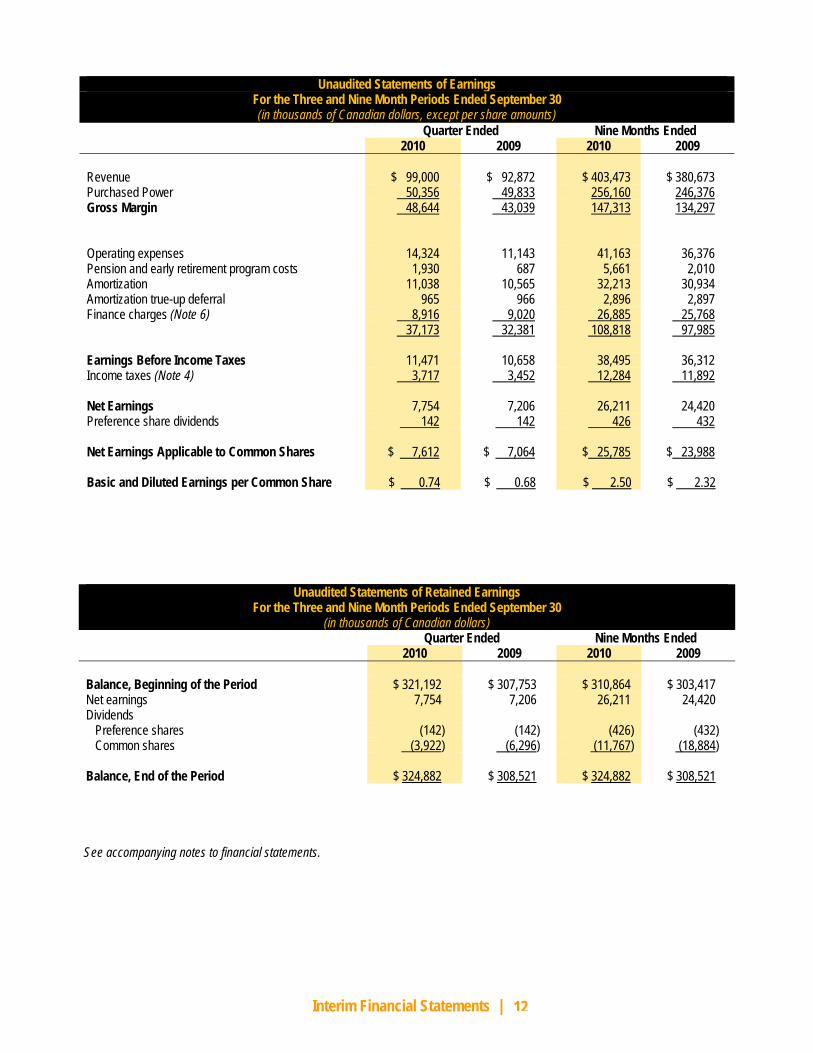
Quarter Ended Nine Months Ended 2010 2009 2010 2009 Revenue $ 99,000 $ 92,872 $ 403,473 $ 380,673 Purchased Power 50,356 49,833 256,160 246,376 Gross Margin 48,644 43,039 147,313 134,297 Operating expenses 14,324 11,143 41,163 36,376 Pension and early retirement program costs 1,930 687 5,661 2,010 Amortization 11,038 10,565 32,213 30,934 Amortization true-up deferral 965 966 2,896 2,897 Finance charges (Note 6) 8,916 9,020 26,885 25,768 37,173 32,381 108,818 97,985 Earnings Before Income Taxes 11,471 10,658 38,495 36,312 Income taxes (Note 4) 3,717 3,452 12,284 11,892 Net Earnings 7,754 7,206 26,211 24,420 Preference share dividends 142 142 426 432 Net Earnings Applicable to Common Shares $ 7,612 $ 7,064 $ 25,785 $ 23,988
Basic and Diluted Earnings per Common Share $ 0.74 $ 0.68
$ 2.50
$ 2.32
Unaudited Statements of Retained Earnings
For the Three and Nine Month Periods Ended September 30 (in thousands of Canadian dollars)
Quarter Ended Nine Months Ended 2010 2009 2010 2009 Balance, Beginning of the Period $ 321,192 $ 307,753 $ 310,864 $ 303,417 Net earnings 7,754 7,206 26,211 24,420 Dividends Preference shares (142) (142) (426) (432) Common shares (3,922) (6,296) (11,767) (18,884) Balance, End of the Period $ 324,882 $ 308,521 $ 324,882 $ 308,521
See accompanying notes to financial statements.
13
Interim Financial Statements |
Unaudited Balance Sheets As at
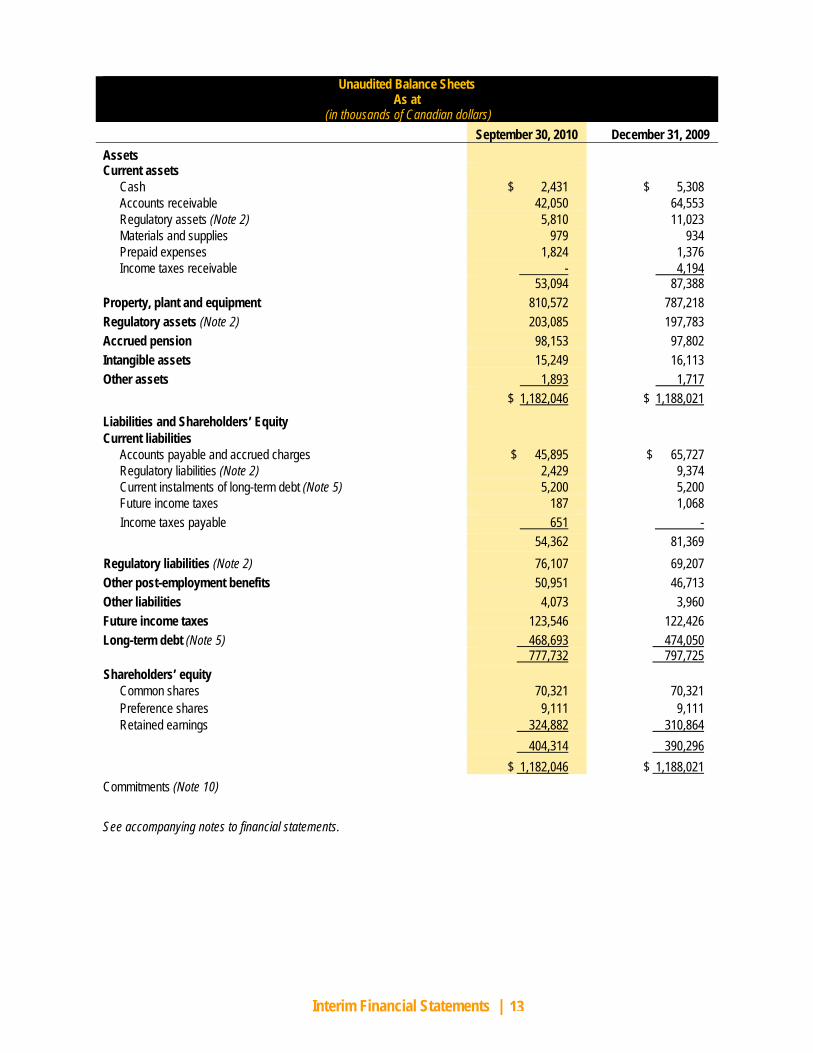
(in thousands of Canadian dollars) September 30, 2010 December 31, 2009 Assets Current assets
Cash $ 2,431 $ 5,308 Accounts receivable 42,050 64,553 Regulatory assets (Note 2) 5,810 11,023 Materials and supplies 979 934 Prepaid expenses 1,824 1,376 Income taxes receivable - 4,194
53,094 87,388 Property, plant and equipment 810,572 787,218 Regulatory assets (Note 2) 203,085 197,783 Accrued pension 98,153 97,802 Intangible assets 15,249 16,113 Other assets 1,893 1,717 $ 1,182,046 $ 1,188,021
Liabilities and Shareholders’ Equity Current liabilities
Accounts payable and accrued charges $ 45,895 $ 65,727 Regulatory liabilities (Note 2) 2,429 9,374 Current instalments of long-term debt (Note 5) 5,200 5,200 Future income taxes 187 1,068 Income taxes payable 651 -
54,362 81,369 Regulatory liabilities (Note 2) 76,107 69,207 Other post-employment benefits 50,951 46,713 Other liabilities 4,073 3,960 Future income taxes 123,546 122,426 Long-term debt (Note 5) 468,693 474,050 777,732 797,725 Shareholders’ equity
Common shares 70,321 70,321 Preference shares 9,111 9,111 Retained earnings 324,882 310,864
404,314 390,296 $ 1,182,046 $ 1,188,021 Commitments (Note 10) See accompanying notes to financial statements.
14
Interim Financial Statements |
See accompanying notes to financial statements.
Unaudited Statements of Cash Flows For the Three and Nine Month Periods Ended September 30
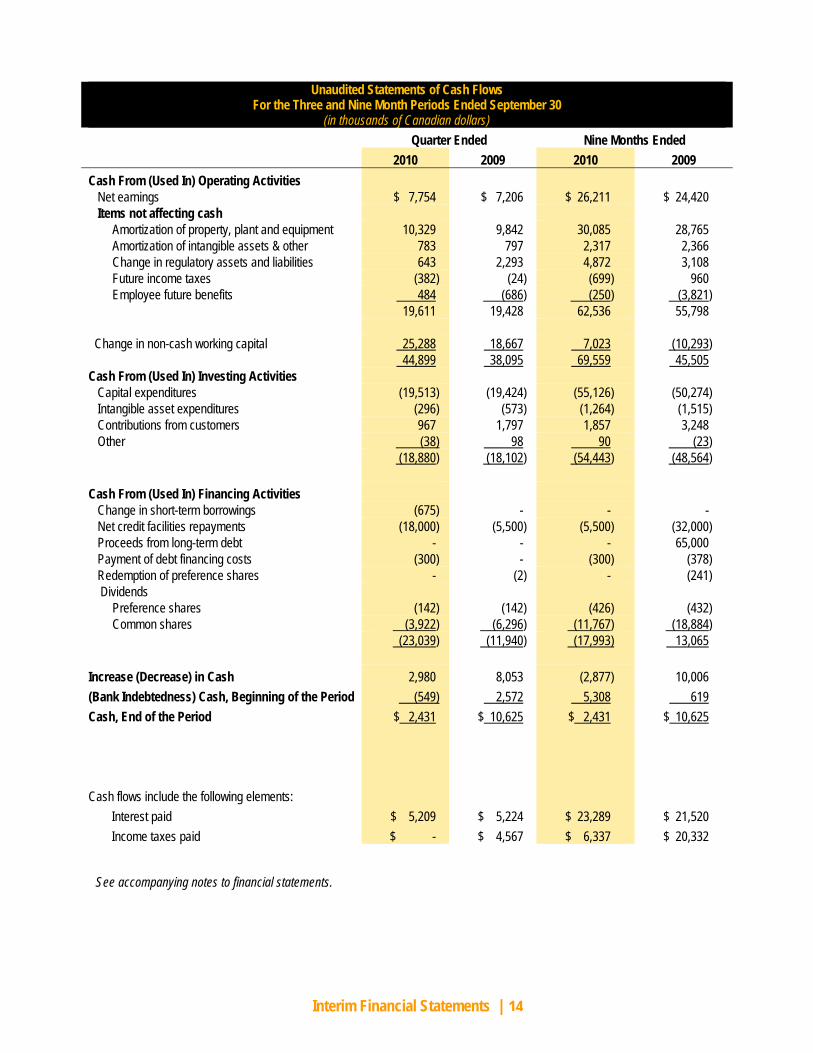
(in thousands of Canadian dollars) Quarter Ended Nine Months Ended 2010 2009 2010 2009 Cash From (Used In) Operating Activities Net earnings $ 7,754 $ 7,206 $ 26,211 $ 24,420 Items not affecting cash
Amortization of property, plant and equipment 10,329 9,842 30,085 28,765 Amortization of intangible assets & other 783 797 2,317 2,366 Change in regulatory assets and liabilities 643 2,293 4,872 3,108 Future income taxes (382) (24) (699) 960 Employee future benefits 484 (686) (250) (3,821)
19,611 19,428 62,536 55,798 Change in non-cash working capital 25,288 18,667 7,023 (10,293) 44,899 38,095 69,559 45,505 Cash From (Used In) Investing Activities Capital expenditures (19,513) (19,424) (55,126) (50,274) Intangible asset expenditures (296) (573) (1,264) (1,515) Contributions from customers 967 1,797 1,857 3,248 Other (38) 98 90 (23) (18,880) (18,102) (54,443) (48,564) Cash From (Used In) Financing Activities Change in short-term borrowings (675) - - - Net credit facilities repayments (18,000) (5,500) (5,500) (32,000) Proceeds from long-term debt - - - 65,000 Payment of debt financing costs (300) - (300) (378) Redemption of preference shares - (2) - (241)
Dividends Preference shares (142) (142) (426) (432) Common shares (3,922) (6,296) (11,767) (18,884)
(23,039) (11,940) (17,993) 13,065 Increase (Decrease) in Cash 2,980 8,053 (2,877) 10,006 (Bank Indebtedness) Cash, Beginning of the Period (549) 2,572 5,308 619 Cash, End of the Period $ 2,431 $ 10,625 $ 2,431 $ 10,625 Cash flows include the following elements: Interest paid $ 5,209 $ 5,224 $ 23,289 $ 21,520 Income taxes paid $ - $ 4,567 $ 6,337 $ 20,332
15
Notes to Interim Financial Statements |
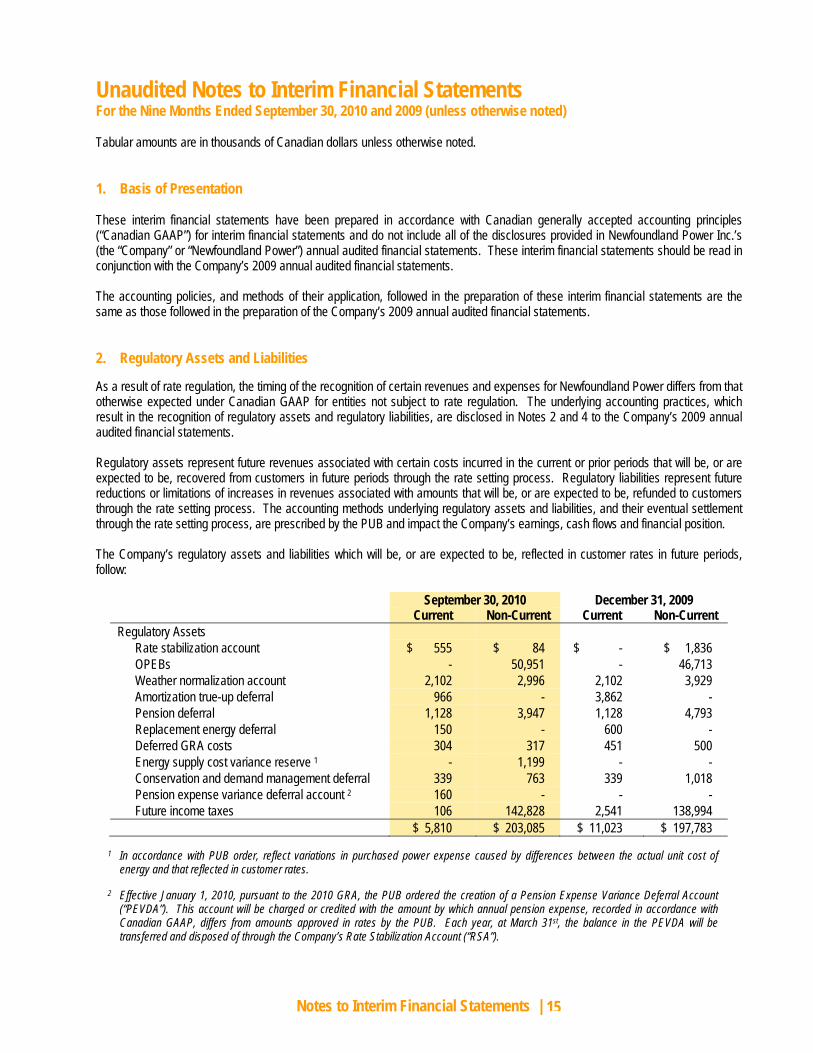
Unaudited Notes to Interim Financial Statements For the Nine Months Ended September 30, 2010 and 2009 (unless otherwise noted) Tabular amounts are in thousands of Canadian dollars unless otherwise noted. 1. Basis of Presentation These interim financial statements have been prepared in accordance with Canadian generally accepted accounting principles (“Canadian GAAP”) for interim financial statements and do not include all of the disclosures provided in Newfoundland Power Inc.’s (the “Company” or “Newfoundland Power”) annual audited financial statements. These interim financial statements should be read in conjunction with the Company’s 2009 annual audited financial statements. The accounting policies, and methods of their application, followed in the preparation of these interim financial statements are the same as those followed in the preparation of the Company’s 2009 annual audited financial statements. 2. Regulatory Assets and Liabilities As a result of rate regulation, the timing of the recognition of certain revenues and expenses for Newfoundland Power differs from that otherwise expected under Canadian GAAP for entities not subject to rate regulation. The underlying accounting practices, which result in the recognition of regulatory assets and regulatory liabilities, are disclosed in Notes 2 and 4 to the Company’s 2009 annual audited financial statements. Regulatory assets represent future revenues associated with certain costs incurred in the current or prior periods that will be, or are expected to be, recovered from customers in future periods through the rate setting process. Regulatory liabilities represent future reductions or limitations of increases in revenues associated with amounts that will be, or are expected to be, refunded to customers through the rate setting process. The accounting methods underlying regulatory assets and liabilities, and their eventual settlement through the rate setting process, are prescribed by the PUB and impact the Company’s earnings, cash flows and financial position. The Company’s regulatory assets and liabilities which will be, or are expected to be, reflected in customer rates in future periods, follow:
September 30, 2010 December 31, 2009 Current Non-Current Current Non-Current Regulatory Assets
Rate stabilization account $ 555 $ 84 $ - $ 1,836 OPEBs - 50,951 - 46,713 Weather normalization account 2,102 2,996 2,102 3,929 Amortization true-up deferral 966 - 3,862 - Pension deferral 1,128 3,947 1,128 4,793 Replacement energy deferral 150 - 600 - Deferred GRA costs 304 317 451 500 Energy supply cost variance reserve 1 - 1,199 - - Conservation and demand management deferral 339 763 339 1,018 Pension expense variance deferral account 2 160 - - - Future income taxes 106 142,828 2,541 138,994
$ 5,810 $ 203,085 $ 11,023 $ 197,783
1 In accordance with PUB order, reflect variations in purchased power expense caused by differences between the actual unit cost of energy and that reflected in customer rates.
2 Effective January 1, 2010, pursuant to the 2010 GRA, the PUB ordered the creation of a Pension Expense Variance Deferral Account
(“PEVDA”). This account will be charged or credited with the amount by which annual pension expense, recorded in accordance with Canadian GAAP, differs from amounts approved in rates by the PUB. Each year, at March 31st, the balance in the PEVDA will be transferred and disposed of through the Company’s Rate Stabilization Account (“RSA”).
16
Notes to Interim Financial Statements |
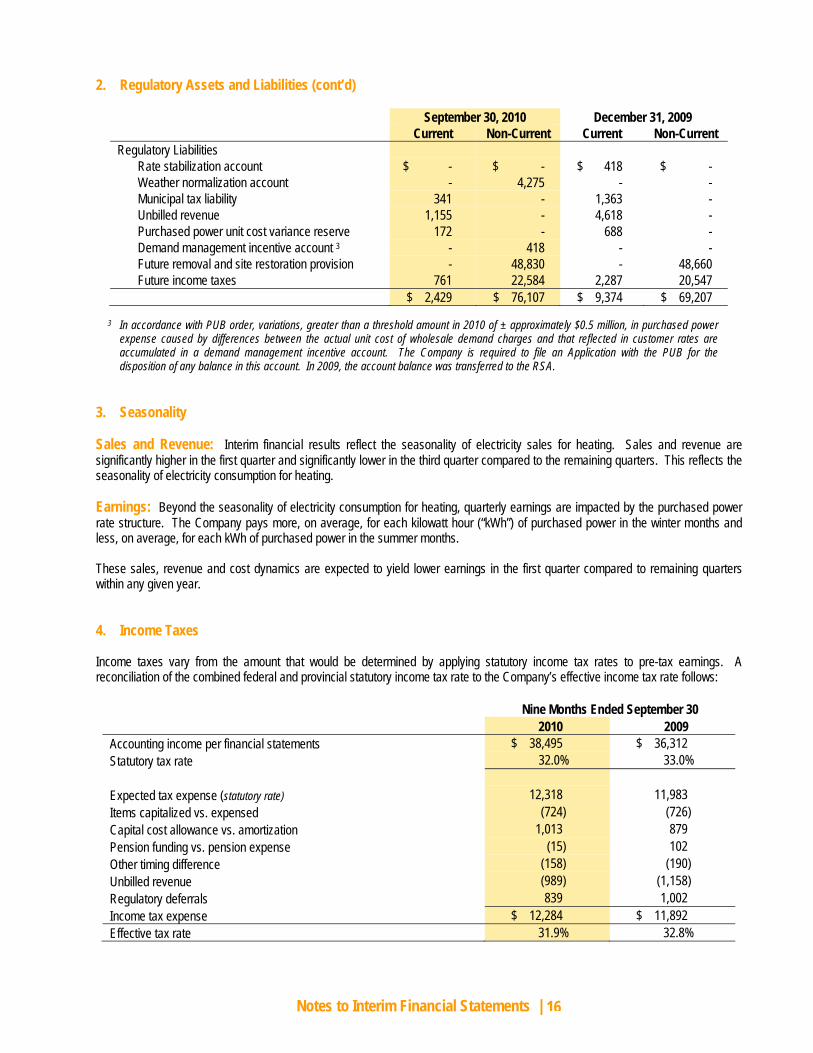
2. Regulatory Assets and Liabilities (cont’d)
September 30, 2010 December 31, 2009 Current Non-Current Current Non-Current Regulatory Liabilities
Rate stabilization account $ - $ - $ 418 $ - Weather normalization account - 4,275 - - Municipal tax liability 341 - 1,363 - Unbilled revenue 1,155 - 4,618 - Purchased power unit cost variance reserve 172 - 688 - Demand management incentive account 3 - 418 - - Future removal and site restoration provision - 48,830 - 48,660 Future income taxes 761 22,584 2,287 20,547
$ 2,429 $ 76,107 $ 9,374 $ 69,207
3 In accordance with PUB order, variations, greater than a threshold amount in 2010 of ± approximately $0.5 million, in purchased power expense caused by differences between the actual unit cost of wholesale demand charges and that reflected in customer rates are accumulated in a demand management incentive account. The Company is required to file an Application with the PUB for the disposition of any balance in this account. In 2009, the account balance was transferred to the RSA.
3. Seasonality Sales and Revenue: Interim financial results reflect the seasonality of electricity sales for heating. Sales and revenue are significantly higher in the first quarter and significantly lower in the third quarter compared to the remaining quarters. This reflects the seasonality of electricity consumption for heating. Earnings: Beyond the seasonality of electricity consumption for heating, quarterly earnings are impacted by the purchased power rate structure. The Company pays more, on average, for each kilowatt hour (“kWh”) of purchased power in the winter months and less, on average, for each kWh of purchased power in the summer months. These sales, revenue and cost dynamics are expected to yield lower earnings in the first quarter compared to remaining quarters within any given year. 4. Income Taxes Income taxes vary from the amount that would be determined by applying statutory income tax rates to pre-tax earnings. A reconciliation of the combined federal and provincial statutory income tax rate to the Company’s effective income tax rate follows:
Nine Months Ended September 30 2010 2009 Accounting income per financial statements $ 38,495 $ 36,312 Statutory tax rate 32.0% 33.0% Expected tax expense (statutory rate) 12,318 11,983 Items capitalized vs. expensed (724) (726) Capital cost allowance vs. amortization 1,013 879 Pension funding vs. pension expense (15) 102 Other timing difference (158) (190) Unbilled revenue (989) (1,158) Regulatory deferrals 839 1,002 Income tax expense $ 12,284 $ 11,892 Effective tax rate 31.9% 32.8%
17
Notes to Interim Financial Statements |
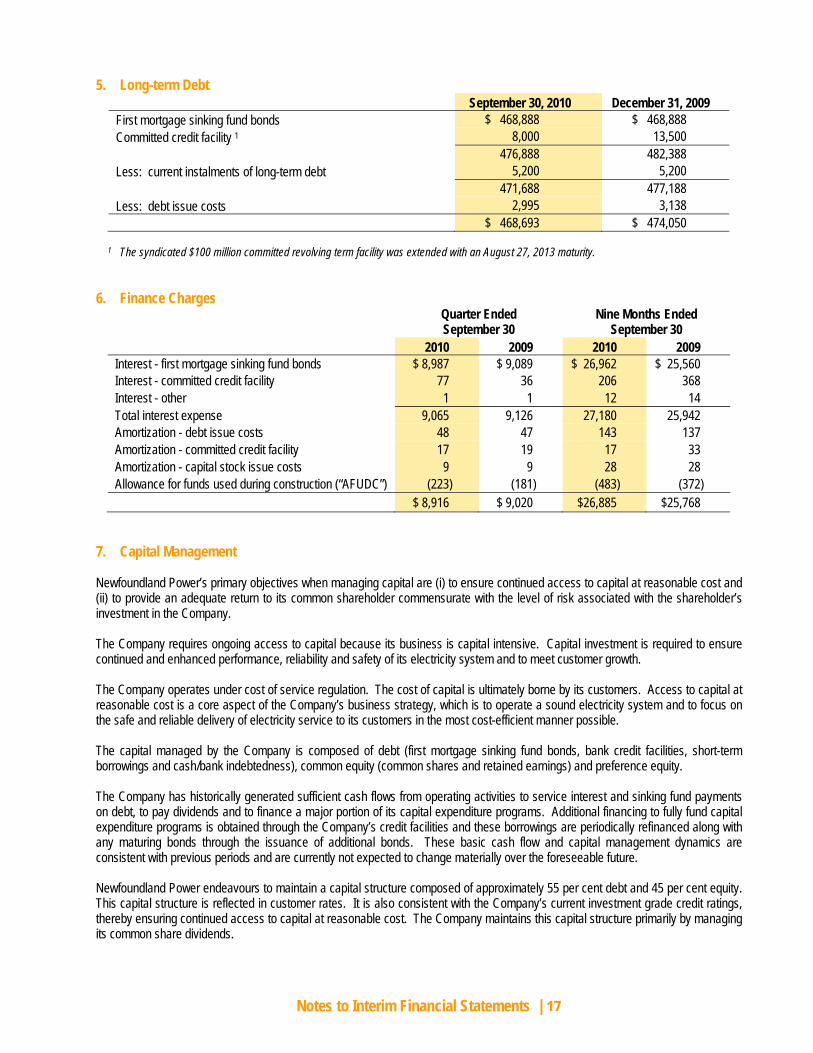
5. Long-term Debt September 30, 2010 December 31, 2009 First mortgage sinking fund bonds $ 468,888 $ 468,888 Committed credit facility 1 8,000 13,500 476,888 482,388 Less: current instalments of long-term debt 5,200 5,200 471,688 477,188 Less: debt issue costs 2,995 3,138 $ 468,693 $ 474,050
1 The syndicated $100 million committed revolving term facility was extended with an August 27, 2013 maturity. 6. Finance Charges
Quarter Ended September 30
Nine Months Ended September 30
2010 2009 2010 2009 Interest - first mortgage sinking fund bonds $ 8,987 $ 9,089 $ 26,962 $ 25,560 Interest - committed credit facility 77 36 206 368 Interest - other 1 1 12 14 Total interest expense 9,065 9,126 27,180 25,942 Amortization - debt issue costs 48 47 143 137 Amortization - committed credit facility 17 19 17 33 Amortization - capital stock issue costs 9 9 28 28 Allowance for funds used during construction (“AFUDC”) (223) (181) (483) (372) $ 8,916 $ 9,020 $26,885 $25,768
7. Capital Management Newfoundland Power’s primary objectives when managing capital are (i) to ensure continued access to capital at reasonable cost and (ii) to provide an adequate return to its common shareholder commensurate with the level of risk associated with the shareholder’s investment in the Company. The Company requires ongoing access to capital because its business is capital intensive. Capital investment is required to ensure continued and enhanced performance, reliability and safety of its electricity system and to meet customer growth. The Company operates under cost of service regulation. The cost of capital is ultimately borne by its customers. Access to capital at reasonable cost is a core aspect of the Company’s business strategy, which is to operate a sound electricity system and to focus on the safe and reliable delivery of electricity service to its customers in the most cost-efficient manner possible. The capital managed by the Company is composed of debt (first mortgage sinking fund bonds, bank credit facilities, short-term borrowings and cash/bank indebtedness), common equity (common shares and retained earnings) and preference equity. The Company has historically generated sufficient cash flows from operating activities to service interest and sinking fund payments on debt, to pay dividends and to finance a major portion of its capital expenditure programs. Additional financing to fully fund capital expenditure programs is obtained through the Company’s credit facilities and these borrowings are periodically refinanced along with any maturing bonds through the issuance of additional bonds. These basic cash flow and capital management dynamics are consistent with previous periods and are currently not expected to change materially over the foreseeable future. Newfoundland Power endeavours to maintain a capital structure composed of approximately 55 per cent debt and 45 per cent equity. This capital structure is reflected in customer rates. It is also consistent with the Company’s current investment grade credit ratings, thereby ensuring continued access to capital at reasonable cost. The Company maintains this capital structure primarily by managing its common share dividends.
18
Notes to Interim Financial Statements |
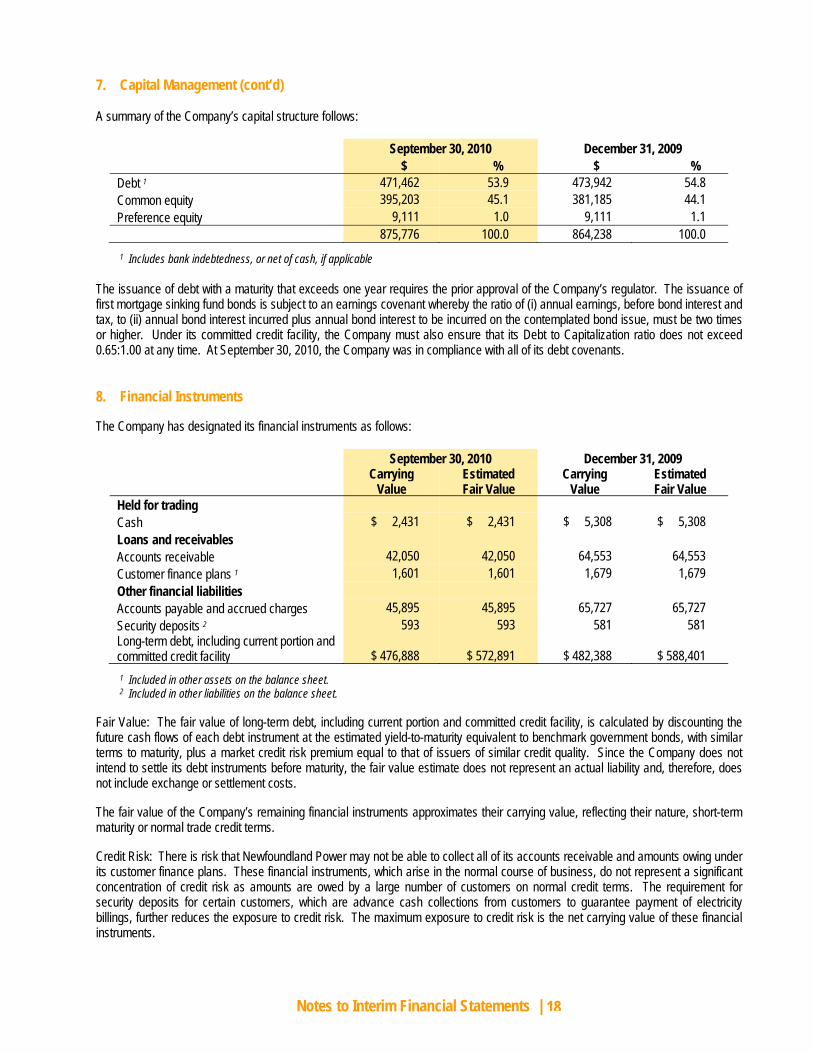
7. Capital Management (cont’d) A summary of the Company’s capital structure follows:
September 30, 2010 December 31, 2009 $ % $ % Debt 1 471,462 53.9 473,942 54.8 Common equity 395,203 45.1 381,185 44.1 Preference equity 9,111 1.0 9,111 1.1 875,776 100.0 864,238 100.0
1 Includes bank indebtedness, or net of cash, if applicable
The issuance of debt with a maturity that exceeds one year requires the prior approval of the Company’s regulator. The issuance of first mortgage sinking fund bonds is subject to an earnings covenant whereby the ratio of (i) annual earnings, before bond interest and tax, to (ii) annual bond interest incurred plus annual bond interest to be incurred on the contemplated bond issue, must be two times or higher. Under its committed credit facility, the Company must also ensure that its Debt to Capitalization ratio does not exceed 0.65:1.00 at any time. At September 30, 2010, the Company was in compliance with all of its debt covenants. 8. Financial Instruments The Company has designated its financial instruments as follows:
September 30, 2010 December 31, 2009
Carrying
Value Estimated Fair Value
Carrying Value
Estimated Fair Value
Held for trading Cash $ 2,431 $ 2,431 $ 5,308 $ 5,308 Loans and receivables Accounts receivable 42,050 42,050 64,553 64,553 Customer finance plans 1 1,601 1,601 1,679 1,679 Other financial liabilities Accounts payable and accrued charges 45,895 45,895 65,727 65,727 Security deposits 2 593 593 581 581 Long-term debt, including current portion and committed credit facility $ 476,888 $ 572,891 $ 482,388 $ 588,401
1 Included in other assets on the balance sheet. 2 Included in other liabilities on the balance sheet.
Fair Value: The fair value of long-term debt, including current portion and committed credit facility, is calculated by discounting the future cash flows of each debt instrument at the estimated yield-to-maturity equivalent to benchmark government bonds, with similar terms to maturity, plus a market credit risk premium equal to that of issuers of similar credit quality. Since the Company does not intend to settle its debt instruments before maturity, the fair value estimate does not represent an actual liability and, therefore, does not include exchange or settlement costs. The fair value of the Company’s remaining financial instruments approximates their carrying value, reflecting their nature, short-term maturity or normal trade credit terms. Credit Risk: There is risk that Newfoundland Power may not be able to collect all of its accounts receivable and amounts owing under its customer finance plans. These financial instruments, which arise in the normal course of business, do not represent a significant concentration of credit risk as amounts are owed by a large number of customers on normal credit terms. The requirement for security deposits for certain customers, which are advance cash collections from customers to guarantee payment of electricity billings, further reduces the exposure to credit risk. The maximum exposure to credit risk is the net carrying value of these financial instruments.
19
Notes to Interim Financial Statements |
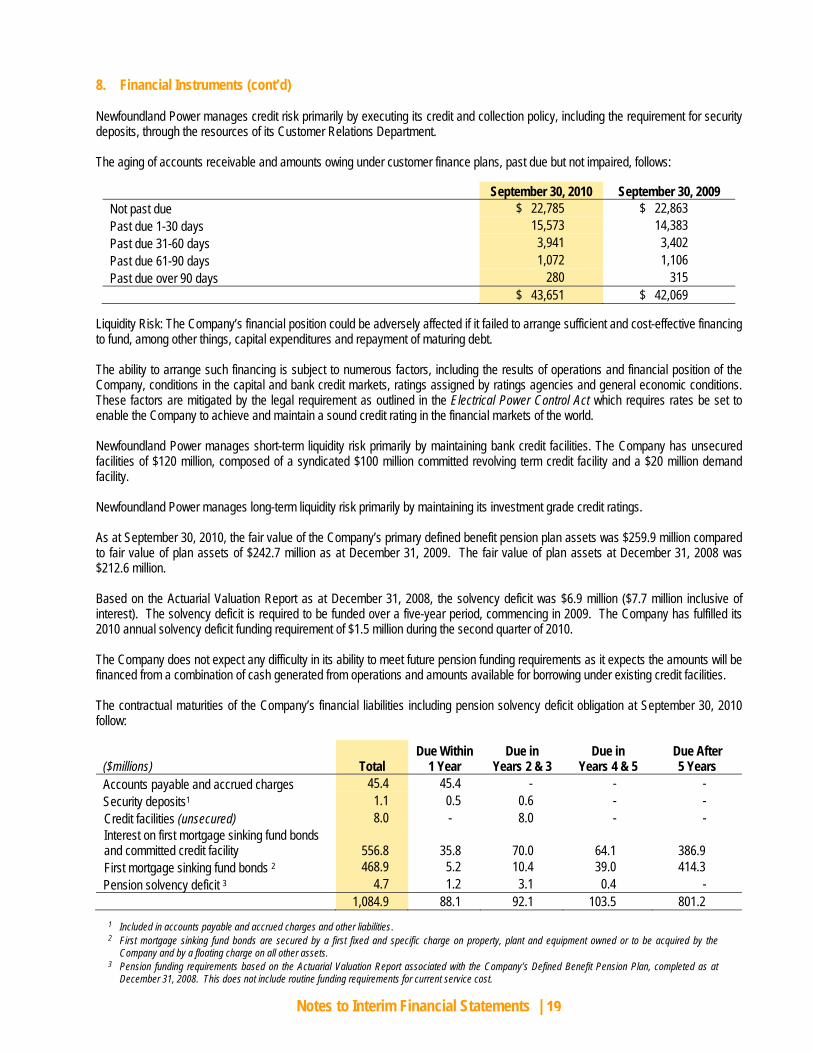
8. Financial Instruments (cont’d) Newfoundland Power manages credit risk primarily by executing its credit and collection policy, including the requirement for security deposits, through the resources of its Customer Relations Department. The aging of accounts receivable and amounts owing under customer finance plans, past due but not impaired, follows:
September 30, 2010 September 30, 2009 Not past due $ 22,785 $ 22,863 Past due 1-30 days 15,573 14,383 Past due 31-60 days 3,941 3,402 Past due 61-90 days 1,072 1,106 Past due over 90 days 280 315 $ 43,651 $ 42,069
Liquidity Risk: The Company’s financial position could be adversely affected if it failed to arrange sufficient and cost-effective financing to fund, among other things, capital expenditures and repayment of maturing debt. The ability to arrange such financing is subject to numerous factors, including the results of operations and financial position of the Company, conditions in the capital and bank credit markets, ratings assigned by ratings agencies and general economic conditions. These factors are mitigated by the legal requirement as outlined in the Electrical Power Control Act which requires rates be set to enable the Company to achieve and maintain a sound credit rating in the financial markets of the world. Newfoundland Power manages short-term liquidity risk primarily by maintaining bank credit facilities. The Company has unsecured facilities of $120 million, composed of a syndicated $100 million committed revolving term credit facility and a $20 million demand facility. Newfoundland Power manages long-term liquidity risk primarily by maintaining its investment grade credit ratings. As at September 30, 2010, the fair value of the Company’s primary defined benefit pension plan assets was $259.9 million compared to fair value of plan assets of $242.7 million as at December 31, 2009. The fair value of plan assets at December 31, 2008 was $212.6 million. Based on the Actuarial Valuation Report as at December 31, 2008, the solvency deficit was $6.9 million ($7.7 million inclusive of interest). The solvency deficit is required to be funded over a five-year period, commencing in 2009. The Company has fulfilled its 2010 annual solvency deficit funding requirement of $1.5 million during the second quarter of 2010. The Company does not expect any difficulty in its ability to meet future pension funding requirements as it expects the amounts will be financed from a combination of cash generated from operations and amounts available for borrowing under existing credit facilities. The contractual maturities of the Company’s financial liabilities including pension solvency deficit obligation at September 30, 2010 follow:
($millions) Total Due Within
1 Year Due in
Years 2 & 3 Due in
Years 4 & 5 Due After 5 Years
Accounts payable and accrued charges 45.4 45.4 - - - Security deposits1 1.1 0.5 0.6 - - Credit facilities (unsecured) 8.0 - 8.0 - - Interest on first mortgage sinking fund bonds and committed credit facility 556.8 35.8 70.0 64.1 386.9 First mortgage sinking fund bonds 2 468.9 5.2 10.4 39.0 414.3 Pension solvency deficit 3 4.7 1.2 3.1 0.4 - 1,084.9 88.1 92.1 103.5 801.2
1 Included in accounts payable and accrued charges and other liabilities. 2 First mortgage sinking fund bonds are secured by a first fixed and specific charge on property, plant and equipment owned or to be acquired by the
Company and by a floating charge on all other assets. 3 Pension funding requirements based on the Actuarial Valuation Report associated with the Company’s Defined Benefit Pension Plan, completed as at
December 31, 2008. This does not include routine funding requirements for current service cost.
20
Notes to Interim Financial Statements |
8. Financial Instruments (cont’d) Market Risk: Exposure to foreign exchange rate fluctuations is immaterial. Market driven changes in interest rates and changes in the Company’s credit ratings can cause fluctuations in interest costs associated with the Company’s bank credit facilities. For the nine month period ended September 30, 2010, each 25 basis points change in interest rates on the Company’s credit facilities would have caused a $31,000 change in credit facility interest costs and a $21,000 change in earnings (2009 - $45,000 and $30,000, respectively). The Company periodically refinances its credit facilities in the normal course with fixed-rate first mortgage sinking fund bonds which significantly mitigate the exposure to interest rate changes. Changes in interest rates and/or changes in the Company’s credit ratings can affect the interest rate on first mortgage sinking fund bonds at the time of issue. The Company does not expect to issue any additional long-term debt during 2010. The Company’s defined benefit pension plan is impacted by economic conditions. There is no assurance that the pension plan assets will earn the expected long-term rate of return in the future. Market driven changes impacting the performance of the pension plan assets may result in material variations from the expected long-term return on the assets. This may cause material changes in future pension liabilities and pension expense. Market driven changes impacting the discount rate may also result in material variations in future pension liabilities and pension expense. 9. Employee Future Benefits The total amount of defined benefit pension plan expense recognized for the quarter ended September 30, 2010 was $1.5 million (2009 - $0.4 million). For the nine months ended September 30, 2010, the cost was $4.6 million (2009 - $1.0 million). 10. Commitments The Company is obligated to provide a service to customers, resulting in ongoing capital expenditure commitments. Capital expenditures, which are subject to PUB approval, are expected to be approximately $74.0 million in 2010.