Embed Size (px)
Citation preview

Third Quarter 2017 Earnings Call
November 3, 2017
Third Quarter 2017 Earnings Call, November 3, 2017 2
Overview
Stephen MaireGlobal Head of Investor Relations and Communications

Third Quarter 2017 Earnings Call, November 3, 2017 3
DisclaimerCertain statements contained in this document are forward-looking statements and are based on future expectations, plans and prospects for Moody’s business and
operations that involve a number of risks and uncertainties. The forward-looking statements in this document are made as of the date hereof, and Moody’s disclaims any
duty to supplement, update or revise such statements on a going-forward basis, whether as a result of subsequent developments, changed expectations or otherwise. In
connection with the “safe harbor” provisions of the Private Securities Litigation Reform Act of 1995, Moody’s is identifying certain factors that could cause actual results to
differ, perhaps materially, from those indicated by these forward-looking statements. Those factors, risks and uncertainties include, but are not limited to, world-wide credit
market disruptions or an economic slowdown, which could affect the volume of debt and other securities issued in domestic and/or global capital markets; other matters that
could affect the volume of debt and other securities issued in domestic and/or global capital markets, including regulation, credit quality concerns, changes in interest rates
and other volatility in the financial markets such as that due to the U.K.’s referendum vote whereby the U.K. citizens voted to withdraw from the EU; the level of merger and
acquisition activity in the U.S. and abroad; the uncertain effectiveness and possible collateral consequences of U.S. and foreign government actions affecting world-wide
credit markets, international trade and economic policy; concerns in the marketplace affecting our credibility or otherwise affecting market perceptions of the integrity or
utility of independent credit agency ratings; the introduction of competing products or technologies by other companies; pricing pressure from competitors and/or
customers; the level of success of new product development and global expansion; the impact of regulation as an NRSRO, the potential for new U.S., state and local
legislation and regulations, including provisions in the Financial Reform Act and regulations resulting from that Act; the potential for increased competition and regulation in
the EU and other foreign jurisdictions; exposure to litigation related to our rating opinions, as well as any other litigation, government and regulatory proceedings,
investigations and inquires to which the Company may be subject from time to time; provisions in the Financial Reform Act legislation modifying the pleading standards, and
EU regulations modifying the liability standards, applicable to credit rating agencies in a manner adverse to credit rating agencies; provisions of EU regulations imposing
additional procedural and substantive requirements on the pricing of services; the possible loss of key employees; failures or malfunctions of our operations and
infrastructure; any vulnerabilities to cyber threats or other cybersecurity concerns; the outcome of any review by controlling tax authorities of the Company’s global tax
planning initiatives; exposure to potential criminal sanctions or civil remedies if the Company fails to comply with foreign and U.S. laws and regulations that are applicable in
the jurisdictions in which the Company operates, including sanctions laws, anti-corruption laws, and local laws prohibiting corrupt payments to government officials; the
impact of mergers, acquisitions or other business combinations and the ability of the Company to successfully integrate acquired businesses; currency and foreign
exchange volatility; the level of future cash flows; the levels of capital investments; and a decline in the demand for credit risk management tools by financial institutions.
Other factors, risks and uncertainties relating to our acquisition of Bureau van Dijk could cause our actual results to differ, perhaps materially, from those indicated by these
forward-looking statements, including risks relating to the integration of Bureau van Dijk’s operations, products and employees into Moody’s and the possibility that
anticipated synergies and other benefits of the acquisition will not be realized in the amounts anticipated or will not be realized within the expected timeframe; risks that the
acquisition could have an adverse effect on the business of Bureau van Dijk or its prospects, including, without limitation, on relationships with vendors, suppliers or
customers; claims made, from time to time, by vendors, suppliers or customers; changes in the European or global marketplaces that have an adverse effect on the
business of Bureau van Dijk; and other factors, risks and uncertainties relating to the transaction as set forth under the caption “‘Safe Harbor’ Statement under the Private
Securities Litigation Reform Act of 1995 ” in Moody’s report on Form 8-K filed on May 15, 2017, which are incorporated by reference herein. These factors, risks and
uncertainties as well as other risks and uncertainties that could cause Moody’s actual results to differ materially from those contemplated, expressed, projected, anticipated
or implied in the forward-looking statements are described in greater detail under “Risk Factors” in Part I, Item 1A of the Company’s annual report on Form 10-K for the year
ended December 31, 2016, and in other filings made by the Company from time to time with the SEC or in materials incorporated herein or therein. Stockholders and
investors are cautioned that the occurrence of any of these factors, risks and uncertainties may cause the Company’s actual results to differ materially from those
contemplated, expressed, projected, anticipated or implied in the forward-looking statements, which could have a material and adverse effect on the Company’s business,
results of operations and financial condition. New factors may emerge from time to time, and it is not possible for the Company to predict new factors, nor can the Company
assess the potential effect of any new factors on it.

Third Quarter 2017 Earnings Call, November 3, 2017 4
Agenda1. Third Quarter and Year-to-Date 2017 Results
Ray McDaniel, President and Chief Executive Officer
2. Third Quarter Financial Highlights Linda Huber, Executive Vice President and Chief Financial Officer
3. Current 2017 Outlook Ray McDaniel, President and Chief Executive Officer
4. Q&A Ray McDaniel, President and Chief Executive Officer Linda Huber, Executive Vice President and Chief Financial Officer Mark Almeida, President, Moody’s Analytics Rob Fauber, President, Moody’s Investors Service
1Third Quarter and
Year-to-Date 2017
Results
Ray McDanielPresident and Chief Executive Officer
Third Quarter 2017 Earnings Call, November 3, 2017 6
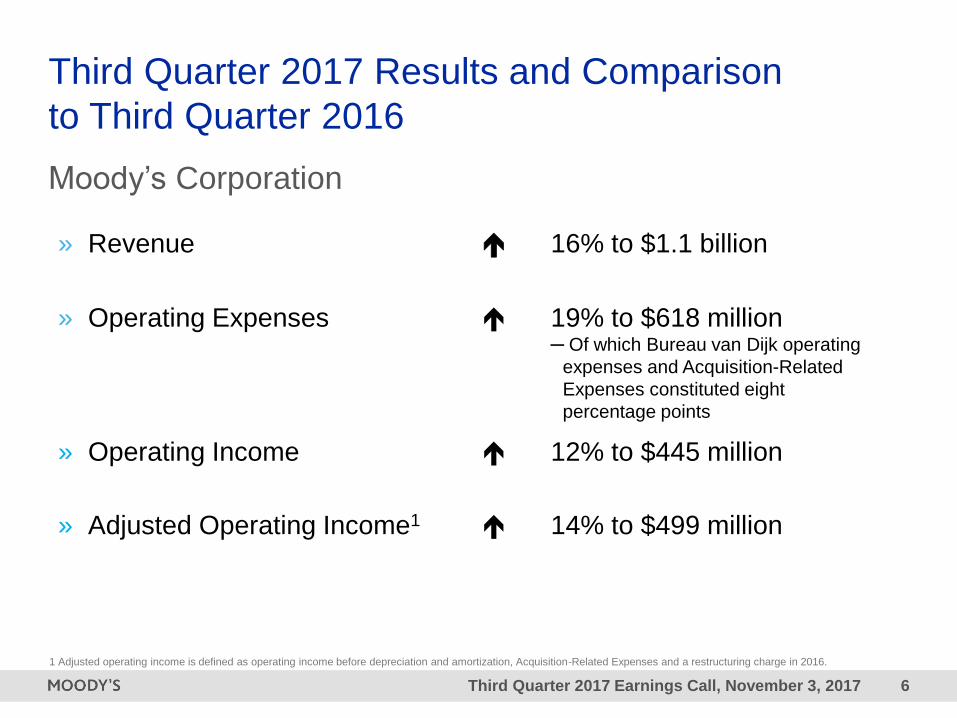
Third Quarter 2017 Results and Comparison
to Third Quarter 2016
Moody’s Corporation
» Revenue 16% to $1.1 billion
» Operating Expenses 19% to $618 million─ Of which Bureau van Dijk operating
expenses and Acquisition-Related
Expenses constituted eight
percentage points
» Operating Income 12% to $445 million
» Adjusted Operating Income1 14% to $499 million
1 Adjusted operating income is defined as operating income before depreciation and amortization, Acquisition-Related Expenses and a restructuring charge in 2016.
Third Quarter 2017 Earnings Call, November 3, 2017 7
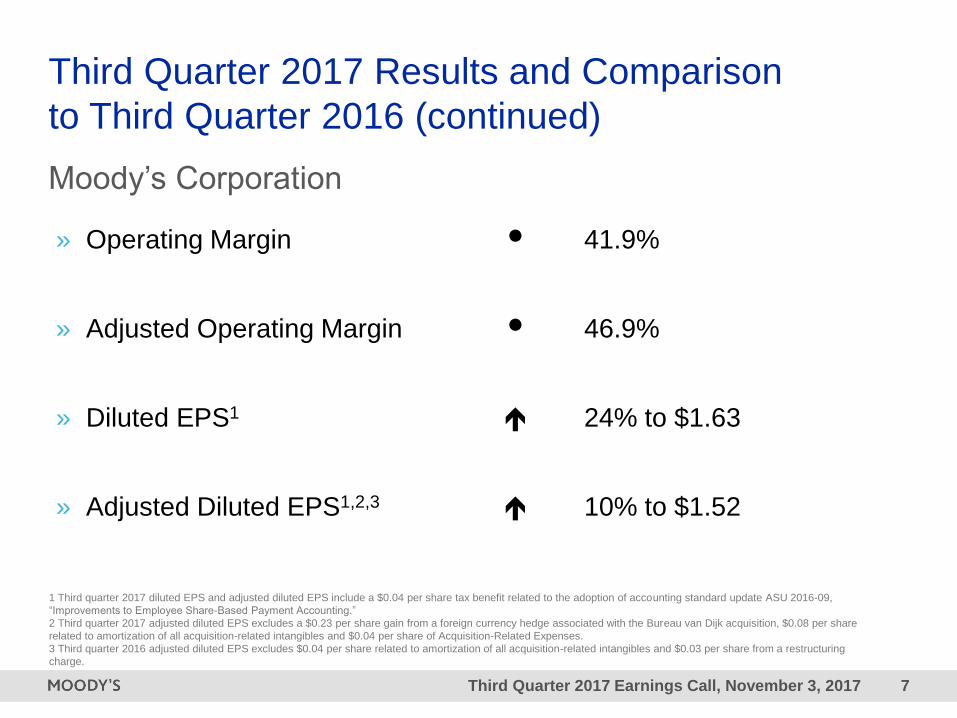
Third Quarter 2017 Results and Comparison
to Third Quarter 2016 (continued)
Moody’s Corporation
» Operating Margin 41.9%
» Adjusted Operating Margin 46.9%
» Diluted EPS1 24% to $1.63
» Adjusted Diluted EPS1,2,3 10% to $1.52
1 Third quarter 2017 diluted EPS and adjusted diluted EPS include a $0.04 per share tax benefit related to the adoption of accounting standard update ASU 2016-09,
“Improvements to Employee Share-Based Payment Accounting.”
2 Third quarter 2017 adjusted diluted EPS excludes a $0.23 per share gain from a foreign currency hedge associated with the Bureau van Dijk acquisition, $0.08 per share
related to amortization of all acquisition-related intangibles and $0.04 per share of Acquisition-Related Expenses.
3 Third quarter 2016 adjusted diluted EPS excludes $0.04 per share related to amortization of all acquisition-related intangibles and $0.03 per share from a restructuring
charge.
Third Quarter 2017 Earnings Call, November 3, 2017 8
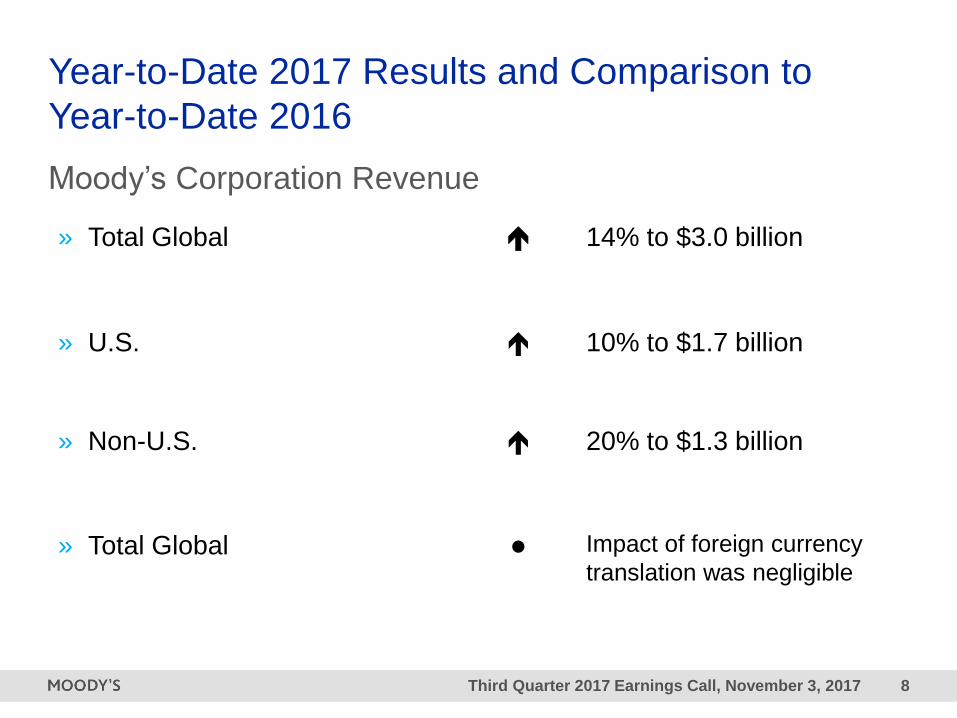
Year-to-Date 2017 Results and Comparison to
Year-to-Date 2016
Moody’s Corporation Revenue
» Total Global 14% to $3.0 billion
» U.S. 10% to $1.7 billion
» Non-U.S. 20% to $1.3 billion
» Total Global Impact of foreign currency
translation was negligible
Third Quarter 2017 Earnings Call, November 3, 2017 9
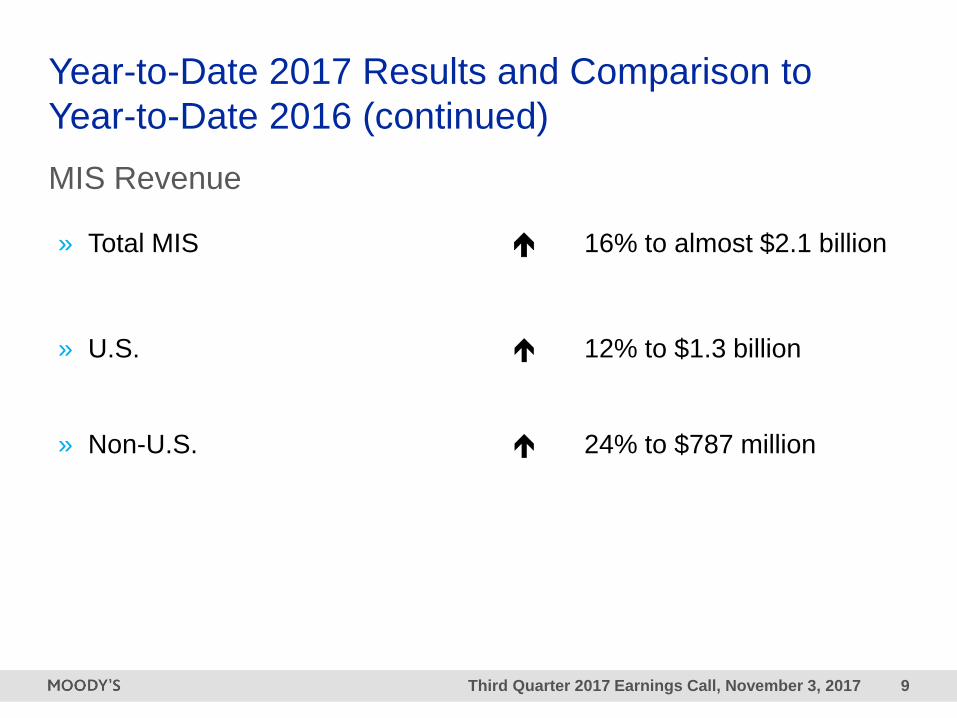
Year-to-Date 2017 Results and Comparison to
Year-to-Date 2016 (continued)
MIS Revenue
» Total MIS 16% to almost $2.1 billion
» U.S. 12% to $1.3 billion
» Non-U.S. 24% to $787 million
Third Quarter 2017 Earnings Call, November 3, 2017 10
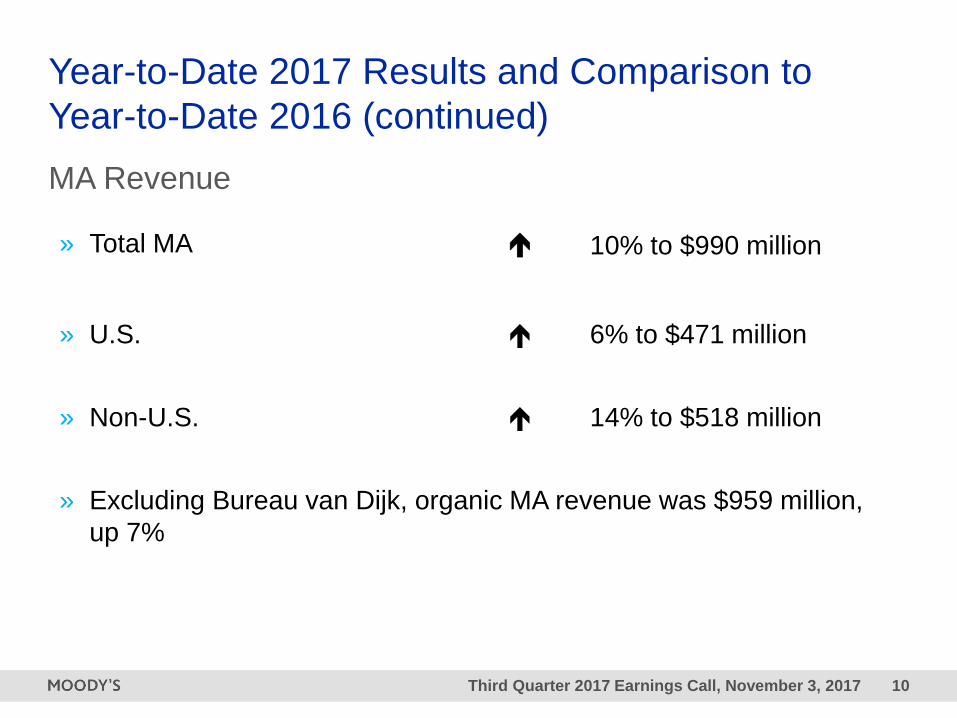
Year-to-Date 2017 Results and Comparison to
Year-to-Date 2016 (continued)
MA Revenue
» Total MA 10% to $990 million
» U.S. 6% to $471 million
» Non-U.S. 14% to $518 million
» Excluding Bureau van Dijk, organic MA revenue was $959 million,
up 7%
Third Quarter 2017 Earnings Call, November 3, 2017 11
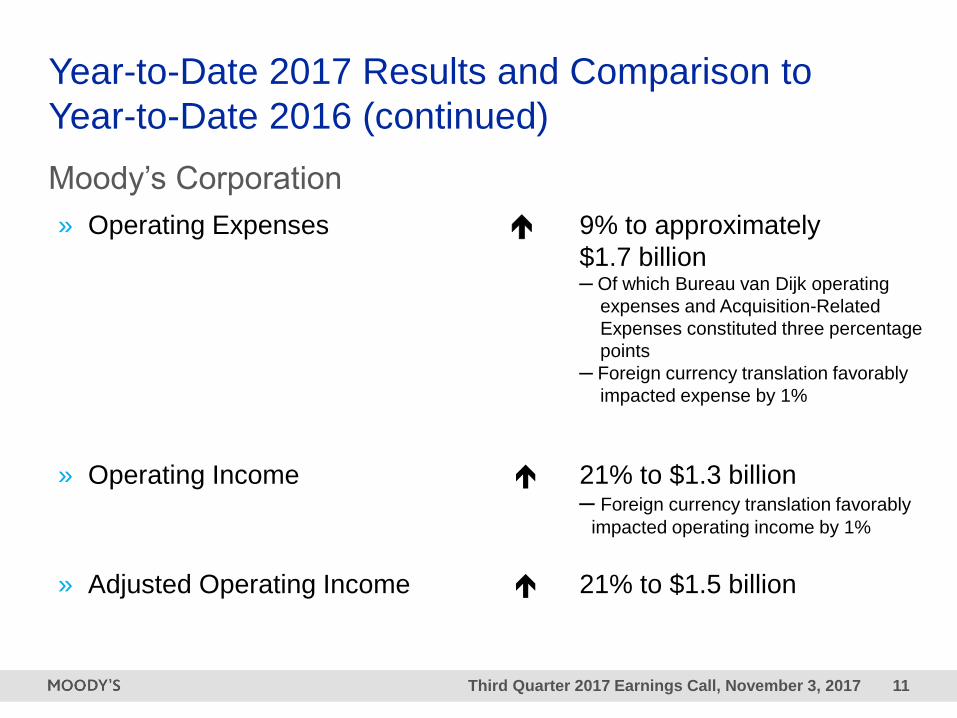
Year-to-Date 2017 Results and Comparison to
Year-to-Date 2016 (continued)
Moody’s Corporation
» Operating Expenses 9% to approximately
$1.7 billion─ Of which Bureau van Dijk operating
expenses and Acquisition-Related
Expenses constituted three percentage
points
─ Foreign currency translation favorably
impacted expense by 1%
» Operating Income 21% to $1.3 billion─ Foreign currency translation favorably
impacted operating income by 1%
» Adjusted Operating Income 21% to $1.5 billion
Third Quarter 2017 Earnings Call, November 3, 2017 12
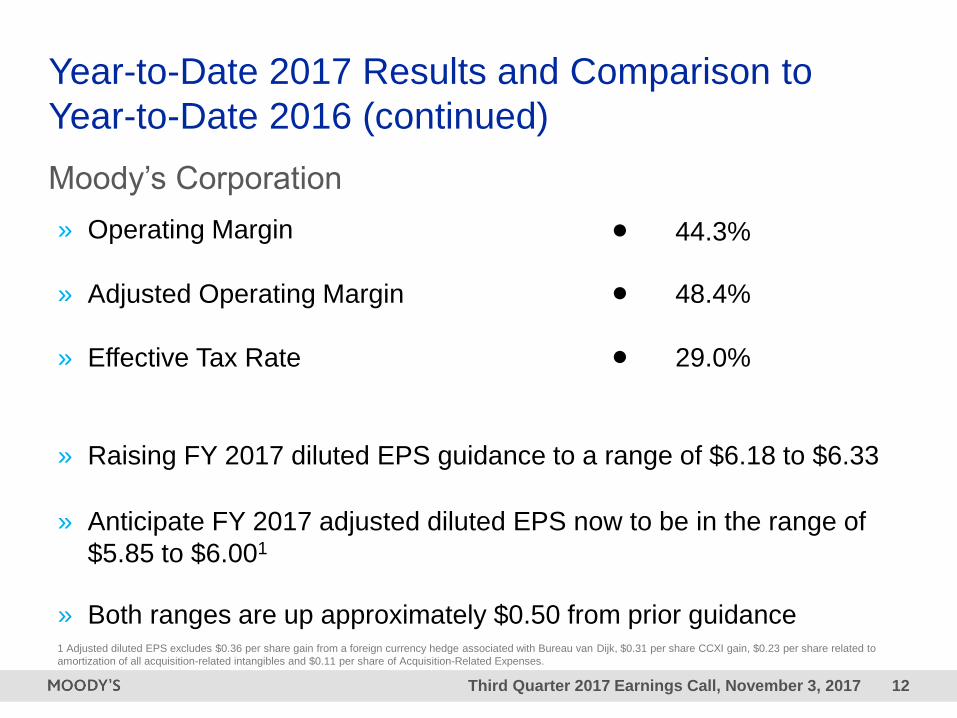
Year-to-Date 2017 Results and Comparison to
Year-to-Date 2016 (continued)
Moody’s Corporation
» Operating Margin 44.3%
» Adjusted Operating Margin 48.4%
» Effective Tax Rate 29.0%
» Raising FY 2017 diluted EPS guidance to a range of $6.18 to $6.33
» Anticipate FY 2017 adjusted diluted EPS now to be in the range of
$5.85 to $6.001
» Both ranges are up approximately $0.50 from prior guidance1 Adjusted diluted EPS excludes $0.36 per share gain from a foreign currency hedge associated with Bureau van Dijk, $0.31 per share CCXI gain, $0.23 per share related to
amortization of all acquisition-related intangibles and $0.11 per share of Acquisition-Related Expenses.

2Third Quarter 2017
Financial Highlights
Linda HuberExecutive Vice President and Chief Financial Officer
Third Quarter 2017 Earnings Call, November 3, 2017 14
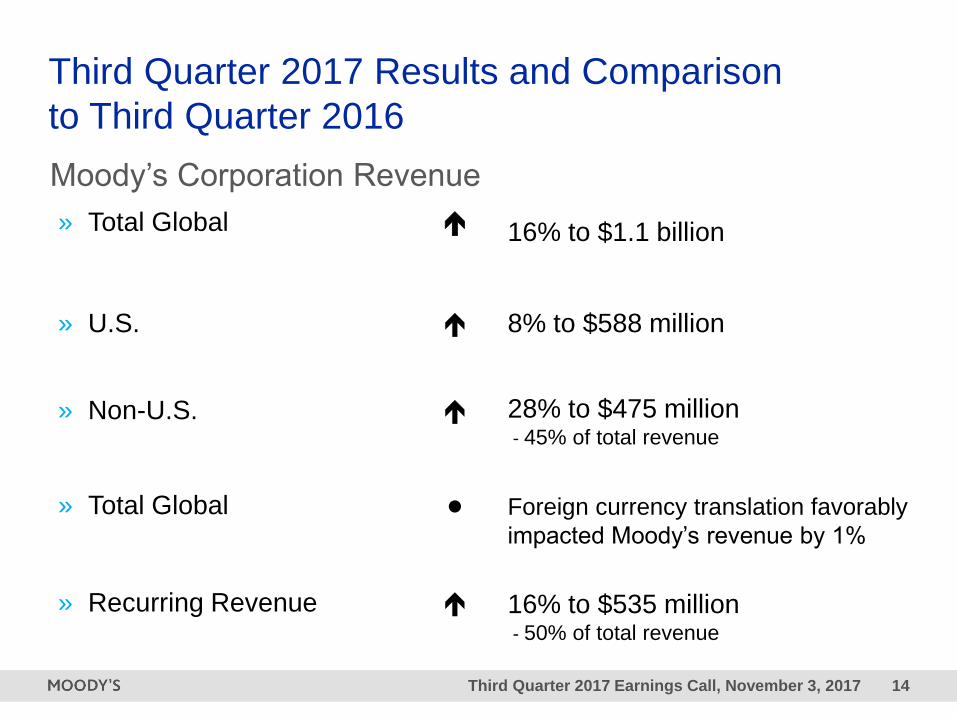
Third Quarter 2017 Results and Comparison
to Third Quarter 2016
Moody’s Corporation Revenue
» Total Global 16% to $1.1 billion
» U.S. 8% to $588 million
» Non-U.S. 28% to $475 million- 45% of total revenue
» Total Global Foreign currency translation favorably
impacted Moody’s revenue by 1%
» Recurring Revenue 16% to $535 million- 50% of total revenue
Third Quarter 2017 Earnings Call, November 3, 2017 15
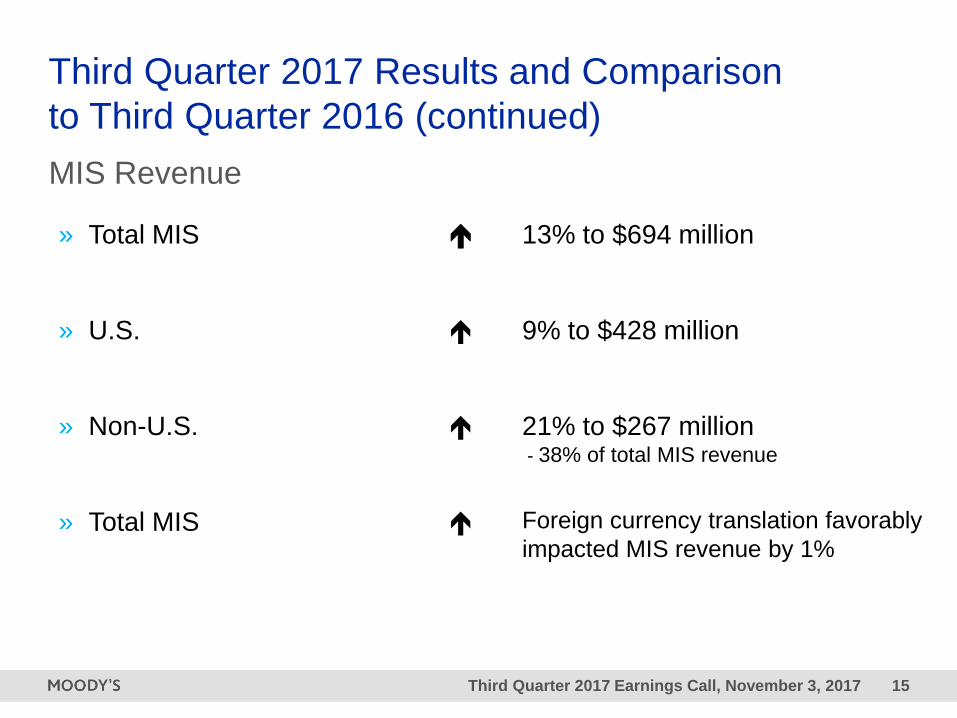
Third Quarter 2017 Results and Comparison
to Third Quarter 2016 (continued)
MIS Revenue
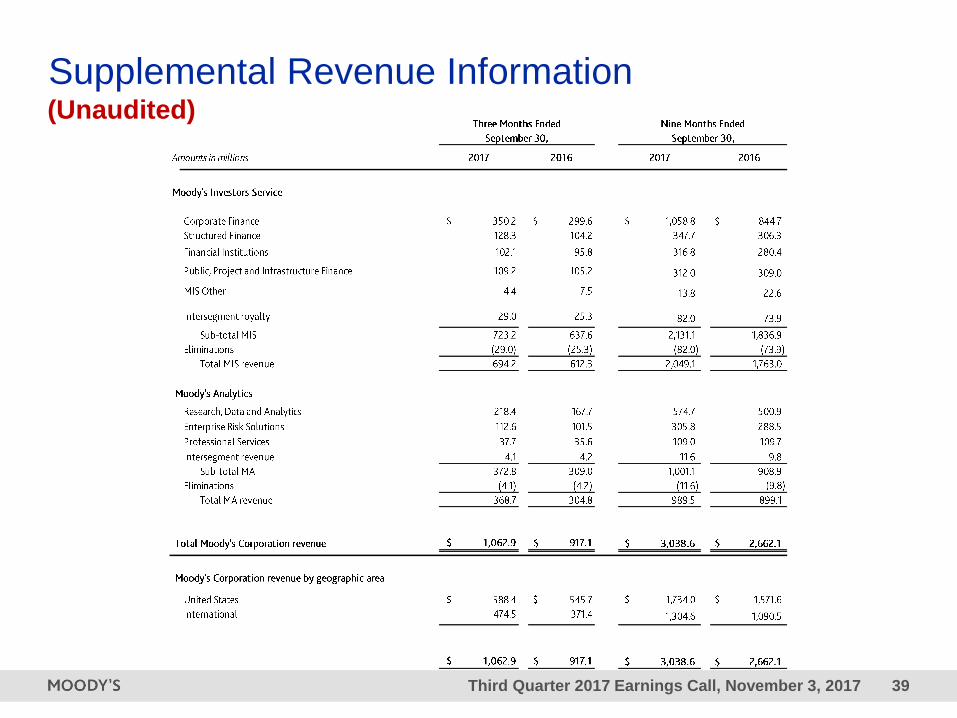
» Total MIS 13% to $694 million
» U.S. 9% to $428 million
» Non-U.S. 21% to $267 million- 38% of total MIS revenue
» Total MIS Foreign currency translation favorably
impacted MIS revenue by 1%

Third Quarter 2017 Earnings Call, November 3, 2017 16
Third Quarter 2017 Results and Comparison
to Third Quarter 2016 (continued)
MIS Revenue by Line of Business
» Corporate Finance: $350 million- Global
- U.S.
- Non-U.S.
17%
17%
17%
» Structured Finance: $128 million- Global
- U.S.
- Non-U.S.
23%
25%
19%
Third Quarter 2017 Earnings Call, November 3, 2017 17
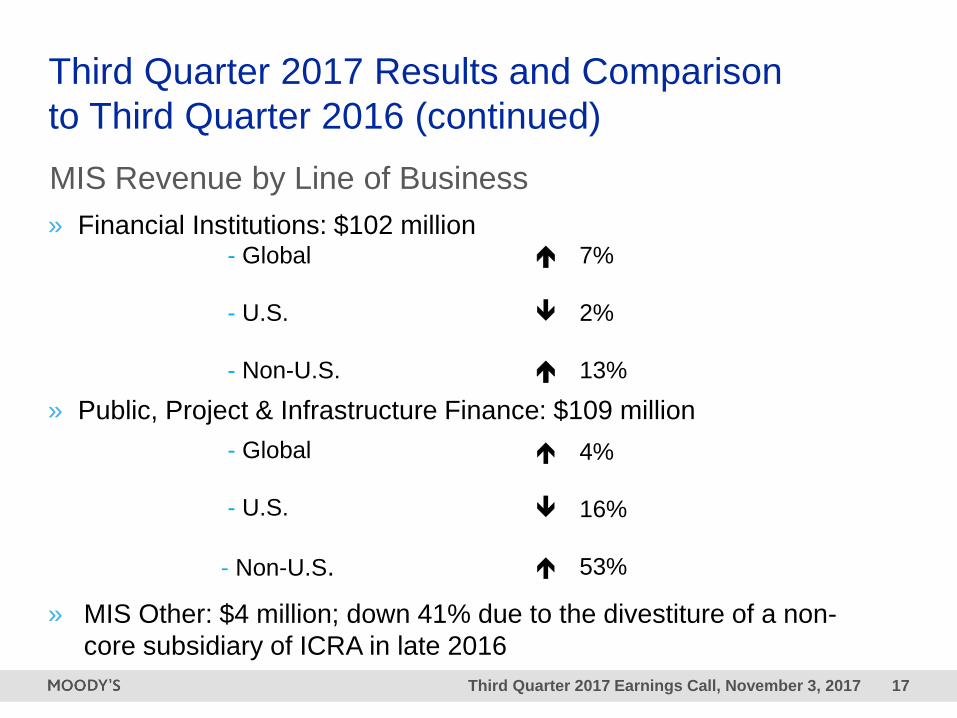
Third Quarter 2017 Results and Comparison
to Third Quarter 2016 (continued)
MIS Revenue by Line of Business
» Financial Institutions: $102 million- Global
- U.S.
- Non-U.S.
7%
2%
13%
» Public, Project & Infrastructure Finance: $109 million
- Global
- U.S.
- Non-U.S.
4%
16%
53%
» MIS Other: $4 million; down 41% due to the divestiture of a non-
core subsidiary of ICRA in late 2016
Third Quarter 2017 Earnings Call, November 3, 2017 18
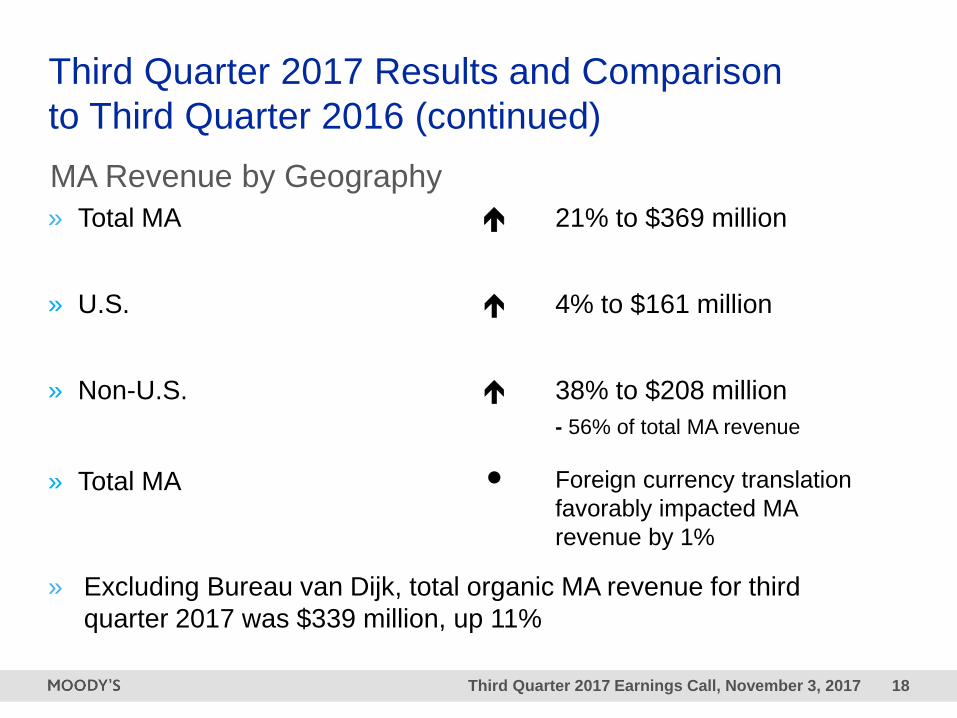
Third Quarter 2017 Results and Comparison
to Third Quarter 2016 (continued)
MA Revenue by Geography
» Total MA 21% to $369 million
» U.S. 4% to $161 million
» Non-U.S. 38% to $208 million
- 56% of total MA revenue
» Total MA Foreign currency translation
favorably impacted MA
revenue by 1%
» Excluding Bureau van Dijk, total organic MA revenue for third
quarter 2017 was $339 million, up 11%
Third Quarter 2017 Earnings Call, November 3, 2017 19
Third Quarter 2017 Results and Comparison
to Third Quarter 2016 (continued)
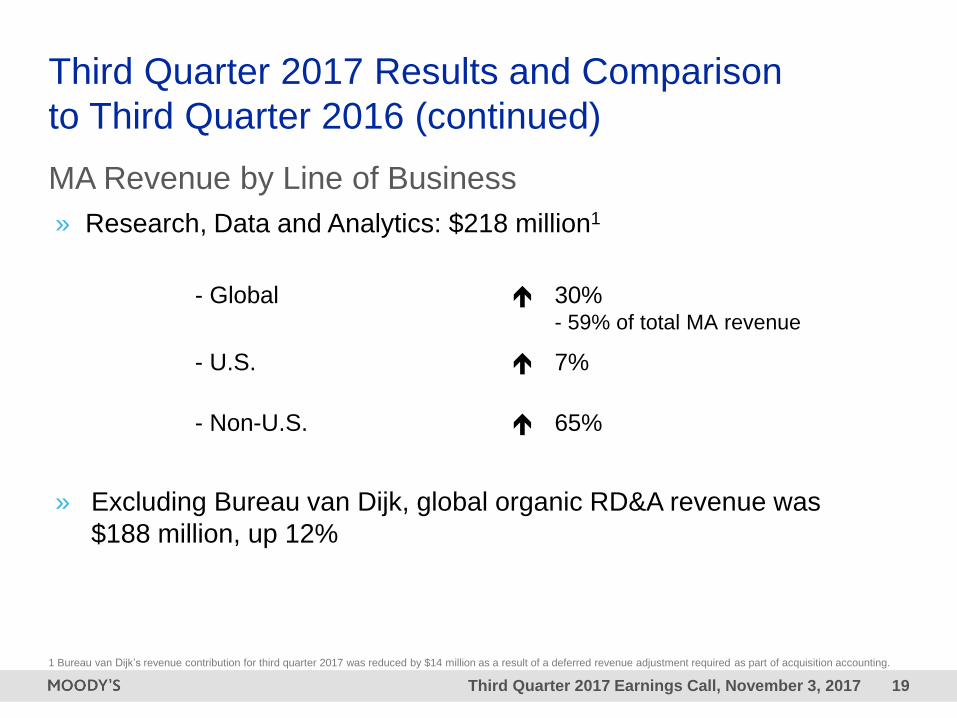
MA Revenue by Line of Business
» Research, Data and Analytics: $218 million1
- Global 30%- 59% of total MA revenue
- U.S. 7%
- Non-U.S. 65%
» Excluding Bureau van Dijk, global organic RD&A revenue was
$188 million, up 12%
1 Bureau van Dijk’s revenue contribution for third quarter 2017 was reduced by $14 million as a result of a deferred revenue adjustment required as part of acquisition accounting.
Third Quarter 2017 Earnings Call, November 3, 2017 20
Third Quarter 2017 Results and Comparison
to Third Quarter 2016 (continued)
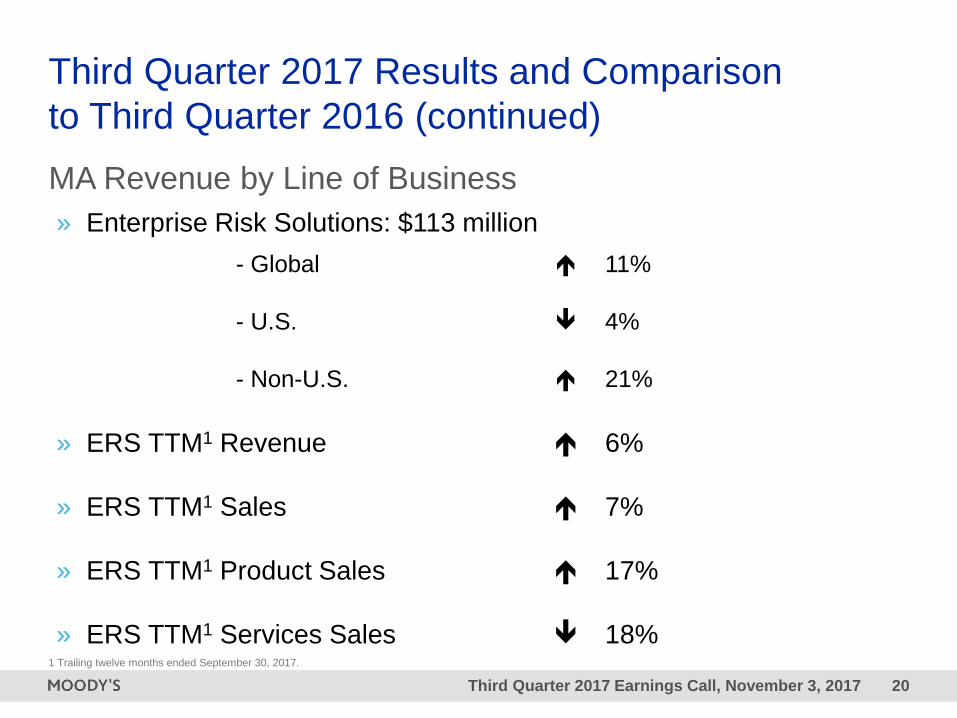
MA Revenue by Line of Business
» Enterprise Risk Solutions: $113 million
- Global
- U.S.
- Non-U.S.
11%
4%
21%
» ERS TTM1 Revenue
» ERS TTM1 Sales
» ERS TTM1 Product Sales
» ERS TTM1 Services Sales
6%
7%
17%
18%1 Trailing twelve months ended September 30, 2017.
Third Quarter 2017 Earnings Call, November 3, 2017 21
Third Quarter 2017 Results and Comparison
to Third Quarter 2016 (continued)
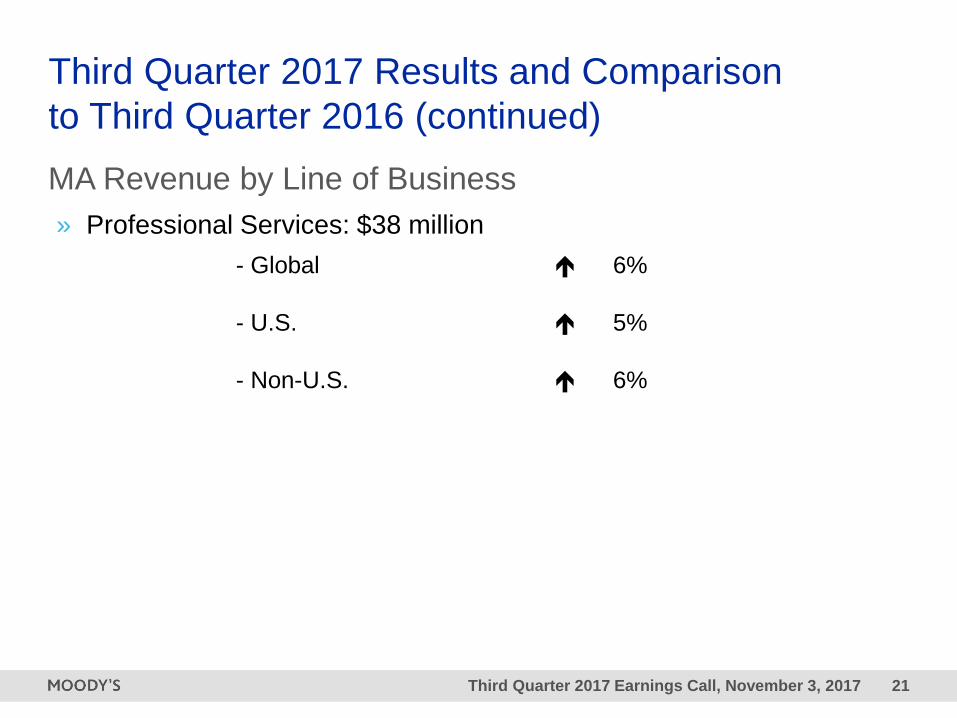
MA Revenue by Line of Business
» Professional Services: $38 million
- Global
- U.S.
- Non-U.S.
6%
5%
6%

Third Quarter 2017 Earnings Call, November 3, 2017 22
Third Quarter 2017 Results and Comparison
to Third Quarter 2016 (continued)
Moody’s Corporation
» Operating Expenses 19% to $618 million– Of which Bureau van Dijk operating
expenses and Acquisition-Related
Expenses constituted eight percentage
points
– Impact of foreign currency translation
was negligible
» Operating Margin 41.9%
» Adjusted Operating Margin 46.9%
» Effective Tax Rate 31.4%
Third Quarter 2017 Earnings Call, November 3, 2017 23
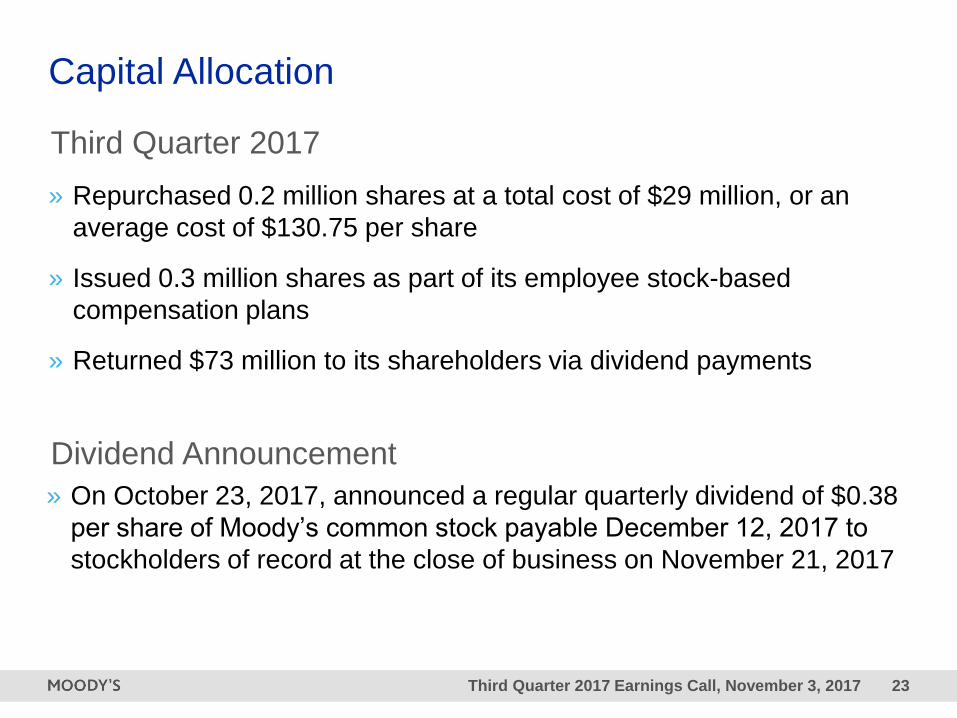
Capital Allocation
» Repurchased 0.2 million shares at a total cost of $29 million, or an
average cost of $130.75 per share
» Issued 0.3 million shares as part of its employee stock-based
compensation plans
» Returned $73 million to its shareholders via dividend payments
Third Quarter 2017
» On October 23, 2017, announced a regular quarterly dividend of $0.38
per share of Moody’s common stock payable December 12, 2017 to
stockholders of record at the close of business on November 21, 2017
Dividend Announcement
Third Quarter 2017 Earnings Call, November 3, 2017 24
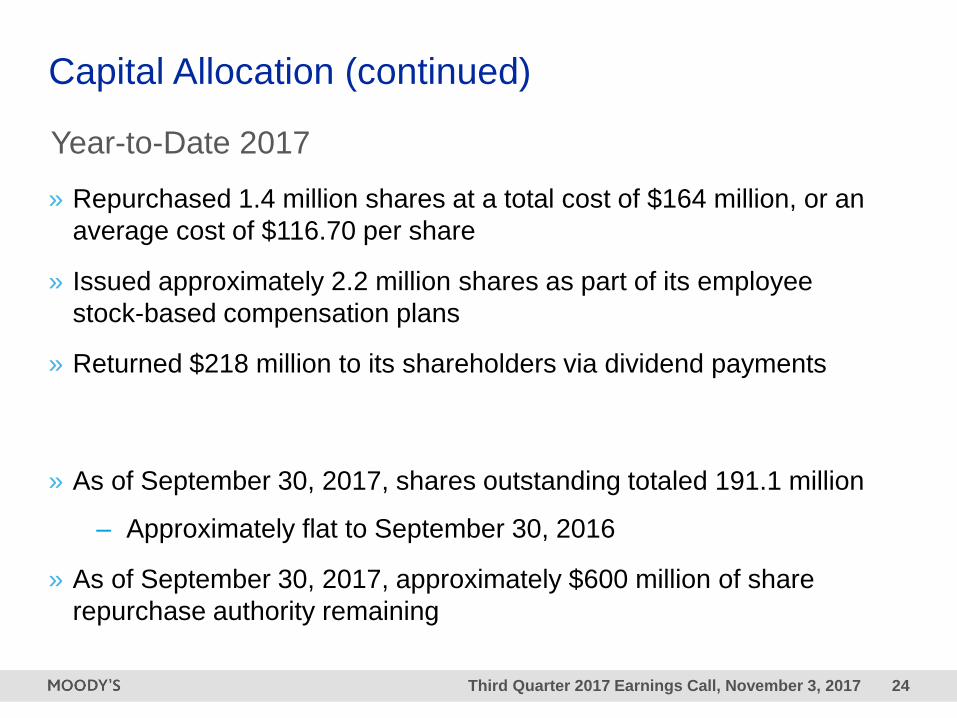
Capital Allocation (continued)
» Repurchased 1.4 million shares at a total cost of $164 million, or an
average cost of $116.70 per share
» Issued approximately 2.2 million shares as part of its employee
stock-based compensation plans
» Returned $218 million to its shareholders via dividend payments
» As of September 30, 2017, shares outstanding totaled 191.1 million
– Approximately flat to September 30, 2016
» As of September 30, 2017, approximately $600 million of share
repurchase authority remaining
Year-to-Date 2017
Third Quarter 2017 Earnings Call, November 3, 2017 25
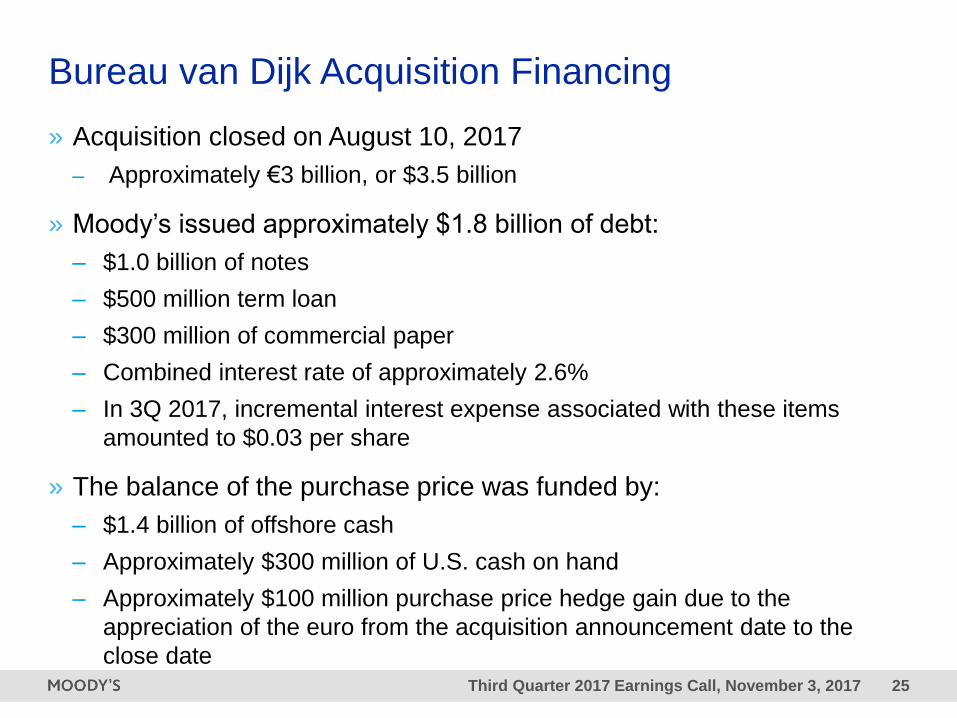
Bureau van Dijk Acquisition Financing
» Acquisition closed on August 10, 2017
– Approximately €3 billion, or $3.5 billion
» Moody’s issued approximately $1.8 billion of debt:
– $1.0 billion of notes
– $500 million term loan
– $300 million of commercial paper
– Combined interest rate of approximately 2.6%
– In 3Q 2017, incremental interest expense associated with these items
amounted to $0.03 per share
» The balance of the purchase price was funded by:
– $1.4 billion of offshore cash
– Approximately $300 million of U.S. cash on hand
– Approximately $100 million purchase price hedge gain due to the
appreciation of the euro from the acquisition announcement date to the
close date

Third Quarter 2017 Earnings Call, November 3, 2017 26
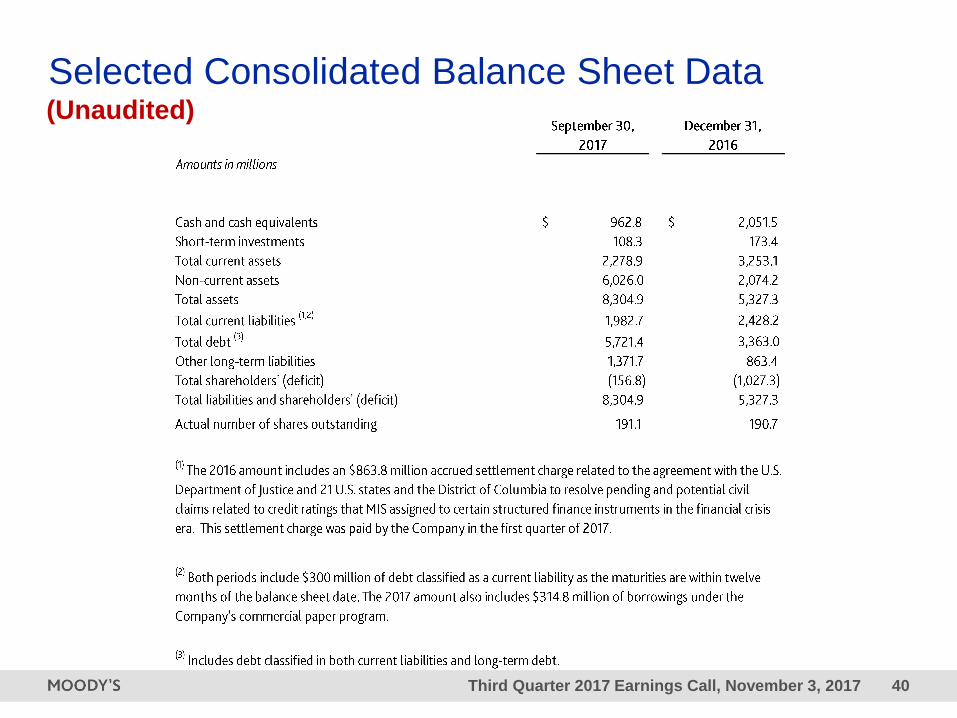
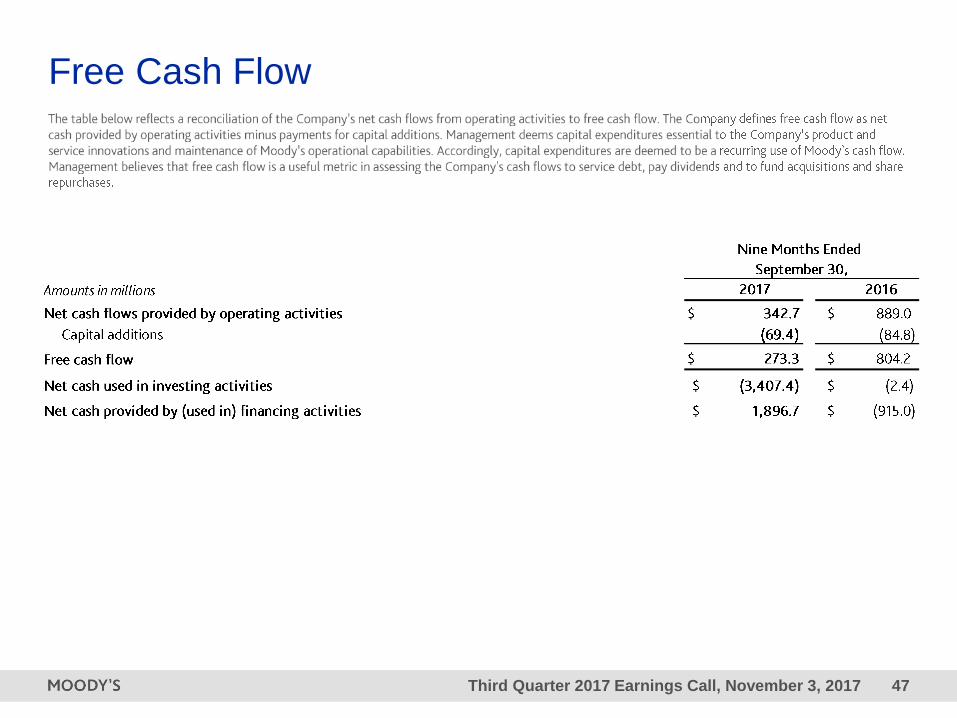
Balance Sheet and Free Cash Flow
» As of September 30, 2017, Moody’s had:
– $5.7 billion of outstanding debt
– Approximately $700 million of additional borrowing capacity
available under its revolving credit facility
– Total cash, cash equivalents and short-term investments of $1.1
billion
- Approximately 74% held outside the U.S.
» Cash flow from operations in the first nine months of 2017 was $343
million, down from $889 million in the first nine months of 20161
» Free cash flow in the first nine months of 2017 was $273 million, down
from $804 million in the first nine months of 20161
1 Declines in cash flow from operations and free cash flow were due to payments the Company made in the first quarter of 2017 pursuant to its 2016 settlement with the
Department of Justice and various states attorneys general.
3Current 2017 Outlook
Ray McDanielPresident and Chief Executive Officer

Third Quarter 2017 Earnings Call, November 3, 2017 28
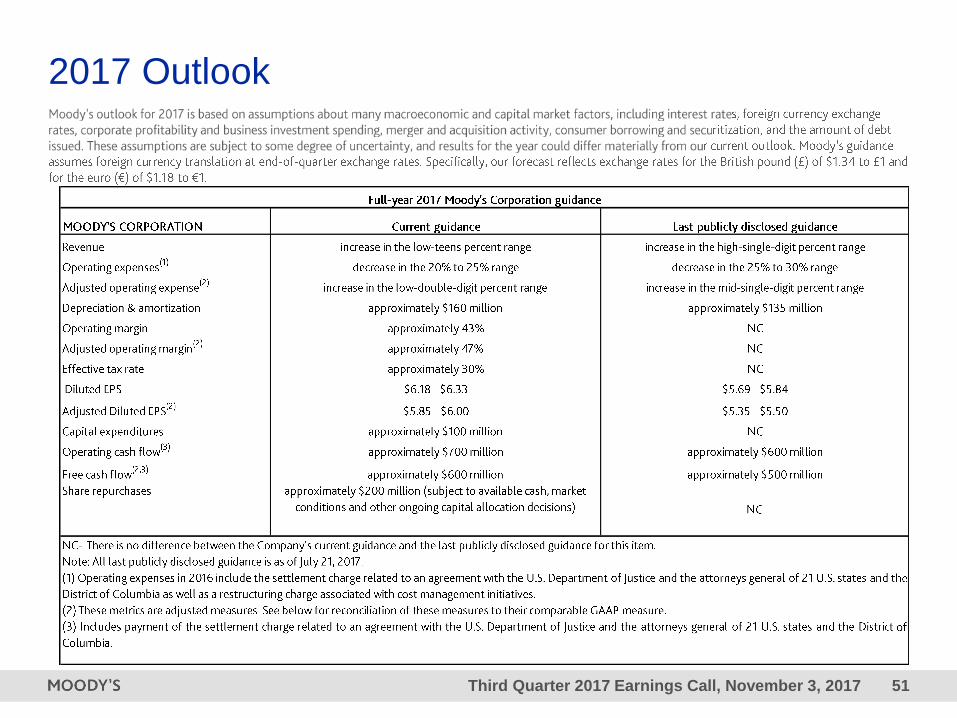
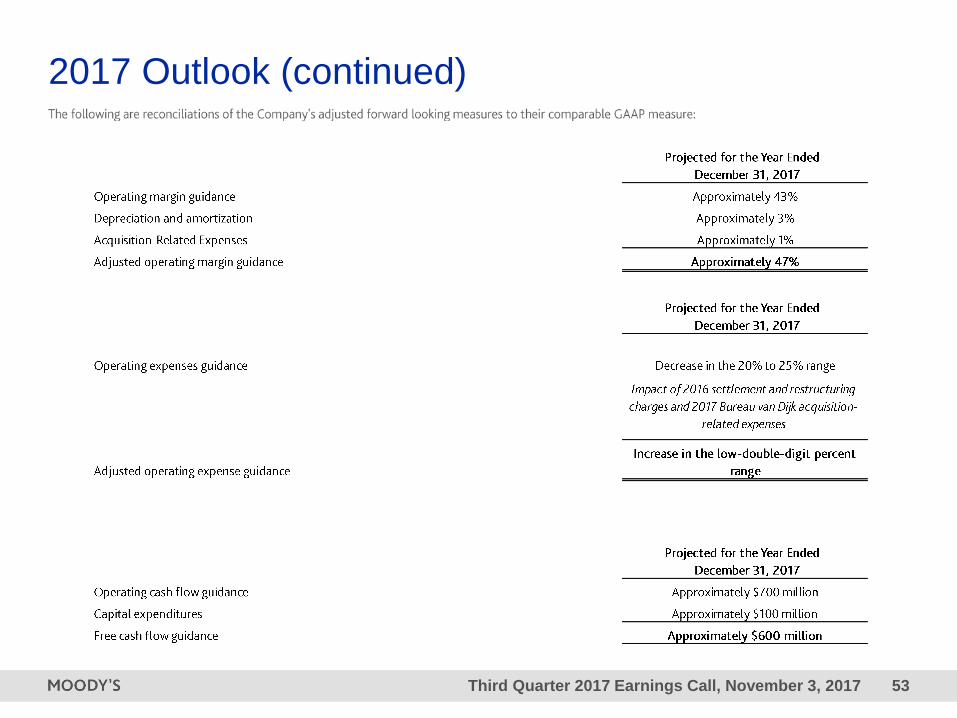
Current 2017 OutlookMoody’s outlook assumes foreign currency translation at end-of-quarter exchange rates.
Specifically, our forecast reflects exchange rates for the British pound (£) of $1.34 to £1
and for the euro (€) of $1.18 to €1.
Changes to 2017 Full-Year Financial Outlook1
MCO Current Guidance as of November 3, 2017
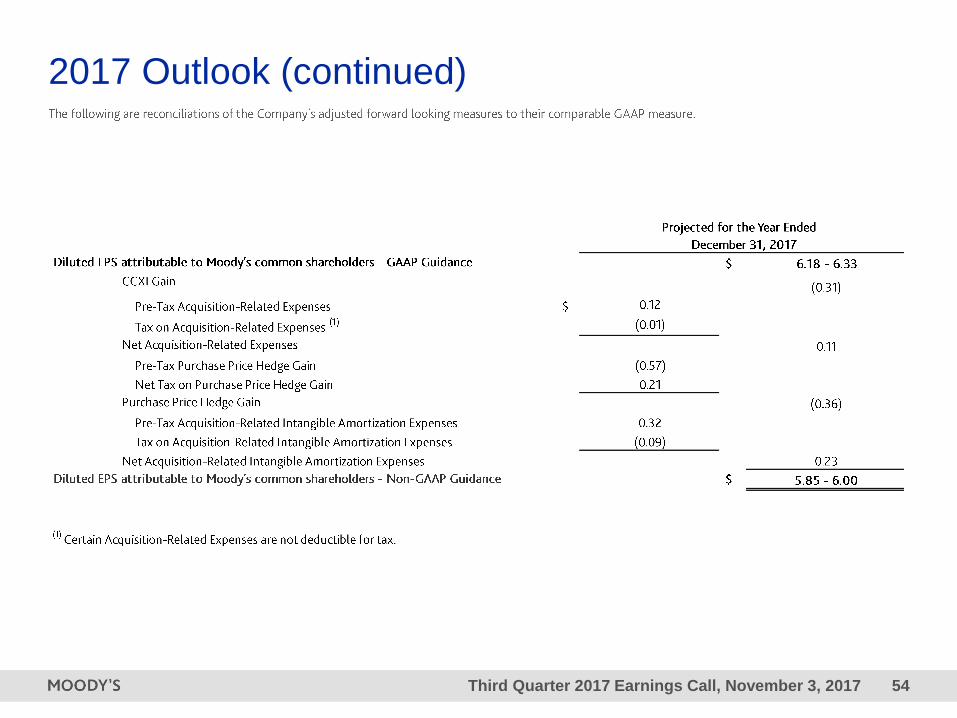
Diluted EPS2 $6.18 to $6.33
Adjusted Diluted EPS2,3 $5.85 to $6.00
Revenue increase in the low-teens percent range
Operating expenses decrease in the 20 to 25 percent range
Adjusted operating expenses4 increase in the low-double-digit percent range
Depreciation & amortization approximately $160 million
Free cash flow approximately $600 million
1 Refer to Table 12 – “2017 Outlook” in the press release for a full view of guidance.
2 Diluted EPS and adjusted diluted EPS ranges include an estimated $0.20 per share tax benefit due to the adoption of the new accounting standard for equity compensation.
3 Adjusted diluted EPS excludes $0.36 per share purchase price hedge gain, $0.31 per share CCXI gain, $0.23 per share related to amortization of all acquisition-related
intangibles, and $0.11 cents per share of Acquisition-Related Expenses.
4 Adjusted operating expense excludes 2016 settlement and restructuring charges and Acquisition-Related Expenses in 2017.

Third Quarter 2017 Earnings Call, November 3, 2017 29
Current 2017 Outlook (continued)
Changes to 2017 Full-Year Financial Outlook1
MIS Current Guidance as of November 3, 2017
Revenue increase in the low-teens percent range
U.S. increase in the low-double-digit percent range
Non-U.S. increase in high-teens percent range
Corporate Finance increase in the low-twenties percent range
Structured Finance increase approximately 10%
Financial Institutions increase in low-double-digit percent range
Public, Project & Infrastructure Finance approximately flat
1 Refer to Table 12 –“2017 Outlook” in the press release for a full review of guidance.

Third Quarter 2017 Earnings Call, November 3, 2017 30
Current 2017 Outlook (continued)
Changes to 2017 Full-Year Financial Outlook1
MA Current Guidance as of November 3, 2017
Revenue2,3 increase in the low-teens percent range
Non-U.S. increase in the low-twenties percent range
Research, Data & Analytics2,3 increase in the low-twenties percent range
1 Refer to Table 12 – “2017 Outlook” in the press release for a full review of guidance.
2 Excluding Bureau van Dijk, MA and RD&A revenues are still expected to increase in the high-single digit and low-double digit percent ranges, respectively.
3 Bureau van Dijk’s revenue contribution for full year 2017 will be reduced by an estimated $39 million ($14 million in the third quarter and an estimated $25 million in the fourth
quarter) as a result of a deferred revenue adjustment required as part of acquisition accounting.

4Q&ARay McDanielPresident and Chief Executive Officer
Linda Huber
Executive Vice President and Chief Financial Officer
Mark Almeida
President, Moody’s Analytics
Rob FauberPresident, Moody’s Investors Service
Third Quarter 2017 Earnings Call, November 3, 2017 32
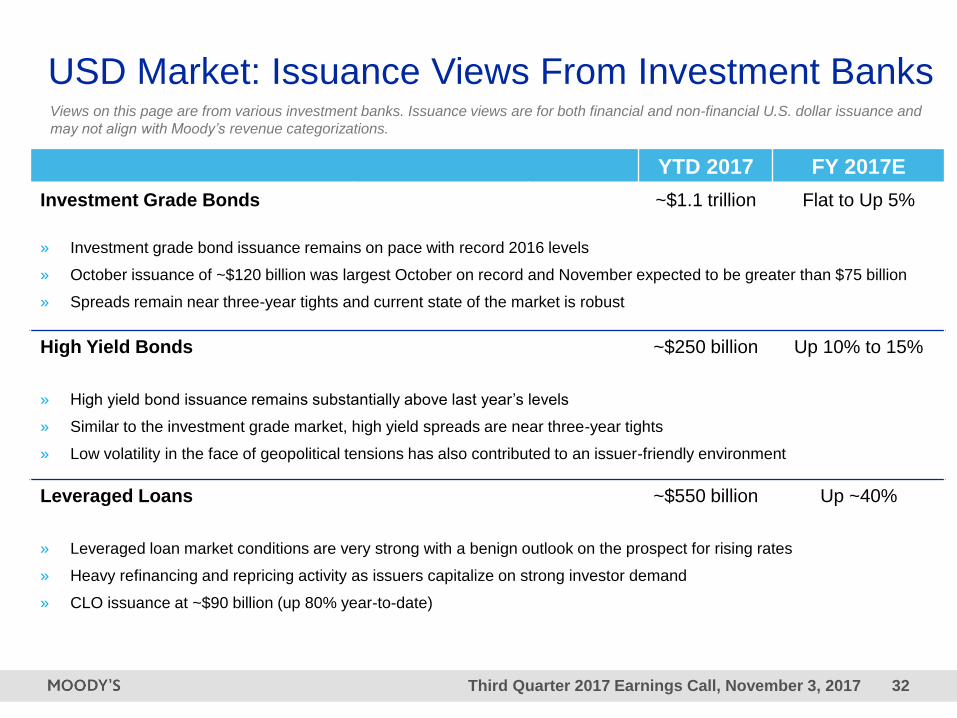
Views on this page are from various investment banks. Issuance views are for both financial and non-financial U.S. dollar issuance and
may not align with Moody’s revenue categorizations.
USD Market: Issuance Views From Investment Banks
YTD 2017 FY 2017E
Investment Grade Bonds ~$1.1 trillion Flat to Up 5%
» Investment grade bond issuance remains on pace with record 2016 levels
» October issuance of ~$120 billion was largest October on record and November expected to be greater than $75 billion
» Spreads remain near three-year tights and current state of the market is robust
High Yield Bonds ~$250 billion Up 10% to 15%
» High yield bond issuance remains substantially above last year’s levels
» Similar to the investment grade market, high yield spreads are near three-year tights
» Low volatility in the face of geopolitical tensions has also contributed to an issuer-friendly environment
Leveraged Loans ~$550 billion Up ~40%
» Leveraged loan market conditions are very strong with a benign outlook on the prospect for rising rates
» Heavy refinancing and repricing activity as issuers capitalize on strong investor demand
» CLO issuance at ~$90 billion (up 80% year-to-date)
Third Quarter 2017 Earnings Call, November 3, 2017 33
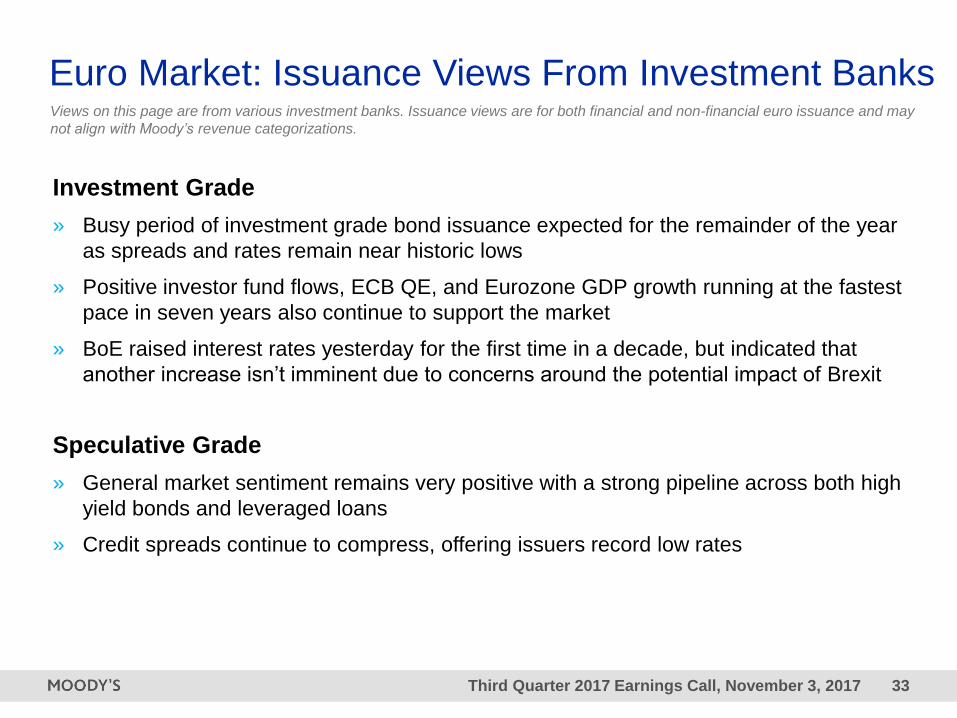
Euro Market: Issuance Views From Investment Banks
Investment Grade
» Busy period of investment grade bond issuance expected for the remainder of the year
as spreads and rates remain near historic lows
» Positive investor fund flows, ECB QE, and Eurozone GDP growth running at the fastest
pace in seven years also continue to support the market
» BoE raised interest rates yesterday for the first time in a decade, but indicated that
another increase isn’t imminent due to concerns around the potential impact of Brexit
Speculative Grade
» General market sentiment remains very positive with a strong pipeline across both high
yield bonds and leveraged loans
» Credit spreads continue to compress, offering issuers record low rates
Views on this page are from various investment banks. Issuance views are for both financial and non-financial euro issuance and may
not align with Moody’s revenue categorizations.
Third Quarter 2017 Earnings Call, November 3, 2017 34
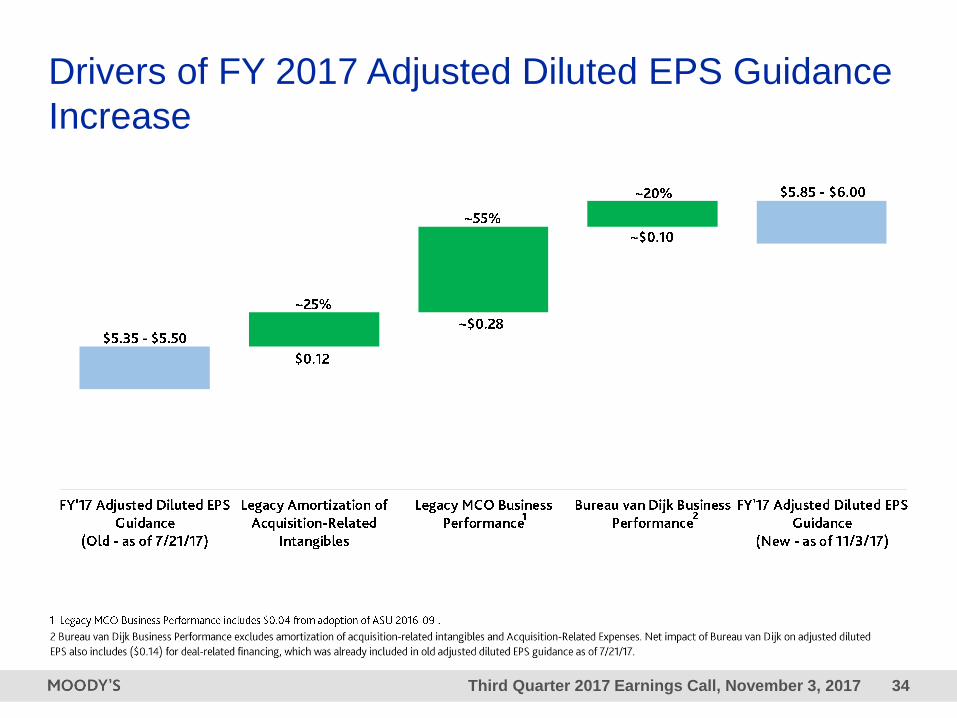
Drivers of FY 2017 Adjusted Diluted EPS Guidance
Increase

Third Quarter 2017 Earnings Call, November 3, 2017 35
Next Investor Day
Moody’s Corporation will hold its next Investor Day on February 28, 2018
in New York City. The event, which will be webcast live, will feature
presentations from management and showcase important aspects of the
Company’s business.
Third Quarter 2017 Earnings Call, November 3, 2017 36
Replay Details
» Available from 3:30pm (Eastern Time) November 3, 2017 until 3:30pm
(Eastern Time) December 2, 2017
» Telephone Details:
– US +1-888-203-1112
– Non-US +1-719-457-0820
– Passcode 5032731
» Webcast Details:
– Go to ir.moodys.com
– Click on “Events & Presentations”
– Click on the link for “3Q 2017 Earnings Conference Call”

Appendix
Third Quarter 2017 Earnings Call, November 3, 2017 38
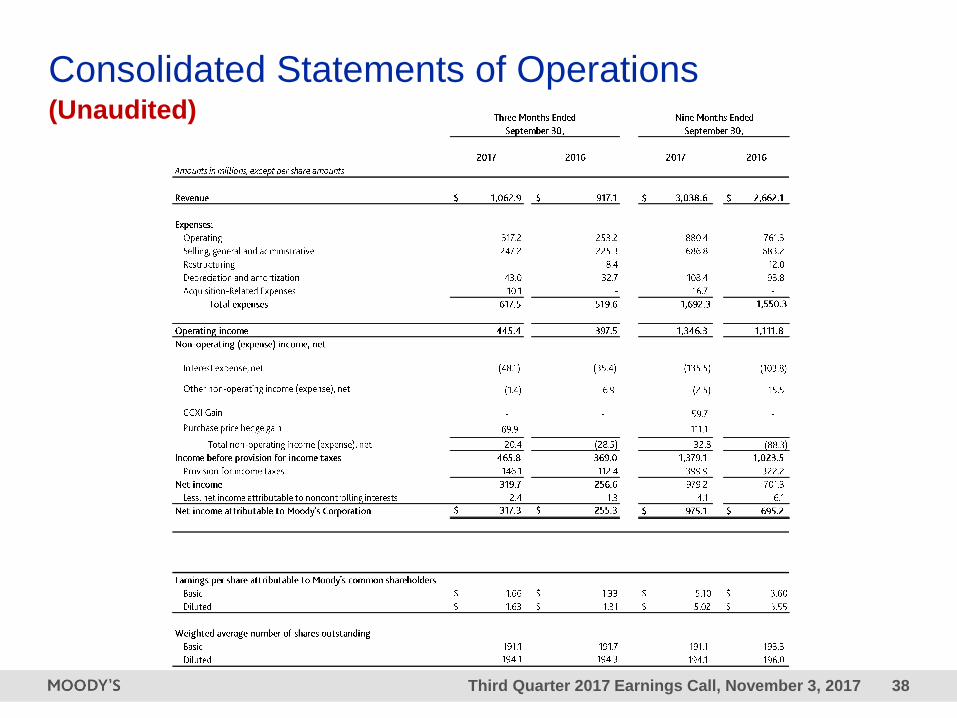
Consolidated Statements of Operations(Unaudited)
Third Quarter 2017 Earnings Call, November 3, 2017 39
Supplemental Revenue Information(Unaudited)
Third Quarter 2017 Earnings Call, November 3, 2017 40
Selected Consolidated Balance Sheet Data(Unaudited)
Third Quarter 2017 Earnings Call, November 3, 2017 41
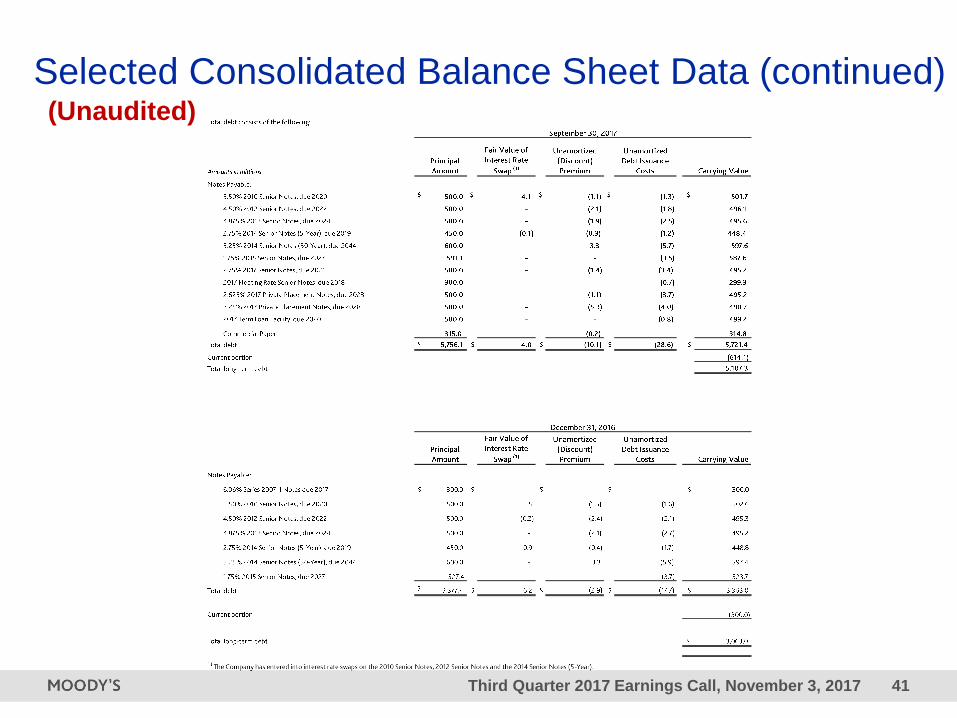
Selected Consolidated Balance Sheet Data (continued)(Unaudited)
Third Quarter 2017 Earnings Call, November 3, 2017 42
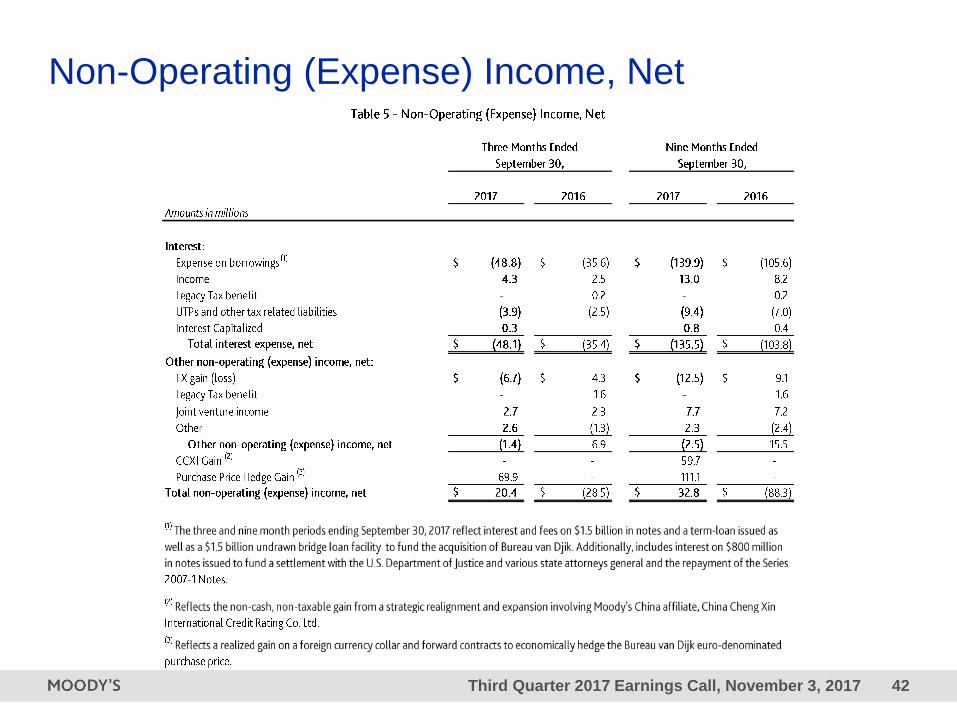
Non-Operating (Expense) Income, Net
Third Quarter 2017 Earnings Call, November 3, 2017 43
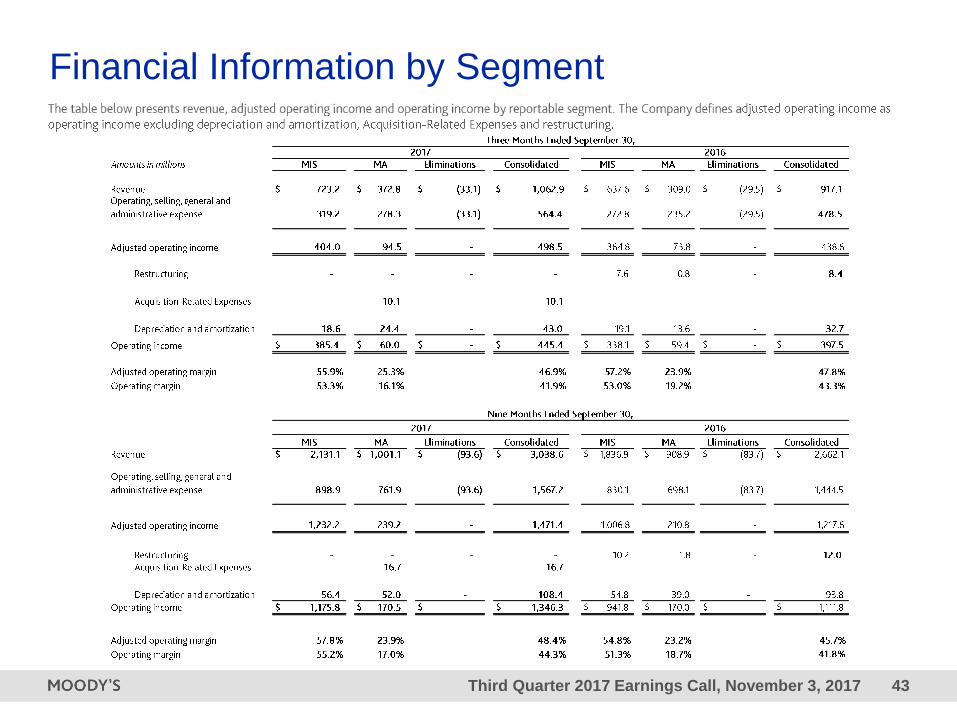
Financial Information by Segment
Third Quarter 2017 Earnings Call, November 3, 2017 44
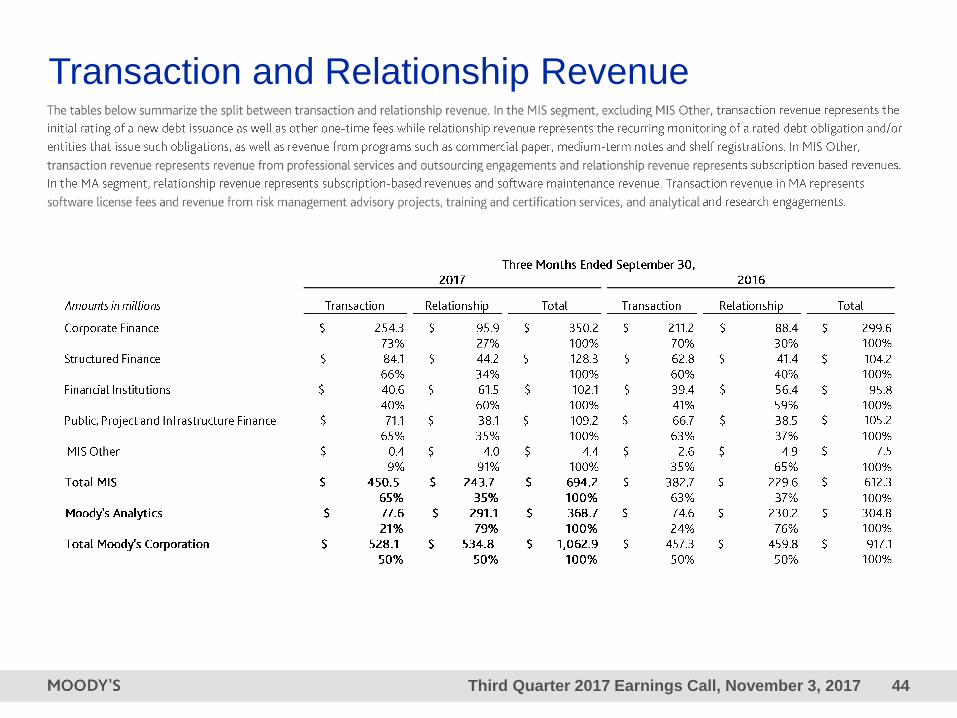
Transaction and Relationship Revenue
Third Quarter 2017 Earnings Call, November 3, 2017 45
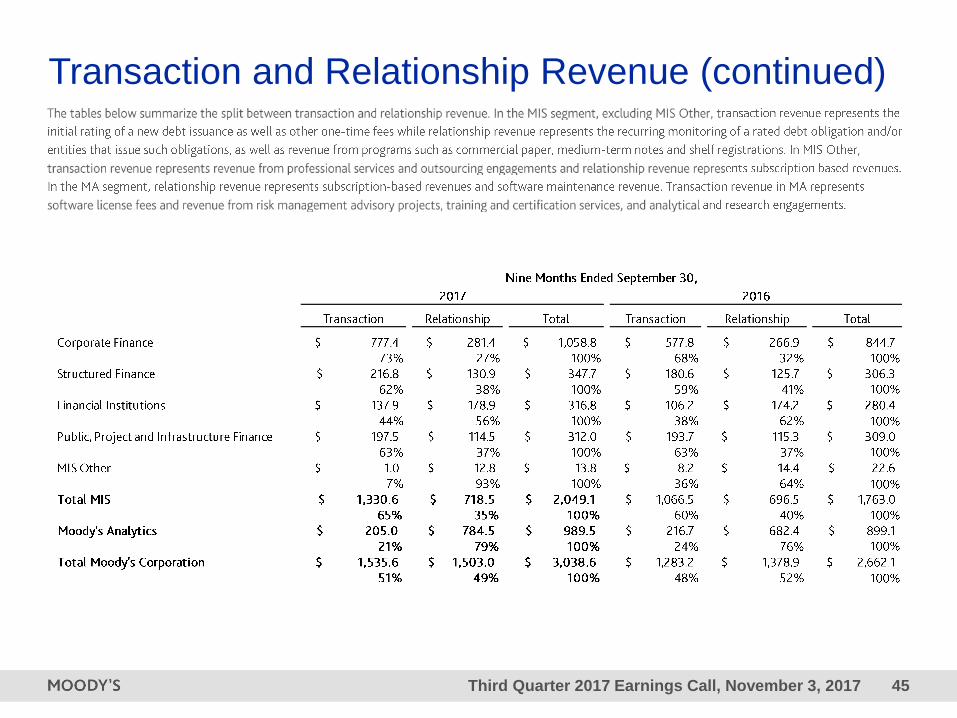
Transaction and Relationship Revenue (continued)
Third Quarter 2017 Earnings Call, November 3, 2017 46
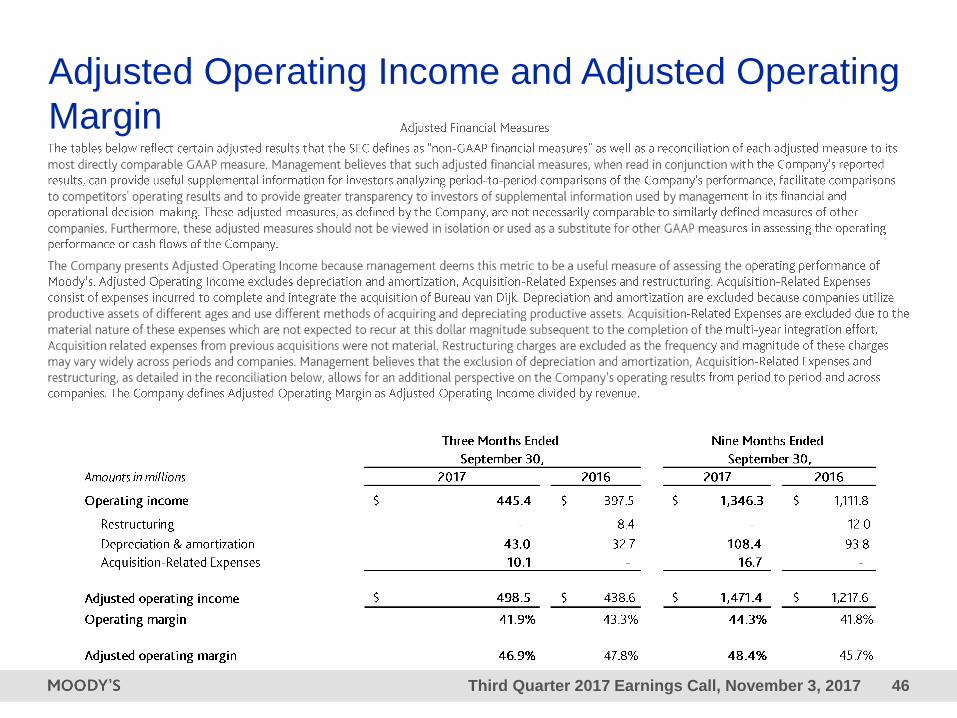
Adjusted Operating Income and Adjusted Operating
Margin
Third Quarter 2017 Earnings Call, November 3, 2017 47
Free Cash Flow

Third Quarter 2017 Earnings Call, November 3, 2017 48
Organic Revenue and Growth Measures
Third Quarter 2017 Earnings Call, November 3, 2017 49
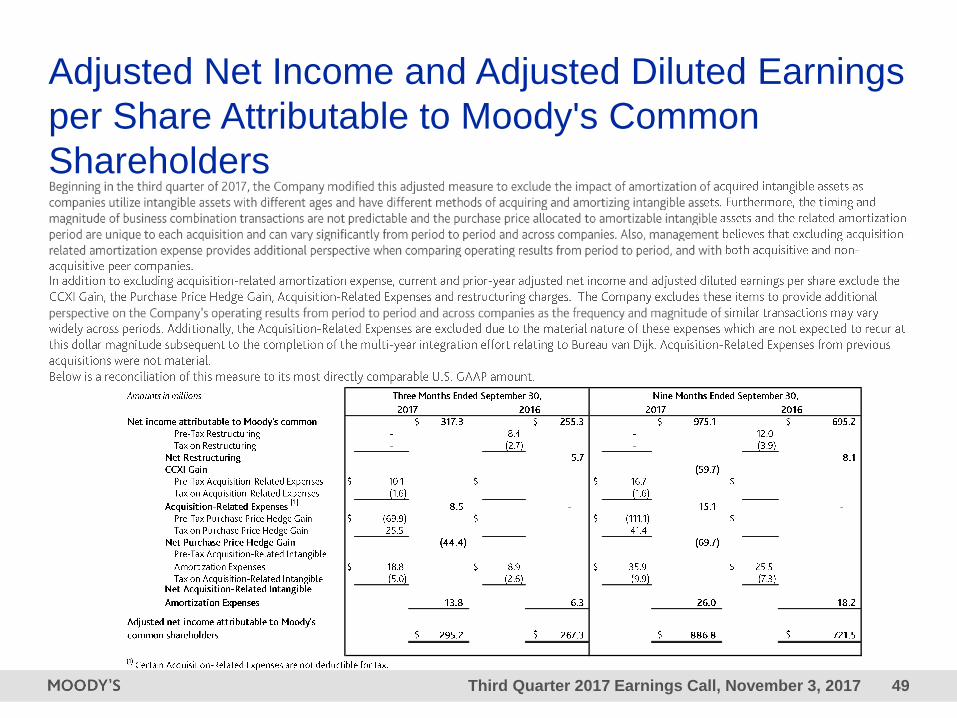
Adjusted Net Income and Adjusted Diluted Earnings
per Share Attributable to Moody's Common
Shareholders
Third Quarter 2017 Earnings Call, November 3, 2017 50
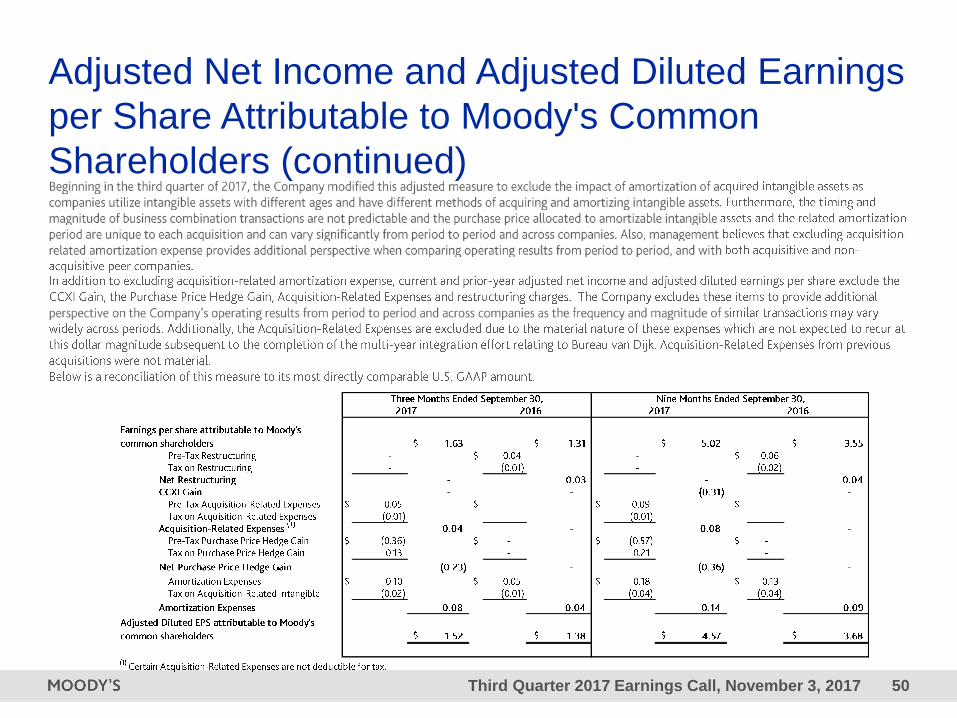
Adjusted Net Income and Adjusted Diluted Earnings
per Share Attributable to Moody's Common
Shareholders (continued)
Third Quarter 2017 Earnings Call, November 3, 2017 51
2017 Outlook

Third Quarter 2017 Earnings Call, November 3, 2017 52
2017 Outlook (continued)
Third Quarter 2017 Earnings Call, November 3, 2017 53
2017 Outlook (continued)
Third Quarter 2017 Earnings Call, November 3, 2017 54
2017 Outlook (continued)

Investor Relations
http://ir.moodys.com
moodys.com
Third Quarter 2017 Earnings Call, November 3, 2017 56
© 2016 Moody’s Corporation, Moody’s Investors Service, Inc., Moody’s Analytics, Inc. and/or their licensors
and affiliates (collectively, “MOODY’S”). All rights reserved.
CREDIT RATINGS ISSUED BY MOODY'S INVESTORS SERVICE, INC. AND ITS RATINGS AFFILIATES
(“MIS”) ARE MOODY’S CURRENT OPINIONS OF THE RELATIVE FUTURE CREDIT RISK OF ENTITIES,
CREDIT COMMITMENTS, OR DEBT OR DEBT-LIKE SECURITIES, AND CREDIT RATINGS AND
RESEARCH PUBLICATIONS PUBLISHED BY MOODY’S (“MOODY’S PUBLICATIONS”) MAY INCLUDE
MOODY’S CURRENT OPINIONS OF THE RELATIVE FUTURE CREDIT RISK OF ENTITIES, CREDIT
COMMITMENTS, OR DEBT OR DEBT-LIKE SECURITIES. MOODY’S DEFINES CREDIT RISK AS THE
RISK THAT AN ENTITY MAY NOT MEET ITS CONTRACTUAL, FINANCIAL OBLIGATIONS AS THEY
COME DUE AND ANY ESTIMATED FINANCIAL LOSS IN THE EVENT OF DEFAULT. CREDIT RATINGS
DO NOT ADDRESS ANY OTHER RISK, INCLUDING BUT NOT LIMITED TO: LIQUIDITY RISK, MARKET
VALUE RISK, OR PRICE VOLATILITY. CREDIT RATINGS AND MOODY’S OPINIONS INCLUDED IN
MOODY’S PUBLICATIONS ARE NOT STATEMENTS OF CURRENT OR HISTORICAL FACT. MOODY’S
PUBLICATIONS MAY ALSO INCLUDE QUANTITATIVE MODEL-BASED ESTIMATES OF CREDIT RISK
AND RELATED OPINIONS OR COMMENTARY PUBLISHED BY MOODY’S ANALYTICS, INC. CREDIT
RATINGS AND MOODY’S PUBLICATIONS DO NOT CONSTITUTE OR PROVIDE INVESTMENT OR
FINANCIAL ADVICE, AND CREDIT RATINGS AND MOODY’S PUBLICATIONS ARE NOT AND DO NOT
PROVIDE RECOMMENDATIONS TO PURCHASE, SELL, OR HOLD PARTICULAR SECURITIES.
NEITHER CREDIT RATINGS NOR MOODY’S PUBLICATIONS COMMENT ON THE SUITABILITY OF AN
INVESTMENT FOR ANY PARTICULAR INVESTOR. MOODY’S ISSUES ITS CREDIT RATINGS AND
PUBLISHES MOODY’S PUBLICATIONS WITH THE EXPECTATION AND UNDERSTANDING THAT EACH
INVESTOR WILL, WITH DUE CARE, MAKE ITS OWN STUDY AND EVALUATION OF EACH SECURITY
THAT IS UNDER CONSIDERATION FOR PURCHASE, HOLDING, OR SALE.
MOODY’S CREDIT RATINGS AND MOODY’S PUBLICATIONS ARE NOT INTENDED FOR USE
BY RETAIL INVESTORS AND IT WOULD BE RECKLESS AND INAPPROPRIATE FOR RETAIL
INVESTORS TO USE MOODY’S CREDIT RATINGS OR MOODY’S PUBLICATIONS WHEN MAKING AN
INVESTMENT DECISION. IF IN DOUBT YOU SHOULD CONTACT YOUR FINANCIAL OR OTHER
PROFESSIONAL ADVISER.
ALL INFORMATION CONTAINED HEREIN IS PROTECTED BY LAW, INCLUDING BUT NOT LIMITED TO,
COPYRIGHT LAW, AND NONE OF SUCH INFORMATION MAY BE COPIED OR OTHERWISE
REPRODUCED, REPACKAGED, FURTHER TRANSMITTED, TRANSFERRED, DISSEMINATED,
REDISTRIBUTED OR RESOLD, OR STORED FOR SUBSEQUENT USE FOR ANY SUCH PURPOSE, IN
WHOLE OR IN PART, IN ANY FORM OR MANNER OR BY ANY MEANS WHATSOEVER, BY ANY
PERSON WITHOUT MOODY’S PRIOR WRITTEN CONSENT.
All information contained herein is obtained by MOODY’S from sources believed by it to be accurate and
reliable. Because of the possibility of human or mechanical error as well as other factors, however, all
information contained herein is provided “AS IS” without warranty of any kind. MOODY'S adopts all
necessary measures so that the information it uses in assigning a credit rating is of sufficient quality and from
sources MOODY'S considers to be reliable including, when appropriate, independent third-party sources.
However, MOODY’S is not an auditor and cannot in every instance independently verify or validate
information received in the rating process or in preparing the Moody’s Publications.
To the extent permitted by law, MOODY’S and its directors, officers, employees, agents, representatives,
licensors and suppliers disclaim liability to any person or entity for any indirect, special, consequential, or
incidental losses or damages whatsoever arising from or in connection with the information contained herein
or the use of or inability to use any such information, even if MOODY’S or any of its directors, officers,
employees, agents, representatives, licensors or suppliers is advised in advance of the possibility of such
losses or damages, including but not limited to: (a) any loss of present or prospective profits or (b) any loss or
damage arising where the relevant financial instrument is not the subject of a particular credit rating assigned
by MOODY’S.
To the extent permitted by law, MOODY’S and its directors, officers, employees, agents, representatives,
licensors and suppliers disclaim liability for any direct or compensatory losses or damages caused to any
person or entity, including but not limited to by any negligence (but excluding fraud, willful misconduct or any
other type of liability that, for the avoidance of doubt, by law cannot be excluded) on the part of, or any
contingency within or beyond the control of, MOODY’S or any of its directors, officers, employees, agents,
representatives, licensors or suppliers, arising from or in connection with the information contained herein or
the use of or inability to use any such information.
NO WARRANTY, EXPRESS OR IMPLIED, AS TO THE ACCURACY, TIMELINESS, COMPLETENESS,
MERCHANTABILITY OR FITNESS FOR ANY PARTICULAR PURPOSE OF ANY SUCH RATING OR
OTHER OPINION OR INFORMATION IS GIVEN OR MADE BY MOODY’S IN ANY FORM OR MANNER
WHATSOEVER.
Moody’s Investors Service, Inc., a wholly-owned credit rating agency subsidiary of Moody’s Corporation
(“MCO”), hereby discloses that most issuers of debt securities (including corporate and municipal bonds,
debentures, notes and commercial paper) and preferred stock rated by Moody’s Investors Service, Inc. have,
prior to assignment of any rating, agreed to pay to Moody’s Investors Service, Inc. for appraisal and rating
services rendered by it fees ranging from $1,500 to approximately $2,500,000. MCO and MIS also maintain
policies and procedures to address the independence of MIS’s ratings and rating processes. Information
regarding certain affiliations that may exist between directors of MCO and rated entities, and between entities
who hold ratings from MIS and have also publicly reported to the SEC an ownership interest in MCO of more
than 5%, is posted annually at www.moodys.com under the heading “Investor Relations — Corporate
Governance — Director and Shareholder Affiliation Policy.”
Additional terms for Australia only: Any publication into Australia of this document is pursuant to the
Australian Financial Services License of MOODY’S affiliate, Moody’s Investors Service Pty Limited ABN 61
003 399 657AFSL 336969 and/or Moody’s Analytics Australia Pty Ltd ABN 94 105 136 972 AFSL 383569
(as applicable). This document is intended to be provided only to “wholesale clients” within the meaning of
section 761G of the Corporations Act 2001. By continuing to access this document from within Australia, you
represent to MOODY’S that you are, or are accessing the document as a representative of, a “wholesale
client” and that neither you nor the entity you represent will directly or indirectly disseminate this document or
its contents to “retail clients” within the meaning of section 761G of the Corporations Act 2001.
MOODY’S credit rating is an opinion as to the creditworthiness of a debt obligation of the issuer, not on the
equity securities of the issuer or any form of security that is available to retail investors. It would be reckless
and inappropriate for retail investors to use MOODY’S credit ratings or publications when making an
investment decision. If in doubt you should contact your financial or other professional adviser.
Additional terms for Japan only: Moody's Japan K.K. (“MJKK”) is a wholly-owned credit rating agency
subsidiary of Moody's Group Japan G.K., which is wholly-owned by Moody’s Overseas Holdings Inc., a
wholly-owned subsidiary of MCO. Moody’s SF Japan K.K. (“MSFJ”) is a wholly-owned credit rating agency
subsidiary of MJKK. MSFJ is not a Nationally Recognized Statistical Rating Organization (“NRSRO”).
Therefore, credit ratings assigned by MSFJ are Non-NRSRO Credit Ratings. Non-NRSRO Credit Ratings
are assigned by an entity that is not a NRSRO and, consequently, the rated obligation will not qualify for
certain types of treatment under US laws. MJKK and MSFJ are credit rating agencies registered with the
Japan Financial Services Agency and their registration numbers are FSA Commissioner (Ratings) No. 2
and 3 respectively.
MJKK or MSFJ (as applicable) hereby disclose that most issuers of debt securities (including corporate and
municipal bonds, debentures, notes and commercial paper) and preferred stock rated by MJKK or MSFJ (as
applicable) have, prior to assignment of any rating, agreed to pay to MJKK or MSFJ (as applicable) for
appraisal and rating services rendered by it fees ranging from JPY200,000 to approximately
JPY350,000,000.
MJKK and MSFJ also maintain policies and procedures to address Japanese regulatory requirements.