Embed Size (px)
Citation preview


Thomas Dreier / Jan Krämer / Rudi Studer / Christof Weinhardt (Eds.)
Information Management and Market EngineeringVol. II

Studies on eOrganisation and Market Engineering 11
Karlsruher Institut für Technologie
Herausgeber:Prof. Dr. Christof WeinhardtProf. Dr. Thomas DreierProf. Dr. Rudi Studer

Information Managementand Market Engineering
Vol. II
Thomas DreierJan KrämerRudi StuderChristof Weinhardt(Eds.)

KIT Scientific Publishing 2010 Print on Demand
ISSN 1862-8893ISBN 978-3-86644-589-5
Impressum
Karlsruher Institut für Technologie (KIT)KIT Scientific PublishingStraße am Forum 2D-76131 Karlsruhewww.ksp.kit.edu
KIT – Universität des Landes Baden-Württemberg und nationalesForschungszentrum in der Helmholtz-Gemeinschaft
Diese Veröffentlichung ist im Internet unter folgender Creative Commons-Lizenz publiziert: http://creativecommons.org/licenses/by-nc-nd/3.0/de/

Preface
At the Karlsruhe Institute of Technology (KIT), the Graduate School InformationManagement and Market Engineering (IME) which is financed by the GermanResearch Association (Deutsche Forschungsgemeinschaft, DFG), offers an inter-disciplinary doctoral program on the economic, technological and legal design ofinstitutions, services, systems and business models for electronic markets. Theexpressed aim of the Graduate School is to endow its doctoral students with aprofound interdisciplinary understanding of electronic markets and informationmanagement that enables them to pursue an outstanding career in academia aswell as industry. Since its foundation in April 2004, sixteen graduates have verysuccessfully completed the doctoral program of the Graduate School and went onto become professors themselves or hold key management positions in the industrytoday, providing proof for the Graduate School’s success in achieving its aim.
The research that is conducted in the Graduate School is directly applicable tothe large domain of electronic markets and information management and has tosteadily keep pace with technological progress. In 2006 the first volume of thisbook was published, which assembled an overview of the research that was andstill is ongoing in the Graduate School. The present and second volume shows theadvancements since then, but also points at new research fields that have recentlybeen explored. Altogether, sixteen research papers have been selected, refereedand compiled for this volume. They cover almost all relevant aspects of the fieldInformation Management and Market Engineering and demonstrate the intellectualchallenges in this domain.
In short, Information Management and Market Engineering comprises the structured,systematic and theoretically founded procedure of analyzing, designing, introducingand also quality assuring of electronic market platforms as well as their legalframework regarding simultaneously their market mechanisms and trading rules,systems, platforms and media, and their business models. This book is structuredin four parts, which reflect the different levels of this Market Engineering process.
Electronic markets often generate a tremendous amount of transactional dataand, on the other hand, react sensitively to exogenous informational influences. Inorder to analyze electronic markets, it is therefore indispensable to develop propermethods and tools which facilitate the (i) processing and structuring of this data,

VI Preface
(ii) extraction of the information content of this data, and (iii) analysis of the impactof this information on the market. The research papers in the first part of this bookare all concerned with this task of Market Information Processing and Analysis.
The second part comprises research papers on the Design of Market Mechanismsand Systems. In this core task of the Market Engineering process, new theoreticaldesigns are proposed that are believed to improve the performance of electronicmarkets. The market design can either influence market behavior directly, forexample through appropriate incentive mechanisms, or indirectly, for examplethrough new means of communication or interaction.
The influence of different theoretical designs on actual Market Interaction andBehavior is considered in the next level of the Market Engineering process, andexemplified by the research papers in the third part of this volume. In particularthe emotional processes of market participants, such as auction fever, are still notfully understood today. Some of the research papers in this part demonstrate howthese emotional processes can be measured and evaluate their influence on marketbehavior and design. The other papers evaluate theoretical market designs on thebasis of actually observed market behavior.
Finally, the papers in the fourth part consider various aspects of ElectronicMarket Regulation, i.e. the ongoing normative evaluation of present market designs.More specifically, market regulation seeks to ensure the long run functioning andeffectiveness of electronic markets. The regulatory issues that are covered in thispart range from the protection of intellectual property rights and personal data tothe stimulation and facilitation of information sharing.
However, these different perspectives on Market Engineering and InformationManagement are not treated separately. Each level of the market analysis is inputto and output of the Market Engineering process at the same time, and therebycontributes to the perennial effort of improving market design.
This advancements in Market Engineering and Information Management, whichare compiled in this book, have only been possible because the professors andstudents of the Graduate School have showed great effort and enthusiasm whileworking for a common goal. In doing so, old-fashioned boundaries between differ-ent departments and disciplines were broken-up, making the research and teachingprogram of the Graduate School truly interdisciplinary. While interdisciplinaryresearch also bears many challenges, this book is ample evidence that it can alsoprovide the researchers with great rewards.
Karlsruhe, Thomas DreierOctober 2010 Jan Kramer
Rudi StuderChristof Weinhardt
Contents
Part I Market Information Processing and Analysis
New Event Detection in Financial News AnalysisUta Losch, Rudi Studer, and Christof Weinhardt . . . . . . . . . . . . . . . . . . . . . . . . . . . . . . . 3
Towards a Benchmarking Framework for Financial Text MiningCaslav Bozic, Ryan Riordan, Detlef Seese, Christof Weinhardt . . . . . . . . . . . . . . . . . . . . 21
The Impact of Economic News on Information and Liquidity in ElectronicFutures TradingAndreas Storkenmaier, Ryan Riordan, Christof Weinhardt, Rudi Studer . . . . . . . . . . . . 37
Market Responses to the Introduction of Interactive Data: The Case ofXBRLS. Sarah Zhang, Christof Weinhardt, Ryan Riordan . . . . . . . . . . . . . . . . . . . . . . . . . . . . . 55
The Impact of the Yearly Emissions Announcement on CO2 Prices: AnEvent StudySteffen Hitzemann, Marliese Uhrig-Homburg, Karl-Martin Ehrhart . . . . . . . . . . . . . . . 63
Estimating Event-based Exponential Random Graph ModelsChristoph Stadtfeld, Andreas Geyer-Schulz, Karl-Heinz Waldmann . . . . . . . . . . . . . . . . 79
Part II Design of Market Mechanisms and Systems
A Bonus Mechanism to Stimulate Reciprocity in the Presence ofManipulated FeedbackJing Zhi Yue, Klemens Bohm, Karl-Martin Ehrhart . . . . . . . . . . . . . . . . . . . . . . . . . . . . . 97
Requirements for Formalizing Usage Policies of Web ServicesSebastian Speiser, Rudi Studer, Thomas Dreier . . . . . . . . . . . . . . . . . . . . . . . . . . . . . . . . . 107
A Feature-based Application Interface for Future NetworksHelge Backhaus, Martina Zitterbart . . . . . . . . . . . . . . . . . . . . . . . . . . . . . . . . . . . . . . . . . . . 125
VIII Contents
Part III Analysis of Market Interaction and Behavior
Investigating Auction FeverMarc T. P. Adam, Jan Kramer, Christof Weinhardt, Karl-Martin Ehrhart . . . . . . . . . . . 141
Anticipated Emotions in the Reference-Dependent Valuation of Gains andLossesLaura Goebes, Karl-Martin Ehrhart, Christof Weinhardt . . . . . . . . . . . . . . . . . . . . . . . . . 159
Consumer Perception of Time-Based PricingLukas Wiewiorra, Jan Kramer, Christof Weinhardt, Karl-Martin Ehrhart . . . . . . . . . . 179
Trading Development Rights: A Laboratory AssessmentJens E. Muller, Stefan Seifert, Karl-Martin Ehrhart . . . . . . . . . . . . . . . . . . . . . . . . . . . . . 191
Part IV Electronic Market Regulation
Electronic Markets and their Mechanisms as Intellectual PropertyTim Klumper, Thomas Dreier . . . . . . . . . . . . . . . . . . . . . . . . . . . . . . . . . . . . . . . . . . . . . . . . 211
Municipal Information – Amounts of Data but no Structure? An outlineover Legal Aspects of Informational Technologies Within Public EntitiesSimone Traub, Indra Spiecker gen. Dohmann . . . . . . . . . . . . . . . . . . . . . . . . . . . . . . . . . . . 229
How Design Principles can Govern the Knowledge Commons: ElinorOstrom and the Case of WikipediaKathrin Noack, Christof Weinhardt, Thomas Dreier . . . . . . . . . . . . . . . . . . . . . . . . . . . . . 243

List of Contributors
Marc T. P. AdamInstitute of Information Systems andManagementKarlsruhe Institute of Technology (KIT)[email protected]
Helge BackhausInstitute of TelematicsKarlsruhe Institute of Technology (KIT)[email protected]
Klemens BohmInstitute of Program Structures and DataOrganizationKarlsruhe Institute of Technology (KIT)[email protected]
Caslav BozicInstitute of Applied Informatics andFormal Description MethodsKarlsruhe Institute of Technology (KIT)[email protected]
Thomas DreierInstitute of Information and EconomicLawKarlsruhe Institute of Technology (KIT)[email protected]
Karl-Martin EhrhartInstitute of Economic Theory andStatisticsKarlsruhe Institute of Technology (KIT)[email protected]
Andreas Geyer-SchulzInstitute of Information Systems andManagementKarlsruhe Institute of Technology (KIT)[email protected]
Laura GoebesInstitute for Economic Theory andStatisticsKarlsruhe Institute of Technology (KIT)[email protected]
Steffen HitzemannChair of Financial Engineering andDerivativesKarlsruhe Institute of Technology (KIT)[email protected]
Tim KlumperInstitute of Information and EconomicLawKarlsruhe Institute of Technology (KIT)[email protected]
Jan KramerInstitute of Information Systems andManagementKarlsruhe Institute of Technology (KIT)[email protected]
Uta LoschInstitute of Applied Informatics andFormal Description MethodsKarlsruhe Institute of Technology (KIT)[email protected]

X List of Contributors
Jens E. MullerInstitute of Information Systems andManagementKarlsruhe Institute of Technology (KIT)[email protected]
Kathrin NoackInstitute of Information and EconomicLawKarlsruhe Institute of Technology (KIT)[email protected]
Ryan RiordanInstitute of Information Systems andManagementKarlsruhe Institute of Technology (KIT)[email protected]
Detlef SeeseInstitute of Applied Informatics andFormal Description MethodsKarlsruhe Institute of Technology (KIT)[email protected]
Stefan SeifertInstitute of Information Systems andManagementKarlsruhe Institute of Technology (KIT)[email protected]
Sebastian SpeiserKarlsruhe Service Research InstituteKarlsruhe Institute of Technology (KIT)[email protected]
Indra Spiecker gen. DohmannInstitute of Information and EconomicLawKarlsruhe Institute of Technology (KIT)[email protected]
Christoph StadtfeldInstitute of Information Systems andManagementKarlsruhe Institute of Technology (KIT)[email protected]
Andreas StorkenmaierInstitute of Information Systems andManagementKarlsruhe Institute of Technology (KIT)[email protected]
Rudi StuderInstitute of Applied Informatics andFormal Description MethodsKarlsruhe Institute of Technology (KIT)[email protected]
Simone TraubInstitute of Information and EconomicLawKarlsruhe Institute of Technology (KIT)[email protected]
Marliese Uhrig-HomburgChair of Financial Engineering andDerivativesKarlsruhe Institute of Technology (KIT)[email protected]
Karl-Heinz WaldmannInstitute of Operations ResearchKarlsruhe Institute of Technology (KIT)[email protected]
Christof WeinhardtInstitute of Information Systems andManagementKarlsruhe Institute of Technology (KIT)[email protected]
Lukas WiewiorraInstitute of Information Systems andManagementKarlsruhe Institute of Technology (KIT)[email protected]
Jing Zhi YueInstitute of Program Structures and DataOrganizationKarlsruhe Institute of Technology (KIT)[email protected]

List of Contributors XI
S. Sarah ZhangInstitute of Information Systems andManagementKarlsruhe Institute of Technology (KIT)[email protected]
Martina ZitterbartInstitute of TelematicsKarlsruhe Institute of Technology (KIT)[email protected]


Part I
Market Information Processing and Analysis

New Event Detection in Financial News Analysis
Uta Losch1, Rudi Studer1, and Christof Weinhardt2
1 Institute of Applied Informatics and Formal Description Methods, KITuta.loesch, [email protected]
2 Institute of Information Systems and Management, [email protected]
Summary. Traders in financial markets commonly have to face an information overload,which is partly due to a continuously arriving stream of news which contains informationon events which may influence the markets. In this paper, we present a news processingframework which allows to collect news from various sources and to present them tothe user in an aggregated form. An important aspect of this framework is a New EventDetection component, which is responsible for recognizing new events and for clusteringnews dealing with the same event. The design of this component will be studied in moredetail: a general framework for New Event Detection will be presented which can beconfigured to implement a broad variety of concrete systems, including most state-of-the-artsystems along with a detailed study of the state of the art in this field.
1 Introduction
Traders and investors in financial markets are confronted with the problem that toomuch information is available from various, heterogenuous sources like newswires,forums, blogs, and collaborative tools. In order to make accurate trading decisions,traders have to be supported in finding and assessing relevant information efficientlysuch that they can react to new information in a timely manner.
In contrast to other domains, information and especially the possibility to makeprofit based on it are extremly transient in financial markets. In fact, it is doubtedwhether there is at all a possibility of profiting from having information that othersdo not have: The Efficient Market Hypothesis (Fama (1970)) states that it should notbe possible to outperform the market, as the stock prices always reflect all theinformation which is currently available. However, the Efficient Market Hypothesisis a theoretical model which has been doubted by behavioural economists over thelast years. Still, it seems intuitive that chances of profiting from new informationare the higher the faster it is reacted upon after its publication.
User support in this context may include:
• Collection of news from various sources: News are published on a multitude of websites, which not only include news sites such as Financial Times, Reuters, or
4 Uta Losch, Rudi Studer, and Christof Weinhardt
the Wall Street Journal, but also personal and collaborative websites, especiallyblogs, and message boards. Support in the collection of news can be providedby crawling a set of relevant sites for new information.• Clustering/aggregation of news: The same events will be reported by several
sources, and the same source may publish several messages on the same event.The goal is to identify clusters of news which report on the same event. Thisis particularly important as traders are especially interested in events that theyhave not read about before.• Ranking of news: Once, the news have been aggregated, they should be ranked
such that those which are most important to the trader are made more prominent.Relevance and importance of a piece of information for the user depends onseveral aspects: Does the information concern some company that the user isinterested in? Does the user already know about the event that occured? Howmuch is the information expected to influence the price of stocks held by theuser?
A lot of research has already been carried out on these aspects. In the following,we will present a framework for news analysis in a financial context. In thesubsequent sections we will then focus on some specific aspects of this framework.
2 A Framework for Financial News Analysis
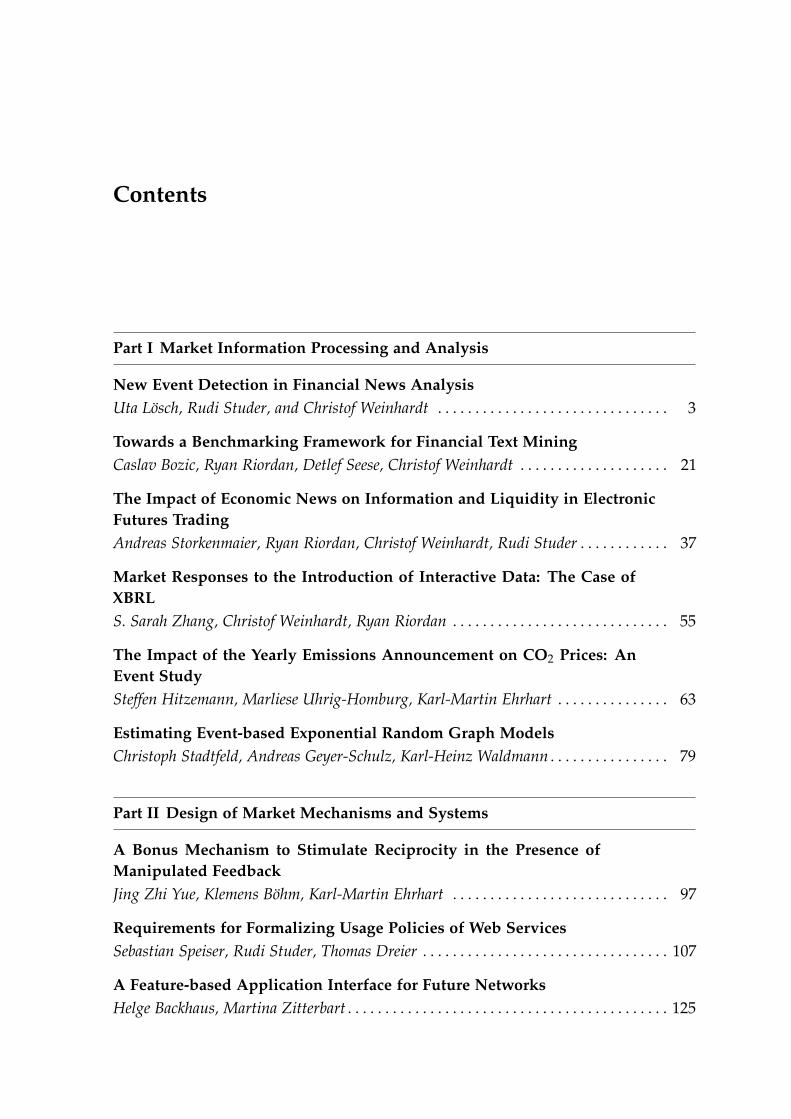
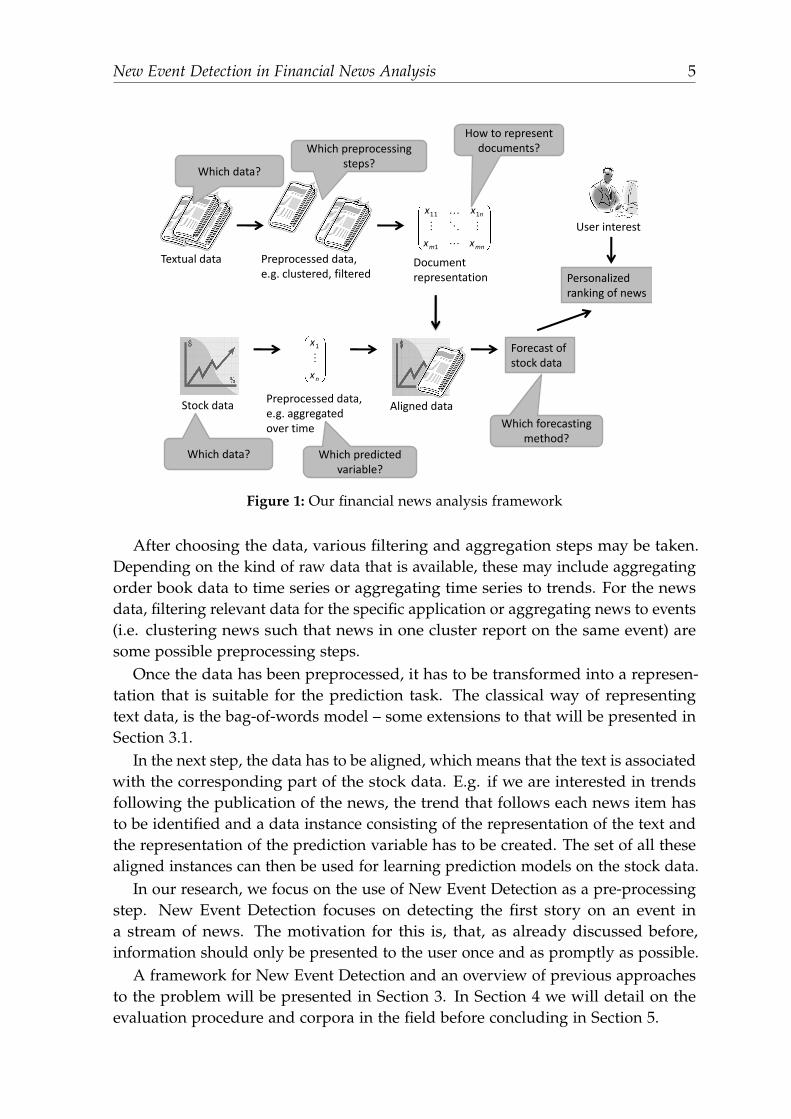
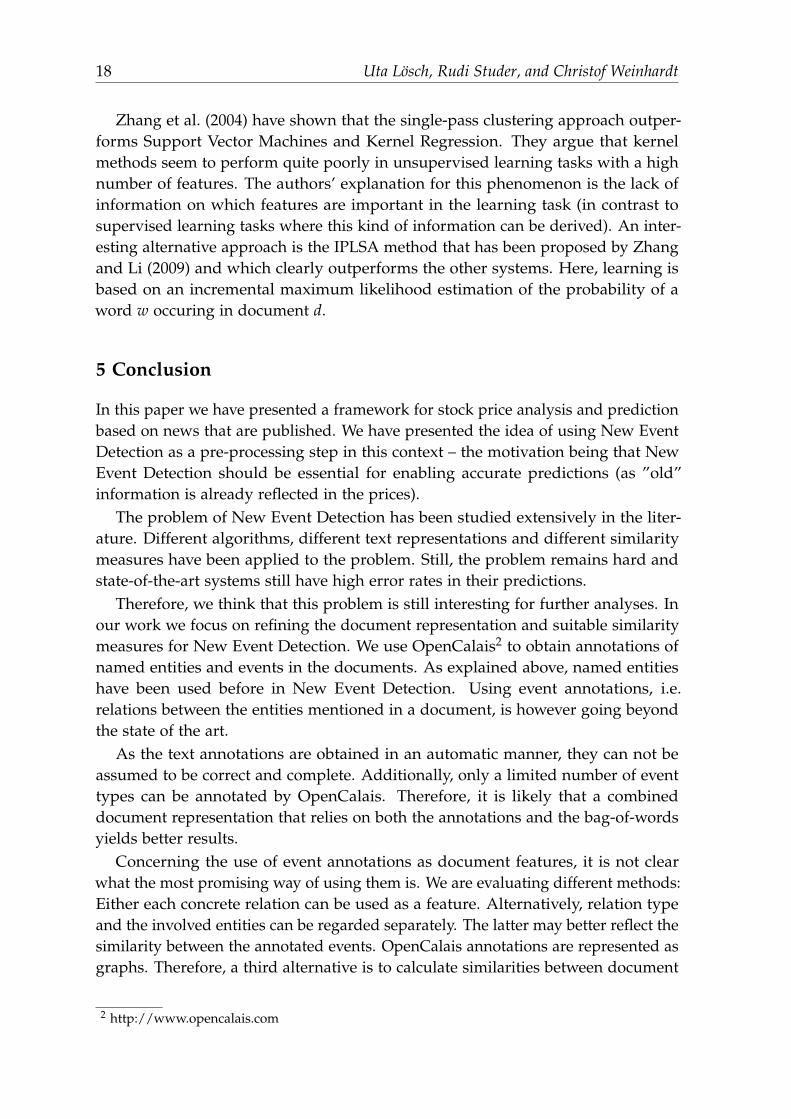
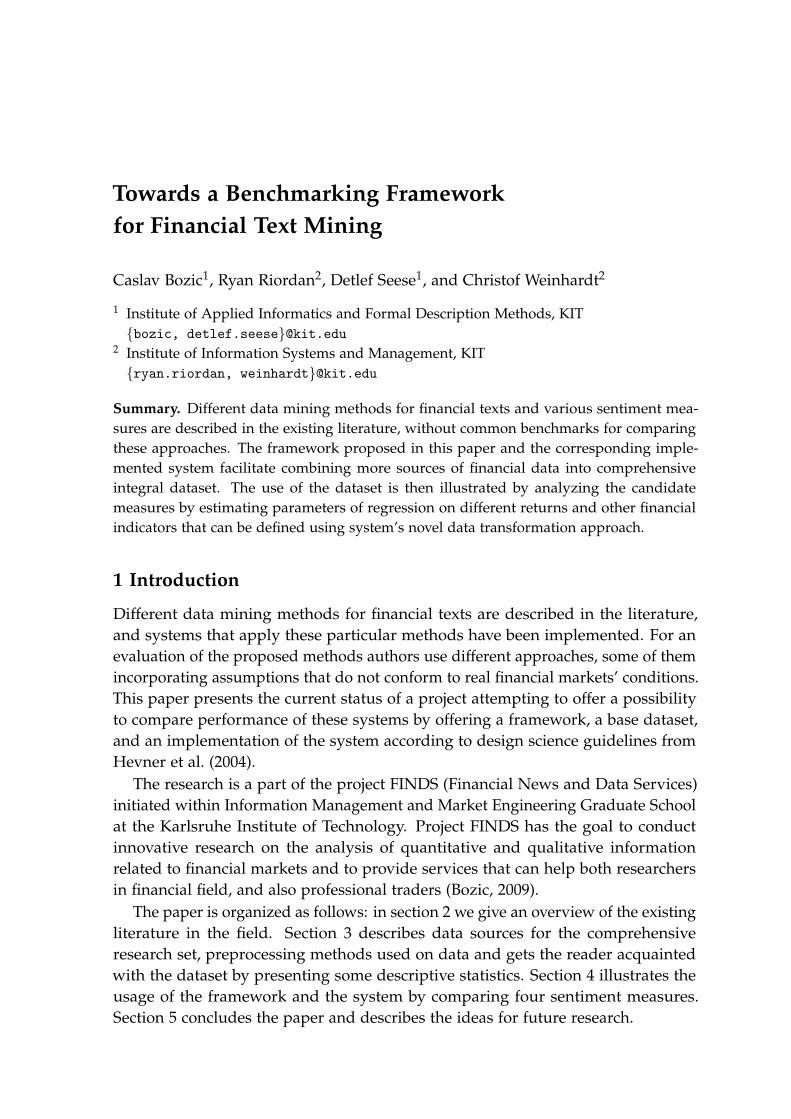
The goal of analysis of financial news is to help traders make informed tradingdecisions. Therefore, methods of finding the information that is important for auser in a specific situation are needed. Identifying the important information iscarried out in a set of analysis steps, which are presented in Figure 1.
Given input data, which consists of textual – news – data on the one hand and ofstock data on the other hand, the goal is to predict the further development of thestock market and to assess whether a specific user might be interested in a specificnews item that has been published.
The system thus has to combine the numeric stock data and the news dataand make predictions based on this combination. In order to make this kind ofprediction, preprocessing is needed to obtain suitable representations of the dataand to aggregate and filter the data. Useful preprocessing steps for the textual datamight include filtering stories that report information that has not been availablebefore or stories that concern topics which the user is interested in.
This kind of process requires many design decisions. The first step is to choosethe data on which the system should operate. This means focusing on a specific setof stocks and on a specific set of news sources. Possible news sources include newstickers (e.g. Reuters), news portals (e.g. Google news), blogs, message boards andcollaborative tools. For the financial data, some kind of stock data is needed. Thiscan be available in form of order book data, but also as time series of stock prices.
New Event Detection in Financial News Analysis 5
Textual data
Stock data
Preprocessed data,e.g. clustered, filtered
mnm
n
xx
xx
1
111
Documentrepresentation
nx
x
1
Preprocessed data,e.g. aggregated over time
Aligned data
Forecast ofstock data
Which data?
Which data?
Which preprocessingsteps?
How to representdocuments?
Which predictedvariable?
Which forecastingmethod?
User interest
Personalizedranking of news
Figure 1: Our financial news analysis framework
After choosing the data, various filtering and aggregation steps may be taken.Depending on the kind of raw data that is available, these may include aggregatingorder book data to time series or aggregating time series to trends. For the newsdata, filtering relevant data for the specific application or aggregating news to events(i.e. clustering news such that news in one cluster report on the same event) aresome possible preprocessing steps.
Once the data has been preprocessed, it has to be transformed into a represen-tation that is suitable for the prediction task. The classical way of representingtext data, is the bag-of-words model – some extensions to that will be presented inSection 3.1.
In the next step, the data has to be aligned, which means that the text is associatedwith the corresponding part of the stock data. E.g. if we are interested in trendsfollowing the publication of the news, the trend that follows each news item hasto be identified and a data instance consisting of the representation of the text andthe representation of the prediction variable has to be created. The set of all thesealigned instances can then be used for learning prediction models on the stock data.
In our research, we focus on the use of New Event Detection as a pre-processingstep. New Event Detection focuses on detecting the first story on an event ina stream of news. The motivation for this is, that, as already discussed before,information should only be presented to the user once and as promptly as possible.
A framework for New Event Detection and an overview of previous approachesto the problem will be presented in Section 3. In Section 4 we will detail on theevaluation procedure and corpora in the field before concluding in Section 5.
6 Uta Losch, Rudi Studer, and Christof Weinhardt
3 New Event Detection
The problem of New Event Detection (NED) – also known as First-Story Detection(FSD) – is defined in the Topic Detection and Tracking (TDT) challenge Fiscus andDoddington (2002): Given a stream of news arriving in chronological order, a TDTsystem must group or cluster articles that discuss the same event in the news stream.NED is one of the sub-tasks of TDT and deals with identifying those stories in anews stream which discuss novel news events. The decision whether a text reportson a new event or not is made by considering only documents which have arrivedprior to the current document. Thus, the system has to adhere to the temporalconstraints of a real-time news stream. A first study on this topic has been done byAllan et al. (1998).
Basically, the problem of New Event Detection can be seen as an outlier detectiontask. In general, the goal of outlier detection is to find points in a dataset whichhave a huge distance to the rest of the data. In New Event Detection, if the newdocument is identified to be different from the older documents, it should be markedas new, otherwise as old. Outlier Detection can be described as a supervised or anunsupervised learning task. The same holds for New Event Detection.
The description of the New Event Detection task as an unsupervised learningtask is as an incremental clustering problem. For a stream of training documentsx1, . . . , xn ∈ D,where D is the document space, and the clusters yi ∈ Y , where Yis the set of clusters that correspond to topics, to which they belong, the goal is todetermine a clustering function c : D → Y that accurately clusters the data. In orderto achieve an incremental clustering, c has to be defined such that c(xi) = φ(xi, Mi−1)
where Mi is the model after clustering documents x1, . . . , xi.An alternative formulation of the New Event Detection problem is as a classifica-
tion problem, i.e. as a supervised learning task. For a stream of training documentsx1, . . . , xn ∈ D, the goal is to find a function f : D → new, old that accuratelylabels the data.
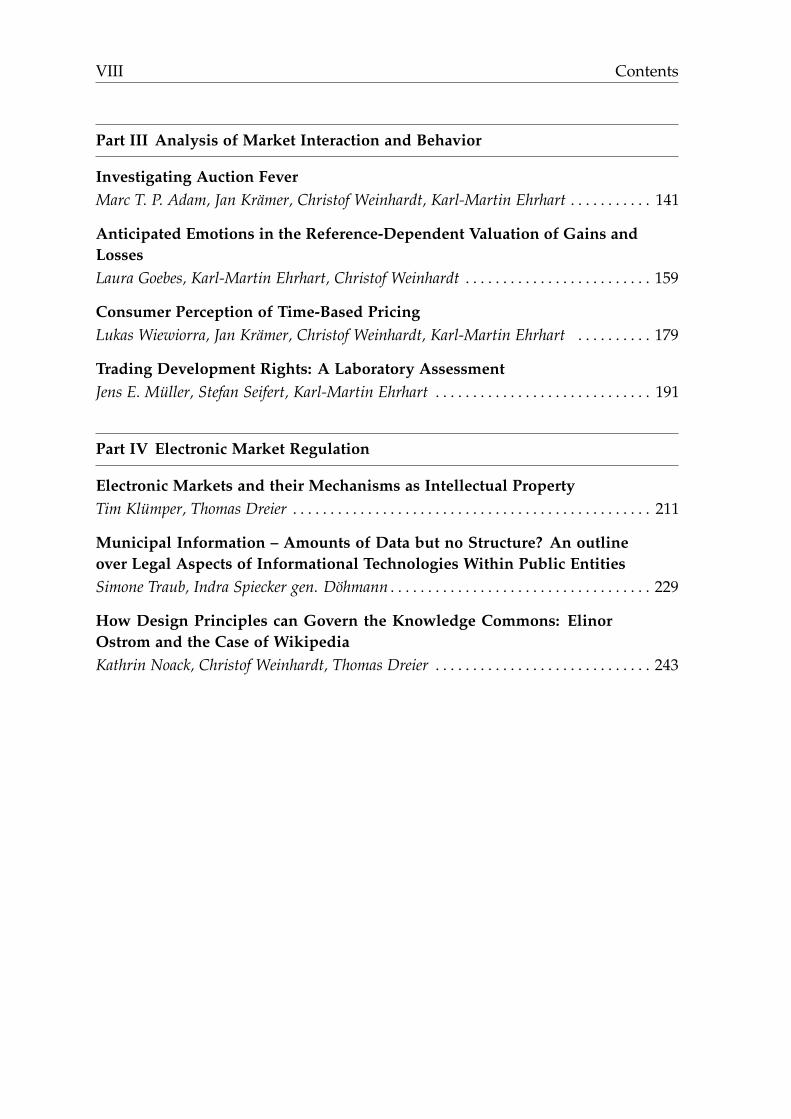
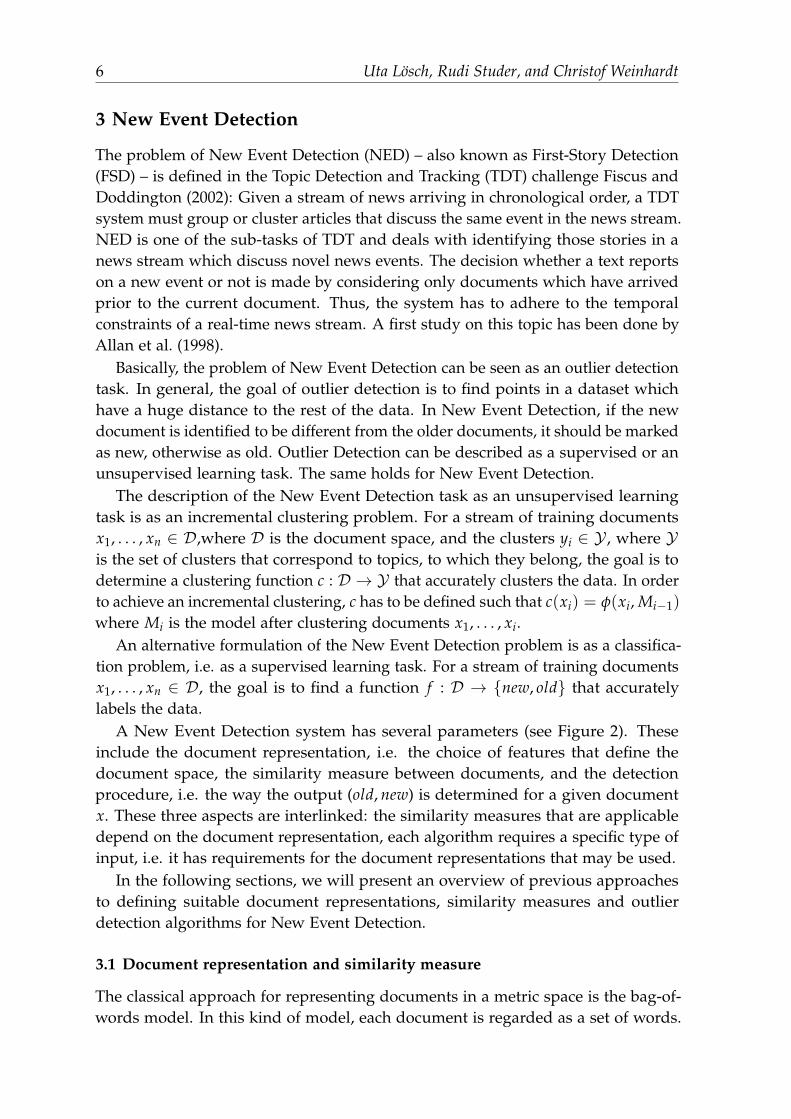
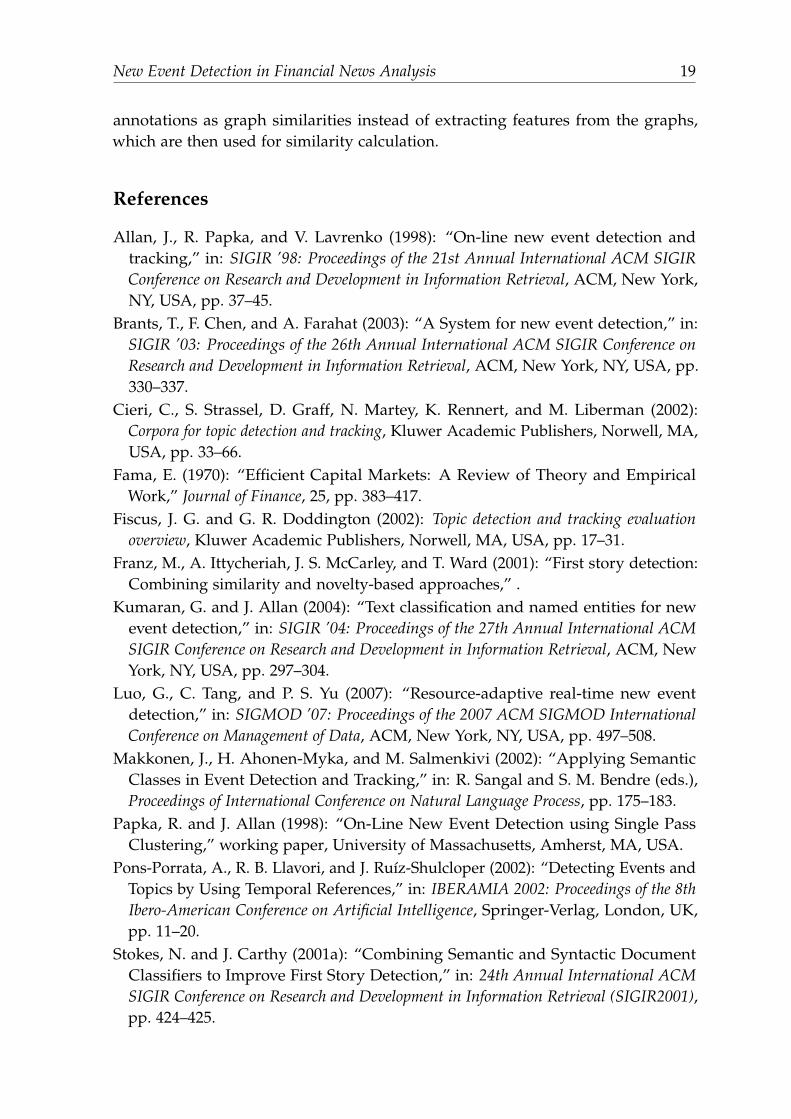
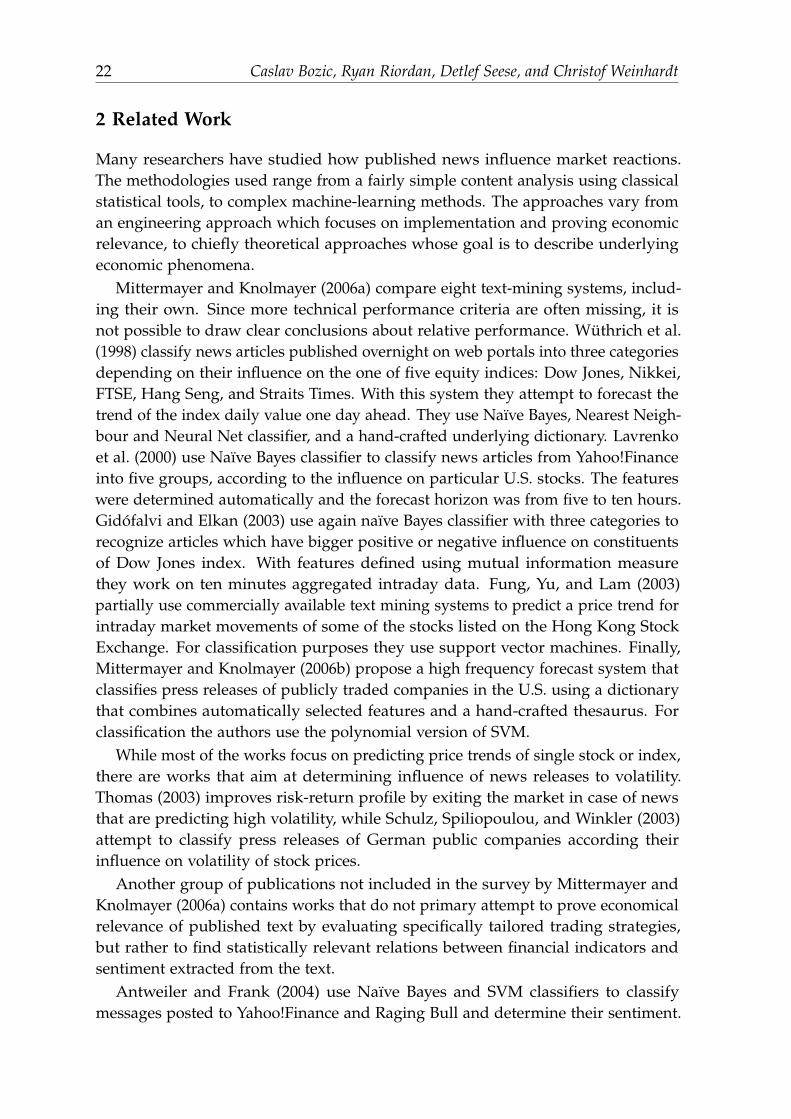
A New Event Detection system has several parameters (see Figure 2). Theseinclude the document representation, i.e. the choice of features that define thedocument space, the similarity measure between documents, and the detectionprocedure, i.e. the way the output (old, new) is determined for a given documentx. These three aspects are interlinked: the similarity measures that are applicabledepend on the document representation, each algorithm requires a specific type ofinput, i.e. it has requirements for the document representations that may be used.
In the following sections, we will present an overview of previous approachesto defining suitable document representations, similarity measures and outlierdetection algorithms for New Event Detection.
3.1 Document representation and similarity measure
The classical approach for representing documents in a metric space is the bag-of-words model. In this kind of model, each document is regarded as a set of words.
New Event Detection in Financial News Analysis 7
nx
x
1
Outlier Detection
Similarity
Text representation new, old
Figure 2: New Event Detection Framework
Each term that occurs in the document set defines a dimension in the documentspace. Common preprocessing steps are stemming (unifying different forms ofthe same term, e.g. singular and plural) and stopword removal (eliminating verycommon words with little meaning, like and or or). Additional features may bedefined; one example is introducing additional features for named entity types(e.g. a feature company which has a positive feature weight, if a company name iscontained in the text). Other approaches try to combine synonyms in one dimensionor to disambiguate between different senses of the same term.
Once the dimensions of the feature space are defined, a weight has to be associ-ated with each dimension. Each document is thus represented as a vector in thedocument space. There are different approaches for defining the weight of a featurein a document:
• Boolean weighting. A feature has weight 1 if the term it represents is present inthe text, 0 otherwise: weightwd = 1 if term w occurs in document d, weightwd = 0otherwise.• Term frequency. The weight of each feature is determined by the number of times
the represented term w is present in the document d:
weightwd =f reqwd
∑k∈T f reqkd
where T is the set of all terms in the document set.• Term frequency inverse document frequency (TFIDF). Term frequency is normal-
ized by document frequency in this approach, where document frequency isthe number of documents which contain the term:weightwd = t fwd ∗ id fw =
f reqwd∑k∈T f reqw,d log |D|nw
where D is the set of documents and nw is the set of docu-ments containing w. The idea of this adaptation is that terms that occur inmany documents are less meaningful and distinctive than terms which are onlycontained in a few documents.
Various similarity measures have been defined on bag-of-word vectors. The mostprominent one is cosine similarity, which defines the similarity of two documentsby the cosine of the angle between the feature vectors of the documents. Thus,
8 Uta Losch, Rudi Studer, and Christof Weinhardt
simcos(d1, d2) =d1d2
||d1||||d2||=
∑w∈T weightw,d1 ∑w∈T weightw,d2√∑w∈T weight2
w,d1
√∑w∈T weight2
w,d2
However, for New Event Detection it seems that the Hellinger distance yieldsbetter results Brants et al. (2003):
simHellinger(d1, d2) = ∑w∈T
√weightwd1
∑k∈T weightkd1
∗weightwd2
∑k∈T weightkd1
Several extensions to these basic models have been considered in New EventDetection. These will be presented in the following paragraphs.
Incremental TFIDF
The TFIDF measure is commonly used in text mining and information retrieval,however, it is not directly applicable in New Event Detection. The problem is thatinverse document frequencies (IDF) would have to be recalculated every time a newdocument is looked at. This recalculation would be by far too expensive. Therefore,an estimate of the overall DF measure is generated based on the documents thathave already been published. To increase efficiency, IDF measures are not updatedafter every document, but only after each k documents. The following incrementalIDF measure is obtained for each word w:
d ft(w) = d ft−1(w) + d fDt(w) (1)
where Dt represents the set of documents received at time t, d fDt(w) is the numberof documents in Dt in which w occurs and d ft(w) is the number of documents inwhich w occurs before time t (Brants et al. (2003), citeyang1998.
Time decay models
News on a specific event usually occur close in time. This means that if a messagethat is similar to a previous one, is released long after release of the earlier message,the probability of the two texts reporting on the same event is small. Therefore,many approaches adapt the similarity of two documents over time. That means thatthe similarity of two documents is smaller if more time has passed between theirpublication. There are different approaches for this kind of decay:
The simplest model is that of using a time window, which has e.g. been used byYang et al. (1999):
simwin(d1, d2) =
sim(d1, d2) age < m
0 else
Thereby, age is the period that has passed between publication of d1 and publicationof d2 and m is the size of the time window.
New Event Detection in Financial News Analysis 9
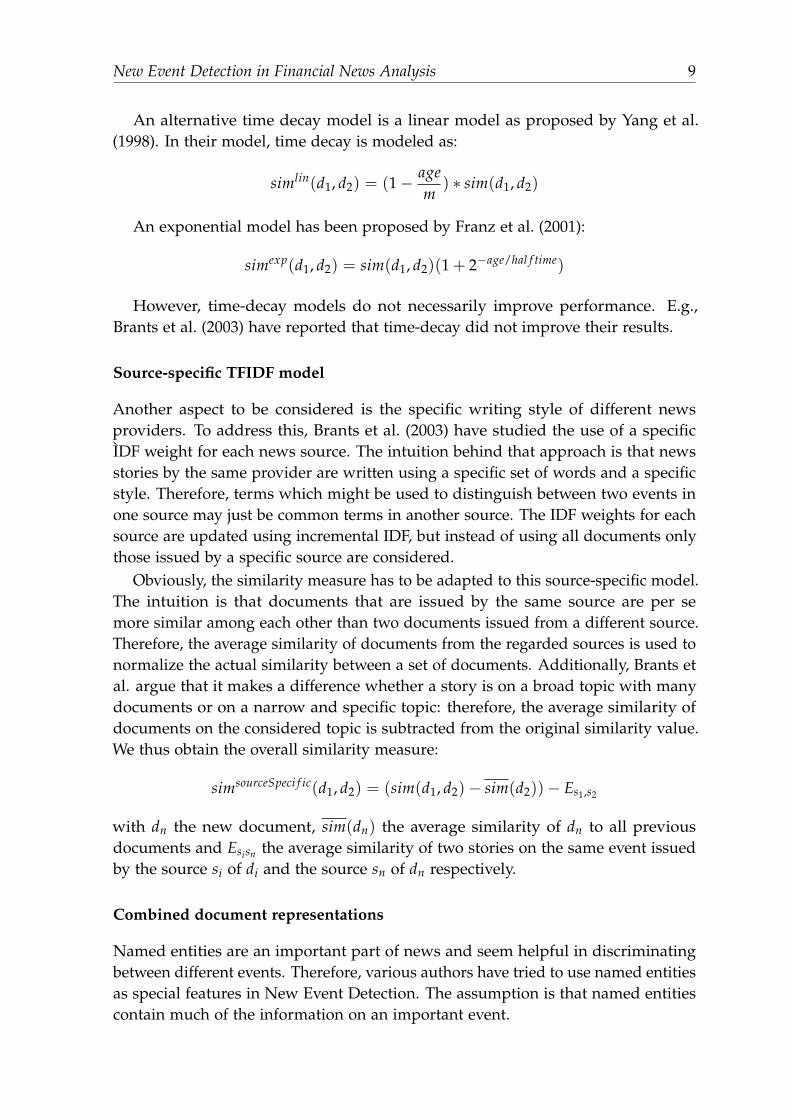
An alternative time decay model is a linear model as proposed by Yang et al.(1998). In their model, time decay is modeled as:
simlin(d1, d2) = (1− agem
) ∗ sim(d1, d2)
An exponential model has been proposed by Franz et al. (2001):
simexp(d1, d2) = sim(d1, d2)(1 + 2−age/hal f time)
However, time-decay models do not necessarily improve performance. E.g.,Brants et al. (2003) have reported that time-decay did not improve their results.
Source-specific TFIDF model
Another aspect to be considered is the specific writing style of different newsproviders. To address this, Brants et al. (2003) have studied the use of a specificIDF weight for each news source. The intuition behind that approach is that newsstories by the same provider are written using a specific set of words and a specificstyle. Therefore, terms which might be used to distinguish between two events inone source may just be common terms in another source. The IDF weights for eachsource are updated using incremental IDF, but instead of using all documents onlythose issued by a specific source are considered.
Obviously, the similarity measure has to be adapted to this source-specific model.The intuition is that documents that are issued by the same source are per semore similar among each other than two documents issued from a different source.Therefore, the average similarity of documents from the regarded sources is used tonormalize the actual similarity between a set of documents. Additionally, Brants etal. argue that it makes a difference whether a story is on a broad topic with manydocuments or on a narrow and specific topic: therefore, the average similarity ofdocuments on the considered topic is subtracted from the original similarity value.We thus obtain the overall similarity measure:
simsourceSpeci f ic(d1, d2) = (sim(d1, d2)− sim(d2))− Es1,s2
with dn the new document, sim(dn) the average similarity of dn to all previousdocuments and Esisn the average similarity of two stories on the same event issuedby the source si of di and the source sn of dn respectively.
Combined document representations
Named entities are an important part of news and seem helpful in discriminatingbetween different events. Therefore, various authors have tried to use named entitiesas special features in New Event Detection. The assumption is that named entitiescontain much of the information on an important event.
10 Uta Losch, Rudi Studer, and Christof Weinhardt
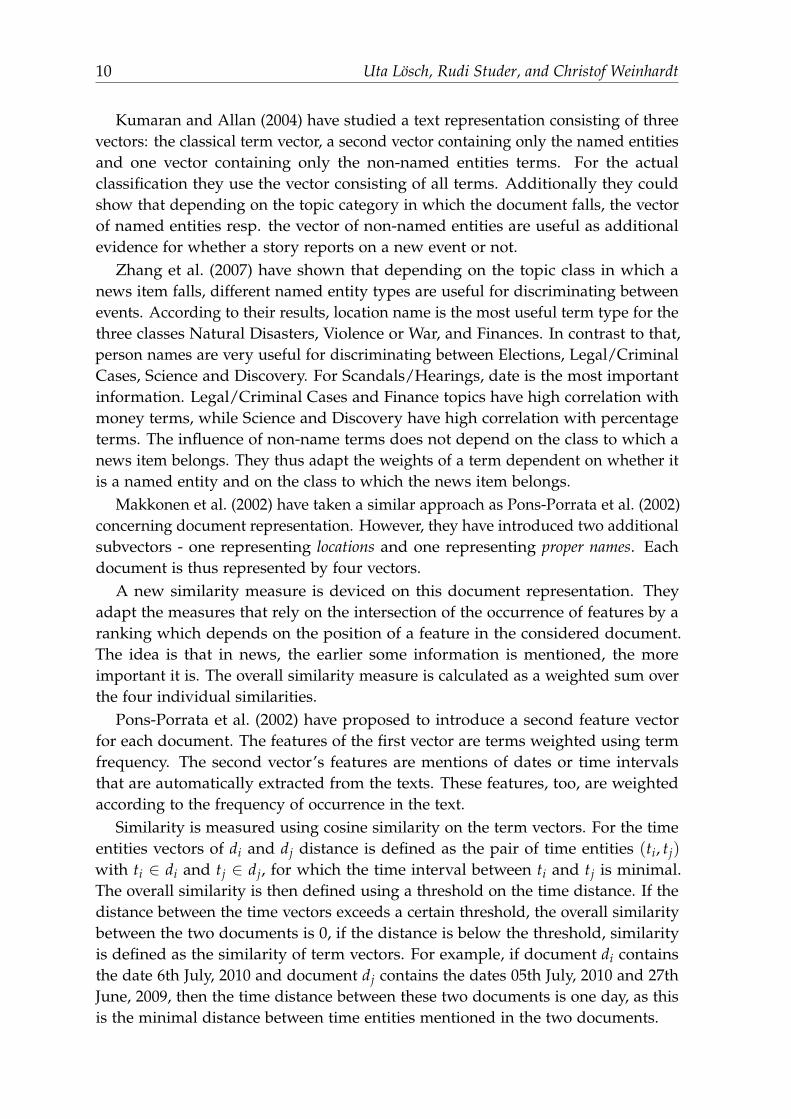
Kumaran and Allan (2004) have studied a text representation consisting of threevectors: the classical term vector, a second vector containing only the named entitiesand one vector containing only the non-named entities terms. For the actualclassification they use the vector consisting of all terms. Additionally they couldshow that depending on the topic category in which the document falls, the vectorof named entities resp. the vector of non-named entities are useful as additionalevidence for whether a story reports on a new event or not.
Zhang et al. (2007) have shown that depending on the topic class in which anews item falls, different named entity types are useful for discriminating betweenevents. According to their results, location name is the most useful term type for thethree classes Natural Disasters, Violence or War, and Finances. In contrast to that,person names are very useful for discriminating between Elections, Legal/CriminalCases, Science and Discovery. For Scandals/Hearings, date is the most importantinformation. Legal/Criminal Cases and Finance topics have high correlation withmoney terms, while Science and Discovery have high correlation with percentageterms. The influence of non-name terms does not depend on the class to which anews item belongs. They thus adapt the weights of a term dependent on whether itis a named entity and on the class to which the news item belongs.
Makkonen et al. (2002) have taken a similar approach as Pons-Porrata et al. (2002)concerning document representation. However, they have introduced two additionalsubvectors - one representing locations and one representing proper names. Eachdocument is thus represented by four vectors.
A new similarity measure is deviced on this document representation. Theyadapt the measures that rely on the intersection of the occurrence of features by aranking which depends on the position of a feature in the considered document.The idea is that in news, the earlier some information is mentioned, the moreimportant it is. The overall similarity measure is calculated as a weighted sum overthe four individual similarities.
Pons-Porrata et al. (2002) have proposed to introduce a second feature vectorfor each document. The features of the first vector are terms weighted using termfrequency. The second vector’s features are mentions of dates or time intervalsthat are automatically extracted from the texts. These features, too, are weightedaccording to the frequency of occurrence in the text.
Similarity is measured using cosine similarity on the term vectors. For the timeentities vectors of di and dj distance is defined as the pair of time entities (ti, tj)
with ti ∈ di and tj ∈ dj, for which the time interval between ti and tj is minimal.The overall similarity is then defined using a threshold on the time distance. If thedistance between the time vectors exceeds a certain threshold, the overall similaritybetween the two documents is 0, if the distance is below the threshold, similarityis defined as the similarity of term vectors. For example, if document di containsthe date 6th July, 2010 and document dj contains the dates 05th July, 2010 and 27thJune, 2009, then the time distance between these two documents is one day, as thisis the minimal distance between time entities mentioned in the two documents.
New Event Detection in Financial News Analysis 11
Event frequencies
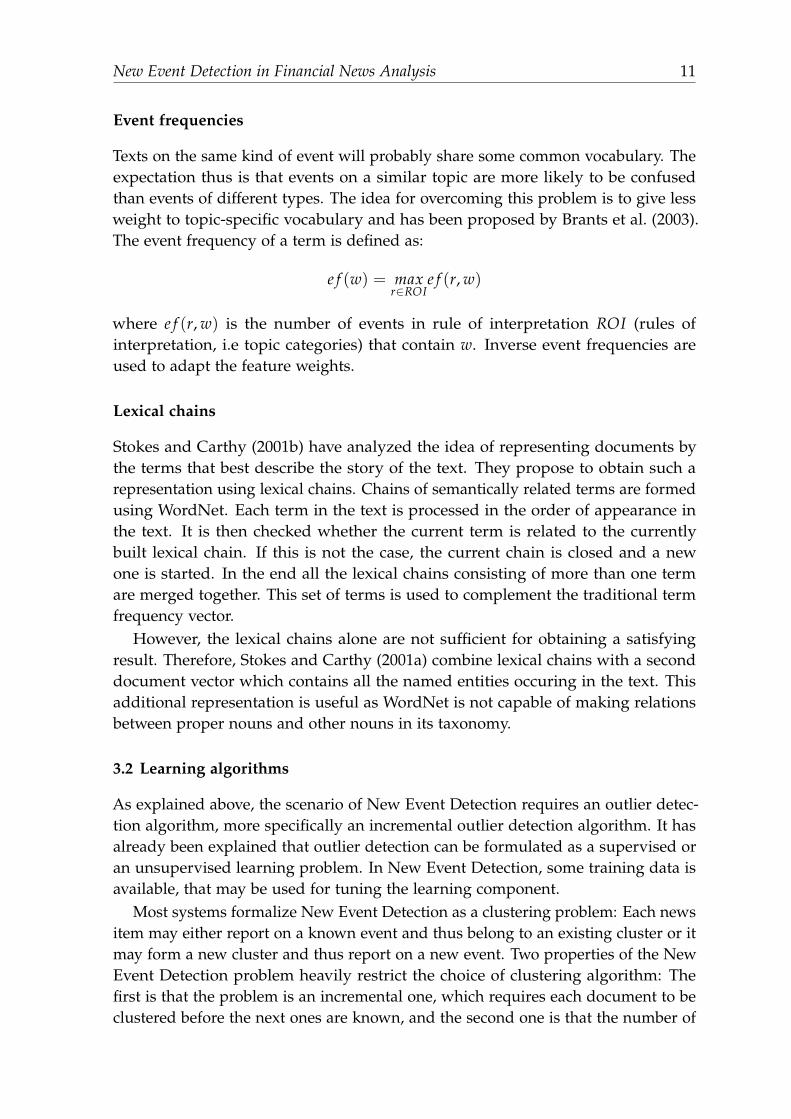
Texts on the same kind of event will probably share some common vocabulary. Theexpectation thus is that events on a similar topic are more likely to be confusedthan events of different types. The idea for overcoming this problem is to give lessweight to topic-specific vocabulary and has been proposed by Brants et al. (2003).The event frequency of a term is defined as:
e f (w) = maxr∈ROI
e f (r, w)
where e f (r, w) is the number of events in rule of interpretation ROI (rules ofinterpretation, i.e topic categories) that contain w. Inverse event frequencies areused to adapt the feature weights.
Lexical chains
Stokes and Carthy (2001b) have analyzed the idea of representing documents bythe terms that best describe the story of the text. They propose to obtain such arepresentation using lexical chains. Chains of semantically related terms are formedusing WordNet. Each term in the text is processed in the order of appearance inthe text. It is then checked whether the current term is related to the currentlybuilt lexical chain. If this is not the case, the current chain is closed and a newone is started. In the end all the lexical chains consisting of more than one termare merged together. This set of terms is used to complement the traditional termfrequency vector.
However, the lexical chains alone are not sufficient for obtaining a satisfyingresult. Therefore, Stokes and Carthy (2001a) combine lexical chains with a seconddocument vector which contains all the named entities occuring in the text. Thisadditional representation is useful as WordNet is not capable of making relationsbetween proper nouns and other nouns in its taxonomy.
3.2 Learning algorithms
As explained above, the scenario of New Event Detection requires an outlier detec-tion algorithm, more specifically an incremental outlier detection algorithm. It hasalready been explained that outlier detection can be formulated as a supervised oran unsupervised learning problem. In New Event Detection, some training data isavailable, that may be used for tuning the learning component.
Most systems formalize New Event Detection as a clustering problem: Each newsitem may either report on a known event and thus belong to an existing cluster or itmay form a new cluster and thus report on a new event. Two properties of the NewEvent Detection problem heavily restrict the choice of clustering algorithm: Thefirst is that the problem is an incremental one, which requires each document to beclustered before the next ones are known, and the second one is that the number of
12 Uta Losch, Rudi Studer, and Christof Weinhardt
clusters is not fixed. Therefore, all algorithms that take the number of clusters asparameter can not be applied in New Event Detection.
Single-pass clustering
The most prominent algorithm for New Event Detection problem is Single-passclustering, which has been proposed by Papka and Allan (1998). The algorithmproceeds as follows: For each new document the nearest cluster is searched. Ifthe similarity of the document to this cluster exceeds a threshold θ the documentis clustered with the nearest cluster, otherwise it will form a new cluster. Thisalgorithm is closely related to Nearest-Neighbour-Classification, in the sense that ifthe method for defining the nearest cluster is chosen such that only the closestdocument is considered, we obtain 1-nearest-neighbour-classification.
Single-pass clustering is not very adaptive: the definition of the nearest clusterhas to be chosen: single-link, average-link, or complete-link. Based on the link-ing strategy and an initial set of documents the optimal parameter value for thethreshold θ has to be learned.
Incremental β0-Compact Algorithm
Pons-Porrata et al. (2002) have proposed to reallocate documents between clustersupon the arrival of new documents. The idea is to use the maximum-similaritygraph of all documents for finding the clusters. A cluster is formed by a set ofnodes which are connected among each other, but not to other documents in thegraph of maximum similarity.
For a new document dn the similarity to all previous documents di is determinedand for each document the information on the nearest document is updated. Usingthe information on the most similar document, the graph of maximum similaritiescan be constructed. It is defined over all documents, and contains an edge (di, dj) ifthe most similar document for di is dj. Clusters are extracted from this graph bysearching for sets of nodes which are connected among each other but not to othernodes outside the set.
Support Vector Machines
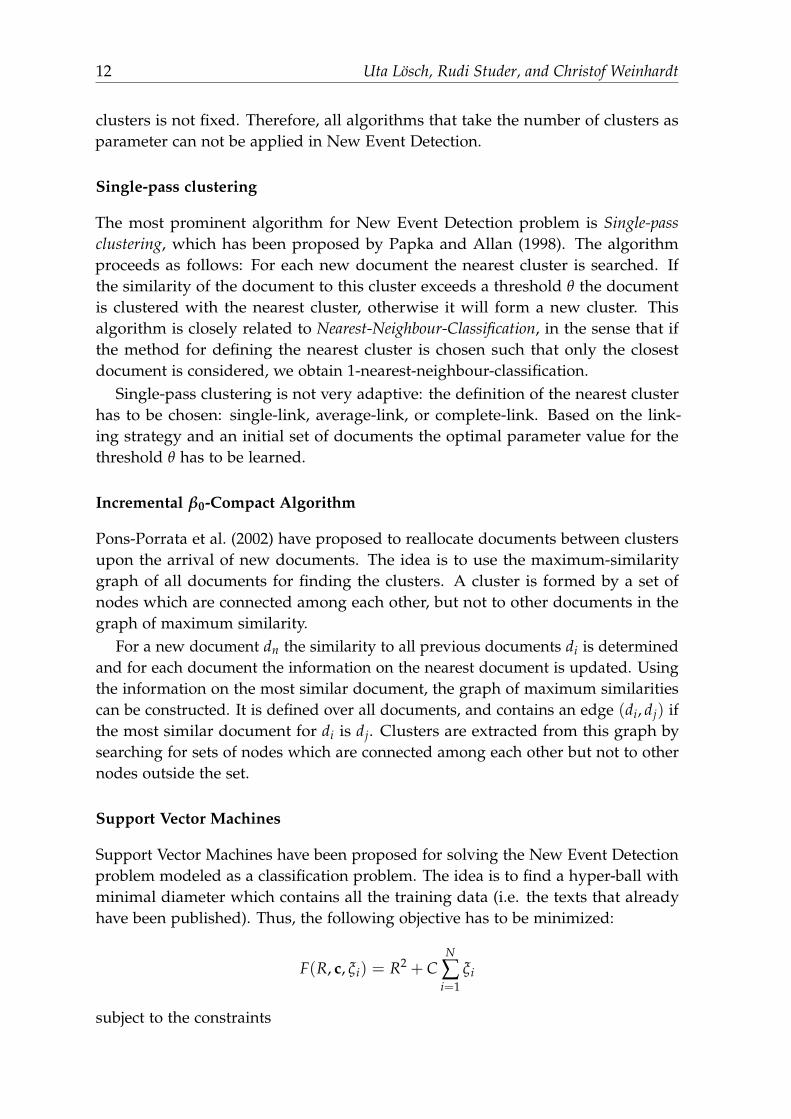
Support Vector Machines have been proposed for solving the New Event Detectionproblem modeled as a classification problem. The idea is to find a hyper-ball withminimal diameter which contains all the training data (i.e. the texts that alreadyhave been published). Thus, the following objective has to be minimized:
F(R, c, ξi) = R2 + CN
∑i=1
ξi
subject to the constraints
New Event Detection in Financial News Analysis 13
0 ≤ ξi(xi − c)>(xi − c) ≤ R2 + ξi
where c is the center of the hyperball, R is its radius, and the ξi are slack variablesthat measure how far the data point is from the hyperball’s surface.
A text is classified as novel if its distance from the center of the hyper-ball exceedsa certain threshold. As in classical SVMs, kernel functions may be used for calcu-lating similarities, thus projecting the data into a high-dimensional feature spaceand determining the hyper-ball there. A detailed description of the optimizationproblem can be found in Zhang et al. (2004). At first glance the use of SVMs mayseem very inefficient in the context of New Event Detection. However, retrainingonly becomes necessary when a text is classified as being novel - therefore, lesstraining effort than one might expect is needed.
Kernel Regression
Zhang et al. (2004) have used Kernel Regression for solving New Event Detection.In Kernel regression the predicted variable is calculated as a weighted average ofthe available data where the weights are determined using a kernel function. Theestimation can thus be phrased as r(y, x1, . . . , xN) = ∑N
i=1 wi(y)s(xi, y) where K is akernel, wi(y) is given by wi(y) =
K(xi,y)∑N
j=1 K(xj,y)(Nadaraya-Watson kernel estimator).
Probabilistic model
Apart from the methods that have been presented in the previous paragraphs,probabilistic methods have been studied as alternative models for New EventDetection. Zhang et al. (2005) have used language models and stochastic processesas their approach to the problem. The development of clusters is modeled usinga Dirichlet process and a multinominal language model is used for modeling theclusters themselves. The probability of a document xi being part of a cluster Cj isthus:
p(Cj|xi) =p(Cj)p(xi|Cj)
∑m+1k=1 p(Ck)p(xi|Ck)
where the prior probabilities of each cluster are determined by
p(cn = Cj) =card(Cj)
λ + ∑mk=1 card(Ck)
(j = 1, . . . , m) (2)
p(cn = Cm+1) =λ
λ + ∑mk=1 card(Ck)
(3)
with C1, . . . , Cm being the clusters obtained by processing x1, . . . , xn−1, Cm+1 being apossible new cluster whose probability of being generated depends on the parameterλ, card(Cj) describing the number of documents that have been clustered into Cj,and
14 Uta Losch, Rudi Studer, and Christof Weinhardt
p(xi|Cj) =∫
p(θ(Cj)|Cj)p(xi|θ(Cj))dθ(Cj)
p(xi|C) decribes the probability of a document xi being generated by cluster CJ . θCj
is the parameter vector of cluster Cj.Zhang and Li (2009) have proposed an alternative probabilistic model which is
based on an incremental version of probabilistic latent semantic analysis (IPLSA).The idea of probabilistic latent semantic analysis is to introduce concepts, whichare variables linking terms to documents and to estimate the parameters P(w|z)and P(z|d) in a way to describe the available data as good as possible, where ware the words occuring in the dataset, d are the documents in the dataset and zare the latent concepts. Zhang et al. have proposed an incremental version of thisalgorithm, which allows to add documents to the model in an online manner.
3.3 Complexity and efficiency
The basic New Event Detection approach which uses Single-pass Clustering withsingle linkage and a bag-of-words model with TFIDF weights has quadratic com-plexity in the number of documents, as each document is compared to all theprevious documents. This complexity results in very low processing speed, leadingto systems that are not able to analyze data streams in a real-time manner.
To the best of our knowledge, little work has been done to improve processingspeed of New Event Detection systems. The most important approach to improvingrun-time efficiency is reducing the number of comparisons. Zhang et al. (2007)have used indexing-trees for the search for the most similar document. The idea isto reduce the number of necessary comparisons from linear to logarithmic in thenumber of documents. Their approach consists in building hierarchical clusters ofdocuments such that the search for the closest document can be done by performinga search in this tree.
The time-decay models presented in Section 3.1 are a possibility of reducing thenumber of documents with which each document has to be compared.
Further methods for reducing the number of comparisons and the complexity ofeach comparison have been proposed by Luo et al. (2007). Additionally to a slidingwindow in which news are considered for comparison, in their approach only thefirst story for each event is considered for comparison, thus significantly reducingthe number of documents to be considered. Additionally, only the terms which arethe most important ones for a document, i.e. those with the highest feature weightsare used for similarity calculation. Luo et al. could show that it is sufficient to usethe top 100 features for comparison. For a further speed-up, the similarity betweentwo documents is only calculated if there is an overlap in the top 10 features of bothdocuments - otherwise the documents are considered to be reporting on differentevents.
A further improvement that Luo et al. proposed is parallelizing the New EventDetection process by splitting the set of candidate documents into several subsets
New Event Detection in Financial News Analysis 15
and by processing each subset on a different machine. If one of the machinesreturns a classification of the document as reporting on a new event, the documentis classified as new, otherwise as old.
4 Evaluation and performance
4.1 Corpora
Five TDT corpora have been developed and are maintained by the Linguistic DataConsortium1. These corpora vary in size, the number and kind of sources they use,and in language Cieri et al. (2002)
The TDT Pilot study corpus was used in the pilot study, it consists of textual newsfrom newswires (Reuters) and transcriptions of broadcast news speech (CNN). Allnews are available in English. The corpus covers one year of data – from July 1,1994 to June 30, 1995, and consists of approximately 16000 stories. On these, a totalof 25 events were defined, which defines a subset of the events covered in the data.
TDT-2 consists of English and Chinese news, both in textual as well as in audioform. Data was collected from nine sources over a period of six months fromJanuary 1998 to June 1998. Transcripts of the audio data and translations of theChinese data are available. The corpus consists of a total of approximately 53600Englisch and 18800 Chinese stories. A total of 200 events were defined on theEnglish data, 20 of them have also been annotated on the Chinese data. This corpuswas used for the TDT evaluations in the year 1998.
TDT-3 was used in the evaluations from 1999 to 2001. It contains news collectedfrom October to December 1998 in English, Chinese and Arabic. 120 topics havebeen annotated for the English and the Chinese data, only a subset of them hasbeen annotated in Arabic.
The TDT-4 corpus was used for the official evaluations in 2002 and 2003. It alsocontains English, Chinese and Arabic data. In this corpus a total of 80 topics havebeen annotated in each language. The corpus consists of data that has been collectedbetween October 2000 to January 2001.
The last corpus that was developed was TDT-5, the corpus which has been usedfor the 2004 evaluation. It contains English, Chinese and Arabic data that has beenpublished between April and September 2003. A total of 250 topics have beenannotated on this corpus, 25% of which are annotated in all three languages, therest is annotated in only one language, distributed equally across languages.
4.2 Evaluation measure
The goal of New Event detection is to mark the first story on an event as new, allthe other stories are to be marked as old. Therefore, the system may make differentmistakes:1 http://www.ldc.upenn.edu/
16 Uta Losch, Rudi Studer, and Christof Weinhardt
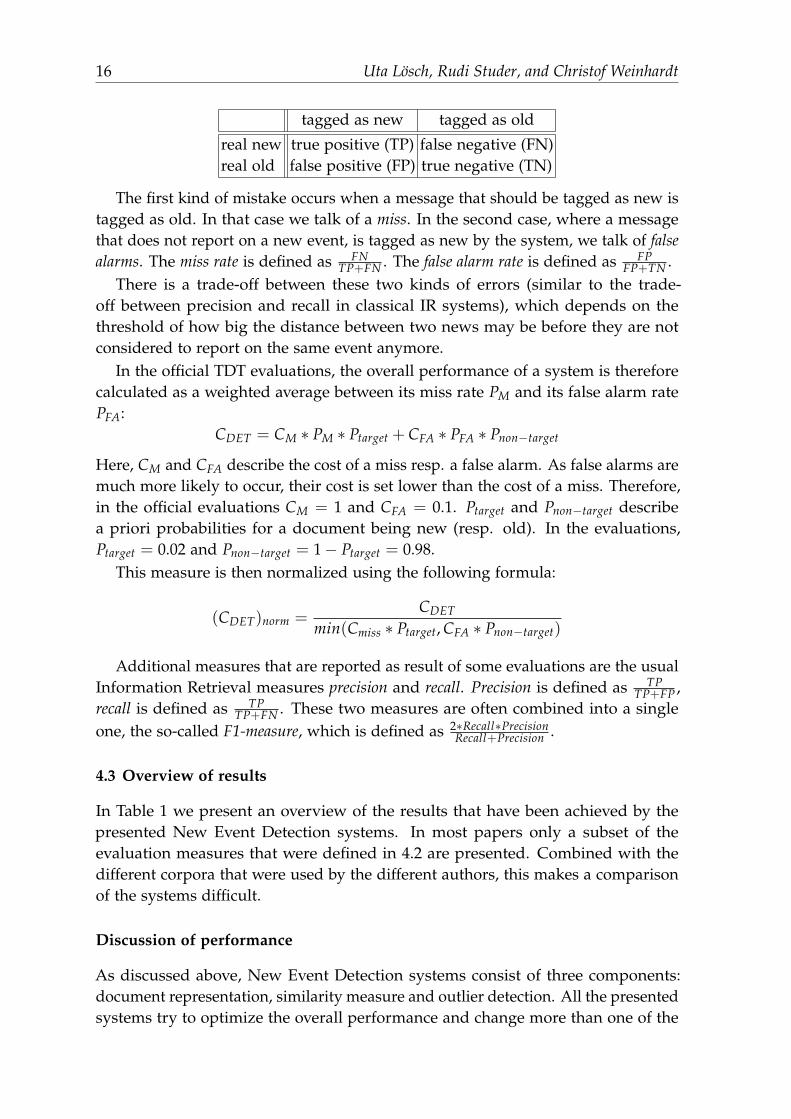
tagged as new tagged as old
real new true positive (TP) false negative (FN)real old false positive (FP) true negative (TN)
The first kind of mistake occurs when a message that should be tagged as new istagged as old. In that case we talk of a miss. In the second case, where a messagethat does not report on a new event, is tagged as new by the system, we talk of falsealarms. The miss rate is defined as FN
TP+FN . The false alarm rate is defined as FPFP+TN .
There is a trade-off between these two kinds of errors (similar to the trade-off between precision and recall in classical IR systems), which depends on thethreshold of how big the distance between two news may be before they are notconsidered to report on the same event anymore.
In the official TDT evaluations, the overall performance of a system is thereforecalculated as a weighted average between its miss rate PM and its false alarm ratePFA:
CDET = CM ∗ PM ∗ Ptarget + CFA ∗ PFA ∗ Pnon−target
Here, CM and CFA describe the cost of a miss resp. a false alarm. As false alarms aremuch more likely to occur, their cost is set lower than the cost of a miss. Therefore,in the official evaluations CM = 1 and CFA = 0.1. Ptarget and Pnon−target describea priori probabilities for a document being new (resp. old). In the evaluations,Ptarget = 0.02 and Pnon−target = 1− Ptarget = 0.98.
This measure is then normalized using the following formula:
(CDET)norm =CDET
min(Cmiss ∗ Ptarget, CFA ∗ Pnon−target)
Additional measures that are reported as result of some evaluations are the usualInformation Retrieval measures precision and recall. Precision is defined as TP
TP+FP ,recall is defined as TP
TP+FN . These two measures are often combined into a singleone, the so-called F1-measure, which is defined as 2∗Recall∗Precision
Recall+Precision .
4.3 Overview of results
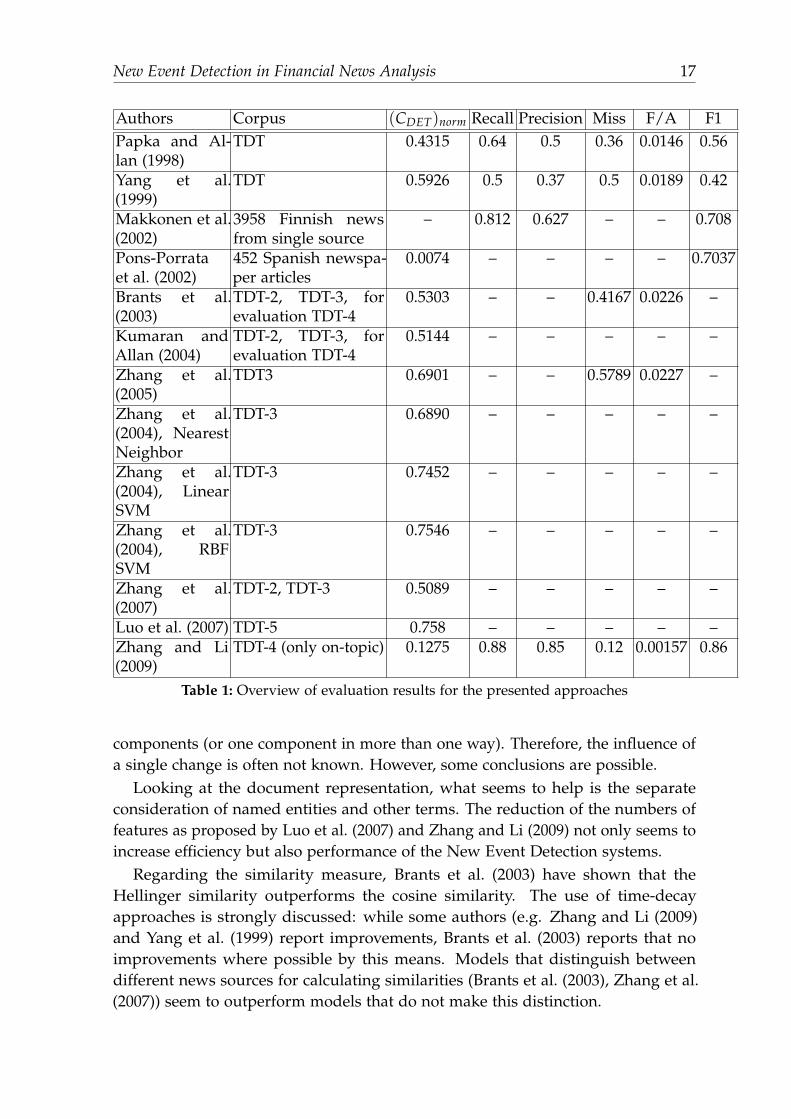
In Table 1 we present an overview of the results that have been achieved by thepresented New Event Detection systems. In most papers only a subset of theevaluation measures that were defined in 4.2 are presented. Combined with thedifferent corpora that were used by the different authors, this makes a comparisonof the systems difficult.
Discussion of performance
As discussed above, New Event Detection systems consist of three components:document representation, similarity measure and outlier detection. All the presentedsystems try to optimize the overall performance and change more than one of the
New Event Detection in Financial News Analysis 17
Authors Corpus (CDET)norm Recall Precision Miss F/A F1Papka and Al-lan (1998)
TDT 0.4315 0.64 0.5 0.36 0.0146 0.56
Yang et al.(1999)
TDT 0.5926 0.5 0.37 0.5 0.0189 0.42
Makkonen et al.(2002)
3958 Finnish newsfrom single source
– 0.812 0.627 – – 0.708
Pons-Porrataet al. (2002)
452 Spanish newspa-per articles
0.0074 – – – – 0.7037
Brants et al.(2003)
TDT-2, TDT-3, forevaluation TDT-4
0.5303 – – 0.4167 0.0226 –
Kumaran andAllan (2004)
TDT-2, TDT-3, forevaluation TDT-4
0.5144 – – – – –
Zhang et al.(2005)
TDT3 0.6901 – – 0.5789 0.0227 –
Zhang et al.(2004), NearestNeighbor
TDT-3 0.6890 – – – – –
Zhang et al.(2004), LinearSVM
TDT-3 0.7452 – – – – –
Zhang et al.(2004), RBFSVM
TDT-3 0.7546 – – – – –
Zhang et al.(2007)
TDT-2, TDT-3 0.5089 – – – – –
Luo et al. (2007) TDT-5 0.758 – – – – –Zhang and Li(2009)
TDT-4 (only on-topic) 0.1275 0.88 0.85 0.12 0.00157 0.86
Table 1: Overview of evaluation results for the presented approaches
components (or one component in more than one way). Therefore, the influence ofa single change is often not known. However, some conclusions are possible.
Looking at the document representation, what seems to help is the separateconsideration of named entities and other terms. The reduction of the numbers offeatures as proposed by Luo et al. (2007) and Zhang and Li (2009) not only seems toincrease efficiency but also performance of the New Event Detection systems.
Regarding the similarity measure, Brants et al. (2003) have shown that theHellinger similarity outperforms the cosine similarity. The use of time-decayapproaches is strongly discussed: while some authors (e.g. Zhang and Li (2009)and Yang et al. (1999) report improvements, Brants et al. (2003) reports that noimprovements where possible by this means. Models that distinguish betweendifferent news sources for calculating similarities (Brants et al. (2003), Zhang et al.(2007)) seem to outperform models that do not make this distinction.
18 Uta Losch, Rudi Studer, and Christof Weinhardt
Zhang et al. (2004) have shown that the single-pass clustering approach outper-forms Support Vector Machines and Kernel Regression. They argue that kernelmethods seem to perform quite poorly in unsupervised learning tasks with a highnumber of features. The authors’ explanation for this phenomenon is the lack ofinformation on which features are important in the learning task (in contrast tosupervised learning tasks where this kind of information can be derived). An inter-esting alternative approach is the IPLSA method that has been proposed by Zhangand Li (2009) and which clearly outperforms the other systems. Here, learning isbased on an incremental maximum likelihood estimation of the probability of aword w occuring in document d.
5 Conclusion
In this paper we have presented a framework for stock price analysis and predictionbased on news that are published. We have presented the idea of using New EventDetection as a pre-processing step in this context – the motivation being that NewEvent Detection should be essential for enabling accurate predictions (as ”old”information is already reflected in the prices).
The problem of New Event Detection has been studied extensively in the liter-ature. Different algorithms, different text representations and different similaritymeasures have been applied to the problem. Still, the problem remains hard andstate-of-the-art systems still have high error rates in their predictions.
Therefore, we think that this problem is still interesting for further analyses. Inour work we focus on refining the document representation and suitable similaritymeasures for New Event Detection. We use OpenCalais2 to obtain annotations ofnamed entities and events in the documents. As explained above, named entitieshave been used before in New Event Detection. Using event annotations, i.e.relations between the entities mentioned in a document, is however going beyondthe state of the art.
As the text annotations are obtained in an automatic manner, they can not beassumed to be correct and complete. Additionally, only a limited number of eventtypes can be annotated by OpenCalais. Therefore, it is likely that a combineddocument representation that relies on both the annotations and the bag-of-wordsyields better results.
Concerning the use of event annotations as document features, it is not clearwhat the most promising way of using them is. We are evaluating different methods:Either each concrete relation can be used as a feature. Alternatively, relation typeand the involved entities can be regarded separately. The latter may better reflect thesimilarity between the annotated events. OpenCalais annotations are represented asgraphs. Therefore, a third alternative is to calculate similarities between document
2 http://www.opencalais.com
New Event Detection in Financial News Analysis 19
annotations as graph similarities instead of extracting features from the graphs,which are then used for similarity calculation.
References
Allan, J., R. Papka, and V. Lavrenko (1998): “On-line new event detection andtracking,” in: SIGIR ’98: Proceedings of the 21st Annual International ACM SIGIRConference on Research and Development in Information Retrieval, ACM, New York,NY, USA, pp. 37–45.
Brants, T., F. Chen, and A. Farahat (2003): “A System for new event detection,” in:SIGIR ’03: Proceedings of the 26th Annual International ACM SIGIR Conference onResearch and Development in Information Retrieval, ACM, New York, NY, USA, pp.330–337.
Cieri, C., S. Strassel, D. Graff, N. Martey, K. Rennert, and M. Liberman (2002):Corpora for topic detection and tracking, Kluwer Academic Publishers, Norwell, MA,USA, pp. 33–66.
Fama, E. (1970): “Efficient Capital Markets: A Review of Theory and EmpiricalWork,” Journal of Finance, 25, pp. 383–417.
Fiscus, J. G. and G. R. Doddington (2002): Topic detection and tracking evaluationoverview, Kluwer Academic Publishers, Norwell, MA, USA, pp. 17–31.
Franz, M., A. Ittycheriah, J. S. McCarley, and T. Ward (2001): “First story detection:Combining similarity and novelty-based approaches,” .
Kumaran, G. and J. Allan (2004): “Text classification and named entities for newevent detection,” in: SIGIR ’04: Proceedings of the 27th Annual International ACMSIGIR Conference on Research and Development in Information Retrieval, ACM, NewYork, NY, USA, pp. 297–304.
Luo, G., C. Tang, and P. S. Yu (2007): “Resource-adaptive real-time new eventdetection,” in: SIGMOD ’07: Proceedings of the 2007 ACM SIGMOD InternationalConference on Management of Data, ACM, New York, NY, USA, pp. 497–508.
Makkonen, J., H. Ahonen-Myka, and M. Salmenkivi (2002): “Applying SemanticClasses in Event Detection and Tracking,” in: R. Sangal and S. M. Bendre (eds.),Proceedings of International Conference on Natural Language Process, pp. 175–183.
Papka, R. and J. Allan (1998): “On-Line New Event Detection using Single PassClustering,” working paper, University of Massachusetts, Amherst, MA, USA.
Pons-Porrata, A., R. B. Llavori, and J. Ruız-Shulcloper (2002): “Detecting Events andTopics by Using Temporal References,” in: IBERAMIA 2002: Proceedings of the 8thIbero-American Conference on Artificial Intelligence, Springer-Verlag, London, UK,pp. 11–20.
Stokes, N. and J. Carthy (2001a): “Combining Semantic and Syntactic DocumentClassifiers to Improve First Story Detection,” in: 24th Annual International ACMSIGIR Conference on Research and Development in Information Retrieval (SIGIR2001),pp. 424–425.
20 Uta Losch, Rudi Studer, and Christof Weinhardt
Stokes, N. and J. Carthy (2001b): “First story detection using a composite documentrepresentation,” in: HLT ’01: Proceedings of the 1st International Conference onHuman Language Technology Research, Association for Computational Linguistics,Morristown, NJ, USA, pp. 1–8.
Yang, Y., J. Carbonell, R. Brown, T. Pierce, B. T. Archibald, and X. Liu (1999):“Learning approaches for detecting and tracking news events,” IEEE IntelligentSystems, 14(4), pp. 32–43.
Yang, Y., T. Pierce, and J. Carbonell (1998): “A study on retrospective and on-lineevent detection,” in: Proceedings of SIGIR-98, 21st ACM International Conference onResearch and Development in Information Retrieval, Melbourne, AU, pp. 28–36.
Zhang, J., Z. Ghahramani, and Y. Yang (2005): “A Probabilistic Model for OnlineDocument Clustering with Application to Novelty Detection,” in: L. Saul andY. Weiss (eds.), Proceedings of the 17th Conference on Advances in Neural InformationProcessing Systems, pp. 1617–1624.
Zhang, J., Y. Yang, and J. Carbonell (2004): “New Event Detection with nearestNeighbor, Support Vector Machines, and Kernel Regression,” working paperCMU-CS-04-118, CMU.
Zhang, K., J. Zi, and L. G. Wu (2007): “New event detection based on indexing-treeand named entity,” in: SIGIR ’07: Proceedings of the 30th annual international ACMSIGIR conference on Research and development in information retrieval, ACM, NewYork, NY, USA, pp. 215–222.
Zhang, X. and Z. Li (2009): “Online New Event Detection Based on IPLSA,” AdvancedData Mining and Applications, pp. 397–408.
Towards a Benchmarking Frameworkfor Financial Text Mining
Caslav Bozic1, Ryan Riordan2, Detlef Seese1, and Christof Weinhardt2
1 Institute of Applied Informatics and Formal Description Methods, KITbozic, [email protected]
2 Institute of Information Systems and Management, KITryan.riordan, [email protected]
Summary. Different data mining methods for financial texts and various sentiment mea-sures are described in the existing literature, without common benchmarks for comparingthese approaches. The framework proposed in this paper and the corresponding imple-mented system facilitate combining more sources of financial data into comprehensiveintegral dataset. The use of the dataset is then illustrated by analyzing the candidatemeasures by estimating parameters of regression on different returns and other financialindicators that can be defined using system’s novel data transformation approach.
1 Introduction
Different data mining methods for financial texts are described in the literature,and systems that apply these particular methods have been implemented. For anevaluation of the proposed methods authors use different approaches, some of themincorporating assumptions that do not conform to real financial markets’ conditions.This paper presents the current status of a project attempting to offer a possibilityto compare performance of these systems by offering a framework, a base dataset,and an implementation of the system according to design science guidelines fromHevner et al. (2004).
The research is a part of the project FINDS (Financial News and Data Services)initiated within Information Management and Market Engineering Graduate Schoolat the Karlsruhe Institute of Technology. Project FINDS has the goal to conductinnovative research on the analysis of quantitative and qualitative informationrelated to financial markets and to provide services that can help both researchersin financial field, and also professional traders (Bozic, 2009).
The paper is organized as follows: in section 2 we give an overview of the existingliterature in the field. Section 3 describes data sources for the comprehensiveresearch set, preprocessing methods used on data and gets the reader acquaintedwith the dataset by presenting some descriptive statistics. Section 4 illustrates theusage of the framework and the system by comparing four sentiment measures.Section 5 concludes the paper and describes the ideas for future research.
22 Caslav Bozic, Ryan Riordan, Detlef Seese, and Christof Weinhardt
2 Related Work
Many researchers have studied how published news influence market reactions.The methodologies used range from a fairly simple content analysis using classicalstatistical tools, to complex machine-learning methods. The approaches vary froman engineering approach which focuses on implementation and proving economicrelevance, to chiefly theoretical approaches whose goal is to describe underlyingeconomic phenomena.
Mittermayer and Knolmayer (2006a) compare eight text-mining systems, includ-ing their own. Since more technical performance criteria are often missing, it isnot possible to draw clear conclusions about relative performance. Wuthrich et al.(1998) classify news articles published overnight on web portals into three categoriesdepending on their influence on the one of five equity indices: Dow Jones, Nikkei,FTSE, Hang Seng, and Straits Times. With this system they attempt to forecast thetrend of the index daily value one day ahead. They use Naıve Bayes, Nearest Neigh-bour and Neural Net classifier, and a hand-crafted underlying dictionary. Lavrenkoet al. (2000) use Naıve Bayes classifier to classify news articles from Yahoo!Financeinto five groups, according to the influence on particular U.S. stocks. The featureswere determined automatically and the forecast horizon was from five to ten hours.Gidofalvi and Elkan (2003) use again naıve Bayes classifier with three categories torecognize articles which have bigger positive or negative influence on constituentsof Dow Jones index. With features defined using mutual information measurethey work on ten minutes aggregated intraday data. Fung, Yu, and Lam (2003)partially use commercially available text mining systems to predict a price trend forintraday market movements of some of the stocks listed on the Hong Kong StockExchange. For classification purposes they use support vector machines. Finally,Mittermayer and Knolmayer (2006b) propose a high frequency forecast system thatclassifies press releases of publicly traded companies in the U.S. using a dictionarythat combines automatically selected features and a hand-crafted thesaurus. Forclassification the authors use the polynomial version of SVM.
While most of the works focus on predicting price trends of single stock or index,there are works that aim at determining influence of news releases to volatility.Thomas (2003) improves risk-return profile by exiting the market in case of newsthat are predicting high volatility, while Schulz, Spiliopoulou, and Winkler (2003)attempt to classify press releases of German public companies according theirinfluence on volatility of stock prices.
Another group of publications not included in the survey by Mittermayer andKnolmayer (2006a) contains works that do not primary attempt to prove economicalrelevance of published text by evaluating specifically tailored trading strategies,but rather to find statistically relevant relations between financial indicators andsentiment extracted from the text.
Antweiler and Frank (2004) use Naıve Bayes and SVM classifiers to classifymessages posted to Yahoo!Finance and Raging Bull and determine their sentiment.
Towards a Benchmarking Framework for Financial Text Mining 23
They do not find statistically significant correlation with stock prices, but they findsentiment and volume of messages significantly correlated to trade volumes andvolatility. In their methodological paper Das and Chen (2007) offer a variety ofclassifiers, as well as composed sentiment measure as a result of voting amongclassifiers. In the illustrative example they analyze Yahoo stock boards and stockprices of 8 technology companies, but they do not find clear evidence that thesentiment index can be predictive for stock prices.
There are two pivotal articles published in the Journal of Finance. Tetlock (2007)observes Wall Street Journal’s column ”Abreast of the Market”, uses content analysissoftware General Inquirer together with Principal Component Analysis approachand finds that high pessimism in published media predicts downward pressure onmarket prices. Authors of Tetlock, Saar-Tsechansky, and Macskassy (2008) succeededto find that rate of negative words in news stories about certain company predictslow earnings of the company.
If we observe text mining methodologies as a transformations that assign numer-ical value to every textual string, we can refer to that numerical value as sentimentindex. All publications from the former group have at least implicit statementsabout the predictive power of the specific sentiment index on e.g. returns or volatil-ity. Following the evaluation approach from the latter group of publication, we aimat providing financial text mining research community with a framework and a toolthat can be used for proving their statements using statistical significance criteria.
3 Data
3.1 Data Sources
We use Thomson Reuters TickHistory data and the output from the Reuters NewsS-cope Sentiment Engine as a source dataset. These data sources are convenientbecause they provide access to trading data over period of more than 10 years, andextensive amount of sentiment data related to financial news stories.
Data constituting the output of the Reuters NewsScope Sentiment Engine rep-resents the author’s sentiment measure for every English-language news itempublished via NewsScope in years 2003-2008. The measure classifies a news iteminto one of three categories: positive, negative, or neutral. The probability of thenews item falling into each of the categories is also given.
Thomson Reuters TickHistory data is available through the DataScope platform.We use daily data for the period equivalent to the NewsScope Sentiment Enginedataset. This provides us with data on opening and closing prices for the particularproduct, bid and ask, as well as volume data. Other types of data about companiescoming from this source are the total amount of shares, used for calculating marketcapitalization, and paid dividends, that can be used for adjusting the returns.Additionally, it is the source of the data about daily values of the MSCI Indices forindividual countries, as well as MCSI World Index.

24 Caslav Bozic, Ryan Riordan, Detlef Seese, and Christof Weinhardt
Field Name Description Sourceric Reuters Instrument Code THd Date THOpen Opening daily price THHigh Maximal price within the day THLow Minimal price within the day THvol Daily trading volume THLast Closing daily price THBid Average bid THAsk Average ask THspread Average spread THcc Close to close daily return of the equity Doc Open to close daily return of the equity Doo Open to open daily return of the equity Dco Close to open daily return of the equity Dcnt Number of news items mentioning company RNSEpnaccnt Number of news stories mentioning company RNSEnsent pos Number of positive news items mentioning company RNSEnsent neut Number of neutral news items mentioning company RNSEnsent neg Number of negative news items mentioning company RNSEavgsent Average sentiment RNSEasent pos Average probability that news items are positive RNSEasent neut Average probability that news items are neutral RNSEasent neg Average probability that news items are negative RNSEnet sent Net sentiment: asent pos - asent neg Dnet sent std Standard deviation of net sentiment Dric market Abbreviation of company’s home market THcountry Country Dicc Close to close daily return of the country index Dioc Open to close daily return of the country index Dioo Open to open daily return of the country index Dico Close to open daily return of the country index Dcnt country Number of news items related to country RNSEavgsent item Average sentiment (country level) RNSEeccc Excess daily close to close return w/r to country index Decoc Excess daily open to close return w/r to country index Decco Excess daily close to open return w/r to country index Decoo Excess daily open to open return w/r to country index D
Table 1: Main fields and sources (TH - TickHistory,RNSE - Sentiment Engine, D - derived)
Towards a Benchmarking Framework for Financial Text Mining 25
Reuters NewsScope Sentiment Engine data has two main properties - the times-tamp of the news item publishing, and the related company mentioned in the newsitem. It is preprocessed in a way that the records are aggregated on the level of eachcompany, and also calendar day - according to local time in force at the location ofcompany’s home market. In that way we get an average sentiment for a companyfor each day in 6 years period. The sentiments are expressed by different calculatedvalues. The first aggregated sentiment measure is average sentiment class - wherethe classes are represented by values 1, 0, and -1 for positive, neutral, and negativeclass, respectively. Further measures are average probabilities that each news itemfalls into positive, negative or neutral class. As the Reuters sentiment index usedfor the evaluation later we adopted a deducted value defined as average probabilityof positive class minus average probability of negative class within one day.
From the data on daily prices we derive data on different returns: namelyclose-to-open, close-to-close, open-to-open, and open-to close returns. This is doneconsidering only days with trades for particular equity or index. The generic way ofdefining calculated fields derived from source data is described in later section. Thecalculated returns are adjusted for paid dividends by increasing the price of shareon the trading day following the dividend payment by the amount of dividendspaid per share.
3.2 Descriptive Statistics
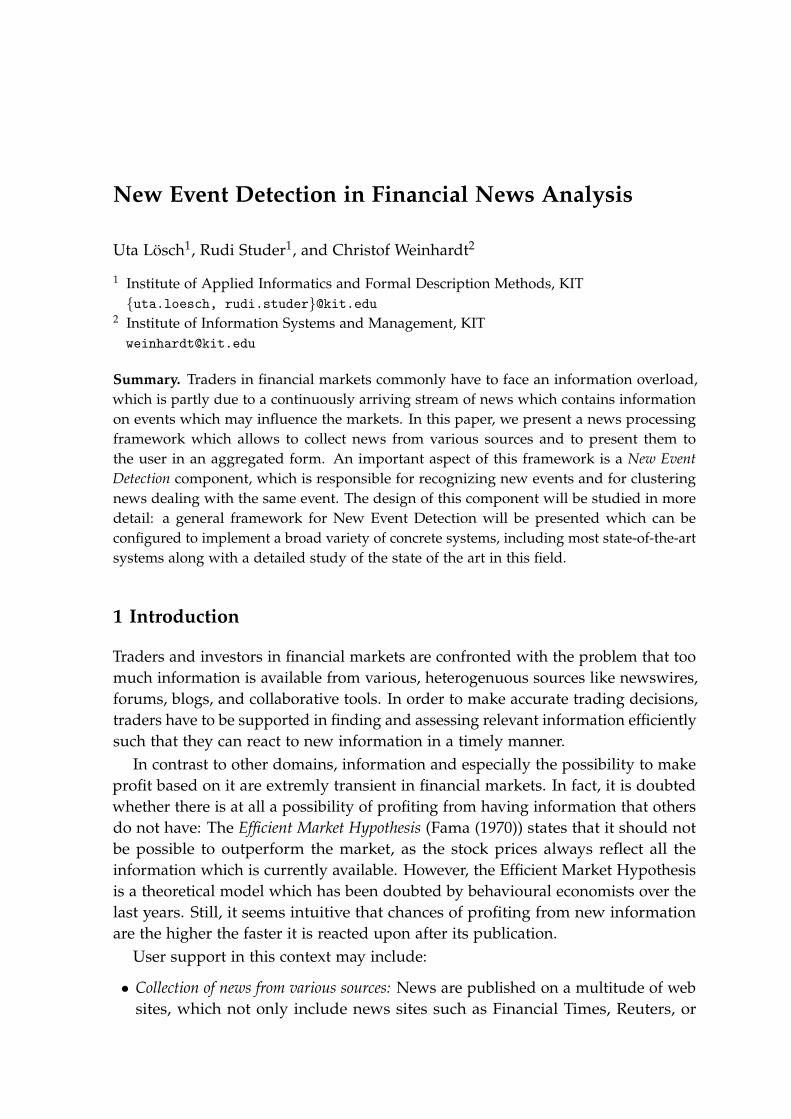
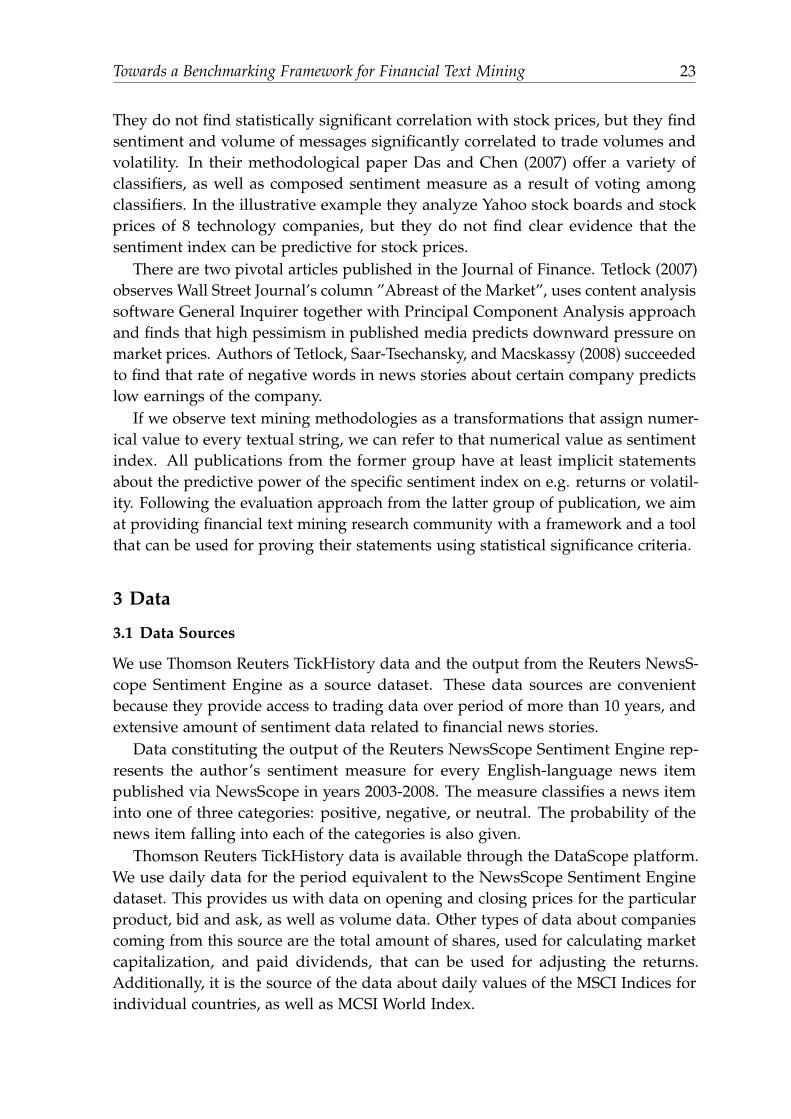
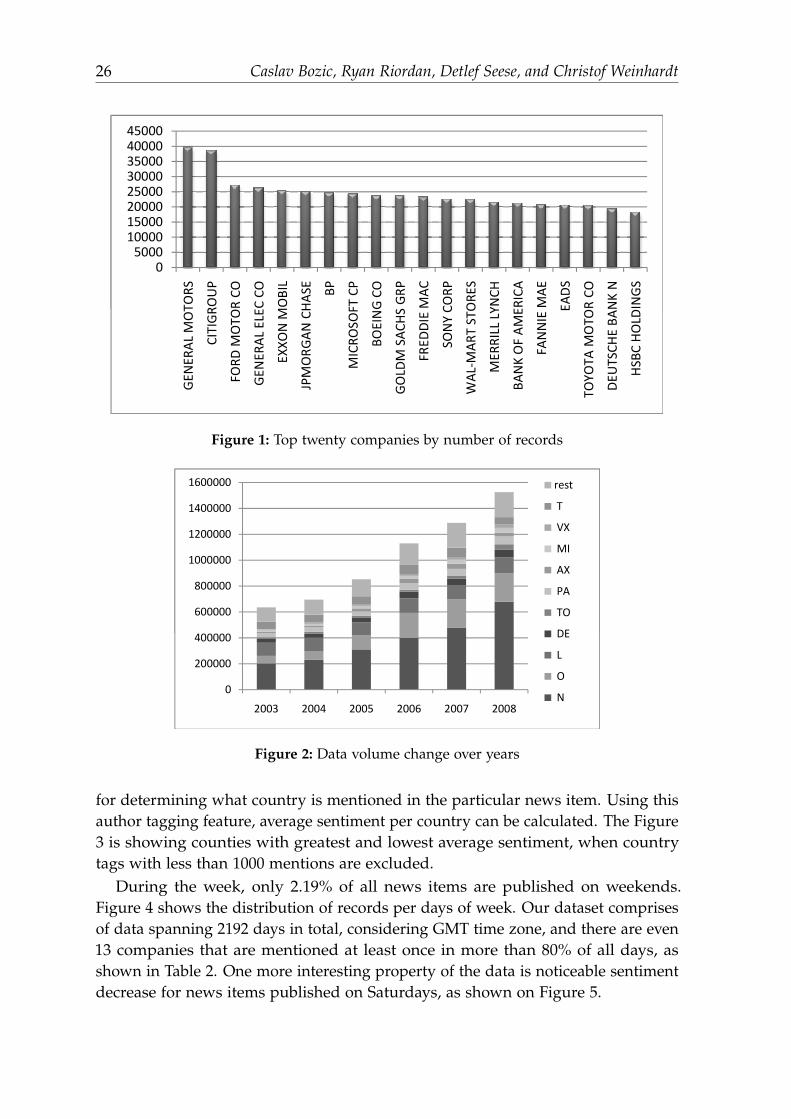
Reuters NewsScope Sentiment Engine data consists of author’s sentiment measuresof English-language news items published through Reuters NewsScope in theperiod from 2003 to 2006 inclusive. Each record represents a unique mention ofthe specific company, with a possibility of one news item relating to more thanone company. In our dataset there are 6,127,190 records about 10,665 differentcompanies. Figure 1 shows the top twenty companies with greatest number ofrecords related to that company. According to Reuters news production process,several news items can make one single news story, e.g. short alert item is publishedimmediately, and after some time extension of the same story is published as a newitem, or in the case of corrections. In the available data average number of newsitems per story is 1.995, saying that in average two items make one news story.
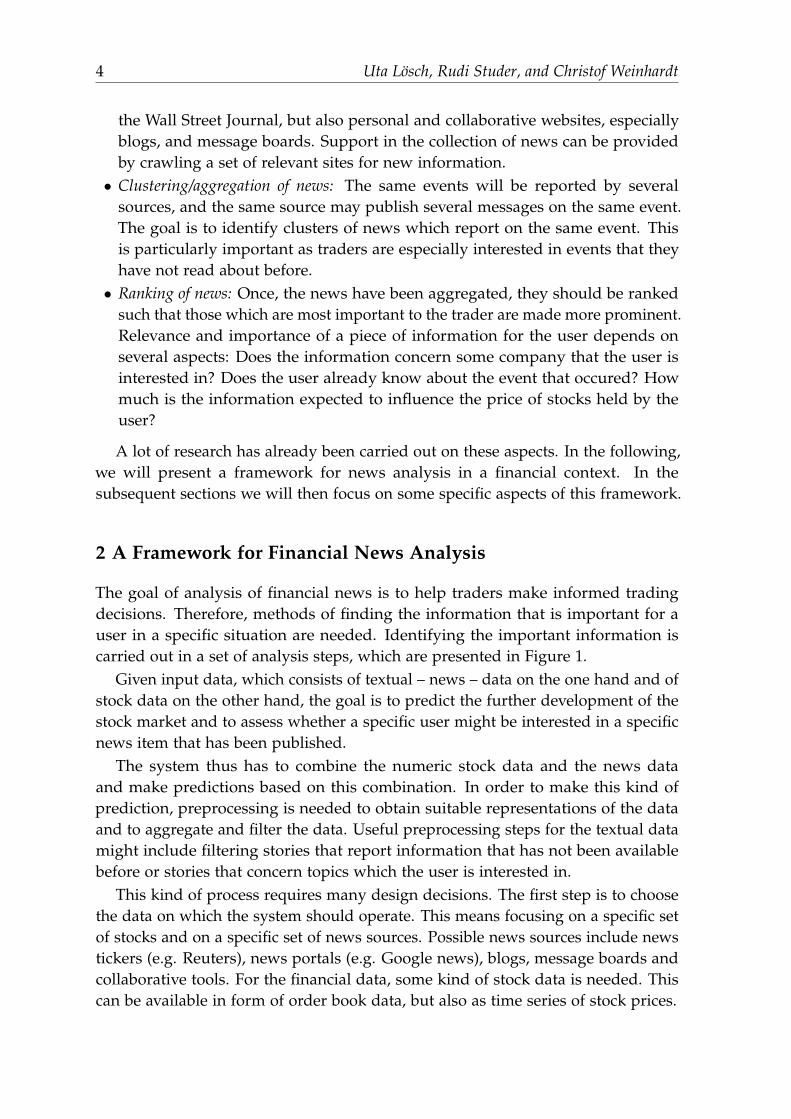
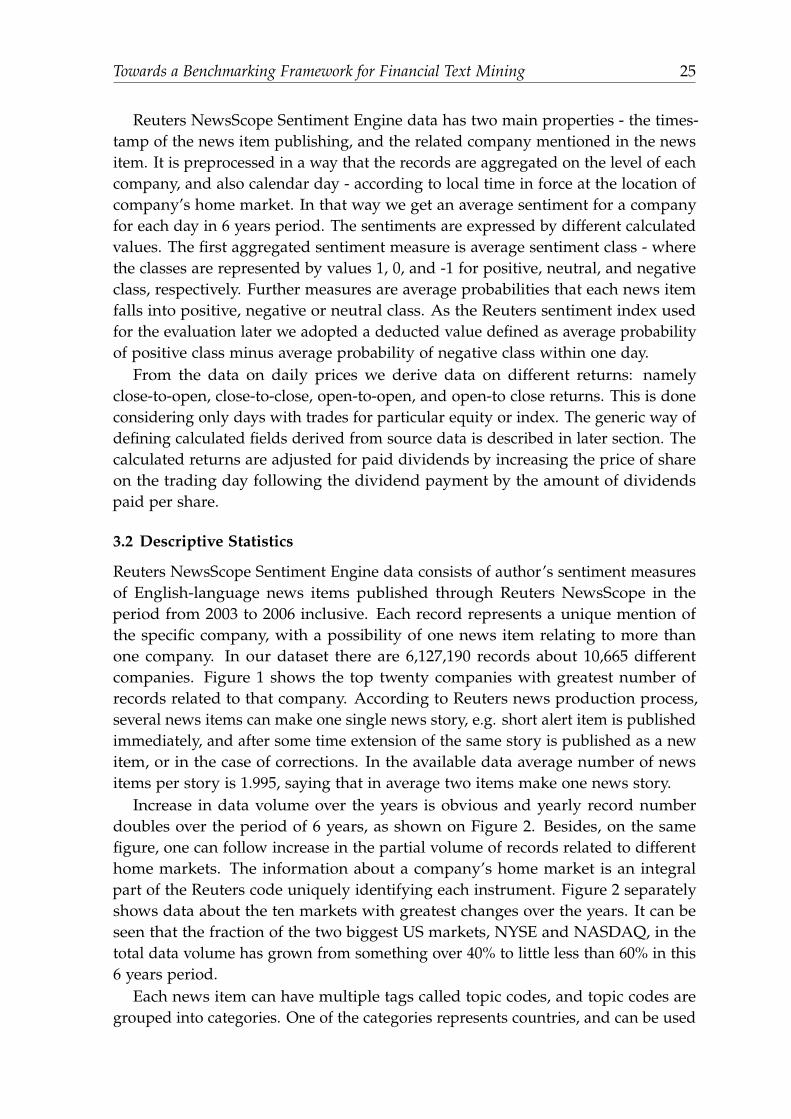
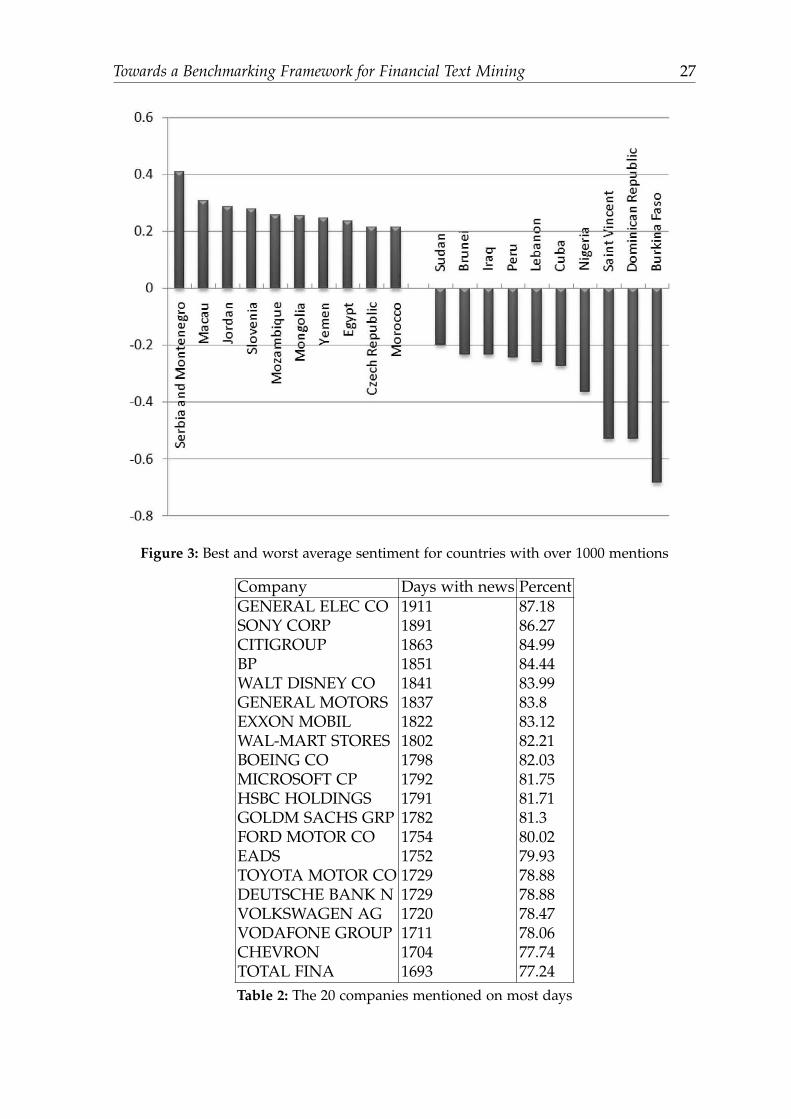
Increase in data volume over the years is obvious and yearly record numberdoubles over the period of 6 years, as shown on Figure 2. Besides, on the samefigure, one can follow increase in the partial volume of records related to differenthome markets. The information about a company’s home market is an integralpart of the Reuters code uniquely identifying each instrument. Figure 2 separatelyshows data about the ten markets with greatest changes over the years. It can beseen that the fraction of the two biggest US markets, NYSE and NASDAQ, in thetotal data volume has grown from something over 40% to little less than 60% in this6 years period.
Each news item can have multiple tags called topic codes, and topic codes aregrouped into categories. One of the categories represents countries, and can be used
26 Caslav Bozic, Ryan Riordan, Detlef Seese, and Christof Weinhardt
0
5000
10000
15000
20000
25000
30000
35000
40000
45000
GE
NE
RA
L M
OT
OR
S
CIT
IGR
OU
P
FO
RD
MO
TO
R C
O
GE
NE
RA
L E
LE
C C
O
EX
XO
N M
OB
IL
JPM
OR
GA
N C
HA
SE
BP
MIC
RO
SO
FT
CP
BO
EIN
G C
O
GO
LD
M S
AC
HS
GR
P
FR
ED
DIE
MA
C
SO
NY
CO
RP
MA
RT
ST
OR
ES
ME
RR
ILL L
YN
CH
BA
NK
OF
AM
ER
ICA
FA
NN
IE M
AE
EA
DS
TO
YO
TA
MO
TO
R C
O
DE
UT
SC
HE
BA
NK
N
HS
BC
HO
LD
ING
S
0
5000
10000
15000
20000
25000
30000
35000
40000
45000
GE
NE
RA
L M
OT
OR
S
CIT
IGR
OU
P
FO
RD
MO
TO
R C
O
GE
NE
RA
L E
LE
C C
O
EX
XO
N M
OB
IL
JPM
OR
GA
N C
HA
SE
BP
MIC
RO
SO
FT
CP
BO
EIN
G C
O
GO
LD
M S
AC
HS
GR
P
FR
ED
DIE
MA
C
SO
NY
CO
RP
WA
L-M
AR
T S
TO
RE
S
ME
RR
ILL L
YN
CH
BA
NK
OF
AM
ER
ICA
FA
NN
IE M
AE
EA
DS
TO
YO
TA
MO
TO
R C
O
DE
UT
SC
HE
BA
NK
N
HS
BC
HO
LD
ING
S
Figure 1: Top twenty companies by number of records
400000
600000
800000
1000000
1200000
1400000
1600000 rest
T
VX
MI
AX
PA
TO
DE
0
200000
400000
600000
800000
1000000
1200000
1400000
1600000
2003 2004 2005 2006 2007 2008
rest
T
VX
MI
AX
PA
TO
DE
L
O
N
Figure 2: Data volume change over years
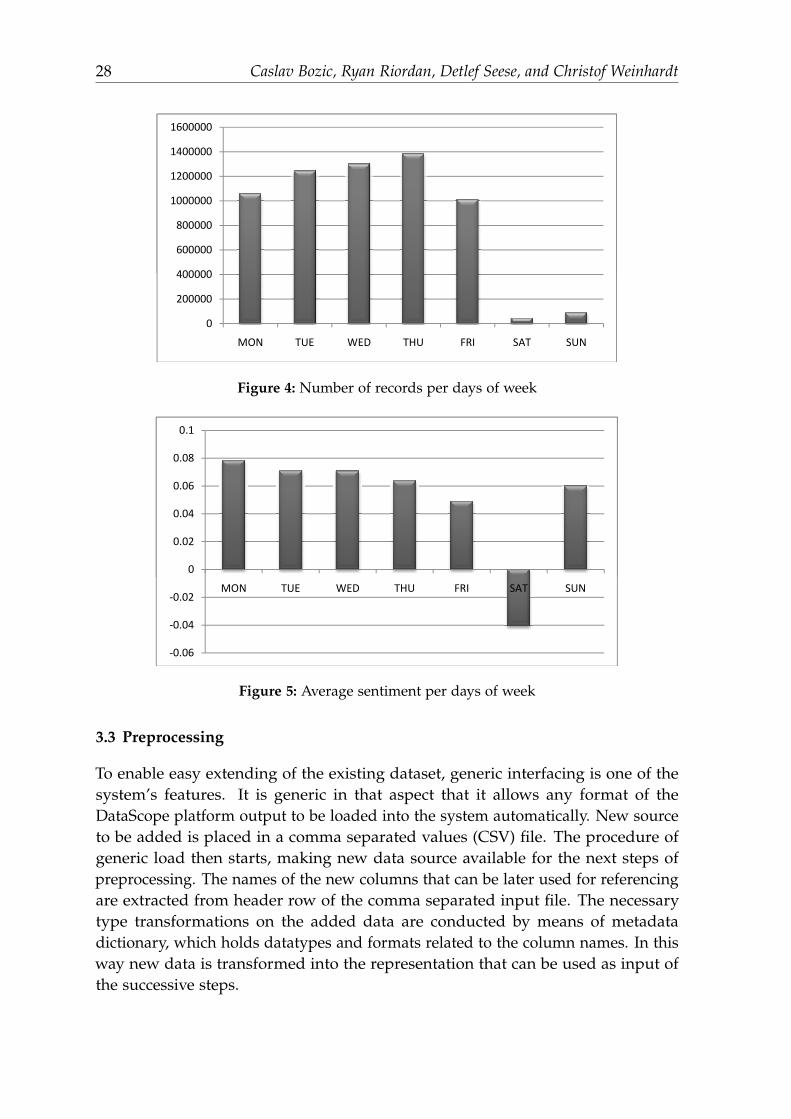
for determining what country is mentioned in the particular news item. Using thisauthor tagging feature, average sentiment per country can be calculated. The Figure3 is showing counties with greatest and lowest average sentiment, when countrytags with less than 1000 mentions are excluded.
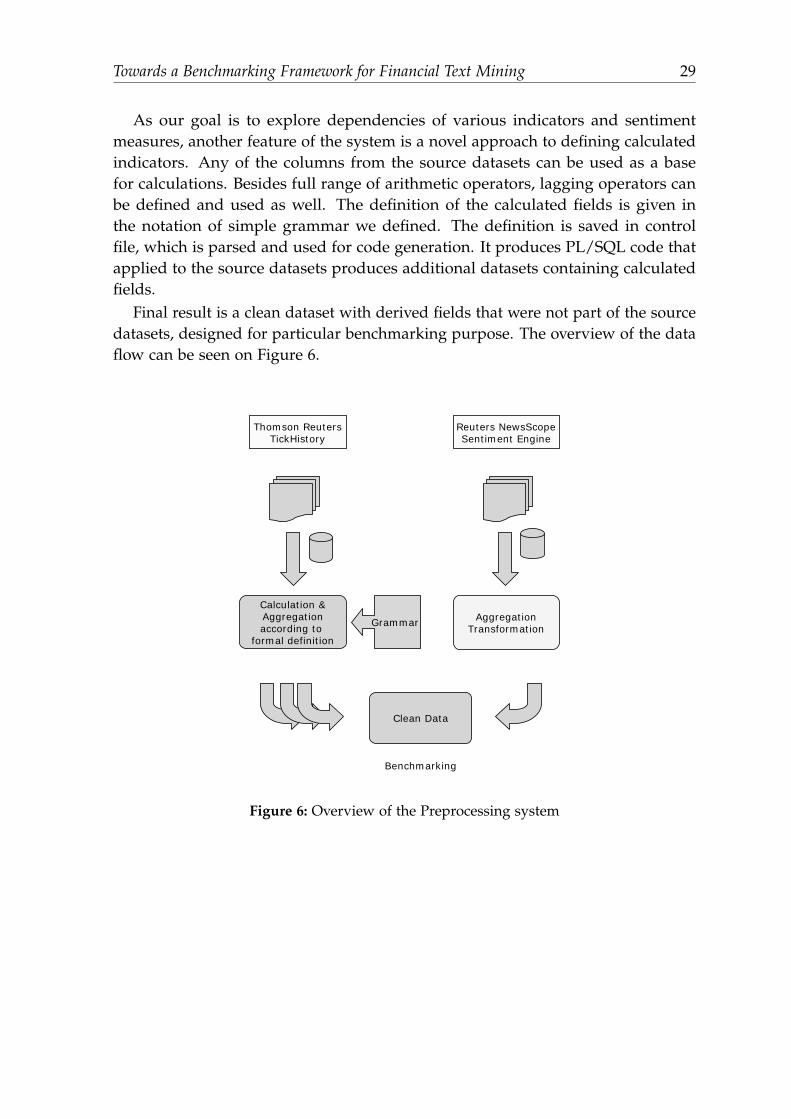
During the week, only 2.19% of all news items are published on weekends.Figure 4 shows the distribution of records per days of week. Our dataset comprisesof data spanning 2192 days in total, considering GMT time zone, and there are even13 companies that are mentioned at least once in more than 80% of all days, asshown in Table 2. One more interesting property of the data is noticeable sentimentdecrease for news items published on Saturdays, as shown on Figure 5.
Towards a Benchmarking Framework for Financial Text Mining 27
Figure 3: Best and worst average sentiment for countries with over 1000 mentions
Company Days with news PercentGENERAL ELEC CO 1911 87.18SONY CORP 1891 86.27CITIGROUP 1863 84.99BP 1851 84.44WALT DISNEY CO 1841 83.99GENERAL MOTORS 1837 83.8EXXON MOBIL 1822 83.12WAL-MART STORES 1802 82.21BOEING CO 1798 82.03MICROSOFT CP 1792 81.75HSBC HOLDINGS 1791 81.71GOLDM SACHS GRP 1782 81.3FORD MOTOR CO 1754 80.02EADS 1752 79.93TOYOTA MOTOR CO 1729 78.88DEUTSCHE BANK N 1729 78.88VOLKSWAGEN AG 1720 78.47VODAFONE GROUP 1711 78.06CHEVRON 1704 77.74TOTAL FINA 1693 77.24Table 2: The 20 companies mentioned on most days
28 Caslav Bozic, Ryan Riordan, Detlef Seese, and Christof Weinhardt
400000
600000
800000
1000000
1200000
1400000
1600000
0
200000
400000
600000
800000
1000000
1200000
1400000
1600000
MON TUE WED THU FRI SAT SUN
Figure 4: Number of records per days of week
0
0.02
0.04
0.06
0.08
0.1
-0.06
-0.04
-0.02
0
0.02
0.04
0.06
0.08
0.1
MON TUE WED THU FRI SAT SUN
Figure 5: Average sentiment per days of week
3.3 Preprocessing
To enable easy extending of the existing dataset, generic interfacing is one of thesystem’s features. It is generic in that aspect that it allows any format of theDataScope platform output to be loaded into the system automatically. New sourceto be added is placed in a comma separated values (CSV) file. The procedure ofgeneric load then starts, making new data source available for the next steps ofpreprocessing. The names of the new columns that can be later used for referencingare extracted from header row of the comma separated input file. The necessarytype transformations on the added data are conducted by means of metadatadictionary, which holds datatypes and formats related to the column names. In thisway new data is transformed into the representation that can be used as input ofthe successive steps.
Towards a Benchmarking Framework for Financial Text Mining 29
As our goal is to explore dependencies of various indicators and sentimentmeasures, another feature of the system is a novel approach to defining calculatedindicators. Any of the columns from the source datasets can be used as a basefor calculations. Besides full range of arithmetic operators, lagging operators canbe defined and used as well. The definition of the calculated fields is given inthe notation of simple grammar we defined. The definition is saved in controlfile, which is parsed and used for code generation. It produces PL/SQL code thatapplied to the source datasets produces additional datasets containing calculatedfields.
Final result is a clean dataset with derived fields that were not part of the sourcedatasets, designed for particular benchmarking purpose. The overview of the dataflow can be seen on Figure 6.Data Processing
10
Thomson ReutersTickHistory
Reuters NewsScopeSentiment Engine
Calculation &Aggregationaccording to
formal definition
Grammar AggregationTransformation
Clean Data
Benchmarking
Caslav Bozic - Towards Benchmarking Framework for Financial Text Mining
Figure 6: Overview of the Preprocessing system
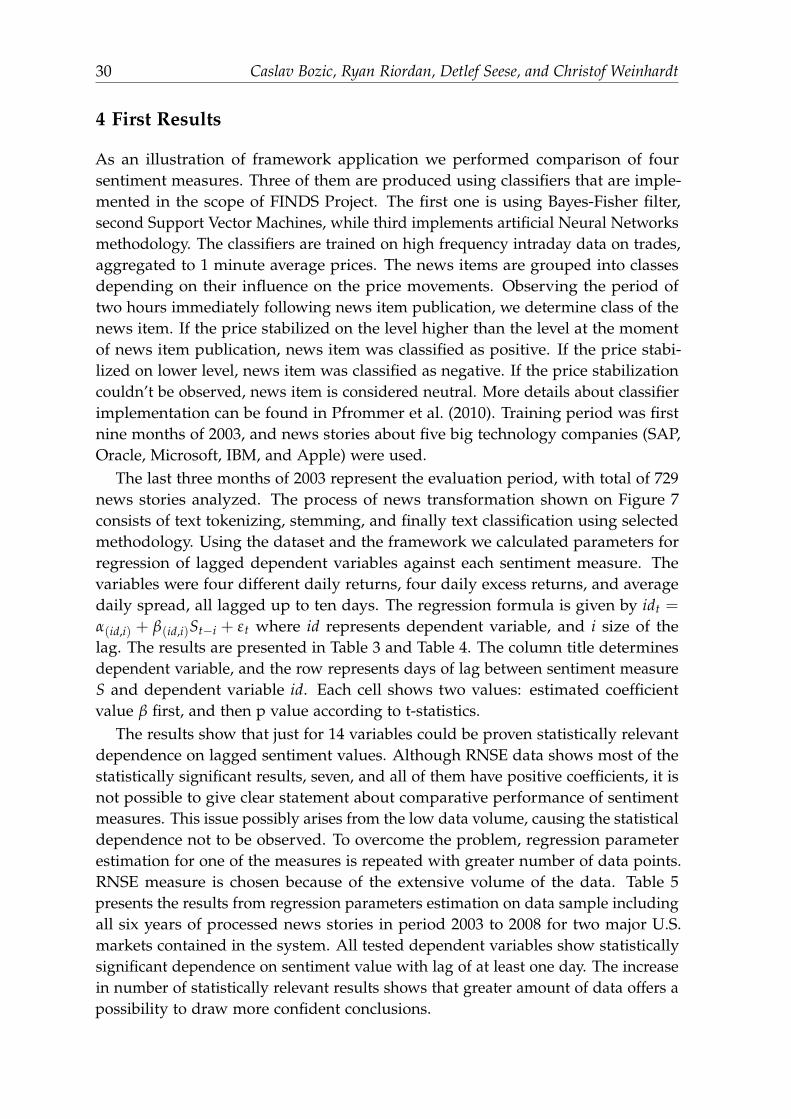
30 Caslav Bozic, Ryan Riordan, Detlef Seese, and Christof Weinhardt
4 First Results
As an illustration of framework application we performed comparison of foursentiment measures. Three of them are produced using classifiers that are imple-mented in the scope of FINDS Project. The first one is using Bayes-Fisher filter,second Support Vector Machines, while third implements artificial Neural Networksmethodology. The classifiers are trained on high frequency intraday data on trades,aggregated to 1 minute average prices. The news items are grouped into classesdepending on their influence on the price movements. Observing the period oftwo hours immediately following news item publication, we determine class of thenews item. If the price stabilized on the level higher than the level at the momentof news item publication, news item was classified as positive. If the price stabi-lized on lower level, news item was classified as negative. If the price stabilizationcouldn’t be observed, news item is considered neutral. More details about classifierimplementation can be found in Pfrommer et al. (2010). Training period was firstnine months of 2003, and news stories about five big technology companies (SAP,Oracle, Microsoft, IBM, and Apple) were used.
The last three months of 2003 represent the evaluation period, with total of 729news stories analyzed. The process of news transformation shown on Figure 7consists of text tokenizing, stemming, and finally text classification using selectedmethodology. Using the dataset and the framework we calculated parameters forregression of lagged dependent variables against each sentiment measure. Thevariables were four different daily returns, four daily excess returns, and averagedaily spread, all lagged up to ten days. The regression formula is given by idt =
α(id,i) + β(id,i)St−i + εt where id represents dependent variable, and i size of thelag. The results are presented in Table 3 and Table 4. The column title determinesdependent variable, and the row represents days of lag between sentiment measureS and dependent variable id. Each cell shows two values: estimated coefficientvalue β first, and then p value according to t-statistics.
The results show that just for 14 variables could be proven statistically relevantdependence on lagged sentiment values. Although RNSE data shows most of thestatistically significant results, seven, and all of them have positive coefficients, it isnot possible to give clear statement about comparative performance of sentimentmeasures. This issue possibly arises from the low data volume, causing the statisticaldependence not to be observed. To overcome the problem, regression parameterestimation for one of the measures is repeated with greater number of data points.RNSE measure is chosen because of the extensive volume of the data. Table 5presents the results from regression parameters estimation on data sample includingall six years of processed news stories in period 2003 to 2008 for two major U.S.markets contained in the system. All tested dependent variables show statisticallysignificant dependence on sentiment value with lag of at least one day. The increasein number of statistically relevant results shows that greater amount of data offers apossibility to draw more confident conclusions.

Towards a Benchmarking Framework for Financial Text Mining 31
Bay
es-F
ish
er
la
g cc
oo
co
oc
sp
read
eccc
ecoo
ecco
ecoc
1 -0
.008
24
0.11
-0
.003
16
0.54
-0
.006
41
0.15
-0
.001
82
0.48
0.
0001
3175
0.
45
-0.0
0646
0.
23
-0.0
0439
0.
40
-0.0
0386
0.
43
-0.0
026
0.24
2
-0.0
0212
0.
72
-0.0
0557
0.
19
-0.0
0046
567
0.93
-0
.001
65
0.54
-0
.000
1933
70.
18
-0.0
039
0.53
-0
.002
63
0.47
-0
.002
52
0.65
-0
.001
47
0.54
3
-0.0
0056
663
0.91
-0
.004
66
0.29
-0
.002
43
0.54
0.
0018
7 0.
49
-0.0
0063
3 0.
01
-0.0
028
0.53
-0
.000
9659
20.
79
-0.0
0301
0.
44
0.00
0298
81
0.90
4
-0.0
0646
0.
15
0.00
26
0.51
-0
.006
67
0.10
0.
0002
0725
0.
93
-0.0
0049
77
0.07
-0
.003
57
0.40
0.
0008
996
0.77
-0
.003
3 0.
40
-0.0
0020
749
0.91
5
-0.0
0032
704
0.94
-0
.000
1323
2 0.
97
0.00
193
0.61
-0
.002
25
0.32
-0
.000
1992
80.
30
0.00
223
0.60
-0
.001
48
0.64
0.
0024
2 0.
51
-0.0
0016
307
0.93
6
0.00
34
0.42
-0
.001
63
0.67
0.
0026
0.
43
0.00
0797
63
0.73
-0
.000
5966
0.
04
0.00
0362
64
0.92
-0
.000
8124
10.
83
0.00
0379
01
0.89
-0
.000
0045
5 1.
00
7 0.
0013
9 0.
75
0.00
642
0.12
-0
.002
34
0.47
0.
0037
3 0.
17
-0.0
0034
695
0.26
0.
0032
6 0.
41
0.00
584
0.17
-0
.000
9226
20.
73
0.00
424
0.11
8
0.00
172
0.69
-0
.000
9565
8 0.
81
0.00
291
0.36
-0
.001
19
0.65
-0
.000
121
0.54
0.
0016
5 0.
68
0.00
262
0.50
0.
0010
6 0.
70
0.00
0620
9 0.
80
9 -0
.003
43
0.27
-0
.005
7 0.
11
0.00
0230
65
0.93
-0
.003
66
0.08
-0
.000
4424
0.
01
-0.0
0181
0.
53
-0.0
0642
0.
09
0.00
206
0.42
-0
.003
85
0.05
10
-0
.004
11
0.19
-0
.003
8 0.
25
-0.0
0204
0.
49
-0.0
0207
0.
21
-0.0
0007
904
0.64
-0
.002
31
0.41
-0
.006
19
0.05
-0
.000
1007
40.
97
-0.0
0218
0.
12
S
V
M
lag
cc
oo
co
oc
spre
ad
ec
cc
ec
oo
ec
co
ec
oc
1
0.00
102
0.83
-0
.003
39
0.48
-0
.001
01
0.81
0.
0020
3 0.
40
-0.0
0003
017
0.76
-0
.001
04
0.85
0.
0012
7 0.
81
-0.0
027
0.59
0.
0016
9 0.
46
2 -0
.003
3 0.
56
-0.0
0377
0.
36
-0.0
0499
0.
31
0.00
169
0.52
-0
.000
0437
60.
65
-0.0
0535
0.
38
0.00
371
0.30
-0
.006
37
0.24
0.
0010
5 0.
65
3 -0
.003
25
0.48
-0
.003
13
0.46
-0
.005
68
0.14
0.
0024
3 0.
36
-0.0
0009
86
0.59
-0
.003
53
0.43
-0
.001
49
0.68
-0
.004
78
0.21
0.
0012
8 0.
58
4 -0
.002
81
0.54
-0
.001
86
0.64
-0
.004
5 0.
28
0.00
169
0.45
-0
.000
0466
70.
83
-0.0
0236
0.
58
-0.0
0109
0.
73
-0.0
0413
0.
30
0.00
179
0.34
5
-0.0
0022
28
0.96
-0
.000
5497
9 0.
89
-0.0
0288
0.
46
0.00
266
0.25
0.
0000
0991
0.
96
0.00
0273
64
0.95
0.
0011
9 0.
72
-0.0
0215
0.
56
0.00
239
0.22
6
0.00
218
0.62
0.
0015
6 0.
69
-0.0
0253
0.
47
0.00
471
0.05
-0
.000
2602
20.
41
0.00
148
0.72
0.
0039
0.
35
-0.0
0121
0.
70
0.00
27
0.28
7
-0.0
0014
802
0.97
0.
0021
0.
63
-0.0
0358
0.
29
0.00
344
0.22
-0
.000
0072
10.
99
0.00
29
0.48
0.
0049
2 0.
26
-0.0
0128
0.
66
0.00
416
0.13
8
-0.0
0127
0.
78
-0.0
0473
0.
25
-0.0
0147
0.
66
0.00
0199
47
0.94
0.
0004
5594
0.
13
0.00
114
0.80
-0
.004
54
0.29
0.
0004
2362
0.
89
0.00
0720
89
0.79
9
-0.0
0316
0.
33
-0.0
0257
0.
49
-0.0
0493
0.
09
0.00
177
0.42
-0
.000
1396
70.
57
-0.0
0421
0.
16
-0.0
0391
0.
31
-0.0
043
0.10
0.
0000
8207
0.
97
10
-0.0
0112
0.
73
0.00
43
0.21
-0
.004
34
0.16
0.
0032
2 0.
06
0.00
0465
03
0.13
-0
.000
3814
0.
90
0.00
532
0.12
-0
.003
34
0.23
0.
0029
7 0.
05
Tab
le
3:
Para
met
er
estim
ate
and
p
valu
e fo
r la
gged
se
ntim
ent
mea
sure
s pro
duce
d
by
Bay
es-F
isch
er
and
SVM
cl
assi
fier
sTa
ble
3:Pa
ram
eter
esti
mat
ean
dp
valu
efo
rla
gged
sent
imen
tm
easu
res
prod
uced
byBa
yes-
Fish
eran
dSV
Mcl
assi
fiers
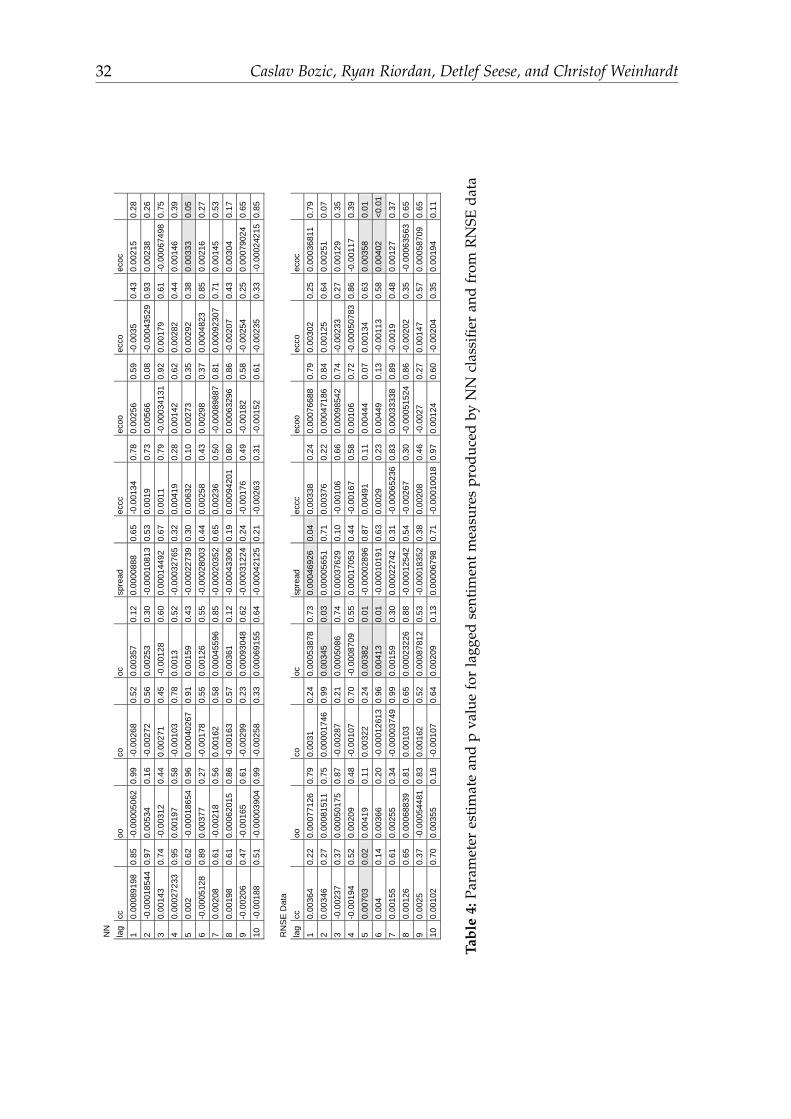
32 Caslav Bozic, Ryan Riordan, Detlef Seese, and Christof Weinhardt N
N
lag
cc
oo
co
oc
spre
ad
ec
cc
ec
oo
ec
co
ec
oc
1
0.00
0891
98
0.85
-0
.000
0506
2 0.
99
-0.0
0268
0.
52
0.00
357
0.12
0.
0000
888
0.65
-0
.001
34
0.78
0.
0025
6 0.
59
-0.0
035
0.43
0.
0021
5 0.
28
2 -0
.000
1854
40.
97
0.00
534
0.16
-0
.002
72
0.56
0.
0025
3 0.
30
-0.0
0010
813
0.53
0.
0019
0.
73
0.00
566
0.08
-0
.000
4352
90.
93
0.00
238
0.26
3
0.00
143
0.74
-0
.003
12
0.44
0.
0027
1 0.
45
-0.0
0128
0.
60
0.00
0144
92
0.67
0.
0011
0.
79
-0.0
0034
131
0.92
0.
0017
9 0.
61
-0.0
0067
498
0.75
4
0.00
0272
33
0.95
0.
0019
7 0.
58
-0.0
0103
0.
78
0.00
13
0.52
-0
.000
3276
50.
32
0.00
419
0.28
0.
0014
2 0.
62
0.00
282
0.44
0.
0014
6 0.
39
5 0.
002
0.62
-0
.000
1865
4 0.
96
0.00
0402
67
0.91
0.
0015
9 0.
43
-0.0
0022
739
0.30
0.
0063
2 0.
10
0.00
273
0.35
0.
0029
2 0.
38
0.00
333
0.05
6
-0.0
0051
28
0.89
0.
0037
7 0.
27
-0.0
0178
0.
55
0.00
126
0.55
-0
.000
2800
30.
44
0.00
258
0.43
0.
0029
8 0.
37
0.00
0482
3 0.
85
0.00
216
0.27
7
0.00
208
0.61
-0
.002
18
0.56
0.
0016
2 0.
58
0.00
0455
96
0.85
-0
.000
2035
20.
65
0.00
236
0.50
-0
.000
8988
70.
81
0.00
0923
07
0.71
0.
0014
5 0.
53
8 0.
0019
8 0.
61
0.00
0620
15
0.86
-0
.001
63
0.57
0.
0036
1 0.
12
-0.0
0043
306
0.19
0.
0009
4201
0.
80
0.00
0632
96
0.86
-0
.002
07
0.43
0.
0030
4 0.
17
9 -0
.002
06
0.47
-0
.001
65
0.61
-0
.002
99
0.23
0.
0009
3048
0.
62
-0.0
0031
224
0.24
-0
.001
76
0.49
-0
.001
82
0.58
-0
.002
54
0.25
0.
0007
9024
0.
65
10
-0.0
0188
0.
51
-0.0
0003
904
0.99
-0
.002
58
0.33
0.
0006
9155
0.
64
-0.0
0042
125
0.21
-0
.002
63
0.31
-0
.001
52
0.61
-0
.002
35
0.33
-0
.000
2421
5 0.
85
R
NS
E D
a
ta
lag
cc
oo
co
oc
spre
ad
ec
cc
ec
oo
ec
co
ec
oc
1
0.00
364
0.22
0.
0007
7126
0.
79
0.00
31
0.24
0.
0005
3878
0.
73
0.00
0469
26
0.04
0.
0033
8 0.
24
0.00
0766
88
0.79
0.
0030
2 0.
25
0.00
0368
11
0.79
2
0.00
346
0.27
0.
0008
1511
0.
75
0.00
0017
46
0.99
0.
0034
5 0.
03
0.00
0056
51
0.71
0.
0037
6 0.
22
0.00
0471
86
0.84
0.
0012
5 0.
64
0.00
251
0.07
3
-0.0
0237
0.
37
0.00
0501
75
0.87
-0
.002
87
0.21
0.
0005
086
0.74
0.
0003
7629
0.
10
-0.0
0106
0.
66
0.00
0985
42
0.74
-0
.002
33
0.27
0.
0012
9 0.
35
4 -0
.001
94
0.52
0.
0020
9 0.
48
-0.0
0107
0.
70
-0.0
0087
09
0.55
0.
0001
7053
0.
44
-0.0
0167
0.
58
0.00
106
0.72
-0
.000
5078
30.
86
-0.0
0117
0.
39
5 0.
0070
3 0.
02
0.00
419
0.11
0.
0032
2 0.
24
0.00
382
0.01
-0
.000
0289
60.
87
0.00
491
0.11
0.
0044
4 0.
07
0.00
134
0.63
0.
0035
8 0.
01
6 0.
004
0.14
0.
0036
6 0.
20
-0.0
0012
613
0.96
0.
0041
3 0.
01
-0.0
0010
191
0.63
0.
0029
0.
23
0.00
449
0.13
-0
.001
13
0.58
0.
0040
2 <0
.01
7 0.
0015
5 0.
61
0.00
255
0.34
-0
.000
0374
90.
99
0.00
159
0.30
0.
0002
2742
0.
31
-0.0
0065
236
0.83
0.
0003
3338
0.
89
-0.0
019
0.48
0.
0012
7 0.
37
8 0.
0012
6 0.
65
0.00
0688
39
0.81
0.
0010
3 0.
65
0.00
0232
26
0.88
-0
.000
1254
20.
54
-0.0
0267
0.
30
-0.0
0051
524
0.86
-0
.002
02
0.35
-0
.000
6356
3 0.
65
9 0.
0025
0.
37
-0.0
0054
481
0.83
0.
0016
2 0.
52
0.00
0878
12
0.53
-0
.000
1835
20.
38
0.00
208
0.46
-0
.002
7 0.
27
0.00
147
0.57
0.
0005
8709
0.
65
10
0.00
102
0.70
0.
0035
5 0.
16
-0.0
0107
0.
64
0.00
209
0.13
0.
0000
6798
0.
71
-0.0
0010
018
0.97
0.
0012
4 0.
60
-0.0
0204
0.
35
0.00
194
0.11
Tab
le 4
: Pa
ram
eter
est
imat
e an
d p
val
ue
for
lagged
sen
tim
ent
mea
sure
s pro
duce
d b
y N
N c
lass
ifie
r an
d f
rom
RN
SE d
ata
Ta
ble
4:Pa
ram
eter
esti
mat
ean
dp
valu
efo
rla
gged
sent
imen
tm
easu
res
prod
uced
byN
Ncl
assi
fier
and
from
RN
SEda
ta
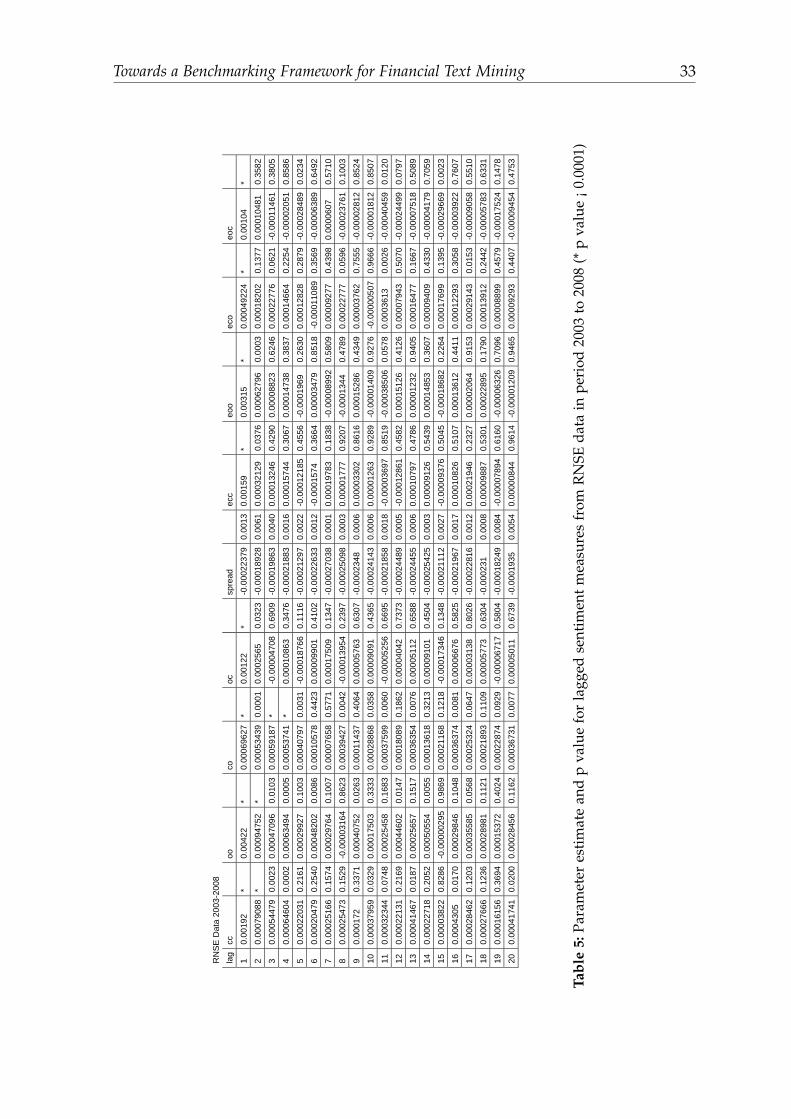
Towards a Benchmarking Framework for Financial Text Mining 33
RN
SE
Dat
a 20
03-2
008
lag
cc
oo
co
oc
spre
ad
ec
c
eoo
ec
o
eoc
1 0.
0019
2 *
0.00
422
* 0.
0006
9627
* 0.
0012
2 *
-0.0
0022
379
0.00
13
0.00
159
* 0.
0031
5 *
0.00
0492
24
* 0.
0010
4 *
2 0.
0007
9088
*
0.00
0947
52
* 0.
0005
3439
0.00
010.
0002
565
0.03
23-0
.000
1892
80.
0061
0.
0003
2129
0.
0376
0.00
0627
96
0.00
030.
0001
8202
0.
1377
0.00
0104
81
0.35
82
3 0.
0005
4479
0.
0023
0.00
0470
96
0.01
03
0.00
0591
87*
-0.0
0004
708
0.69
09-0
.000
1986
30.
0040
0.
0001
3246
0.
4290
0.00
0088
23
0.62
460.
0002
2776
0.
0621
-0.0
0011
461
0.38
05
4 0.
0006
4604
0.
0002
0.00
0634
94
0.00
05
0.00
0537
41*
0.00
0108
63
0.34
76-0
.000
2188
30.
0016
0.
0001
5744
0.
3067
0.00
0147
38
0.38
370.
0001
4664
0.
2254
-0.0
0002
051
0.85
86
5 0.
0002
2031
0.
2161
0.00
0299
27
0.10
03
0.00
0407
970.
0031
-0.0
0018
766
0.11
16-0
.000
2129
70.
0022
-0
.000
1218
50.
4556
-0.0
0019
69
0.26
300.
0001
2828
0.
2879
-0.0
0028
489
0.02
34
6 0.
0002
0479
0.
2540
0.00
0482
02
0.00
86
0.00
0105
780.
4423
0.00
0099
01
0.41
02-0
.000
2263
30.
0012
-0
.000
1574
0.
3664
0.00
0034
79
0.85
18-0
.000
1108
90.
3569
-0.0
0006
389
0.64
92
7 0.
0002
5166
0.
1574
0.00
0297
64
0.10
07
0.00
0076
580.
5771
0.00
0175
09
0.13
47-0
.000
2703
80.
0001
0.
0001
9783
0.
1838
-0.0
0008
992
0.58
090.
0000
9277
0.
4398
0.00
0060
7 0.
5710
8
0.00
0254
73
0.15
29-0
.000
0316
4 0.
8623
0.
0003
9427
0.00
42-0
.000
1395
40.
2397
-0.0
0025
098
0.00
03
0.00
0017
77
0.92
07-0
.000
1344
0.
4789
0.00
0227
77
0.05
96-0
.000
2376
1 0.
1003
9
0.00
0172
0.
3371
0.00
0407
52
0.02
63
0.00
0114
370.
4064
0.00
0057
63
0.63
07-0
.000
2348
0.
0006
0.
0000
3302
0.
8616
0.00
0152
86
0.43
490.
0000
3762
0.
7555
-0.0
0002
812
0.85
24
10
0.00
0379
59
0.03
290.
0001
7503
0.
3333
0.
0002
8868
0.03
580.
0000
9091
0.
4365
-0.0
0024
143
0.00
06
0.00
0012
63
0.92
89-0
.000
0140
90.
9276
-0.0
0000
507
0.96
66-0
.000
0181
2 0.
8507
11
0.
0003
2344
0.
0748
0.00
0254
58
0.16
83
0.00
0375
990.
0060
-0.0
0005
256
0.66
95-0
.000
2185
80.
0018
-0
.000
0369
70.
8519
-0.0
0038
506
0.05
780.
0003
613
0.00
26-0
.000
4045
9 0.
0120
12
0.
0002
2131
0.
2169
0.00
0446
02
0.01
47
0.00
0180
890.
1862
0.00
0040
42
0.73
73-0
.000
2448
90.
0005
-0
.000
1286
10.
4582
0.00
0151
26
0.41
260.
0000
7943
0.
5070
-0.0
0024
499
0.07
97
13
0.00
0414
67
0.01
870.
0002
5657
0.
1517
0.
0003
6354
0.00
760.
0000
5112
0.
6588
-0.0
0024
455
0.00
06
0.00
0107
97
0.47
860.
0000
1232
0.
9405
0.00
0164
77
0.16
67-0
.000
0751
8 0.
5089
14
0.
0002
2718
0.
2052
0.00
0505
54
0.00
55
0.00
0136
180.
3213
0.00
0091
01
0.45
04-0
.000
2542
50.
0003
0.
0000
9126
0.
5439
0.00
0148
53
0.36
070.
0000
9409
0.
4330
-0.0
0004
179
0.70
59
15
0.00
0038
22
0.82
86-0
.000
0029
5 0.
9869
0.
0002
1168
0.12
18-0
.000
1734
60.
1348
-0.0
0021
112
0.00
27
-0.0
0009
376
0.50
45-0
.000
1868
20.
2264
0.00
0176
99
0.13
95-0
.000
2966
9 0.
0023
16
0.
0004
305
0.01
700.
0002
9846
0.
1048
0.
0003
6374
0.00
810.
0000
6676
0.
5825
-0.0
0021
967
0.00
17
0.00
0108
26
0.51
070.
0001
3612
0.
4411
0.00
0122
93
0.30
58-0
.000
0392
2 0.
7607
17
0.
0002
8462
0.
1203
0.00
0355
85
0.05
68
0.00
0253
240.
0647
0.00
0031
38
0.80
26-0
.000
2281
60.
0012
0.
0002
1946
0.
2327
0.00
0020
64
0.91
530.
0002
9143
0.
0153
-0.0
0009
058
0.55
10
18
0.00
0276
66
0.12
360.
0002
8981
0.
1121
0.
0002
1893
0.11
090.
0000
5773
0.
6304
-0.0
0023
1 0.
0008
0.
0000
9887
0.
5301
0.00
0228
95
0.17
900.
0001
3912
0.
2442
-0.0
0005
783
0.63
31
19
0.00
0161
56
0.36
940.
0001
5372
0.
4024
0.
0002
2874
0.09
29-0
.000
0671
70.
5804
-0.0
0018
249
0.00
84
-0.0
0007
894
0.61
60-0
.000
0632
60.
7096
0.00
0088
99
0.45
79-0
.000
1752
4 0.
1478
20
0.
0004
1741
0.
0200
0.00
0284
56
0.11
62
0.00
0367
310.
0077
0.00
0050
11
0.67
39-0
.000
1935
0.
0054
0.
0000
0844
0.
9614
-0.0
0001
209
0.94
650.
0000
9293
0.
4407
-0.0
0009
454
0.47
53
T abl
e5:
Para
met
eres
tim
ate
and
pva
lue
for
lagg
edse
ntim
ent
mea
sure
sfr
omR
NSE
data
inpe
riod
2003
to20
08(*
pva
lue
¡0.0
001)
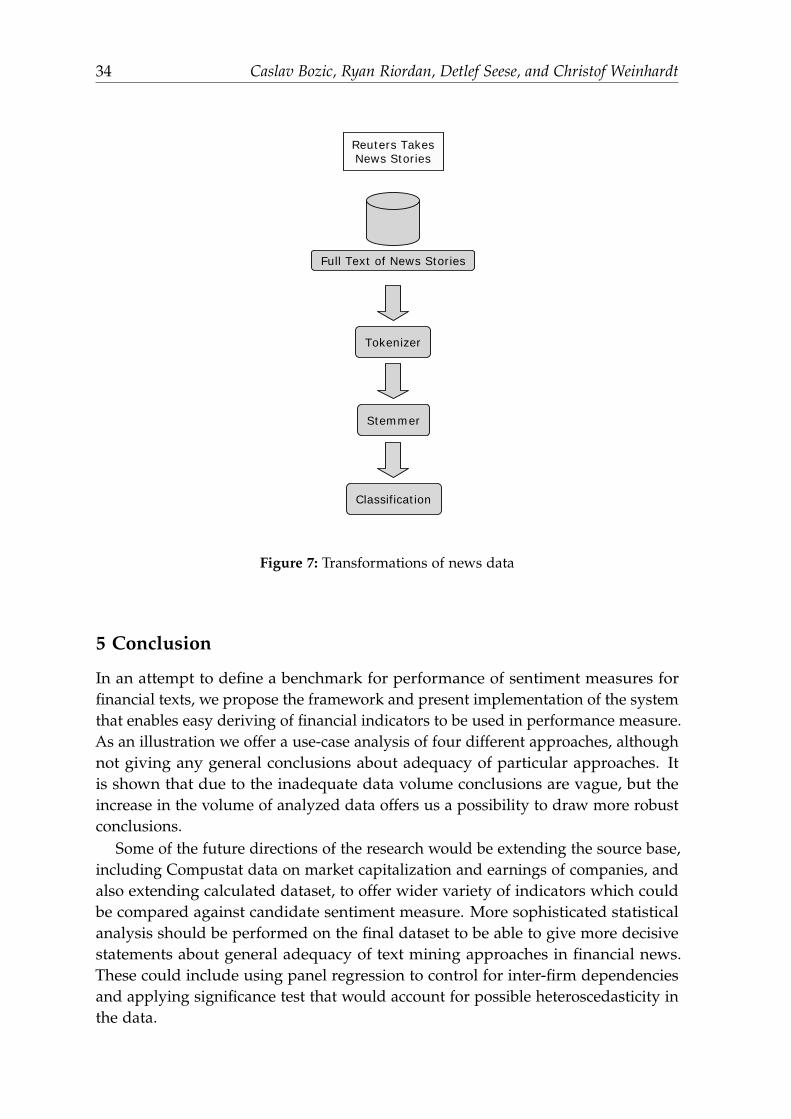
34 Caslav Bozic, Ryan Riordan, Detlef Seese, and Christof WeinhardtFirst Results
12 Caslav Bozic - Towards Benchmarking Framework for Financial Text Mining
Tokenizer
Stemmer
Classification
Reuters TakesNews Stories
Full Text of News Stories
3 classifiersBayes – FisherSVMNeural Network
Figure 7: Transformations of news data
5 Conclusion
In an attempt to define a benchmark for performance of sentiment measures forfinancial texts, we propose the framework and present implementation of the systemthat enables easy deriving of financial indicators to be used in performance measure.As an illustration we offer a use-case analysis of four different approaches, althoughnot giving any general conclusions about adequacy of particular approaches. Itis shown that due to the inadequate data volume conclusions are vague, but theincrease in the volume of analyzed data offers us a possibility to draw more robustconclusions.
Some of the future directions of the research would be extending the source base,including Compustat data on market capitalization and earnings of companies, andalso extending calculated dataset, to offer wider variety of indicators which couldbe compared against candidate sentiment measure. More sophisticated statisticalanalysis should be performed on the final dataset to be able to give more decisivestatements about general adequacy of text mining approaches in financial news.These could include using panel regression to control for inter-firm dependenciesand applying significance test that would account for possible heteroscedasticity inthe data.
Towards a Benchmarking Framework for Financial Text Mining 35
References
Antweiler, W. and M. Z. Frank (2004): “Is All That Talk Just Noise? The InformationContent of InternetStock Message Boards,” The Journal of Finance, 59(3), pp. 1259–1294.
Bozic, C. (2009): “FINDS - Integrative services,” in: Computer Systems and Applications,2009. AICCSA 2009. IEEE/ACS International Conference on, pp. 61–62.
Das, S. and M. Chen (2007): “Yahoo! for Amazon: Sentiment extraction from smalltalk on the web,” Management Science, 53(9), pp. 1375–1388.
Fung, G. P. C., J. X. Yu, and W. Lam (2003): “Stock prediction: Integrating textmining approach using real-time news,” in: Computational Intelligence for FinancialEngineering, 2003. Proceedings. 2003 IEEE International Conference on, pp. 395 – 402.
Gidofalvi, G. and C. Elkan (2003): “Using news articles to predict stock price move-ments,” Department of Computer Science and Engineering, University of California,San Diego.
Hevner, A. R., S. T. March, J. Park, and S. Ram (2004): “Design Science in InformationSystems Research,” MIS Quarterly, 28(1), pp. 75–105.
Lavrenko, V., M. Schmill, D. Lawrie, P. Ogilvie, D. Jensen, and J. Allan (2000):“Mining of Concurrent Text and Time-Series,” in: Sixth ACM SIGKDD InternationalConference on Knowledge Discovery and Data Mining.
Mittermayer, M. and G. Knolmayer (2006a): “Text mining systems for marketresponse to news: A survey,” Institute of Informations Systems, University of Bern.
Mittermayer, M.-A. and G. F. Knolmayer (2006b): “NewsCATS: A News Categoriza-tion and Trading System,” Data Mining, IEEE International Conference on, 0, pp.1002–1007.
Pfrommer, J., C. Hubschneider, and S. Wenzel (2010): “Sentiment Analysis on StockNews using Historical Data and Machine Learning Algorithms,” Term Paper,Karlsruhe Institute of Technology (KIT).
Schulz, A., M. Spiliopoulou, and K. Winkler (2003): “Kursrelevanzprognose vonAd-hoc-Meldungen: Text Mining wider die Informationsuberlastung im MobileBanking,” Wirtschaftsinformatik, 2, pp. 181–200.
Tetlock, P. (2007): “Giving Content to Investor Sentiment: The Role of Media in theStock Market,” Journal of Finance, 62(3).
Tetlock, P., M. Saar-Tsechansky, and S. Macskassy (2008): “More Than Words:Quantifying Language to Measure Firms’ Fundamentals,” Journal of Finance, 63(3),pp. 1437–1467.
Thomas, J. (2003): News and trading rules, Ph.D. thesis, Carnegie Mellon University.Wuthrich, B., D. Permunetilleke, S. Leung, V. Cho, J. Zhang, and W. Lam (1998):
“Daily prediction of major stock indices from textual www data,” 1998 IEEEInternational Conference on Systems, Man, and Cybernetics.

The Impact of Economic News on Information andLiquidity in Electronic Futures Trading
Andreas Storkenmaier1, Ryan Riordan1, Christof Weinhardt1, and Rudi Studer2
1 Institute of Information Systems and Management, KITandreas.storkenmaier,ryan.riordan,[email protected]
2 Institute of Applied Informatics and Formal Description Methods, [email protected]
Summary. In this paper we analyze the effect of the release of U.S. unemployment numberson information, liquidity, and trading activity in German Bund Futures. Our samplecomprises the years 2000 to 2009 of Eurex traded futures. We find that liquidity and tradingactivity is lower pre-announcement associated with high adverse selection costs. Liquidityrecovers and adverse selection stays on a slightly higher level than normal within thirtyminutes after announcements. Trading activity drastically increases and stays on a highlevel during the first thirty minutes after announcements. Our findings are consistent withexisting empirical literature. We find that the Euro-Bund Futures market is a highly liquidand efficient market that incorporates public information fast. Private information arisesthrough varying information processing and gathering capabilities of market participants.
During the last decades, futures trading on government bonds has risen to con-stitute a major part of trading in financial instruments. This paper analyzes howinformation asymmetry and liquidity develops around U.S. unemployment rate an-nouncements in trading of German Bund Futures. Bund Futures belong to Europe’smost traded securities. With Eurex, we specifically analyze a highly automatedelectronic market suitable for automated trading. Macroeconomic news are, addi-tionally to official government outlets, also released through news wire networks ofBloomberg, Thomson Reuters, and Dow Jones. Recent evidence from the foreignexchange (FX) market suggests that algorithmic traders also use macroeconomicnews as input parameters (Chaboud et al., 2009). Algorithmic traders automaticallypull out of the FX market around macroeconomic news announcements to reducepotential adverse selection costs. The role of information and liquidity has long beenof interest to market microstructure research. In combination with recent develop-ments in trading systems and market automation the question of information andliquidity around macroeconomic news events in electronic markets is interesting toresearchers and practitioners alike.
Our study shows, consistent with existing literature, higher adverse selectioncosts around macroeconomic news, lower liquidity, and higher trading intensitypost announcements. We find that the Euro-Bund Futures market is a highly liquid
38 A. Storkenmaier, R. Riordan, C. Weinhardt, R. Studer
and efficient market that incorporates public information fast. Private informationarises through varying information processing and gathering capabilities of marketparticipants.
The remainder of the paper is structured as follows. Section 1 gives a literatureoverview, section 2 provides information about Eurex’s institutional details andsection 3 describes the unemployment and transaction data. Section 4 explains ourresearch design. Section 5 provides the results and section 6 finally concludes.
1 Literature Review
The notion of information in markets, its impact, and its relevance has triggeredlots of research in the area of market microstructure during the last forty years. Onefundamental model is the Glosten and Milgrom (1985) model which also providesthe theoretical foundation for the Madhavan et al. (1997) model used in this paper.The main contribution of the Glosten and Milgrom model is that it shows howbid-ask spreads can emerge independently from exogenous transaction costs andthat private information is impounded into prices through order flow. Liquiditysuppliers revise their expectations about an asset’s value depending on whethertrades are buys or sells. Since liquidity suppliers try to safeguard themselves againstinformed traders the amount of private information is reflected through the adverseselection component in the spread.
This paper does not analyze general aspects of information and liquidity inGerman Bund futures trading but concentrates on the effects in trading aroundmacroeconomic news announcements. In equity markets private information fun-damentally consists of information about future cash flows. However, there shouldnot be substantial private information about future cash flows of government bonds.From a theoretical point of view there are models that analyze effects before andafter anticipated announcements. Kim and Verrecchia (1991) formulate a modelwhich explains private information prior to an anticipated announcement such asearnings announcements. Traders acquire costly private information to trade inadvance of a public announcement. Kim and Verrecchia (1994) introduce a modelwith the notion that different traders have different capabilities to interpret earningsannouncements. This might lead to an increase in adverse selection costs associatedwith a reduction in liquidity. However, according to their model trading volumemight still increase despite a decrease in liquidity around earnings announcements.In short, their paper “suggests a model of trade in which financial accountingdisclosures simultaneoulsy induce increased information asymmetry, less liquidity,and more trading volume” (Kim and Verrecchia, 1994). Economic news indicatorsare similar to earnings announcements in that there should be no other prior directprivate information source and the information contained in the news might beinterpreted differently by different market participants. Kim and Verrecchia (1997)provide an extension of their 1994 model in which they incorporate the effects of pre-
The Impact of Economic News on Trading 39
announcement anticipation and private information as well as post-announcementpublic event-period information.
Additional to theoretical models researchers have conducted empirical studies onthe effects of news announcements on information. Krinsky and Lee (1996) provideempirical evidence for Kim and Verrecchia (1994). They find that the adverse selec-tion component of the spread increases around earnings announcements. They alsoattribute this effect to temporary information advantages of informed investors andinformation advantages of public information processors. Niessen (2007) researchesinto the effect of media coverage on macroeconomic news processing in the futuresmarket on government bonds. Her paper provides evidence that there is macroeco-nomic information processing prior to economic indicator releases induced throughmedia coverage. Higher pre-announcement media coverage increases investor at-tention and leads to stronger post-announcement market reactions. Vega (2006)studies how stock prices react to media coverage. She finds a connection betweenmedia coverage and post-announcement stock price changes. The paper explainsa post-announcement drift with different information market participants receive.In a recent paper, Evans and Lyons (2008) investigate the effect of macroeconomicnews on foreign exchange markets. They analyze a broad spectrum of macroeco-nomic news and study the direct influence on prices through order flow. They findthat after the announcement of macro economic news there is more informationimpounded into the market through order flow than during normal times. Thisfinding translates into higher adverse selection after macro news than normal andis not consistent with the hypothesis that public information is directly impoundedinto the market and directly causes price changes. The paper closest to our studyis Green (2004). He studies U.S. government bond trading around macroeconomicnews releases. The results show higher adverse selection costs around macroeco-nomic news releases as a result of private information impounded through theorder flow. Andersen et al. (2007) analyze different futures markets with respect tothe release of macroeconomic information. They find quick significant responsesalso in non-U.S. government bond futures markets. This finding indicates a quickand thus efficient price discovery process.
There exists also literature on the effect of liquidity, volatility, and tradingintensity around pulic information releases in securites markets. Mitchell andMulherin (1994) study the effect of publicly reported information by Dow Jones onsecurities market activity. They find positive relations between the number of newsstories and volume and volatility in equity markets. Fleming and Remolona (1999)find a reduction in trading volume and sharp price reactions with higher volatilityafter the publication of macroeconomic news in the U.S. Treasury market. In theirstudy the quoted spread increases around macroeconomic news announcementsand then slowly reverts to normal. They also find highly significant cross-marketlinkages between trading venues in different countries. Hess et al. (2008) focus theiranalysis on the liquidity provision around macrocenomic news announcementsin the German Bund Futures market. They measure liquidity supply through the
40 A. Storkenmaier, R. Riordan, C. Weinhardt, R. Studer
quoted spread and volume at the best bid and ask. However, they lack order bookdata to analyze liquidity at order book levels beyond the best bid and ask. Intheir paper, they find that bid and ask volume decreases around macroeconomicnews announcements while the quoted spread increases. In another analysis ofliquidity in equity markets Lee et al. (1993) find lower liquidity around earningsannouncements.
2 Institutional Details
We analyze trading at Eurex1, a joint-venture of Deutsche Boerse AG and SIX SwissExchange. Eurex is a pure derivatives exchange that offers a wide range of productsbased on interest rates, equities, volatilities, and options, but for instance alsoweather derivatives. Eurex is built as an electronic public limit order book. Mostproducts are matched based on price-time priority, only money market futuresare matched through pro rata matching. Orders are executed against quotes withthe best prices first. If prices of quotes are equal, orders are first executed againstquotes with a lower timestamp i.e. which have been in the book the longest. Thetrading day at Eurex lasts typically from 7h30 a.m. to 10h00 p.m. CET (CentralEuropean Time) depending on the product and consists of a pre-trading, trading,and post-trading phase. Trading hours have changed several times between theyears 2000 and 2009. Since we only consider data between 1h00 p.m. and 4h00p.m., which have always been within normal trading hours, those changes are notrelevant for our analysis. Normal trading refers to the continuous trading periodwith price-time priority based matching in the public limit order book. Nowadays,Eurex is based on a version of the Xetra system which features low exchange systemlatencies in the magnitude of milliseconds.2
Euro-Bund Futures are fixed income derivatives on German federal bonds3. Theyare based on bonds with a remaining term of 8.5 to 10.5 years and a coupon of 6%.The standardized contract value is 100,000 Euros. A delivery obligation might bemet with German federal bonds with a minimum issue amount of 5bn Euros. Theminimum tick size is 0.01 percentage points (pts) which is equivalent to a value of 10Euros. Bund Futures are traded with the delivery months March, June, September,and December. Three Bund Futures trade at the same time, the futures with the1 http://www.eurexchange.com.2 Eurex features different order types. Market orders are directly executed whereas stop orders
create market orders when a pre-specified stop price is reached. Market orders contain no limitprice and both normal market orders and stop orders are not visible in the order book. Stop ordersare not available for options traded at Eurex. There are several flags to influence the behaviorof limit orders. Good-for-Day flagged orders are not persistent over night, Good-till-Cancelledorders can stay in the order book up to one year, and Good-till-Date limit orders can stay in thebook until some pre-defined date. Immediate-or-Cancel limit orders are filled immediately. Ifsuch an order cannot be filled, partly or completely, then the whole order or parts of the order arecancelled. The executed part of an Immediate-or-Cancel limit order is essentially a marketablelimit order.
3 http://www.eurexchange.com/trading/products/INT/FIX/FGBL en.html.
The Impact of Economic News on Trading 41
three nearest delivery months. We incorporate the future with the nearest deliverymonth in our analysis.
3 Data
3.1 Unemployment Data
We retrieve U.S. unemployment data from the official data bases of the U.S. Bureauof Labor Statistics4. The relevant data are released monthly with the EmploymentSituation Report, always at 8:30 a.m. ET (Eastern Time). The monthly releaseanalyzes the previous month’s employment situation, i.e. the report released inOctober describes the employment situation in September. The United StatesDepartment of Labor does not release employment information prior to the officialrelease date. The official report is accessible via Internet at exactly 8:30 a.m. ET,the information is also disseminated through Reuters or Bloomberg systems. Weare interested in the exact date of a report release and check these data with theEmployment Situation Report. We also re-check the exact release times. The reportsare mostly released on Fridays. However, sometimes release dates deviate due topublic holidays. Depending on the year and differences in daylight savings time, U.S.unemployment data is released at either 1h30 p.m., 2h30 p.m., or 3h30 p.m. CET.
3.2 Transaction Data
We use transaction and order data retrieved from the Reuters DataScope TickHistory archive through SIRCA5. The DataScope Tick History archive providestrade and quote and order book data for a wide range of instruments for all majorexchanges worldwide.
We retrieve data for Euro-Bund Futures from 1st January 2000 to 30th June 2009.Our analysis comprises the future with the closest maturity date. To construct atime series we roll over to the next future on the last trading day of the currentfuture. We do not use the last trading day of a future since trading already ends at12h30 p.m. CET on those days for this particular future. Through rolling over weconstruct a time series that consists of thirty-nine different contracts over eight anda half years. We retrieve both trade and quote and order book data for our analysis.Trade and quote data includes price and volume for transactions as well as best bidand best ask including associated volumes. Order book entries feature bid and askas well as associated volumes up to twenty levels into the order book. All trades,quotes, and order book entries are timestamped to the millisecond. All prices arereported in percentage points (pts) to a contract value of EUR 100,000.
4 http://www.bls.gov.5 Securities Industry Research Centre of Asia Pacific (SIRCA), http://www.sirca.org.au, We thank
SIRCA for providing access to the Thomson Reuters DataScope Tick History archive.
42 A. Storkenmaier, R. Riordan, C. Weinhardt, R. Studer
As explained in the previous section, U.S. unemployment data arrives in themiddle of the Eurex trading day. For each month we cut the daily transactiondata to thirty minute time intervals around that month’s unemployment newsannouncement time. For example, if in February the unemployment numbersarrive at 2h30 p.m. CET then only trade and quote and order book data from2h00 p.m. to 3h00 p.m. are included in the time series for February. If in a monththe unemployment numbers arrive at 1h30 p.m. CET then data from 1h00 p.m. to2h00 p.m. are included in that month’s time series. Such an approach minimizestime-of-day effects and compares data from announcement days with appropriatedata from other days. We also exclude any non-continuous trading from thetransaction data time series. Altogether the final time series comprises 4,917,372trades with an average price of 116.06 pts.
4 Research Design
4.1 Information
We measure information impounded through order flow with an extended MRRmodel introduced by Madhavan et al. (1997). We extend the model in the spirit ofGreen (2004) to include variables for different intervals around a macroeconomicnews event. The MRR model is a common market microstructure model to ap-proximate the adverse selection component of the bid-ask spread, the informationrevealed through trades. When informed traders trade, prices tend to follow theirtrades which constitutes a risk for market participants that post limit orders. Theadverse selection component measures the part of the bid-ask spread that is requiredas a compensation for liquidity suppliers risk of losing against informed traders.Hence, the adverse selection component of the bid-ask spread can be interpretedas private information that is impounded into prices through the order flow. TheMRR model estimates an adverse selection component and an inventory and orderprocessing cost component of the bid-ask spread.
The MRR model is only based on the trade process and analyzes transactionprice changes and their relation to the trade direction of orderflow. We use thecommon Lee and Ready (1991) algorithm to sign trades with contemporaneousquotes as proposed by Bessembinder (2003).
Let xi be the trade direction, 1 for a market buy order and -1 for a market sellorder at time i and pi denotes the transaction price. Specifically, i denotes a singleobservation in the trade process. Then the original Madhavan et al. (1997) modelformulates the following relation:
pi − pi−1 = (φ + θ)xi − (φ + ρθ)xi−1 + εi. (1)
Let ρ be the first-order autocorrelation, θ denotes the asymmetric informationcomponent, and φ captures inventory and order processing costs. The fundamental
The Impact of Economic News on Trading 43
concept to measure private information is that only the deviation from expectedorder flow comprises information. Expected order flow ρxi−1 is based on orderflow autocorrelation ρ. θ measures “the degree of information asymmetry or theso-called permanent impact of the order flow innovation” (Madhavan et al., 1997).Beliefs about asset values might change through new public information withouttrade or through information impounded by the order flow. The change in belief ispositively correlated with order flow innovation. Inventory and order processingcosts represent the transitory effect of order flow on prices. Bid and ask quotesthat reflect the inventory and order processing cost component are ex post rationalindependent of the trade direction. Accordingly, φ is not dependent on the tradeprocess’ autocorrelation ρ. The MRR model assumes a fixed order size and doesnot consider volume. Madhavan et al. (1997) address this issue and find that tradedirection is better suited to analyze their model than signed volume.
To analyze information around economic news events we extend the originalMRR model based on Green (2004). We introduce several dummy variables fordifferent intervals around an economic news event. Dummy variables allow todistinguish ten minute intervals within thirty minute time periods before and afteran economic news event from observations not close to the economic news eventsunder consideration. A dummy variable takes 1 if the observation is within thetime period asigned to this variable and else 0. Let i denote single observationsin the trade process and n ∈ 1, . . . , 7 denotes the different intervals aroundmacroeconomic news where n = 1 indicates observations on non-announcementdays then Dn,i represents the dummy variable. Then the following model thatallows for changes in the bid-ask spread components around macroeconomic newsannouncements emerges:
pi − pi−1 =7
∑n=1
[(φn + θn)xiDn,i − (φn + ρnθn)xi−1Dn,i−1] + εi. (2)
Madhavan et al. (1997) use absolute price changes to estimate the model. Tosupport the interpretation of results we use relative price changes in basis points toestimate equation 2. However, results are robust to using absolute or relative pricechanges. The model is estimated using the generalized methods of moments (GMM)with the Newey and West (1987) procedure as proposed in the original paper byMadhavan et al. (1997). The Newey-West procedure is robust to autocorrelation andheteroskedasticity. Let ri denote the relative price change which is calculated asri = 10, 000× ln (pi/pi−1) then the model can be estimated as:
ui = ri +7
∑n=1
[−(φn + θn)xiDn,i + (φn + ρnθn)xi−1Dn,i−1] . (3)
using the following implied moment conditions that exactly identify the constant α
and the parameter vector β = (θn, φn, ρn) with n ∈ 1, ..., 7:
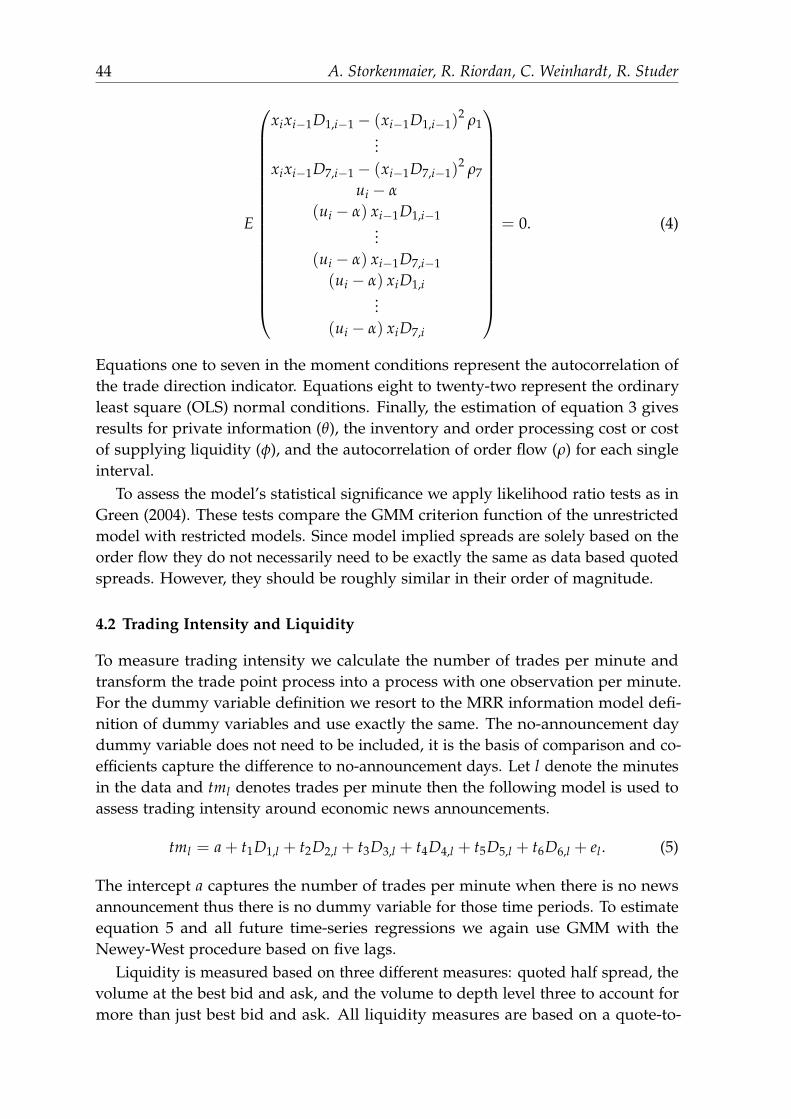
44 A. Storkenmaier, R. Riordan, C. Weinhardt, R. Studer
E
xixi−1D1,i−1 − (xi−1D1,i−1)2 ρ1
...xixi−1D7,i−1 − (xi−1D7,i−1)
2 ρ7
ui − α
(ui − α) xi−1D1,i−1...
(ui − α) xi−1D7,i−1
(ui − α) xiD1,i...
(ui − α) xiD7,i
= 0. (4)
Equations one to seven in the moment conditions represent the autocorrelation ofthe trade direction indicator. Equations eight to twenty-two represent the ordinaryleast square (OLS) normal conditions. Finally, the estimation of equation 3 givesresults for private information (θ), the inventory and order processing cost or costof supplying liquidity (φ), and the autocorrelation of order flow (ρ) for each singleinterval.
To assess the model’s statistical significance we apply likelihood ratio tests as inGreen (2004). These tests compare the GMM criterion function of the unrestrictedmodel with restricted models. Since model implied spreads are solely based on theorder flow they do not necessarily need to be exactly the same as data based quotedspreads. However, they should be roughly similar in their order of magnitude.
4.2 Trading Intensity and Liquidity
To measure trading intensity we calculate the number of trades per minute andtransform the trade point process into a process with one observation per minute.For the dummy variable definition we resort to the MRR information model defi-nition of dummy variables and use exactly the same. The no-announcement daydummy variable does not need to be included, it is the basis of comparison and co-efficients capture the difference to no-announcement days. Let l denote the minutesin the data and tml denotes trades per minute then the following model is used toassess trading intensity around economic news announcements.
tml = a + t1D1,l + t2D2,l + t3D3,l + t4D4,l + t5D5,l + t6D6,l + el. (5)
The intercept a captures the number of trades per minute when there is no newsannouncement thus there is no dummy variable for those time periods. To estimateequation 5 and all future time-series regressions we again use GMM with theNewey-West procedure based on five lags.
Liquidity is measured based on three different measures: quoted half spread, thevolume at the best bid and ask, and the volume to depth level three to account formore than just best bid and ask. All liquidity measures are based on a quote-to-
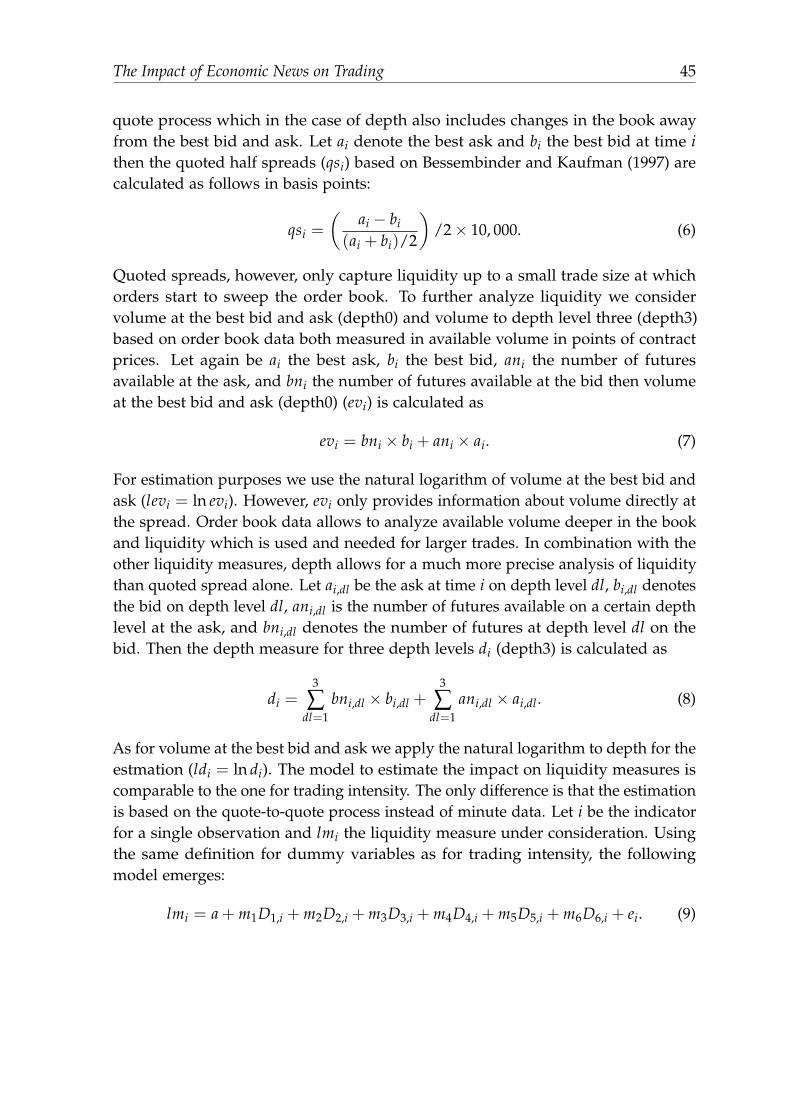
The Impact of Economic News on Trading 45
quote process which in the case of depth also includes changes in the book awayfrom the best bid and ask. Let ai denote the best ask and bi the best bid at time ithen the quoted half spreads (qsi) based on Bessembinder and Kaufman (1997) arecalculated as follows in basis points:
qsi =
(ai − bi
(ai + bi)/2
)/2× 10, 000. (6)
Quoted spreads, however, only capture liquidity up to a small trade size at whichorders start to sweep the order book. To further analyze liquidity we considervolume at the best bid and ask (depth0) and volume to depth level three (depth3)based on order book data both measured in available volume in points of contractprices. Let again be ai the best ask, bi the best bid, ani the number of futuresavailable at the ask, and bni the number of futures available at the bid then volumeat the best bid and ask (depth0) (evi) is calculated as
evi = bni × bi + ani × ai. (7)
For estimation purposes we use the natural logarithm of volume at the best bid andask (levi = ln evi). However, evi only provides information about volume directly atthe spread. Order book data allows to analyze available volume deeper in the bookand liquidity which is used and needed for larger trades. In combination with theother liquidity measures, depth allows for a much more precise analysis of liquiditythan quoted spread alone. Let ai,dl be the ask at time i on depth level dl, bi,dl denotesthe bid on depth level dl, ani,dl is the number of futures available on a certain depthlevel at the ask, and bni,dl denotes the number of futures at depth level dl on thebid. Then the depth measure for three depth levels di (depth3) is calculated as
di =3
∑dl=1
bni,dl × bi,dl +3
∑dl=1
ani,dl × ai,dl. (8)
As for volume at the best bid and ask we apply the natural logarithm to depth for theestmation (ldi = ln di). The model to estimate the impact on liquidity measures iscomparable to the one for trading intensity. The only difference is that the estimationis based on the quote-to-quote process instead of minute data. Let i be the indicatorfor a single observation and lmi the liquidity measure under consideration. Usingthe same definition for dummy variables as for trading intensity, the followingmodel emerges:
lmi = a + m1D1,i + m2D2,i + m3D3,i + m4D4,i + m5D5,i + m6D6,i + ei. (9)
46 A. Storkenmaier, R. Riordan, C. Weinhardt, R. Studer
5 Results and Interpretation
Table 1 provides results for the estimated MRR model around macroeconomic newsannouncements. Statistical significance at the 1% level is indicated through an ’a’.The table shows the estimated spread components for no-announcement periodsand ten minute intervals in the thirty minutes pre and post the release of U.S.unemployment information. The adverse selection (θ) component is the componentof the spread that arises as a result of private information impounded into themarket through order flow and the order processing component (φ) represents othercosts of supplying liquidity independent the of trade process autocorrelation (ρ).Compared to equity markets it strikes that adverse selection costs only make upa minor part of the spread. However, this is consistent with the fact that privateinformation should be much lower for Bund Futures than for individual firms.
For no-announcement periods the estimation of the spread through the MRRmodel adds up to 0.3208 basis points, the sum of the adverse selection and orderprocessing components. The no-announcement period average quoted spreadcalculated from actual quotes is 0.450 basis points. The similarity of estimatedspreads and data based spreads indicates that the MRR model is well specified toanalyze Bund Futures trading. Table 1 shows that adverse selection costs increasesharply prior to the release of U.S. unemployment information. Thirty to twentyminutes before an announcement adverse selection costs are slightly higher with0.0797 basis points compared to 0.0680 basis points in no news periods. Thenadverse selection costs sharply rise to 0.1597 and 0.1488 in the two ten minuteintervals prior to the announcement. In both periods adverse selection costs riseby almost 100% in comparison to normal periods. Directly after an announcement,adverse selection is slightly higher with 0.0761 than normal and seems to slowlyrevert to normal with 0.0724 basis points during the last ten minute interval.
Although the theoretical models of Kim and Verrecchia (1991, 1994, 1997) operateunder some assumptions, they qualitively fit our empirical observations. Economicnews releases are similar in nature to earnings announcements. Both forms ofnews are scheduled and there should not be prior information leakage. Prior toannouncements traders who try to trade in advance of public unemploymentnumbers collect private information. Costly private information gathering asintroduced in the Kim and Verrechia models could be the analysis of existing U.S.job market data. As introduced by Kim and Verrecchia prior information gatheringis costly and requires benefits from trading in advance of public information. Afterthe announcement there seems to be a period where traders substantially differin their information processing capabilities and in their evaluation of the U.S.unemployment information. Our results are also consistent with empirical papers(cf. Krinsky and Lee (1996), Niessen (2007), Evans and Lyons (2008), Green (2004)).For further analysis we need to look at trading intensity, liquidity and their relationto information.
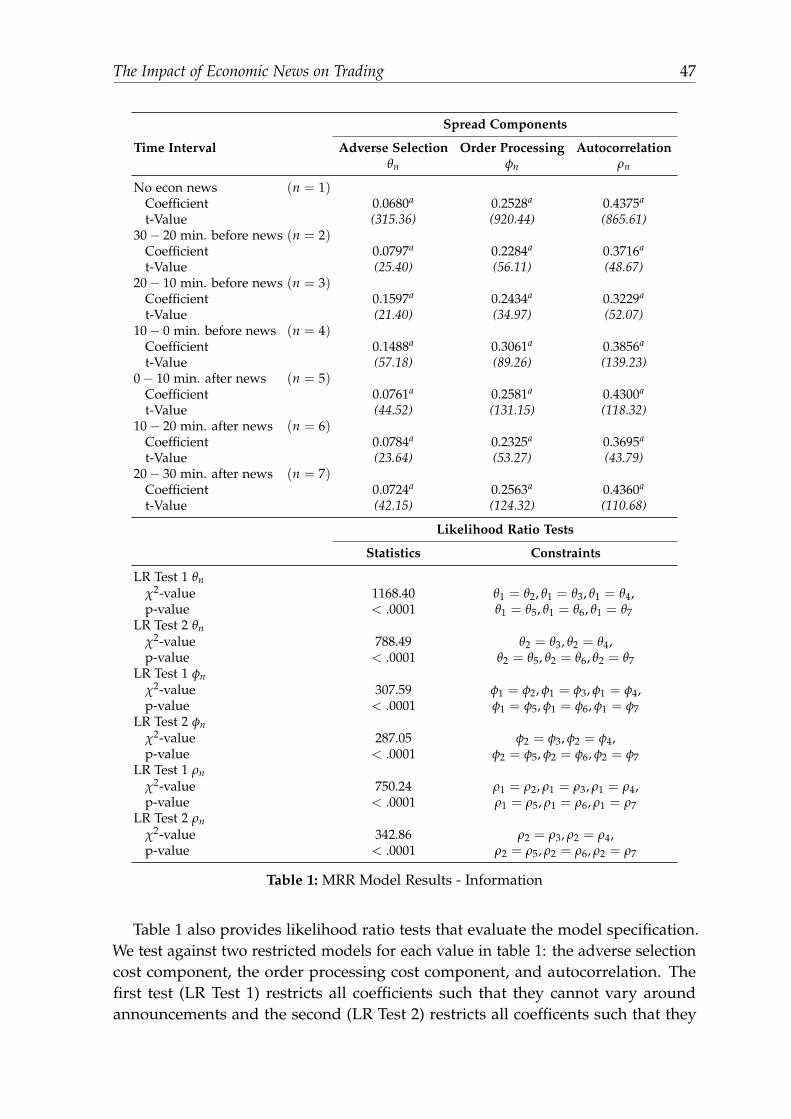
The Impact of Economic News on Trading 47
Spread Components
Time Interval Adverse Selection Order Processing Autocorrelationθn φn ρn
No econ news (n = 1)Coefficient 0.0680a 0.2528a 0.4375a
t-Value (315.36) (920.44) (865.61)30− 20 min. before news (n = 2)
Coefficient 0.0797a 0.2284a 0.3716a
t-Value (25.40) (56.11) (48.67)20− 10 min. before news (n = 3)
Coefficient 0.1597a 0.2434a 0.3229a
t-Value (21.40) (34.97) (52.07)10− 0 min. before news (n = 4)
Coefficient 0.1488a 0.3061a 0.3856a
t-Value (57.18) (89.26) (139.23)0− 10 min. after news (n = 5)
Coefficient 0.0761a 0.2581a 0.4300a
t-Value (44.52) (131.15) (118.32)10− 20 min. after news (n = 6)
Coefficient 0.0784a 0.2325a 0.3695a
t-Value (23.64) (53.27) (43.79)20− 30 min. after news (n = 7)
Coefficient 0.0724a 0.2563a 0.4360a
t-Value (42.15) (124.32) (110.68)
Likelihood Ratio Tests
Statistics Constraints
LR Test 1 θnχ2-value 1168.40 θ1 = θ2, θ1 = θ3, θ1 = θ4,p-value < .0001 θ1 = θ5, θ1 = θ6, θ1 = θ7
LR Test 2 θnχ2-value 788.49 θ2 = θ3, θ2 = θ4,p-value < .0001 θ2 = θ5, θ2 = θ6, θ2 = θ7
LR Test 1 φnχ2-value 307.59 φ1 = φ2, φ1 = φ3, φ1 = φ4,p-value < .0001 φ1 = φ5, φ1 = φ6, φ1 = φ7
LR Test 2 φnχ2-value 287.05 φ2 = φ3, φ2 = φ4,p-value < .0001 φ2 = φ5, φ2 = φ6, φ2 = φ7
LR Test 1 ρnχ2-value 750.24 ρ1 = ρ2, ρ1 = ρ3, ρ1 = ρ4,p-value < .0001 ρ1 = ρ5, ρ1 = ρ6, ρ1 = ρ7
LR Test 2 ρnχ2-value 342.86 ρ2 = ρ3, ρ2 = ρ4,p-value < .0001 ρ2 = ρ5, ρ2 = ρ6, ρ2 = ρ7
Table 1: MRR Model Results - Information
Table 1 also provides likelihood ratio tests that evaluate the model specification.We test against two restricted models for each value in table 1: the adverse selectioncost component, the order processing cost component, and autocorrelation. Thefirst test (LR Test 1) restricts all coefficients such that they cannot vary aroundannouncements and the second (LR Test 2) restricts all coefficents such that they
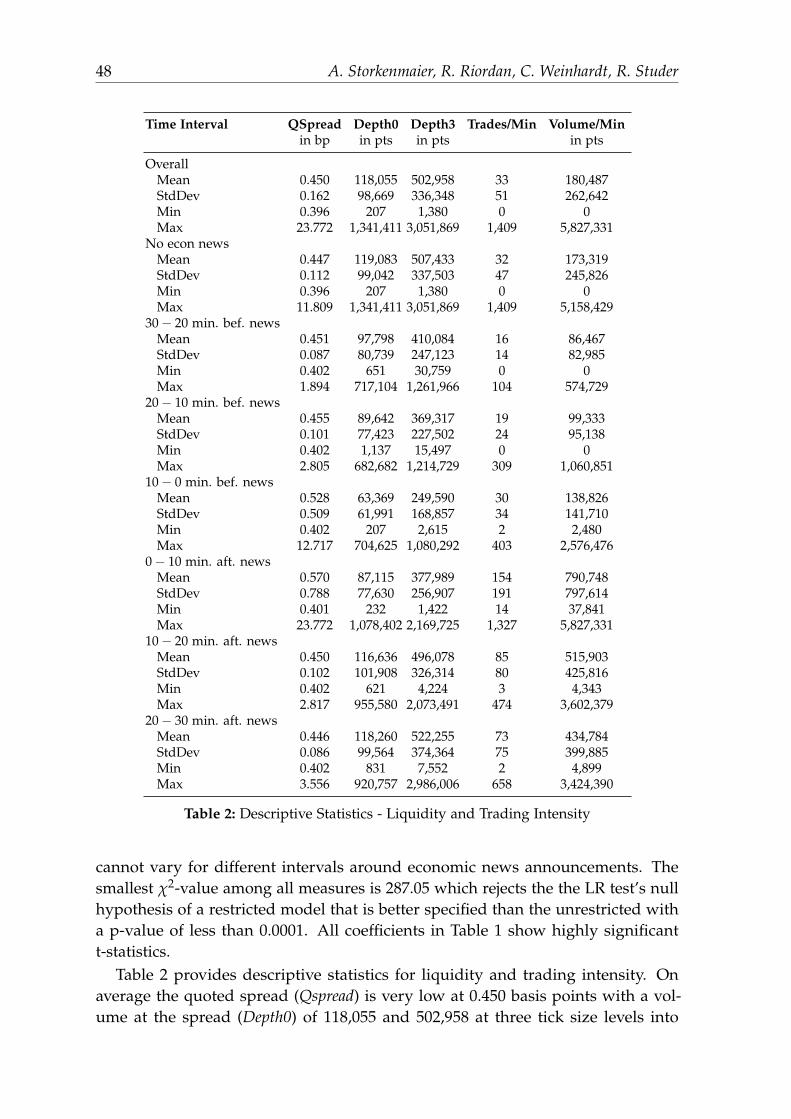
48 A. Storkenmaier, R. Riordan, C. Weinhardt, R. Studer
Time Interval QSpread Depth0 Depth3 Trades/Min Volume/Minin bp in pts in pts in pts
OverallMean 0.450 118,055 502,958 33 180,487StdDev 0.162 98,669 336,348 51 262,642Min 0.396 207 1,380 0 0Max 23.772 1,341,411 3,051,869 1,409 5,827,331
No econ newsMean 0.447 119,083 507,433 32 173,319StdDev 0.112 99,042 337,503 47 245,826Min 0.396 207 1,380 0 0Max 11.809 1,341,411 3,051,869 1,409 5,158,429
30− 20 min. bef. newsMean 0.451 97,798 410,084 16 86,467StdDev 0.087 80,739 247,123 14 82,985Min 0.402 651 30,759 0 0Max 1.894 717,104 1,261,966 104 574,729
20− 10 min. bef. newsMean 0.455 89,642 369,317 19 99,333StdDev 0.101 77,423 227,502 24 95,138Min 0.402 1,137 15,497 0 0Max 2.805 682,682 1,214,729 309 1,060,851
10− 0 min. bef. newsMean 0.528 63,369 249,590 30 138,826StdDev 0.509 61,991 168,857 34 141,710Min 0.402 207 2,615 2 2,480Max 12.717 704,625 1,080,292 403 2,576,476
0− 10 min. aft. newsMean 0.570 87,115 377,989 154 790,748StdDev 0.788 77,630 256,907 191 797,614Min 0.401 232 1,422 14 37,841Max 23.772 1,078,402 2,169,725 1,327 5,827,331
10− 20 min. aft. newsMean 0.450 116,636 496,078 85 515,903StdDev 0.102 101,908 326,314 80 425,816Min 0.402 621 4,224 3 4,343Max 2.817 955,580 2,073,491 474 3,602,379
20− 30 min. aft. newsMean 0.446 118,260 522,255 73 434,784StdDev 0.086 99,564 374,364 75 399,885Min 0.402 831 7,552 2 4,899Max 3.556 920,757 2,986,006 658 3,424,390
Table 2: Descriptive Statistics - Liquidity and Trading Intensity
cannot vary for different intervals around economic news announcements. Thesmallest χ2-value among all measures is 287.05 which rejects the the LR test’s nullhypothesis of a restricted model that is better specified than the unrestricted witha p-value of less than 0.0001. All coefficients in Table 1 show highly significantt-statistics.
Table 2 provides descriptive statistics for liquidity and trading intensity. Onaverage the quoted spread (Qspread) is very low at 0.450 basis points with a vol-ume at the spread (Depth0) of 118,055 and 502,958 at three tick size levels into
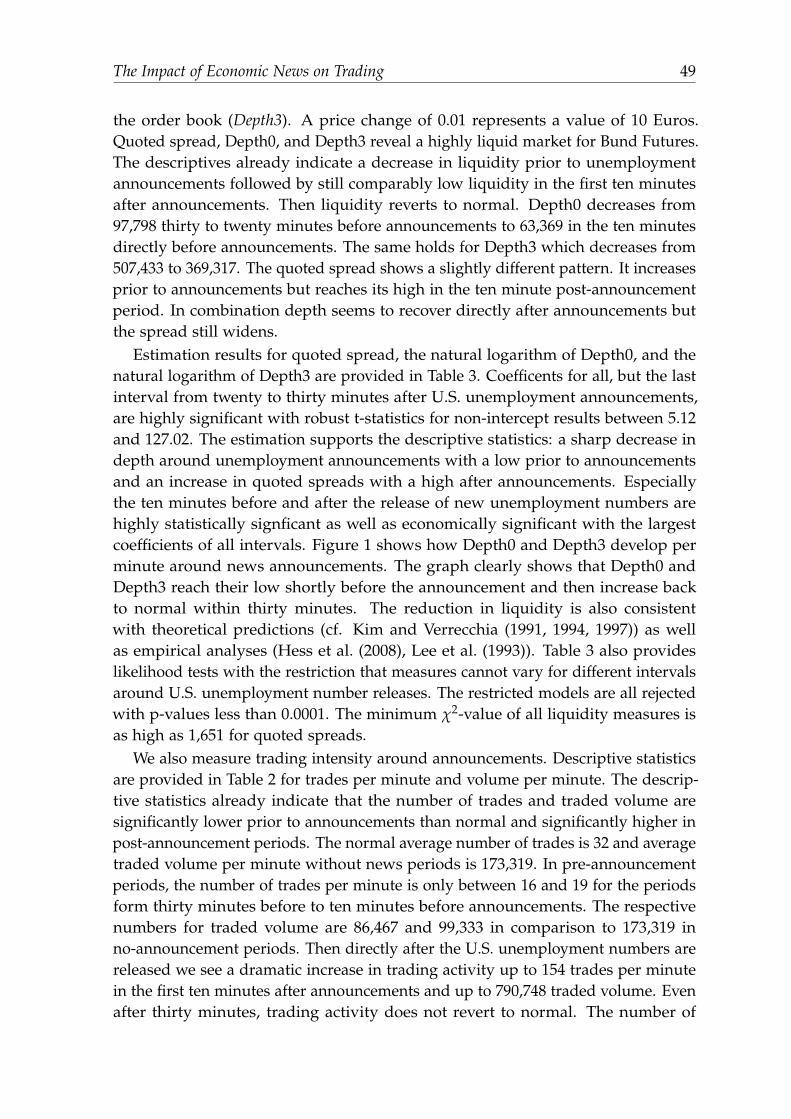
The Impact of Economic News on Trading 49
the order book (Depth3). A price change of 0.01 represents a value of 10 Euros.Quoted spread, Depth0, and Depth3 reveal a highly liquid market for Bund Futures.The descriptives already indicate a decrease in liquidity prior to unemploymentannouncements followed by still comparably low liquidity in the first ten minutesafter announcements. Then liquidity reverts to normal. Depth0 decreases from97,798 thirty to twenty minutes before announcements to 63,369 in the ten minutesdirectly before announcements. The same holds for Depth3 which decreases from507,433 to 369,317. The quoted spread shows a slightly different pattern. It increasesprior to announcements but reaches its high in the ten minute post-announcementperiod. In combination depth seems to recover directly after announcements butthe spread still widens.
Estimation results for quoted spread, the natural logarithm of Depth0, and thenatural logarithm of Depth3 are provided in Table 3. Coefficents for all, but the lastinterval from twenty to thirty minutes after U.S. unemployment announcements,are highly significant with robust t-statistics for non-intercept results between 5.12and 127.02. The estimation supports the descriptive statistics: a sharp decrease indepth around unemployment announcements with a low prior to announcementsand an increase in quoted spreads with a high after announcements. Especiallythe ten minutes before and after the release of new unemployment numbers arehighly statistically signficant as well as economically significant with the largestcoefficients of all intervals. Figure 1 shows how Depth0 and Depth3 develop perminute around news announcements. The graph clearly shows that Depth0 andDepth3 reach their low shortly before the announcement and then increase backto normal within thirty minutes. The reduction in liquidity is also consistentwith theoretical predictions (cf. Kim and Verrecchia (1991, 1994, 1997)) as wellas empirical analyses (Hess et al. (2008), Lee et al. (1993)). Table 3 also provideslikelihood tests with the restriction that measures cannot vary for different intervalsaround U.S. unemployment number releases. The restricted models are all rejectedwith p-values less than 0.0001. The minimum χ2-value of all liquidity measures isas high as 1,651 for quoted spreads.
We also measure trading intensity around announcements. Descriptive statisticsare provided in Table 2 for trades per minute and volume per minute. The descrip-tive statistics already indicate that the number of trades and traded volume aresignificantly lower prior to announcements than normal and significantly higher inpost-announcement periods. The normal average number of trades is 32 and averagetraded volume per minute without news periods is 173,319. In pre-announcementperiods, the number of trades per minute is only between 16 and 19 for the periodsform thirty minutes before to ten minutes before announcements. The respectivenumbers for traded volume are 86,467 and 99,333 in comparison to 173,319 inno-announcement periods. Then directly after the U.S. unemployment numbers arereleased we see a dramatic increase in trading activity up to 154 trades per minutein the first ten minutes after announcements and up to 790,748 traded volume. Evenafter thirty minutes, trading activity does not revert to normal. The number of
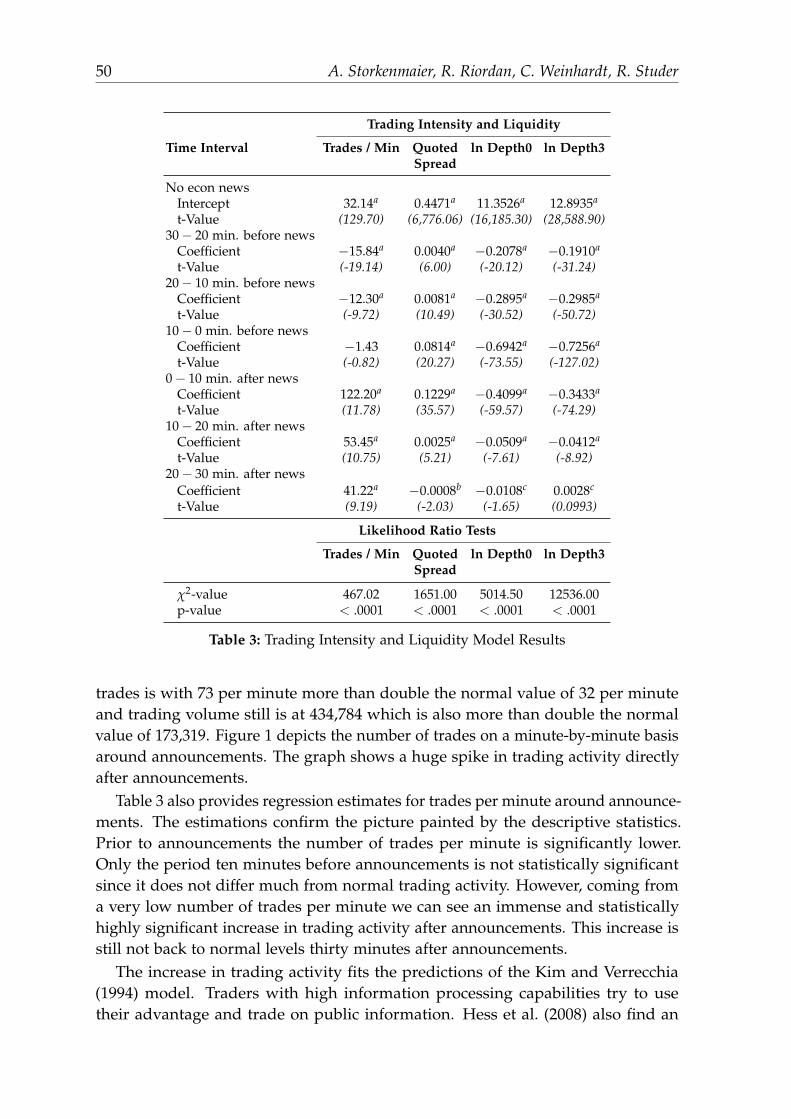
50 A. Storkenmaier, R. Riordan, C. Weinhardt, R. Studer
Trading Intensity and Liquidity
Time Interval Trades / Min Quoted ln Depth0 ln Depth3Spread
No econ newsIntercept 32.14a 0.4471a 11.3526a 12.8935a
t-Value (129.70) (6,776.06) (16,185.30) (28,588.90)30− 20 min. before news
Coefficient −15.84a 0.0040a −0.2078a −0.1910a
t-Value (-19.14) (6.00) (-20.12) (-31.24)20− 10 min. before news
Coefficient −12.30a 0.0081a −0.2895a −0.2985a
t-Value (-9.72) (10.49) (-30.52) (-50.72)10− 0 min. before news
Coefficient −1.43 0.0814a −0.6942a −0.7256a
t-Value (-0.82) (20.27) (-73.55) (-127.02)0− 10 min. after news
Coefficient 122.20a 0.1229a −0.4099a −0.3433a
t-Value (11.78) (35.57) (-59.57) (-74.29)10− 20 min. after news
Coefficient 53.45a 0.0025a −0.0509a −0.0412a
t-Value (10.75) (5.21) (-7.61) (-8.92)20− 30 min. after news
Coefficient 41.22a −0.0008b −0.0108c 0.0028c
t-Value (9.19) (-2.03) (-1.65) (0.0993)
Likelihood Ratio Tests
Trades / Min Quoted ln Depth0 ln Depth3Spread
χ2-value 467.02 1651.00 5014.50 12536.00p-value < .0001 < .0001 < .0001 < .0001
Table 3: Trading Intensity and Liquidity Model Results
trades is with 73 per minute more than double the normal value of 32 per minuteand trading volume still is at 434,784 which is also more than double the normalvalue of 173,319. Figure 1 depicts the number of trades on a minute-by-minute basisaround announcements. The graph shows a huge spike in trading activity directlyafter announcements.
Table 3 also provides regression estimates for trades per minute around announce-ments. The estimations confirm the picture painted by the descriptive statistics.Prior to announcements the number of trades per minute is significantly lower.Only the period ten minutes before announcements is not statistically significantsince it does not differ much from normal trading activity. However, coming froma very low number of trades per minute we can see an immense and statisticallyhighly significant increase in trading activity after announcements. This increase isstill not back to normal levels thirty minutes after announcements.
The increase in trading activity fits the predictions of the Kim and Verrecchia(1994) model. Traders with high information processing capabilities try to usetheir advantage and trade on public information. Hess et al. (2008) also find an
The Impact of Economic News on Trading 51
-30-20
-100
1020
29
0
100,000
200,000
300,000
400,000
500,000
600,000
Minutes Around Economic News
Ave
rage
Dep
th0
and
Dep
th3
Per M
inut
e
-30-20
-100
1020
29
0
50
100
150
200
250
300
350
400
Minutes Around Economic News
Trad
es P
er M
inut
e
Figure 1: Liquidity and trading intensity around macroeconomic news announcements:The upper graph depicts Depth0 (dashed line) and Depth3 (continuous line) and the lowergraph shows trading intensity around announcements measured by the number of tradesper minute.
52 A. Storkenmaier, R. Riordan, C. Weinhardt, R. Studer
increase in trading volume around the release of U.S. unemployment numbers andMitchell and Mulherin (1994) find a positive relation between news and volume inequity markets. Fleming and Remolona (1999) find a reduction in trading aroundmacroeconomic news for the U.S. treasury market. They, however, do not study thefutures market but directly the underlying U.S. treasury market which has differentmarket characteristics.
Table 3 also provides likelihood ratio test for trading activity with the restrictionthat measures cannot vary among different intervals around U.S. unemploymentnumber releases. The restricted model is rejected with p-values less than 0.0001.The χ2-value is 467.02.
The individual results of information, liquidity, and trading intensity are con-sistent with existing empirical evidence. However, what remains is the relationbetween all three factors. Before U.S. unemployment numbers are released we findlow liquidity and low trading activity but much higher adverse selection costs, i.e.more private information impounded through order flow than normal in the market.Directly after announcements, liquidity slightly recovers until it reverts to normaland trading activity dramatically increases and stays at a high level even thirtyminutes after announcements. Adverse selection, however, decreases from its preannouncement high but is still a bit higher than during no-announcement periods.What kind of trading behavior could explain such patterns? Only a few trader withprivate information trade prior to announcements. Private information derived fromin-depth analysis and research is costly and gains from trading in advance of publicinformation need to be high enough to offset the costs of private information gath-ering. However, such traders seem to see profits from pre-announcement tradingsince they are not put off by low liquidity. As soon as U.S. unemployment numbersare released we find a strong decrease in adverse selection which is consistentwith the fact that this information is now public information. However, adverseselection is still slightly higher than normal. The results for trading activity indicatea “race of public information processing”. Massive amounts of traders trade onprocessed public information but bring considerably less private information intothe market than the pre-announcement traders. Overall the fast incorporation ofpublic information is an indication for efficient markets consistent with Andersenet al. (2007).
6 Conclusion
In this paper we analyze the effect of the release of U.S. unemployment numbersand its effect on information, liquidity, and trading activity in German Bund Futures.We find that liquidity and trading activity is lower pre-announcement associatedwith high adverse selection costs. Liquidity recovers and adverse selection stayson a slightly higher level then normal within thirty minutes after announcements.Trading activity drastically increases and stays on a high level during the first thirtyminutes after announcements. Our findings are consistent with existing empirical
The Impact of Economic News on Trading 53
literature and the theoretical models of Kim and Verrecchia (1991, 1994, 1997).Additionally, the results implicate a significant influence of U.S. unemploymentannouncements on trading behavior in German Bund futures. The confirms the roleof these announcements as an important worldwide economic indicator.
Our results show that Eurex is a highly liquid and efficient market for BundFutures that incorporates public information fast. Private information arises throughvarying information processing and gathering capabilities of market participants.
References
Andersen, T. G., T. Bollerslev, F. X. Diebold, and C. Vega (2007): “Real-Time PriceDiscovery in Global Stock, Bond and Foreign Exchange Markets,” Journal ofInternational Economics, 73, pp. 251–277.
Bessembinder, H. (2003): “Issues in assessing trade execution costs,” Journal ofFinancial Markets, 6(3), pp. 233–257.
Bessembinder, H. and H. Kaufman (1997): “A Cross-exchange Comparison ofExecution Costs and Information Flow for NYSE-listed Stocks,” Journal of FinancialEconomics, 46(3), pp. 293–319.
Chaboud, A., B. Chiquoine, E. Hjalarsson, and C. Vega (2009): “Rise of the machines:Algorithmic trading in the foreign exchange market,” Working Paper, StanfordUniversity.
Evans, M. D. D. and R. K. Lyons (2008): “How Is Macro News Transmitted toExchange Rates,” Journal of Financial Economics, 88, pp. 26–50.
Fleming, M. J. and E. M. Remolona (1999): “Price Formation and Liquidity in theU.S. Treasury market: The response to public information,” The Journal of Finance,54(5), pp. 1901–1915.
Glosten, L. and P. Milgrom (1985): “Bid, Ask and Transaction Prices in a SpecialistMarket with Heterogeneously Informed Traders,” Journal of Financial Economics,14, pp. 71–100.
Green, T. C. (2004): “Economic News and the Impact of Trading on Bond Prices,”The Journal of Finance, 59(3), pp. 1201–1233.
Hess, D., A. Kempf, and M. Malinowska (2008): “Liquidity Provision in Periods ofHigh Information Flow,” Working Paper.
Kim, O. and R. E. Verrecchia (1991): “Market Reactions to Anticipated Announce-ments,” Journal of Financial Economics, 30(2), pp. 273–309.
Kim, O. and R. E. Verrecchia (1994): “Market Liquidity and Volume AroundEarnings Announcements,” Journal of Accounting and Economics, 17, pp. 41–67.
Kim, O. and R. E. Verrecchia (1997): “Pre-Announcement and Event-Period PrivateInformation,” Journal of Accounting and Econmics, 24, pp. 395–419.
Krinsky, I. and J. Lee (1996): “Earnings Announcements and the Components of theBid-Ask Spread,” The Journal of Finance, 51(4), pp. 1523–1535.
54 A. Storkenmaier, R. Riordan, C. Weinhardt, R. Studer
Lee, C. and M. Ready (1991): “Inferring Trade Direction from Intraday Data,” TheJournal of Finance, 46(2), pp. 733–746.
Lee, C. M. C., B. Mucklow, and M. J. Ready (1993): “Spreads, Depths, and theImpact of Earnings Information: An Intraday Analysis,” The Review of FinancialStudies, 6(2), pp. 345–374.
Madhavan, A., M. Richardson, and M. Roomans (1997): “Why Do Security PricesChange? A Transaction-Level Analysis of NYSE Stocks,” The Review of FinancialStudies, 10(4), pp. 1035–1064.
Mitchell, M. L. and J. H. Mulherin (1994): “The Impact of Public Information on theStock Market,” The Journal of Finance, 49(3), pp. 923–950.
Newey, W. K. and K. D. West (1987): “A Simple, Positive Semi-Definite, Het-eroskedasticity and Autocorrelation Consistent Covariance Matrix,” Econometrica,55(3), pp. 703–708.
Niessen, A. (2007): “Media Coverage and Macroeconomic Information Processing,”SFB 649 Discussion Paper 2007-011.
Vega, C. (2006): “Stock Price Reaction to Public and Private Information,” Journal ofFinancial Economics, 82, pp. 103–133.
Market Responses to the Introduction of InteractiveData: The Case of XBRL
S. Sarah Zhang, Christof Weinhardt, and Ryan Riordan
Institute of Information Systems and Managment, KITsarah.zhang, weinhardt, [email protected]
Summary. We examine the introduction of the voluntary filing program of financial reportsusing XBRL by the Securities and Exchange Commission (SEC) as a quasi-natural experi-ment to isolate the effects of an improvement in the information environment of programparticipants. The voluntary SEC XBRL program, generally referred to as Interactive Data,has allowed firms to file annual and quarterly reports using eXtensible Business ReportingLanguage (XBRL). XBRL is a machine-readable Interactive Data format, designed to improvethe financial information environment of a firm and the accessibility of financial information.We study the effects of this event of corporate disclosure on the cost of capital of participat-ing companies and information intermediation of investors following and find statisticallysignificant results for medium-term cost of capital and for information intermediation.
1 Introduction
Over the past two decades, developments in information technology (IT) havefacilitated information transparency and investment decisions. This change hastranslated into easier access to management reporting data and corporate disclosure,for example via the EDGAR (Electronic Data Gathering, Analysis, and Retrieval)system, for investors and regulators alike. In April of 2005, the Securities andExchange Commission (SEC), the regulating authority in the US, introduced avoluntary filing program (VFP) for the introduction of XBRL (eXtensible BusinessReporting Language), or ’Interactive Data’ as it is called in the US, designed tomake corporate reports more accessible and to reduce costs of data preparationand analysis. XBRL is an innovative XML based format geared towards corporateinformation disclosure, which has already gained international importance and hasbeen implemented in report management systems by market regulators of severalcountries. In this paper, which is research in progress, we study how IT innovationfacilitates information intermediation and transparency. More specifically, this paperinvestigates the market effects of the introduction of Interactive Data for companiesand investors, and also tries to find interest groups among participating companiesfor the voluntary participation in this program.
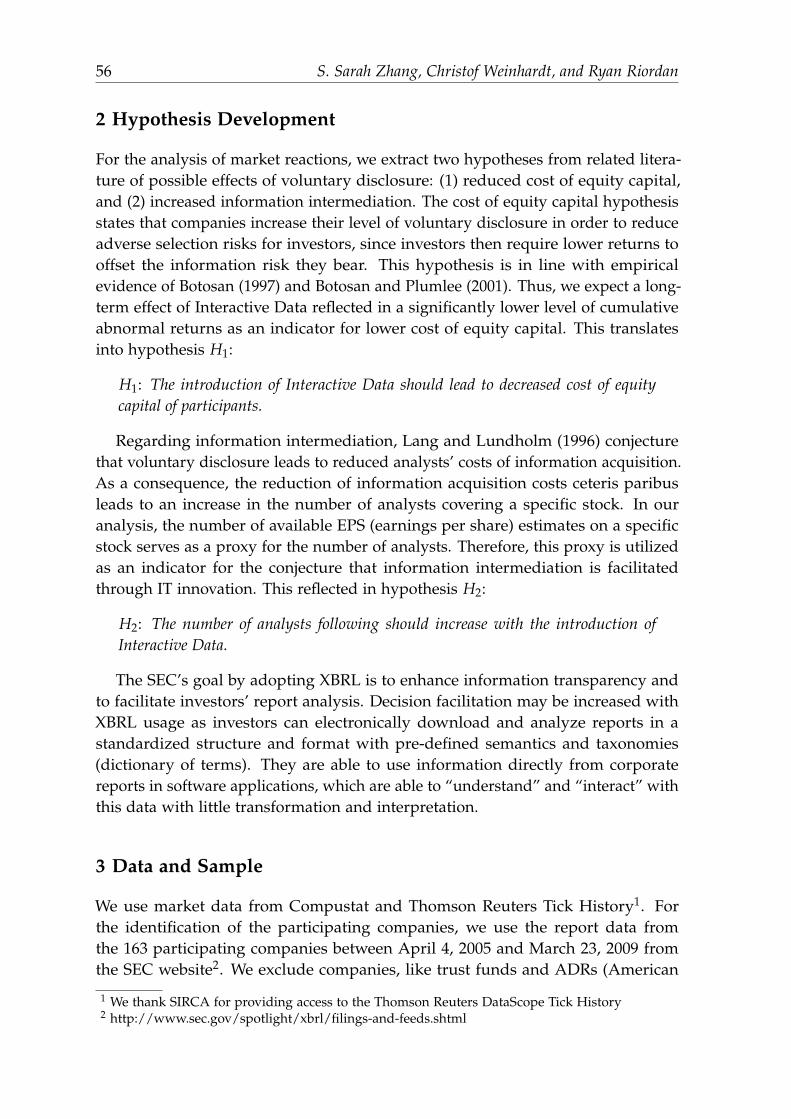
56 S. Sarah Zhang, Christof Weinhardt, and Ryan Riordan
2 Hypothesis Development
For the analysis of market reactions, we extract two hypotheses from related litera-ture of possible effects of voluntary disclosure: (1) reduced cost of equity capital,and (2) increased information intermediation. The cost of equity capital hypothesisstates that companies increase their level of voluntary disclosure in order to reduceadverse selection risks for investors, since investors then require lower returns tooffset the information risk they bear. This hypothesis is in line with empiricalevidence of Botosan (1997) and Botosan and Plumlee (2001). Thus, we expect a long-term effect of Interactive Data reflected in a significantly lower level of cumulativeabnormal returns as an indicator for lower cost of equity capital. This translatesinto hypothesis H1:
H1: The introduction of Interactive Data should lead to decreased cost of equitycapital of participants.
Regarding information intermediation, Lang and Lundholm (1996) conjecturethat voluntary disclosure leads to reduced analysts’ costs of information acquisition.As a consequence, the reduction of information acquisition costs ceteris paribusleads to an increase in the number of analysts covering a specific stock. In ouranalysis, the number of available EPS (earnings per share) estimates on a specificstock serves as a proxy for the number of analysts. Therefore, this proxy is utilizedas an indicator for the conjecture that information intermediation is facilitatedthrough IT innovation. This reflected in hypothesis H2:
H2: The number of analysts following should increase with the introduction ofInteractive Data.
The SEC’s goal by adopting XBRL is to enhance information transparency andto facilitate investors’ report analysis. Decision facilitation may be increased withXBRL usage as investors can electronically download and analyze reports in astandardized structure and format with pre-defined semantics and taxonomies(dictionary of terms). They are able to use information directly from corporatereports in software applications, which are able to “understand” and “interact” withthis data with little transformation and interpretation.
3 Data and Sample
We use market data from Compustat and Thomson Reuters Tick History1. Forthe identification of the participating companies, we use the report data fromthe 163 participating companies between April 4, 2005 and March 23, 2009 fromthe SEC website2. We exclude companies, like trust funds and ADRs (American
1 We thank SIRCA for providing access to the Thomson Reuters DataScope Tick History2 http://www.sec.gov/spotlight/xbrl/filings-and-feeds.shtml
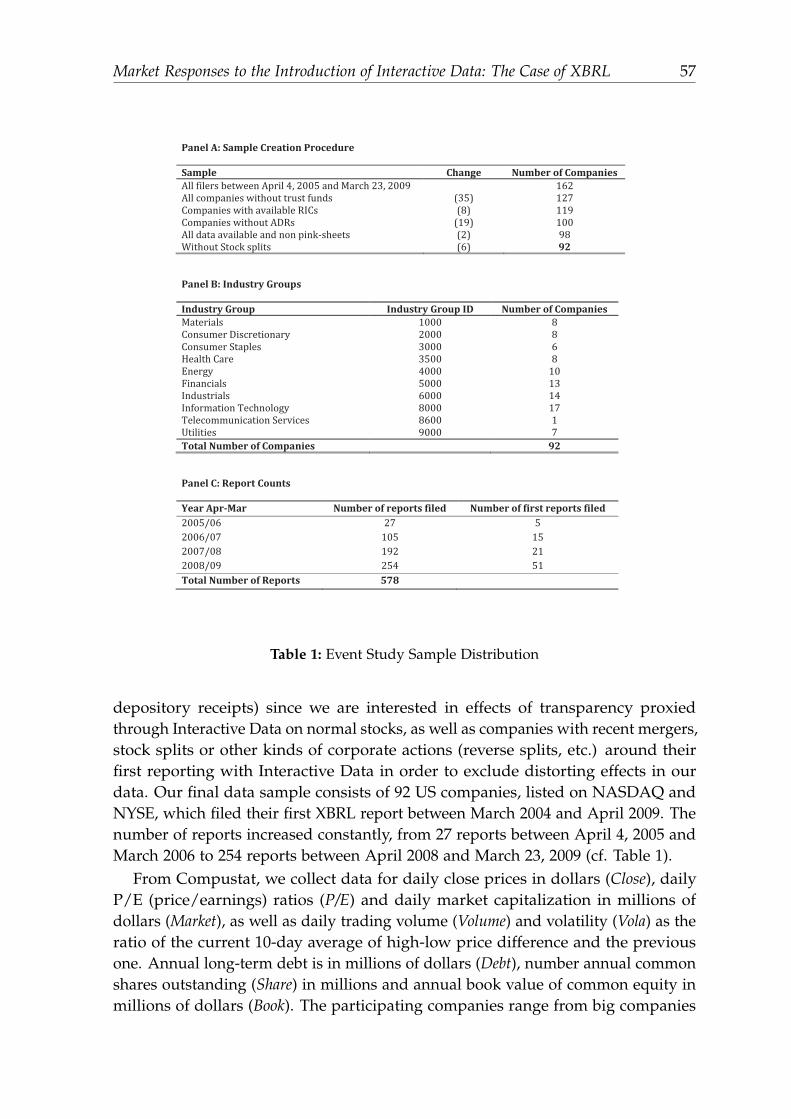
Market Responses to the Introduction of Interactive Data: The Case of XBRL 57
Panel A: Sample Creation Procedure
Sample Change Number of Companies
92
Panel B: Industry Groups
Industry Group Industry Group ID Number of Companies
Total Number of Companies 92
Panel C: Report Counts
Year Apr Mar Number of reports filed Number of first reports filed
Total Number of Reports 578
Table 1: Event Study Sample Distribution
depository receipts) since we are interested in effects of transparency proxiedthrough Interactive Data on normal stocks, as well as companies with recent mergers,stock splits or other kinds of corporate actions (reverse splits, etc.) around theirfirst reporting with Interactive Data in order to exclude distorting effects in ourdata. Our final data sample consists of 92 US companies, listed on NASDAQ andNYSE, which filed their first XBRL report between March 2004 and April 2009. Thenumber of reports increased constantly, from 27 reports between April 4, 2005 andMarch 2006 to 254 reports between April 2008 and March 23, 2009 (cf. Table 1).
From Compustat, we collect data for daily close prices in dollars (Close), dailyP/E (price/earnings) ratios (P/E) and daily market capitalization in millions ofdollars (Market), as well as daily trading volume (Volume) and volatility (Vola) as theratio of the current 10-day average of high-low price difference and the previousone. Annual long-term debt is in millions of dollars (Debt), number annual commonshares outstanding (Share) in millions and annual book value of common equity inmillions of dollars (Book). The participating companies range from big companies
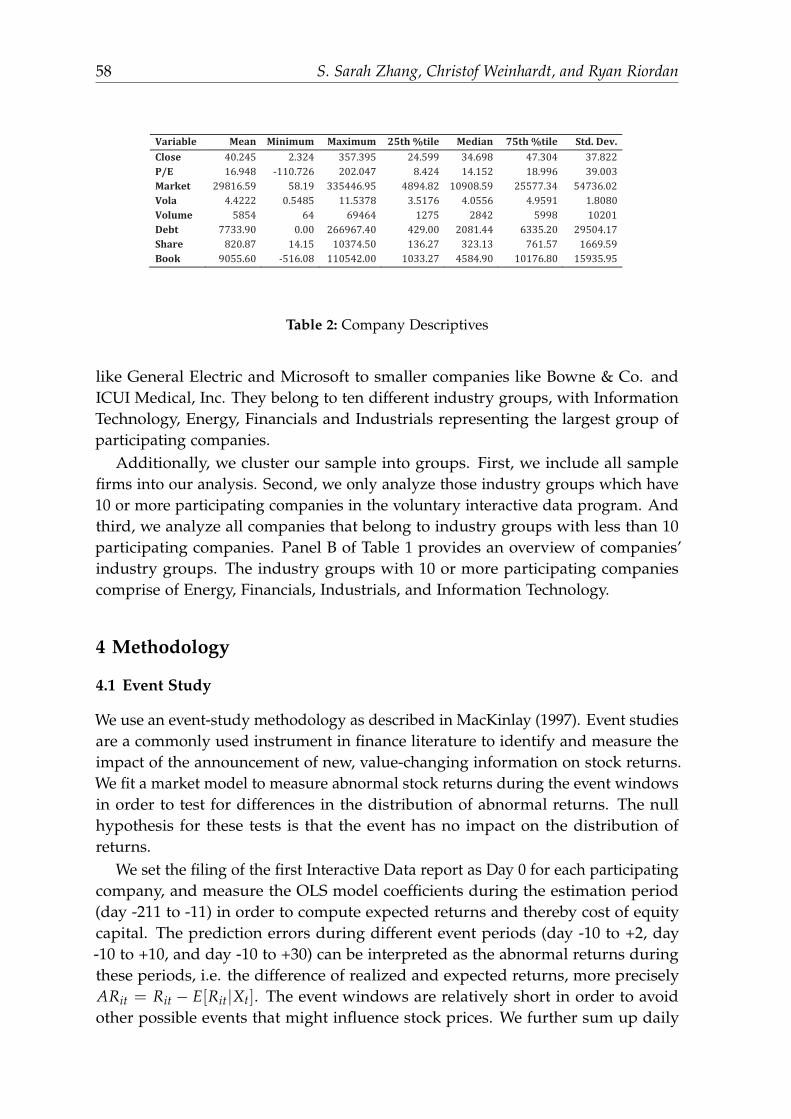
58 S. Sarah Zhang, Christof Weinhardt, and Ryan Riordan
Variable Mean Minimum Maximum 25th%tile Median 75th%tile Std. Dev.
CloseP/EMarketVolaVolumeDebtShareBook
Table 2: Company Descriptives
like General Electric and Microsoft to smaller companies like Bowne & Co. andICUI Medical, Inc. They belong to ten different industry groups, with InformationTechnology, Energy, Financials and Industrials representing the largest group ofparticipating companies.
Additionally, we cluster our sample into groups. First, we include all samplefirms into our analysis. Second, we only analyze those industry groups which have10 or more participating companies in the voluntary interactive data program. Andthird, we analyze all companies that belong to industry groups with less than 10participating companies. Panel B of Table 1 provides an overview of companies’industry groups. The industry groups with 10 or more participating companiescomprise of Energy, Financials, Industrials, and Information Technology.
4 Methodology
4.1 Event Study
We use an event-study methodology as described in MacKinlay (1997). Event studiesare a commonly used instrument in finance literature to identify and measure theimpact of the announcement of new, value-changing information on stock returns.We fit a market model to measure abnormal stock returns during the event windowsin order to test for differences in the distribution of abnormal returns. The nullhypothesis for these tests is that the event has no impact on the distribution ofreturns.
We set the filing of the first Interactive Data report as Day 0 for each participatingcompany, and measure the OLS model coefficients during the estimation period(day -211 to -11) in order to compute expected returns and thereby cost of equitycapital. The prediction errors during different event periods (day -10 to +2, day-10 to +10, and day -10 to +30) can be interpreted as the abnormal returns duringthese periods, i.e. the difference of realized and expected returns, more preciselyARit = Rit − E[Rit|Xt]. The event windows are relatively short in order to avoidother possible events that might influence stock prices. We further sum up daily
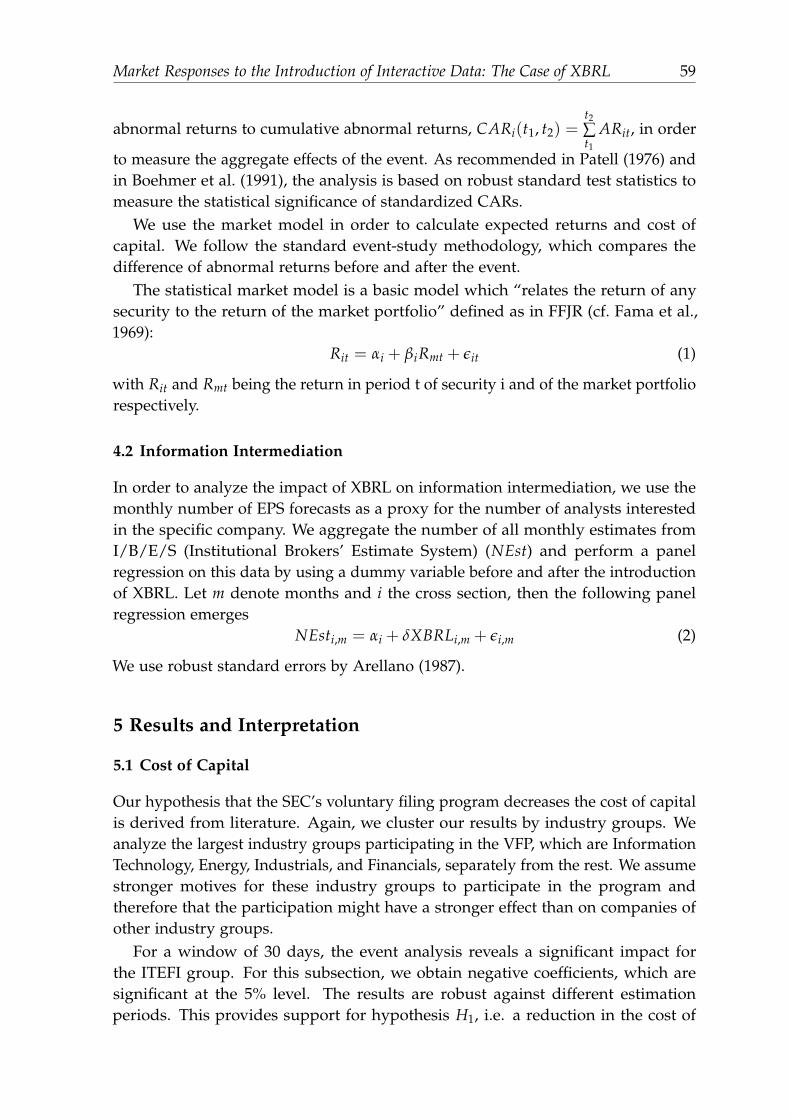
Market Responses to the Introduction of Interactive Data: The Case of XBRL 59
abnormal returns to cumulative abnormal returns, CARi(t1, t2) =t2∑t1
ARit, in order
to measure the aggregate effects of the event. As recommended in Patell (1976) andin Boehmer et al. (1991), the analysis is based on robust standard test statistics tomeasure the statistical significance of standardized CARs.
We use the market model in order to calculate expected returns and cost ofcapital. We follow the standard event-study methodology, which compares thedifference of abnormal returns before and after the event.
The statistical market model is a basic model which “relates the return of anysecurity to the return of the market portfolio” defined as in FFJR (cf. Fama et al.,1969):
Rit = αi + βiRmt + εit (1)
with Rit and Rmt being the return in period t of security i and of the market portfoliorespectively.
4.2 Information Intermediation
In order to analyze the impact of XBRL on information intermediation, we use themonthly number of EPS forecasts as a proxy for the number of analysts interestedin the specific company. We aggregate the number of all monthly estimates fromI/B/E/S (Institutional Brokers’ Estimate System) (NEst) and perform a panelregression on this data by using a dummy variable before and after the introductionof XBRL. Let m denote months and i the cross section, then the following panelregression emerges
NEsti,m = αi + δXBRLi,m + εi,m (2)
We use robust standard errors by Arellano (1987).
5 Results and Interpretation
5.1 Cost of Capital
Our hypothesis that the SEC’s voluntary filing program decreases the cost of capitalis derived from literature. Again, we cluster our results by industry groups. Weanalyze the largest industry groups participating in the VFP, which are InformationTechnology, Energy, Industrials, and Financials, separately from the rest. We assumestronger motives for these industry groups to participate in the program andtherefore that the participation might have a stronger effect than on companies ofother industry groups.
For a window of 30 days, the event analysis reveals a significant impact forthe ITEFI group. For this subsection, we obtain negative coefficients, which aresignificant at the 5% level. The results are robust against different estimationperiods. This provides support for hypothesis H1, i.e. a reduction in the cost of
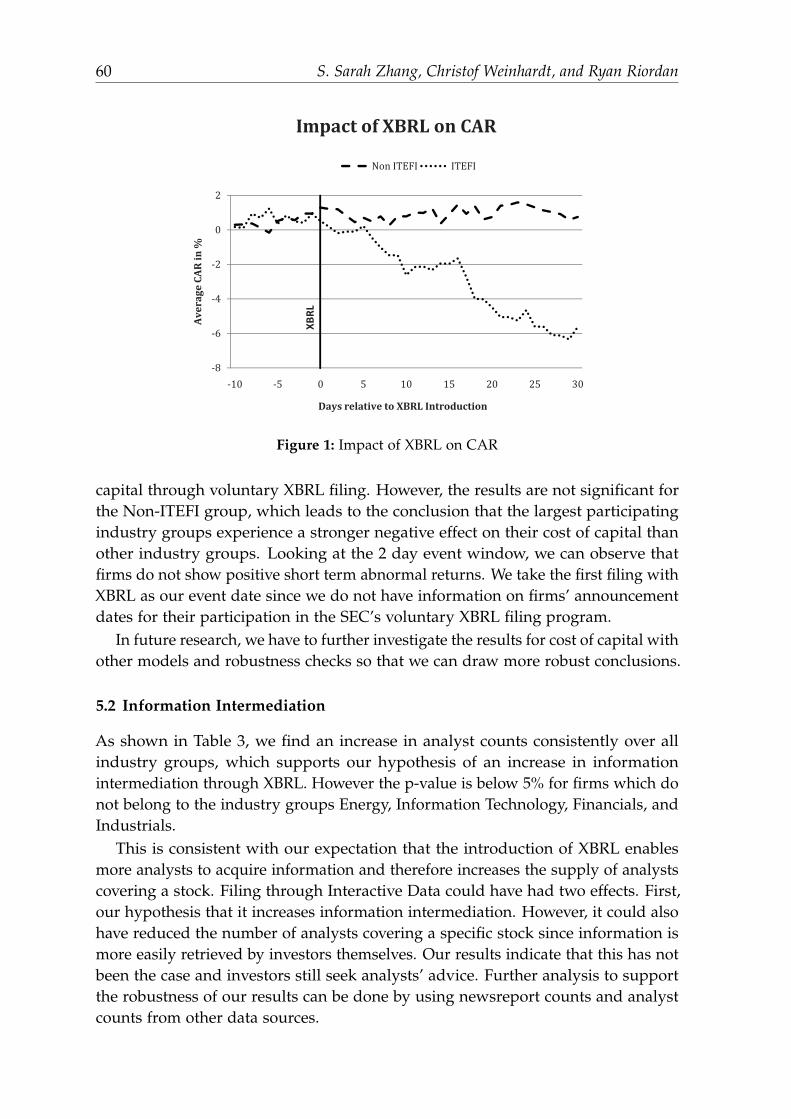
60 S. Sarah Zhang, Christof Weinhardt, and Ryan Riordan
Impact of XBRL on CAR
eCARin%
Averag
XBRL
Days relative to XBRL Introduction
Figure 1: Impact of XBRL on CAR
capital through voluntary XBRL filing. However, the results are not significant forthe Non-ITEFI group, which leads to the conclusion that the largest participatingindustry groups experience a stronger negative effect on their cost of capital thanother industry groups. Looking at the 2 day event window, we can observe thatfirms do not show positive short term abnormal returns. We take the first filing withXBRL as our event date since we do not have information on firms’ announcementdates for their participation in the SEC’s voluntary XBRL filing program.
In future research, we have to further investigate the results for cost of capital withother models and robustness checks so that we can draw more robust conclusions.
5.2 Information Intermediation
As shown in Table 3, we find an increase in analyst counts consistently over allindustry groups, which supports our hypothesis of an increase in informationintermediation through XBRL. However the p-value is below 5% for firms which donot belong to the industry groups Energy, Information Technology, Financials, andIndustrials.
This is consistent with our expectation that the introduction of XBRL enablesmore analysts to acquire information and therefore increases the supply of analystscovering a stock. Filing through Interactive Data could have had two effects. First,our hypothesis that it increases information intermediation. However, it could alsohave reduced the number of analysts covering a specific stock since information ismore easily retrieved by investors themselves. Our results indicate that this has notbeen the case and investors still seek analysts’ advice. Further analysis to supportthe robustness of our results can be done by using newsreport counts and analystcounts from other data sources.
Market Responses to the Introduction of Interactive Data: The Case of XBRL 61
IT, Energy,Industrials,Financials
Estimate StandardError
t statistic p value
All01
Table 3: Results of Analysts Counts
6 Conclusion
The main focus of this paper was to investigate whether IT innovations can facilitateinformation intermediation and transparency in markets. Participation in thisprogram qualifies as voluntary disclosure. In April 2009, the SEC made the programcompulsory and the program will be implemented through a staggered introductionover three years. However, it is still unclear what the effects of reporting withXBRL are on financial markets. We derive two hypotheses from existing literature.Previous studies suggest that voluntary disclosure reduces the cost of equity capitaland increases information intermediation. The introduction of XBRL has turnedout to (H1) decrease costs of capital for the four largest participating industrysectors and (H2) increase information intermediation of investors. Further, withrespect to the results of hypothesis H1, the analysis reveals that specific industrygroups have stronger incentives to participate on a voluntary basis and, therefore,experience stronger market reactions, e.g. on their costs of capital. Our results sofar raise questions whether voluntary adaption has had other effects than those weanalyzed which might justify the decision of early voluntary adoption or whetherparticipation might even have been harmful for participating companies, consideringcosts involved in early adoption. We preliminarily accept the increased informationintermediation hypothesis. Our results show an increase in analyst coverage afterreporting with XBRL through the SEC’s voluntary filing program, proxied byI/B/E/S estimates counts. We will further use news reports counts as well asother proxies to get more robust results. In conclusion, future research needs toinvolve more robust checks on liquidity and information intermediation and adeeper analysis of the effects on the cost of equity capital. Further studies mightalso include an analysis of the mandatory introduction of Interactive Data by theSEC.
References
Arellano, J. (1987): “Computing Robust Standard Errors for Within-groups Estima-tors,” Oxford Bulletin of Economics and Statistics, 49(4), pp. 431–434.
62 S. Sarah Zhang, Christof Weinhardt, and Ryan Riordan
Boehmer, E., J. Musumeci, and A. Poulsen (1991): “Event-study methodologyunder conditions of event-induced variance,” Journal of Financial Economics, 30,pp. 253–272.
Botosan, C. A. (1997): “Disclosure level and the cost of equity capital,” The Account-ing Review, 73(3), pp. 323–350.
Botosan, C. A. and M. A. Plumlee (2001): “A Re-examination of Disclosure Leveland the Expected Cost of Equity Capital,” Journal of Accounting Research, 40(1), pp.21–40.
Fama, E. F., L. Fisher, M. C. Jensen, and R. Roll (1969): “The adjustment of stockprices to new information,” International Economic Review, 10(1), pp. 1–21.
Lang, M. and R. Lundholm (1996): “Corporate disclosure policy and analyst behav-ior,” The Accounting Review, 71(4), pp. 467–496.
MacKinlay, A. C. (1997): “Event Studies in Economics and Finance,” Journal ofEconomic Literature, 35(1), pp. 13–39.
Patell, J. M. (1976): “Corporate forecasts of earnings per share and stock pricebehavior,” Journal of Accounting Research, 14(2), pp. 246–276.
The Impact of the Yearly Emissions Announcement onCO2 Prices: An Event Study
Steffen Hitzemann1, Marliese Uhrig-Homburg2, and Karl-Martin Ehrhart3
1 Chair of Financial Engineering and [email protected]
2 Chair of Financial Engineering and [email protected]
3 Institute of Economic Theory and [email protected]
Summary. One of the most important news events in the European carbon market is theyearly announcement of aggregated realized emissions for the previous year. Especially in2006, this event attracted a lot of attention, when CO2 allowances lost about two thirds oftheir value in consequence of a big permit surplus that became known. We use standardevent study methodology to analyze the impact of the yearly emissions announcementevent on CO2 prices for the years 2006 to 2010. We find that the surprise effect causedby this event has considerably declined over the years. Furthermore, the market seemsto incorporate information conveyed by such events efficiently and we cannot find clearevidence of prior information leakage. We additionally observe that futures maturing inthe same trading period show almost the same reaction to these events according to thecost-of-carry-relationship.
1 Introduction
In January 2005, the European Union Emission Trading System (EU ETS) wasintroduced, and along with it, a market for tradable permits began to evolve.Since then, European CO2 prices have gone through turbulent phases. The mostspectacular price movements occurred in 2006 when permits of the first tradingperiod lost about two thirds of their value in less than three weeks. This collapse wasmainly caused by the yearly emissions announcement of the European Commission,which stated that aggregated emissions for 2005 were far below the number ofallowances allocated for that year. Surprisingly, the collapse already took placemore than two weeks before the official announcement date, scheduled for May15, and it became known later that this was due to an accidental publication ofpreliminary emissions data on the European Commission’s website.
Due to these occurrences, the yearly emissions announcement event has attractedthe attention of traders as well as researchers. However, there is only sparse literatureon this topic. Conrad et al. (2009) analyze the market response to decisions on
64 Steffen Hitzemann, Marliese Uhrig-Homburg, and Karl-Martin Ehrhart
National Allocation Plans (NAPs). Mansanet-Bataller and Pardo (2007) also focuson NAP events, but take into account the influence of the emissions announcementsin 2006 and 2007. Referring to only two events of that type, they are not able todiscuss the price impact of these events in detail. Additionally, they take May 15 asthe 2006 event day which is inappropriate in our opinion and causes misleadingresults for that event. Chevallier et al. (2009) analyze changes in investors’ riskaversion around the 2006 announcement event.
Still, it is of interest to analyze the influence of this event in detail which issupposed to be the main news event related to the European CO2 market. Based onan available set of five events now, it is possible to gain first substantiated insightsinto this topic. This is, to the best of our knowledge, the first study to analyze theinfluence of the yearly emissions announcement event on European CO2 prices indetail. We use standard event study methodology to calculate abnormal returns andvolumes around the event date for the five events from 2006 to 2010. We find thatthe surprise effect caused by this event, which has been clearly visually observablein 2006, has considerably declined over the years. The market seems to incorporateinformation conveyed by such events efficiently and we cannot find clear evidencefor information leakage prior to an announcement event. Furthermore, futuresmaturing in the same trading period show almost the same reaction to such anevent according to the cost-of-carry-relationship.
The paper is organized as follows. Section 2 gives an overview of the mostimportant regulatory rules of the EU ETS and discusses the impact of emissions an-nouncement events on CO2 prices. Section 3 describes the emissions announcementevents. Section 4 derives our research design. Section 5 presents empirical results.Section 6 concludes.
2 EU Emission Trading System and the Impact of EmissionsAnnouncements
2.1 EU Emission Trading System
In 2005, the EU ETS was launched in order to reduce CO2 emissions of the EUmember states. It was designed as a cap-and-trade system. The main advantage ofsuch a market mechanism compared to other measures is that it is supposed to givecompanies an economic incentive to use the cheapest abatement opportunities ofthe economy. The EU ETS is subdivided into different trading periods. First, a trialperiod (Phase I) from 2005 to 2007 was introduced, followed by the current tradingperiod from 2008 to 2012. The next trading period will be from 2012 to 2020. At thebeginning of each trading period, the EU Commission allocates emission permitsto the regulated companies according to National Allocation Plans. Each permit,called EU Allowance (EUA), allows for the emission of 1 ton CO2 during the yearthe permit is allocated for.
The Yearly CO2 Emissions Announcement: An Event Study 65
At the end of each year, companies have to cover their emissions by EUAs,whereas additional emissions are penalized. The penalty has been 40 Euro perton in the trial period and is 100 Euro per ton in the current trading period. Still,the payment of a penalty does not exempt a company from delivering lackingallowances later. The compliance date for allowance delivery is April 30 of each year.As the allocation of new permits takes place each year at the end of February and aspermits from different years within the same trading period are not distinguishable,allowances allocated for the following year can in fact be used for compliance as well(“borrowing”). Thus, borrowing within a trading period is implicitly allowed, but itis not allowed between two different trading periods. The opposite of borrowing, i.e.the usage of current allowances for the following year (“banking”), is allowed withina trading period, again because permits of the same trading period are identical.Contrary, banking has not been allowed between the trial period and the currentperiod because the trial period was intended to be separated from the followingtrading periods. From this trading period on, banking is allowed between tradingperiods as well. Since allowances can be banked and borrowed from one year toanother within a trading period, one can consider a whole trading period as onemarket and penalties are in fact only paid at the end of a trading period.1
In addition to EUAs, standard EUA derivatives are traded on several exchangesacross Europe, most importantly futures contracts expiring in December of each yearwith an underlying allowance of the same year.2 Currently, the futures with the latestmaturity date expire in December 2014. That means that there are futures expiringin the next trading period, although the underlying allowances are not allocatedyet and thus are not tradable. The December futures contract next to maturity isusually traded with higher liquidity than the EUAs themselves. Furthermore, thereare European-style options written on the different futures with maturity dates fewdays before the underlying futures expire.
2.2 Influence of Emissions Announcements on Permit Prices
As emission permits are used to cover realized emissions and to avoid payingpenalties at the end of a trading period, the (expected) scarcity of permits heav-ily depends on the expected overall emissions belonging to that trading period.Therefore, this parameter is the main influencing factor of CO2 permit prices.3
The expected overall emissions for a specific trading period are made up of theknown realized emissions4 and the expected emissions up to the end of the trading
1 This simplification cannot be made if there is a significant probability that allowances allocatedfor the current and the following year are completely needed to cover emissions of the currentyear because borrowing from later years is not allowed. However, in realistic scenarios this is veryimprobable.
2 Recently, futures with expiry in March, June, and September of each year are traded as well.3 There are also other influencing factors that are not fixed, such as allowance allocations in the far
future or the amount of transferable allowances from connected trading systems, like the CleanDevelopment Mechanism.
4 Clearly, realized emissions are known once they have been published on an announcement event.
66 Steffen Hitzemann, Marliese Uhrig-Homburg, and Karl-Martin Ehrhart
period. If the whole trading period that is considered lies in the future, the realizedemissions part does not exist. An emissions announcement event, on the one hand,has the effect that realized emissions are exactly known for one additional year,but as it gives an indication about the current emission rate of the economy, it alsoaffects the expected emissions in the future. Let us distinguish between the firstpart, which we will call information about realized emissions, and the second part, theindication about future emissions.
A change of the information about realized emissions clearly affects the expectedallowance scarcity for the related trading period, which is the current tradingperiod unless we are in the first year of a new trading period. The indicationabout future emissions may influence the expected emissions for the current andall future trading periods. Precise effects depend on how these expectations evolve.For example, if they show a mean-reverting behavior to a predefined trend, theindication about future emissions will mainly affect the current trading period andwill have only little impact on a trading period in the far future.
Additionally, the allowance scarcity of one trading period might be forwardedto the following period, depending on whether banking is allowed or not. Whenbanking is prohibited, as it was the case in the trial period, the amount of realizedemissions during the related period has an impact on the permit scarcity in allfollowing trading periods if the current market is short due to the obligation todeliver lacking allowances later, but is irrelevant if the market is long. In contrast, ifbanking is allowed, realized emissions always influence permit scarcity in followingtrading periods, independent of the current market being long or short.
This means that both types of information conveyed by announcement eventsshould influence permit prices of all trading periods when banking is allowed, andthat should also be the case when banking is not allowed, but the market of therelated trading period is short. In these cases it is not possible to separate bothtypes of information from each other and to identify the dominant one. Contraryto that, if the market of a trading period is known to be long and banking is notallowed, the information about realized emissions should not affect permit prices ofthe following trading periods, so that only the indication about future emissionsshould have an impact on those prices.
3 Emissions Announcement Events
The available set of realized emissions announcement events consists of thoseobserved between 2006 and 2010 which we will call EA2006, EA2007, EA2008,EA2009, and EA2010. An overview of these events and related data is shown inTable 15. The first release of verified emissions data took place in 2006 and theofficial announcement date was planned to be on May 15. However, as the European5 We refer to data from the first official press release after an emissions announcement. In 2006,
this data includes emissions from Austria, Belgium, Czech Republic, Denmark, Estonia, Finland,France, Germany, Greece, Hungary, Ireland, Italy, Latvia, Lithuania, Netherlands, Portugal, Slovak
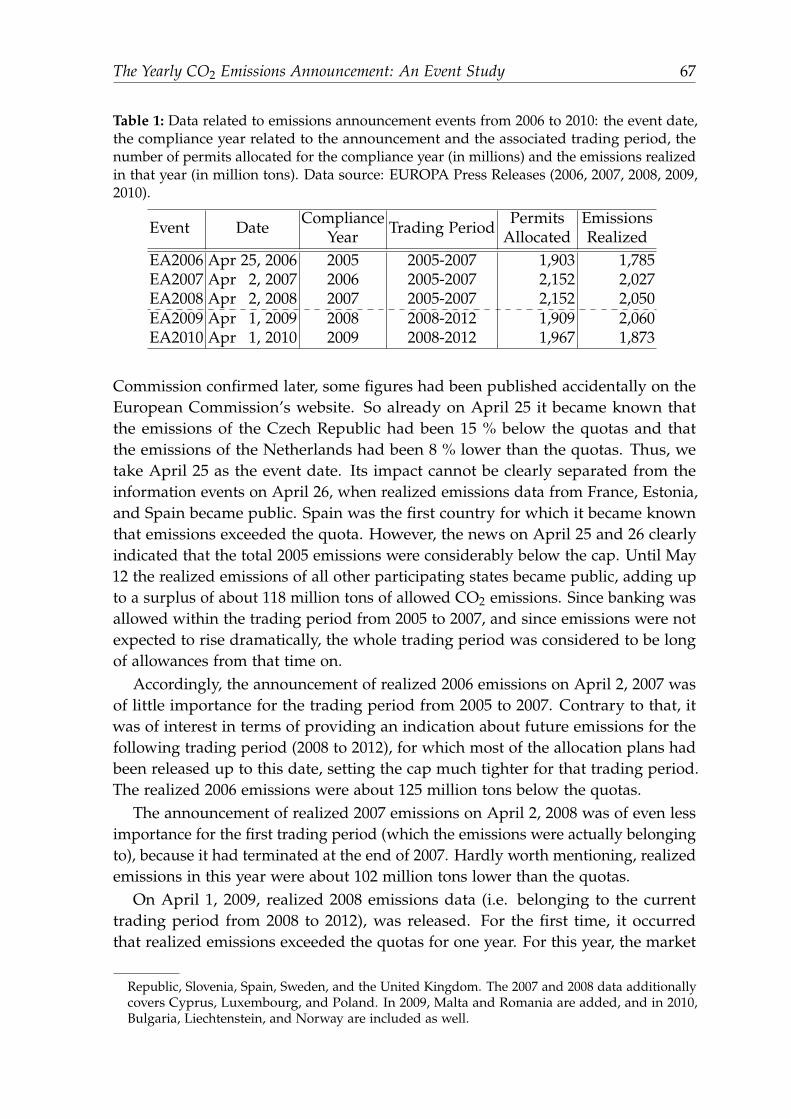
The Yearly CO2 Emissions Announcement: An Event Study 67
Table 1: Data related to emissions announcement events from 2006 to 2010: the event date,the compliance year related to the announcement and the associated trading period, thenumber of permits allocated for the compliance year (in millions) and the emissions realizedin that year (in million tons). Data source: EUROPA Press Releases (2006, 2007, 2008, 2009,2010).
Event Date ComplianceYear Trading Period Permits
AllocatedEmissionsRealized
EA2006 Apr 25, 2006 2005 2005-2007 1,903 1,785EA2007 Apr 2, 2007 2006 2005-2007 2,152 2,027EA2008 Apr 2, 2008 2007 2005-2007 2,152 2,050EA2009 Apr 1, 2009 2008 2008-2012 1,909 2,060EA2010 Apr 1, 2010 2009 2008-2012 1,967 1,873
Commission confirmed later, some figures had been published accidentally on theEuropean Commission’s website. So already on April 25 it became known thatthe emissions of the Czech Republic had been 15 % below the quotas and thatthe emissions of the Netherlands had been 8 % lower than the quotas. Thus, wetake April 25 as the event date. Its impact cannot be clearly separated from theinformation events on April 26, when realized emissions data from France, Estonia,and Spain became public. Spain was the first country for which it became knownthat emissions exceeded the quota. However, the news on April 25 and 26 clearlyindicated that the total 2005 emissions were considerably below the cap. Until May12 the realized emissions of all other participating states became public, adding upto a surplus of about 118 million tons of allowed CO2 emissions. Since banking wasallowed within the trading period from 2005 to 2007, and since emissions were notexpected to rise dramatically, the whole trading period was considered to be longof allowances from that time on.
Accordingly, the announcement of realized 2006 emissions on April 2, 2007 wasof little importance for the trading period from 2005 to 2007. Contrary to that, itwas of interest in terms of providing an indication about future emissions for thefollowing trading period (2008 to 2012), for which most of the allocation plans hadbeen released up to this date, setting the cap much tighter for that trading period.The realized 2006 emissions were about 125 million tons below the quotas.
The announcement of realized 2007 emissions on April 2, 2008 was of even lessimportance for the first trading period (which the emissions were actually belongingto), because it had terminated at the end of 2007. Hardly worth mentioning, realizedemissions in this year were about 102 million tons lower than the quotas.
On April 1, 2009, realized 2008 emissions data (i.e. belonging to the currenttrading period from 2008 to 2012), was released. For the first time, it occurredthat realized emissions exceeded the quotas for one year. For this year, the market
Republic, Slovenia, Spain, Sweden, and the United Kingdom. The 2007 and 2008 data additionallycovers Cyprus, Luxembourg, and Poland. In 2009, Malta and Romania are added, and in 2010,Bulgaria, Liechtenstein, and Norway are included as well.
68 Steffen Hitzemann, Marliese Uhrig-Homburg, and Karl-Martin Ehrhart
was short by about 151 million tons. Comparing this figure to prior projections asestablished by a Reuters poll shows that emissions were at the upper end of marketexpectations.6
Realized 2009 emissions, published on April 1, 2010, were 94 million tons lowerthan the quota, a consequence of the economic downturn. According to estimates ofthe Reuters poll, this was expected by market participants, and in fact the emissionswere again higher than expected on average.7
4 Research Design
The magnitude of abnormal performance at the time of an emission announcementevent provides a measure of the unanticipated impact of this event. We derivehypotheses concerning the behavior of EUA prices around announcement eventsand apply event study methodology as mean of testing our hypotheses.
4.1 Hypotheses
Bearing in mind the dramatic drop of CO2 prices on April 25, 2006, when firstdetails of the realized 2005 emissions became known, it is reasonable to conjecturethat this event always causes a huge surprise effect. However, in the following yearsa similarly big surprise was not observable, at least not by visual inspection. Toanalyze possible surprise effects, we test the following hypothesis.
Hypothesis 1 (H1) Information regarding emissions of all regulated companies is com-pletely priced into CO2 prices. The yearly announcement of realized emissions thus does notcause a surprise effect.
The market crashed on April 25, 2006 although the official announcement date in2006 was on May 15. As described before, in retrospect it is clear that there wasan obvious information leakage caused by the European Commission. Meanwhile,the reporting process has been optimized, so that countries report to the EuropeanCommission on March 31 and aggregated figures are published on April 1. Never-theless, information leakages might still exist on the level of individual countries.To discover possible information leakages, we test H2.
Hypothesis 2 (H2) The aggregated information about emissions can be kept confidentialby the European Commission and countries until the official announcement date. Noinformation will leak out on the days before the official announcement date.
The collapse on April 25, 2006 was followed by further big losses on the followingtrading days. Again, in retrospect we know that these were caused by additional
6 Estimates ranged from 100 million tons long (Citi) to 180 million tons short (IDEACarbon), medianexpectation at 30 million tons short. Biases may arise from divergences in the number of includedcountries.
7 Excluding an out-dated estimate of UBS, figures ranged from 190 million tons long (DeutscheBank) to 60 million tons long (Nomisma Energia), median expectation at 150 million tons long.
The Yearly CO2 Emissions Announcement: An Event Study 69
information about realized emissions leaking into the market. Anyhow, this pricebehavior has as well attracted publicity, in this case with respect to market efficiencyas formulated in H3.
Hypothesis 3 (H3) The market reacts to new public information about realized emissionswithout delay.
Finally, we have discussed in Section 2 that price reactions to an announcementevent should be mainly characterized by the trading period the permit belongsto. Only permits of the current year are tradable, as stated before, but futures areavailable for permits of other years as well. Prior literature, such as Uhrig-Homburgand Wagner (2009) and Rittler (2009), lends support to the cost-of-carry-relationshipbetween futures belonging to the same trading period. Our hypothesis H4 is thatthis relationship also holds on a daily basis around the news events considered.
Hypothesis 4 (H4) Futures belonging to the same trading period react to an announcementevent in line with each other.
4.2 Event Study Methodology
We will analyze our hypotheses by applying standard event study methodology.Our study considers abnormal returns and volumes for a short horizon aroundthe events identified to provide evidence relevant for understanding the role of theyearly emissions announcement event in the EU ETS. A general overview of eventstudy methodology can be found in Binder (1998).
To calculate abnormal returns we choose a mean-adjusted return model accordingto Brown and Warner (1980, 1985) as a benchmark model. Generally, it is alsopossible to use market-adjusted returns as proposed in Fama et al. (1969) or certaindeviations based on other models (cf. Binder (1998)). As pointed out by Brown andWarner (1980, 1985), the mean-adjusted model is very simple, but the use of moresophisticated models often does not lead to a smaller variance of the abnormalreturns.
We apply the mean-adjusted return model to arithmetic daily returns rt. Givenan event at time 0, an estimation window Iest := [t1, t2] with t2 < 0 is chosen. Themean return r in Iest is then calculated as
r =1
t2 − t1
t2
∑t=t1
rt. (1)
Furthermore, we calculate abnormal (mean-adjusted) returns art in Iest and theirvariance as
art = rt − r (2)
and

70 Steffen Hitzemann, Marliese Uhrig-Homburg, and Karl-Martin Ehrhart
σ2(ar) =1
t2 − t1 − 1
t2
∑t=t1
(art −
1t2 − t1
t2
∑s=t1
ars
)2
, (3)
respectively.Based on r and σ2(ar), we are able to determine standardized abnormal returns
in a chosen event window Iev := [t3, t4] with t2 < t3 ≤ 0, t4 ≥ 0 as
sart =rt − rσ(ar)
. (4)
To consider the cumulative abnormal return over a certain time window within theevent window, we define
cart,t′ =t′
∑s=t
ars (5)
and standardize by
scart,t′ =cart,t′
σ(ar)√
t′ − t + 1. (6)
We use a standard one-tailed t-test according to Brown and Warner (1980) with t2 −t1 − 1 degrees of freedom to test the significance of the (cumulative) standardizedabnormal returns under the assumption that the abnormal returns are independentand identically normally distributed. Departures from this assumption and potentialbiases induced by non-normally distributed abnormal returns are not accounted forin this study.
For the calculation of abnormal volumes, we apply the mean-adjusted model aswell. As established by Ajinkya and Jain (1989) and Mai and Tchemeni (1996), itis recommendable to use the logarithm of the traded volume in monetary value8
rather than the untransformed volumes. Given these daily log-volumes, denotedby vt, we simply reuse the calculation methodology for the abnormal returns byreplacing all rs by v.
To calculate abnormal returns and volumes of the data described in the nextsection for the days around the announcement events EA2006, EA2007, EA2008,EA2009, and EA2010, we choose an estimation window from 70 to eleven daysbefore each of the events.
4.3 Price and Volume Data
We use price and volume data of futures contracts instead of EUA spot data for tworeasons: First, futures are traded with higher liquidity than the EUAs themselves.Second, at every point in time, futures are available for the permits of followingyears, while the allowances are only traded for the current year (or trading period).Our data set consists of daily EUA futures prices and volumes of all futures contracts
8 To this end, we multiply daily prices by daily volumes. Of course, use of tick-by-tick data wouldbe more accurate to determine the monetary value of trading volumes, but such approach shouldnot lead to markedly different results.
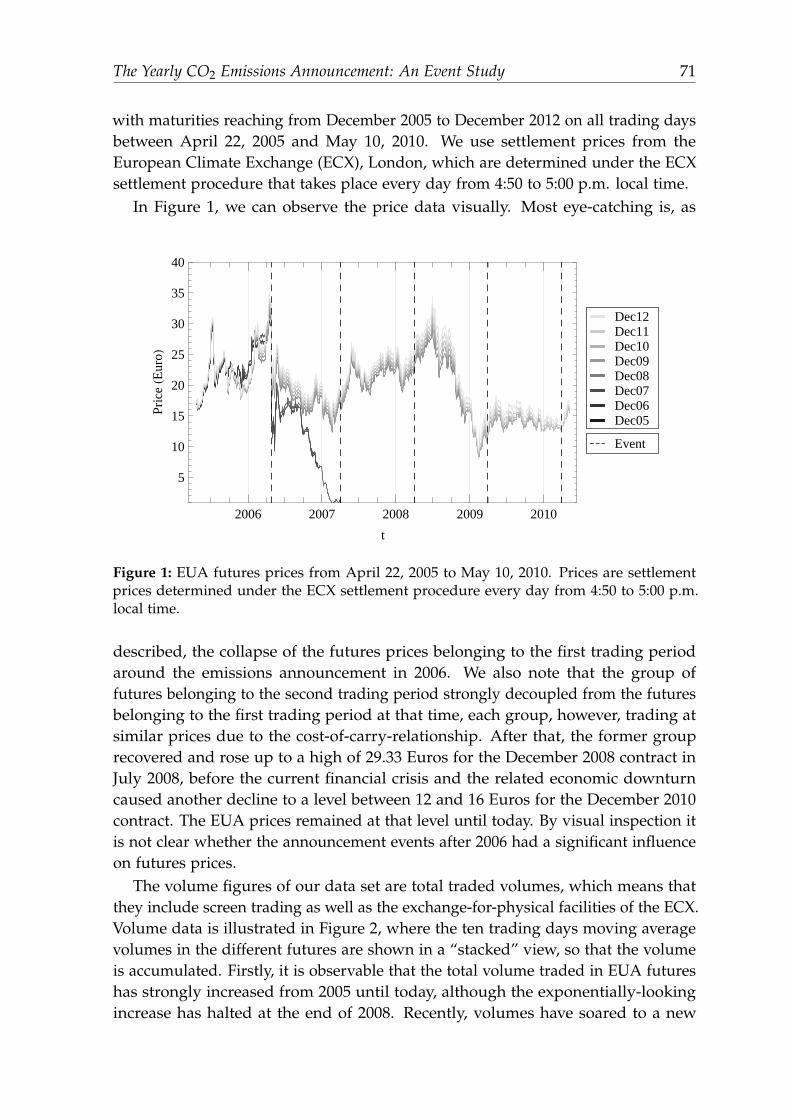
The Yearly CO2 Emissions Announcement: An Event Study 71
with maturities reaching from December 2005 to December 2012 on all trading daysbetween April 22, 2005 and May 10, 2010. We use settlement prices from theEuropean Climate Exchange (ECX), London, which are determined under the ECXsettlement procedure that takes place every day from 4:50 to 5:00 p.m. local time.
In Figure 1, we can observe the price data visually. Most eye-catching is, as
2006 2007 2008 2009 2010
5
10
15
20
25
30
35
40
t
Pric
eHE
uroL
Dec05Dec06Dec07Dec08Dec09Dec10Dec11Dec12
Event
Figure 1: EUA futures prices from April 22, 2005 to May 10, 2010. Prices are settlementprices determined under the ECX settlement procedure every day from 4:50 to 5:00 p.m.local time.
described, the collapse of the futures prices belonging to the first trading periodaround the emissions announcement in 2006. We also note that the group offutures belonging to the second trading period strongly decoupled from the futuresbelonging to the first trading period at that time, each group, however, trading atsimilar prices due to the cost-of-carry-relationship. After that, the former grouprecovered and rose up to a high of 29.33 Euros for the December 2008 contract inJuly 2008, before the current financial crisis and the related economic downturncaused another decline to a level between 12 and 16 Euros for the December 2010contract. The EUA prices remained at that level until today. By visual inspection itis not clear whether the announcement events after 2006 had a significant influenceon futures prices.
The volume figures of our data set are total traded volumes, which means thatthey include screen trading as well as the exchange-for-physical facilities of the ECX.Volume data is illustrated in Figure 2, where the ten trading days moving averagevolumes in the different futures are shown in a “stacked” view, so that the volumeis accumulated. Firstly, it is observable that the total volume traded in EUA futureshas strongly increased from 2005 until today, although the exponentially-lookingincrease has halted at the end of 2008. Recently, volumes have soared to a new
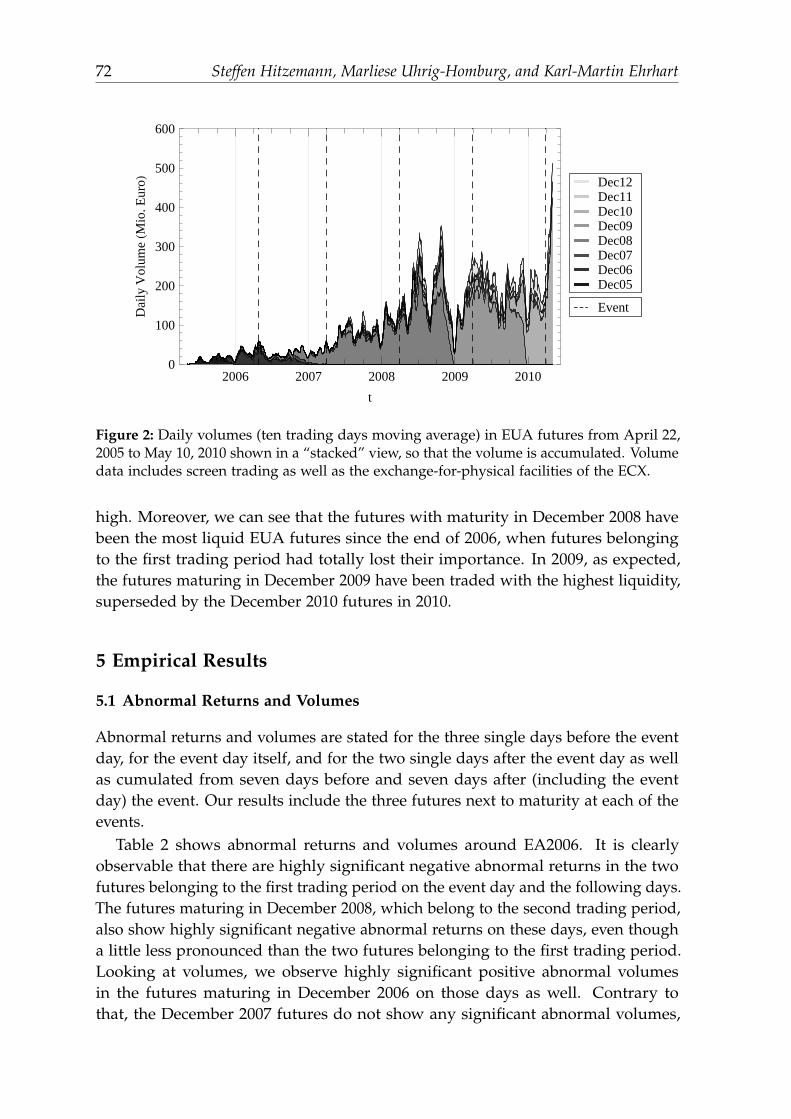
72 Steffen Hitzemann, Marliese Uhrig-Homburg, and Karl-Martin Ehrhart
2006 2007 2008 2009 20100
100
200
300
400
500
600
t
Dai
lyV
olum
eHM
io.E
uroL
Dec05Dec06Dec07Dec08Dec09Dec10Dec11Dec12
Event
Figure 2: Daily volumes (ten trading days moving average) in EUA futures from April 22,2005 to May 10, 2010 shown in a “stacked” view, so that the volume is accumulated. Volumedata includes screen trading as well as the exchange-for-physical facilities of the ECX.
high. Moreover, we can see that the futures with maturity in December 2008 havebeen the most liquid EUA futures since the end of 2006, when futures belongingto the first trading period had totally lost their importance. In 2009, as expected,the futures maturing in December 2009 have been traded with the highest liquidity,superseded by the December 2010 futures in 2010.
5 Empirical Results
5.1 Abnormal Returns and Volumes
Abnormal returns and volumes are stated for the three single days before the eventday, for the event day itself, and for the two single days after the event day as wellas cumulated from seven days before and seven days after (including the eventday) the event. Our results include the three futures next to maturity at each of theevents.
Table 2 shows abnormal returns and volumes around EA2006. It is clearlyobservable that there are highly significant negative abnormal returns in the twofutures belonging to the first trading period on the event day and the following days.The futures maturing in December 2008, which belong to the second trading period,also show highly significant negative abnormal returns on these days, even thougha little less pronounced than the two futures belonging to the first trading period.Looking at volumes, we observe highly significant positive abnormal volumesin the futures maturing in December 2006 on those days as well. Contrary tothat, the December 2007 futures do not show any significant abnormal volumes,
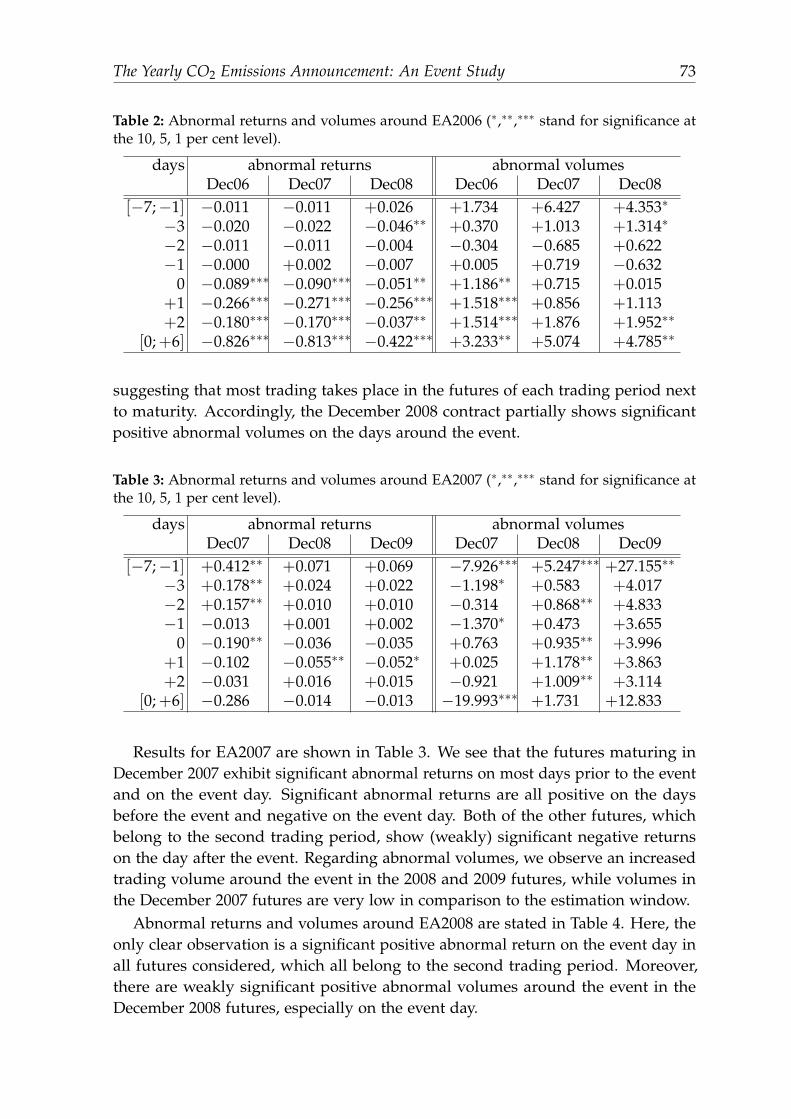
The Yearly CO2 Emissions Announcement: An Event Study 73
Table 2: Abnormal returns and volumes around EA2006 (∗,∗∗,∗∗∗ stand for significance atthe 10, 5, 1 per cent level).
days abnormal returns abnormal volumesDec06 Dec07 Dec08 Dec06 Dec07 Dec08
[−7;−1] −0.011 −0.011 +0.026 +1.734 +6.427 +4.353∗
−3 −0.020 −0.022 −0.046∗∗ +0.370 +1.013 +1.314∗
−2 −0.011 −0.011 −0.004 −0.304 −0.685 +0.622−1 −0.000 +0.002 −0.007 +0.005 +0.719 −0.632
0 −0.089∗∗∗ −0.090∗∗∗ −0.051∗∗ +1.186∗∗ +0.715 +0.015+1 −0.266∗∗∗ −0.271∗∗∗ −0.256∗∗∗ +1.518∗∗∗ +0.856 +1.113+2 −0.180∗∗∗ −0.170∗∗∗ −0.037∗∗ +1.514∗∗∗ +1.876 +1.952∗∗
[0;+6] −0.826∗∗∗ −0.813∗∗∗ −0.422∗∗∗ +3.233∗∗ +5.074 +4.785∗∗
suggesting that most trading takes place in the futures of each trading period nextto maturity. Accordingly, the December 2008 contract partially shows significantpositive abnormal volumes on the days around the event.
Table 3: Abnormal returns and volumes around EA2007 (∗,∗∗,∗∗∗ stand for significance atthe 10, 5, 1 per cent level).
days abnormal returns abnormal volumesDec07 Dec08 Dec09 Dec07 Dec08 Dec09
[−7;−1] +0.412∗∗ +0.071 +0.069 −7.926∗∗∗ +5.247∗∗∗ +27.155∗∗
−3 +0.178∗∗ +0.024 +0.022 −1.198∗ +0.583 +4.017−2 +0.157∗∗ +0.010 +0.010 −0.314 +0.868∗∗ +4.833−1 −0.013 +0.001 +0.002 −1.370∗ +0.473 +3.655
0 −0.190∗∗ −0.036 −0.035 +0.763 +0.935∗∗ +3.996+1 −0.102 −0.055∗∗ −0.052∗ +0.025 +1.178∗∗ +3.863+2 −0.031 +0.016 +0.015 −0.921 +1.009∗∗ +3.114
[0;+6] −0.286 −0.014 −0.013 −19.993∗∗∗ +1.731 +12.833
Results for EA2007 are shown in Table 3. We see that the futures maturing inDecember 2007 exhibit significant abnormal returns on most days prior to the eventand on the event day. Significant abnormal returns are all positive on the daysbefore the event and negative on the event day. Both of the other futures, whichbelong to the second trading period, show (weakly) significant negative returnson the day after the event. Regarding abnormal volumes, we observe an increasedtrading volume around the event in the 2008 and 2009 futures, while volumes inthe December 2007 futures are very low in comparison to the estimation window.
Abnormal returns and volumes around EA2008 are stated in Table 4. Here, theonly clear observation is a significant positive abnormal return on the event day inall futures considered, which all belong to the second trading period. Moreover,there are weakly significant positive abnormal volumes around the event in theDecember 2008 futures, especially on the event day.
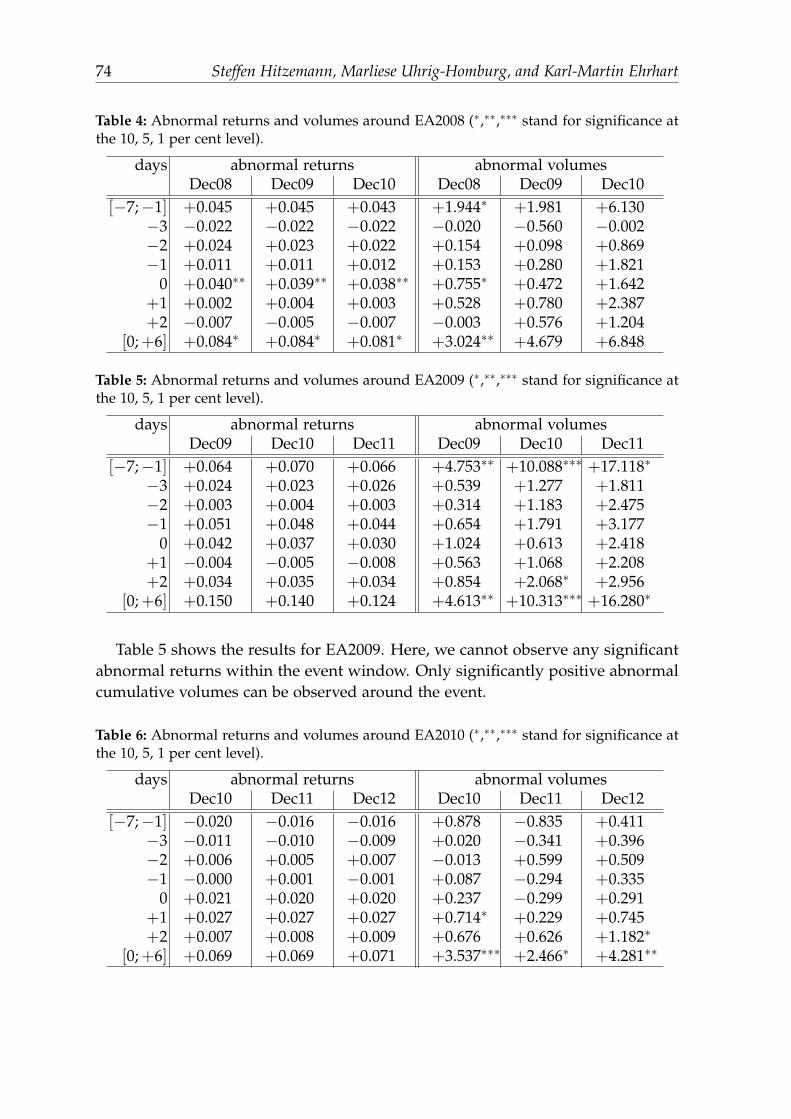
74 Steffen Hitzemann, Marliese Uhrig-Homburg, and Karl-Martin Ehrhart
Table 4: Abnormal returns and volumes around EA2008 (∗,∗∗,∗∗∗ stand for significance atthe 10, 5, 1 per cent level).
days abnormal returns abnormal volumesDec08 Dec09 Dec10 Dec08 Dec09 Dec10
[−7;−1] +0.045 +0.045 +0.043 +1.944∗ +1.981 +6.130−3 −0.022 −0.022 −0.022 −0.020 −0.560 −0.002−2 +0.024 +0.023 +0.022 +0.154 +0.098 +0.869−1 +0.011 +0.011 +0.012 +0.153 +0.280 +1.821
0 +0.040∗∗ +0.039∗∗ +0.038∗∗ +0.755∗ +0.472 +1.642+1 +0.002 +0.004 +0.003 +0.528 +0.780 +2.387+2 −0.007 −0.005 −0.007 −0.003 +0.576 +1.204
[0;+6] +0.084∗ +0.084∗ +0.081∗ +3.024∗∗ +4.679 +6.848
Table 5: Abnormal returns and volumes around EA2009 (∗,∗∗,∗∗∗ stand for significance atthe 10, 5, 1 per cent level).
days abnormal returns abnormal volumesDec09 Dec10 Dec11 Dec09 Dec10 Dec11
[−7;−1] +0.064 +0.070 +0.066 +4.753∗∗ +10.088∗∗∗ +17.118∗
−3 +0.024 +0.023 +0.026 +0.539 +1.277 +1.811−2 +0.003 +0.004 +0.003 +0.314 +1.183 +2.475−1 +0.051 +0.048 +0.044 +0.654 +1.791 +3.177
0 +0.042 +0.037 +0.030 +1.024 +0.613 +2.418+1 −0.004 −0.005 −0.008 +0.563 +1.068 +2.208+2 +0.034 +0.035 +0.034 +0.854 +2.068∗ +2.956
[0;+6] +0.150 +0.140 +0.124 +4.613∗∗ +10.313∗∗∗ +16.280∗
Table 5 shows the results for EA2009. Here, we cannot observe any significantabnormal returns within the event window. Only significantly positive abnormalcumulative volumes can be observed around the event.
Table 6: Abnormal returns and volumes around EA2010 (∗,∗∗,∗∗∗ stand for significance atthe 10, 5, 1 per cent level).
days abnormal returns abnormal volumesDec10 Dec11 Dec12 Dec10 Dec11 Dec12
[−7;−1] −0.020 −0.016 −0.016 +0.878 −0.835 +0.411−3 −0.011 −0.010 −0.009 +0.020 −0.341 +0.396−2 +0.006 +0.005 +0.007 −0.013 +0.599 +0.509−1 −0.000 +0.001 −0.001 +0.087 −0.294 +0.335
0 +0.021 +0.020 +0.020 +0.237 −0.299 +0.291+1 +0.027 +0.027 +0.027 +0.714∗ +0.229 +0.745+2 +0.007 +0.008 +0.009 +0.676 +0.626 +1.182∗
[0;+6] +0.069 +0.069 +0.071 +3.537∗∗∗ +2.466∗ +4.281∗∗
The Yearly CO2 Emissions Announcement: An Event Study 75
The results for the last event of our set, EA2010, are stated in Table 6. As forEA2009, there are no significant abnormal returns within the event window. Again,partly significant positive abnormal volumes can be observed, but only after theevent in this case.
5.2 Interpretation
In light of these results, we can now have a closer look at the hypotheses formulatedin Section 4.1.
Hypothesis 1 says that the emissions announcement event does not cause asurprise effect. We have observed highly significant abnormal returns for EA2006and still significant abnormal returns attributed to EA2007 and EA2008, rejectingH1. For EA2009 and EA2010, however, no significant abnormal returns around theevent day are observable. This is noteworthy especially for EA2010, where realized2009 emissions were announced to be far below the quotas. One may conclude thatthe surprise effect caused by this event has declined, which might be evidence foran increased capability of the market to anticipate unpublished information aboutrealized emissions and the current emission rate of the economy. Nevertheless therestill are increased trading volumes in the relevant futures around the emissionsannouncements suggesting higher trading activity induced by such an event. Whileat EA2006 and EA2008, significant positive abnormal volumes roughly correspondto significant abnormal returns on the event day or the days thereafter, at EA2009and EA2010 mainly the cumulative abnormal volumes over the whole event windoware significant. This supports the thesis of the surprise effect caused by the event tohave declined.
As discussed in Section 2, in special cases, the allowance prices of differenttrading periods should be affected by the new information in different ways. In oursample, futures prices from different trading periods are only available for EA2006and EA2007. Before EA2006, it was not clear that the market of the related tradingperiod had been long, so that the information about realized emissions and theindication about future emissions cannot be separated from each other. On the otherhand, it was very clear before EA2007 that there was a huge surplus of allowancesbelonging to the trial period, and banking into the following trading period wasnot allowed. This means that, according to our theoretical considerations, abnormalreturns in the futures maturing in December 2008 and 2009 around EA2007 areonly caused by that share of the information that we call indication about futureemissions. As we see, this part can be sufficient to cause a surprise effect.
Hypothesis 2 states that there is no information leakage prior to an announce-ment event and would be rejected by significant abnormal returns on the daysantedating such an event. It is quite obvious that there have been highly significantabnormal returns at EA2006 before May 15 because of information leakages, butthese information leakages were obvious. Therefore, we choose April 25 as the eventday, as information started to leak on this day. Before that day, there are hardly
76 Steffen Hitzemann, Marliese Uhrig-Homburg, and Karl-Martin Ehrhart
any significant abnormal returns observable, so there does not seem to have beenany additional “hidden” information leakage. Considering EA2007, we observesignificant positive abnormal returns in the December 2007 futures prior to the event.This could be construed as evidence for information leakage, but we think that thereare other reasons. Firstly, the first trading period market had already collapsed, andthe low prices should have attracted speculators previous to the event. Secondly,there has been a significant abnormal return in the opposite direction on the eventday, which underpins the conjecture of speculators getting into the market beforethe event and getting out of it afterwards. Thirdly, the futures belonging to thesecond trading period do not show any evidence for information leakage, so thatit is quite unlikely that such leakage has occurred indeed. The same is valid forEA2008, where no significant abnormal returns prior to the event are observable.On EA2009 and EA2010, there are no abnormal returns at all. Altogether, we arenot able to substantiate information leakages previous to the announcement events.
In Hypothesis 3 we have formulated an immediate market reaction to the newspublished, whereas significant abnormal returns on the days after the event would beevidence to the contrary. On EA2006, such abnormal returns are clearly observable,but again this event is special in that parts of the information were published onevery day from April 25 on. Therefore, these abnormal returns are supposed tobe a reaction to the new information becoming available. For EA2007, we do notrely on the futures maturing in December 2007 for the reasons described before.However, both of the other futures show significant negative abnormal returns oneday after the event day, which, further, are in the same direction as the abnormalreturns on the event day. One could take this as evidence for market-inefficiency,which affected futures belonging to the following trading period. Contrary, forEA2008, EA2009, and EA2010 there are no significant abnormal returns after theevent day. It is therefore reasonable to conclude that H3 holds true since the markethas achieved a more mature state.
Finally, Hypothesis 4 states a similar behavior of futures belonging to the sametrading period. We are able to provide support for this hypothesis by comparing therelated abnormal returns. Contrary to that, it is interesting to see that futures fromdifferent trading periods may behave differently. For example, the abnormal returnsafter EA2006 are obviously smaller for futures belonging to the second tradingperiod than they are for those belonging to the first trading period. Around EA2007,the behavior of both types of futures differs even more as has been describedalready. However, due to the small set of relevant events, we are not able to makeany statement about the different reaction of futures from different trading periodsto an announcement event.
6 Conclusion
The incidents related to the emissions announcement event in 2006 raised severalquestions regarding the impact of such announcements on CO2 prices. We formulate
The Yearly CO2 Emissions Announcement: An Event Study 77
these questions in form of hypotheses and analyze them by using standard eventstudy methodology. One finding is that this event has caused a surprise effectin the years 2007 and 2008 which has, however, been much weaker than for theannouncement event in 2006. For the events in 2009 and 2010, no surprise effectis observable. Additionally, we cannot find any evidence for information leakageprior to an announcement event. Regarding market efficiency, the market seemsto be mature enough now to react immediately and without delay to these events.Furthermore, futures maturing in the same trading period show almost the samereaction to such an event.
Relating to the evolution of this still new market, our results can be interpreted ina very positive way. It is good to see that prices seem to incorporate new informationcoming from an emissions announcement efficiently. Even before the information ispublished, the market seems to anticipate it more and more, so that the surpriseeffect caused by such events has considerably declined. Since we do not detect anyinformation leakages on the days prior to the events, the surprise effect is supposedto diminish due to a better capability of the market in anticipating informationabout realized emissions and the current emission rate of the economy.
References
Ajinkya, B. B. and P. C. Jain (1989): “The behavior of daily stock market tradingvolume,” Journal of Accounting and Economics, 11, pp. 331–359.
Binder, J. J. (1998): “The Event Study Methodology Since 1969,” Review of QuantitativeFinance and Accounting, 11, pp. 111–137.
Brown, S. J. and J. B. Warner (1980): “Measuring Security Price Performance,”Journal of Financial Economics, 8, pp. 205–258.
Brown, S. J. and J. B. Warner (1985): “Using Daily Returns: The Case of EventStudies,” Journal of Financial Economics, 14, pp. 3–31.
Chevallier, J., F. Ielpo, and L. Mercier (2009): “Risk aversion and institutionalinformation disclosure on the European carbon market: A case-study of the 2006compliance event,” Energy Policy, 37(1), pp. 15–28.
Conrad, C., D. Rittler, and W. Rotfuß (2009): “The European Commission andEUA Prices: A High-Frequency Analysis of the EC’s Decisions on Second NAPs,”Working Paper.
EUROPA Press Releases (2006): “EU emissions trading scheme delivers first ver-ified emissions data for installations,” IP/06/612, http://europa.eu/rapid/
pressReleasesAction.do?reference=IP/06/612.EUROPA Press Releases (2007): “Emissions trading: strong compliance in 2006,
emissions decoupled from economic growth,” IP/07/776, http://europa.eu/rapid/pressReleasesAction.do?reference=IP/07/776.
78 Steffen Hitzemann, Marliese Uhrig-Homburg, and Karl-Martin Ehrhart
EUROPA Press Releases (2008): “Emissions trading: 2007 verified emissions from EUETS businesses,” IP/08/787, http://europa.eu/rapid/pressReleasesAction.
do?reference=IP/08/787.EUROPA Press Releases (2009): “Emissions trading: EU ETS emissions fall
3 % in 2008,” IP/09/794, http://europa.eu/rapid/pressReleasesAction.do?reference=IP/09/794.
EUROPA Press Releases (2010): “Emissions trading: EU ETS emissions fall morethan 11 % in 2009,” IP/10/576, http://europa.eu/rapid/pressReleasesAction.do?reference=IP/10/576.
Fama, E. F., L. Fisher, M. C. Jensen, and R. Roll (1969): “The Adjustment Of StockPrices To New Information,” International Economic Review, 10.
MacKinlay, A. C. (1997): “Event Studies in Economics and Finance,” Journal ofEconomic Literature, 35(1), pp. 13–39.
Mai, H. M. and E. Tchemeni (1996): “Etude d’evenement par les volumes:Methodologies et comparaison,” Working Paper.
Mansanet-Bataller, M. and A. Pardo (2007): “The Effects of National AllocationPlans on Carbon Markets,” Working Paper.
Rittler, D. (2009): “Price Discovery, Causality and Volatility Spillovers in EuropeanUnion Allowances Phase II: A High Frequency Analysis,” Working Paper.
Uhrig-Homburg, M. and M. Wagner (2009): “Futures Price Dynamics of CO2Emission Allowances: An Empirical Analysis of the Trial Period,” Journal ofDerivatives, 17(2), pp. 73–88.
Estimating Event-based Exponential Random GraphModels
Christoph Stadtfeld1, Andreas Geyer-Schulz1, and Karl-Heinz Waldmann3
1 Institute of Information Systems and Management, [email protected], [email protected]
2 Institute of Operations Research, [email protected]
Summary. Communication is often measured as events streams. Events are directed, dyadicand time-stamped interactions. A model is introduced that allows to describe the occurenceof new events in a data stream dependent on actor activities and network structures. Toillustrate how the model and its estimation works, a straightforward example is given. Somepossible applications of the model are proposed.
1 Introduction
Exponential random graph models (ERGMs) are widely used to model structuralchoices of actor in networks (Wasserman and Pattison (1996); Snijders et al. (2006);Robins et al. (2007); Wang et al. (2009)). Given a static network, its estimates expressin how far the network structures that actors are connected with and embeddedin differ from some random graph. A similar estimation can be done for binary,static networks that are measured at a small number of discrete points in time aslongitudinal data (see Snijders (2001, 2005)). Some new approaches (Butts (2008);Brandes et al. (2009); Zenk and Stadtfeld (2010)) use event data instead. Eventsare any kind of social, dyadic interaction and are related to certain types of tiesin social networks. However, when describing such an event stream with ERGMs,the estimation of optimal parameters is a bit different from the longitudinal datacase: Firstly, the model assumes availability of full information, so no guesses aboutunobserved tie changes have to be made. Secondly, the amount of data which hasto be processed is much bigger.
The goal of this paper is to introduce a generic model (that we call event-basedERGM) and illustrate its estimation with some exemplary input data. This idea isexplained in several steps: Firstly, in section 2 the underlying event stream formatis introduced (subsection 2.1), after this some information about the observedcommunication network is given (subsection 2.2), then it is explained how eventsand time change the network (subsection 2.3) using update rules. Based on thesebasic introductions, a Markov model framework is explained in section 3. A concrete
80 Christoph Stadtfeld, Andreas Geyer-Schulz, and Karl-Heinz Waldmann
two-parameter model and a related exemplary event stream are defined in section 4.In section 5, the maximum likelihood function of the abstract model is introducedand plotted for the example. The results of the exemplary estimation are providedin secion 6. In section 7 possible applications of event based models are specified.Finally, section 8 summarizes and gives an outlook on future work.
2 Data, Network and Updates
2.1 Event Stream
When analyzing the change in communication networks, the underlying data doesnot need to be collected at discrete points in time by surveying the actors in anetwork (as in longitudinal studies). Instead, computer mediated communicationdata can be used. Dyadic communication interactions are in the following namedevents. Events are defined as directed, dyadic, social interactions.
An event stream Ω is a chronologically ordered finite list of events
Ω = (ω1, ω2, . . . , ων, . . .). (1)
Events ων are defined as triplets
ων = (ων.sender, ων.recipient, ων.timestamp)
= (iν, jν, tν) (2)
where the first element is the sender of the event (the person who starts a phonecall), the second one the recipient and the third element the timestamp when theevent takes place. For each pair of events ων (ν is the index ∈ 1, . . . , |Ω|), ωφ
holdsν < φ⇒ tν ≤ tφ. (3)
The timestamps tν have values in R+. Sender and recipient are elements of the setof actors A. The time between to subsequent events is named
δν = tν − tν−1. (4)
2.2 Network
The set of actors A and the communication intensities between them are representedby the stream of events Ω. For each point in time t ∈ [t1, t|Ω|], the communicationintensities are represented by a directed, weighted communication network. Itis described with a graph X. The nodes of this network are all actors occuringin the data stream as senders or recipients. Ties in this network represent recentcommunication intensity.
X(t) = (xkl(t)), k, l ∈ 1, . . . , |A|. (5)
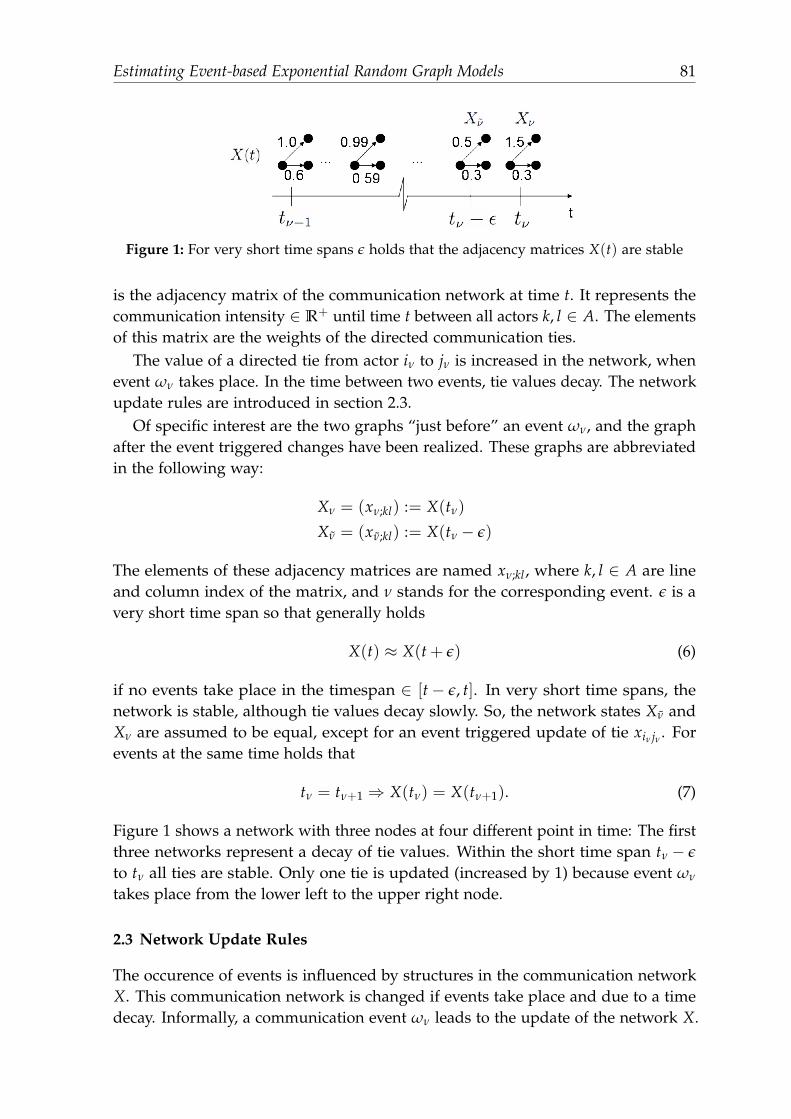
Estimating Event-based Exponential Random Graph Models 81
Figure 1: For very short time spans ε holds that the adjacency matrices X(t) are stable
is the adjacency matrix of the communication network at time t. It represents thecommunication intensity ∈ R+ until time t between all actors k, l ∈ A. The elementsof this matrix are the weights of the directed communication ties.
The value of a directed tie from actor iν to jν is increased in the network, whenevent ων takes place. In the time between two events, tie values decay. The networkupdate rules are introduced in section 2.3.
Of specific interest are the two graphs “just before” an event ων, and the graphafter the event triggered changes have been realized. These graphs are abbreviatedin the following way:
Xν = (xν;kl) := X(tν)
Xν = (xν;kl) := X(tν − ε)
The elements of these adjacency matrices are named xν;kl, where k, l ∈ A are lineand column index of the matrix, and ν stands for the corresponding event. ε is avery short time span so that generally holds
X(t) ≈ X(t + ε) (6)
if no events take place in the timespan ∈ [t− ε, t]. In very short time spans, thenetwork is stable, although tie values decay slowly. So, the network states Xν andXν are assumed to be equal, except for an event triggered update of tie xiν jν . Forevents at the same time holds that
tν = tν+1 ⇒ X(tν) = X(tν+1). (7)
Figure 1 shows a network with three nodes at four different point in time: The firstthree networks represent a decay of tie values. Within the short time span tν − ε
to tν all ties are stable. Only one tie is updated (increased by 1) because event ων
takes place from the lower left to the upper right node.
2.3 Network Update Rules
The occurence of events is influenced by structures in the communication networkX. This communication network is changed if events take place and due to a timedecay. Informally, a communication event ων leads to the update of the network X.
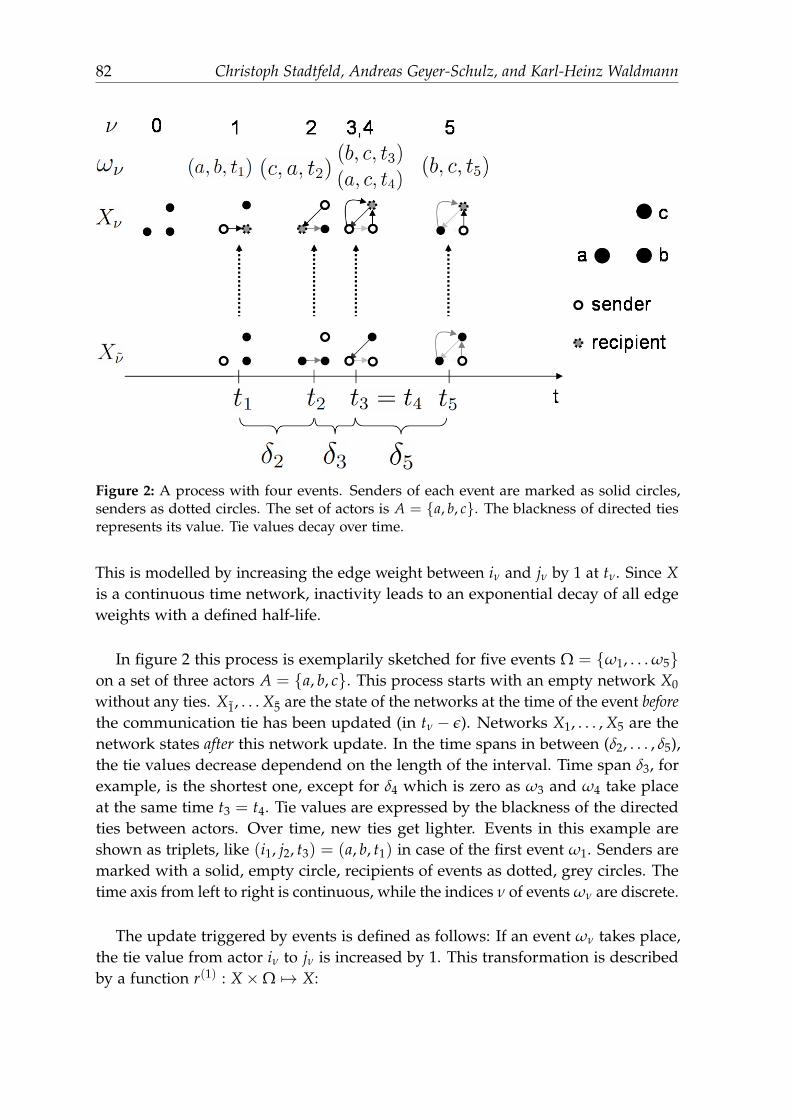
82 Christoph Stadtfeld, Andreas Geyer-Schulz, and Karl-Heinz Waldmann
Figure 2: A process with four events. Senders of each event are marked as solid circles,senders as dotted circles. The set of actors is A = a, b, c. The blackness of directed tiesrepresents its value. Tie values decay over time.
This is modelled by increasing the edge weight between iν and jν by 1 at tν. Since Xis a continuous time network, inactivity leads to an exponential decay of all edgeweights with a defined half-life.
In figure 2 this process is exemplarily sketched for five events Ω = ω1, . . . ω5on a set of three actors A = a, b, c. This process starts with an empty network X0
without any ties. X1, . . . X5 are the state of the networks at the time of the event beforethe communication tie has been updated (in tν − ε). Networks X1, . . . , X5 are thenetwork states after this network update. In the time spans in between (δ2, . . . , δ5),the tie values decrease dependend on the length of the interval. Time span δ3, forexample, is the shortest one, except for δ4 which is zero as ω3 and ω4 take placeat the same time t3 = t4. Tie values are expressed by the blackness of the directedties between actors. Over time, new ties get lighter. Events in this example areshown as triplets, like (i1, j2, t3) = (a, b, t1) in case of the first event ω1. Senders aremarked with a solid, empty circle, recipients of events as dotted, grey circles. Thetime axis from left to right is continuous, while the indices ν of events ων are discrete.
The update triggered by events is defined as follows: If an event ων takes place,the tie value from actor iν to jν is increased by 1. This transformation is describedby a function r(1) : X×Ω 7→ X:
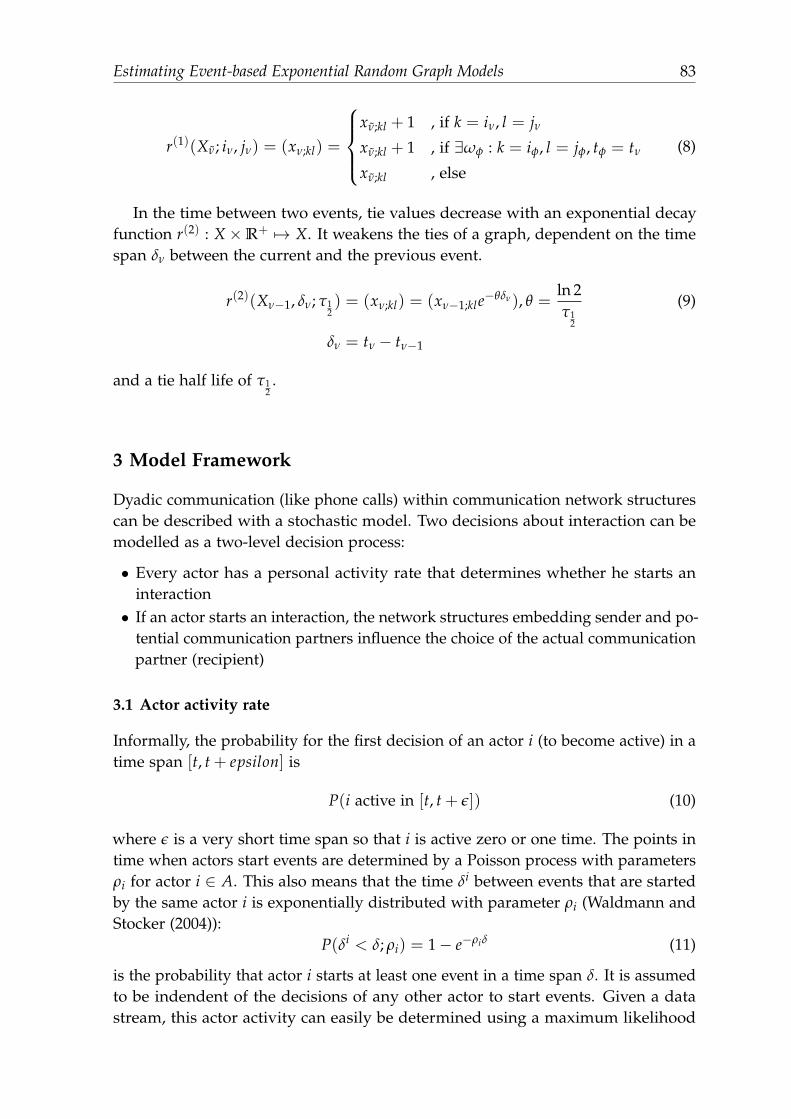
Estimating Event-based Exponential Random Graph Models 83
r(1)(Xν; iν, jν) = (xν;kl) =
xν;kl + 1 , if k = iν, l = jνxν;kl + 1 , if ∃ωφ : k = iφ, l = jφ, tφ = tν
xν;kl , else
(8)
In the time between two events, tie values decrease with an exponential decayfunction r(2) : X×R+ 7→ X. It weakens the ties of a graph, dependent on the timespan δν between the current and the previous event.
r(2)(Xν−1, δν; τ12) = (xν;kl) = (xν−1;kle−θδν), θ =
ln 2τ1
2
(9)
δν = tν − tν−1
and a tie half life of τ12.
3 Model Framework
Dyadic communication (like phone calls) within communication network structurescan be described with a stochastic model. Two decisions about interaction can bemodelled as a two-level decision process:
• Every actor has a personal activity rate that determines whether he starts aninteraction• If an actor starts an interaction, the network structures embedding sender and po-
tential communication partners influence the choice of the actual communicationpartner (recipient)
3.1 Actor activity rate
Informally, the probability for the first decision of an actor i (to become active) in atime span [t, t + epsilon] is
P(i active in [t, t + ε]) (10)
where ε is a very short time span so that i is active zero or one time. The points intime when actors start events are determined by a Poisson process with parametersρi for actor i ∈ A. This also means that the time δi between events that are startedby the same actor i is exponentially distributed with parameter ρi (Waldmann andStocker (2004)):
P(δi < δ; ρi) = 1− e−ρiδ (11)
is the probability that actor i starts at least one event in a time span δ. It is assumedto be indendent of the decisions of any other actor to start events. Given a datastream, this actor activity can easily be determined using a maximum likelihood
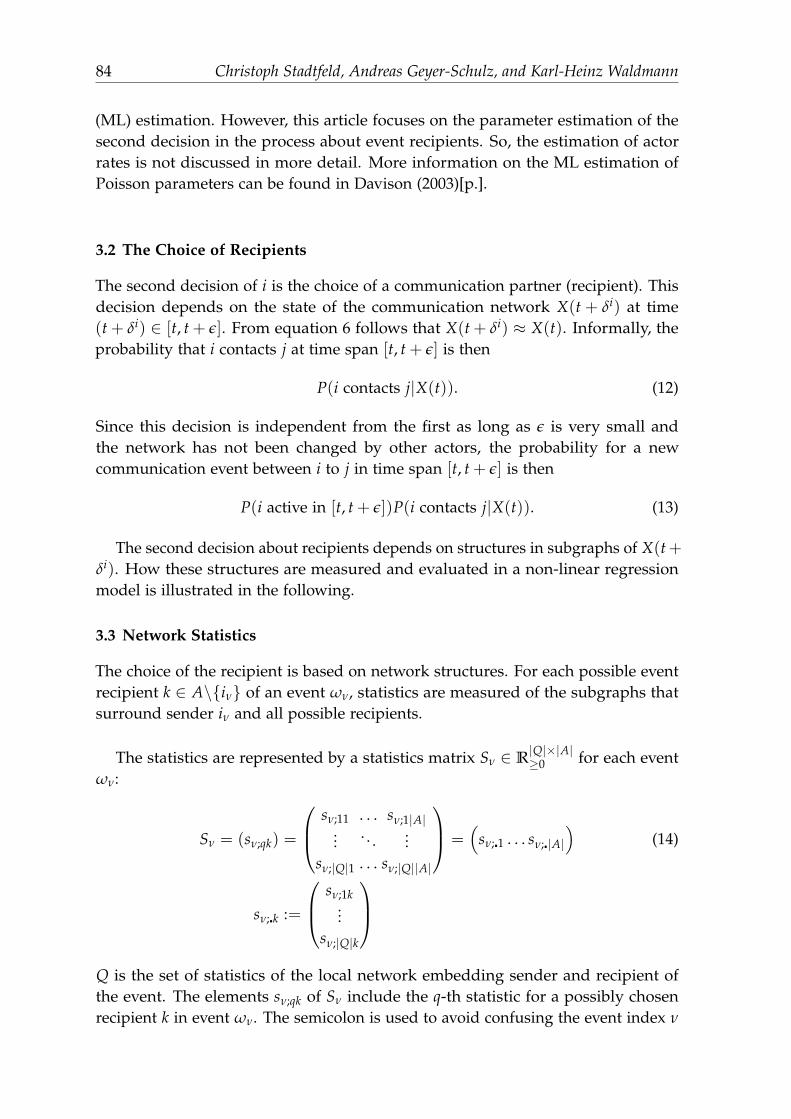
84 Christoph Stadtfeld, Andreas Geyer-Schulz, and Karl-Heinz Waldmann
(ML) estimation. However, this article focuses on the parameter estimation of thesecond decision in the process about event recipients. So, the estimation of actorrates is not discussed in more detail. More information on the ML estimation ofPoisson parameters can be found in Davison (2003)[p.].
3.2 The Choice of Recipients
The second decision of i is the choice of a communication partner (recipient). Thisdecision depends on the state of the communication network X(t + δi) at time(t + δi) ∈ [t, t + ε]. From equation 6 follows that X(t + δi) ≈ X(t). Informally, theprobability that i contacts j at time span [t, t + ε] is then
P(i contacts j|X(t)). (12)
Since this decision is independent from the first as long as ε is very small andthe network has not been changed by other actors, the probability for a newcommunication event between i to j in time span [t, t + ε] is then
P(i active in [t, t + ε])P(i contacts j|X(t)). (13)
The second decision about recipients depends on structures in subgraphs of X(t+δi). How these structures are measured and evaluated in a non-linear regressionmodel is illustrated in the following.
3.3 Network Statistics
The choice of the recipient is based on network structures. For each possible eventrecipient k ∈ A\iν of an event ων, statistics are measured of the subgraphs thatsurround sender iν and all possible recipients.
The statistics are represented by a statistics matrix Sν ∈ R|Q|×|A|≥0 for each event
ων:
Sν = (sν;qk) =
sν;11 . . . sν;1|A|... . . . ...
sν;|Q|1 . . . sν;|Q||A|
=(
sν;1 . . . sν;|A|
)(14)
sν;k :=
sν;1k...
sν;|Q|k
Q is the set of statistics of the local network embedding sender and recipient ofthe event. The elements sν;qk of Sν include the q-th statistic for a possibly chosenrecipient k in event ων. The semicolon is used to avoid confusing the event index ν
Estimating Event-based Exponential Random Graph Models 85
with the line and column indices q ∈ Q and k ∈ A. A vector sν;k includes all |Q|statistics for the potential case that in event ων the sender iν had chosen actor k ∈ Aas recipient. The elements of matrix Sν are results of the evaluation of functionsfq : X × A× A 7→ R+ that are part of a function S(X, i) for any network state Xand a sending actor i:
S(X, i) =(sqk)=(
fq(r(1)(X, i, k), i, k))
(15)
Sν =(sν;qk
):= S(Xν, iν) (16)
Under the assumption that k was chosen as the recipient, a subgraph of thepotential network r(1)(Xν, iν, k) around sender iν and potential recipient k ∈ A isanalyzed. Typical examples for communication structures that have an effect on fu-ture communication are repeated using of the same communication ties, reciprocalor transitive communication.
The choice of the statistics set Q defines a concrete model. An examplary modelwith two parameters is introduced in section 4.
3.4 Markov Model
This two-level decision process can be modelled as a Markov process (or continuous-time Markov chain). The state of this process at time t is the state of the communi-cation graph X(t). Poisson transitions can be defined for the occurence of eventswith each possible sender-recipient combination (i, j) on this graph.
Given a communication data stream, activity of actors and the influence ofnetwork structures on recipient choices can ex post be determined. The set ofmeasured structures defines the concrete model. The estimation of the weightsof the structures influencing the choice of recipients takes place in a non-linearregression model. It belongs to the class of exponential random graph models. Thecorresponding probability function for chosing a recipient jν over any other possiblerecipient is:
p(jν; Sν, β) =1
c(Sν, β)exp(
βTsν;jν)
(17)
c(Sν, β) = ∑k∈A\iν
exp(
βTsν;k)
p(jν; Sν, β) returns the probability that an event from actor iν to actor jν isobserved, given that iν started this event at all. The probability depends on thenetwork statistics in Sν and a vector β that weights statistics in the graph after a newtie has been added. The constant c(Sν, β) makes sure that the function is a proper
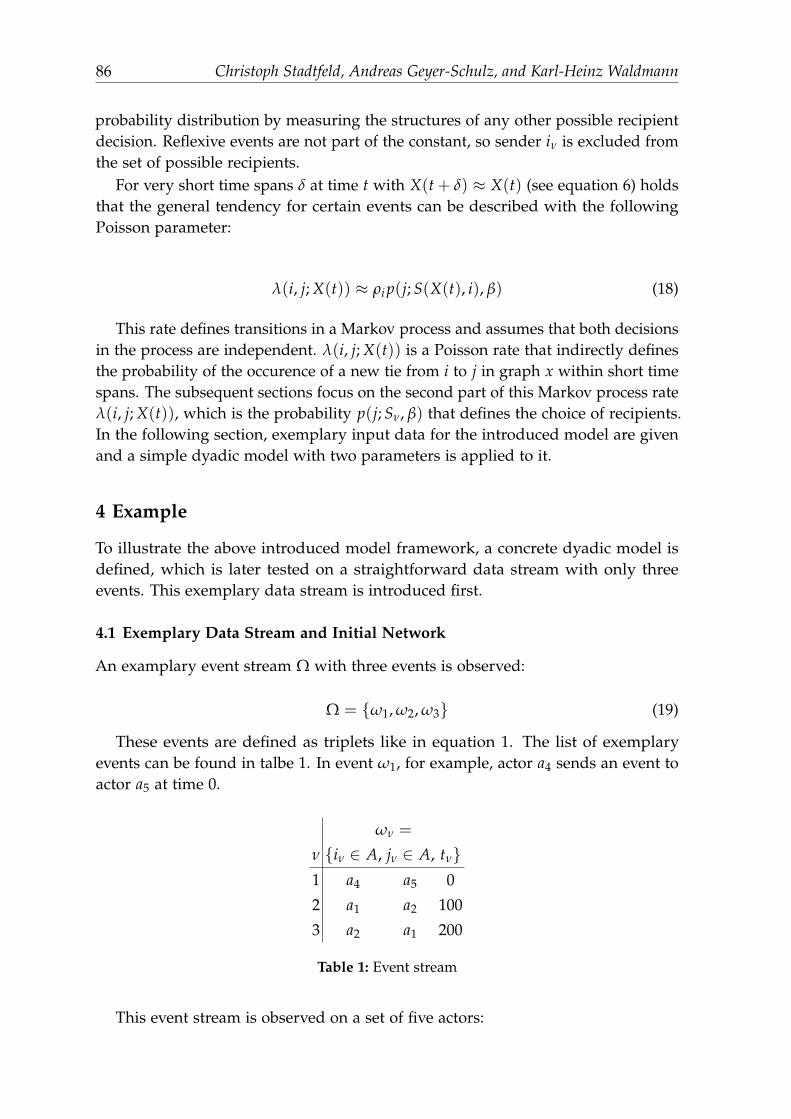
86 Christoph Stadtfeld, Andreas Geyer-Schulz, and Karl-Heinz Waldmann
probability distribution by measuring the structures of any other possible recipientdecision. Reflexive events are not part of the constant, so sender iν is excluded fromthe set of possible recipients.
For very short time spans δ at time t with X(t + δ) ≈ X(t) (see equation 6) holdsthat the general tendency for certain events can be described with the followingPoisson parameter:
λ(i, j; X(t)) ≈ ρi p(j; S(X(t), i), β) (18)
This rate defines transitions in a Markov process and assumes that both decisionsin the process are independent. λ(i, j; X(t)) is a Poisson rate that indirectly definesthe probability of the occurence of a new tie from i to j in graph x within short timespans. The subsequent sections focus on the second part of this Markov process rateλ(i, j; X(t)), which is the probability p(j; Sν, β) that defines the choice of recipients.In the following section, exemplary input data for the introduced model are givenand a simple dyadic model with two parameters is applied to it.
4 Example
To illustrate the above introduced model framework, a concrete dyadic model isdefined, which is later tested on a straightforward data stream with only threeevents. This exemplary data stream is introduced first.
4.1 Exemplary Data Stream and Initial Network
An examplary event stream Ω with three events is observed:
Ω = ω1, ω2, ω3 (19)
These events are defined as triplets like in equation 1. The list of exemplaryevents can be found in talbe 1. In event ω1, for example, actor a4 sends an event toactor a5 at time 0.
ων =
ν iν ∈ A, jν ∈ A, tν1 a4 a5 0
2 a1 a2 100
3 a2 a1 200
Table 1: Event stream
This event stream is observed on a set of five actors:
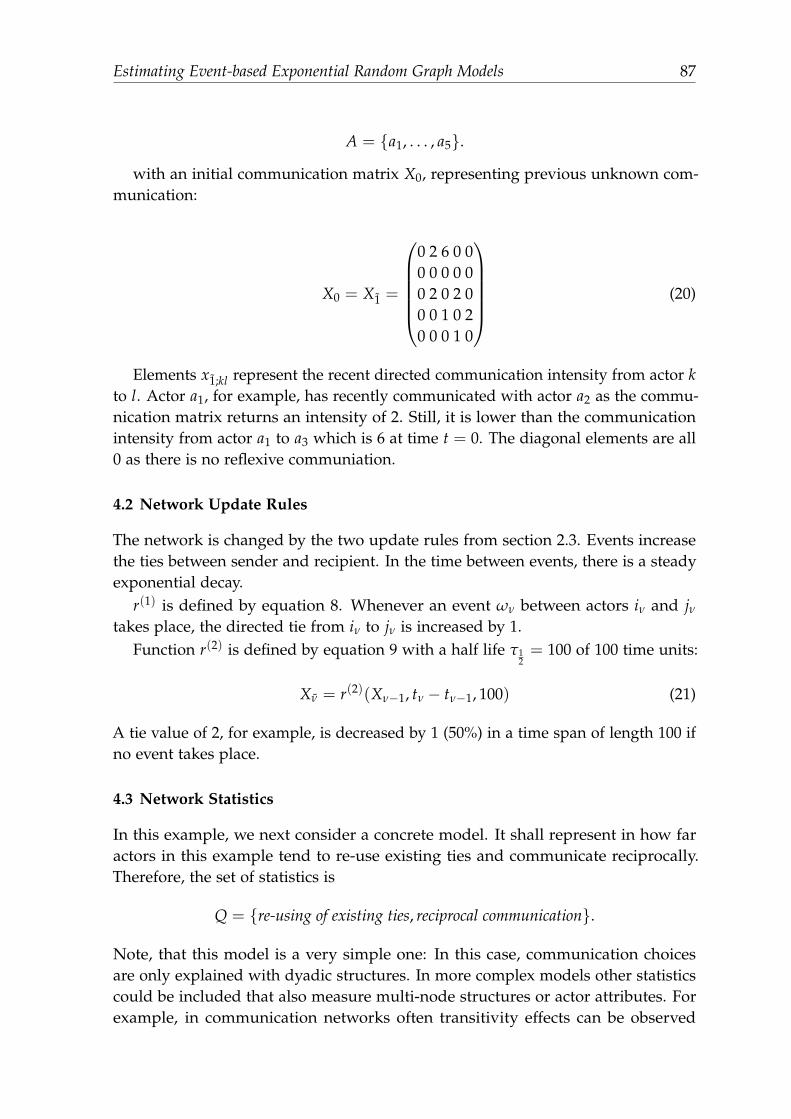
Estimating Event-based Exponential Random Graph Models 87
A = a1, . . . , a5.
with an initial communication matrix X0, representing previous unknown com-munication:
X0 = X1 =
0 2 6 0 00 0 0 0 00 2 0 2 00 0 1 0 20 0 0 1 0
(20)
Elements x1;kl represent the recent directed communication intensity from actor kto l. Actor a1, for example, has recently communicated with actor a2 as the commu-nication matrix returns an intensity of 2. Still, it is lower than the communicationintensity from actor a1 to a3 which is 6 at time t = 0. The diagonal elements are all0 as there is no reflexive communiation.
4.2 Network Update Rules
The network is changed by the two update rules from section 2.3. Events increasethe ties between sender and recipient. In the time between events, there is a steadyexponential decay.
r(1) is defined by equation 8. Whenever an event ων between actors iν and jνtakes place, the directed tie from iν to jν is increased by 1.
Function r(2) is defined by equation 9 with a half life τ12= 100 of 100 time units:
Xν = r(2)(Xν−1, tν − tν−1, 100) (21)
A tie value of 2, for example, is decreased by 1 (50%) in a time span of length 100 ifno event takes place.
4.3 Network Statistics
In this example, we next consider a concrete model. It shall represent in how faractors in this example tend to re-use existing ties and communicate reciprocally.Therefore, the set of statistics is
Q = re-using of existing ties, reciprocal communication.
Note, that this model is a very simple one: In this case, communication choicesare only explained with dyadic structures. In more complex models other statisticscould be included that also measure multi-node structures or actor attributes. Forexample, in communication networks often transitivity effects can be observed
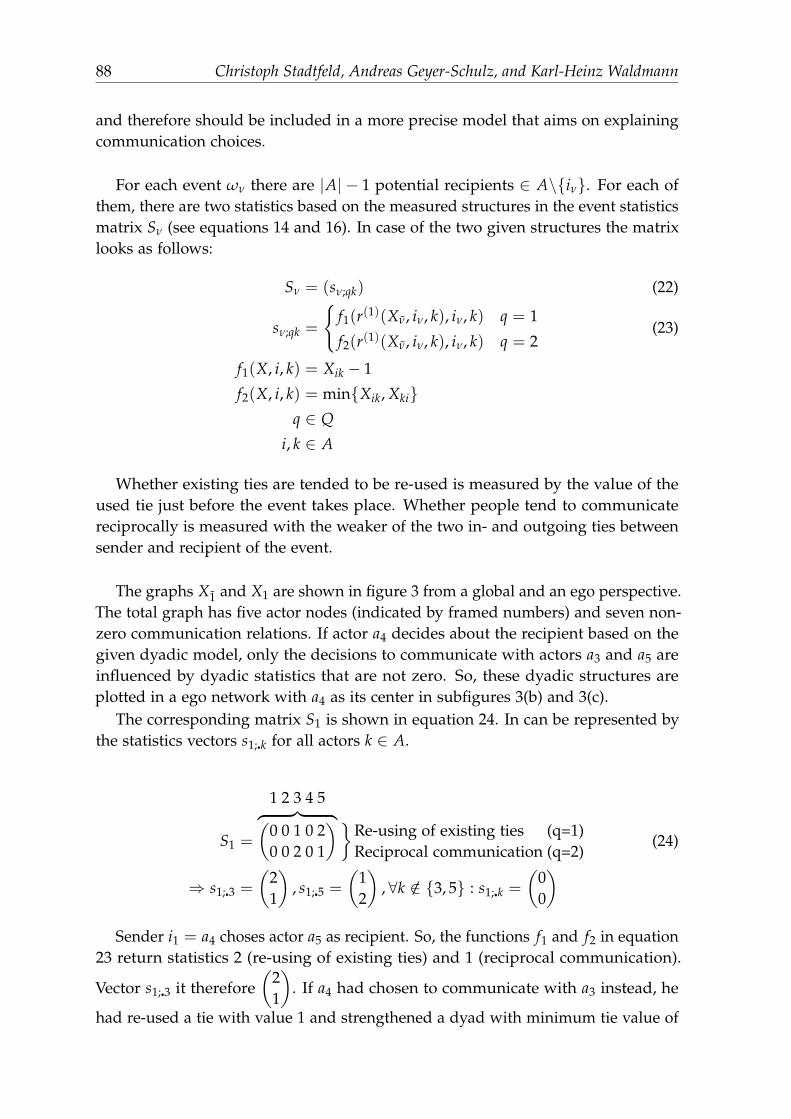
88 Christoph Stadtfeld, Andreas Geyer-Schulz, and Karl-Heinz Waldmann
and therefore should be included in a more precise model that aims on explainingcommunication choices.
For each event ων there are |A| − 1 potential recipients ∈ A\iν. For each ofthem, there are two statistics based on the measured structures in the event statisticsmatrix Sν (see equations 14 and 16). In case of the two given structures the matrixlooks as follows:
Sν = (sν;qk) (22)
sν;qk =
f1(r(1)(Xν, iν, k), iν, k) q = 1
f2(r(1)(Xν, iν, k), iν, k) q = 2(23)
f1(X, i, k) = Xik − 1
f2(X, i, k) = minXik, Xkiq ∈ Q
i, k ∈ A
Whether existing ties are tended to be re-used is measured by the value of theused tie just before the event takes place. Whether people tend to communicatereciprocally is measured with the weaker of the two in- and outgoing ties betweensender and recipient of the event.
The graphs X1 and X1 are shown in figure 3 from a global and an ego perspective.The total graph has five actor nodes (indicated by framed numbers) and seven non-zero communication relations. If actor a4 decides about the recipient based on thegiven dyadic model, only the decisions to communicate with actors a3 and a5 areinfluenced by dyadic statistics that are not zero. So, these dyadic structures areplotted in a ego network with a4 as its center in subfigures 3(b) and 3(c).
The corresponding matrix S1 is shown in equation 24. In can be represented bythe statistics vectors s1;k for all actors k ∈ A.
S1 =
1 2 3 4 5︷ ︸︸ ︷(0 0 1 0 20 0 2 0 1
)Re-using of existing ties (q=1)Reciprocal communication (q=2)
(24)
⇒ s1;3 =
(21
), s1;5 =
(12
), ∀k /∈ 3, 5 : s1;k =
(00
)Sender i1 = a4 choses actor a5 as recipient. So, the functions f1 and f2 in equation
23 return statistics 2 (re-using of existing ties) and 1 (reciprocal communication).
Vector s1;3 it therefore(
21
). If a4 had chosen to communicate with a3 instead, he
had re-used a tie with value 1 and strengthened a dyad with minimum tie value of
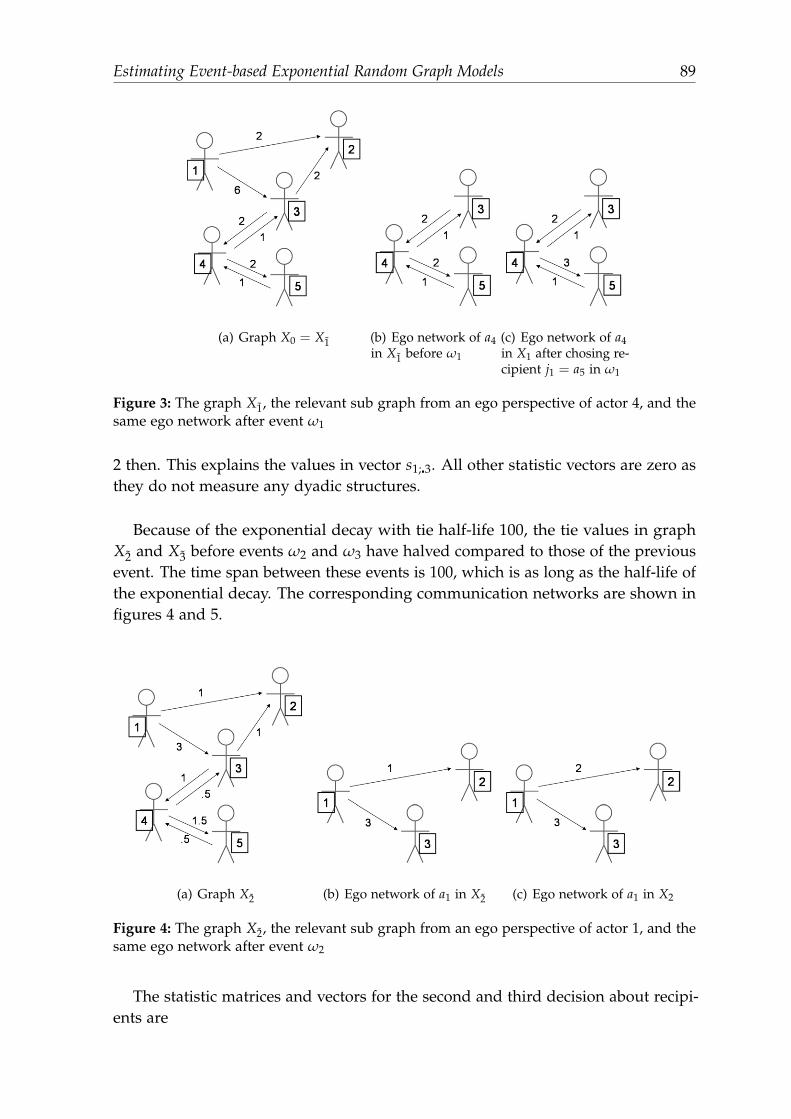
Estimating Event-based Exponential Random Graph Models 89
(a) Graph X0 = X1 (b) Ego network of a4in X1 before ω1
(c) Ego network of a4in X1 after chosing re-cipient j1 = a5 in ω1
Figure 3: The graph X1, the relevant sub graph from an ego perspective of actor 4, and thesame ego network after event ω1
2 then. This explains the values in vector s1;3. All other statistic vectors are zero asthey do not measure any dyadic structures.
Because of the exponential decay with tie half-life 100, the tie values in graphX2 and X3 before events ω2 and ω3 have halved compared to those of the previousevent. The time span between these events is 100, which is as long as the half-life ofthe exponential decay. The corresponding communication networks are shown infigures 4 and 5.
(a) Graph X2 (b) Ego network of a1 in X2 (c) Ego network of a1 in X2
Figure 4: The graph X2, the relevant sub graph from an ego perspective of actor 1, and thesame ego network after event ω2
The statistic matrices and vectors for the second and third decision about recipi-ents are
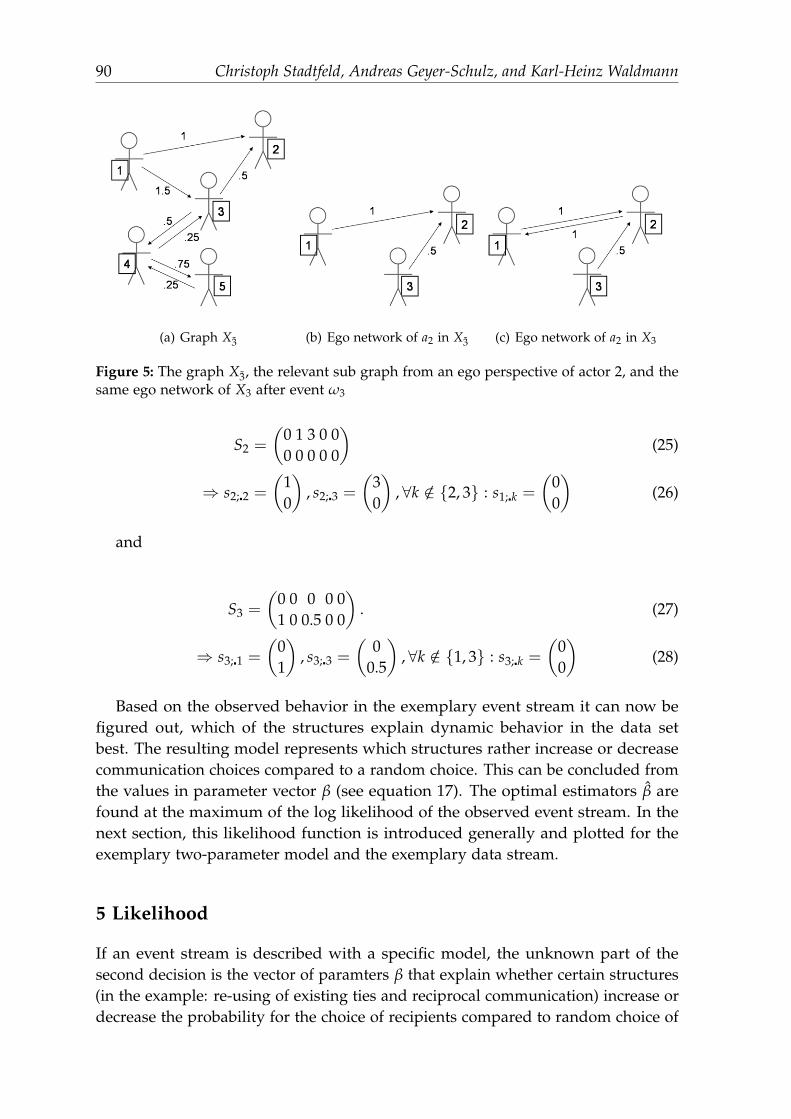
90 Christoph Stadtfeld, Andreas Geyer-Schulz, and Karl-Heinz Waldmann
(a) Graph X3 (b) Ego network of a2 in X3 (c) Ego network of a2 in X3
Figure 5: The graph X3, the relevant sub graph from an ego perspective of actor 2, and thesame ego network of X3 after event ω3
S2 =
(0 1 3 0 00 0 0 0 0
)(25)
⇒ s2;2 =
(10
), s2;3 =
(30
), ∀k /∈ 2, 3 : s1;k =
(00
)(26)
and
S3 =
(0 0 0 0 01 0 0.5 0 0
). (27)
⇒ s3;1 =
(01
), s3;3 =
(0
0.5
), ∀k /∈ 1, 3 : s3;k =
(00
)(28)
Based on the observed behavior in the exemplary event stream it can now befigured out, which of the structures explain dynamic behavior in the data setbest. The resulting model represents which structures rather increase or decreasecommunication choices compared to a random choice. This can be concluded fromthe values in parameter vector β (see equation 17). The optimal estimators β arefound at the maximum of the log likelihood of the observed event stream. In thenext section, this likelihood function is introduced generally and plotted for theexemplary two-parameter model and the exemplary data stream.
5 Likelihood
If an event stream is described with a specific model, the unknown part of thesecond decision is the vector of paramters β that explain whether certain structures(in the example: re-using of existing ties and reciprocal communication) increase ordecrease the probability for the choice of recipients compared to random choice of
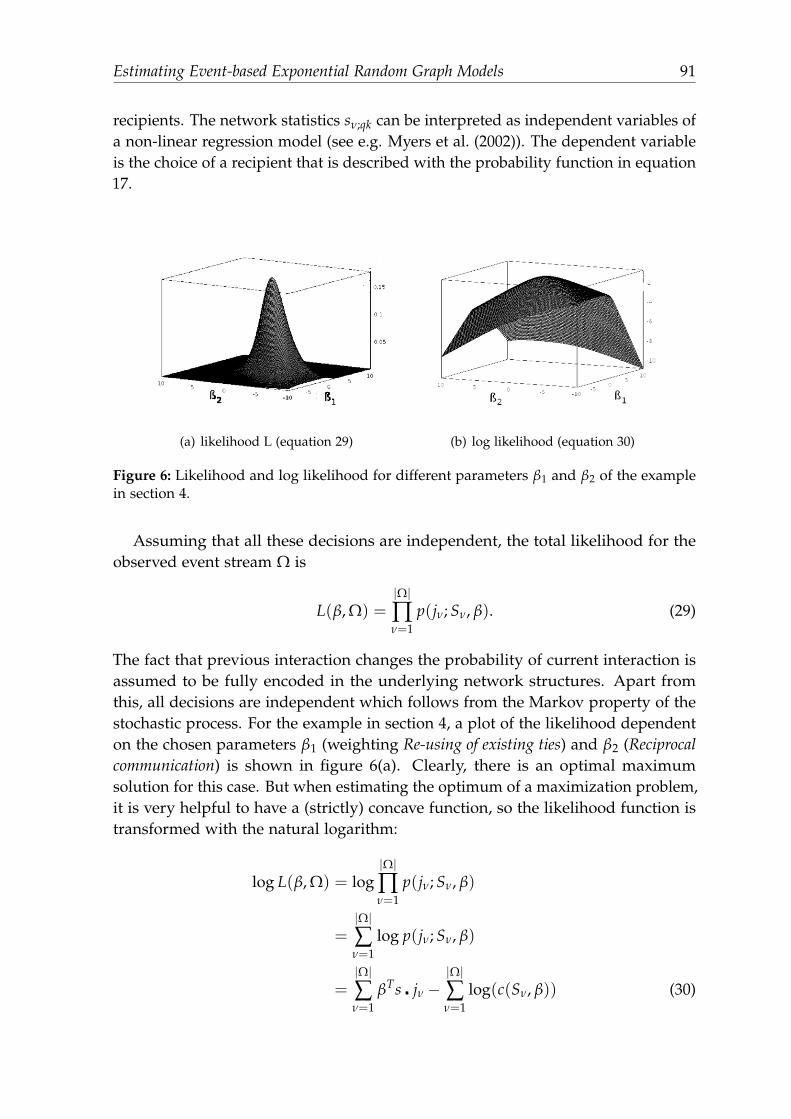
Estimating Event-based Exponential Random Graph Models 91
recipients. The network statistics sν;qk can be interpreted as independent variables ofa non-linear regression model (see e.g. Myers et al. (2002)). The dependent variableis the choice of a recipient that is described with the probability function in equation17.
(a) likelihood L (equation 29) (b) log likelihood (equation 30)
Figure 6: Likelihood and log likelihood for different parameters β1 and β2 of the examplein section 4.
Assuming that all these decisions are independent, the total likelihood for theobserved event stream Ω is
L(β, Ω) =|Ω|
∏ν=1
p(jν; Sν, β). (29)
The fact that previous interaction changes the probability of current interaction isassumed to be fully encoded in the underlying network structures. Apart fromthis, all decisions are independent which follows from the Markov property of thestochastic process. For the example in section 4, a plot of the likelihood dependenton the chosen parameters β1 (weighting Re-using of existing ties) and β2 (Reciprocalcommunication) is shown in figure 6(a). Clearly, there is an optimal maximumsolution for this case. But when estimating the optimum of a maximization problem,it is very helpful to have a (strictly) concave function, so the likelihood function istransformed with the natural logarithm:
log L(β, Ω) = log|Ω|
∏ν=1
p(jν; Sν, β)
=|Ω|
∑ν=1
log p(jν; Sν, β)
=|Ω|
∑ν=1
βTs jν −|Ω|
∑ν=1
log(c(Sν, β)) (30)
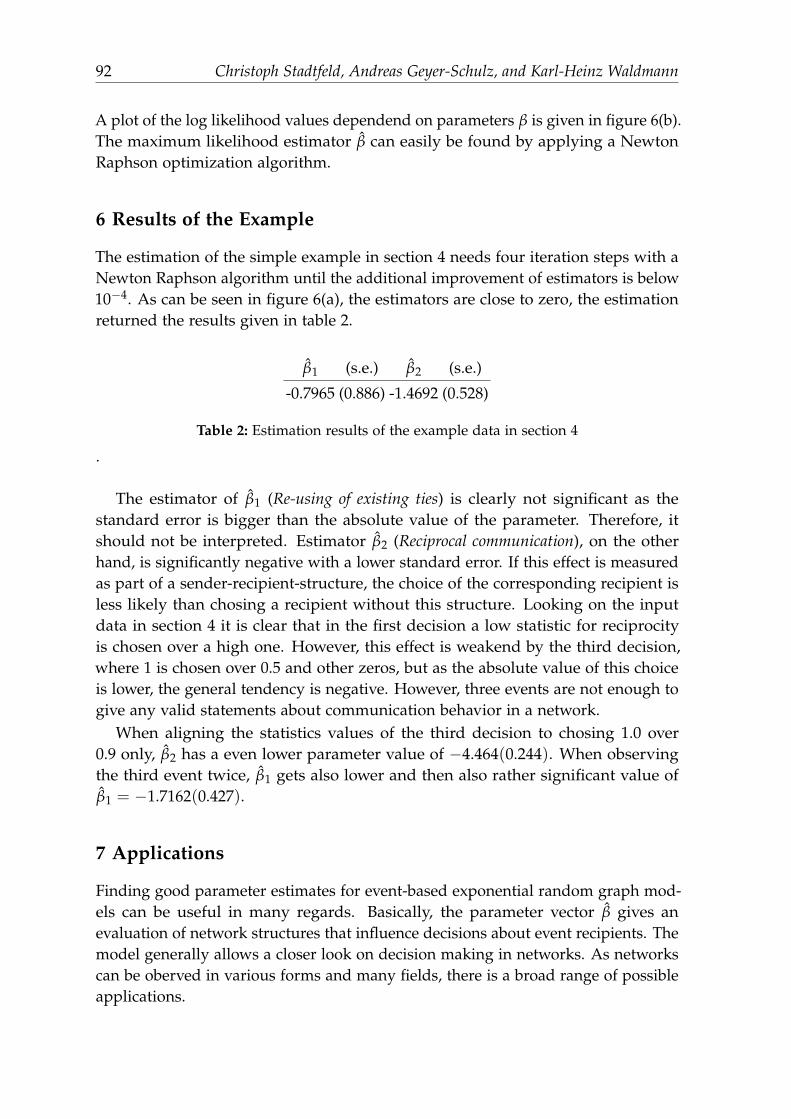
92 Christoph Stadtfeld, Andreas Geyer-Schulz, and Karl-Heinz Waldmann
A plot of the log likelihood values dependend on parameters β is given in figure 6(b).The maximum likelihood estimator β can easily be found by applying a NewtonRaphson optimization algorithm.
6 Results of the Example
The estimation of the simple example in section 4 needs four iteration steps with aNewton Raphson algorithm until the additional improvement of estimators is below10−4. As can be seen in figure 6(a), the estimators are close to zero, the estimationreturned the results given in table 2.
β1 (s.e.) β2 (s.e.)
-0.7965 (0.886) -1.4692 (0.528)
Table 2: Estimation results of the example data in section 4
.
The estimator of β1 (Re-using of existing ties) is clearly not significant as thestandard error is bigger than the absolute value of the parameter. Therefore, itshould not be interpreted. Estimator β2 (Reciprocal communication), on the otherhand, is significantly negative with a lower standard error. If this effect is measuredas part of a sender-recipient-structure, the choice of the corresponding recipient isless likely than chosing a recipient without this structure. Looking on the inputdata in section 4 it is clear that in the first decision a low statistic for reciprocityis chosen over a high one. However, this effect is weakend by the third decision,where 1 is chosen over 0.5 and other zeros, but as the absolute value of this choiceis lower, the general tendency is negative. However, three events are not enough togive any valid statements about communication behavior in a network.
When aligning the statistics values of the third decision to chosing 1.0 over0.9 only, β2 has a even lower parameter value of −4.464(0.244). When observingthe third event twice, β1 gets also lower and then also rather significant value ofβ1 = −1.7162(0.427).
7 Applications
Finding good parameter estimates for event-based exponential random graph mod-els can be useful in many regards. Basically, the parameter vector β gives anevaluation of network structures that influence decisions about event recipients. Themodel generally allows a closer look on decision making in networks. As networkscan be oberved in various forms and many fields, there is a broad range of possibleapplications.
Estimating Event-based Exponential Random Graph Models 93
In the context of electronic markets, estimated results may describe the environ-ment in which agents in a market interact with others in a certain way. It can betested whether agents who know each other are likelier to trade.
In the context of information or knowledge management it can be tested whetherlinks between actors and certain entities (like knowledge bases) increase the likeli-hood of information flow between actors.
In service value networks (SVN), some services are not compatible with others.Events in this context are, for example, the emergence of new interfaces. Theintroduced model could help to explain whether there are network effects thatincrease the likelihood for such a product change when observing the SVN marketover time. Network effects may represent market concentration or competitionbetween service providers.
In the context of communication theory, the results may help to understand andtest sociological theories. Some examples are homophily theories, contagion theoriesor dependency theories (see Monge and Contractor (2003)) in communicationenvironments.
8 Summary and Outlook
This article aimed on introducing event-based ERGMs, a model to describe choicesin communication event streams. The model was illustrated using a simple exam-ple and the estimation process was briefly explained. The model can be used toresearch decision making processes in different environments, some examples forapplications were given.
There are still some open, but interesting questions regarding the introducedmodel. Firstly, a way has to be found to reduce the set of possible recipientswithout violating statistical assumptions and features of the model. Secondly,further research will focus on how graph dependencies between network structuresaffect estimates. Also, estimation results may be influenced by general networkfeatures like density or degree distributions. These questions will be addressedusing simulations. In further work it will be shown that the maximum log likelihoodfunction is concave and in most cases even strictly concave.
References
Brandes, U., J. Lerner, and T. A. B. Snijders (2009): “Networks Evolving Step by Step:Statistical Analysis of Dyadic Event Data,” in: Proceedings of the 2009 InternationalConference on Advances in Social Network Analysis and Mining (ASONAM 2009),IEEE Computer Society, pp. 200 –205.
Butts, C. T. (2008): “A relational event framework for social action,” SociologicalMethodology, 38(1), pp. 155–200.
94 Christoph Stadtfeld, Andreas Geyer-Schulz, and Karl-Heinz Waldmann
Davison, A. C. (2003): Statistical Models, Cambridge Series in Statistical and Proba-bilistic Mathematics, Cambridge University Press.
Deuflhard, P. (2004): Newton Methods for Nonlinear Problems, number 35 in SpringerSeries in Computational Mathematics, Springer-Verlag Berlin Heidelberg.
Monge, P. R. and N. S. Contractor (2003): Theories of Communication Networks, OxfordUniversity Press.
Myers, R. H., D. C. Montgomery, and G. G. Vining (2002): Generalized Linear Models,Wiley Series In Probability And Statistics, John Wiley & Sons, Inc., New York.
Robins, G., T. A. Snijders, W. P., M. Handcock, and P. & Pattison (2007): “Recentdevelopments in exponential random graph (p*) models for social networks,”Social Networks, 29, pp. 192–215.
Snijders, T. A. (2005): “Models and methods in social network analysis,” in: J. S.P. Carrington and S. Wasserman (eds.), Models for Longitudinal Network Data,Cambridge University Press, New York.
Snijders, T. A., P. E. Pattison, G. L. Robins, and M. S. Handcock (2006): “Newspecifications for exponential random graph models,” Sociological Methodology, pp.99–153.
Snijders, T. A. B. (2001): “The Statistical Evaluation of Social Network Dynamics,”Sociological Methodology, 31, pp. 361–395.
Stadtfeld, C. and A. Geyer-Schulz (2010): “Analysing Event Stream Dynamics inTwo Mode Networks: An Exploratory Analysis of Private Communication in aQuestion and Answer Community,” working paper.
Waldmann, K.-H. and U. Stocker (2004): Stochastische Modelle: Eine anwendungsorien-tierte Einfuhrung, Springer, Berlin.
Wang, P., K. Sharpe, G. L. Robins, and P. E. Pattison (2009): “Exponential RandomGraph (p*) Models for Affiliation Networks,” Social Networks, 31, pp. 12–25.
Wasserman, S. and P. Pattison (1996): “Logit Models and Logistic Regressions forSocial Networks: I. An Introduction to Markov Graphs and p*,” Psychometrika,61(3), pp. 401–425.
Zenk, L. and C. Stadtfeld (2010): “Dynamic organizations. How to Measure Evo-lution and Change in Organizations by Analyzing Email Communication,” in:Proceedings of Applications of Social Network Analysis (ASNA), to appear.

Part II
Design of Market Mechanisms and Systems

A Bonus Mechanism to Stimulate Reciprocity in thePresence of Manipulated Feedback
Jing Zhi Yue1, Klemens Bohm1, and Karl-Martin Ehrhart3
1 Institute of Program Structures and Data Organization, KITjing.yue, [email protected]
2 Institute of Economic Theory and Statistics, [email protected]
Summary. Many online service-oriented interactions rely on reputation systems to facilitatetrust and trustworthiness in anonymous transactions. However in the absence of indepen-dent verification authorities, feedback on interaction outcome could be manipulated. In thiswork, we constructs a model, which 1) extends symmetric games like prisoner’s dilemma byallowing players to elicit feedback; 2) rewards participants having high reputation with bonuspoints. The better reputation a player has, compared to other players, the more bonuseshe could gain. In another word, participants have incentives to win higher reputation thanothers and thus reputation itself turns to be a kind of competitive goods.
Our focus is to investigate what kind of impact has bonus mechanism on participants’cooperation and feedback behavior. In this work we will analyze this game model to findout, under which condition could such a bonus mechanism incentivize cooperation andtruthful feedback.
1 Introduction
With the proliferation of a broad range of services on the web like auction platform(eBay, Amazon) or file-sharing (Freenet, Gnutella) or scientific distributed computing(Seti@home, Folding@home), virtual social networks have attracted a lot of attention.Since in many online service-oriented interactions, there are no explicit payments orcontracts for the shared service, a widely adopted method is reputation mechanism(Bolton et al., 2007). Much existing literature has confirmed that the publiclyavailable reputation information is an incentive for participants to cooperate, evenwith unknown interaction partners (D.Engelmann and U.Fischbacher, 2002; Nowakand Sigmund, 1998; I.Seinen and A.Schram, 2006). However the premise of anefficient reputation mechanism is that the reports about participants’ behavior inthe history are truthful (Jurca and Faltings, 2004).
However in most online communities this premise could not be hold, because inthe absence of independent verification authorities the true outcome of an interactioncan not be revealed. players’ behavior is reported by their co-players. It is difficult

98 Jing Zhi Yue, Klemens Bohm, and Karl-Martin Ehrhart
to distinguish whether a player is really uncooperative or he is defamed by his co-player. A reputation system could be distorted by strategic reports. To describe thisphenomena, in this work we will extend symmetric games like prisoner’s dilemmaby allowing players to elicit feedback, which reports the interaction outcomes. Insuch surrounding strategic participants could manipulate their submitted feedback.
Furthermore in Internet markets, market competition creates incentives thatarguably may enhance or curb the effectiveness of reputation systems. (Boltonet al., 2007) have investigated how different forms of market competition and socialreputation networks interact in a series of laboratory online markets. The argumentis that information about reputation trumps pricing in the sense that traders usuallydo not interact with someone with a bad reputation, not even for a substantial pricediscount.
Based on this observation we argue that reputation has not only indirect influenceon pricing, but reputation itself is a kind of competitive goods. High reputationyields a high payoff. For example, on a web portal for hotel reservation, the hotelswhich have higher reputation, could have better ranking positions and thus attractmore tourists. We propose that participants having high reputation will be rewardedby bonus points. The better reputation a player has, compared to other players, themore bonuses he could gain. In another word, participants have incentives to winhigher reputation than others. Our focus is to investigate what kind of impact hasbonus mechanism on participants’ cooperation and feedback behavior.
Following we will introduce our model, which enables participants to elicitfeedback and participants gain bonus points dependent on their own reputationsand the distribution of global reputation. Based on this model, we construct twogames and draw analysis, under which condition could such a bonus mechanismyield in equilibrium cooperation and truthful feedback. These two games differfrom each other in the available information, one offers no reputation informationand the other offers first-order information.
2 The Model
At the beginning of a round all M players will be randomly matched into pairs.Two players in a pair have equal roles and make decision simultaneously. In thefirst stage (service stage), players decide whether they want to provide service forthe opponent, to cooperate (C) or to defect (D). It costs a player c points for thecooperation, while his opponent gains b (b > c > 0) points as profit; otherwise thereis no payoff for both. In the second stage (feedback stage), players submit feedbackon each other to report the opponents’ action. Such feedback in our setting is eitherpositive (1) or negative (0).
Furthermore players gain bonus points from the system as reward. We computea player’s bonus according to his reputation, which is dependent on the feedbacksubmitted in the current round. Player i receives feedback Fn
i ∈ 0, 1 at round n
Title Suppressed Due to Excessive Length 99
from his opponent. Hence his reputation at this round is Rni = Fn
i . The sum of allplayers’ reputations in the n-th round is Rn
total = ∑i∈M Rni . At the end of round n,
Player i gains following bonus from the system:
Bonusni =
g ∗ Rni
Rntotal
i f Rntotal > 0
0 i f Rntotal = 0
(1)
Parameter g decides the value of assigned bonus. Equation 1 reflects two basicprinciples for assigning bonus. First, the better reputation has a player, the morebonuses he could gain. Second, the more outstanding is a player’s reputationcompared to those of other players, the more bonuses he could gain.
Since a negative feedback is a dominant strategy in the subgame of the feedbackstage, a rational player is expected to choose this action in the second stage. Bytaking this prediction into account, a payoff maximizing player decides on playing Don the first stage. Thus there exists a unique symmetric subgame perfect equilibrium(D, 0), which is given by the strategy:” Choose D on the service stage, followed by0 on the feedback stage, independently of the other player’s decision on the firststage.”
Based on this analysis we see that players prefer to defect under the belief thatthe opponent always submits negative feedback. However in the following we wantto analyze whether players could be incentivized to cooperate if players change thisbelief through coordination.
The amount of information available is decisive for players’ strategies. Based onthis model we analyze games with two information conditions – no information andfirst-order information. For no information players know nothing about his opponents’behavior in the history. Thus their decision of cooperation or feedback dependsonly on the action profile of himself and of his opponent in the current round.For first-order information, the players know what kind of feedback their opponentssubmitted and received in the last round.
3 The Game Without Reputation Information
At the decision, whether a player should cooperate in the service stage, he has notonly to estimate whether his opponent cooperates but also has to estimate whatkind of bonus he could gain. Since there is no reputation information availableand it is not possible to observe players’ behavior in the history, the estimatedfeedback outcome is only dependent on the action profile from the service stage.For Player i, we denote his expected bonus as Ei[Bonusi|(Ai, Aj)]. Here (Ai, Aj)
stands for the action profile of Player i and Player j in the service stage, (Ai, Aj) ∈(C, C), (C, D), (D, C), (D, D). Furthermore, in a two-player game after each round,it is valid that:
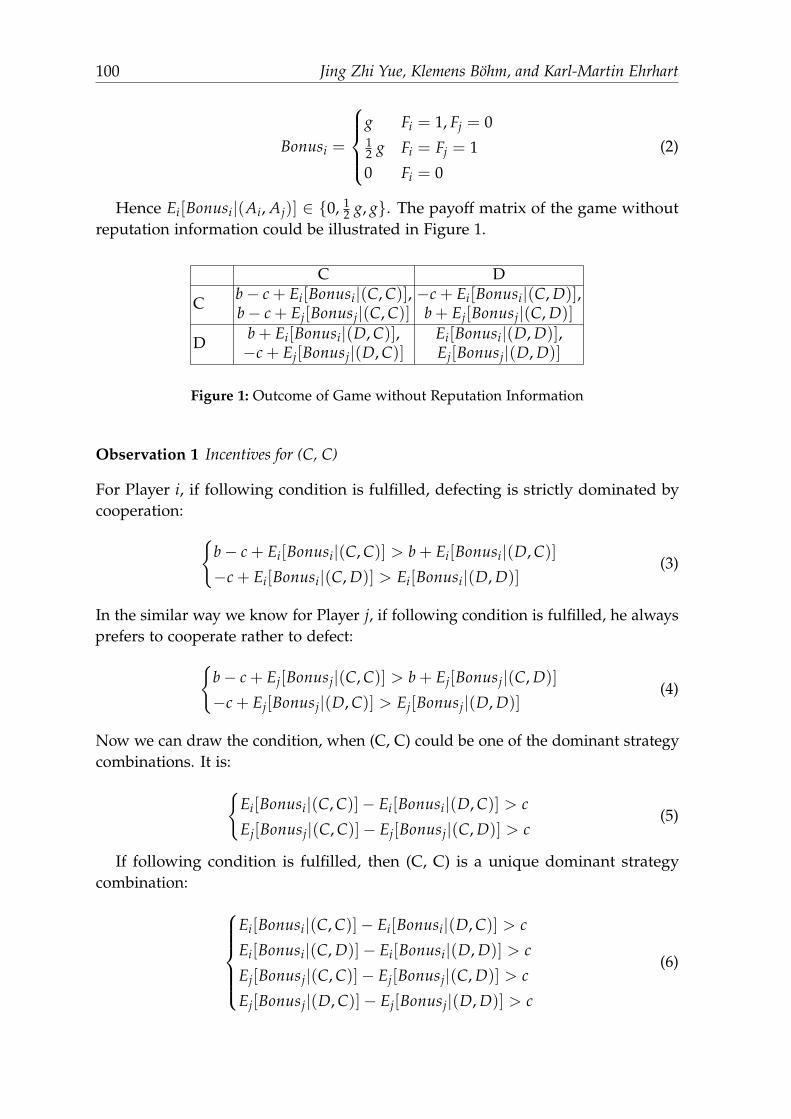
100 Jing Zhi Yue, Klemens Bohm, and Karl-Martin Ehrhart
Bonusi =
g Fi = 1, Fj = 012 g Fi = Fj = 1
0 Fi = 0
(2)
Hence Ei[Bonusi|(Ai, Aj)] ∈ 0, 12 g, g. The payoff matrix of the game without
reputation information could be illustrated in Figure 1.
C D
C b− c + Ei[Bonusi|(C, C)], −c + Ei[Bonusi|(C, D)],b− c + Ej[Bonusj|(C, C)] b + Ej[Bonusj|(C, D)]
D b + Ei[Bonusi|(D, C)], Ei[Bonusi|(D, D)],−c + Ej[Bonusj|(D, C)] Ej[Bonusj|(D, D)]
Figure 1: Outcome of Game without Reputation Information
Observation 1 Incentives for (C, C)
For Player i, if following condition is fulfilled, defecting is strictly dominated bycooperation:
b− c + Ei[Bonusi|(C, C)] > b + Ei[Bonusi|(D, C)]
−c + Ei[Bonusi|(C, D)] > Ei[Bonusi|(D, D)](3)
In the similar way we know for Player j, if following condition is fulfilled, he alwaysprefers to cooperate rather to defect:
b− c + Ej[Bonusj|(C, C)] > b + Ej[Bonusj|(C, D)]
−c + Ej[Bonusj|(D, C)] > Ej[Bonusj|(D, D)](4)
Now we can draw the condition, when (C, C) could be one of the dominant strategycombinations. It is:
Ei[Bonusi|(C, C)]− Ei[Bonusi|(D, C)] > c
Ej[Bonusj|(C, C)]− Ej[Bonusj|(C, D)] > c(5)
If following condition is fulfilled, then (C, C) is a unique dominant strategycombination:
Ei[Bonusi|(C, C)]− Ei[Bonusi|(D, C)] > c
Ei[Bonusi|(C, D)]− Ei[Bonusi|(D, D)] > c
Ej[Bonusj|(C, C)]− Ej[Bonusj|(C, D)] > c
Ej[Bonusj|(D, C)]− Ej[Bonusj|(D, D)] > c
(6)
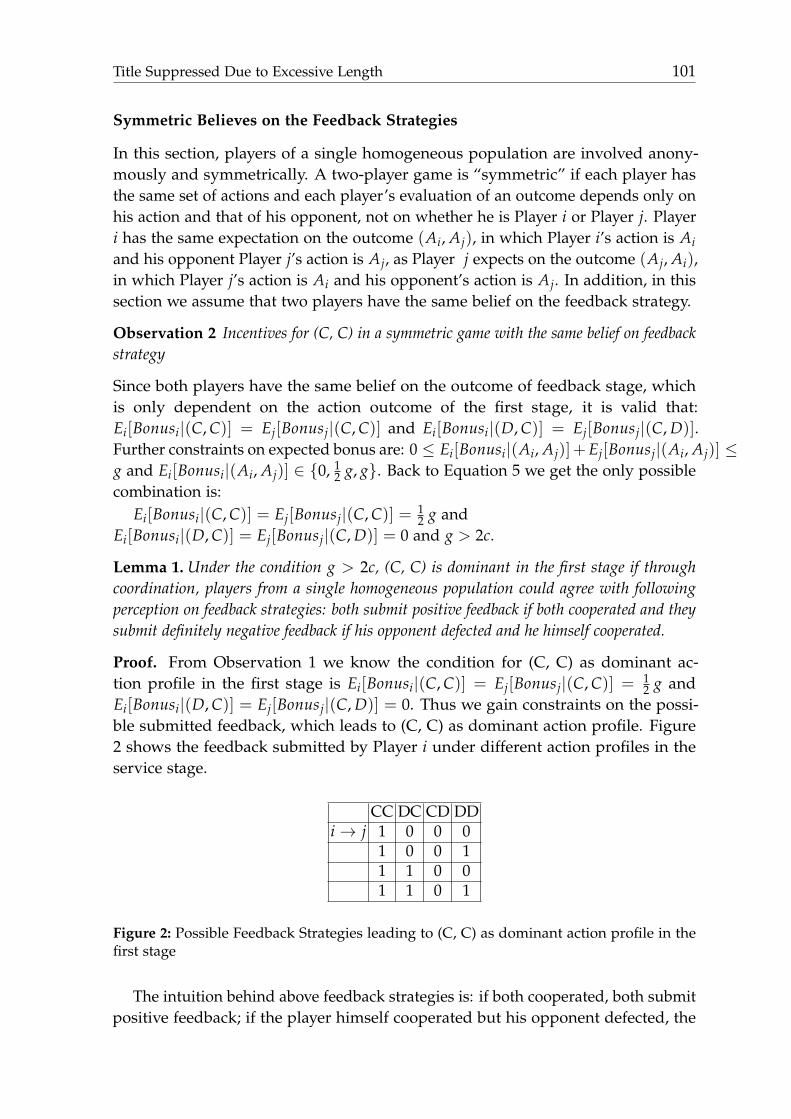
Title Suppressed Due to Excessive Length 101
Symmetric Believes on the Feedback Strategies
In this section, players of a single homogeneous population are involved anony-mously and symmetrically. A two-player game is “symmetric” if each player hasthe same set of actions and each player’s evaluation of an outcome depends only onhis action and that of his opponent, not on whether he is Player i or Player j. Playeri has the same expectation on the outcome (Ai, Aj), in which Player i’s action is Aiand his opponent Player j’s action is Aj, as Player j expects on the outcome (Aj, Ai),in which Player j’s action is Ai and his opponent’s action is Aj. In addition, in thissection we assume that two players have the same belief on the feedback strategy.
Observation 2 Incentives for (C, C) in a symmetric game with the same belief on feedbackstrategy
Since both players have the same belief on the outcome of feedback stage, whichis only dependent on the action outcome of the first stage, it is valid that:Ei[Bonusi|(C, C)] = Ej[Bonusj|(C, C)] and Ei[Bonusi|(D, C)] = Ej[Bonusj|(C, D)].Further constraints on expected bonus are: 0 ≤ Ei[Bonusi|(Ai, Aj)]+Ej[Bonusj|(Ai, Aj)] ≤g and Ei[Bonusi|(Ai, Aj)] ∈ 0, 1
2 g, g. Back to Equation 5 we get the only possiblecombination is:
Ei[Bonusi|(C, C)] = Ej[Bonusj|(C, C)] = 12 g and
Ei[Bonusi|(D, C)] = Ej[Bonusj|(C, D)] = 0 and g > 2c.
Lemma 1. Under the condition g > 2c, (C, C) is dominant in the first stage if throughcoordination, players from a single homogeneous population could agree with followingperception on feedback strategies: both submit positive feedback if both cooperated and theysubmit definitely negative feedback if his opponent defected and he himself cooperated.
Proof. From Observation 1 we know the condition for (C, C) as dominant ac-tion profile in the first stage is Ei[Bonusi|(C, C)] = Ej[Bonusj|(C, C)] = 1
2 g andEi[Bonusi|(D, C)] = Ej[Bonusj|(C, D)] = 0. Thus we gain constraints on the possi-ble submitted feedback, which leads to (C, C) as dominant action profile. Figure2 shows the feedback submitted by Player i under different action profiles in theservice stage.
CC DC CD DDi→ j 1 0 0 0
1 0 0 11 1 0 01 1 0 1
Figure 2: Possible Feedback Strategies leading to (C, C) as dominant action profile in thefirst stage
The intuition behind above feedback strategies is: if both cooperated, both submitpositive feedback; if the player himself cooperated but his opponent defected, the

102 Jing Zhi Yue, Klemens Bohm, and Karl-Martin Ehrhart
opponent receives then negative feedback. The resulted Nash Equilibria of abovefeedback strategies is either [(C, C)] or [(C, C), (D, D)]. Since the payoff for bothplayers under (D, D) is surely smaller than the payoff under (C, C), we couldassume that after coordination both players will agree to cooperate in the servicestage.
4 The Game with First-Order Information
Now we consider the game with first-order information, where players know whatkind of feedback their opponents submitted and received in the last round. In-tuitively speaking, a player cooperates in the service stage in the hope that hisopponent also cooperates and he could gain positive feedback for a higher bonus.But a player prefers to submit negative feedback to the opponent, so that his ownreputation could be more outstanding compared to those of others. Thus defamingco-players by submitting negative feedback should be penalized.
Strategy Space
We assume that all players use uniformly the same Service Trigger (ST) strategy forthe service stage. A player cooperates if his opponent didn’t receive or submit anynegative feedback in the last round; otherwise he defects. This trigger strategypenalizes not only the player who received negative feedback strictly, but also theplayers who submitted negative feedback. Under this strict punishment playersmay tend to avoid negative feedback by submitting untruthful positive feedback.
Therefore in this work we analyze the effect, in which three feedback strategiesinteract with each other: honest players tell always truth, unconditioned positiveplayers submit always positive feedback and unconditioned negative players submitalways negative feedback. We notate these three feedback strategies as Truth, AllPand AllN. We consider a large, well-mixed population. Among all M players, thenumber of players of these three feedback strategies (Truth, AllP, AllN) are given byr, s and t with r + s + t = M.
4.1 Cooperate or Defect
According to the ST strategy, a player cooperates only if the opponent is qualifiedin the way that he didn’t receive or submit negative feedback in the last round. Wesuppose at round n, there are ωn percent of the players who are qualitfied to wincooperation, whereby 0 ≤ ωn ≤ 1.
Observation 3 Sum of all players’ reputations
If all players follow the prescribed service strategy, it means they cooperate withprobability of ωn at round n. Any player who meets a AllP player, gets alwayspositive feedback, while he always receives negative feedback if he meets a AllN

Title Suppressed Due to Excessive Length 103
player. Any player who meets a truth telling player, receives positive feedback if hecooperated.
Thus the sum of reputation of all players is Rntotal = r( r−1
M ∗ωn +s
M ∗ 1) + s( rM ∗
ωn +s−1M ∗ 1) + t
M ( rM ∗ωn +
sM ∗ 1) = M−1
M ∗ (rωn + s).
Assumption 1 In a stable system, the probability that a player is qualified to win coopera-tion stays unchanged.
Observation 4 Probability of qualified players ω = ωn−1 = ωn in a stable system
At the beginning of the game each player is qualified to win cooperation, so ω0 = 1.A player is qualified for winning cooperation in the next round, if he receives andsubmits positive feedback at the current round. He receives positive feedback if hecooperates with a qualified opponent according to the prescribed service strategyand his opponent tells truth or if he meets with a AllP player: Probn
rec =s
M + rM ∗
ωn−1. With the same probability he submits positive feedback: Probnsub = Probn
rec.So the probability that a player is qualified for winning cooperation is ωn =
Probnrec ∗ Probn
sub = ( sM + r
M ∗ ωn−1)2. According to Assumption 1 (ωn = ωn−1)
and under the constraint 0 ≤ ω ≤ 1, we get: if r > 0, ω = M2−2rs−M∗√
M2−4rs2r2 or if
r = 0, ω = ( sM )2, the probability that a player is qualified to win cooperation stays
unchanged.
Lemma 2. A rational player prefers to cooperate, if all other players follow ST strategy andfollowing condition is fulfilled: if r > 0,g > (M− 1)(M2−M∗
√M2−4rs
2r2 )(c− bδ M−√
M2−4rs2M ).
Proof. We assume that each player believes that all other players follow thesubscribed service strategy. Now we want to discuss under which condition aplayer prefers to cooperate.
If a player cooperates, it costs him c points and he could gain positive feedbackwith the probability of 1− t
M . According to Observation 3 his expected bonus
for this round is g ∗ 1− tM
M−1M ∗(rω+s)
. He could be free from punishment by his next
opponent only if he receives and submits positive feedback in the current round. Inan infinitely repeated game with discount factor δ, his expected punishment in thenext round is bδ[1− (ω ∗ r
M + sM ) ∗ (1− t
M )]. His expected utility by cooperating istherefore:
Uc = −c + g ∗1− t
MM−1
M ∗ (rω + s)− bδ[1− (ω ∗ r
M+
sM
) ∗ (1− tM
)] (7)
If a player defects, he could save the cooperation cost but he could gain positivefeedback only when he meets a AllP player. His expected utility by defecting is:
Ud = g ∗s
MM−1
M ∗ (rω + s)− bδ[1− s
M∗ (ω ∗ r
M+
sM
)] (8)

104 Jing Zhi Yue, Klemens Bohm, and Karl-Martin Ehrhart
If Uc > Ud, a player prefers to cooperate. So we gain following condition: ifr > 0,
g >(M− 1)(rω + s)
r[c− bδ
r(rω + s)M2 ], (9)
whereby ω = M2−2rs−M∗√
M2−4rs2r2 .
For long-run players, they have incentives to keep above condition fulfilled sothat there are still players, who are willing to cooperate. We see the relationshipbetween bonus parameter g and the number of Truth and AllP players decideswhether rational players prefer to cooperate.
4.2 Dynamic among Feedback Strategies
We consider the effects of three feedback strategies. With UTruth, UAllP and UAllNwe denote the expected utility by using these three strategies. Strategy with highutility dominates.
Under the premise that all players follow the ST strategy, we could analyze whenis a feedback strategy more successful than another. For a truth telling player if hemeets another truth telling player, he could gain positive feedback if he cooperates.And he could be free from punishment if both truth telling players cooperate. Ifthis truthful telling player meets a AllP player, he gains certainly positive feedback.He will not be punished if his opponent cooperates and thus he submits positivefeedback. However if he meets a AllN player, he could never get positive feedbackand he will be surely punished in the next round. Therefore for a truth tellingplayer, his expected utility is:
UTruth =r− 1
M[g ∗ ω
Rtotal− bδ(1−ω2)] +
sM
[g ∗ 1Rtotal
− bδ(1−ω)]− bδt
M(10)
Two AllP players meet each other and both get certainly positive feedback andwill never be punished. But if he meets a truth telling player, he gets positivefeedback only when he cooperates. Similarly he gets also only negative feedbackand will be punished by his next opponent if he meets a AllN player. His utilityunder AllP strategy is:
UAllP =rM
[g ∗ ω
Rtotal− bδ(1−ω)] +
s− 1M∗ g ∗ 1
Rtotal− bδ
tM
(11)
A AllN player could never escape from punishment. In the similar way we couldgain the utility of AllN strategy:
UAllN =rM
(g ∗ ω
Rtotal− bδ) +
sM∗ (g ∗ 1
Rtotal− bδ)− bδ
t− 1M
(12)
By comparing the resulted utility of different feedback strategies, we couldsee which strategy is more successful. From Lemma 2 we know rational players
Title Suppressed Due to Excessive Length 105
have incentives to keep opponents to cooperate. For a given bonus parameterg, the number of Truth and AllP players decide, whether cooperation and truthfeedback yield equilibrium. If condition r > 0, g > (M− 1)(M2−M∗
√M2−4rs
2r2 )(c−bδ M−
√M2−4rs
2M ), UTruth > UAllP and UTruth > UAllN is fulfilled, rational players willchoose to cooperate and to submit truthful feedback.
5 Conclusion
In this work we have constructed a model, which 1) extends symmetric gameslike prisoner’s dilemma by allowing players to elicit feedback; 2) rewards partici-pants having high reputation with bonus points. The better reputation a player has,compared to other players, the more bonuses he could gain. In a game without repu-tation information, a player estimates his received feedback based on the interactionoutcome in the service stage, i.e., whether the player himself and his opponentcooperated. According to the analysis in section 3, we know if players play purestrategies, the relationship between bonus parameter g and payoff parameter b andc decides whether cooperation and truth feedback is dominant action combination.
In a game, where first-order information is available, we suppose players penalizenot only the players received negative feedback strictly, but also the players sub-mitted negative feedback. In addition, we analyze how three possible feedbackstrategies (telling truth, always positive feedback and always negative feedback)interact with each other. For a given bonus parameter g, we have observed thatthe number of Truth players and AllP players decide the outcome of the game. In astable system, where the number of players who are qualified to win cooperationstays unchanged, players are motivated to keep the number of Truth players to fulfillcertain threshold so that there are still incentives for players to cooperate.
References
Bolton, G. E., C. Loebbecke, and A. Ockenfels (2007): “How Social ReputationNetworks Interact with Competition in Anonymous Online Trading: An Exper-imental Study,” Working Paper Series in Economics 32, University of Cologne,Department of Economics, http://ideas.repec.org/p/kls/series/0032.html.
D.Engelmann and U.Fischbacher (2002): “Indirect Reciprocity and Strategic Reputa-tion Building in an Experimental Helping Game.” Technical report 132, ZuerichIEER.
I.Seinen and A.Schram (2006): “Social Status and Group Norms: Indirect Reciprocityin a Repeated Helping Experiment,” European Economic Review, 50(3).
Jurca, R. and B. Faltings (2004): “Truthful Reputation Information in ElectronicMarkets without Independent Verification,” .
Nowak, M. and K. Sigmund (1998): “Evolution of Indirect Reciprocity by ImageScroing,” European Economic Review, 393.

Requirements for Formalizing Usage Policies of WebServices
Sebastian Speiser1, Rudi Studer1, and Thomas Dreier2
1 Karlsruhe Service Research Institute, KITspeiser, [email protected]
2 Institute of Information and Economic Law, [email protected]
Summary. The availability of functionality and information as Web services fosters thedynamic cooperation of heterogeneous providers in form of service compositions. Thestandardized interfaces of Web services enable unlimited options to combine services on atechnical level. In contrast there is also a business and economical view that may constrainthese possibilities. Service and data providers can restrict allowed usages of their resourcesand link it to obligations, e.g. only non-commercial usage is allowed and requires anattribution of the provider. Such terms and conditions are currently typically available innatural language which makes verifying, if a composition is compliant with the policiesof the used services, a tedious task. In order to make it easier for users to adhere to theseusage policies, we propose to formalize them. This enables policy-aware tools that can(semi-)automatically check compliance of service compositions. In this paper we analyzethe requirements for such a formalization, both from technical view as well as driven by theactual usage restrictions of existing Web services. We propose design decisions for a formalmodel and show how they fulfill the postulated requirements. Furthermore we outline legalaspects of a system relying on formal usage policies.
1 Introduction
Modern information and communications technology (ICT) enables low-effort inte-gration of services from different providers. This facilitates the dynamic formationof service value networks (SVN), which are compositions of services created in orderto fulfill customer needs (Blau et al., 2009b). SVNs are not restricted to use onlyservices from a closed repository, but can foster service offers in open markets, thatpose low entry barriers for service providers due to the use of standardized Webservice interfaces. Due to changing customer needs and the steady (dis-)appearanceof providers and offered services, SVNs are continuously formed and transformed.This can be automated, e.g. by an electronic auction market (Blau et al., 2009a) ordecentralized formation algorithms (Speiser et al., 2008). Such automation mecha-nisms rely on formal descriptions of Web services. There exist several approachesthat describe the functionality of services as well as their quality attributes, e.g.
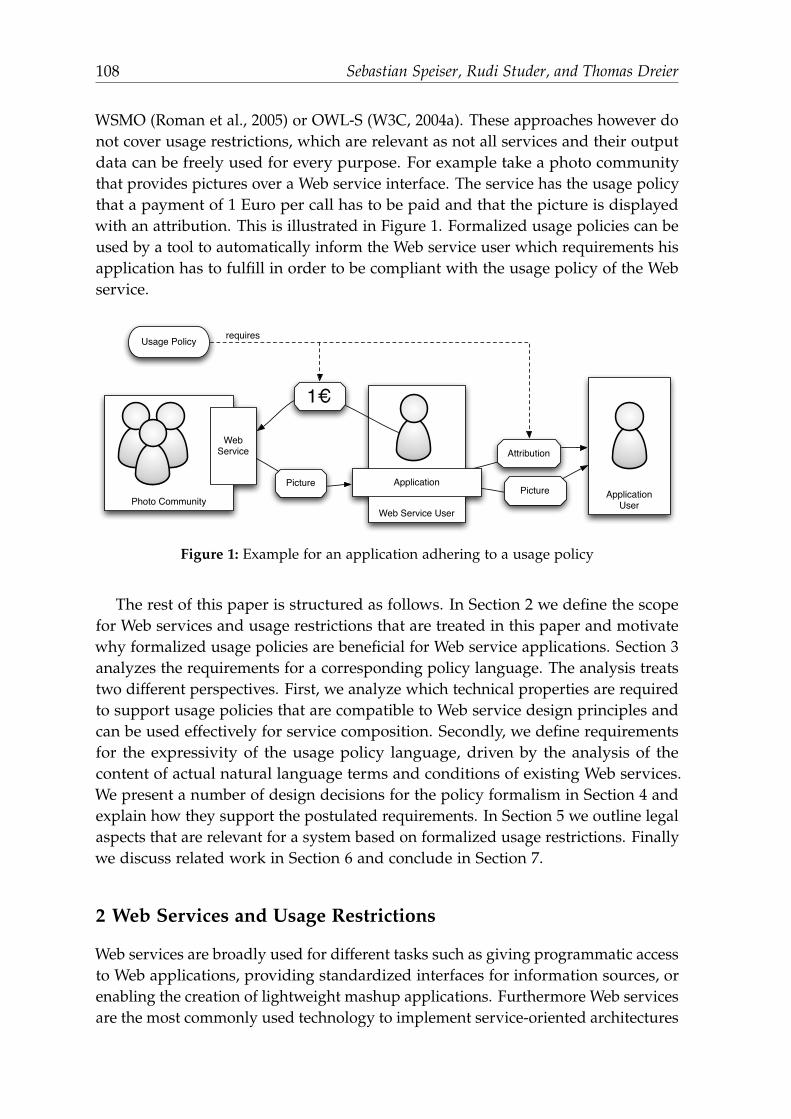
108 Sebastian Speiser, Rudi Studer, and Thomas Dreier
WSMO (Roman et al., 2005) or OWL-S (W3C, 2004a). These approaches however donot cover usage restrictions, which are relevant as not all services and their outputdata can be freely used for every purpose. For example take a photo communitythat provides pictures over a Web service interface. The service has the usage policythat a payment of 1 Euro per call has to be paid and that the picture is displayedwith an attribution. This is illustrated in Figure 1. Formalized usage policies can beused by a tool to automatically inform the Web service user which requirements hisapplication has to fulfill in order to be compliant with the usage policy of the Webservice.
Photo Community
WebService
Web Service User
Picture
1€
Attribution
PictureApplication
ApplicationUser
Usage Policy requires
Figure 1: Example for an application adhering to a usage policy
The rest of this paper is structured as follows. In Section 2 we define the scopefor Web services and usage restrictions that are treated in this paper and motivatewhy formalized usage policies are beneficial for Web service applications. Section 3analyzes the requirements for a corresponding policy language. The analysis treatstwo different perspectives. First, we analyze which technical properties are requiredto support usage policies that are compatible to Web service design principles andcan be used effectively for service composition. Secondly, we define requirementsfor the expressivity of the usage policy language, driven by the analysis of thecontent of actual natural language terms and conditions of existing Web services.We present a number of design decisions for the policy formalism in Section 4 andexplain how they support the postulated requirements. In Section 5 we outline legalaspects that are relevant for a system based on formalized usage restrictions. Finallywe discuss related work in Section 6 and conclude in Section 7.
2 Web Services and Usage Restrictions
Web services are broadly used for different tasks such as giving programmatic accessto Web applications, providing standardized interfaces for information sources, orenabling the creation of lightweight mashup applications. Furthermore Web servicesare the most commonly used technology to implement service-oriented architectures
Requirements for Formalizing Usage Policies of Web Services 109
(SOA). Correspondingly there exist numerous definitions of Web services, that covera wide range of aspects. We do not rely on a narrow definition of Web services,that dictates the adherence to specific standards (e.g. WSDL and SOAP). Instead weaccept that depending on the used architecture or application environment, differenttechnologies can be appropriate. We consider as Web services all components thatfulfill the following requirements:
• Self-contained: the functionality of the Web service is independent of otherservices and can be used in different applications and processes.• Interoperable: no or minimal integration effort is needed to access the service.
This is realized by communicating over an interface adhering to a standard Webprotocol (e.g. HTTP) and exchanging data represented in a (quasi-)standardformat (e.g. XML, JSON).• Self-described: the Web service provides a description of its interface that
enables the correct invocation of the service by a client that fulfills the sameinteroperability requirements.• Loosely coupled: for the Web service, the only relevant property of a system
using it, is that it adheres to the published interface of the service.
This rather broad classification abstracts from technical details and includes, de-pending on the used environment, also technologies like linked data or HTMLforms. For more detailed information on these requirements and more aspects, thatare not relevant in our context, we refer the reader to Erl (2007).
Descriptions of Web services are not only helpful for the invocation but alsofor the selection of services. Users select services based on the net value theyexpect from the service consumption (Ng, 2007, p. 23ff). The net value is given bysubtracting the costs from the experienced gross value. Both can only be determinedafter consumption, as the actual service is only co-created at the time of consumption.Therefore users have to rely on value estimations that are based on experience orservice descriptions.
Description of services that can be used for service selection have to be moreextensive than in the above definition of the requirement “self-described”. Themost obvious parts of a description influencing service selection are about thefunctionality of the service and its price. However costs of a service have not to berestricted to payments and value gained from the functionality can be influencedby the non-functional properties (NFPs) of the service. NFPs cover a wide range ofissues, such as quality of service (QoS), limited liabilities, usage restrictions of theservice or its output data, privacy terms or obligations, e.g. to attribute the providerof a used service in the corresponding application.
Service selection can be split into two operations: discovery and ranking. Dis-covery filters from a set of services (e.g. retrieved from a repository or by crawlingthe Internet) those that match the user’s request (Sycara et al., 2003). Rankingsorts this list according to preferences given by the user, see e.g. Lamparter (2007).Furthermore several services can be combined to form a service composition with
110 Sebastian Speiser, Rudi Studer, and Thomas Dreier
combined functionality and properties that can be determined from the servicedescriptions. Another desired operation is to check if the use of a service in acomposition is compliant with the restrictions and conditions stated in its NFP de-scriptions. Validating a composition means checking if all service uses are compliantand the desired functionality is achieved.
Performing these operations manually can be a cumbersome and time-consumingtask. This is in contrast to the principles of dynamic service selection and frequenttransformation of applications, business processes and service compositions, that arepropagated by popular Web service scenarios, such as SOA or mashups. Formalizedservice descriptions help to perform discovery, ranking, composition and validation(semi-)automatically. Current approaches to formal service descriptions mainlyconcentrate on functionality and quality of service. These aspects are often sufficientfor service users to build running systems and therefore other properties such asusage restrictions and obligations are easily ignored. We call these properties usageterms and define them as follows:
The usage terms of a Web service restrict the invocation of the service and the utilizationof its output data based on the usage context, including purpose, time, location, identityof the user, as well as structure and non-functional properties of the composition in whichthe service or its output data is used. Furthermore the usage terms can optionally linkobligations, including attributions and payments, to the service or data usage.
In this paper we analyze the requirements for usage policies, i.e. the formalizationof usage terms, that can be used to consider them for (semi-)automatic discovery,ranking, composition and validation. Our main goals are:
• Make it easier to adhere to usage terms than to break them. Tools can help theuser to build and check for compliance. However we do not want to enforceusage policies technically, e.g. by using digital rights management (DRM). Suchapproaches are based on cryptography and work only in trusted computingenvironments. This contrasts our notion of open markets, where everybody canparticipate. Furthermore DRM only allows predefined actions, which hindersnew and innovative data and service usages.• Support providers to make their services and data broadly available in open
markets, without giving up their rights and commercial interests. This has bothadvantages for users, who can access more services and for providers, who reacha larger customer base.
Currently usage terms are defined in natural language documents, depending onthe relation between provider and user. This ranges from individually negotiatedcontracts to terms and conditions published on the provider’s homepage. We areespecially interested in the latter case, where a provider offers his service undercertain conditions and the user can decide whether to accept or not. The reason forthis decision is that individual contracts are negotiated in a way that the desiredusage scenario is compliant to the contracts.
Requirements for Formalizing Usage Policies of Web Services 111
3 Requirements for Formalizing Usage Policies
Web services are typically not directly invoked by end users but as part of applica-tions. These applications provide the context in which the service and its outputdata is used. The context can be of different types from simple user interface wrap-pers, over dynamic Web pages and service compositions to business processes. Thecontext however is not only defined by the technical description of the applicationbut also includes aspects such as the purpose of the service invocation and theintended usage context of the application. As an example for the last statement,consider a Web service which provides confidential data that is displayed by adynamic Web page. This usage is only compliant, if the access to the Web page isrestricted in the same way as for the service.
The usage context regards the usage of a service and its output data as an isolatedevent. Usage terms however can also regulate repeated service usages, e.g. impose alimit on the number of service invocations per day, or obligate the user to pay a pricebased on the total number of service usages. Repeated usage situations describemultiple occurrences of usages, which can be of different types (e.g. commercial oracademic usage), as well as other actions, such as payments, that are not directlylinked to the application, respectively usage context in which a service or its outputdata is used. We therefore split a usage policy in two parts:
• Usage context policy: a function mapping the set of all possible usage contexts toa hierarchical set of usage types, e.g. compliant usage and non-compliant usage.Compliant usage could have a possible subtype “compliant non-commercialusage” of a specific service.• Repeated usage situation policy: a function mapping the set of all repeated
usage situations, that can refer to the usage types as defined by the usage contextpolicy, to either compliant or non-compliant.
In order to support formalization we need models for usage contexts and repeatedservice usages, as well as languages for specifying restrictions that form the policies.Additionally we need algorithms that can process the models and languages. In thefollowing we present requirements that have to be fulfilled by the models, languages,policies and algorithms in order to enable usage policy aware applications.
3.1 Technical Requirements
In this section we concentrate on aspects that are independent of the contents ofconcrete usage policies but are required in order to build applications that supportboth Web service consumers and providers to be policy compliant, respectivelyspecify policies.
Requirement 1: Interoperability
We defined above that interoperability is a required criterion for Web services, whichcan be directly transferred as an requirement for usage policies of services. Web
112 Sebastian Speiser, Rudi Studer, and Thomas Dreier
services are used in heterogeneous environments across technological boundaries.We therefore require that policies are accessible over standard Web protocols (e.g.HTTP) and can be serialized in a widely understood format (e.g. XML, JSON, RDF).In order to avoid ambiguities, we require that the terms of the policies are uniquelynamed by using URIs. Furthermore it is desirable that the meaning of usagesituation descriptions and policies are not dependent on a reference implementationof used algorithms or the human interpretation of a textual specification. Thishas to be achieved by basing models and policy languages on a formal logic withwell-defined semantics.
Requirement 2: Loose Coupling
The purpose of usage policies is to restrict the situations and applications in whicha service can be employed. This means that providers deliberately constrain thereusability requirement of Web services. By referring to the usage context of aservice, however also the loose coupling property is violated as a form of collateraldamage. While this cannot be completely avoided, it is essential to keep the violationat a minimum. This means that the usage model underlying the policies shouldbe general and abstract enough to support the wide range of possible technicalenvironments in which services could be used, e.g. BPEL processes, dynamic Webpages or lightweight mashups.
Requirement 3: Computational Efficiency
We cannot make the used formalism arbitrarily powerful, as we have to keep itdecidable, so that automated reasoning about compliant usages and policy proper-ties is possible. Furthermore, operations such as searching for a service with givenpolicy properties, can involve the evaluation of a large number of policies. Thuswe require that reasoning complexity for the policy formalism should be kept at alevel, which allows the efficient evaluation of realistic policies.
Supporting this point, we require that it is possible to directly specify propertiesof usage situations, that cannot or only very costly be determined from the formalmodel. An example for this includes determining whether a service is called foracademic purposes, which cannot be inferred from a technical description of anapplication, but can be specified very easily by a human user.
Requirement 4: Usability for Web Service Consumer
Above we described a usage policy as a function that classifies a usage situationas either compliant or non-compliant. This is not sufficient for service consumers,who do not only want to know that their current application is non-compliant, butalso why this is the case (e.g. missing payment) and how they can fix this (e.g. adda payment of 1 Euro). Thus we require our algorithms to include a justificationmechanism for their decisions. In principal, justifications can be embedded with
Requirements for Formalizing Usage Policies of Web Services 113
little effort in reasoning algorithms for many logics by saving a history of logicalconclusions. However such bare-metal justifications are not easily understandablefor service consumers that cannot be expected to be logic specialists. Therefore it isessential that justifications are given in a format that users can utilize.
Requirement 5: Usability for Web Service Provider
Not only the service consumers but also the service providers and policy specifierswill be mostly non-logicians. Therefore it is important that providers are notrequired to specify their policies directly as logic formulas. Instead they should beable to reuse building blocks which they can configure for their specific offer.
3.2 Content Requirements
In this section we list a number of requirements that are motivated by the contentsof actual usage restrictions. Many different terms can be covered by the first contentrequirement extendability, but it is followed by others that have to be structurallypresent in the policy formalism.
Requirement 6: Extendability
Specifications of policies should be able to extend the used vocabulary, terms andattributes. This is required because it cannot be assumed that a standard modelcan be built that covers all desired aspects of all service providers on the Web. Thisshould include possibilities to define new attributes of operations, e.g. a restrictionabout the minimal or maximal size which has to be used to display output data of aservice, this is required by YouTube1, respectively Google Maps2. Another exampleis the inclusion of flexible authentication requirements. While for company internalservices it may be possible to use a centralized, identity-based system, it may bemore appropriate for a service provided between independent partners to rely on acredential-based authentication scheme (see e.g. Agarwal and Sprick (2005)).
In the following we will discuss requirements that cannot be covered by intro-ducing new operations and attributes.
Requirement 7: Restrictions on other Policies
Providers can also impose constraints on the policies of applications using theirservices or data. This is mostly done to prevent third parties from making aprofit of cheap or free offers. Examples include the share-alike clause of CreativeCommons3, and the restriction of Google Maps that forbids that applications usingthis service are only made available for paying users. This can be interpreted as a
1 http://code.google.com/apis/youtube/terms.html2 http://http://code.google.com/apis/maps/terms.html3 http://creativecommons.org

114 Sebastian Speiser, Rudi Studer, and Thomas Dreier
non-commercial clause, which is also popular by Creative Commons users, eventhough there is no general consensus what this clause exactly means4.
Requirement 8: Dependence on Invocation of other Services
In general Web services can be combined with other services in so-called composi-tions. According to the Web service characteristics self-contained and interoperablethere is no restriction about which other services can be used, as long as they havecompatible inputs and outputs. However it is required that usage policies can spec-ify that certain other services must or must not be composed with their describedservice. Depending on the used composition model this property has to be checkedin different ways. For simple dynamic Web pages the composition model can beseen as a set of services, where (non-)containment of (un)desired services has totested. Complex processes on the other hand require that branching conditionsare evaluated in order to determine if two services are always, respectively neverinvoked together in a process instance.
Policy examples for this requirement include:
• A Web service requires that an external authentication service is successfullycalled before each invocation.• An image forbids that services with the purpose “advertisement” are used in
an application displaying the image. This is another partial interpretation of anon-commercial clause.• Amazon.com Product Advertising API5 can only be used for applications, whose
main purpose is generating sales of products and services on the Amazon site.
Requirement 9: Counting and Arithmetic Operations
This requirement concerns the language of repeated usage policies. Usage restric-tions can contain quantifiers on the number of allowed invocations of services.Furthermore counts of certain usage types have to be added, multiplied with costper call prices, compared to discount levels, etc. in order to calculate the totalamount that has to be payed for service usage in a specific time period.
Examples for this requirement are:
• Usage terms of Amazon Simple Storage Service (S3)6 that require a payment foreach package of thousand service calls.• eBay API license agreement7 which imposes a limit on the number of calls that
users are allowed to make.4 Creative Commons has commissioned a study about the understanding of commercial vs.
non-commercial use. An interim report can be found at:http://mirrors.creativecommons.org/nc-study/NC Use Study Interim Report 20090501.pdf
5 https://affiliate-program.amazon.com/gp/advertising/api/detail/agreement.html6 http://aws.amazon.com/s3/#pricing, http://aws.amazon.com/agreement/7 http://developer.ebay.com/join/licenses/individual/,
http://developer.ebay.com/join/pricing/
Requirements for Formalizing Usage Policies of Web Services 115
Requirement 10: Notion of Time
The previously introduced limits on the number of service calls as well as thecomplex payment terms usually refer to a time period. Thus it is essential that therepeated usage policy component is able to relate the occurrence of service usagesto time points and intervals.
Examples for time in usage terms are Amazon S3 that is paid monthly and eBaywhich specifies call frequency limitations on a daily basis.
4 Concepts for a Formal Model
In this section we describe high level design decisions for our formal model forusage policies. We base these decisions on the requirements analysis presented inSection 3.
Decision 1: RDF Model of Usage Contexts
Applications using Web services can be treated as distributed computer programsusing message passing. A powerful model for such programs are process calculi.Constraints on such models can be expressed by temporal logic formulas. Agarwal(2007) employs these techniques for Web service discovery. For our purposes, wehowever do not need this level of detail in modeling usage contexts. The onlyrequirement for expressiveness regarding the structure of a usage situation is (R8)dependence on invocation of other services. To fulfill (R8), it is sufficient to have a usagemodel that specifies if two service invocations are either (i) always executed incombination, or (ii) can be executed in combination. Case (i) is relevant if anotherservice is required to be always executed whenever the regulated service is called.Case (ii) can be used in a negated condition, in order to forbid other services tobe used in combination with the regulated service. We propose to model actions,such as service invocations or payments as instances of corresponding classes ofan RDF(S) model (W3C, 2004b). Action instances are then linked with propertiesrepresenting cases (i) and (ii) above that are abstracted from the specific computingmodel underlying a usage situation. Such a model has the following properties:
• Actions are not modeled with a fixed schema, but can be easily extended byusing standard RDF constructs, thus fulfilling (R6) extendability.• Usage contexts are represented on a general and abstract level, that does not
have assumptions on the technology underlying a service usage. This fulfills(R2) loose coupling.• RDF(S) is a standard Web format, relying on URIs and providing formal seman-
tics, which supports fulfillment of (R1) interoperability.• The usage of RDF(S) instead of a more expressive ontology language such as
OWL has the advantage that complex queries over the model have well-defined
116 Sebastian Speiser, Rudi Studer, and Thomas Dreier
semantics and there exist efficient algorithms for query evaluation. This supports(R3) computational efficiency. Queries are suitable for policy specification, as wewill discuss in the next paragraph.
Decision 2: Usage Context Policies using SPARQL Queries
We propose to construct policies using SPARQL queries (W3C, 2008) on usagedescriptions according to the RDF usage model. The queries can extract instancesthat fulfill given properties, e.g. return all usage situations that invoke a specificservice. By combining several queries, we can reuse previous results to check furtherproperties, e.g. check for each usage situation, if the service invocation is alwaysexecuted in combination with a payment action. The two basic ways of combiningsuch queries are (i) for each result of query 1, evaluate query 2, and (ii) if query 1has a result, proceed to query 2, else proceed to query 3. Such combinations lead todirected graphs with queries as nodes and as leafs (nodes that are no queries andhave no outgoing edges) we allow the creation of statements that classify instancesretrieved by one of the queries as specific usage types. We will define a formalsemantics for these query trees and thus fulfill (R1) interoperability. By checkingall possible paths from the root of a query tree to its leafs, we can check (i) if acertain condition is required for compliance in all paths, or (ii) if it is impossible toreach compliance given a certain condition. These tests enable the fulfillment of (R7)restrictions on other policies. In such a model it is also possible to reuse parametrizedqueries provided by a third party in its own policies. This mechanism can be usedto provide standard building blocks, thus fulfilling (R5) usability for Web serviceprovider.
Decision 3: Foster User-given Query Groupings and Labels
As mentioned in (R4) usability for Web service consumers, we want to have decisionjustifications that are valuable for a service consumer. Therefore we propose to fosterthe groupings given by the specifier of the policy, when he splits his usage policyinto several SPARQL queries, as described above. We assume that he will typicallycheck a specific aspect in a single query, that the user can fix, if the evaluation fails.An algorithm that regards the policy as a complete logical specification, has to workwith heuristics to determine which level of detail for explanations is useful for aservice consumer.
Additionally the policy creator has the possibility to label SPARQL queries,using natural language strings with references to variables occurring in the currentand previously evaluated queries. These labels can give a high level and easilyunderstandable explanation, why the checked restriction was not fulfilled, andpossibly a hint, how it can be fixed.
A similar approach is taken by the policy language AIR (Kagal et al., 2008), but ithas currently no formal semantics, therefore violating (R1) interoperability and doesnot support (R7) restrictions on other policies.
Requirements for Formalizing Usage Policies of Web Services 117
Open Decision: Repeated Usage Situation Policies
Above we described, how we can split usage policies into a usage context part and apart constraining the repeated usages of services. We have defined that the interfacebetween the two parts is a number of usage events with corresponding usage typesand point in time when they occurred. These usage events can also be generatedby an estimate in order to forecast the repeated usages, e.g. to know the price fora planned service usage. Currently we have not yet decided on a formalism torepresent the aspects of usage policies concerning repeated usage situations. In thefollowing we list two possible approaches that can solve the task:
• Treat the event log as a linear trace of system behavior and define the repeatedusage situation policy as restrictions in temporal logics. The (R10) notion of timecan be introduced by creating artificial events representing relevant time points.• Treat the event log as a set of data tuples, consisting of usage type and time
point. One could then filter events in a specific time frame and then use a querylanguage for counting the tuples and performing arithmetic operations, fulfilling(R9) counting and arithmetic operations.
5 Legal Perspective
In this section we regard usage policies from a legal perspective, based on thelaws in Germany. The purpose of this section is to point to questions that haveto be considered, when formalized usage policies and policy-aware systems areused. Note that it is neither possible nor intended to answer these questions in thescope of this work. Rather we want to give an overview of laws and norms thatare relevant for the following questions: (i) what is the legal foundation for usagepolicies?, (ii) do restrictions on the freedom of contract apply?, (iii) who is liablein case of policy violations?, and (iv) are usage policies protected by intellectualproperty right?
5.1 What is the legal foundation for usage policies?
Software in general is subject to the German Copyright Act (§69a UrhG) and thusthe creator holds the exclusive rights to exploit the software. For software that iscreated within an employment, the employer is entitled to the exploitation rightsaccording to §69b UrhG. The rights holder can grant third parties rights to exploitthe software. This grant can be linked to obligations and usage restrictions. Webservice consumers however do not directly use the software providing the service’sfunctionally, but only use its interface. The code implementing the interface is alsoprotected by copyright, but not the specification of the interface (Meyer, 2008, p.55)(Gangadharan et al., 2008). It has therefore to be examined, if the copyright isapplicable as a legal foundation for specifying usage policies.
118 Sebastian Speiser, Rudi Studer, and Thomas Dreier
Data that is obtained from a Web service, can be subject of copyright, if it is acreative work, e.g. a photo. For output data that is no creative work, one has tocheck, if it can be protected as a database, according to §§87a ff. UrhG. However ithas to be reviewed, if the result of a service call is considered as a marginal part ofa database, and thus not protected.
Copyright does not have to be registered by a creator, but is given automatically.This means that without an explicit grant of the creator, one is not allowed to exploithis works. Thus an usage policy in this case can be seen as an allowance of usagesthat would otherwise be forbidden.
Similar is the situation with data that is related to individuals and thus is subjectof data protection laws (in Germany “Bundesdatenschutzgesetz”). This protectionis also automatically given and usage of such data requires the consent of theconcerned individual.
In case that data is not automatically protected, usage policies can be specified,that forbid things that would otherwise be allowed. The foundation for suchpolicies depends on the data to protect. If data can be declared as a trade secret, it isprotected by §17 UWG, the German law against unfair competition. Usage policiescan in this case be seen as non-disclosure agreements.
Apart from legal foundations, the restriction of service and data usage can alsobe based on social norms. This can be the case for usage inside a company, orbetween private persons, e.g. a friend providing personal pictures to another friendvia a Web service, and forbidding him to share the pictures or give access to theservice to other people.
5.2 Do restrictions on the freedom of contract apply?
Usage policies are formalized contracts (or parts thereof) between a service providerand a service user. In general both parties are free to form the contact as they like,as long as it does not break any laws. However we can think of two sources forrestrictions on the freedom of contract, that are explained in the following.
First is the German Civil Code (“burgerliches Gesetzbuch” BGB) and its regu-lations on general terms and conditions. We assume that individually negotiatedcontracts are only established if they allow the intended usage of the service user.Thus formal usage policies are more useful in situations where they are offered toall potential customer on a take-or-leave basis. In such cases it has to be checked ifthe policy is considered as general terms and conditions (AGB). AGB are subjectto a content check according to §307 BGB and §§308 - 309, if the service user is aconsumer. The latter can be a blurry notion, if we consider the Web 2.0, whereindividual users also often act as providers. A similar situation is given with onlineauctions on eBay8, where private persons act both as seller and buyers. There havebeen several judgments in Germany concerning the classification of individuals asconsumers or tradesman, that could possibly be relevant in a Web service scenario.
8 http://www.ebay.de
Requirements for Formalizing Usage Policies of Web Services 119
Furthermore AGB have to be presented and pointed to in an appropriate way,according to §305 BGB.
Second is §19 GWB (German Law Against Restraints on Competition), thatforbids the misuse of a market dominating position. The prohibition comprisesbesides others arbitrary pricing and denial of service to other companies.
5.3 Who is liable in case of policy violations?
The obvious answer to this question would be the service user violating the policy.However there may be other parties involved that can make mistakes, which lead toan unintended policy violation by the user. The policy specifier for example canbe different from the service provider, e.g. a third party company that providesformalized usage policies as added value services. Similarly the developer of thepolicy engine can have errors in his software that leads to wrong classifications. Incase of mistakes by third parties that lead to policy violations, it is unclear if theuser can have recourse. Policy specifiers and engine vendors are certainly interestedhow far they can rule out liabilities according to law and user acceptance.
5.4 Are usage policies protected by intellectual property right?
This question is important for a potential market for reusable policy clauses. Apolicy clause can backed by a legal text, having the advantage that it can be checkedautomatically and has a representation that is suitable for enforcing it througha lawsuit. The creation of such clauses can cause great effort and can only beconducted by lawyers, but can be reused in many situations by many people (cf.the Creative Commons RDF representation (Abelson et al., 2008)). If the clauses canbe protected by intellectual property right, its creators can develop business modelsbased on the licensing of rights to use the clauses. If intellectual property rightsapply to a legal document does however not depend on the amount of effort thatwent into its creation. Rather the decision is based on the level of creativity thatwas required to produce the document. Legal documents have been classified asscientific documents (e.g. in the judgment of the Oberlandesgericht Munchen onOctober 16th 2007, reference: 29 W 2325/07), for which other criteria of creativityapply than for literature.
6 Related Work
O’Sullivan (2006) presents in his thesis an extensive taxonomy of non-functionalproperties (NFPs) of services. His results are based on the analysis of classicservices and Web services from numerous domains. The taxonomy deals withvarious categories of NFPs, such as availability, price, discounts and quality. Usagepolicy related concepts that allow providers e.g. to forbid commercial usage oftheir service are not considered. The taxonomy itself is not concerned with the
120 Sebastian Speiser, Rudi Studer, and Thomas Dreier
specification of service policies but delivers a vocabulary for common aspects ofservices.
The taxonomy of O’Sullivan was modeled as WSML ontologies and used torepresent NFPs in WSMO (Toma and Foxvog, 2006). Originally WSMO supportedannotations like creator or title adapted from Dublin Core to describe non-functionalproperties of ontology elements. With the integration of the O’Sullivan NFP conceptsand the extension of WSMO models to include rule-based definitions of NFPs forservices, the approach is now able to describe expressive NFP offers in terms of thedefined ontologies. The proposed ontologies can serve as a formal vocabulary tomodel restrictions in our approach.
Web service policy languages can be used to define quality guarantees andalso user requirements. For example WS-Policy can specify with assertions whichtechnologies users have to support, e.g. encryption (W3C, 2007). Assertions aredefined in different WS-* standards which cover technical domains but no usagerights and restrictions. Furthermore the semantics of language constructs thatcombine several assertions are not clearly specified and thus can lead to ambiguities.
Formalized usage policies exist for digital objects such as e-books and musicfiles. The RDF serialization of the Creative Commons licenses can be used forautomatic determination of associated rights (Abelson et al., 2008). This is used byGoogle’s advanced search9, where users can specify their desired Creative Commonslicense and only documents that were annotated correspondingly by their owner arereturned. However Creative Commons is mainly suitable for open contents, as thelicenses are generally addressed to the public and do not specify rights for singleusers. Another point is that commercial usage can be allowed but no specific terms(e.g. price) can be expressed. Thus the Creative Commons licenses, can be regardedas a subset of our proposed usage policies. The standard building blocks of ourproposed approach are inspired by Creative Commons, and we plan to enable reuseof their existing blocks.
In the area of digital rights management (DRM), there exist several rights expres-sion languages (REL), e.g. ODRL (Iannella, 2002) and XrML (Wang et al., 2002).These are XML based languages that allow more complex right specifications thanCreative Commons. In theory existing RELs would be a good basis for serviceusage policies, however the mentioned RELs include language elements that go farbeyond rights expression. They handle encryption, media encodings, user authen-tication and other domain-specific aspects. These are represented as syntacticallydefined XML elements and a meaning has to be given in the corresponding standardspecifications (e.g. ODRL). Also they are lacking formal semantics which leads toambiguities in scenarios with heterogeneous providers.
This problem is also recognized by Jamkhedkar et al. who present a DRMarchitecture that separates rights expression from other aspects (Jamkhedkar andHeileman, 2009). They propose that there is a need for a core REL which is based on
9 http://www.google.com/advanced search
Requirements for Formalizing Usage Policies of Web Services 121
a logical foundation (Jamkhedkar and Heileman, 2008). We share this thought andhave split the usage description model and the formalism for specifying policies. Incontrast to our work, Jamdkhedkar et al. do not consider usability and thus employa complex formalism that also prevents the specification of restrictions on otherpolicies.
Arnab and Hutchison (2007) present LiREL which is a formal REL. They showwhat the difference to classical access control is and what the resulting requirementsfor an REL are. LiREL focuses on the expression of rights and requires an externalstandardized vocabulary for the definition of actions, constraints, etc. This is incontrast to our planned solution which relies on extendable ontologies and ontologymappings rather than trying to build a closed standard vocabulary that covers alldomains and has to be used by all providers and users.
Gangadharan et al. (2008) developed an ODRL profile for service licenses (ODRL-S). As a service license they define regulations concerning the use of a service. Thisis a similar concept to our proposed usage policies, however their approach definesa static vocabulary of actions, including composition or attribution. This regulatesthe general usage of the service but does not incorporate context information, e.g.this means that generally composition can be forbidden but there is no way tospecify that composition is allowed with specific other services or providers. Alsothe policy does not refer to the output data of services. The lack of clear semanticsis inherited from ODRL. The interpretation of licenses relies on information such as:composition is a special case of derivation. This hierarchy is however not modeledformally, so that it has to be implemented manually in every program that reasonsabout service licenses.
The thesis of Lamparter (2007) presents a policy-based approach for serviceoffers, requests and contracts for Web service markets using ontologies to matchdifferent provider vocabularies. The approach models functions ranging over non-functional properties of Web services. The functions are used to compactly representpolicies that map configurations of NFPs to numerical values. Users specify theirvaluation of configurations and providers their prices. The policies are then used tofind the optimal configuration with respect to the difference of user valuation andprice. Lamparter identifies the allowed use of information returned by services as arelevant NFP. Our approach can be used as a NFP representation in Lamparter’sapproach and thus enabling a usage policy aware market mechanism.
Accountability in RDF (AIR) is a policy language based on RDF, extended withformulas using quantified variables that can be used as conditions in nested if-then-else rules (Kagal et al., 2008). It supports justifications based on user-givenlabels, which inspired us to support them in our approach. In fact we evaluatedthe possibility of using AIR as a general purpose policy language as foundationfor our approach and supplement it with usage models. However, currently thesemantics of the variables and the rules are not formally defined, and therefore theinterpretation of policies is dependent on its existing implementation. This violates
122 Sebastian Speiser, Rudi Studer, and Thomas Dreier
the requirement interoperability and makes it unsuitable for extending the languagewith features that we require, such as introducing restrictions on other policies.
The traditional access control model is the access control matrix, which specifieswhether a specific action on a specific object by a specific subject is allowed or not(Lampson, 1971). Most access control approaches like role based access control donot explicitly state the matrix but can be reduced to it. Park and Sandhu (2004) breakwith this model and present the UCONABC approach for usage control which notonly regulates the access to resources but also their further usage (Park and Sandhu,2002). Their model includes obligations on the user side and mutable subjectand object attributes that have influence on user rights after the initial access to aresource was granted, e.g. an object can only be printed twice. Parker et al. observethat DRM, privacy policies and access control are developed independently despitetheir similarity and propose the UCONABC model as a theoretical foundation forthe mentioned wide range of application areas (Park and Sandhu, 2004). The modelhas received broad attention, but views usage control from another perspectiveas our approach. UCONABC regulates access requests and the following ongoingusage at the time they occur. In contrast, our proposed solution is able to classifydescriptions of usage situations, that can be instantiated many times.
7 Conclusions and Future Work
In this paper we motivated the need for formalized usage policies. We conducted anextensive requirements analysis based both on technical aspects and on the usagerestrictions of existing services. The two overarching goals of formal usage policiesare: (i) being able to build tools that make it easier for users to adhere to usagerestrictions than to break them, and (ii) supporting providers to make their servicesand data available in open markets, without having to fear that they give up alltheir rights and commercial interests.
Based on the requirements analysis, we proposed conceptual decisions how theusage policy formalism should be designed. We showed how the proposed solutionfulfills the requirements postulated before. Namely the decisions are: (i) developan RDF model of usage contexts, (ii) design policies as SPARQL queries on thismodel, and (iii) foster user-given query groupings and labels for policy decisionjustification. We also presented some initial ideas for the repeated usage situationspart of usage policies, but left the decision open for the future.
We gave an comprehensive overview of related works, and showed how theydiffer from our approach and only partially fulfill our stated requirements.
Furthermore we outlined legal aspects of the proposed solution. We coveredquestions about the legal foundation, possible legal restrictions on policies, liabilities,and the protection of policy clauses by intellectual property rights.
As future work we plan to develop a usage policy language and engine, basedon the design decisions, proposed in this paper. Based thereon we will evaluate
Requirements for Formalizing Usage Policies of Web Services 123
our approach by formalizing usage restrictions of existing Web services and testingthe usability of policy-aware tools. Thus we can check, if our two main goals arereached, i.e. if service providers can express their interests adequately and if userscan adhere to usage restrictions more easily with the help of tools.
References
Abelson, H., B. Adida, M. Linksvayer, and N. Yergler (2008): “ccREL: The CreativeCommons Rights Expression Language,” working paper, Creative Commons,available at http://creativecommons.org/projects/ccREL.
Agarwal, S. (2007): Formal Description of Web Services for Expressive Matchmaking,Ph.D. thesis, Universitat Karlsruhe (TH), Institut AIFB.
Agarwal, S. and B. Sprick (2005): “Specification of Access Control and CertificationPolicies for Semantic Web Services,” in: E-Commerce and Web Technologies, pp.348–357.
Arnab, A. and A. Hutchison (2007): “Persistent Access Control: A Formal Modelfor DRM,” in: ACM Workshop on Digital Rights Management, pp. 41–53.
Blau, B., T. Conte, and C. van Dinther (2009a): “A Multidimensional ProcurementAuction for Trading Composite Services,” Issue in the Electronic Commerce Researchand Applications Elsevier Journal on: Emerging Economic, Strategic and Technical Issuesin Online Auctions and Electronic Market Mechanisms.
Blau, B., J. Kramer, T. Conte, and C. van Dinther (2009b): “Service Value Networks,”in: Proceedings of the 11th IEEE Conference on Commerce and Enterprise Computing,Vienna, Austria, pp. 194–201.
Erl, T. (2007): SOA: Principles of Service Design, Prentice Hall Press, Upper SaddleRiver, NJ, USA.
Gangadharan, G. R., V. D’Andrea, and M. Weiss (2008): “Service Licensing Compo-sition and Compatibility Analysis,” Int. J. Cooperative Inf. Syst., 17(3), pp. 301–317.
Iannella, R. (2002): “Open Digital Rights Language (ODRL) Version 1.1,” W3C Note,available at http://www.w3.org/TR/odrl/.
Jamkhedkar, P. A. and G. L. Heileman (2008): “A Formal Conceptual Model forRights,” in: Digital Rights Management Workshop (DRM), pp. 29–38.
Jamkhedkar, P. A. and G. L. Heileman (2009): “Digital Rights Management Archi-tectures,” Comput. Electr. Eng., 35(2), pp. 376–394.
Kagal, L., C. Hanson, and D. Weitzner (2008): “Using Dependency Tracking toProvide Explanations for Policy Management,” in: 2008 IEEE Workshop on Policiesfor Distributed Systems and Networks, pp. 54–61.
Lamparter, S. (2007): Policy-based Contracting in Semantic Web Service Markets, Ph.D.thesis, Universitat Karlsruhe (TH), Institut AIFB.
Lampson, B. W. (1971): “Protection,” in: Proc. Firth Princeton Symposium on Infor-mation Sciences and Systems, Princeton University, pp. pp. 437–443, reprinted inOperating Systems Review, 8,1, January 1974, pp. 18 – 24.
124 Sebastian Speiser, Rudi Studer, and Thomas Dreier
Meyer, O. (2008): Aktuelle vertrags- und urheberrechtliche Aspekte der Erstellung, desVertriebs und der Nutzung von Software, Ph.D. thesis, University of Karlsruhe.
Ng, I. C. (2007): The Pricing and Revenue Management of Services: a Strategic Approach,Routledge Advances in Management and Business Studies.
O’Sullivan, J. (2006): Towards a Precise Understanding of Service Properties, Ph.D. thesis,Queensland University of Technology.
Park, J. and R. Sandhu (2002): “Towards Usage Control Models: Beyond Tradi-tional Access Control,” in: ACM Symp. on Access Control Models and Technologies(SACMAT’02).
Park, J. and R. Sandhu (2004): “The UCONABC Usage Control Model,” ACM Trans.Inf. Syst. Secur., 7(1), pp. 128–174.
Roman, D., U. Keller, H. Lausen, J. de Bruijn, R. Lara, M. Stollberg, A. Polleres,C. Feier, C. Bussler, and D. Fensel (2005): “Web Service Modeling Ontology,”Applied Ontology, 1(1), pp. 77–106.
Speiser, S., B. Blau, S. Lamparter, and S. Tai (2008): “Formation of Service ValueNetworks for Decentralized Service Provisioning,” in: Proceedings of the 6th Inter-national Conference on Service Oriented Computing (ICSOC).
Sycara, K., M. Paolucci, A. Ankolekar, and N. Srinivasan (2003): “AutomatedDiscovery, Interaction and Composition of Semantic Web Services,” Journal of WebSemantics, 1, pp. 27–46.
Toma, I. and D. Foxvog (2006): “Non-Functional Properties in Web Services,” work-ing paper D28.4 v0.1, WSMO Working Draft.
W3C (2004a): OWL-S: Semantic Markup for Web Services, W3C Member Submission,available at http://www.w3.org/Submission/OWL-S/.
W3C (2004b): Resource Description Framework (RDF): Concepts and Abstract Syntax,W3C Recommendation, available at http://www.w3.org/TR/rdf-concepts/.
W3C (2007): Web Services Policy 1.5 - Framework, W3C Recommendation, available athttp://www.w3.org/TR/ws-policy/.
W3C (2008): SPARQL Query Language for RDF, W3C Recommendation, available athttp://www.w3.org/TR/rdf-sparql-query/.
Wang, X., G. Lao, T. Demartini, H. Reddy, M. Nguyen, and E. Valenzuela (2002):“XrML - eXtensible rights Markup Language,” in: ACM workshop on XML security(XMLSEC’02).
A Feature-based Application Interface for FutureNetworks
Helge Backhaus and Martina Zitterbart
Institute of Telematics, KITbackhaus, [email protected]
1 Introduction
The Internet is considered to be one of the most important inventions in the historyof information technologies since the introduction of letterpress printing. Serviceslike E-Mail, file transfers, and the World Wide Web have become a part of everydaylife. Services traditionally provided by dedicated networks like cable television,telephony, and radio are becoming more and more available via the Internet, throughnew services such as VoIP, IPtv, and online radio.
Theoretically it is possible for any two devices to exchange information via theInternet regardless of their current position. In order to enable all kinds of differentdevices such as cell phones, laptops, or for example cars to communicate with eachother, some kind of protocol is needed. In the Internet several protocols define theform of exchanged data, and regulate how this data is exchanged.
Historically a relatively small number of protocols emerged, with TCP (transmis-sion control protocol) respectively UDP (user datagram protocol) and IP (internetprotocol) being the most prominent ones. Nearly all applications and servicesoffered via the Internet today are somehow based on these protocols.
Over time the need for several enhancements to this initially simple set ofprotocols arose. Originally designed to connect stationary devices like desktopPCs, we have to deal with mobility today. There are cell phones and other mobiledevices, which change their location and thereby their Internet access point. Anotherexample would be security in general. Security mechanisms are often just tackedon instead of being properly integrated into today’s Internet protocol stack. Viruses,worms, phishing, and spyware pose a serious threat for inexperienced Internet userstoday and we experience a constant arms race between malware developers andsecurity solutions providers.
Many new applications, like social networks, online data storage accessible fromeverywhere, or online gaming for instance, put further demands on the currentInternet architecture, which have become increasingly difficult to meet. This willbecome even worse in the future. With scenarios like car-2-car communication or
126 Helge Backhaus and Martina Zitterbart
pervasive computing on the horizon, there will be all kinds of new devices withonline access.
2 Architectural Problems
Today we are facing a multitude of problems within the current Internet architecture,some of which are described in Why the Internet only just works[Handley (2006)].These stem mainly from the fact that the Internet core protocols have not significantlychanged since the early nineties. Many changes occurred on the physical layer,considering the introduction of several new wireless standards in the field of mobiledevices for instance. Above that however it is basically all TCP/IP.
Some problems are more deeply rooted within the Internet architecture and itscore protocols.
2.1 Address space exhaustion
In today’s Internet a hosts network interface is reachable via an IPv4 address.Every host participating in an IP-based network like the Internet, needs a uniqueIP address in order to receive and send data packets from or to other hosts inthe network. Since the early 1990s it has become apparent, that the Internet willeventually run out of IP addresses. This has been delayed by introducing ClasslessInter-Domain Routing (CIDR) in 1993 and the rise of network address translation(NAT) later on. NAT is used to connect (private) subnetworks with the Internet, byallowing the usage of several private IP addresses behind one public IP address.This is achieved through rewriting the IP address information for incoming oroutgoing connections. Today NAT is considered to be rather harmful. It does notsolve the address space exhaustion problem but instead just conceals it. Despite allefforts it is still assumed, that IPv4 addresses will run out in 2012.
With IPv6 on the horizon and IPv6 support in most major operating systems, thisproblem might be solved in the near future. Yet widespread adoption of IPv6 isstill lacking. A study conducted by Google1 in 2008 concluded, that less than onepercent of the Internet’s hosts was reachable via IPv6. This is also a prime exampleof how rigid the structure of today’s Internet is. IPv6 was first proposed in 1998over 10 years ago, and thus took a long time to develop and establish. In generalit has become elaborate to change core parts of todays’s Internet, as most of ourinfrastructure today is dependent on the Internet. Future network architecturestherefore should foster a flexible replacement of different components withoutcompromising the robustness of the Internet itself.
2.2 Mobility
Another problem is lacking support for mobile devices like laptops or mobile phones.Due to their nature those devices are often used to access the Internet on the go via1 http://www.ripe.net/ripe/meetings/ripe-57/presentations/thursday.html
A Feature-based Application Interface for Future Networks 127
wireless connections. Mobility refers to the fact that while communicating, a devicecan migrate from the reception area of one wireless network to another. The sameapplies for mobile phones, while moving through different radio cells. In such casesthe connection is normally lost for a short time and has to be re-established, oftenaccompanied by an IP address change. Today applications are mostly designed tobe delay and loss tolerant, to compensate for regular reconnects. On a connectionloss applications pretend to still be connected. Data to be sent is cached, whilere-establishing the connection in the background, so that the user does not noticeany unwanted behavior. With the possibility of support for VoIP and IPtv on mobiledevices, in the future a more transparent, and application independent way ofhandling handovers is desirable.
2.3 ID/Locator split
Both of the aforementioned issues are part of an additional problem. Even with IPv6,an IP address always specifies a location and at the same time serves as an uniqueidentifier. In today’s Internet this is sufficient, as most applications are designedin a way that a specific resource is expected to be found at a specific location. Inthe future however, it might be possible to address specific content directly. Acircumstance described by the lately coined term Content centric Networking2. Insuch a scenario it is conceivable, that an actual resource like an online video or awebpage, may be available on multiple host e.g. locations. Also one host may holdmany resources, which should be directly accessible via unique identifiers. Finallyit is possible, that one resource changes its location. In all of these cases, specificcontent should still be available via the same identifier.
A solution to this problem is often called ID/Locator split. In the future a newaddressing scheme, which offers a dynamic association between an objects identifierand one of its current locations, is very likely. Today this is mainly achieved bysearch engines like Google, as most Internet users rely on them for finding certainresources quickly. Even with IPv6 there is however no immanent support for anID/Locator split in today’s Internet architecture.
3 The Future Internet
One core issue within the scope of Internet development and advancement, asidefrom fixing current short and long term problems, is to specify and anticipate whatthe Internet of tomorrow might look like. It is important to assess though, that thereexists no such thing as one Future Internet. Rather several national and internationalresearch initiatives exist, which try to overcome the shortcomings of and improvethe current Internet architecture. These are often summarized under the term FutureInternet. Our understanding is that instead of one network, there will be manydifferent networks in the future, with many heterogenous devices.
2 http://mmlab.snu.ac.kr/courses/2007 advanced internet/papers/20071010 1.pdf
128 Helge Backhaus and Martina Zitterbart
Currently the Internet operates according to the best-effort paradigm. For apacket switched network this means, incoming data-packets are forwarded as longas there are enough free resources. Theoretically every Internet user is able toutilize the maximum bandwidth provided by his network access. There are howeverno guarantees regarding the actual provided bandwidth or any delays before adata-packet is delivered. Neither is there a guarantee, that a data-packet reaches itsdestination at all.
The best-effort paradigm is however mitigated by higher level protocols likeTCP, which enable reliable delivery of data-packets by retransmitting lost packets.In addition multiple quality of service mechanisms like IP differentiated services3
(DiffServ) or IP integrated services4 (IntServ) exist. None of them was however ableto achieve a widespread distribution thus far. Still the need for quality of servicesupport is constantly growing, as more new applications emerge, which could profitfrom quality of service mechanisms.
Instead of integrating existing or new quality of service approaches into thecurrent Internet architecture, we envision a Future Internet consisting of manydifferent networks, specifically suited for single applications or services. Onestep towards such service tailored networks is to provide an architecture andenvironment, which allows for easy creation and deployment of new networks.Network virtualization[Schaffrath et al. (2009)][Chowdhury and Boutaba (2010)]is regarded to be one key technology towards achieving this goal, by providinga flexible virtual infrastructure, which abstracts from the underlying physicalinfrastructure.
On the other hand different protocols are needed to control, how data is ex-changed in different networks. Within the scope of the projects 4Ward5 and GLab6 aNode Architecture was developed, which aims at providing a flexible environmentfor concurrently running different network architectures, each with its own setof protocols. Also tools were developed, which aid protocol designers with thecreation and deployment of new protocols.
4 The Node Architecture
A simplified version of the Node Architecture is shown in figure 1. The Node Architec-ture is intended to work on end-nodes. The main goal is to provide a protocol-stackindependent framework to connect applications and network interfaces. Instead ofbeing bound to a certain set of protocols, it provides the option to run a multitudeof future protocols and applications side-by-side. It hides the actual protocol-stackfrom the application and provides a generic interface, which connects applications
3 http://tools.ietf.org/html/rfc24744 http://tools.ietf.org/html/rfc16335 http://www.4ward-project.eu6 http://www.german-lab.de
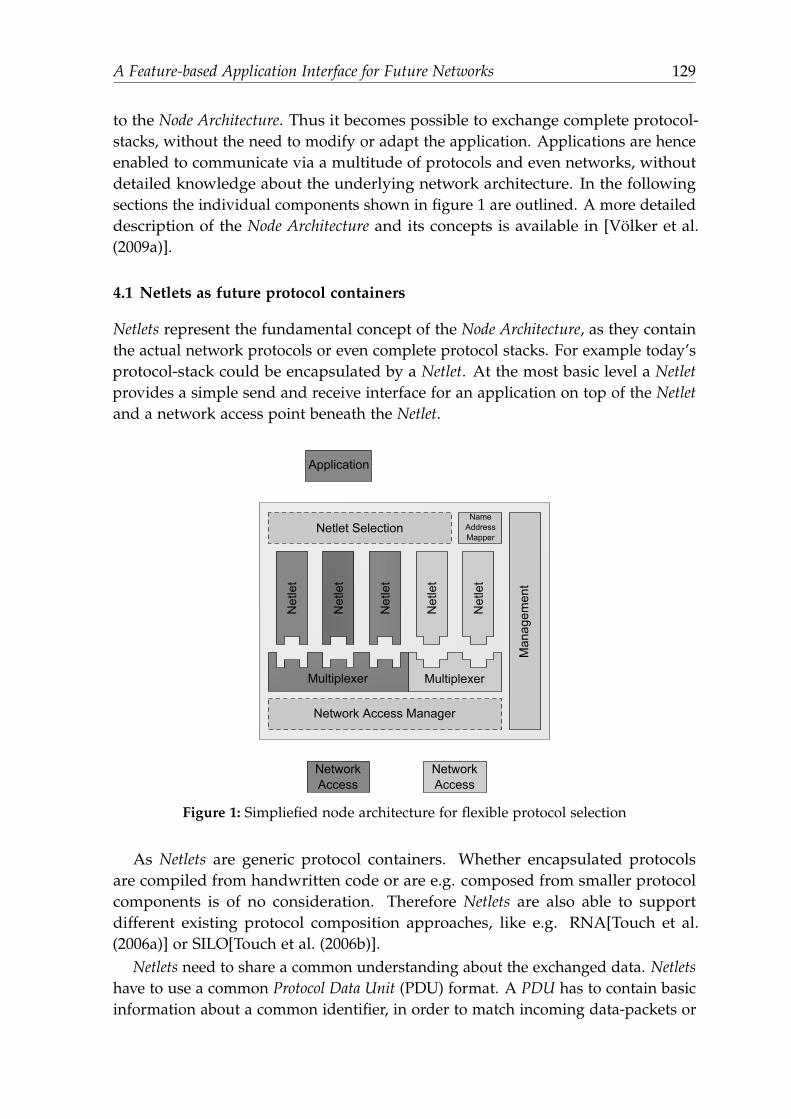
A Feature-based Application Interface for Future Networks 129
to the Node Architecture. Thus it becomes possible to exchange complete protocol-stacks, without the need to modify or adapt the application. Applications are henceenabled to communicate via a multitude of protocols and even networks, withoutdetailed knowledge about the underlying network architecture. In the followingsections the individual components shown in figure 1 are outlined. A more detaileddescription of the Node Architecture and its concepts is available in [Volker et al.(2009a)].
4.1 Netlets as future protocol containers
Netlets represent the fundamental concept of the Node Architecture, as they containthe actual network protocols or even complete protocol stacks. For example today’sprotocol-stack could be encapsulated by a Netlet. At the most basic level a Netletprovides a simple send and receive interface for an application on top of the Netletand a network access point beneath the Netlet.
Application
Netlet SelectionName
AddressMapper
Man
agem
ent
Net
let
Net
let
Net
let
Net
let
Net
let
Network Access Manager
Multiplexer
NetworkAccess
NetworkAccess
Multiplexer
Figure 1: Simpliefied node architecture for flexible protocol selection
As Netlets are generic protocol containers. Whether encapsulated protocolsare compiled from handwritten code or are e.g. composed from smaller protocolcomponents is of no consideration. Therefore Netlets are also able to supportdifferent existing protocol composition approaches, like e.g. RNA[Touch et al.(2006a)] or SILO[Touch et al. (2006b)].
Netlets need to share a common understanding about the exchanged data. Netletshave to use a common Protocol Data Unit (PDU) format. A PDU has to contain basicinformation about a common identifier, in order to match incoming data-packets or
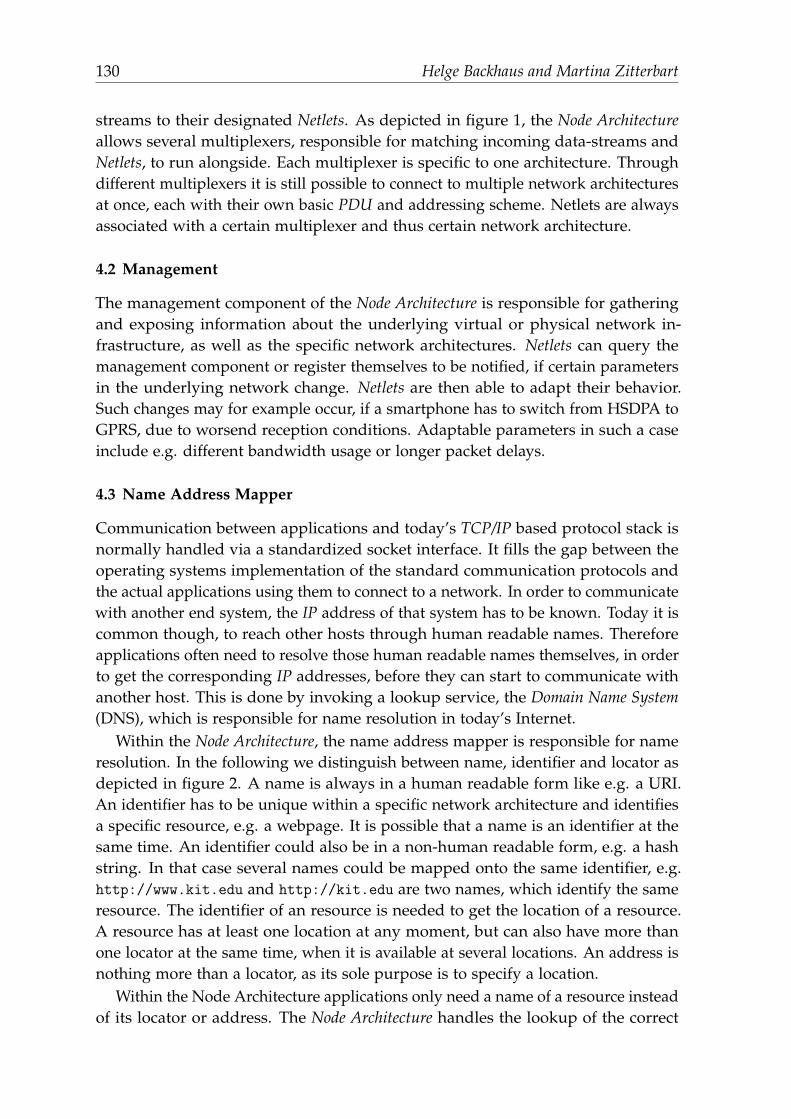
130 Helge Backhaus and Martina Zitterbart
streams to their designated Netlets. As depicted in figure 1, the Node Architectureallows several multiplexers, responsible for matching incoming data-streams andNetlets, to run alongside. Each multiplexer is specific to one architecture. Throughdifferent multiplexers it is still possible to connect to multiple network architecturesat once, each with their own basic PDU and addressing scheme. Netlets are alwaysassociated with a certain multiplexer and thus certain network architecture.
4.2 Management
The management component of the Node Architecture is responsible for gatheringand exposing information about the underlying virtual or physical network in-frastructure, as well as the specific network architectures. Netlets can query themanagement component or register themselves to be notified, if certain parametersin the underlying network change. Netlets are then able to adapt their behavior.Such changes may for example occur, if a smartphone has to switch from HSDPA toGPRS, due to worsend reception conditions. Adaptable parameters in such a caseinclude e.g. different bandwidth usage or longer packet delays.
4.3 Name Address Mapper
Communication between applications and today’s TCP/IP based protocol stack isnormally handled via a standardized socket interface. It fills the gap between theoperating systems implementation of the standard communication protocols andthe actual applications using them to connect to a network. In order to communicatewith another end system, the IP address of that system has to be known. Today it iscommon though, to reach other hosts through human readable names. Thereforeapplications often need to resolve those human readable names themselves, in orderto get the corresponding IP addresses, before they can start to communicate withanother host. This is done by invoking a lookup service, the Domain Name System(DNS), which is responsible for name resolution in today’s Internet.
Within the Node Architecture, the name address mapper is responsible for nameresolution. In the following we distinguish between name, identifier and locator asdepicted in figure 2. A name is always in a human readable form like e.g. a URI.An identifier has to be unique within a specific network architecture and identifiesa specific resource, e.g. a webpage. It is possible that a name is an identifier at thesame time. An identifier could also be in a non-human readable form, e.g. a hashstring. In that case several names could be mapped onto the same identifier, e.g.http://www.kit.edu and http://kit.edu are two names, which identify the sameresource. The identifier of an resource is needed to get the location of a resource.A resource has at least one location at any moment, but can also have more thanone locator at the same time, when it is available at several locations. An address isnothing more than a locator, as its sole purpose is to specify a location.
Within the Node Architecture applications only need a name of a resource insteadof its locator or address. The Node Architecture handles the lookup of the correct
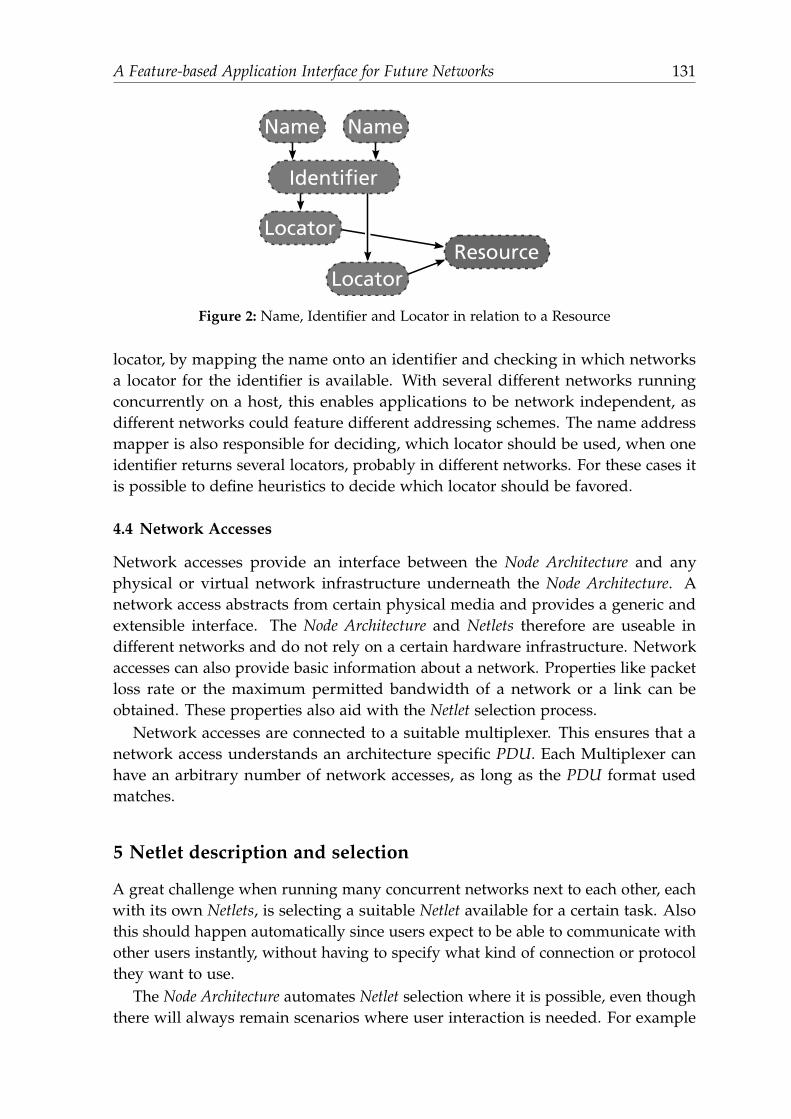
A Feature-based Application Interface for Future Networks 131
Resource
Name Name
Identifier
Locator
Locator
Figure 2: Name, Identifier and Locator in relation to a Resource
locator, by mapping the name onto an identifier and checking in which networksa locator for the identifier is available. With several different networks runningconcurrently on a host, this enables applications to be network independent, asdifferent networks could feature different addressing schemes. The name addressmapper is also responsible for deciding, which locator should be used, when oneidentifier returns several locators, probably in different networks. For these cases itis possible to define heuristics to decide which locator should be favored.
4.4 Network Accesses
Network accesses provide an interface between the Node Architecture and anyphysical or virtual network infrastructure underneath the Node Architecture. Anetwork access abstracts from certain physical media and provides a generic andextensible interface. The Node Architecture and Netlets therefore are useable indifferent networks and do not rely on a certain hardware infrastructure. Networkaccesses can also provide basic information about a network. Properties like packetloss rate or the maximum permitted bandwidth of a network or a link can beobtained. These properties also aid with the Netlet selection process.
Network accesses are connected to a suitable multiplexer. This ensures that anetwork access understands an architecture specific PDU. Each Multiplexer canhave an arbitrary number of network accesses, as long as the PDU format usedmatches.
5 Netlet description and selection
A great challenge when running many concurrent networks next to each other, eachwith its own Netlets, is selecting a suitable Netlet available for a certain task. Alsothis should happen automatically since users expect to be able to communicate withother users instantly, without having to specify what kind of connection or protocolthey want to use.
The Node Architecture automates Netlet selection where it is possible, even thoughthere will always remain scenarios where user interaction is needed. For example
132 Helge Backhaus and Martina Zitterbart
Netlet Selection
Man
agem
ent
Net
let
Application
Feature
Requests
Provided
Features
User Admin
NetworkAccess
NetworkAccess
Provided
Features
Provided
Features
Resources
Resource
Requests
Feature
Requests
Feature
Requests
Provided
Features
Resources
Figure 3: Features and requirements affecting protocol selection
when a certain Netlet’s usage is associated with immediate costs for the user. Figure3 illustrates the role of different Node Architecture components during the process ofselecting a Netlet. Network accesses expose technical properties, like e.g. bandwidthor the support for secure communication. The management component exposesfeatures, which have to be measured. The current packet loss rate or the experiencedpacket delay to another host for example.
As Netlets contain the actual communication protocols, they can provide all kindsof different services. Features like reliable transport, error detection and correctionmechanisms, routing, or security are common of today’s TCP/IP based protocolstack. In the future however Netlets may also have additional features like dataprivacy, validity of delivered content, or access rights management for certain data.
Applications can state their requirements through feature requests, which aNetlet has to meet in order to be a suitable for the users communication needs.These requirements have to be defined by the application’s developer. To makethe task of defining requirements easier, extensible profiles can be predefined forstandard use cases. For application developers, profiles like WWW, distributed filestorage, multimedia data, or a generic reliable transport can be defined. Devicemanufacturers could set up predefined profiles for, e.g., mobile phones, which aretuned for low energy consumption.
Not only applications, but also Netlets can have requirements. A Netlet mightneed a certain set of system resources to work properly. For example a Netlet couldrequire local disk space to store data or have certain energy consumption demands,which have to be met by e.g. a mobile device.
Furthermore the user can formulate additional requirements as a set of featurerequests. These can be defined as a general policy, for a specific application, orper connection. Users could limit the maximum bandwidth an application uses
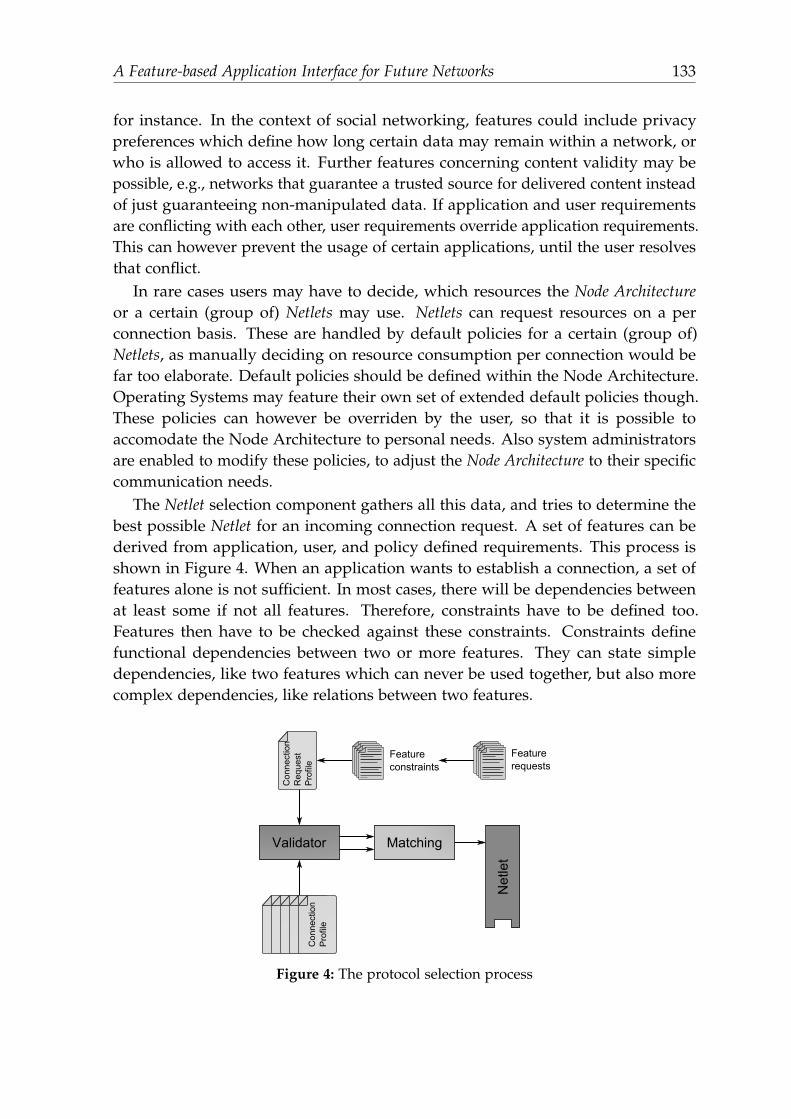
A Feature-based Application Interface for Future Networks 133
for instance. In the context of social networking, features could include privacypreferences which define how long certain data may remain within a network, orwho is allowed to access it. Further features concerning content validity may bepossible, e.g., networks that guarantee a trusted source for delivered content insteadof just guaranteeing non-manipulated data. If application and user requirementsare conflicting with each other, user requirements override application requirements.This can however prevent the usage of certain applications, until the user resolvesthat conflict.
In rare cases users may have to decide, which resources the Node Architectureor a certain (group of) Netlets may use. Netlets can request resources on a perconnection basis. These are handled by default policies for a certain (group of)Netlets, as manually deciding on resource consumption per connection would befar too elaborate. Default policies should be defined within the Node Architecture.Operating Systems may feature their own set of extended default policies though.These policies can however be overriden by the user, so that it is possible toaccomodate the Node Architecture to personal needs. Also system administratorsare enabled to modify these policies, to adjust the Node Architecture to their specificcommunication needs.
The Netlet selection component gathers all this data, and tries to determine thebest possible Netlet for an incoming connection request. A set of features can bederived from application, user, and policy defined requirements. This process isshown in Figure 4. When an application wants to establish a connection, a set offeatures alone is not sufficient. In most cases, there will be dependencies betweenat least some if not all features. Therefore, constraints have to be defined too.Features then have to be checked against these constraints. Constraints definefunctional dependencies between two or more features. They can state simpledependencies, like two features which can never be used together, but also morecomplex dependencies, like relations between two features.
Connection
Request
Profile
Connection
Profile
Featureconstraints
Featurerequests
Validator
Netlet
Matching
Figure 4: The protocol selection process
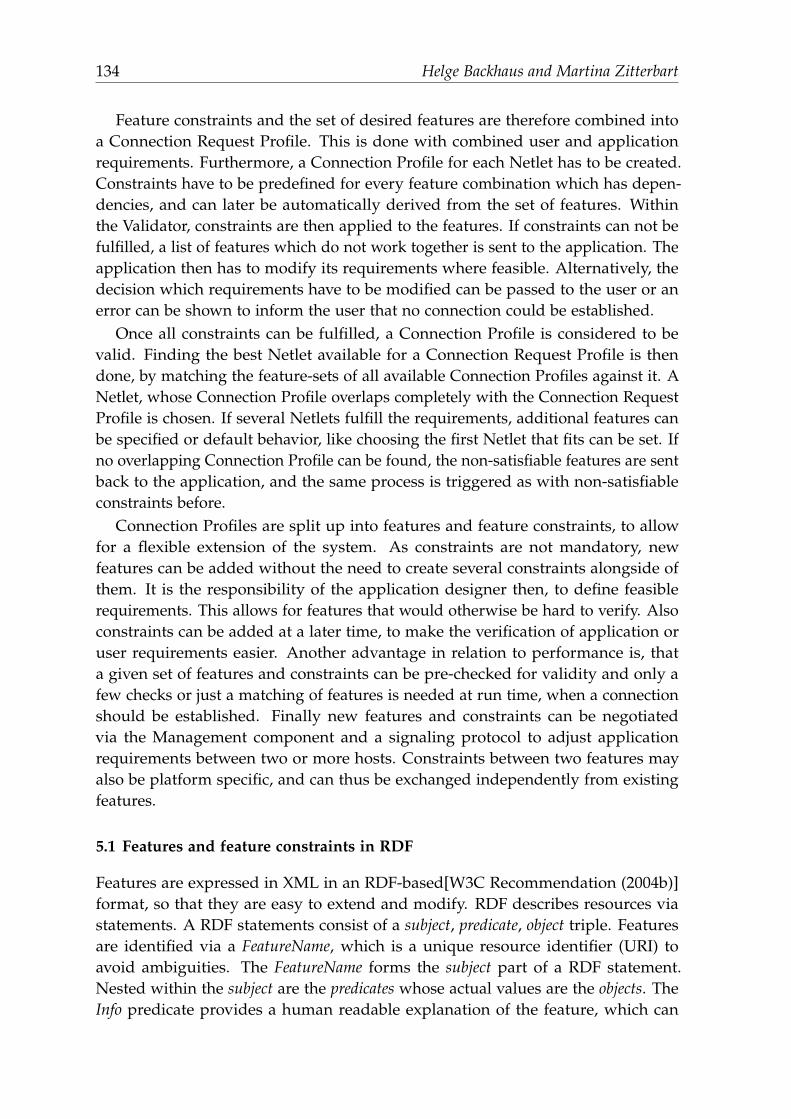
134 Helge Backhaus and Martina Zitterbart
Feature constraints and the set of desired features are therefore combined intoa Connection Request Profile. This is done with combined user and applicationrequirements. Furthermore, a Connection Profile for each Netlet has to be created.Constraints have to be predefined for every feature combination which has depen-dencies, and can later be automatically derived from the set of features. Withinthe Validator, constraints are then applied to the features. If constraints can not befulfilled, a list of features which do not work together is sent to the application. Theapplication then has to modify its requirements where feasible. Alternatively, thedecision which requirements have to be modified can be passed to the user or anerror can be shown to inform the user that no connection could be established.
Once all constraints can be fulfilled, a Connection Profile is considered to bevalid. Finding the best Netlet available for a Connection Request Profile is thendone, by matching the feature-sets of all available Connection Profiles against it. ANetlet, whose Connection Profile overlaps completely with the Connection RequestProfile is chosen. If several Netlets fulfill the requirements, additional features canbe specified or default behavior, like choosing the first Netlet that fits can be set. Ifno overlapping Connection Profile can be found, the non-satisfiable features are sentback to the application, and the same process is triggered as with non-satisfiableconstraints before.
Connection Profiles are split up into features and feature constraints, to allowfor a flexible extension of the system. As constraints are not mandatory, newfeatures can be added without the need to create several constraints alongside ofthem. It is the responsibility of the application designer then, to define feasiblerequirements. This allows for features that would otherwise be hard to verify. Alsoconstraints can be added at a later time, to make the verification of application oruser requirements easier. Another advantage in relation to performance is, thata given set of features and constraints can be pre-checked for validity and only afew checks or just a matching of features is needed at run time, when a connectionshould be established. Finally new features and constraints can be negotiatedvia the Management component and a signaling protocol to adjust applicationrequirements between two or more hosts. Constraints between two features mayalso be platform specific, and can thus be exchanged independently from existingfeatures.
5.1 Features and feature constraints in RDF
Features are expressed in XML in an RDF-based[W3C Recommendation (2004b)]format, so that they are easy to extend and modify. RDF describes resources viastatements. A RDF statements consist of a subject, predicate, object triple. Featuresare identified via a FeatureName, which is a unique resource identifier (URI) toavoid ambiguities. The FeatureName forms the subject part of a RDF statement.Nested within the subject are the predicates whose actual values are the objects. TheInfo predicate provides a human readable explanation of the feature, which can
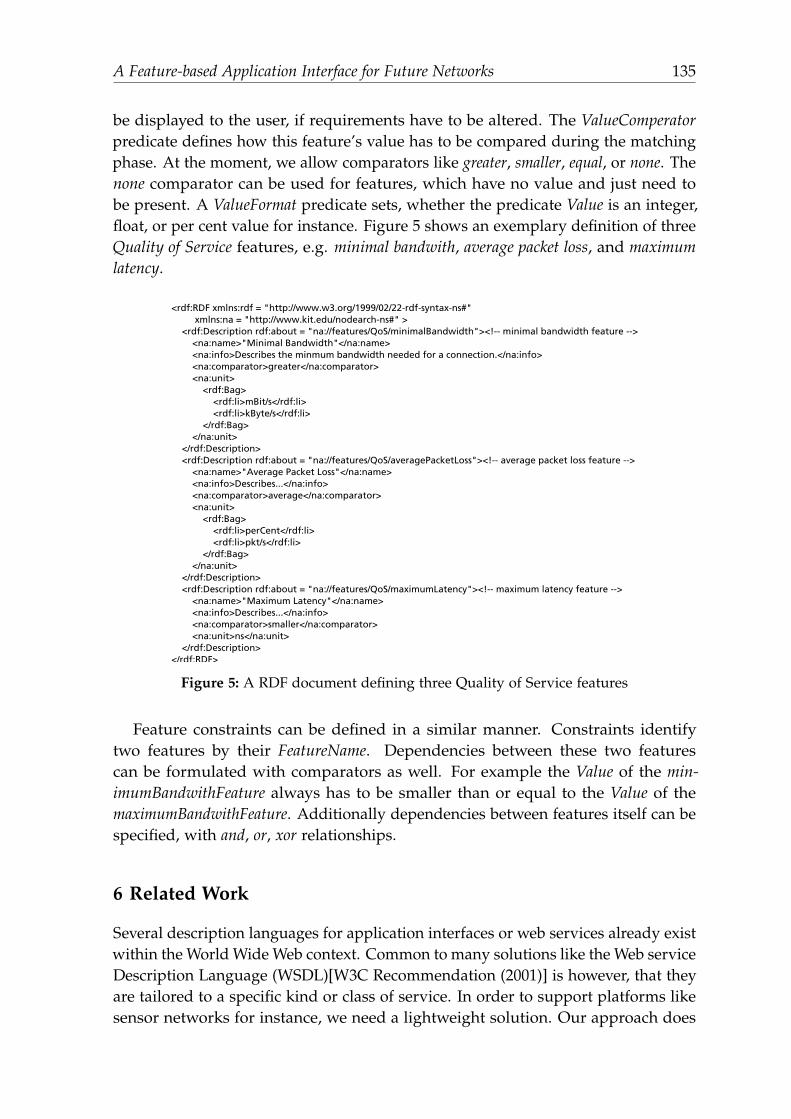
A Feature-based Application Interface for Future Networks 135
be displayed to the user, if requirements have to be altered. The ValueComperatorpredicate defines how this feature’s value has to be compared during the matchingphase. At the moment, we allow comparators like greater, smaller, equal, or none. Thenone comparator can be used for features, which have no value and just need tobe present. A ValueFormat predicate sets, whether the predicate Value is an integer,float, or per cent value for instance. Figure 5 shows an exemplary definition of threeQuality of Service features, e.g. minimal bandwith, average packet loss, and maximumlatency.
<rdf:RDF xmlns:rdf = "http://www.w3.org/1999/02/22-rdf-syntax-ns#" xmlns:na = "http://www.kit.edu/nodearch-ns#" > <rdf:Description rdf:about = "na://features/QoS/minimalBandwidth"><!-- minimal bandwidth feature --> <na:name>"Minimal Bandwidth"</na:name> <na:info>Describes the minmum bandwidth needed for a connection.</na:info> <na:comparator>greater</na:comparator> <na:unit> <rdf:Bag> <rdf:li>mBit/s</rdf:li> <rdf:li>kByte/s</rdf:li> </rdf:Bag> </na:unit> </rdf:Description> <rdf:Description rdf:about = "na://features/QoS/averagePacketLoss"><!-- average packet loss feature --> <na:name>"Average Packet Loss"</na:name> <na:info>Describes...</na:info> <na:comparator>average</na:comparator> <na:unit> <rdf:Bag> <rdf:li>perCent</rdf:li> <rdf:li>pkt/s</rdf:li> </rdf:Bag> </na:unit> </rdf:Description> <rdf:Description rdf:about = "na://features/QoS/maximumLatency"><!-- maximum latency feature --> <na:name>"Maximum Latency"</na:name> <na:info>Describes...</na:info> <na:comparator>smaller</na:comparator> <na:unit>ns</na:unit> </rdf:Description> </rdf:RDF>
Figure 5: A RDF document defining three Quality of Service features
Feature constraints can be defined in a similar manner. Constraints identifytwo features by their FeatureName. Dependencies between these two featurescan be formulated with comparators as well. For example the Value of the min-imumBandwithFeature always has to be smaller than or equal to the Value of themaximumBandwithFeature. Additionally dependencies between features itself can bespecified, with and, or, xor relationships.
6 Related Work
Several description languages for application interfaces or web services already existwithin the World Wide Web context. Common to many solutions like the Web serviceDescription Language (WSDL)[W3C Recommendation (2001)] is however, that theyare tailored to a specific kind or class of service. In order to support platforms likesensor networks for instance, we need a lightweight solution. Our approach does
136 Helge Backhaus and Martina Zitterbart
not require a complex syntax or even full-featured XML parser for its properties,which also makes it easily portable to other languages. The Web Ontology Language(OWL)[W3C Recommendation (2004a)] which is also based on RDF, could be usedin a lite version. OWL comes with a larger vocabulary and stronger syntax thanRDF. Therefore OWL is more powerful in terms of expressiveness. OWL however ismore complex to parse and process. We believe that describing services at a basiclevel is sufficient for protocol selection, as in our context time constraints are alsoan important factor.
7 Conclusion
This paper described an architecture, which is suited for executing parallel networkarchitectures on a single host. It is designed with flexibility and extensibility inmind. We presented a concept for defining requirements for and features of networkprotocols and applications in future networks. The solution aims at recreating thestraightforward and hassle-free experience users have come to expect from today’sInternet, in an environment where several protocols and network architecturesare running concurrently. We achieve flexibility by using an RDF-based format,which is portable and can be converted to other formats. Extensibility is supportedby a design, which fosters the addition of new features and feature constraintsstep-by-step.
Current work focuses on the definition and refinement of requirements and fea-tures. In a next step means are needed to synchronize protocol selection over severalhosts. Therefore some sort of signaling mechanism is needed, to communicateprotocol selection decisions to other network users. Also we want to investigate howour approach can aid in finding the best protocol, in cases where several protocolssatisfy provided requirements equally well. Therefore we want to build upon asolution initially developed for selecting e.g. security mechanisms[Volker et al.(2009b)] and extend it to incorporate our feature descriptions.
References
Chowdhury, N. M. K. and R. Boutaba (2010): “A survey of network virtualiza-tion,” Computer Networks, 54(5), pp. 862 – 876, http://www.sciencedirect.com/science/article/B6VRG-4XKBYY4-4/2/91ac30e6e1c4d24c53d95798a6148f03.
Handley, M. (2006): “Why the Internet only just works,” BT Technology Journal, 24(3),pp. 119–129.
Schaffrath, G., C. Werle, P. Papadimitriou, A. Feldmann, R. Bless, A. Greenhalgh,A. Wundsam, M. Kind, O. Maennel, and L. Mathy (2009): “Network virtualizationarchitecture: proposal and initial prototype,” in: VISA ’09: Proceedings of the 1stACM workshop on Virtualized infrastructure systems and architectures, ACM, NewYork, NY, USA, pp. 63–72.

A Feature-based Application Interface for Future Networks 137
Touch, J. D., Y.-S. Wang, and V. Pingali (2006a): “A Recursive Network Architecture,”in: ISI, Tech. Rep.
Touch, J. D., Y.-S. Wang, and V. Pingali (2006b): “A Recursive Network Architecture,”in: ISI, Tech. Rep.
Volker, L., D. Martin, I. El Khayat, C. Werle, and M. Zitterbart (2009a): “A Node Ar-chitecture for 1000 Future Networks,” in: Proceedings of the International Workshopon the Network of the Future 2009, IEEE, Dresden, Germany.
Volker, L., D. Martin, C. Werle, M. Zitterbart, and I. El Khayat (2009b): “SelectingConcurrent Network Architectures at Runtime,” in: Proceedings of the IEEE Interna-tional Conference on Communications (ICC 2009), IEEE Computer Society, Dresden,Germany.
W3C Recommendation (2001): “Web Services Description Language (WSDL) 1.1,”Available at http://www.w3.org/TR/wsdl.html.
W3C Recommendation (2004a): “OWL Web Ontology Language Semantics andAbstract Syntax,” Available at http://www.w3.org/TR/owl-semantics/.
W3C Recommendation (2004b): “Resource Description Framework (RDF): Conceptsand Abstract Syntax,” Available at http://www.w3.org/TR/rdf-concepts/.


Part III
Analysis of Market Interaction and Behavior

Investigating Auction Fever
Marc T. P. Adam1, Jan Kramer1, Christof Weinhardt1, and Karl-Martin Ehrhart2
1 Institute of Information Systems and Management, KITmarc.adam, kraemer, [email protected]
2 Institute for Economic Theory and Statistics, [email protected]
Summary. Auction fever is a frequently observed phenomenon in traditional and Internetauctions. However, traditional approaches of auction theory often neglect the influenceof emotions. In this paper we discuss a unified framework for emotional bidding in auc-tions and identify challenges for future auction fever research. In particular, we identifyinterdependent utilities and product characteristics as important influencing factors forauction fever, which have only gained little attention in the literature at this stage. Further,methodological approaches for auction fever research are discussed. While a substantialpart of auction fever literature is based on deception of participants, one has to considerfundamental drawbacks of this approach. In contrast, we find that applying physiologicalmeasurements in economic laboratory experiments and auctioning real world commodi-ties is a promising (complementary) approach. Further, letting subjects compete withcomputerized agents seems to be an adequate approach for assessing the importance ofinterdependent utilities.
1 Introduction
Auctions are nowadays a popular and frequently employed market mechanism inelectronic markets. In particular Internet auctions for consumers have turned outto be “one of the greatest success stories of web-based services” (Ariely and Simonson,2003). As the end of 2008, alone the market leader eBay.com reported a total numberof 86.3 million active users worldwide and net revenues of 5.6 billion US dollars(eBay Inc., 2009). In economic literature, the success of Internet auctions has beenlargely attributed to reductions of transaction costs, the large number of potentialbuyers, and the independence of time and space (Ockenfels et al., 2006). However,these characteristics also apply to retail sites as Amazon.com. Further, the popularityof Internet auctions seems somewhat counterintuitive from a consumer perspectiveas several field studies have confirmed that auctions yield on average higher pricescompared to fixed price offers on retail sites (e.g. Lucking-Reiley, 1999; Lee et al.,2009a).
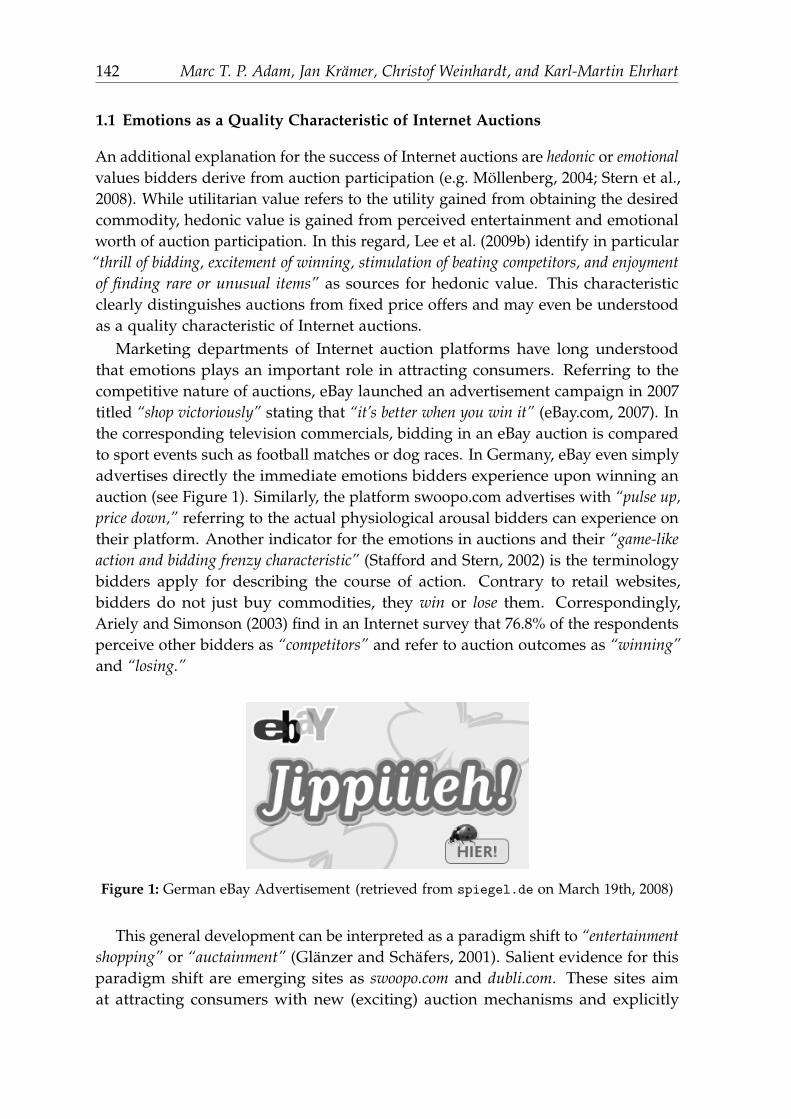
142 Marc T. P. Adam, Jan Kramer, Christof Weinhardt, and Karl-Martin Ehrhart
1.1 Emotions as a Quality Characteristic of Internet Auctions
An additional explanation for the success of Internet auctions are hedonic or emotionalvalues bidders derive from auction participation (e.g. Mollenberg, 2004; Stern et al.,2008). While utilitarian value refers to the utility gained from obtaining the desiredcommodity, hedonic value is gained from perceived entertainment and emotionalworth of auction participation. In this regard, Lee et al. (2009b) identify in particular“thrill of bidding, excitement of winning, stimulation of beating competitors, and enjoymentof finding rare or unusual items” as sources for hedonic value. This characteristicclearly distinguishes auctions from fixed price offers and may even be understoodas a quality characteristic of Internet auctions.
Marketing departments of Internet auction platforms have long understoodthat emotions plays an important role in attracting consumers. Referring to thecompetitive nature of auctions, eBay launched an advertisement campaign in 2007titled “shop victoriously” stating that “it’s better when you win it” (eBay.com, 2007). Inthe corresponding television commercials, bidding in an eBay auction is comparedto sport events such as football matches or dog races. In Germany, eBay even simplyadvertises directly the immediate emotions bidders experience upon winning anauction (see Figure 1). Similarly, the platform swoopo.com advertises with “pulse up,price down,” referring to the actual physiological arousal bidders can experience ontheir platform. Another indicator for the emotions in auctions and their “game-likeaction and bidding frenzy characteristic” (Stafford and Stern, 2002) is the terminologybidders apply for describing the course of action. Contrary to retail websites,bidders do not just buy commodities, they win or lose them. Correspondingly,Ariely and Simonson (2003) find in an Internet survey that 76.8% of the respondentsperceive other bidders as “competitors” and refer to auction outcomes as “winning”and “losing.”
Figure 1: German eBay Advertisement (retrieved from spiegel.de on March 19th, 2008)
This general development can be interpreted as a paradigm shift to “entertainmentshopping” or “auctainment” (Glanzer and Schafers, 2001). Salient evidence for thisparadigm shift are emerging sites as swoopo.com and dubli.com. These sites aimat attracting consumers with new (exciting) auction mechanisms and explicitly
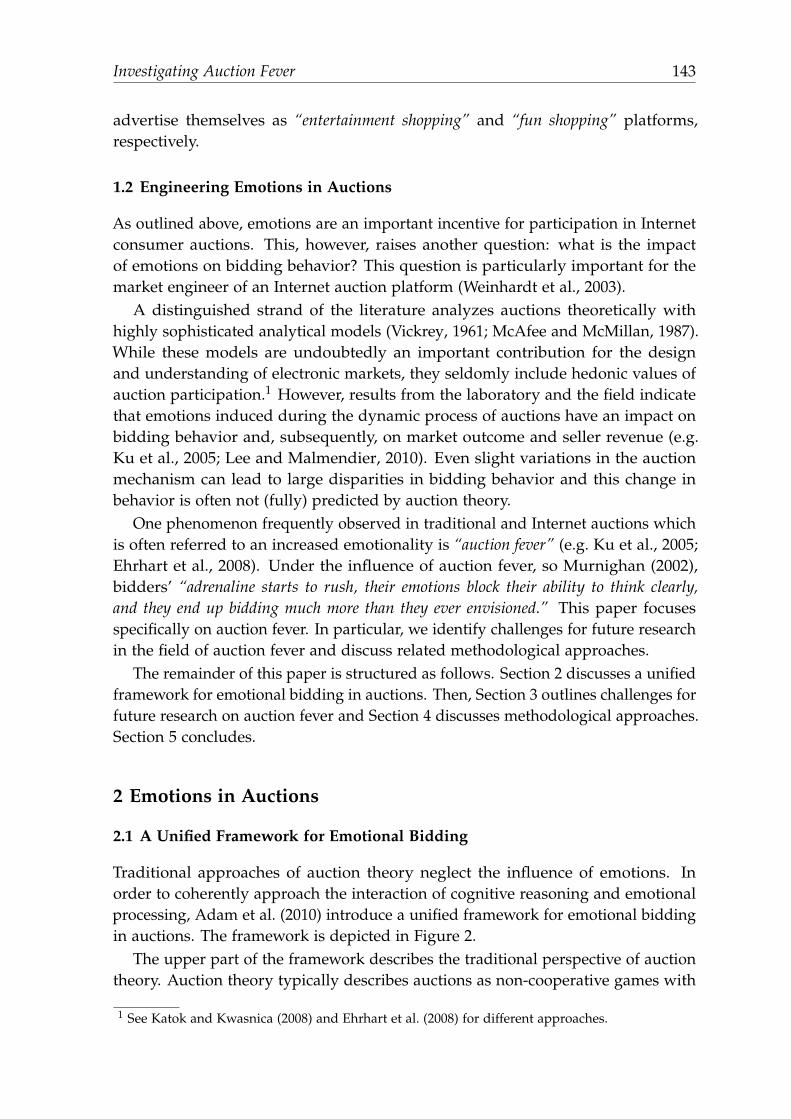
Investigating Auction Fever 143
advertise themselves as “entertainment shopping” and “fun shopping” platforms,respectively.
1.2 Engineering Emotions in Auctions
As outlined above, emotions are an important incentive for participation in Internetconsumer auctions. This, however, raises another question: what is the impactof emotions on bidding behavior? This question is particularly important for themarket engineer of an Internet auction platform (Weinhardt et al., 2003).
A distinguished strand of the literature analyzes auctions theoretically withhighly sophisticated analytical models (Vickrey, 1961; McAfee and McMillan, 1987).While these models are undoubtedly an important contribution for the designand understanding of electronic markets, they seldomly include hedonic values ofauction participation.1 However, results from the laboratory and the field indicatethat emotions induced during the dynamic process of auctions have an impact onbidding behavior and, subsequently, on market outcome and seller revenue (e.g.Ku et al., 2005; Lee and Malmendier, 2010). Even slight variations in the auctionmechanism can lead to large disparities in bidding behavior and this change inbehavior is often not (fully) predicted by auction theory.
One phenomenon frequently observed in traditional and Internet auctions whichis often referred to an increased emotionality is “auction fever” (e.g. Ku et al., 2005;Ehrhart et al., 2008). Under the influence of auction fever, so Murnighan (2002),bidders’ “adrenaline starts to rush, their emotions block their ability to think clearly,and they end up bidding much more than they ever envisioned.” This paper focusesspecifically on auction fever. In particular, we identify challenges for future researchin the field of auction fever and discuss related methodological approaches.
The remainder of this paper is structured as follows. Section 2 discusses a unifiedframework for emotional bidding in auctions. Then, Section 3 outlines challenges forfuture research on auction fever and Section 4 discusses methodological approaches.Section 5 concludes.
2 Emotions in Auctions
2.1 A Unified Framework for Emotional Bidding
Traditional approaches of auction theory neglect the influence of emotions. Inorder to coherently approach the interaction of cognitive reasoning and emotionalprocessing, Adam et al. (2010) introduce a unified framework for emotional biddingin auctions. The framework is depicted in Figure 2.
The upper part of the framework describes the traditional perspective of auctiontheory. Auction theory typically describes auctions as non-cooperative games with
1 See Katok and Kwasnica (2008) and Ehrhart et al. (2008) for different approaches.
144 Marc T. P. Adam, Jan Kramer, Christof Weinhardt, and Karl-Martin Ehrhart
personality & expertise
auction system& environment
biddingstrategy / behavior
auctionevent
auctionoutcome
currentemotional state
immediateemotions
experienced emotions
anticipatedpemotions
Figure 2: Framework for Emotional Bidding in Auctions
incomplete information (Bayesian games) and provides the auction participants witha strategy in order to maximize their expected payoff (e.g. McAfee and McMillan,1987; Krishna, 2002). A strategy is defined as a set of rules, which tells a decisionmaker which action to chose at each instant of the game, given her information set(Rasmusen, 2007). In terms of auctions, a bidding strategy tells a bidder when toplace a bid for what amount, and whether to participate in the auction at all. Oftena particular auction mechanism implicates a set of one or more optimal (symmetric)bidding strategies. In particular, the rather simple auction mechanisms usuallyemployed on Internet auction platforms have this characteristic. Depending on theparticular auction mechanism, the induced bidding strategy results in one or moreauction events, which ultimately end in an auction outcome.
The lower part of Figure 2 describes the interaction of the auction mechanism, bid-ding behavior, auction events, and emotional processing. An emotion can be roughlydefined as a subjectively experienced state that can be described qualitatively and isaccompanied by changes in feeling, physiology, behavior, and expression (Gerrigand Zimbardo, 2007). As pointed out by Loewenstein (2000), emotions can bedistinguished into anticipated and experienced emotions. An anticipated emotionrefers to the expected emotional processing in response to a salient future event, e.g.the end of an auction and the anticipated win or loss. In contrast, an experiencedemotion refers to the actual emotional processing, which comprises both immediateemotions in response to a single stimulus (Loewenstein, 2000) and ongoing currentemotional states (Ding et al., 2005).
Immediate emotions are triggered by auction events and the auction outcome.Auction events comprise for instance the placement of new bids, entry of newbidders, becoming the current high bidder, or being outbidden. The auction outcomeinduces immediate emotions as “joy of winning” and “frustration of losing” (Delgadoet al., 2008). The processing of immediate emotions can be anticipated by biddersthroughout the process of an auction. The set of possible immediate emotions is
Investigating Auction Fever 145
limited by the auction system2. Therefore, some auction mechanisms pronounceemotionality stronger than others. For instance, some auction mechanisms onlyallow for placing a single sealed-bid. These auctions are often referred to as staticauctions. In contrast, dynamic auctions allow bidders for placing multiple bids andobserving the behavior of other bidders. As argued by Gimpel (2007), auction feveris particularly a phenomenon of dynamic auctions.
The terms immediate and anticipated emotion refer to momentary (phasic) re-sponses to a single stimulus. In contrast, a bidder’s current emotional state refersto her ongoing (tonic) emotional processing. As outlined by Ariely and Simonson(2003), the current emotional state of a bidder is influenced by the “frequency andmagnitude of anticipated post-auction feelings.” For instance, frequently anticipating thejoy of winning and frustration of losing can increase a bidder’s tonic level of arousal.But also anticipated and immediate emotions with respect to auction events otherthan the auction outcome have an impact on a bidder’s current emotional state.For instance becoming the current high bidder in an auction and being outbiddenhave been identified as salient events (Ehrhart et al., 2008). However, as indicatedin the framework for emotional bidding, the current emotional state can also bedirectly affected by the employed auction system. For instance, Malhotra et al. (2008)denote that “a ticking clock (...) can overwhelm people with the desire to win,” indicatingthat a high degree of time pressure in auctions can directly increase the bidders’individual level of arousal.
2.2 Auction Fever
The controversy about auction fever is probably as old as auctions. Apparently, legalscholars already debated in ancient Rome whether auctions were void if the winnerwas infected by “bidder’s heat” (Lee and Malmendier, 2010). Based on the frameworkfor emotional bidding, Adam et al. (2010) define auction fever as “a current emotionalstate elicited in the course of one or more auctions that distorts a bidder’s preselected biddingstrategy.” This definition comprises not only overbidding in ascending auctions, butalso underbidding in Dutch auctions, repeated bidding, and other changes in thepreselected bidding strategy.
The definition is based on the assumption that bidders commit themselves to abidding strategy before the auction starts.3 This is in line with the observation of anInternet survey conducted by Ku et al. (2005). The authors report that 82% of thesurvey respondents set themselves a limit prior to bidding.
2 In this paper, an auction system is well defined by the auction mechanism design and the userinterface design.
3 Note that the preselected bidding strategy does not necessarily need to be derived by means ofauction theory. As already observed by Vickrey (1961), some of the bidders may be “insufficientlysophisticated to discern the equilibrium-point strategy.” In a rather behavioral approach, one can arguethat bidders may set themselves a limit by estimating a subjective valuation for the commodityand then heuristically deriving a corresponding bidding strategy (Ariely and Simonson, 2003).
146 Marc T. P. Adam, Jan Kramer, Christof Weinhardt, and Karl-Martin Ehrhart
3 Challenges for Auction Fever Research
Auction fever literature identified in particular perceived competition (e.g. Heymanet al., 2004; Ku et al., 2005), previous investments (Ku, 2008; Park et al., 2008), andperceived ownership (Heyman et al., 2004; Wolf et al., 2005) as elicitors of auctionfever. Further, in Internet auctions the elicitation of auction fever is mediatedthrough the user interface design of the auction system. In this section, two mainchallenges for future auction fever research are identified, which have only gainedlittle focus in the literature at this stage. In particular, we will focus on the role ofinterdependencies in bidders’ utility functions and product characteristics of theauctioned commodities.
3.1 Interdependent Utilities in Auctions
Time pressure, social facilitation, and rivalry have been identified as the maininfluencing factors for the degree of competition bidders perceive in auctions (e.gKu et al., 2005; Malhotra et al., 2008). In the following we focus specifically on socialfacilitation and rivalry.
Social Facilitation and Rivalry
The literature on social facilitation distinguishes two major paradigms: audienceeffects and co-action effects (cf. Zajonc, 1965). Audience effects refer to the influencepassive spectators have on human behavior. In the context of auctions, audienceeffect are elicited by individuals who observe the course of bidding but are notactively participating. For instance, this may be an audience watching a charityauction or the media attention on spectrum license auctions. On the other hand,co-action effects refer to the influence the presence of other individuals has, who arealso engaged in the same activity (cf. Zajonc, 1965). In a live auction, for instance,co-action effects are elicited by the presence of other bidders who are bidding on thesame item and bidders who are merely observing the current auction and actuallywaiting for a specific item following up.
It is important to highlight that audience and co-action effects already occurwithout strategic interaction. Accordingly, social facilitation only refers to thesheer presence of other individuals, i.e. the awareness of being observed by passiveobservers and other bidders. In contrast, the concept of rivalry addresses the factthat bidders are actually competing for obtaining the very same good. Therefore,strategic interaction is a necessary condition for rivalry. Rivalry is an inherentcharacteristic of live and Internet auctions, as “each bidder competes against others whowant the same item” (Stern and Stafford, 2006).
Investigating Auction Fever 147
Interdependencies in Bidders’ Utility Functions
The degree of rivalry increases ceteris paribus with the number of bidders in anauction (Heyman et al., 2004).4 However, rivalry can also get more intense, whena bidder’s utility does not only depend on her own individual monetary gainsand losses, but also on the utilities of other bidders. This concept of utility isusually referred to as “interdependent utilities” (e.g. Schall, 1972; Bault et al., 2008).For instance, subjects may develop personal rivalries with other individuals andperceive feelings of envy or gloating (Smith et al., 1996). In the context of auctions,the literature has identified in particular “spitefulness” and (nonmonetary) “joy ofwinning” as sources for such interdependencies.
A bidder is spiteful, if she derives an additional negative utility when heropponent wins an auction. This negative utility depends on the monetary profit ofthe competitor (cf. Morgan et al., 2003). Morgan et al. (2003) show that symmetricequilibrium bidding becomes more aggressive in various auctions, if bidders arespiteful. Therefore, if an agent’s utility depends on the outcomes of other agents,it can be a (rational) best response to place higher bids. In contrast, a bidderexperiences a nonmonetary joy of winning if she derives an additional positiveutility from the “uniqueness of being first” in the social competition of an auction(Ku et al., 2005). Morgan et al. (2003) refer to this nonmonetary component as the“love of winning.” Although there is not much evidence for love of winning in theliterature (e.g. Andreoni et al., 2007; Delgado et al., 2008), most of these studiesinvestigate sealed-bid auctions. However, there is strong indication to conjecturethat love of winning, and its anticipation, is strongly intertwined with auction fever.As outlined above, auction fever is frequently described as a phenomenon onlyoccurring in dynamic auctions (e.g. Gimpel, 2007; Haruvy and Popkowski Leszczyc,2009).
Immediate emotions induced by the auction outcome are depicted in Figure 3.Assume a single unit auction, in which the auction outcome reveals which bidderobtains the commodity for sale and how much she has to pay for it. If a bidder winsthe auction, she may experience a “joy of winning” (Goeree and Offerman, 2003).This joy does not only comprise her utility from monetary payoffs, but also theutility from winning the social competition inherent in an auction, i.e. the love ofwinning. However, the winner of the auction may at the same time also suffer from“winner regret.” For instance, in a first-price sealed-bid auction, the winner of theauction may still have won the auction by placing a lower bid and, thus, won theauction with a higher monetary payoff (Engelbrecht-Wiggans, 1989). In contrast,if the bidder loses the auction, she can experience “loser regret” from the missedopportunity of achieving a monetary payoff and from losing the social competition(Filiz-Ozbay and Ozbay, 2007). If bidders anticipate joy of winning and loser regret
4 Recall that an increasing number of bidders decreases the expected payoff of each bidder (Vickrey,1961).
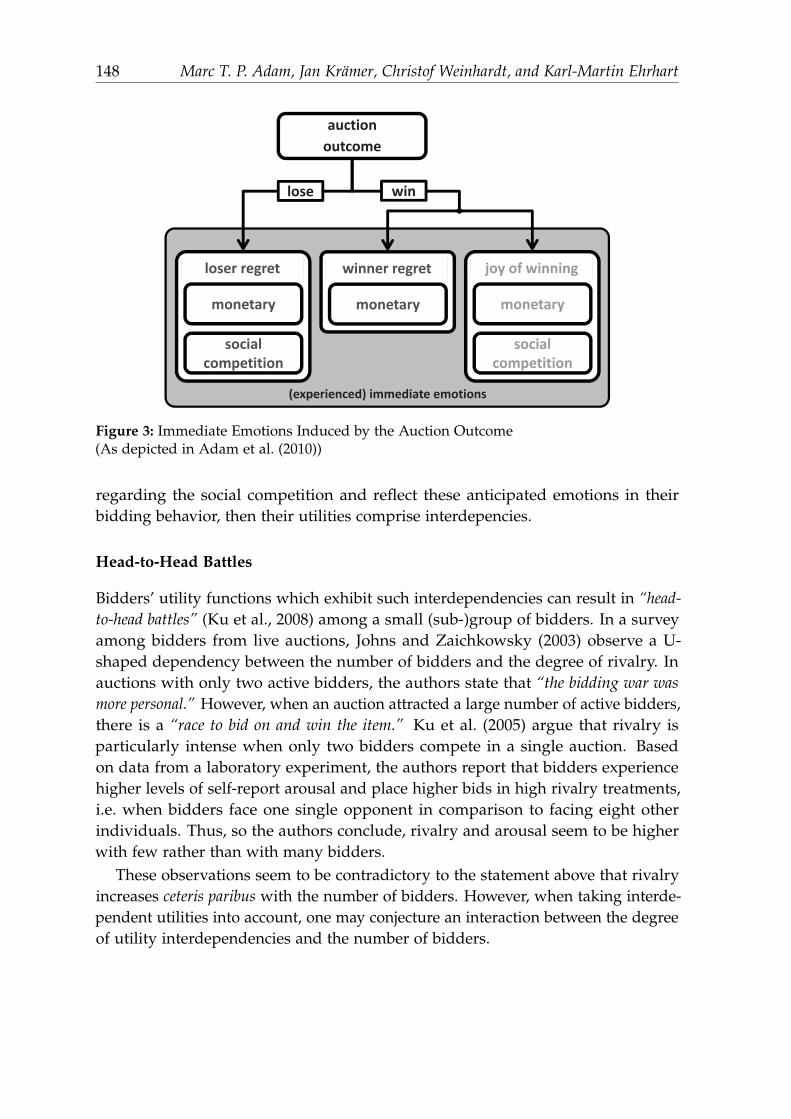
148 Marc T. P. Adam, Jan Kramer, Christof Weinhardt, and Karl-Martin Ehrhart
auctionoutcomeoutcome
lose win
winner regretloser regret joy of winning
monetarymonetary
socialcompetition
monetary
socialcompetition
(experienced) immediate emotions
Figure 3: Immediate Emotions Induced by the Auction Outcome(As depicted in Adam et al. (2010))
regarding the social competition and reflect these anticipated emotions in theirbidding behavior, then their utilities comprise interdepencies.
Head-to-Head Battles
Bidders’ utility functions which exhibit such interdependencies can result in “head-to-head battles” (Ku et al., 2008) among a small (sub-)group of bidders. In a surveyamong bidders from live auctions, Johns and Zaichkowsky (2003) observe a U-shaped dependency between the number of bidders and the degree of rivalry. Inauctions with only two active bidders, the authors state that “the bidding war wasmore personal.” However, when an auction attracted a large number of active bidders,there is a “race to bid on and win the item.” Ku et al. (2005) argue that rivalry isparticularly intense when only two bidders compete in a single auction. Basedon data from a laboratory experiment, the authors report that bidders experiencehigher levels of self-report arousal and place higher bids in high rivalry treatments,i.e. when bidders face one single opponent in comparison to facing eight otherindividuals. Thus, so the authors conclude, rivalry and arousal seem to be higherwith few rather than with many bidders.
These observations seem to be contradictory to the statement above that rivalryincreases ceteris paribus with the number of bidders. However, when taking interde-pendent utilities into account, one may conjecture an interaction between the degreeof utility interdependencies and the number of bidders.
Investigating Auction Fever 149
Research Questions on Interdependent Utilities
As outlined above, interdependent utilities (IU) seem to play an important role inauction fever. In particular, we identify the following research questions concerninginterdependent utilities:
IU1: To what degree does the phenomenon of auction fever depend on interdepen-dencies between bidders’ utility functions?
IU2: To what extent does the degree of interdependent utilities depend on thenumber of active bidders?
IU3: How do audience and co-action effects affect the degree of interdependentutilities?
Further, the existence of interdependent utilities and the general phenomenonof auction fever also seems to depend on the commodity for sale. Product char-acteristics and their influence on auction fever will be discussed in the followingsection.
3.2 Product Characteristics
Ariely and Simonson (2003) argue that the occurrence and degree of auction fever issubject to the specific characteristics of the auctioned item, e.g. “whether the productoffered is such that the allure of its low starting price has the potential to generate emotionalinvolvement.” At this stage, there has been little research on how the phenomenonof auction fever depends on product characteristics. Nevertheless, this researchquestion is important, because the literature on auction fever analyzes auctionsranging from retail products such as electronic equipment to collectibles as one-centcoins and fiberglass cows (cf. Ku et al., 2005; Lucking-Reiley et al., 2007).
The conjecture that characteristics of the auctioned commodity have an impact onthe degree of auction fever is supported by the observation of Lee and Malmendier(2010). The authors report that the amount of overbidding in eBay auctions dependson the product category, with proportions of overbidding ranging “between 30% and60% for most categories.” The authors define overbidding with respect to simultane-ouly listed ficed price offers on the same platform. However, the authors do notaddress which characteristics of the commodity are responsible for this observation.
Product Value, Scarcity, and Public Interest
We conjecture that in particular the product’s value, scarcity, and public interestplay an important role for the occurrence of auction fever.
First, if the value of the item is comparatively high, this affects bidder’s individualinvolvement and, thus, arousal. For instance, Ku et al. (2008) report that biddingbehavior is more aggressive when stakes are high by manipulating conversion rates.The perceived loss of the current high bidder in the event of being outbidden is
150 Marc T. P. Adam, Jan Kramer, Christof Weinhardt, and Karl-Martin Ehrhart
probably higher when stakes are high. Second, Smith (1990) argues that bidders areoften uncertain about their own product valuation. In this respect, Lucking-Reiley(1999) notes that this uncertainty inherently increases in Internet auctions, wherebidders’ information regarding product quality and seller reliability is rather limitedand biased.
Third, product scarcity affects rivalry among bidders. For instance, Hou (2007)argue that a long auction duration only then positively affects the endogenousnumber of bidders, if scarcity is sufficiently high and bidders do not have “moreoptions at any point of time.” Beyond that, Lynn (1992) report that an item becomesmore desirable for consumers if it is scarce. Peters and Bodkin (2007) observe thateBay bidders derive “joy in finding rare or unusual items.” Finally, a high publicinterest can presumably increase a bidder’s prestige when obtaining the auctioneditem, e.g. a charity auction or a unique collectible. Ku et al. (2005) observe charityauctions and conjecture that the intense media attention may also have “increasedarousal and facilitated higher bidding.”
Research Questions on Product Characteristics
As outlined above, product characteristics (PC) of the auction commodity seem toplay an important role in auction fever. In particular, we identify the followingresearch questions concerning product characteristics:
PC1: What is the impact of a product’s value, scarcity, and public interest on biddingfever?
PC2: Which features of a product are responsible for inducing psychological attach-ment in auctions, in particular with respect to perceived ownership?
PC3: To what extent does the degree of interdependent utilities depend on productcharacteristics?
4 Discussion on Methodological Approaches
The last section discussed two main challenges for auction fever research. Inparticular, interpersonal utilities and product characteristics have been identifiedas important influencing factors for auction fever. In this section we will nowdiscuss different methodological approaches for analyzing auction fever in economiclaboratory experiments.
4.1 Participant Deception
The literature on auction fever frequently conducts laboratory experiments in whichparticipants are intentionally deceived in order “not to disturb the emergence ofauction fever” (Ockenfels et al., 2006). In particular, participants are told that they(1) bid against other human individuals, while they are actually competing with
Investigating Auction Fever 151
computerized agents (e.g. Haubl and Popkowski Leszczyc, 2004; Ku et al., 2008),and (2) that their payment is performance depending although every participanteventually receives the same payoff (e.g. Ku et al., 2008). While deception ofparticipants has turned out to be common practice in experimental psychology, itviolates established paradigms of experimental economics (cf. Guala, 2005).
With respect to auction fever experiments, Ockenfels et al. (2006) criticize thatit remains unclear to what extent participants “will actually believe any part of theinformation they are given,” if the subject pool has been exposed to deception inexperiments before. Following this reasoning, the deception of participants turnsout to be an inappropriate methodological approach for auction fever experiments.
4.2 Physioeconomics
Hagenau et al. (2007) and Adam et al. (2009) propose a methodology denotedas “physioeconomics” for measuring the impact of emotions in electronic auctions.Physioeconomics, so Adam et al. (2009), “extends existing methods of experimentaleconomics by measuring autonomic nervous system activity using well-established psy-chophysiological methodology, in order to gain a deep understanding of the dynamic processof human economic decision-making.”
A subject’s heart rate and skin conductivity are well established parameters inpsychophysiology for assessing her emotional processing. In particular, the (tonic)skin conductance level and the phasic amplitude of skin conductance responsesare sensitive indexes for the general level of arousal and the degree of arousalassociated with a single auction event, respectively. Phasic heart rate, on the otherhand, allows for evaluating the perceived valence of a certain stimulus with negativestimuli typically eliciting decelatory responses and positive stimuli relative heartrate accelerations.
Physioeconomics allows for identifying the intensity of immediate and antici-pated emotions, as well as for assessing a subject’s current emotional state. Therefore,it turns out to be a complementary methodological approach for investigating auc-tion fever in particular and the interactions outlined in the framework for emotionalbidding in general. While a lot of studies on auction fever conjecture an interactionbetween emotional processing and bidding behavior, physioeconomics allows foractually measuring this interaction.
4.3 Human or Computerized Competitors
As depicted in Figure 3, the immediate emotions upon winning and losing anauction can be distinguished into (1) emotions regarding the monetary payoff and(2) emotions regarding the social competition.5 Both categories of emotions playan important role for human decision-making in auctions (e.g. Delgado et al., 2008;Engelbrecht-Wiggans and Katok, 2008). However, the phenomenon of auction fever
5 Recall that interdependent utilities are an inherent characteristic of the social competition.
152 Marc T. P. Adam, Jan Kramer, Christof Weinhardt, and Karl-Martin Ehrhart
seems to be particularly depending on emotions regarding the social competition.For instance, Haubl and Popkowski Leszczyc (2004) argue that for the experience ofauction fever, it is a necessary condition “that an auction participant competes directlywith other human bidders.” Heyman et al. (2004) refer to this phenomenon as the“opponent effect” and Delgado et al. (2008) argue that actually the “fear of losing thesocial competition” inherent in auctions is responsible for overbidding.
Engelbrecht-Wiggans and Katok (2008) intentionally exclude emotions regardingthe social competition by letting subjects compete with computerized agents. Incontrast to the studies addressed in Section 4.1, subjects are explicitly told thatthey compete against computerized agents. Engelbrecht-Wiggans and Katok arguethat “theories [of spitefulness] require inter-personal comparisons and, therefore, cannotexplain similar behavior by subjects who were bidding against computerized rather thanhuman competitors.” Following this reasoning, the experimenter can investigate theimpact emotions originated in interdependent utilities, by benchmarking humanbehavior when bidding against computerized agents with bidding against humanindividuals. This seems to be a promising approach for investigating the signifi-cance of interdependent utilities for auction fever. The actual intensity differenceof emotional processing can then be simultaneously assessed with physiologicalparameters and the methodology of physioeconomics.
4.4 Induced Values vs. Real Goods
One major paradigm of experimental economics is the induced value theory intro-duced in the seminal work of Smith (1976). The induced value theory states thatin order to observe realistic behavior in laboratory experiments subjects need tobe properly incentivized through a proper reward medium that has to fulfill therequirements of monotonicity, salience, and dominance.6 Typically, experimenterschoose real money as the reward medium and provide a performance depend-ing payment scheme to incentivize human behavior in the context of an artificialeconomic institution.
In contrast, a series of studies on auction fever rewards subjects with a fixed lumpsum, which does not allow for performance depending gains or losses (Heymanet al., 2004; Wolf et al., 2005).7 Particularly with respect to Figure 3, it remainstotally unclear to what extent emotions elicited by monetary payoffs are reflectedin bidding behavior, if there are neither actual nor potential monetary gains andlosses. Further, is important to keep in mind that the expected utility from winning
6 For a comprehensive survey on the methodology of experimental economics please refer to Guala(2005).
7 In these studies, subjects are explicitly told that they will receive a fixed show-up fee. In contrast,the literature addressed in Section 4.1 pretends a performance depending payment scheme,although all subjects eventually receive the same amount of money.
Investigating Auction Fever 153
an auction is the actual reason for bidders to participate. If this utility is zero byconstruction, the explanatory power of such studies seems rather small.8
Another approach is auctioning off real world commodities, or “real goods,” inlaboratory experiments (Kahneman et al., 1990). While the theory of induced valuesis a well-established methodological approach to induce real world behavior, onecan also directly auction off real goods. Kahneman et al. (1990) conduct a nowfamous auction experiment in which participants can place bids on coffee mugs.9
In another well-known auction experiment comprising real goods, Lucking-Reiley(1999) conducts a controlled field experiment on eBay. In particular, the authorsauction off collector cards. Ehrhart et al. (2010) conduct a laboratory experimentcomprising real goods to investigate the effect of perceived ownership on biddingbehavior, by auctioning off USB mass storage devices. The authors argue thatit is particularly important to properly choose the auctioned commodity whenconducting economic experiments with real goods. Therefore, before running thelaboratory experiment, Ehrhart et al. initially conduct a survey study to assesswhich objects are actually appropriate.
One main advantage, so Ehrhart et al. (2010), for using real goods in auction feverexperiments is that subjects can actually develop a psychological attachment with anobject, which is not or not to this extent the case for money.10 Going one step further,it would now be particularly interesting to use real world commodities for identify-ing those product characteristics which actually mediate psychological attachment.Therefore, we believe that using real world commodities is a promising approachfor investigating auction fever. Once again, the actual elicited emotional state can beassessed with physiological parameters and the methodology of physioeconomics.
5 Conclusion
In this paper we focused on the question of how to systematically investigate auctionfever and its impact on electronic auctions. Emotions have turned out to be a qualitycharacteristic of Internet consumer auctions. Therefore, it is vital to know howelectronic auctions can trigger emotions, and, perhaps even more importantly, howthe triggered emotions affect the auction outcome. Following this reasoning, a deepunderstanding of how cognitive reasoning and emotional processing are reflectedin bidding behavior is of high relevance for the market engineer.
8 Recall that the non-monetary component of the joy of winning is most likely intertwined with thephenomenon of auction fever. Therefore, this utility, and particularly its anticipation, arises onlyduring the dynamic process of an auction.
9 Kahneman et al. (1990) analyze the endowment effect, i.e. effect of actual ownership, by endowingcoffee mugs to one half of the participants (sellers), while the other half (buyers) receives no coffeemugs. Sellers and buyers can then exchange the coffee mugs through a double-sided auction.The authors report that the average price a seller is willing to accept (WTA) for a coffee mug issignificantly larger than the average price a buyer is willing to pay (WTP).
10 This is in line with the observation of Wolf et al. (2008), who find that even the time a bidder hasfor observing the item plays an important role for developing her attachment.
154 Marc T. P. Adam, Jan Kramer, Christof Weinhardt, and Karl-Martin Ehrhart
Auction fever literature identified in particular perceived competition, previousinvestments, and perceived ownership as elicitors of auction fever. Further, inInternet auctions the elicitation of auction fever is mediated through the userinterface design of the auction system. Additionally, we identified in particularproduct characteristics and interdependent utilities as important influencing factorswhich have often been neglected in auction fever literature, or only gained littleattention. Although interdependent utilities are an influencing factor for rivalry,and therefore, for perceived competition, we believe it is important to focus on howsuch interdependencies arise and how they interact with other facets of auctionfever.
Summarizing the methodological discussion, one can conclude that applyingphysiological measurements in economic laboratory experiments and auctioningreal world commodities are promising approaches, which are complementary totraditional methodologies in experimental economics. Further, utilizing comput-erized agents seems to be an adequate approach for assessing the significance ofinterdependent utilities for auction fever. In contrast, although a substantial partof auction fever literature is based on deception of participants and hypotheticalauction scenarios, one has to consider fundamental drawbacks of these approaches.Therefore, the explanatory power of these approaches seems at least questionable.
References
Adam, M. T. P., M. Gamer, and C. Weinhardt (2009): “Measuring the impact ofemotions in electronic auctions: A physioeconomic approach,” Working Paper, Karl-sruhe Institute of Technology (KIT), pp. 1–26.
Adam, M. T. P., J. Kramer, C. Jahnig, S. Seifert, and C. Weinhardt (2010): “Emotionsin electronic auctions: Insights from a literature review,” Working Paper, KarlsruheInstitute of Technology (KIT), pp. 1–50.
Andreoni, J., Y.-K. Che, and J. Kim (2007): “Asymmetric information about rivals’types: An experiment,” Games and Economic Behavior, 59, pp. 240–259.
Ariely, D. and I. Simonson (2003): “Buying, bidding, playing, or competing? Valueassessment and decision dynamics in online auctions,” Journal of Consumer Psy-chology, 13, pp. 113–123.
Bault, N., G. Coricelle, and A. Rustichini (2008): “Interdependent utilities: Howsocial ranking affects choice behavior,” PLoS ONE, 3(10), pp. 1–10.
Delgado, M. R., A. Schotter, E. Y. Ozbay, and E. A. Phelphs (2008): “Understand-ing overbidding: Using the neural circuitry of reward to design economic auc-tions,” Science, 321(5897), pp. 1849–1852.
Ding, M., J. Eliashberg, J. Huber, and R. Saini (2005): “Emotional bidders: Ananalytical and experimental examination of consumers’ behavior in a priceline-like reverse auction,” Management Science, 51(3), pp. 352–364.
eBay Inc. (2009): Annual report 2008, http://investor.ebay.com/.
Investigating Auction Fever 155
Ehrhart, K.-M., L. Goebes, and S. Lotz (2010): “Experimental Analysis of thePseudo-Endowment Effect with Real Goods,” Working Paper, Karlsruhe Institute ofTechnology (KIT).
Ehrhart, K.-M., M. Ott, and S. Abele (2008): “Auction fever: Theory and experi-mental evidence,” SFB 504 Discussion Paper Series, No. 08-27, http://www.sfb504.uni-mannheim.de/publications/dp08-27.pdf.
Engelbrecht-Wiggans, R. (1989): “The effect of regret on optimal bidding in auctions,”Management Science, 35(6), pp. 685–692.
Engelbrecht-Wiggans, R. and E. Katok (2008): “Regret and feedback information infirst-price sealed-bid auctions,” Management Science, 54(4), pp. 808–819.
Filiz-Ozbay, E. and E. Y. Ozbay (2007): “Auctions with anticipated regret: Theoryand experiment,” The American Economic Review, 97(4), pp. 1407–1418.
Gerrig, R. J. and P. G. Zimbardo (2007): Psychology and life, 18th ed edition, Pearson/ Allyn and Bacon, Boston, Mass.
Gimpel, H. (2007): Preferences in negotiations: The attachment effect, Lecture notes ineconomics and mathematical systems, Springer, Berlin, Heidelberg.
Glanzer, S. and B. Schafers (2001): “Dynamic Trading Network und virtuelleAuktionen im Internet: Das Beispiel ricardo.de,” in: A. Hermanns and M. Sauter(eds.), Management-Handbuch Electronic Commerce, Vahlen, Munchen, pp. 609–616.
Goeree, J. K. and T. Offerman (2003): “Winner’s curse without overbidding,” Euro-pean Economic Review, 47, pp. 625–644.
Guala, F. (2005): The methodology of experimental economics, Cambridge UniversityPress, Cambridge.
Hagenau, M., S. Seifert, and C. Weinhardt (2007): “A primer on physioeconomics,”in: G. E. Kersten, J. Rios, and E. Chen (eds.), Proceedings of the 8th Group Decisionand Negotiation Conference (GDN), Montreal, Canada, pp. 214–215.
Haruvy, E. and P. T. Popkowski Leszczyc (2009): “The impact of online auctionduration,” Decision Analysis.
Haubl, G. and P. T. Popkowski Leszczyc (2004): “The psychology of auctions:Enriching models of bidder and seller behavior,” Advances in Consumer Research,31(1), pp. 91–92.
Heyman, J. E., Y. Orhun, and D. Ariely (2004): “Auction fever: The effect ofopponents and quasi-endowment on product valuations,” Journal of InteractiveMarketing, 18(4), pp. 7–21.
Hou, J. (2007): “Price determinants in online auctions: A comparative study of eBayChina and US,” Journal of Electronic Commerce Research, 8(3), pp. 172–183.
Johns, C. L. and J. L. Zaichkowsky (2003): “Bidding behavior at the auction,”Psychology and Marketing, 20(4), pp. 303–322.
Kahneman, D., J. L. Knetsch, and R. H. Thaler (1990): “Experimental tests of theendowment effect and the Coase theorem,” The Journal of Political Economy, 98(6),pp. 1325–1348.
156 Marc T. P. Adam, Jan Kramer, Christof Weinhardt, and Karl-Martin Ehrhart
Katok, E. and A. M. Kwasnica (2008): “Time is money: The effect of clock speed onseller’s revenue in Dutch auctions,” Experimental Economics, 11(4), pp. 344–357.
Krishna, V. (2002): Auction theory, Acad. Press, San Diego, California.Ku, G. (2008): “Learning to de-escalate: The effects of regret in escalation of
commitment,” Organizational Behavior and Human Decision Processes, 105, pp. 221–232.
Ku, G., A. D. Galinsky, and J. K. Murnighan (2008): “Arousal, interest, and auctionbidders,” http://ssrn.com/abstract=1298572.
Ku, G., D. Malhotra, and J. K. Murnighan (2005): “Towards a competitive arousalmodel of decision-making: A study of auction fever in live and Internet auctions,”Organizational Behavior and Human Decision Processes, 96, pp. 89–103.
Lee, L., O. Amir, and D. Ariely (2009a): “In search of Homo Economicus: Cognitivenoise and the role of emotion in preference consistency,” Journal of ConsumerResearch, 36, pp. 173–187.
Lee, M.-Y., Y.-K. Kim, and A. Fairhurst (2009b): “Shopping value in online auctions:Their antecendents and outcomes,” Journal of Retailing and Consumer Services, 16,pp. 75–82.
Lee, Y. H. and U. Malmendier (2010): “The bidder’s curse,” The American EconomicReview.
Loewenstein, G. (2000): “Emotions in economic theory and economic behavior,” TheAmerican Economic Review, 90(2), pp. 426–432.
Lucking-Reiley, D. (1999): “Using field experiments to test equivalence betweenauction formats: Magic on the Internet,” The American Economic Review, 89(5), pp.1063–1080.
Lucking-Reiley, D., D. Bryan, N. Prasad, and D. Reeves (2007): “Pennies from eBay:The determinants of price in online auctions,” The Journal of Industrial Economics,55(2), pp. 223–233.
Lynn, M. (1992): “Scarcity’s enhancement of desirability: The role of naive economictheories,” Basic and Applied Social Psychology, 13(1), pp. 67–78.
Malhotra, D., G. Ku, and J. K. Murnighan (2008): “When winning is everything,”Harvard Business Review, 86(5), pp. 78–86.
McAfee, R. P. and J. McMillan (1987): “Auctions and bidding,” Journal of EconomicLiterature, 25(2), pp. 699–738.
Mollenberg, A. (2004): “Internet auctions in marketing: The consumer perspective,”Electronic Markets, 14(4), pp. 360–371.
Morgan, J., K. Steiglitz, and G. Reis (2003): “The spite motive and equilibriumbehavior in auctions,” Contributions to Economic Analysis & Policy, 2(1), pp. 1102–1127.
Murnighan, J. K. (2002): “A very extreme case of the dollar auction,” Journal ofManagement Education, 26, pp. 56–69.
Investigating Auction Fever 157
Ockenfels, A., D. Reiley, and A. Sadrieh (2006): “Online auctions,” in: T. J. Hender-shott (ed.), Economics and information systems, Handbooks in Information Systems,vol. 1, Elsevier B. V., Amsterdam, The Netherlands, pp. 571–628.
Park, S. C., J. U. Kim, and G. W. Bock (2008): “Understanding a bidder’s escalationof commitment in the online C2C auction,” in: Z. Irani, S. Sahraoui, A. Ghoneim,J. Sharp, S. Ozkan, M. Ali, and S. Alshawi (eds.), European Mediterranean Conferenceon Information Systems (EMCIS).
Peters, C. and C. D. Bodkin (2007): “An exploratory investigation of problematiconline auction behaviors: Experience of eBay users,” Journal of Retailing andConsumer Services, 14, pp. 1–16.
Rasmusen, E. (2007): Games and information: An introduction to game theory, 4th. ed.edition, Blackwell, Malden, Mass.
Schall, L. D. (1972): “Interdependent utilities and Pareto optimality,” The QuarterlyJournal of Economics, 86(1), pp. 19–24.
Smith, C. W. (1990): Auctions: The social construction of value, University of CaliforniaPress, Berkeley.
Smith, R. H., T. J. Turner, R. Garonzik, C. W. Leach, V. Urch-Druskat, and C. M.Weston (1996): “Envy and Schadenfreude,” Personality and Social Psychology, 22,pp. 158–168.
Smith, V. L. (1976): “Experimental economics: Induced value theory,” The AmericanEconomic Review, 66(2), pp. 274–279.
Stafford, M. R. and B. Stern (2002): “Consumer bidding behavior on Internet auc-tion sites,” International Journal of Electronic Commerce, 7(1), pp. 135–150.
Stern, B., M. B. Royne, T. F. Stafford, and C. C. Bienstock (2008): “Consumeracceptance of online auctions: An extension and revision of the TAM,” Psychologyand Marketing, 25(7), pp. 619–636.
Stern, B. and M. R. Stafford (2006): “Individual and social determinants of winningbids in online auctions,” Journal of Consumer Behaviour, 5(1), pp. 43–55.
Vickrey, W. (1961): “Counterspeculation, auctions, and competitive sealed tenders,”The Journal of Finance, 16(1), pp. 8–37.
Weinhardt, C., C. Holtmann, and D. Neumann (2003): “Market engineering,”Wirtschaftsinformatik, 45(6), pp. 635–640.
Wolf, J. R., H. R. Arkes, and W. A. Muhanna (2005): “Do auction bidders reallywant to win the item, or do they simply want to win?” Working Paper, pp. 1–19.
Wolf, J. R., H. R. Arkes, and W. A. Muhanna (2008): “The power of touch: Anexamination of the effect of duration of physical contact on the valuation ofobjects,” Judgment and Decision Making, 3(6), pp. 476–482.
Zajonc, R. B. (1965): “Social facilitation,” Science, 149, pp. 269–274.

Anticipated Emotions in the Reference-DependentValuation of Gains and Losses
Laura Goebes1, Karl-Martin Ehrhart1, and Christof Weinhardt2
1 Institute for Economic Theory and Statistics, [email protected], [email protected]
2 Institute of Information Systems and Management, [email protected]
Summary. Standard economic theory offers normative as well as descriptive models todescribe and predict human choice behavior. Here, the role of emotion in decision-makinghas been ignored in the past. To make advantageous decisions, a subject must be ableto valuate gains and losses as options to be realized in future outcomes. Additional tostandard economic theory it is suggested that decisions are aided by emotions, in the formof somatic states, that are elicited during the deliberation of future consequences and thatmark different options for behavior to be advantageous or disadvantageous. To gain insightsin how economic decisions are made and what role anticipated emotions play in economicdecision-making, the somatic marker hypothesis is applied to several standard economicchoice problems. The paper presents an experimental setup to test the role of anticipatedemotions in economic decision-making under risk. The proposed experimental design aimsat measuring the physiological differences of subjects with high and small probabilitiesof potential gains and losses in a controlled laboratory experiment with the methodologyof physio economics. The authors present an overview of standard economic theory ofdecision making under risk, a review of the role of emotions in decision-making as wellas an introduction into physio economics. The authors further present the design of alaboratory experiment and the hypotheses to be tested within the experiment.
1 Introduction
In economics it is usually assumed that subjects have stable and well-definedpreferences and make rational choices according to these preferences. Standardeconomic theory offers normative as well as descriptive models to describe andpredict human choice behavior. Decision-making under risk is usually modeledby a choice problem over a set of lotteries, where a lottery is defined as a (known)distribution of probabilities over a set of outcomes. The standard approach fordecision-making under risk is the expected utility theory by von Neumann andMorgenstern (1944). The expected utility theory has dominated the analysis ofdecision under risk over years and is generally accepted as a normative model. Thepredictive quality of the expected utility theory as a descriptive model for decisions
160 Laura Goebes, Karl-Martin Ehrhart, and Christof Weinhardt
under risk has often been discussed and criticized, because it is often observed thatsubjects do not decide as predicted by expected utility theory. With the prospecttheory Kahneman and Tversky propose an alternative account of decision underrisk. The core idea of the prospect theory is to offer a descriptive model which takesthe observed phenomena in human decision-making into account:
• Certain outcomes are overestimated compared to less probable outcomes.• Gains and losses are weighted differently, that is subjects show risk aversion
in the face of gains and risk seeking in the face of losses (except for very smallprobablities).• The presentation of a lottery affects subjects preferences.
Standard economic theory ignores the influence of emotions in decision-making.Research in neuroscience suggests that rational decision-making, in fact, depends onprior emotional processing. The somatic marker hypothesis provides a systems-levelneuroanatomical and cognitive framework for decision-making and its influence byemotions. The key idea of this hypothesis is that decision-making is a process thatis influenced by marker signals, that express themselves in emotions and feelings.The theory suggests that decisions are aided by emotions, in the form of somaticstates, that are elicited during the deliberation of future consequences and thatmark different options for behavior to be advantageous or disadvantageous. To gaininsights in how economic decisions are made and what role anticipated emotionsplay in economic decision-making, an experimental setup is presented in this paper.
2 Economic Decision-Making under Risk
2.1 Expected Utility Theory
Economic theory usually models decision-making under risk by a choice problemover a set of lotteries, where a lottery is defined as a (known) distribution of proba-bilities over a set of outcomes. The standard approach for decision-making underrisk is the expected utility theory by von Neumann and Morgenstern (1944). Incase of discrete outcomes, for example, the expected utility is given by the sum ofthe probability weighted utilities of the certain (riskless) outcomes. As the nameof the expected utility suggests, a subject‘s decision under risk is based on thecomparison of the expected utilities of different lotteries. That is, the subject decidesin favor of the lottery which provides the highest expected utility. To be moreprecise, if the subject faces a binary choice problem of accepting or declining asingle lottery, it is assumed that a subject accepts the lottery if the utility, resultingfrom integrating the lottery with ones endowment, is higher than the utility of hisendowment alone. This means that the domain of the utility function is determinedby the final endowment, rather than by gains and losses.
Anticipated Emotions in the Reference-Dependent Valuation of Gains and Losses 161
A subject is called risk averse if he prefers certain outcomes to risky situations.According to the expected utility theory a subject is risk averse if he prefers theexpected value of a lottery to the lottery itself. That is, in case of risk aversionthe subject‘s utility of the expected values is higher than his expected utility ofthe lottery. The degree of risk aversion is measured by the concavity of the utilityfunction1. Note that also with respect to risk aversion, as mentioned before, theexpected utility theory does not distinguish between gain risk and loss risk.
The expected utility theory is based on four axioms2. A subject is consideredas rational if all four axioms are satisfied. In this case, as von Neumann and Mor-genstern prove, a subject‘s preferences can be uniquely and completely describedby means of expected utility. Hence, according to von Neumann and Morgenstern,subjects act rational in a way that they maximize their expected utility.
The expected utility theory has dominated the analysis of decision under riskover years and is generally accepted as a normative model. Thus, it describeswhat a subject should do. However, it is often also applied as a descriptive model,which means it predicts what subjects in fact do. The predictive quality of theexpected utility theory as a descriptive model for decisions under risk has oftenbeen discussed and criticized, because it is often observed that subjects do not decideas predicted by expected utility theory. As is well known, Allais (1953) presentsempirical examples, known as Allais paradox, where systematical violations of theaxioms of the expected utility are observed (see next section). These examples andfurther observations of systematic violation lead to alternative and complementarytheories of decision-making under risk, where one of the most famous is the so-called prospect theory by Kahneman and Tversky (1979).
1 More precisely, the (Arrow Pratt) measure of risk-aversion (according to the economists KennethArrow and John W. Pratt) is defined as ru(c) = − u′′(c)
u′(c) , where u(c) denotes subject‘s utility of thecertain outcome c and u’(c) and u”(c) the first and second derivative of the utility function u(c).
2 The 4 axioms of expected utility theory:
• Completeness: For every A and B either A B, A ≺ B or A ∼ B holds.Completeness assumes that a subject has well defined preferences to compare and evaluate twoalternatives.
• Transitivity: For every A, B and C with A B and B C we must have A C.Transitivity assumes that, as a subject decides according to the completeness axiom, the subjectalso decides consistently.
• Independence: Let A and B be two lotteries with A B, and let t ∈ (0, 1] ⇒ tA + (1− t)C tB + (1− t)C for all C.Independence assumes that the preference order of two lotteries mixed with a third one maintainsthe same preference order as when the two are mixed independently.
• Continuity: Let A, B and C be lotteries with A B C ⇒ ∃t ∈ (0, 1) with tA + (1− t)C ∼ B.Continuity assumes that when there are three lotteries (A, B and C) and the subject prefers A toB and B to C, then there should be a possible combination of A and C in which the subject isthen indifferent between this mix and the lottery B.
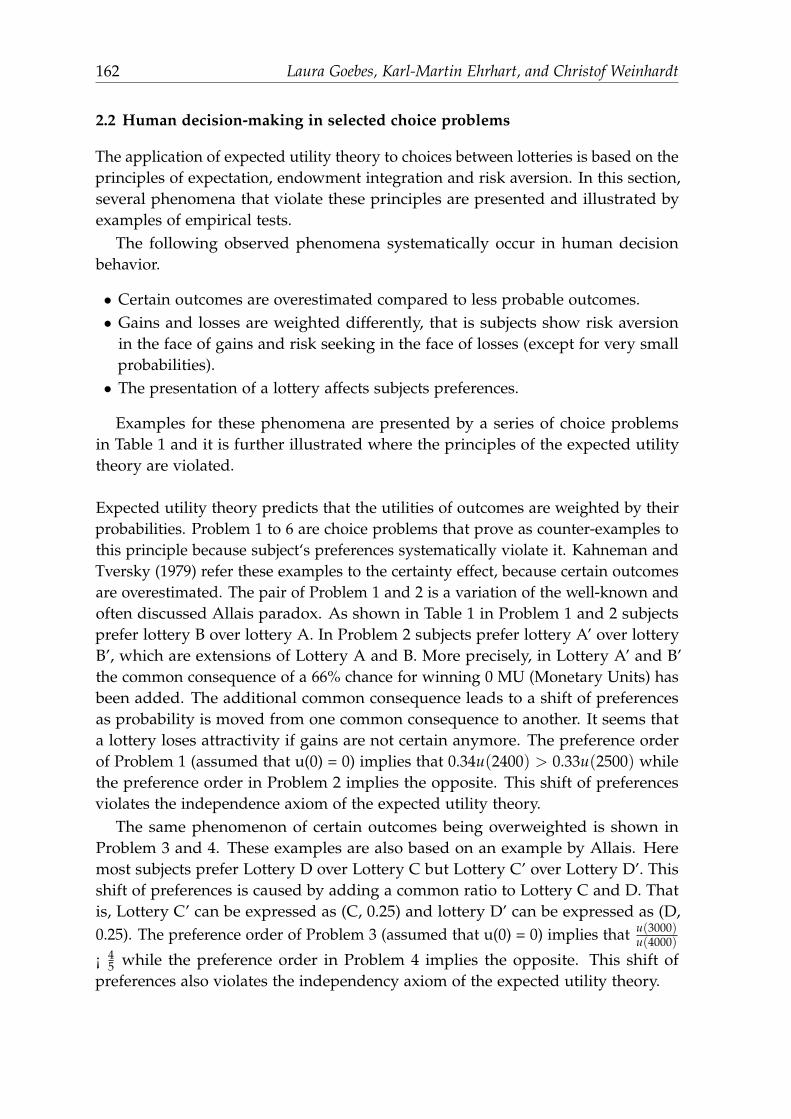
162 Laura Goebes, Karl-Martin Ehrhart, and Christof Weinhardt
2.2 Human decision-making in selected choice problems
The application of expected utility theory to choices between lotteries is based on theprinciples of expectation, endowment integration and risk aversion. In this section,several phenomena that violate these principles are presented and illustrated byexamples of empirical tests.
The following observed phenomena systematically occur in human decisionbehavior.
• Certain outcomes are overestimated compared to less probable outcomes.• Gains and losses are weighted differently, that is subjects show risk aversion
in the face of gains and risk seeking in the face of losses (except for very smallprobabilities).• The presentation of a lottery affects subjects preferences.
Examples for these phenomena are presented by a series of choice problemsin Table 1 and it is further illustrated where the principles of the expected utilitytheory are violated.
Expected utility theory predicts that the utilities of outcomes are weighted by theirprobabilities. Problem 1 to 6 are choice problems that prove as counter-examples tothis principle because subject‘s preferences systematically violate it. Kahneman andTversky (1979) refer these examples to the certainty effect, because certain outcomesare overestimated. The pair of Problem 1 and 2 is a variation of the well-known andoften discussed Allais paradox. As shown in Table 1 in Problem 1 and 2 subjectsprefer lottery B over lottery A. In Problem 2 subjects prefer lottery A’ over lotteryB’, which are extensions of Lottery A and B. More precisely, in Lottery A’ and B’the common consequence of a 66% chance for winning 0 MU (Monetary Units) hasbeen added. The additional common consequence leads to a shift of preferencesas probability is moved from one common consequence to another. It seems thata lottery loses attractivity if gains are not certain anymore. The preference orderof Problem 1 (assumed that u(0) = 0) implies that 0.34u(2400) > 0.33u(2500) whilethe preference order in Problem 2 implies the opposite. This shift of preferencesviolates the independence axiom of the expected utility theory.
The same phenomenon of certain outcomes being overweighted is shown inProblem 3 and 4. These examples are also based on an example by Allais. Heremost subjects prefer Lottery D over Lottery C but Lottery C’ over Lottery D’. Thisshift of preferences is caused by adding a common ratio to Lottery C and D. Thatis, Lottery C’ can be expressed as (C, 0.25) and lottery D’ can be expressed as (D,0.25). The preference order of Problem 3 (assumed that u(0) = 0) implies that u(3000)
u(4000)
¡ 45 while the preference order in Problem 4 implies the opposite. This shift of
preferences also violates the independency axiom of the expected utility theory.
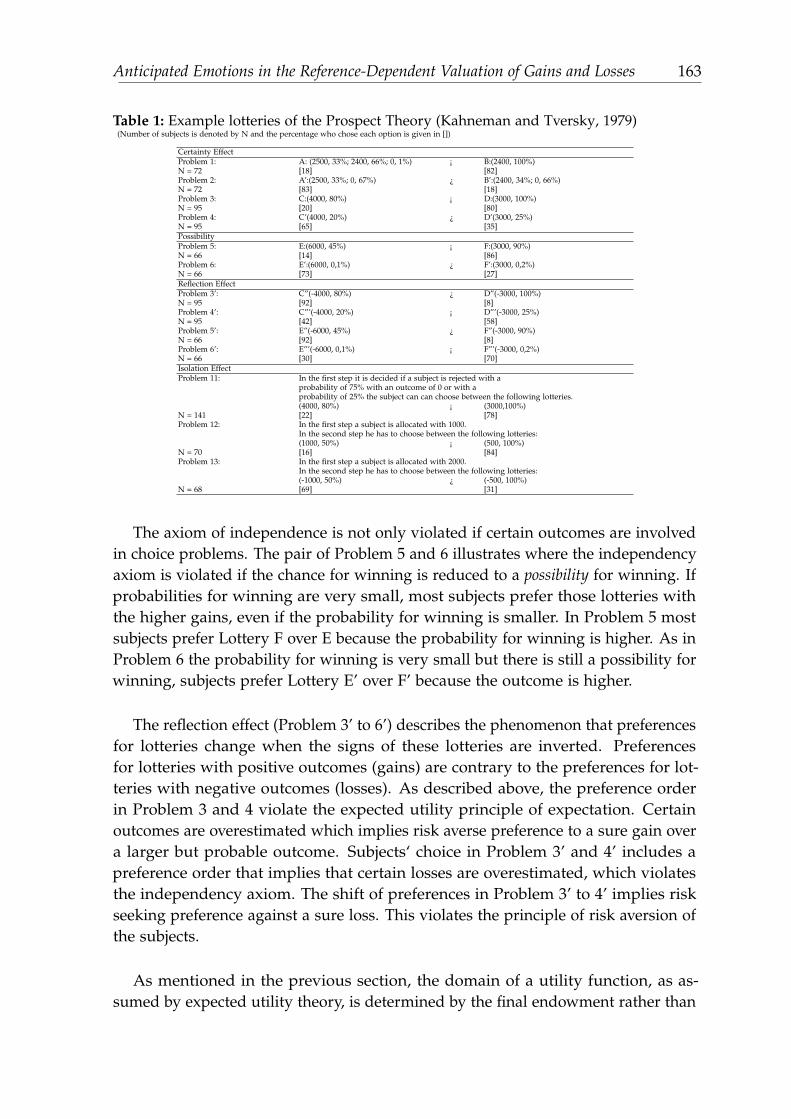
Anticipated Emotions in the Reference-Dependent Valuation of Gains and Losses 163
Table 1: Example lotteries of the Prospect Theory (Kahneman and Tversky, 1979)(Number of subjects is denoted by N and the percentage who chose each option is given in [])
Certainty EffectProblem 1: A: (2500, 33%; 2400, 66%; 0, 1%) ¡ B:(2400, 100%)N = 72 [18] [82]Problem 2: A’:(2500, 33%; 0, 67%) ¿ B’:(2400, 34%; 0, 66%)N = 72 [83] [18]Problem 3: C:(4000, 80%) ¡ D:(3000, 100%)N = 95 [20] [80]Problem 4: C’(4000, 20%) ¿ D’(3000, 25%)N = 95 [65] [35]PossibilityProblem 5: E:(6000, 45%) ¡ F:(3000, 90%)N = 66 [14] [86]Problem 6: E’:(6000, 0,1%) ¿ F’:(3000, 0,2%)N = 66 [73] [27]Reflection EffectProblem 3’: C”(-4000, 80%) ¿ D”(-3000, 100%)N = 95 [92] [8]Problem 4’: C”’(-4000, 20%) ¡ D”’(-3000, 25%)N = 95 [42] [58]Problem 5’: E”(-6000, 45%) ¿ F”(-3000, 90%)N = 66 [92] [8]Problem 6’: E”’(-6000, 0,1%) ¡ F”’(-3000, 0,2%)N = 66 [30] [70]Isolation EffectProblem 11: In the first step it is decided if a subject is rejected with a
probability of 75% with an outcome of 0 or with aprobability of 25% the subject can can choose between the following lotteries.(4000, 80%) ¡ (3000,100%)
N = 141 [22] [78]Problem 12: In the first step a subject is allocated with 1000.
In the second step he has to choose between the following lotteries:(1000, 50%) ¡ (500, 100%)
N = 70 [16] [84]Problem 13: In the first step a subject is allocated with 2000.
In the second step he has to choose between the following lotteries:(-1000, 50%) ¿ (-500, 100%)
N = 68 [69] [31]
The axiom of independence is not only violated if certain outcomes are involvedin choice problems. The pair of Problem 5 and 6 illustrates where the independencyaxiom is violated if the chance for winning is reduced to a possibility for winning. Ifprobabilities for winning are very small, most subjects prefer those lotteries withthe higher gains, even if the probability for winning is smaller. In Problem 5 mostsubjects prefer Lottery F over E because the probability for winning is higher. As inProblem 6 the probability for winning is very small but there is still a possibility forwinning, subjects prefer Lottery E’ over F’ because the outcome is higher.
The reflection effect (Problem 3’ to 6’) describes the phenomenon that preferencesfor lotteries change when the signs of these lotteries are inverted. Preferencesfor lotteries with positive outcomes (gains) are contrary to the preferences for lot-teries with negative outcomes (losses). As described above, the preference orderin Problem 3 and 4 violate the expected utility principle of expectation. Certainoutcomes are overestimated which implies risk averse preference to a sure gain overa larger but probable outcome. Subjects‘ choice in Problem 3’ and 4’ includes apreference order that implies that certain losses are overestimated, which violatesthe independency axiom. The shift of preferences in Problem 3’ to 4’ implies riskseeking preference against a sure loss. This violates the principle of risk aversion ofthe subjects.
As mentioned in the previous section, the domain of a utility function, as as-sumed by expected utility theory, is determined by the final endowment rather than
164 Laura Goebes, Karl-Martin Ehrhart, and Christof Weinhardt
by gains and losses. As the before illustrated examples show, certain outcomesare overweighted and subjects are risk averse in the face of gains and risk seekingin the face of losses. In Problem 11 to 13 it is illustrated that subjects preferencesshift when, due to another framing of the choice problem, one of these componentsbecomes more obvious. Kahneman and Tversky refer these observations as theisolation effect. In Problem 11, choice between Lottery G and H has to be madebefore it is decided if the subject is rejected or not. This is the same situation asin Problem 4. However, subjects‘ preferences are opposite in Problem 11. Thefirst step of the choice problem is not taken into account, the subject only looksat the supposed certain outcome of 3000 MU. Other two-step choice problemsare presented in Problem 12 and 13. Both situations are identical with regard tothe expected outcome. But the framing of the lotteries is different. Problem 12 isseen as a chance to gain and Problem 13 is seen as a chance to avoid a loss as thereference-point, the subjects endowment, changes. This seems to show, that thebasis for the valuation of ones utility is not the final state of endowment but thechange of the endowment.
With the prospect theory Kahneman and Tversky propose an alternative accountof decision under risk. The core idea of the prospect theory is to offer a descriptivemodel which takes the observed phenomena in human decision-making into ac-count. That is, the prospect theory includes more degrees of freedom. In general,this does not improve the quality of a model but in this case the explanatory valueand predictive quality of the model is increased very much.
Prospect theory differentiates between two phases in decision-making: editingand evaluation. The purpose of the editing phase is to organize and reformulategiven lotteries which results in a simpler or better known presentation of lotteriesand to set a reference point which defines the domain of gains and losses. Furtherthe edited lotteries are evaluated and the lottery with the highest value is chosen.The overall value of a lottery V is expressed in terms of two scales, Π and v.The first scale Π associates a decision weight to each probability p, that is itreflects the impact of a probability to the overall value of a lottery. The secondscale v assigns a number v(x) to each outcome x, which reflects the subjectivevalue of the outcome. As outcomes are defined relative to the reference point,v measures the value of deviations from that reference point (gains and losses).In prospect theory it is differentiated between strictly positive, strictly negativeand regular lotteries3. For a regular lottery the value of the lottery is given byV(x, p; y, q) = Π(p)v(x) + Π(q)v(y) with v(0) = 0, Π(1) = 1 and Π(0) = 0.This value function generalizes expected utility theory by relaxing the expectationprinciple.
3 A lottery is given in form of: (x, p; y, q). A lottery is strictly positive if x, y > 0 and p + q = 1,strictly negative if x, y < 0 and p + q = 1. A lottery is regular if it is neither strictly positive ornegative.
Anticipated Emotions in the Reference-Dependent Valuation of Gains and Losses 165
For a strictly positive or negative lottery the overall value of the lottery is presenteddifferently: V(x, p; y, q) = v(y) + Π(p)[v(x)− v(y)]. The value of such a lotteryrepresents the value of the riskless component plus the difference of values betweenthe outcomes multiplied with the weight of the more extreme outcome.
3 Emotions in (economic) decision-making
As mentioned before, in economics it is assumed that subjects have stable andwell-defined preferences and make rational choices according to these preferences.Allais described several phenomena that are not consistent with this assumptionand Kahneman and Tversky extended the theory of decision-making under riskby integrating these phenomena into their model. It seems that human decisionmaking is influenced by other factors than only rational utility maximization.The psychology and neural processes that underly human behavior in (economic)decision-making is investigated to give answers to the questions about what drivessubjects while they valuate gains and losses in order to make advantageous decisions.The role of emotions in economic decision-making is investigated by differentdisciplines and methods.
3.1 Characteristics of emotions
In the nineteenth century the scientists James (1884), Lange and Kurella (1887) devel-oped a new definition and explanation of the nature of emotions. The James-Langetheory refers to a hypothesis, which states that within subjects, as a response tocertain stimuli, the autonomic nervous system creates physiological reactions likemuscular tension, a rise in heart rate, perspiration, and dryness of the mouth. Emo-tions are expressed by feelings which come about as a result of these physiologicalchanges, rather than being their cause. James (1884) explains his concept as:
”My theory [...] is that the bodily changes follow directly the perceptionof the exciting fact, and that our feeling of the same changes as they occuris the emotion. Common sense says, we lose our fortune, are sorry andweep; we meet a bear, are frightened and run; we are insulted by a rival, areangry and strike. The hypothesis here to be defended says that this order ofsequence is incorrect [...] and that the more rational statement is that we feelsorry because we cry, angry because we strike, afraid because we tremble [...]Without the bodily states following on the perception, the latter would bepurely cognitive in form, pale, colorless, destitute of emotional warmth. Wemight then see the bear, and judge it best to run, receive the insult and deemit right to strike, but we should not actually feel afraid or angry.”
According to the James-Lang theory emotions are associated with distinct pat-terns of somato-visceral activity. There have been conducted several experimentswhich give evidence for the existence of distinct patterns of peripheral activity
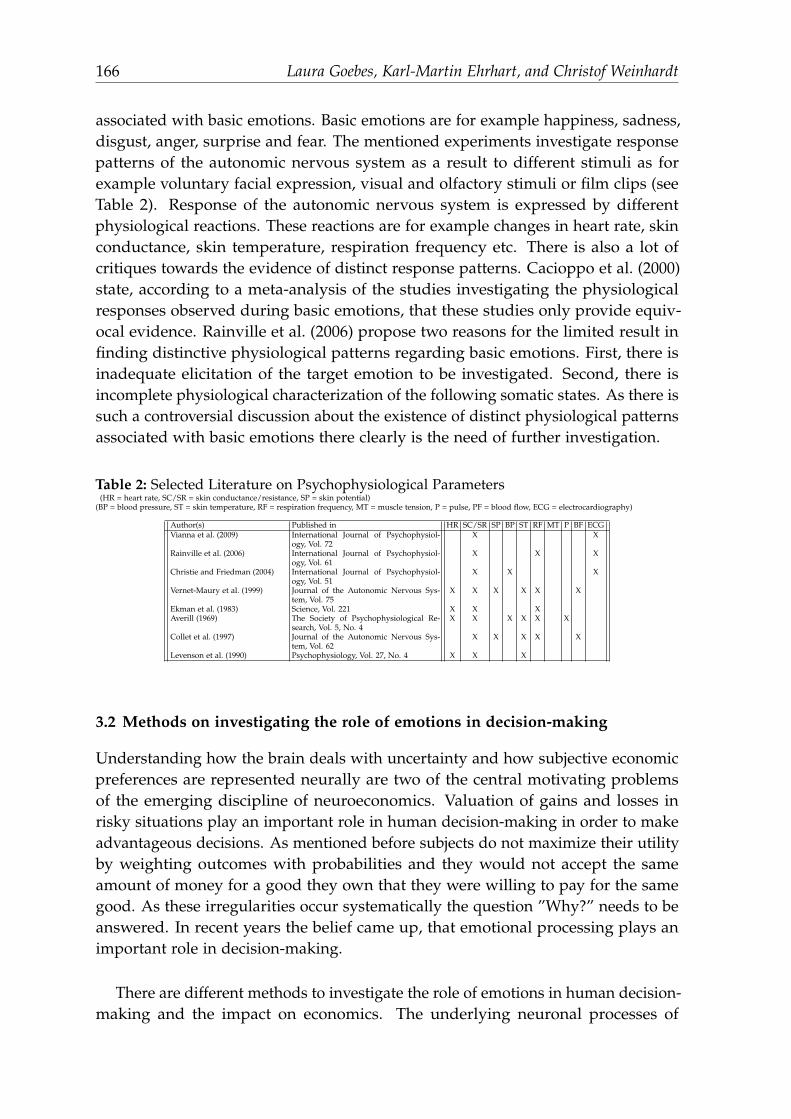
166 Laura Goebes, Karl-Martin Ehrhart, and Christof Weinhardt
associated with basic emotions. Basic emotions are for example happiness, sadness,disgust, anger, surprise and fear. The mentioned experiments investigate responsepatterns of the autonomic nervous system as a result to different stimuli as forexample voluntary facial expression, visual and olfactory stimuli or film clips (seeTable 2). Response of the autonomic nervous system is expressed by differentphysiological reactions. These reactions are for example changes in heart rate, skinconductance, skin temperature, respiration frequency etc. There is also a lot ofcritiques towards the evidence of distinct response patterns. Cacioppo et al. (2000)state, according to a meta-analysis of the studies investigating the physiologicalresponses observed during basic emotions, that these studies only provide equiv-ocal evidence. Rainville et al. (2006) propose two reasons for the limited result infinding distinctive physiological patterns regarding basic emotions. First, there isinadequate elicitation of the target emotion to be investigated. Second, there isincomplete physiological characterization of the following somatic states. As there issuch a controversial discussion about the existence of distinct physiological patternsassociated with basic emotions there clearly is the need of further investigation.
Table 2: Selected Literature on Psychophysiological Parameters(HR = heart rate, SC/SR = skin conductance/resistance, SP = skin potential)
(BP = blood pressure, ST = skin temperature, RF = respiration frequency, MT = muscle tension, P = pulse, PF = blood flow, ECG = electrocardiography)
Author(s) Published in HR SC/SR SP BP ST RF MT P BF ECGVianna et al. (2009) International Journal of Psychophysiol-
ogy, Vol. 72X X
Rainville et al. (2006) International Journal of Psychophysiol-ogy, Vol. 61
X X X
Christie and Friedman (2004) International Journal of Psychophysiol-ogy, Vol. 51
X X X
Vernet-Maury et al. (1999) Journal of the Autonomic Nervous Sys-tem, Vol. 75
X X X X X X
Ekman et al. (1983) Science, Vol. 221 X X XAverill (1969) The Society of Psychophysiological Re-
search, Vol. 5, No. 4X X X X X X
Collet et al. (1997) Journal of the Autonomic Nervous Sys-tem, Vol. 62
X X X X X
Levenson et al. (1990) Psychophysiology, Vol. 27, No. 4 X X X
3.2 Methods on investigating the role of emotions in decision-making
Understanding how the brain deals with uncertainty and how subjective economicpreferences are represented neurally are two of the central motivating problemsof the emerging discipline of neuroeconomics. Valuation of gains and losses inrisky situations play an important role in human decision-making in order to makeadvantageous decisions. As mentioned before subjects do not maximize their utilityby weighting outcomes with probabilities and they would not accept the sameamount of money for a good they own that they were willing to pay for the samegood. As these irregularities occur systematically the question ”Why?” needs to beanswered. In recent years the belief came up, that emotional processing plays animportant role in decision-making.
There are different methods to investigate the role of emotions in human decision-making and the impact on economics. The underlying neuronal processes of
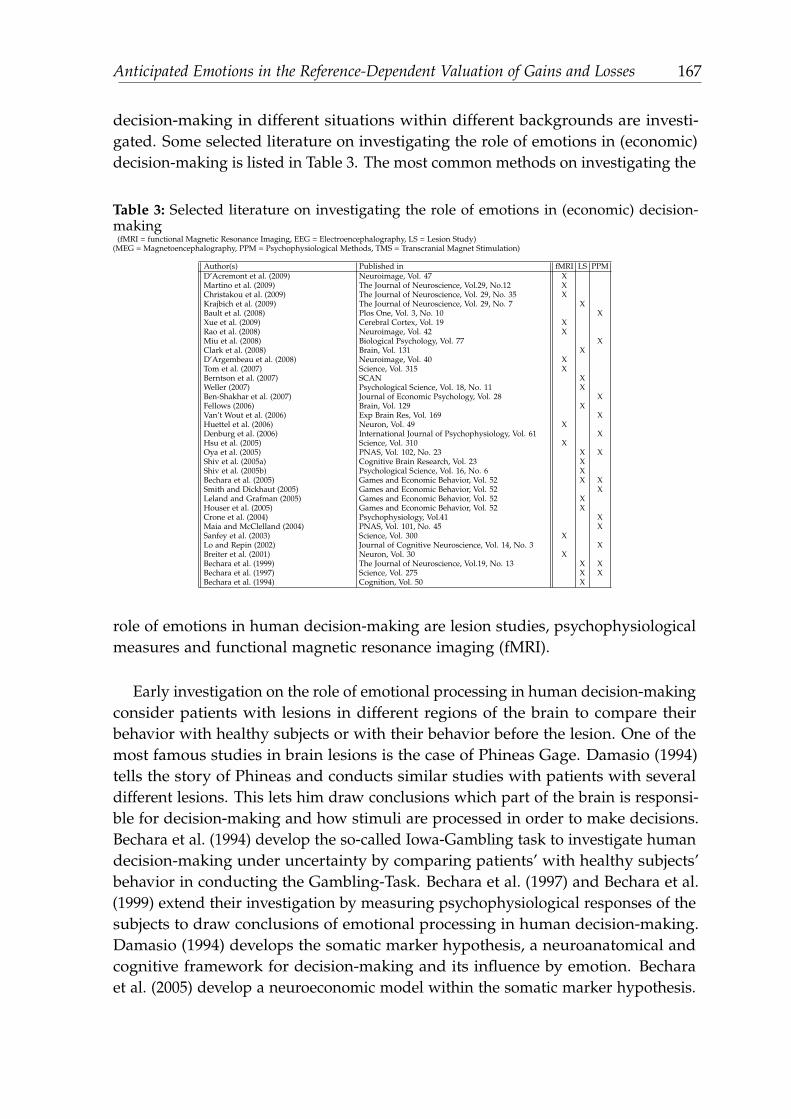
Anticipated Emotions in the Reference-Dependent Valuation of Gains and Losses 167
decision-making in different situations within different backgrounds are investi-gated. Some selected literature on investigating the role of emotions in (economic)decision-making is listed in Table 3. The most common methods on investigating the
Table 3: Selected literature on investigating the role of emotions in (economic) decision-making
(fMRI = functional Magnetic Resonance Imaging, EEG = Electroencephalography, LS = Lesion Study)(MEG = Magnetoencephalography, PPM = Psychophysiological Methods, TMS = Transcranial Magnet Stimulation)
Author(s) Published in fMRI LS PPMD’Acremont et al. (2009) Neuroimage, Vol. 47 XMartino et al. (2009) The Journal of Neuroscience, Vol.29, No.12 XChristakou et al. (2009) The Journal of Neuroscience, Vol. 29, No. 35 XKrajbich et al. (2009) The Journal of Neuroscience, Vol. 29, No. 7 XBault et al. (2008) Plos One, Vol. 3, No. 10 XXue et al. (2009) Cerebral Cortex, Vol. 19 XRao et al. (2008) Neuroimage, Vol. 42 XMiu et al. (2008) Biological Psychology, Vol. 77 XClark et al. (2008) Brain, Vol. 131 XD’Argembeau et al. (2008) Neuroimage, Vol. 40 XTom et al. (2007) Science, Vol. 315 XBerntson et al. (2007) SCAN XWeller (2007) Psychological Science, Vol. 18, No. 11 XBen-Shakhar et al. (2007) Journal of Economic Psychology, Vol. 28 XFellows (2006) Brain, Vol. 129 XVan’t Wout et al. (2006) Exp Brain Res, Vol. 169 XHuettel et al. (2006) Neuron, Vol. 49 XDenburg et al. (2006) International Journal of Psychophysiology, Vol. 61 XHsu et al. (2005) Science, Vol. 310 XOya et al. (2005) PNAS, Vol. 102, No. 23 X XShiv et al. (2005a) Cognitive Brain Research, Vol. 23 XShiv et al. (2005b) Psychological Science, Vol. 16, No. 6 XBechara et al. (2005) Games and Economic Behavior, Vol. 52 X XSmith and Dickhaut (2005) Games and Economic Behavior, Vol. 52 XLeland and Grafman (2005) Games and Economic Behavior, Vol. 52 XHouser et al. (2005) Games and Economic Behavior, Vol. 52 XCrone et al. (2004) Psychophysiology, Vol.41 XMaia and McClelland (2004) PNAS, Vol. 101, No. 45 XSanfey et al. (2003) Science, Vol. 300 XLo and Repin (2002) Journal of Cognitive Neuroscience, Vol. 14, No. 3 XBreiter et al. (2001) Neuron, Vol. 30 XBechara et al. (1999) The Journal of Neuroscience, Vol.19, No. 13 X XBechara et al. (1997) Science, Vol. 275 X XBechara et al. (1994) Cognition, Vol. 50 X
role of emotions in human decision-making are lesion studies, psychophysiologicalmeasures and functional magnetic resonance imaging (fMRI).
Early investigation on the role of emotional processing in human decision-makingconsider patients with lesions in different regions of the brain to compare theirbehavior with healthy subjects or with their behavior before the lesion. One of themost famous studies in brain lesions is the case of Phineas Gage. Damasio (1994)tells the story of Phineas and conducts similar studies with patients with severaldifferent lesions. This lets him draw conclusions which part of the brain is responsi-ble for decision-making and how stimuli are processed in order to make decisions.Bechara et al. (1994) develop the so-called Iowa-Gambling task to investigate humandecision-making under uncertainty by comparing patients’ with healthy subjects’behavior in conducting the Gambling-Task. Bechara et al. (1997) and Bechara et al.(1999) extend their investigation by measuring psychophysiological responses of thesubjects to draw conclusions of emotional processing in human decision-making.Damasio (1994) develops the somatic marker hypothesis, a neuroanatomical andcognitive framework for decision-making and its influence by emotion. Becharaet al. (2005) develop a neuroeconomic model within the somatic marker hypothesis.
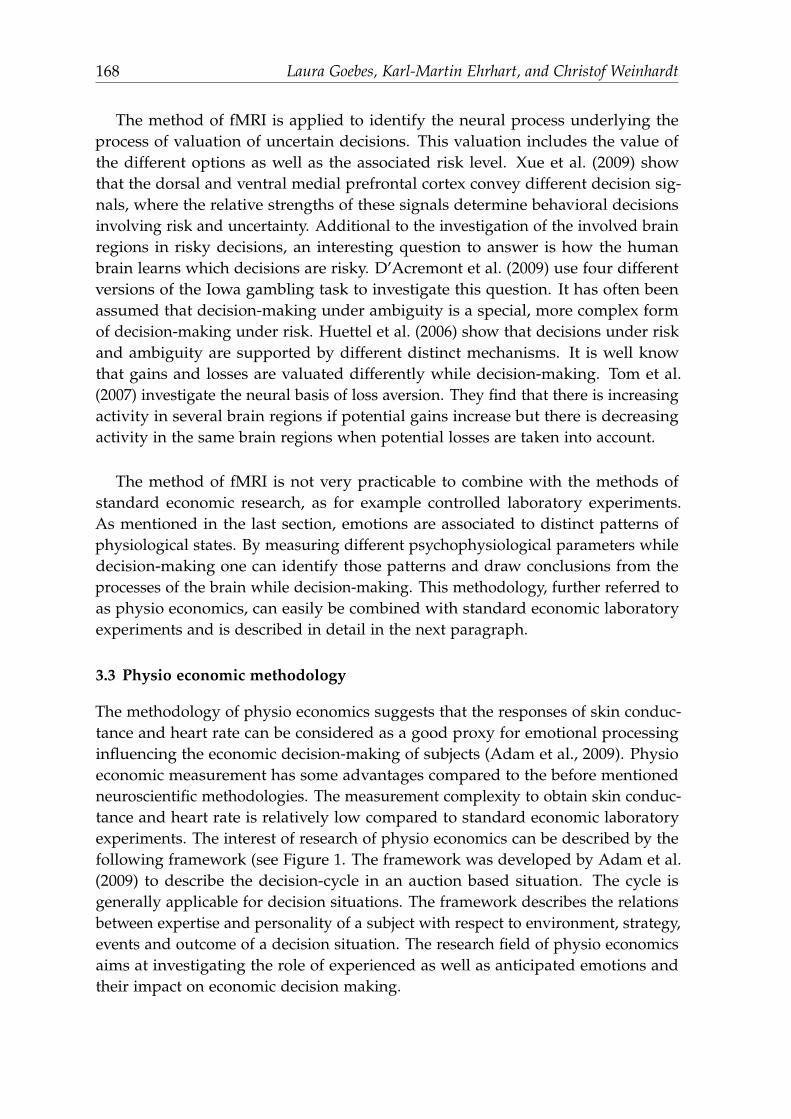
168 Laura Goebes, Karl-Martin Ehrhart, and Christof Weinhardt
The method of fMRI is applied to identify the neural process underlying theprocess of valuation of uncertain decisions. This valuation includes the value ofthe different options as well as the associated risk level. Xue et al. (2009) showthat the dorsal and ventral medial prefrontal cortex convey different decision sig-nals, where the relative strengths of these signals determine behavioral decisionsinvolving risk and uncertainty. Additional to the investigation of the involved brainregions in risky decisions, an interesting question to answer is how the humanbrain learns which decisions are risky. D’Acremont et al. (2009) use four differentversions of the Iowa gambling task to investigate this question. It has often beenassumed that decision-making under ambiguity is a special, more complex formof decision-making under risk. Huettel et al. (2006) show that decisions under riskand ambiguity are supported by different distinct mechanisms. It is well knowthat gains and losses are valuated differently while decision-making. Tom et al.(2007) investigate the neural basis of loss aversion. They find that there is increasingactivity in several brain regions if potential gains increase but there is decreasingactivity in the same brain regions when potential losses are taken into account.
The method of fMRI is not very practicable to combine with the methods ofstandard economic research, as for example controlled laboratory experiments.As mentioned in the last section, emotions are associated to distinct patterns ofphysiological states. By measuring different psychophysiological parameters whiledecision-making one can identify those patterns and draw conclusions from theprocesses of the brain while decision-making. This methodology, further referred toas physio economics, can easily be combined with standard economic laboratoryexperiments and is described in detail in the next paragraph.
3.3 Physio economic methodology
The methodology of physio economics suggests that the responses of skin conduc-tance and heart rate can be considered as a good proxy for emotional processinginfluencing the economic decision-making of subjects (Adam et al., 2009). Physioeconomic measurement has some advantages compared to the before mentionedneuroscientific methodologies. The measurement complexity to obtain skin conduc-tance and heart rate is relatively low compared to standard economic laboratoryexperiments. The interest of research of physio economics can be described by thefollowing framework (see Figure 1. The framework was developed by Adam et al.(2009) to describe the decision-cycle in an auction based situation. The cycle isgenerally applicable for decision situations. The framework describes the relationsbetween expertise and personality of a subject with respect to environment, strategy,events and outcome of a decision situation. The research field of physio economicsaims at investigating the role of experienced as well as anticipated emotions andtheir impact on economic decision making.
Anticipated Emotions in the Reference-Dependent Valuation of Gains and Losses 169
Figure 1: Basic Framework
4 An experimental approach to anticipated emotions in thevaluation of gains and losses
Research in neuroscience suggests that rational decision-making depends on prioremotional processing. The somatic marker hypothesis provides a systems-levelneuroanatomical and cognitive framework for decision-making under risk and itsinfluence by emotion. The key idea of this hypothesis is that decision-making is aprocess that is influenced by marker signals, that express themselves in emotionsand feelings (Bechara et al., 2005). According to the authors, an emotion is definedas follows:
An emotion is defined as a collection of changes in body and brain statestriggered by a dedicated brain system that responds to specific contents ofones perceptions, actual or recalled, relative to a particular object or event.
The event that predictably causes an emotion is an emotionally-competent stimulus.The body responses referred to the stimulus result in a specific somatic state, thatincludes physiological reactions. These reactions are for example, as describedbefore, changes in heart rate, skin conductance, respiration etc. A stimulus can bea primary or secondary inducer. In the investment world, primary inducers arereactions to market events, secondary inducers are for example thoughts aboutwhat to do next or about consequences of a decision. Primary inducers result inexperienced emotions while secondary inducers result in anticipated emotions.
The observations of Kahneman and Tversky captured aspects of human economicchoice that were contrary to standard economic theory. However, the prospect the-ory does not explain why humans choose the way they do.
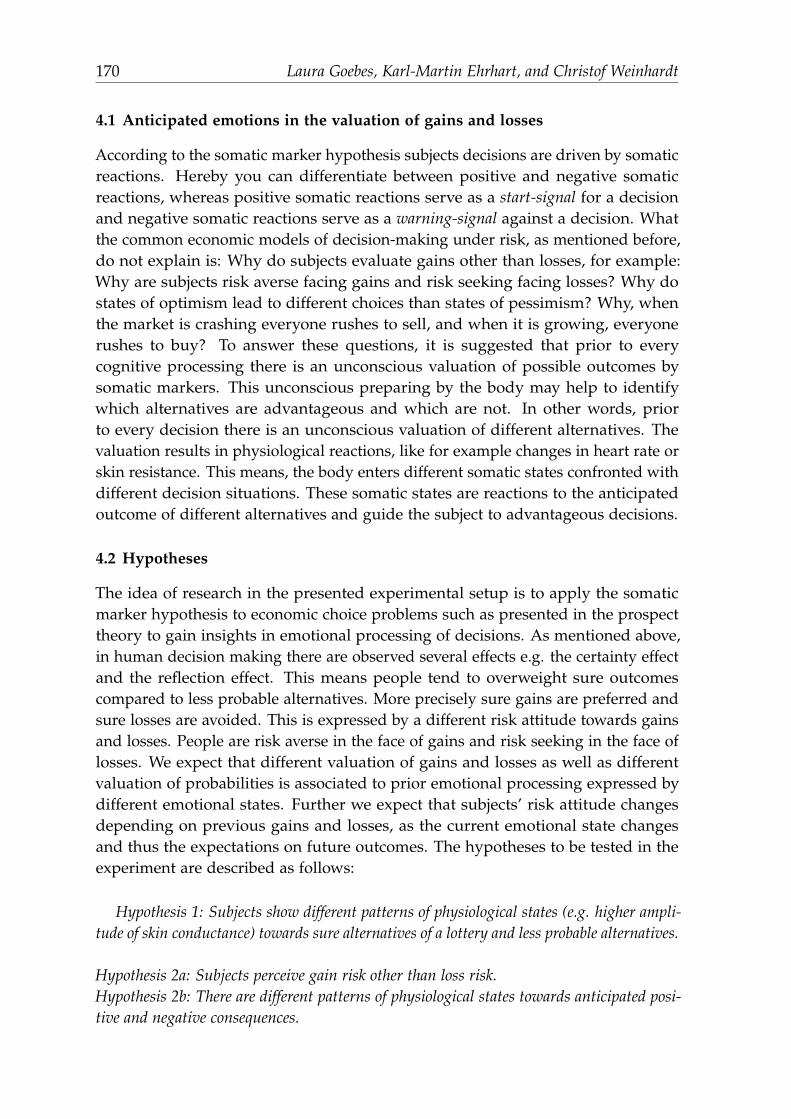
170 Laura Goebes, Karl-Martin Ehrhart, and Christof Weinhardt
4.1 Anticipated emotions in the valuation of gains and losses
According to the somatic marker hypothesis subjects decisions are driven by somaticreactions. Hereby you can differentiate between positive and negative somaticreactions, whereas positive somatic reactions serve as a start-signal for a decisionand negative somatic reactions serve as a warning-signal against a decision. Whatthe common economic models of decision-making under risk, as mentioned before,do not explain is: Why do subjects evaluate gains other than losses, for example:Why are subjects risk averse facing gains and risk seeking facing losses? Why dostates of optimism lead to different choices than states of pessimism? Why, whenthe market is crashing everyone rushes to sell, and when it is growing, everyonerushes to buy? To answer these questions, it is suggested that prior to everycognitive processing there is an unconscious valuation of possible outcomes bysomatic markers. This unconscious preparing by the body may help to identifywhich alternatives are advantageous and which are not. In other words, priorto every decision there is an unconscious valuation of different alternatives. Thevaluation results in physiological reactions, like for example changes in heart rate orskin resistance. This means, the body enters different somatic states confronted withdifferent decision situations. These somatic states are reactions to the anticipatedoutcome of different alternatives and guide the subject to advantageous decisions.
4.2 Hypotheses
The idea of research in the presented experimental setup is to apply the somaticmarker hypothesis to economic choice problems such as presented in the prospecttheory to gain insights in emotional processing of decisions. As mentioned above,in human decision making there are observed several effects e.g. the certainty effectand the reflection effect. This means people tend to overweight sure outcomescompared to less probable alternatives. More precisely sure gains are preferred andsure losses are avoided. This is expressed by a different risk attitude towards gainsand losses. People are risk averse in the face of gains and risk seeking in the face oflosses. We expect that different valuation of gains and losses as well as differentvaluation of probabilities is associated to prior emotional processing expressed bydifferent emotional states. Further we expect that subjects’ risk attitude changesdepending on previous gains and losses, as the current emotional state changesand thus the expectations on future outcomes. The hypotheses to be tested in theexperiment are described as follows:
Hypothesis 1: Subjects show different patterns of physiological states (e.g. higher ampli-tude of skin conductance) towards sure alternatives of a lottery and less probable alternatives.
Hypothesis 2a: Subjects perceive gain risk other than loss risk.Hypothesis 2b: There are different patterns of physiological states towards anticipated posi-tive and negative consequences.
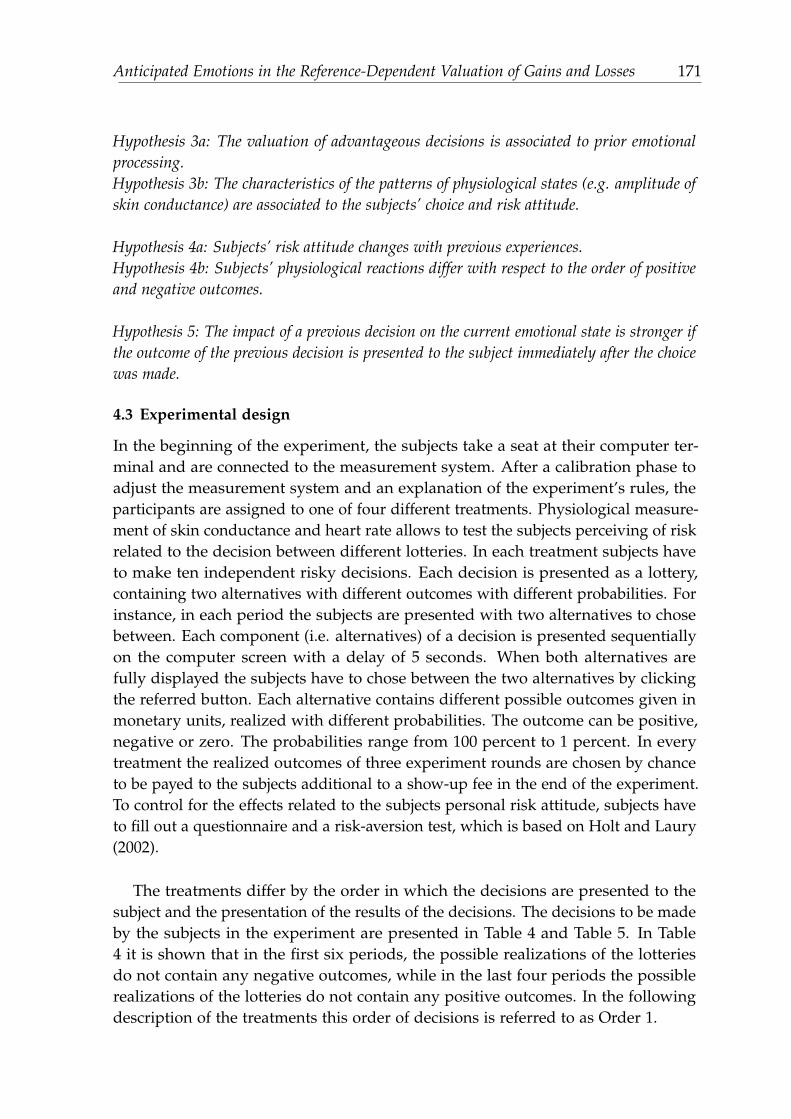
Anticipated Emotions in the Reference-Dependent Valuation of Gains and Losses 171
Hypothesis 3a: The valuation of advantageous decisions is associated to prior emotionalprocessing.Hypothesis 3b: The characteristics of the patterns of physiological states (e.g. amplitude ofskin conductance) are associated to the subjects’ choice and risk attitude.
Hypothesis 4a: Subjects’ risk attitude changes with previous experiences.Hypothesis 4b: Subjects’ physiological reactions differ with respect to the order of positiveand negative outcomes.
Hypothesis 5: The impact of a previous decision on the current emotional state is stronger ifthe outcome of the previous decision is presented to the subject immediately after the choicewas made.
4.3 Experimental design
In the beginning of the experiment, the subjects take a seat at their computer ter-minal and are connected to the measurement system. After a calibration phase toadjust the measurement system and an explanation of the experiment’s rules, theparticipants are assigned to one of four different treatments. Physiological measure-ment of skin conductance and heart rate allows to test the subjects perceiving of riskrelated to the decision between different lotteries. In each treatment subjects haveto make ten independent risky decisions. Each decision is presented as a lottery,containing two alternatives with different outcomes with different probabilities. Forinstance, in each period the subjects are presented with two alternatives to chosebetween. Each component (i.e. alternatives) of a decision is presented sequentiallyon the computer screen with a delay of 5 seconds. When both alternatives arefully displayed the subjects have to chose between the two alternatives by clickingthe referred button. Each alternative contains different possible outcomes given inmonetary units, realized with different probabilities. The outcome can be positive,negative or zero. The probabilities range from 100 percent to 1 percent. In everytreatment the realized outcomes of three experiment rounds are chosen by chanceto be payed to the subjects additional to a show-up fee in the end of the experiment.To control for the effects related to the subjects personal risk attitude, subjects haveto fill out a questionnaire and a risk-aversion test, which is based on Holt and Laury(2002).
The treatments differ by the order in which the decisions are presented to thesubject and the presentation of the results of the decisions. The decisions to be madeby the subjects in the experiment are presented in Table 4 and Table 5. In Table4 it is shown that in the first six periods, the possible realizations of the lotteriesdo not contain any negative outcomes, while in the last four periods the possiblerealizations of the lotteries do not contain any positive outcomes. In the followingdescription of the treatments this order of decisions is referred to as Order 1.
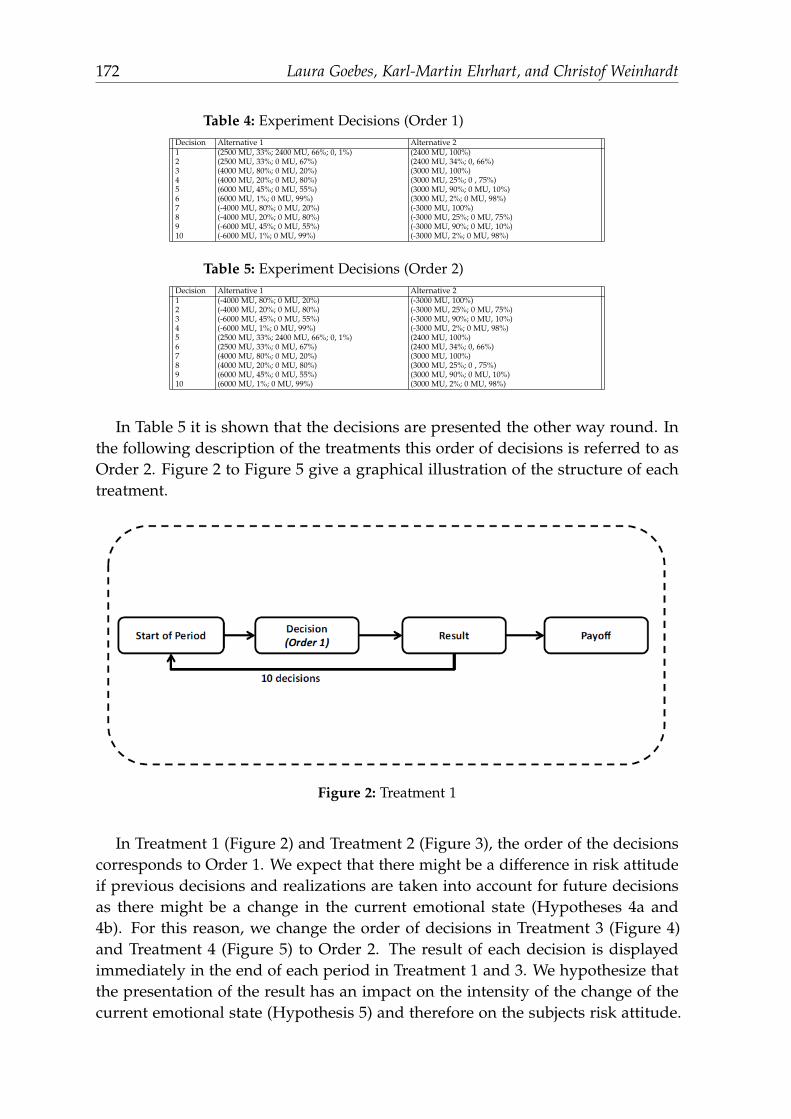
172 Laura Goebes, Karl-Martin Ehrhart, and Christof Weinhardt
Table 4: Experiment Decisions (Order 1)Decision Alternative 1 Alternative 21 (2500 MU, 33%; 2400 MU, 66%; 0, 1%) (2400 MU, 100%)2 (2500 MU, 33%; 0 MU, 67%) (2400 MU, 34%; 0, 66%)3 (4000 MU, 80%; 0 MU, 20%) (3000 MU, 100%)4 (4000 MU, 20%; 0 MU, 80%) (3000 MU, 25%; 0 , 75%)5 (6000 MU, 45%; 0 MU, 55%) (3000 MU, 90%; 0 MU, 10%)6 (6000 MU, 1%; 0 MU, 99%) (3000 MU, 2%; 0 MU, 98%)7 (-4000 MU, 80%; 0 MU, 20%) (-3000 MU, 100%)8 (-4000 MU, 20%; 0 MU, 80%) (-3000 MU, 25%; 0 MU, 75%)9 (-6000 MU, 45%; 0 MU, 55%) (-3000 MU, 90%; 0 MU, 10%)10 (-6000 MU, 1%; 0 MU, 99%) (-3000 MU, 2%; 0 MU, 98%)
Table 5: Experiment Decisions (Order 2)Decision Alternative 1 Alternative 21 (-4000 MU, 80%; 0 MU, 20%) (-3000 MU, 100%)2 (-4000 MU, 20%; 0 MU, 80%) (-3000 MU, 25%; 0 MU, 75%)3 (-6000 MU, 45%; 0 MU, 55%) (-3000 MU, 90%; 0 MU, 10%)4 (-6000 MU, 1%; 0 MU, 99%) (-3000 MU, 2%; 0 MU, 98%)5 (2500 MU, 33%; 2400 MU, 66%; 0, 1%) (2400 MU, 100%)6 (2500 MU, 33%; 0 MU, 67%) (2400 MU, 34%; 0, 66%)7 (4000 MU, 80%; 0 MU, 20%) (3000 MU, 100%)8 (4000 MU, 20%; 0 MU, 80%) (3000 MU, 25%; 0 , 75%)9 (6000 MU, 45%; 0 MU, 55%) (3000 MU, 90%; 0 MU, 10%)10 (6000 MU, 1%; 0 MU, 99%) (3000 MU, 2%; 0 MU, 98%)
In Table 5 it is shown that the decisions are presented the other way round. Inthe following description of the treatments this order of decisions is referred to asOrder 2. Figure 2 to Figure 5 give a graphical illustration of the structure of eachtreatment.
Figure 2: Treatment 1
In Treatment 1 (Figure 2) and Treatment 2 (Figure 3), the order of the decisionscorresponds to Order 1. We expect that there might be a difference in risk attitudeif previous decisions and realizations are taken into account for future decisionsas there might be a change in the current emotional state (Hypotheses 4a and4b). For this reason, we change the order of decisions in Treatment 3 (Figure 4)and Treatment 4 (Figure 5) to Order 2. The result of each decision is displayedimmediately in the end of each period in Treatment 1 and 3. We hypothesize thatthe presentation of the result has an impact on the intensity of the change of thecurrent emotional state (Hypothesis 5) and therefore on the subjects risk attitude.
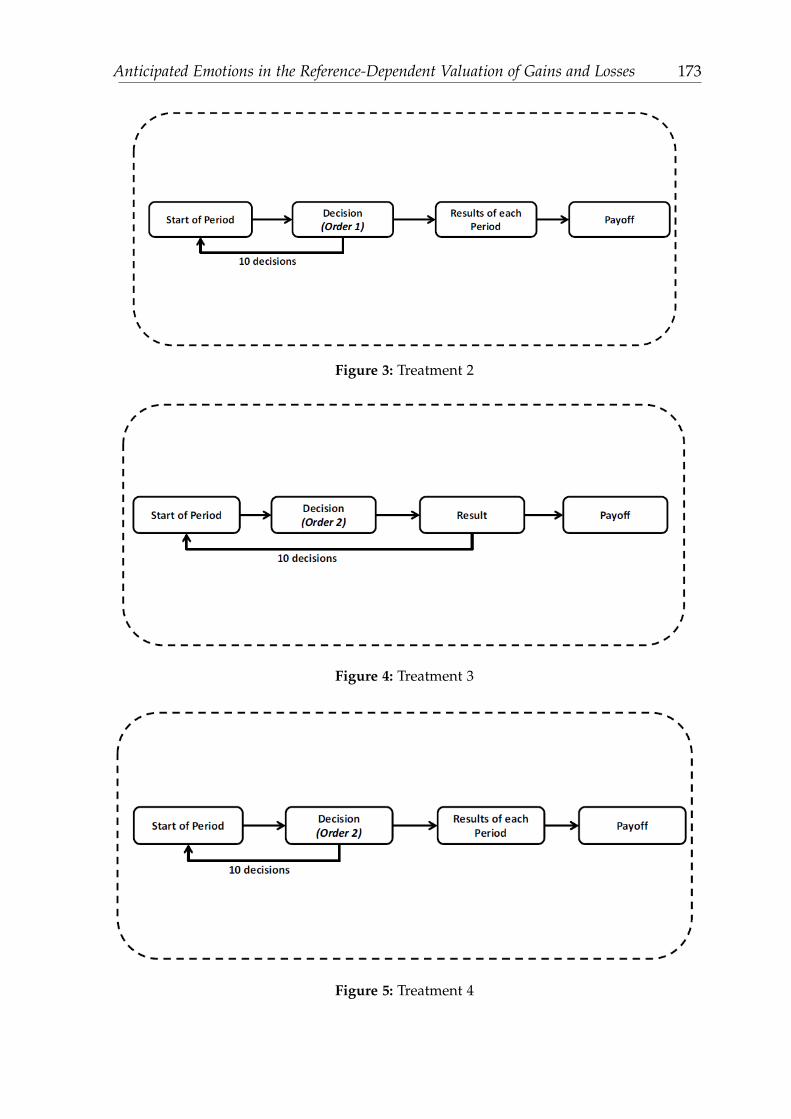
Anticipated Emotions in the Reference-Dependent Valuation of Gains and Losses 173
Figure 3: Treatment 2
Figure 4: Treatment 3
Figure 5: Treatment 4
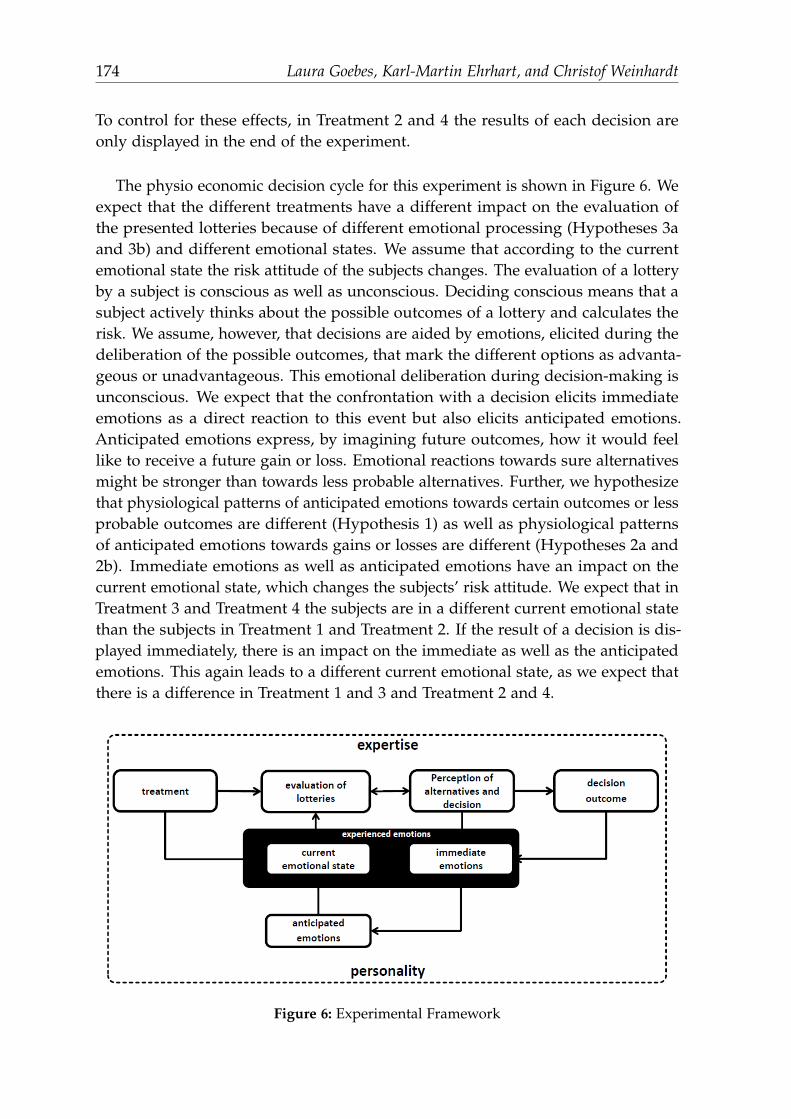
174 Laura Goebes, Karl-Martin Ehrhart, and Christof Weinhardt
To control for these effects, in Treatment 2 and 4 the results of each decision areonly displayed in the end of the experiment.
The physio economic decision cycle for this experiment is shown in Figure 6. Weexpect that the different treatments have a different impact on the evaluation ofthe presented lotteries because of different emotional processing (Hypotheses 3aand 3b) and different emotional states. We assume that according to the currentemotional state the risk attitude of the subjects changes. The evaluation of a lotteryby a subject is conscious as well as unconscious. Deciding conscious means that asubject actively thinks about the possible outcomes of a lottery and calculates therisk. We assume, however, that decisions are aided by emotions, elicited during thedeliberation of the possible outcomes, that mark the different options as advanta-geous or unadvantageous. This emotional deliberation during decision-making isunconscious. We expect that the confrontation with a decision elicits immediateemotions as a direct reaction to this event but also elicits anticipated emotions.Anticipated emotions express, by imagining future outcomes, how it would feellike to receive a future gain or loss. Emotional reactions towards sure alternativesmight be stronger than towards less probable alternatives. Further, we hypothesizethat physiological patterns of anticipated emotions towards certain outcomes or lessprobable outcomes are different (Hypothesis 1) as well as physiological patternsof anticipated emotions towards gains or losses are different (Hypotheses 2a and2b). Immediate emotions as well as anticipated emotions have an impact on thecurrent emotional state, which changes the subjects’ risk attitude. We expect that inTreatment 3 and Treatment 4 the subjects are in a different current emotional statethan the subjects in Treatment 1 and Treatment 2. If the result of a decision is dis-played immediately, there is an impact on the immediate as well as the anticipatedemotions. This again leads to a different current emotional state, as we expect thatthere is a difference in Treatment 1 and 3 and Treatment 2 and 4.
Figure 6: Experimental Framework
Anticipated Emotions in the Reference-Dependent Valuation of Gains and Losses 175
5 Conclusion and Outlook
The presented experimental design contributes in special to gain insight into thesubjects’ valuation of gains and losses dependent on the associated probabilities.With the methodology of physio-economics the role of (anticipated) emotions isinvestigated to draw conclusions from the impact of prior emotional processing oneconomical decisions. As Kahneman and Tversky point out in their prospect theory,subjects valuate gains and losses related to a reference-point. The reference-pointassigns what is seen as gain or loss individually to a subject. As losses are valuateddifferently compared to gains, subjects’ risk attitude and therefore decisions dependon where the reference-point is set. It is assumed that the reference-point is notonly set according to the status quo but also according to expected future gainsand losses. In future research, based on the results of the present experimentalsetup, the impact of the current emotional state on the calculation and shifts ofthe reference-point will be investigated. The shift of reference-point might causedifferent effects in decision-making. The so-called pseudo-endowment effect, asone possible approach to explain the so-called auction-fever, is caused by a shiftof reference-point resulting in higher willingness to pay. Auction-fever combinesdifferent approaches to explain effects on the development of prices in auctions.Insights from the proposed experiment and further research can contribute toextensions of the classical economic theories and models where descriptions andexplanations are not conform with actual observations of human behavior.
References
Adam, M. T. P., M. Gamer, and C. Weinhardt (2009): “Measuring the impact ofemotions in electronic auctions: a physioeconomic approach.” Working paper,Karlsruhe Institute of Technology (KIT).
Allais, M. (1953): “Le Comportement de l’Homme Rationnel devant le Risque:Critique des Postulats et Axiomes de l’Ecole,” Econometrica, 21(4), pp. 503–546.
Averill, J. R. (1969): “Autonomic Response Patterns During Sadness and Mirth,”Psychophysiology, 5(4), pp. 399–414.
Bault, N., G. Coricelli, and A. Rustichini (2008): “Interdependent Utilities: HowSocial Ranking Affects Choice Behavior,” PLoS ONE, 3(10), p. e3477.
Bechara, A., H. Damasio, A. R. Damasio, and S. W. Anderson (1994): “Insensitivityto future consequences following damage to human prefrontal cortex,” Cognition,50, pp. 7–15.
Bechara, A., H. Damasio, A. R. Damasio, and G. P. Lee (1999): “Different Contri-butions of the Human Amygdala and ventromedial prefrontal cortex to decisionmaking,” The Journal of Neuroscience, 19(13), pp. 5473–5481.
Bechara, A., H. Damasio, D. Tranel, and A. Damasio (2005): “The Iowa GamblingTask and the somatic marker hypothesis: some questions and answers,” Trends inCognitive Sciences, 9(4), pp. 159 – 162.

176 Laura Goebes, Karl-Martin Ehrhart, and Christof Weinhardt
Bechara, A., H. Damasio, D. Tranel, and A. R. Damasio (1997): “Deciding advanta-geously before knowing the advantageous strategy,” Science, 275, pp. 1293–1295.
Ben-Shakhar, G., G. Bornstein, A. Hopfensitz, and F. van Winden (2007): “Reciprocityand emotions in bargaining using physiological and self-report measures,” Journalof Economic Psychology, 28(3), pp. 314 – 323.
Berntson, G. G., A. Bechara, H. Damasio, D. Tranel, and J. T. Cacioppo (2007):“Amygdala Contribution to selective dimensions of emotion,” SCAN, 1, pp. 1–7.
Breiter, H. C., I. Aharon, D. Kahneman, A. Dale, and P. Shizgal (2001): “FunctionalImaging of Neural responses to Expectancy and Experience of Monetary Gainsand Losses,” Neuron, 30, pp. 619–639.
Cacioppo, J. T., G. G. Berntson, J. T. Larsen, K. M. Poehlmann, and T. A. Ito (2000):“The Psychophysiology of Emotion,” Biological and Neurophysiological approaches,pp. 173–191.
Christakou, A., M. Brammer, V. Giampietro, and K. Rubia (2009): “Right Ventro-medial and Dorsolateral Prefrontal Cortices Mediate Adaptive Decisions underAmbiguity by Integrating Choice Utility and Outcome Evaluation,” J. Neurosci.,29(35), pp. 11020–11028.
Christie, I. C. and B. Friedman (2004): “Autonomic specificity of discrete emotionand dimensions of affective space: a multivariate approach,” International Journalof Psychophysiology, 51, pp. 143–153.
Clark, L., A. Bechara, H. Damasio, M. Aitken, B. J. Sahakian, and T. Robbons (2008):“Differential effects of insular and ventromedial prefrontal cortex lesions on riskydecision-making,” Brain, 131, pp. 1311 – 1322.
Collet, C., E. Vernet-Maury, G. Delhomme, and A. Dittmar (1997): “Autonomicnervous system response patterns specificity to basic emotions,” Journal of theAutonomic Nervous System, 62, pp. 45–57.
Crone, E. A., R. J. M. Somsen, B. van Beek, and M. W. V. D. Molen (2004): “HeartRate and skin conductance analysis of antecendents and consequences of decision-making,” Psychophsiology, 15(4), pp. 316–324.
D’Acremont, M., Z.-L. Lu, X. Li, M. V. der Linden, and A. Bechara (2009): “Neuralcorrelates of risk prediction error during reinforcement learning in humans,”NeuroImage, 47(4), pp. 1929 – 1939.
Damasio, A. R. (1994): Descartes Error: Emotion, Reason and the Human Brain, G PPutnams Sons.
D’Argembeau, A., G. Xue, Z.-L. Lu, M. V. der Linden, and A. Bechara (2008):“Neural Correlates of envisioning emotional events in the near and far future,”NeuroImage, 40, pp. 398–407.
Denburg, N. L., E. C. Recknor, A. Bechara, and D. Tranel (2006): “Psychophysiologi-cal anticipation of positive outcomes promotes advantageous decision-making innormal older persons,” International Journal of Psychophysiology, 61(1), pp. 19 – 25.
Ekman, P., R. W. Levenson, and W. V. Friesen (1983): “Autonomic Nervous SystemActivity Distinguishes Among Emotions,” Science, 221, pp. 1208–1210.
Anticipated Emotions in the Reference-Dependent Valuation of Gains and Losses 177
Fellows, L. K. (2006): “Deciding how to decide: ventromedial frontal lobe damageaffects information acquisition in multi-attribute decision making,” Brain, 129, pp.944–952(9).
Holt, C. and S. Laury (2002): “Risk aversion and incentive effects,” The americaneconomic review, 92(5), pp. 1644–1655.
Houser, D., A. Bechara, M. Keane, K. McCabe, and V. Smith (2005): “Identifyingindividual differences: An algorithm with application to Phineas Gage,” Gamesand Economic Behavior, 52(2), pp. 373 – 385.
Hsu, M., M. Bhatt, R. Adolphs, D. Tranel, and C. F. Camerer (2005): “Neural SystemsResponding to Degrees of Uncertainty in Human Decision-Making,” Science, 310,pp. 1680–1683.
Huettel, S. A., C. J. Stowe, E. M. Gordon, B. T. Warner, and M. L. Platt (2006):“Neural Signatures of Economic Preferences for Risk and Ambiguity,” Neuron,49(5), pp. 765 – 775.
James, W. (1884): “What is an Emotion?” Mind, 9(34), pp. 188–205.Kahneman, D. and A. Tversky (1979): “Prospect Theory: An Analysis of Decision
under risk,” Econometrica, 47(2), pp. 263–291.Krajbich, I., R. Adolphs, D. Tranel, N. Denburg, and C. Camerer (2009): “Economic
Games Quantify Diminished Sense of Guilt in Patients with Damage to thePrefrontal Cortex,” J. Neurosci., 29(7), pp. 2188–2192.
Lange, C. G. and H. Kurella (1887): Ueber Gemuthsbewegungen: Eine Psycho-physiologische Studie, T. Thomas.
Leland, J. W. and J. Grafman (2005): “Experimental tests of the Somatic Markerhypothesis,” Games and Economic Behavior, 52(2), pp. 386 – 409.
Levenson, R. W., P. Ekman, and W. V. Friesen (1990): “Voluntary facial actiongenerates emotion-specific autonomic nervous system activity,” Psychophysiology,27(4), pp. 363–384.
Lo, A. W. and D. V. Repin (2002): “The Psychophysiology of real-time financial riskprocessing,” Journal of cognitive Neuroscience, 14(3), pp. 323–339.
Maia, T. V. and J. L. McClelland (2004): “A reexamination of the evidence for thesomatic marker hypothesis: What participants really know in the Iowa gamblingtask,” PNAS, 101(45), pp. 16075–16080.
Martino, B. D., D. Kumaran, B. Holt, and R. J. Dolan (2009): “The Neurobiology ofReference-Dependent Value Computation,” The Journal of Neuroscience, 29(12), pp.3833–3842.
Miu, A. C., R. M. Heilman, and D. Houser (2008): “Anxiety impairs decision-making: Psychophysiological evidence from the Iowa Gambling Task,” BiologicalPsychology, 77, pp. 353–358.
Oya, H., R. Adolphs, H. Kawasaki, A. Bechara, A. Damasio, and I. Howard,Matthew A. (2005): “Psychophysiological anticipation of positive outcomes pro-motes advantageous decision-making in normal older persons,” Proceedings of theNational Academy of Sciences of the United States of America, 102(23), pp. 8351–8356.

178 Laura Goebes, Karl-Martin Ehrhart, and Christof Weinhardt
Rainville, P., A. Bechara, N. Naqvi, and A. R. Damasio (2006): “Basic emotionsare associated with distinct patterns of cardiorespiratory activity,” InternationalJournal of Psychophysiology, 61, pp. 5–18.
Rao, H., M. Korczykowski, J. Pluta, A. Hoang, and J. A. Detre (2008): “Neuralcorrelates of voluntary and involuntary risk taking in the human brain: An fMRIStudy of the Balloon Analog Risk Task (BART),” NeuroImage, 42(2), pp. 902 – 910.
Sanfey, A. G., J. K. Rilling, J. A. Aronson, L. E. Nystrom, and J. D. Cohen (2003):“The neural basis of decision-making in the ultimatum game,” Science, 300, pp.1755–1758.
Shiv, B., G. Loewenstein, and A. Bechara (2005a): “The dark side of emotion indecision-making: When individuals with decreased emotional reactions makemore advantageous decisions,” Cognitive Brain Research, 23(1), pp. 85 – 92.
Shiv, B., G. Loewenstein, A. Bechara, H. Damasio, and A. R. Damasio (2005b):“Investment Behavior and the Negative Side of Emotion,” Psychological Sience,16(6), pp. 435–439.
Smith, K. and J. Dickhaut (2005): “Economics and emotion: Institutions matter,”Games and Economic Behavior, 52(2), pp. 316 – 335.
Tom, S. M., C. R. Fox, C. Trepel, and R. A. Poldrack (2007): “The Neural Basis ofLoss Aversion in Decision-Making Under Risk,” Science, 315(5811), pp. 515–518.
Van’t Wout, M., R. S. Kahn, A. G. Sanfey, and A. Aleman (2006): “Affective stateand decision-making in the Ultimatum Game,” Experimental brain research, 129,pp. 564–568.
Vernet-Maury, E., O. Alaoui-Ismili, A. Dittmar, G. Delhomme, and J. Chanel (1999):“Basic Emotions induced by odorant: a new approach based on autonomic patternresults,” Journal of autonomic nervous system, 75, pp. 176–183.
Vianna, E. P. M., N. Naqvi, A. Bechara, and D. Tranel (2009): “Does vivid emotionalimagery depend on body signals?” International Journal of Psychophysiology, 72, pp.46–50.
von Neumann, J. and O. Morgenstern (1944): Theory of Games and Economic Behavior,Princeton University Press.
Weller, J. A. (2007): “Neural Correlates of Adaptive Decision Making for RiskyGains and Losses,” Psychological Science, 18, pp. 958–964(7).
Xue, G., Z. Lu, I. P. Levin, J. A. Weller, X. Li, and A. Bechara (2009): “FunctionalDissociations of Risk and Reward Processing in the Medial Prefrontal Cortex,”Cerebral Cortex, 19, pp. 1019–1027.
Consumer Perception of Time-Based Pricing
Lukas Wiewiorra1, Jan Kramer1, Christof Weinhardt1, and Karl-Martin Ehrhart2
1 Institute of Information Systems and Management, KITwiewiorra, kraemer, [email protected]
2 Institute of Economic Theory and Statistics, [email protected]
Summary. The introduction of new mobile phone tariffs with cost caps raises some in-teresting questions about consumer perception of additional flat rate value components,especially the so called taxi meter effect. The paper presents a seminal experimental setupto test if consumers feel negatively if costs are realized per unit of time. Additionally thedesign allows to assess the interplay of the so called insurance and taxi meter effect. Withthis results an even better understanding of cost cap tariffs and potential tariff switchingbehavior in mobile telecommunications would be possible. In contrast to a flat rate pricing,the cost cap tariff allows for cost insurance, while maintaining the taximeter property aslong as the cost cap is not reached. The proposed experimental design aims at measuring thephysiological differences of participants with a flat rate tariff in comparison to a pay-per-useand a cost cap tariff in a controlled laboratory experiment with the methodology of physioeconomics. The authors present a brief summary of the literature about tariff bias research,a review of the related methodology as well as an introduction into physio economics. Itfollows an outline of the laboratory experiment and the hypotheses that can be tested withthis experimental setup.
1 Introduction
Nowadays consumers face a sheer endless variety of tariff alternatives when de-ciding for a telecommunication or information service. Competing firms engagein price competition, since there is not much scope for quality differentiation. Inthe early days of mobile telecommunication services in Germany consumers couldnot opt for a flat rate plan. Network providers offered usage based tariffs with afixed fee per billing period. Prices per minute were usually higher at daytime, sincenetwork providers established tariffs similar to the peak load pricing scheme inclassic network industries. Additionally users were charged comparably high ratesfor calls terminated into a concurring networks.
1.1 Tariffing Mobile Telecommunication
So called ”Two-part tariffs” have a long tradition in telephony (Littlechild, 1975).Their popularity stems from the fact that a large portion of the provider’s costs
180 Lukas Wiewiorra, Jan Kramer, Christof Weinhardt, and Karl-Martin Ehrhart
are fixed costs related to the build up, maintenance and operation of the networkinfrastructure, which can be recovered by the fixed component of the two-part tariff(Valletti, 2003). On the contrary, the marginal costs of calling, which are constitutedthrough switching or interconnection fees, for example, are relatively small andcan be recovered by the variable component of the two-part tariff. In fact, if thetelephony provider holds a monopoly, which has been the case for the fixed-lineproviders for most of the twentieth century, two-part tariffs can even achieve toextract customer rent completely, comparably to perfect price discrimination (Oi,1971).Later on the network providers focused almost simultaneously on three part tariffswitch are defined by a usage allowance, a corresponding access price and a marginalprice for any usage in excess of the allowance. This innovation allows them toprice discriminate between consumers based on the expected amount of usage.Therefore providers discriminate not solely over the average usage, but also overvariation of usage (Lambrecht et al., 2007). A clever design of the set of offeredallowances can exploit consumer uncertainty of future demand and lurks themmore likely into more expensive tariffs with a higher amount of included minutes.Obviously this pricing scheme is not linear since the average price per minute indifferent combinations of allowance and access price can vary. It is not surprisingthat network providers were enthusiastic about this form of price discrimination.Despite the intensive marketing campaigns consumers did not fully accept this tariffscheme until now.Following the decision of E-Plus (KPN) to grant mobile discounters access to theirnetwork, the other operators1 jumped on the bandwagon soon. Competition led toan enormous variety of tariffs in the market and prices for mobile telecommunicationservices dropped rapidly. Today every network provider offers all-net flat rates,defined by a fixed price for all calls originated and terminated inside Germany.2
Since a few months a new tariff model changes the market again. A new innovativecost cap tariff has been introduced to the German mobile market in 2009 by o2(Telefonica).3 The cost cap tariff is a new type of two-part tariff that constitutesa hybrid between a pay-per-use and a flat rate. It is a pure uniform pay-per-usetariff until the total costs exceed a predefined cost cap, at which the tariff effectivelybecomes a flat rate. o2 claims that the cost cap tariff is a great success and hassignificantly contributed to attracting new customers (Briegleb, 2009). Since thecurrent cost cap equals the actual market price for an all-net flatrate this tariffobviously became a weakly dominated alternative.
1 T-Mobile, Vodafone and o2 (Telefonica)2 Except for all premium- and international calls, roaming, all forms of data connections as well as
short- and multimedia messaging.3 The tariff, which is called “o2 o”, has officially been released on May 5, 2009.
Consumer Perception of Time-Based Pricing 181
1.2 Flatrate and Pay-per-use Bias
Economic theory assumes that consumers, independent of the tariff alternativesand characteristics, maximize their utility when selecting a pricing scheme fortelecommunication or information services. Therefore a chosen tariff usually shouldlead to the lowest possible bill given the anticipated usage volume of a service.Economically this corresponds to a maximization of the consumer rent. In realitypeople often behave differently from what theory suggests. Existing researchshows that consumers are often biased in favor of flat rate tariffs (e.g. Nunes, 2000;Miravete, 2003; Lambrecht and Skiera, 2006a; Gerpott, 2009; Grubb, 2009). The socalled ”flat rate bias” describes the phenomenon that consumers tend to choosea flat rate even if a pay-per-use pricing scheme would be cheaper with regard totheir usage volume. This behavior has been shown in context with all-you-can-eatbuffets (Just and Wansink, 2008), gym subscriptions (Della Vigna and Malmendier,2006), Internet access plans (e.g. Train et al., 1989; Kridel et al., 1993; Lambrechtand Skiera, 2006a) and mobile calling plans (e.g. Mitomo et al., 2007; Gerpott, 2009).Flexibility is the core property of pay-per-use tariffs. A so called ”pay-per-use bias”could be identified in a few studies (e.g. Kridel et al., 1993; Prelec and Loewenstein,1998; Miravete, 2003; Schulze and Gedenk, 2005). Consumers value the option ofconsuming less in one billing period without being committed to a high fixed fee.This can sometimes result in decisions for a usage based pricing scheme, even if aflat rate would be cheaper in the long run. Nevertheless this phenomenon seemsto be far less widespread than the flat rate bias. With respect to information andcommunication services, the literature has identified four distinctive effects that aresupposed to drive the flat rate bias:
Effects causing a Flat rate Bias
According to the insurance effect risk-averse consumers who cannot predict theirfuture demand correctly choose a flat-rate to insure against the risk of high costsin periods of higher than average usage. The convenience effect may stem fromconsumers who want to avoid the effort of finding an alternative tariff. Telecom-munications companies try to leverage this effect by offering dominated tariffalternatives. Consumers with potentially high search costs or a high degree ofconvenience end up with such a dominated tariff more likely. Due to incorrectanticipation of future demand consumers may tend to overestimation of serviceusage and therefore choose a flat-rate more frequently. If consumers enjoy the usageof a telecommunication service more if they use a flat-rate this is called the taximeter effect. The intuition behind the taxi meter effect is borrowed from the analogyof using a cab in a foreign city. It is commonly described as the reduced joy ofconsuming one unit of the service because of the immediately perceived cost ofconsumption due to the taxi meter. Since a flat rate has marginal costs of zero perunit of time the joy of consumption is higher. This prevention of immediate costreception is interpreted as one component of additional value, favoring the decision
182 Lukas Wiewiorra, Jan Kramer, Christof Weinhardt, and Karl-Martin Ehrhart
for a flat rate. The taxi meter effect can be explained by the theory of mental ac-counting (Thaler, 1985, 1999). Consumers assign costs to different mental accounts,dependent on the time of cost realization. The price of a flat rate is accounted in thebeginning of a billing period, since it is comparable to sunk costs. Therefore usageis perceived as costless or free. In contrast to that a usage based tariff is perceiveddifferently, since costs are realized per time unit. This immediate accounting ofcosts reduces the joy of every consumed unit. Lambrecht and Skiera (2006b) are thefirst controlling for all four different effects supposed to cause the total flat-rate biasand point out the importance of measuring all effects simultaneously. This papertries to shed light on two effects that are assumed to lead to biased decisions. Theauthors propose an experimental design to test isolated for this effects which can beinterpreted as additional value components of a flat rate tariff.
2 The methodology of tariff choice bias analysis
The literature about tariff biases is best categorized by the methodology that hasbeen used to conduct the economic analysis itself, but also by the type of underlyingtheoretical model.Econometric analysis based on historical usage data identifies ex-post suboptimaltariff decisions as biased. Every consumer who could have saved money in anotherbut his own tariff is labeled as potentially biased. In contrast to this approach ofmapping ex-post usage data on different ex-ante tariff alternatives, choice modelsare designed to capture the decision process of consumers itself. Those econometricmodels incorporate various independent variables like price and amount of usageto estimate the given tariff decision of a consumer. A tariff bias is incorporated intothe model as a unique tariff inherent variable. If such a variable turns out to besignificant a tariff decision is assumed to be influenced at least to some degree byother than rational parameters.Nevertheless many of those classic econometric analyses propose only intuitionsand guesses for the biases found in the data. The predominant explanation is theinability of consumers to anticipate their own amount of usage correctly in givenperiod of time. This leads to the methodological discussion of how to analyze thephenomenon. Econometric analysis of usage data appears to be the right tool if onetries to confirm the mere existence of such biases and perhaps to quantify the extent.It seems more challenging to identify and confirm influence factors witch lead tosuch biases. Since the necessary information cannot be derived by analyzing usagedata, researchers have to rely on other methodological tools. Questionnaires areone source of data to identify the influence factors of tariff decisions. Some authorsconduct so called ”quasi experiments”. As an extension of a classic questionnairethey formulate hypothetical situations and induce a usage level to measure howsubjects think they would behave in the given situations. This quasi experimental
Consumer Perception of Time-Based Pricing 183
methods obviously lack the controlled environment, as well as the direct monetaryincentives that are provided in a classic economical laboratory experiment.
3 An experimental approach to the taxi meter effect
The introduction of new mobile phone tariffs with cost caps raises some interestingquestions about consumer perception of additional flat rate value components,especially the taxi meter effect. In telecommunications the best analogy to a costlytaxi ride, as described in section 1.2, might be a service hotline call where consumersusually have to pay a higher than usual fee and have to wait in a queue beforethey receive service. The question arises if consumers experience the taxi metereffect even if they are insured against high costs and how this affects their perceivedfeelings during the consumption as well as the tariff selection process itself. Incontrast to a flat rate pricing scheme, cost cap tariffs allow for cost insurance, whilemaintaining the taximeter property as long as the cost cap is not reached. Thereforethis pricing scheme allows the experimenter to control for the interdependency ofthis two effects. The experimental design proposed in this article aims at measuringthe physiological differences of participants with a flat rate tariff in comparisonto a pay-per-use and a cost cap tariff in a controlled laboratory experiment withthe methodology of physio economics. Especially the existence of the taxi metereffect has never been verified and examined in an experimental setup. Kramer andWiewiorra (2010) already showed in a seminal study of end user cost cap tariffsthat consumers seem to perceive the taxi meter property differently under a costcap and a pay-per-use tariff. The following experimental setup will propose severaldesign parameters to isolate the tariff properties driving the taxi meter effect.
3.1 Physio economic measurement
Human decision-making is not a purely cognitive driven maximization of utility.Human behavior is to some extent influenced by emotions and perceived feelings(Loewenstein, 2000). The field of psychophysiology focuses on the relationship ofcognitive and emotional processes, physiological states and the human behavioritself. The methodology of physio economics in particular suggests that the re-sponses of heart rate and skin conductance can be considered as a good proxy foremotional processes influencing the economic decision making of human beings(Adam et al., 2009). This approach has several advantages in comparison to thequasi experimental methodology mentioned in section 2. Questionnaire data ingeneral deal with the severe problem of social desirability (Crowne and Marlowe,1960). Respondents tend to answer questions in a way they assume to appear associally suitable. Physiological parameters instead measure the activation of theautonomic nervous system and therefore cannot directly be influenced by free will.Physio economic methods add to the field by obtaining objective data not relyingon self reported information. Furthermore the measurement complexity to obtain
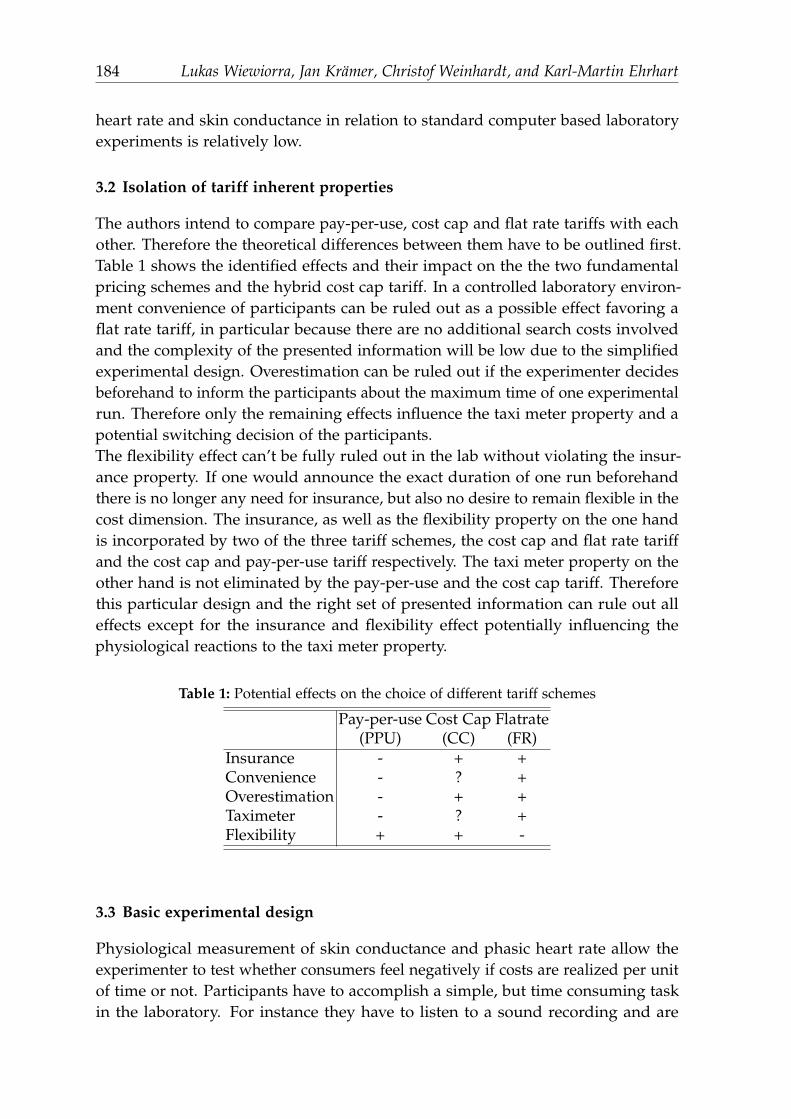
184 Lukas Wiewiorra, Jan Kramer, Christof Weinhardt, and Karl-Martin Ehrhart
heart rate and skin conductance in relation to standard computer based laboratoryexperiments is relatively low.
3.2 Isolation of tariff inherent properties
The authors intend to compare pay-per-use, cost cap and flat rate tariffs with eachother. Therefore the theoretical differences between them have to be outlined first.Table 1 shows the identified effects and their impact on the the two fundamentalpricing schemes and the hybrid cost cap tariff. In a controlled laboratory environ-ment convenience of participants can be ruled out as a possible effect favoring aflat rate tariff, in particular because there are no additional search costs involvedand the complexity of the presented information will be low due to the simplifiedexperimental design. Overestimation can be ruled out if the experimenter decidesbeforehand to inform the participants about the maximum time of one experimentalrun. Therefore only the remaining effects influence the taxi meter property and apotential switching decision of the participants.The flexibility effect can’t be fully ruled out in the lab without violating the insur-ance property. If one would announce the exact duration of one run beforehandthere is no longer any need for insurance, but also no desire to remain flexible in thecost dimension. The insurance, as well as the flexibility property on the one handis incorporated by two of the three tariff schemes, the cost cap and flat rate tariffand the cost cap and pay-per-use tariff respectively. The taxi meter property on theother hand is not eliminated by the pay-per-use and the cost cap tariff. Thereforethis particular design and the right set of presented information can rule out alleffects except for the insurance and flexibility effect potentially influencing thephysiological reactions to the taxi meter property.
Table 1: Potential effects on the choice of different tariff schemes
Pay-per-use Cost Cap Flatrate(PPU) (CC) (FR)
Insurance - + +Convenience - ? +Overestimation - + +Taximeter - ? +Flexibility + + -
3.3 Basic experimental design
Physiological measurement of skin conductance and phasic heart rate allow theexperimenter to test whether consumers feel negatively if costs are realized per unitof time or not. Participants have to accomplish a simple, but time consuming taskin the laboratory. For instance they have to listen to a sound recording and are
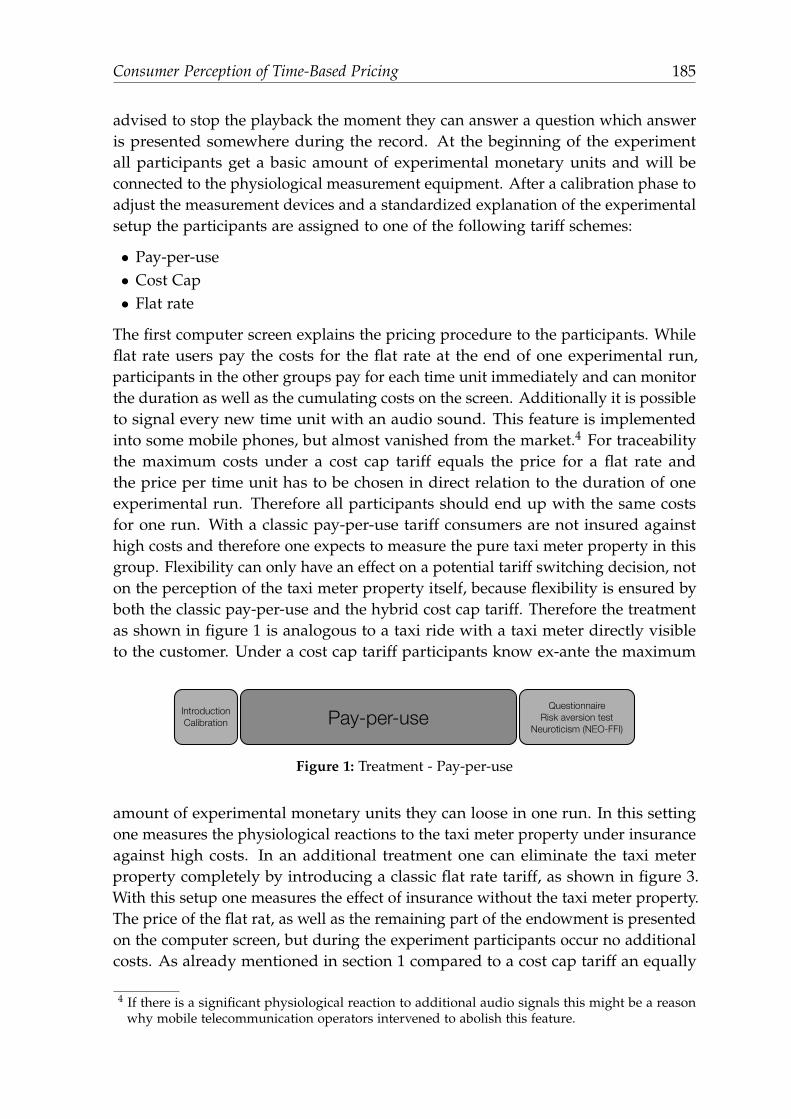
Consumer Perception of Time-Based Pricing 185
advised to stop the playback the moment they can answer a question which answeris presented somewhere during the record. At the beginning of the experimentall participants get a basic amount of experimental monetary units and will beconnected to the physiological measurement equipment. After a calibration phase toadjust the measurement devices and a standardized explanation of the experimentalsetup the participants are assigned to one of the following tariff schemes:
• Pay-per-use• Cost Cap• Flat rate
The first computer screen explains the pricing procedure to the participants. Whileflat rate users pay the costs for the flat rate at the end of one experimental run,participants in the other groups pay for each time unit immediately and can monitorthe duration as well as the cumulating costs on the screen. Additionally it is possibleto signal every new time unit with an audio sound. This feature is implementedinto some mobile phones, but almost vanished from the market.4 For traceabilitythe maximum costs under a cost cap tariff equals the price for a flat rate andthe price per time unit has to be chosen in direct relation to the duration of oneexperimental run. Therefore all participants should end up with the same costsfor one run. With a classic pay-per-use tariff consumers are not insured againsthigh costs and therefore one expects to measure the pure taxi meter property in thisgroup. Flexibility can only have an effect on a potential tariff switching decision, noton the perception of the taxi meter property itself, because flexibility is ensured byboth the classic pay-per-use and the hybrid cost cap tariff. Therefore the treatmentas shown in figure 1 is analogous to a taxi ride with a taxi meter directly visibleto the customer. Under a cost cap tariff participants know ex-ante the maximum
Pay-per-useQuestionnaire
Risk aversion testNeuroticism (NEO-FFI)
IntroductionCalibration
Figure 1: Treatment - Pay-per-use
amount of experimental monetary units they can loose in one run. In this settingone measures the physiological reactions to the taxi meter property under insuranceagainst high costs. In an additional treatment one can eliminate the taxi meterproperty completely by introducing a classic flat rate tariff, as shown in figure 3.With this setup one measures the effect of insurance without the taxi meter property.The price of the flat rat, as well as the remaining part of the endowment is presentedon the computer screen, but during the experiment participants occur no additionalcosts. As already mentioned in section 1 compared to a cost cap tariff an equally
4 If there is a significant physiological reaction to additional audio signals this might be a reasonwhy mobile telecommunication operators intervened to abolish this feature.
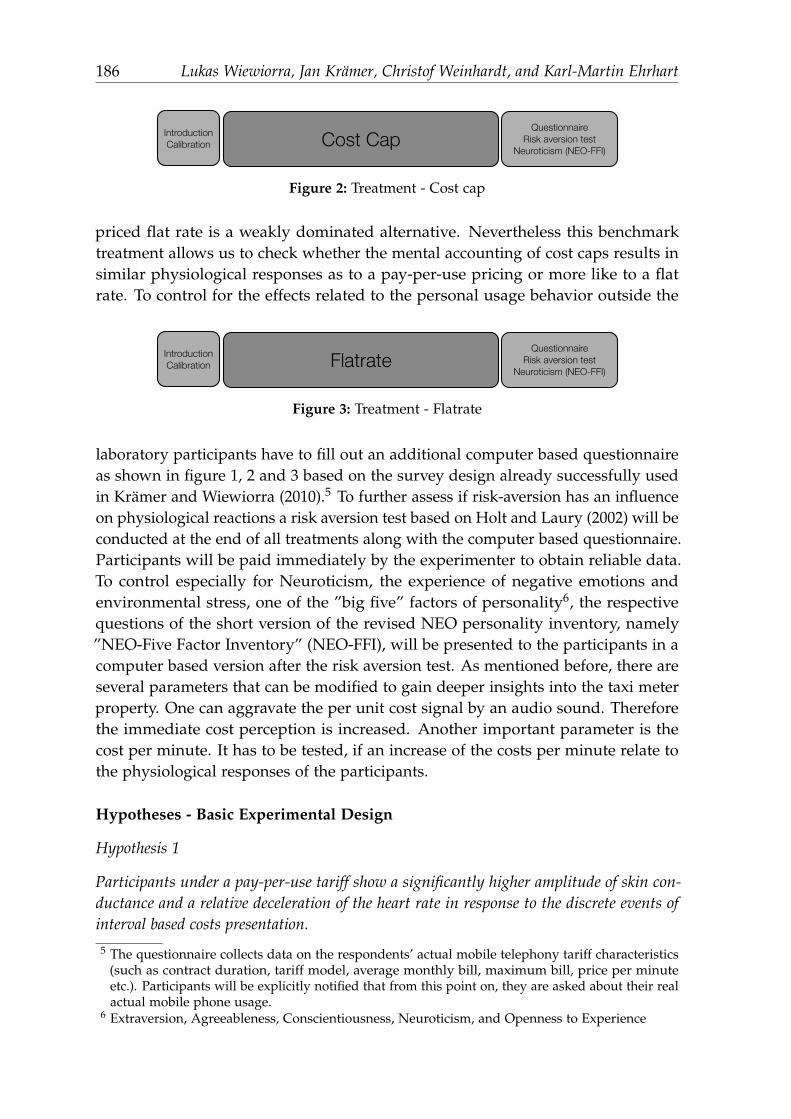
186 Lukas Wiewiorra, Jan Kramer, Christof Weinhardt, and Karl-Martin Ehrhart
Cost CapQuestionnaire
Risk aversion testNeuroticism (NEO-FFI)
IntroductionCalibration
Figure 2: Treatment - Cost cap
priced flat rate is a weakly dominated alternative. Nevertheless this benchmarktreatment allows us to check whether the mental accounting of cost caps results insimilar physiological responses as to a pay-per-use pricing or more like to a flatrate. To control for the effects related to the personal usage behavior outside the
FlatrateQuestionnaire
Risk aversion testNeuroticism (NEO-FFI)
IntroductionCalibration
Figure 3: Treatment - Flatrate
laboratory participants have to fill out an additional computer based questionnaireas shown in figure 1, 2 and 3 based on the survey design already successfully usedin Kramer and Wiewiorra (2010).5 To further assess if risk-aversion has an influenceon physiological reactions a risk aversion test based on Holt and Laury (2002) will beconducted at the end of all treatments along with the computer based questionnaire.Participants will be paid immediately by the experimenter to obtain reliable data.To control especially for Neuroticism, the experience of negative emotions andenvironmental stress, one of the ”big five” factors of personality6, the respectivequestions of the short version of the revised NEO personality inventory, namely”NEO-Five Factor Inventory” (NEO-FFI), will be presented to the participants in acomputer based version after the risk aversion test. As mentioned before, there areseveral parameters that can be modified to gain deeper insights into the taxi meterproperty. One can aggravate the per unit cost signal by an audio sound. Thereforethe immediate cost perception is increased. Another important parameter is thecost per minute. It has to be tested, if an increase of the costs per minute relate tothe physiological responses of the participants.
Hypotheses - Basic Experimental Design
Hypothesis 1
Participants under a pay-per-use tariff show a significantly higher amplitude of skin con-ductance and a relative deceleration of the heart rate in response to the discrete events ofinterval based costs presentation.5 The questionnaire collects data on the respondents’ actual mobile telephony tariff characteristics
(such as contract duration, tariff model, average monthly bill, maximum bill, price per minuteetc.). Participants will be explicitly notified that from this point on, they are asked about their realactual mobile phone usage.
6 Extraversion, Agreeableness, Conscientiousness, Neuroticism, and Openness to Experience
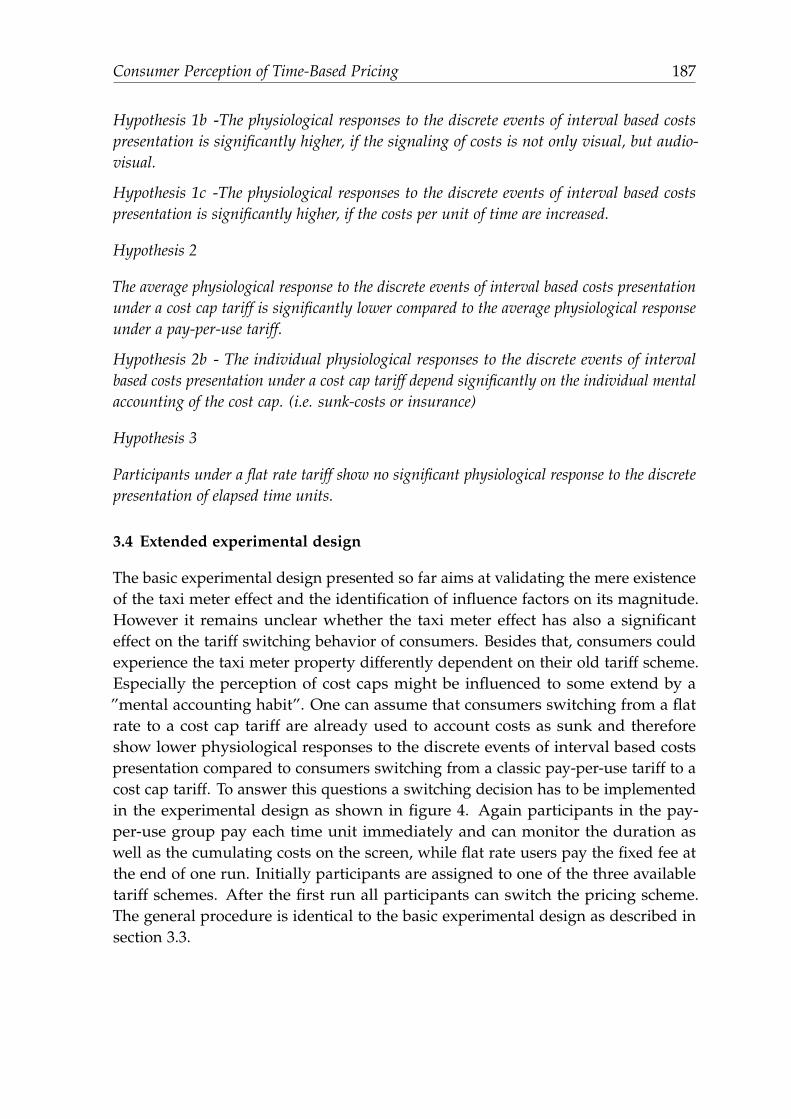
Consumer Perception of Time-Based Pricing 187
Hypothesis 1b -The physiological responses to the discrete events of interval based costspresentation is significantly higher, if the signaling of costs is not only visual, but audio-visual.
Hypothesis 1c -The physiological responses to the discrete events of interval based costspresentation is significantly higher, if the costs per unit of time are increased.
Hypothesis 2
The average physiological response to the discrete events of interval based costs presentationunder a cost cap tariff is significantly lower compared to the average physiological responseunder a pay-per-use tariff.
Hypothesis 2b - The individual physiological responses to the discrete events of intervalbased costs presentation under a cost cap tariff depend significantly on the individual mentalaccounting of the cost cap. (i.e. sunk-costs or insurance)
Hypothesis 3
Participants under a flat rate tariff show no significant physiological response to the discretepresentation of elapsed time units.
3.4 Extended experimental design
The basic experimental design presented so far aims at validating the mere existenceof the taxi meter effect and the identification of influence factors on its magnitude.However it remains unclear whether the taxi meter effect has also a significanteffect on the tariff switching behavior of consumers. Besides that, consumers couldexperience the taxi meter property differently dependent on their old tariff scheme.Especially the perception of cost caps might be influenced to some extend by a”mental accounting habit”. One can assume that consumers switching from a flatrate to a cost cap tariff are already used to account costs as sunk and thereforeshow lower physiological responses to the discrete events of interval based costspresentation compared to consumers switching from a classic pay-per-use tariff to acost cap tariff. To answer this questions a switching decision has to be implementedin the experimental design as shown in figure 4. Again participants in the pay-per-use group pay each time unit immediately and can monitor the duration aswell as the cumulating costs on the screen, while flat rate users pay the fixed fee atthe end of one run. Initially participants are assigned to one of the three availabletariff schemes. After the first run all participants can switch the pricing scheme.The general procedure is identical to the basic experimental design as described insection 3.3.
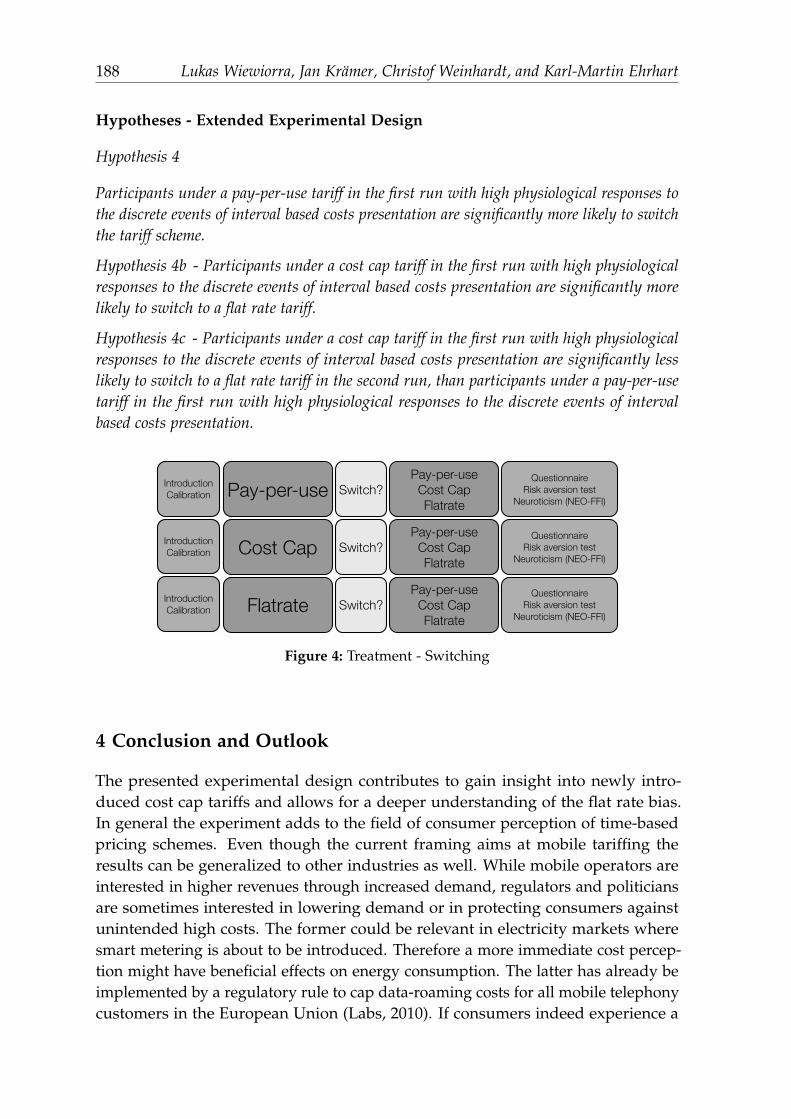
188 Lukas Wiewiorra, Jan Kramer, Christof Weinhardt, and Karl-Martin Ehrhart
Hypotheses - Extended Experimental Design
Hypothesis 4
Participants under a pay-per-use tariff in the first run with high physiological responses tothe discrete events of interval based costs presentation are significantly more likely to switchthe tariff scheme.
Hypothesis 4b - Participants under a cost cap tariff in the first run with high physiologicalresponses to the discrete events of interval based costs presentation are significantly morelikely to switch to a flat rate tariff.
Hypothesis 4c - Participants under a cost cap tariff in the first run with high physiologicalresponses to the discrete events of interval based costs presentation are significantly lesslikely to switch to a flat rate tariff in the second run, than participants under a pay-per-usetariff in the first run with high physiological responses to the discrete events of intervalbased costs presentation.
FlatrateQuestionnaire
Risk aversion testNeuroticism (NEO-FFI)
IntroductionCalibration
Cost CapQuestionnaire
Risk aversion testNeuroticism (NEO-FFI)
IntroductionCalibration
Pay-per-useQuestionnaire
Risk aversion testNeuroticism (NEO-FFI)
IntroductionCalibration Switch?
Switch?
Switch?Pay-per-use
Cost CapFlatrate
Pay-per-useCost CapFlatrate
Pay-per-useCost CapFlatrate
Figure 4: Treatment - Switching
4 Conclusion and Outlook
The presented experimental design contributes to gain insight into newly intro-duced cost cap tariffs and allows for a deeper understanding of the flat rate bias.In general the experiment adds to the field of consumer perception of time-basedpricing schemes. Even though the current framing aims at mobile tariffing theresults can be generalized to other industries as well. While mobile operators areinterested in higher revenues through increased demand, regulators and politiciansare sometimes interested in lowering demand or in protecting consumers againstunintended high costs. The former could be relevant in electricity markets wheresmart metering is about to be introduced. Therefore a more immediate cost percep-tion might have beneficial effects on energy consumption. The latter has already beimplemented by a regulatory rule to cap data-roaming costs for all mobile telephonycustomers in the European Union (Labs, 2010). If consumers indeed experience a
Consumer Perception of Time-Based Pricing 189
lower disutility of the taxi meter property due to the insurance effect, a cost cap ondata-roaming could even increase demand without any changes in the price perunit of service. The same intuition holds for cost cap tariffs in general. Thereforethe open question remains whether cost caps have an indirect effect on demandtoo. If consumers are more relaxed and unsolicitous due to the insurance property,this could cause an increase of service usage even without reaching the cost cap.Consumers could end up paying more on average compared to a classic pay-per-usetariff even if the cost cap never becomes binding.
References
Adam, M. T. P., M. Gamer, and C. Weinhardt (2009): “Measuring the impact ofemotions in electronic auctions: A physioeconomic approach.” Working Paper,Karlsruhe Institute of Technology (KIT).
Briegleb, V. (2009): “O2 mit mehr Kunden und Gewinn,” http://www.heise.
de/mobil/meldung/O2-mit-mehr-Kunden-und-Gewinn-857876.html, heise News-meldung.
Crowne, D. and D. Marlowe (1960): “A new scale of social desirability independentof psychopathology.” Journal of consulting psychology, 24(4), pp. 349–354.
Della Vigna, S. and U. Malmendier (2006): “Paying not to go to the gym,” AmericanEconomic Review, 96(3), pp. 694–719.
Gerpott, T. J. (2009): “Biased choice of a mobile telephony tari type: Exploring usageboundary perceptions as a cognitive cause in choosing between a use-based or aat rate plan,” Telematics and Informatics, 26, pp. 167–179.
Grubb, M. D. (2009): “Selling to Overconfident Consumers,” American EconomicReview, 99(5), pp. 1770–1807.
Holt, C. and S. Laury (2002): “Risk aversion and incentive effects,” The AmericanEconomic Review, 92(5), pp. 1644–1655.
Just, D. and B. Wansink (2008): “The Fixed Price Paradox: Conflicting Effects ofAll-You-Can-EatPricing,” Working Manuscript.
Kridel, D. J., D. E. Lehman, and D. L. Weisman (1993): “Option Value, Telecommu-nication Demand, and Policy,” Information Economics and Policy, 5, pp. 125–44.
Kramer, J. and L. Wiewiorra (2010): “Consumer Perception of Mobile TelephonyTariffs with Cost Caps,” Working Paper, Karlsruhe Institute of Technology (KIT).
Labs, L. (2010): “Mehr Sicherheit beim EU-Daten-Roaming,” http://www.heise.de/
newsticker/meldung/Mehr-Sicherheit-beim-EU-Daten-Roaming-943000.html,heise Newsmeldung.
Lambrecht, A., K. Seim, and B. Skiera (2007): “Does Uncertainty Matter? ConsumerBehavior Under Three-Part Tariffs,” Marketing Science, 26(5).
Lambrecht, A. and B. Skiera (2006a): “Paying Too Much and Being Happy About It:Existence, Causes and Consequences of Tariff-Choice Biases,” Journal of MarketingResearch, (May).
190 Lukas Wiewiorra, Jan Kramer, Christof Weinhardt, and Karl-Martin Ehrhart
Lambrecht, A. and B. Skiera (2006b): “Ursachen eines Flatrate-Bias, Systema-tisierung und Messung der Einflussfaktoren,” Schmalenbachs Zeitschrift fur be-triebswirtschaftliche Forschung, 58, pp. 588–617.
Littlechild, S. (1975): “Two-part tariffs and consumption externalities,” The BellJournal of Economics, 6(2), pp. 661–670.
Loewenstein, G. (2000): “Emotions in economic theory and economic behavior,”American Economic Review, 90(2), pp. 426–432.
Miravete, E. J. (2003): “Choosing the Wrong Calling Plan? Ignorance and Learning,”American Economic Review, 93, pp. 297–310.
Mitomo, H., T. Otsuka, and K. Nakaba (2007): “A Behavioral Economic Interpreta-tion of the Preference for Flat Rates: A Case of Post-Paid Mobile Phone Services,”in: 18th European Regional ITS Conference, International Telecommunications Society,Istanbul, Springer.
Nunes, J. (2000): “A Cognitive Model of People’s Usage Estimations,” Journal ofMarketing Research, 37, pp. 397–409.
Oi, W. (1971): “A Disneyland dilemma: Two-part tariffs for a Mickey Mousemonopoly,” The Quarterly Journal of Economics, 85(1), pp. 77–96.
Prelec, D. and G. Loewenstein (1998): “The Red and the Black: Mental Accouting ofSavings and Debt,” Marketing Science, 17(1), pp. 4–28.
Schulze, T. and K. Gedenk (2005): “Segmentspezifische Schatzung von Zahlungsbe-reitschaftsfunktionen 1,” Seminar, 57(August), pp. 401–422.
Thaler, R. H. (1985): “Mental Accounting and Consumer Choice,” Marketing Science,4(3), pp. 199–214.
Thaler, R. H. (1999): “Mental accounting matters,” Journal of Behavioral DecisionMaking, 12(3), pp. 183–206.
Train, K. E., M. Ben-akiva, and T. Atherton (1989): “Consumption Patterns andSelf-Selecting Tariffs,” Review of Economic and Statistics, 1, pp. 62–73.
Valletti, T. (2003): “The theory of access pricing and its linkage with investmentincentives,” Telecommunications Policy, 27(10-11), pp. 659–675.
Trading Development Rights: A LaboratoryAssessment
Jens E. Muller1, Stefan Seifert1, and Karl-Martin Ehrhart2
1 Institute of Information Systems and Management, [email protected], [email protected]
2 Institute for Economic Theory and Statistics, [email protected]
Summary. Within its Strategy for Sustainability, the German Federal Government aims toreduce the land utilization to a maximum of 30 hectare per day in 2020. From an economicperspective, market-based-instruments such as cap-and-trade schemes are promising policymechanisms to achieve this goal efficiently. Market-based instruments are relatively newmechanisms for the management of natural resources and the environment, for whichregulatory approaches have largely failed. First field experiments have revealed that theimplementation of a cap-and-trade scheme to limit the land utilization is very complex.
Based on the results of a field experiment, we conducted a lab experiment with differentstudent groups, who played the role of municipalities, and analyzed the effect of framingthe task. The study reveals that the total incomes of the municipalities for reaching thetarget can be higher in the cap-and-trade system than in a comparable command-and-control system. Concerning the framing, we could not observe any impact on the marketoutcome. However, the spatial planning students were further away from the theoreticaloptimum than the economics student group. As in the field experiment, the complexity ofthe trading system and the design of decision support tools are linked to a higher marketoutcome in the economics student group. As a result, an extensive preparatory phasefor practical decision makers in municipal administrations might be necessary in order toassure sufficient competence and acceptance for the new instrument.
1 Introduction
In Germany, there is an ongoing conversion of agricultural land into residential andcommercial uses. Negative ecological and economic consequences related to thistrend compromise the ecological function of space as a resource for humans, animals,and plants. One of the reasons for the continuous consumption of land is the tightfinancial situation of many municipalities (Jorissen and Coenen, 2007). At firstglance, the development of new areas in the outer area appears attractive because itis often cost neutral or even linked with proceeds from selling land. Moreover, alarger estate per capita ratio is expected to attract the settlement of young familieswith a positive impact on the redistribution of income taxes. However, the urban
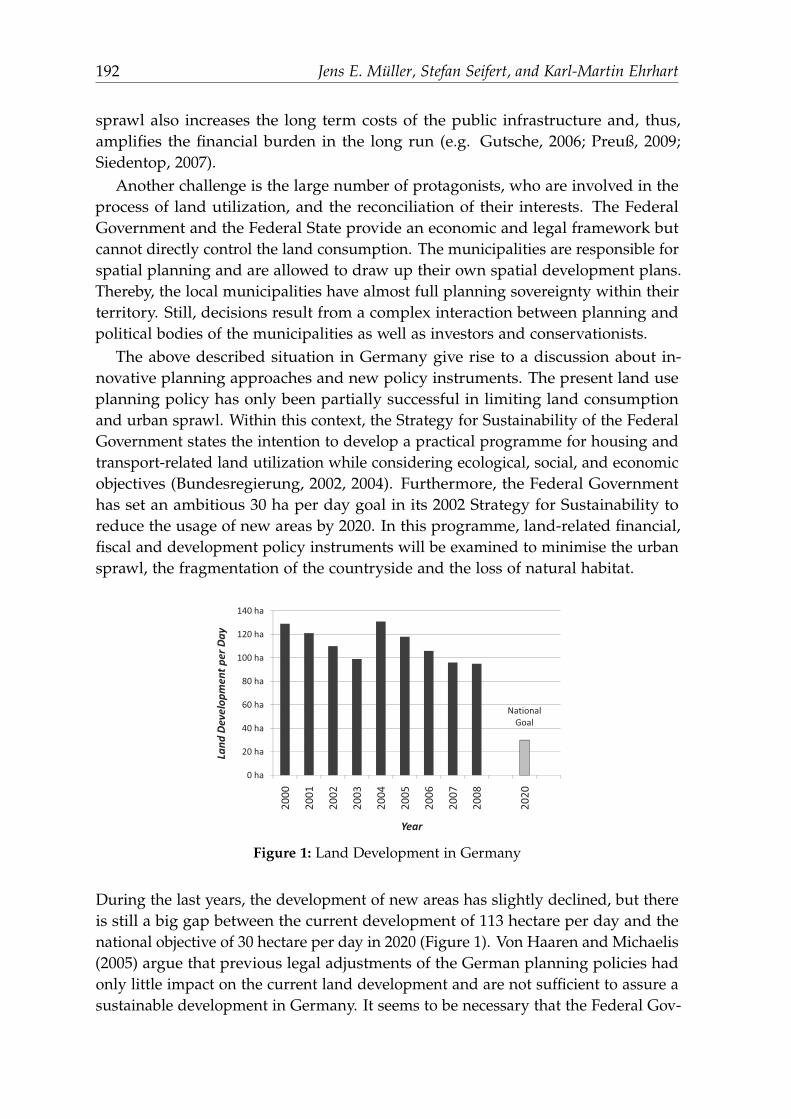
192 Jens E. Muller, Stefan Seifert, and Karl-Martin Ehrhart
sprawl also increases the long term costs of the public infrastructure and, thus,amplifies the financial burden in the long run (e.g. Gutsche, 2006; Preuß, 2009;Siedentop, 2007).
Another challenge is the large number of protagonists, who are involved in theprocess of land utilization, and the reconciliation of their interests. The FederalGovernment and the Federal State provide an economic and legal framework butcannot directly control the land consumption. The municipalities are responsible forspatial planning and are allowed to draw up their own spatial development plans.Thereby, the local municipalities have almost full planning sovereignty within theirterritory. Still, decisions result from a complex interaction between planning andpolitical bodies of the municipalities as well as investors and conservationists.
The above described situation in Germany give rise to a discussion about in-novative planning approaches and new policy instruments. The present land useplanning policy has only been partially successful in limiting land consumptionand urban sprawl. Within this context, the Strategy for Sustainability of the FederalGovernment states the intention to develop a practical programme for housing andtransport-related land utilization while considering ecological, social, and economicobjectives (Bundesregierung, 2002, 2004). Furthermore, the Federal Governmenthas set an ambitious 30 ha per day goal in its 2002 Strategy for Sustainability toreduce the usage of new areas by 2020. In this programme, land-related financial,fiscal and development policy instruments will be examined to minimise the urbansprawl, the fragmentation of the countryside and the loss of natural habitat.
40ha
60ha
80ha
100ha
120ha
140ha
Developm
entp
erDay
NationalGoal
0ha
20ha
2000
2001
2002
2003
2004
2005
2006
2007
2008
2020
Land
D
Year
Figure 1: Land Development in Germany
During the last years, the development of new areas has slightly declined, but thereis still a big gap between the current development of 113 hectare per day and thenational objective of 30 hectare per day in 2020 (Figure 1). Von Haaren and Michaelis(2005) argue that previous legal adjustments of the German planning policies hadonly little impact on the current land development and are not sufficient to assure asustainable development in Germany. It seems to be necessary that the Federal Gov-

Trading Development Rights: A Laboratory Assessment 193
ernment implements an effective medium- and long-term policy for a sustainabledevelopment on the basis of new economic instruments, as legal instruments aloneare apparently not sufficient to reduce land consumption (Bundesregierung, 2004):
”Subsidies, taxes, duties and development programs need to be examined with respectto their potential contribution to land consumption reduction. To that end, social,economic and financial effects must also be considered.”
In addition to the examination of other land-related financial, fiscal and developmentpolicy instruments, the Strategy for Sustainability of the Federal Government fo-cused its attention on inter-disciplinary methods to achieve a stronger link betweenthe existing ecological and planning approaches.
2 Tradable Development Rights in Germany
Market-based instruments (MBIs) are relatively new economic instruments forthe management of natural resources and the environment (Whitten et al., 2003).Compared to other regulatory approaches, MBIs ensure that any improvement ofenvironmental protection and quality is reached at the lowest overall costs. In addi-tion, a cap-and-trade system specifies in advance a precise target for environmentalprotection and the system ensures that the target is reached. Thus, a cap-and-tradesystem is not only efficient in economic terms; it is also effective with respect toenvironmental protection. MBIs have been gaining more and more acceptance aspolicy mechanisms in different areas and have already been applied to differentenvironmental issues. Cap-and-trade systems have become a leading policy optionin controlling air emissions and are also being used in fisheries regulation (e.g. EUCO2 Emission Trading Scheme).
The use of tradable development rights (TDRs) under a cap for land developmentis considered as a promising policy instrument to reduce the development of newsettlement and commercial areas in Germany (Rolfe and Windle, 2006; Hendersonand Wang, 2007). Within such a scheme, the right of a local authority to developnew areas would require to submit a certificate for cancelation. By restricting thetotal number of permits, the extension of new areas is limited in advance. Thecertificates can be freely traded between municipalities. If a local authority wants todevelop a new area and does not have sufficient certificates, it has to buy them on amarket. Alternatively, a municipality with a surplus of certificates can sell them.The actual price of the certificates is then determined by supply and demand.
Example: Instead of developing a new area with 5 ha associated floor-space, a citycould provide an appropriate site in the inner zone by converting a fallow. Inthe former case, the proceeds of selling the real estate would cover all costs of thedevelopment, but the city would have to submit corresponding development rightsfor cancellation. In the later case, the infill development is more cost-intensive, butthe city could sell (or would not have to buy) development rights on the market.

194 Jens E. Muller, Stefan Seifert, and Karl-Martin Ehrhart
A system with tradable development rights is quite similar to an emission tradingsystem (e.g. EU ETS). Table 1 summarizes the main characteristics of the Develop-ment Rights Trading and compares the trading rules with the Emission TradingMechanism. In emissions schemes companies are the participants that have torealize a total cap (emitted emission permits) at minimal costs. The goal is to reducethe CO2-emissions by using alternative fuels or by increasing the energy efficiencyof installations. In contrast, in a system with development rights the municipalitieswould be the participants and the main goal is the reduction of land use. Themunicipalities should be able to provide the floor space by closing gaps in the innerareas of a city to achieve a total reduction goal, which is determined by the totalamount of emitted certificates.
Table 1: Emission Trading vs. Trading Development Rights
Characteristics Emission Trading Development Rights Trad-ing
Participants Companies Municipalities / Local au-thorities
Goal Reduction of CO2 emis-sions
Reduction of new land use
Certificates Emission permit (1 tonCO2)
TDR (development of 1hectare area of settlement)
Objective Realizing total cap (CO2emissions) at minimal cost
Realizing total cap (devel-opment of new land) atminimal cost
Constraints Production of given output(electricity, heat, concrete)
Provision of floor space(residential, commercial)
Reduction Alternative fuels, increas-ing energy efficiency instal-lations
Closing gaps, conversion offallows, smaller/denser de-velopment areas
However, a system of Tradable Development Rights (TDRs) can give rise to hosts ofconstitutional and planning policy concerns (e.g. Bovet, 2006; Schlapfer, 2007; Sussand Gmunder, 2005). For instance, when using the certificates the existing planningguidelines have to be considered. In the fields of spatial planning, constructionplanning law, nature conservation and specialized planning law many legal andplanning instruments to protect the open space and to assure a sustainable urbandevelopment already exist. As mentioned above, the biggest problem might to bethe planning sovereignty of the municipalities, which is guaranteed by the Germanconstitution. Therefore, it is difficult for the Federal Government to set tight limitson the quota for developing new areas in a system with TDRs. Thus, TDRs must beconsidered as a supplement to the system of existing planning instruments.
Unfortunately, recent case studies have revealed that the design and implemen-tation of a cap-and-trade scheme in land development is complex (Radermacher,2004; Henger and Schroter-Schlaack, 2008; Walz and Ostertag, 2007). Experiences
Trading Development Rights: A Laboratory Assessment 195
with existing schemes have also shown some practical difficulties, which implemen-tations must take into consideration (Schleich et al., 2006). Thus, new planninginstruments should be carefully investigated before actually applying them in prac-tice. Alongside theoretical analysis, it is important that supplementary areas ofresearch also include numerous practical projects and research programs beforecontinuing to pursue some of these approaches in real practice. Results of pilotprojects, which currently run in some municipalities, should be evaluated, anddiscussed with the potential market participants. With respect to the use of land,exemplary projects and case studies have been already conducted at the nationallevel (e.g. Gutsche, 2007; Preuß, 2006; Walz, 2005). In the future, more simulationsand regional reference cases should be pursued.
Experience with cap-and-trade systems has led to a rich empirical and exper-imental academic literature on the subject. Focusing on the market design, thetheoretical literature allows to make predictions about the market outcomes ofdifferent designs in particular situations (Roth, 1988; Smith, 1994). Empirical experi-ence with real-world environmental markets give evidence of how well the theoryfits with actual results. Another way to do that, is to test and refine environmentalmarkets in the laboratory - the so-called test bedding method (Plott and Porter, 1996;Plott and Cook, 2005). For evaluating environmental policy instruments, differentexperimental methods have been recently used (Shogren, 2005). In the laboratory, agroup of human participants are sitting in front of a set of computers and are linkedwith each other by specialized software. The participants have to cope with decisiontasks, which include carefully controlled incentives, choices, information, and othercharacteristics. By varying one design parameter between different experimentalsessions, while holding all other factors constant, the experimentalists can test howthat treatment variable affects the market outcome. Typically, students are recruitedfor the experiments. They receive a payment based on their performance in theexperiment. These economics experiments are increasingly used for investigatingpublic policy and economic theories.
Ostertag et al. (2009) have investigated a potential TDR system in a controlledfield experiment with actual German municipalities based on real data. Theyfind that such a system may be well suited to effectively reduce the use of land.While the total cost of the society are lower than under a command-and-controlbenchmark, the participants failed to reach the efficiency gains that would havebeen possible in theory. Possibly, the participants in the field study did not perfectlyalign their actions to the respective monetary valuation. Against this background,this study uses a lab experiment to investigate whether the particular context oftrading development rights rather than other economic goods impacts the observedbehavior. Moreover, we analyse whether municipal planners behave differently thanmore economically trained subjects. Thus, the following questions are addressed:
• Do planning experts behave less efficiently than economic experts?
196 Jens E. Muller, Stefan Seifert, and Karl-Martin Ehrhart
• Is it relevant for the development of a strategy, for the efficiency, and for thescheme design, if participants are trading with rights for land developmentinstead of neutral goods?
Experimental economic research usually abstracts from a particular context andconfronts subjects in the lab with a stylized model of a decision making situation(Evans et al., 2008). The underlying assumption is that fundamental principles canbe investigated by a context-free design. However, this leads to an abstraction ofcontext-dependent effects. Furthermore, the standard subject pool in experimentaleconomic research are students. Due to the fact that students represent only a smallgroup of the population, results from experiments with students cannot always betransferred to other groups of the society (e.g. Henrich, 2001). Therefore, experts orstudents from specific fields have been recruited in recent experimental economicresearch, because they are already experienced in a certain field of application(Carpenter et al., 2005).
3 Experimental Design
The above mentioned field study Ostertag et al. (2009) was clearly framed in a landdevelopment context and the subjects were experts in this field. In order to testwhether the background of the participants and the framing of the context relatedto the deviation from the theoretical prediction, we conducted a respective controlexperiment in the laboratory. The experiment applied a balanced 2x2 design of twotreatments and two subject pools. In the treatment ”FR” the decision situation wasframed with full context information: Participants made decisions over developmentprojects and traded development rights. In the treatment ”NE” participants decidedover investment projects that required some certificates. Instructions were given inan abstract and neutral language.
Both treatments were conducted with two subject pools, students from theKarlsruhe Institute of Technology (”KA”) and students from the University ofApplied Sciences for Economics and Environment in Nurtingen-Geislingen (”NU”).The participants from Karlsruhe were mainly recruited from economics studyprograms. Consequently, a basic knowledge in economics can be assumed. Thestudents from Nurtingen have a background in spatial planning and landscapingand acted as planning experts. Both treatments were run with both groups and twosessions for each combination. The following four working hypotheses guided thedesign:
Efficiency I The description of the context negatively influences the efficiency oftrading.
Efficiency II Economic experts behave more rational (in economic terms) thanplanning experts, i.e. they achieve the required reduction of land use at lowercost.
Trading Development Rights: A Laboratory Assessment 197
Price Discovery I The description of the context negatively influences the pricediscovery process.
Price Discovery II Prices in the sessions with the economic experts are closer tothe theoretical prices than with the planning experts.
The sessions with the students from Nurtingen-Geislingen were conducted inJanuary 2009. A mobile computer lab from the the Karlsruhe Institute of Technologywas used for this purpose in order to have the same environmental conditions inNurtingen and in Karlsruhe. Subsequently, the remaining sessions were conductedin the computer lab at the Karlsruhe Institute of Technology. All students receiveda financial compensation for their participation in the experiment that depended onindividual results. The payments ranged from 6.30 euros up to 20.80 euros with anaverage of 14.30 euros.
3.1 Rules
In the laboratory experiment we simplified the rules of the field experiment andrun each experimental session within a time slot of around 90 minutes. In a session,eight students participated and acted on behalf of one municipality each. Onesession was divided into seven planning periods. Additionally, two test runs werecarried out at the start of a session, to allow the participants to get used to thehandling of the software. The participants had the task to develop settlement andcommercial areas in each planning period to provide additional space for livingand business.
At the beginning of each period the participants were able to sell or buy certifi-cates on a market place. Then, they had to select one of 14 development projects,of which seven were inner-city projects and the other seven involved new landuse in the outer area. The inner-city development projected incurred costs thatdiffered from project to project and from municipality to municipality. Overallcosts ranged between 27 and 968 monetary units. However, these options didnot require development rights, since these areas are already inner-city settlementand transport areas. As an alternative, a participant could develop 2 ha of newsettlement area. This areas was assumed to be cost-neutral which means it didnot generates expenses for the municipality. This works on the assumption that amunicipality can pass the development cost of a new settlement area to the propertyowner. Due to the fact, that one development rights certificate legitimized theconversion of 1 hectare forest area or agricultural land into new settlement andtransport areas, two development rights certificates were needed to develop a newsettlement area. The development implementation generated income regardless ofthe type of development option. Each participant received 1,000 monetary unitsincome for carrying out a development option.
At the beginning of a planning period, each participant received one certificate.The totally emitted development rights allowed the participants to implement onaverage half of their outer-city projects. If one development option was carried out
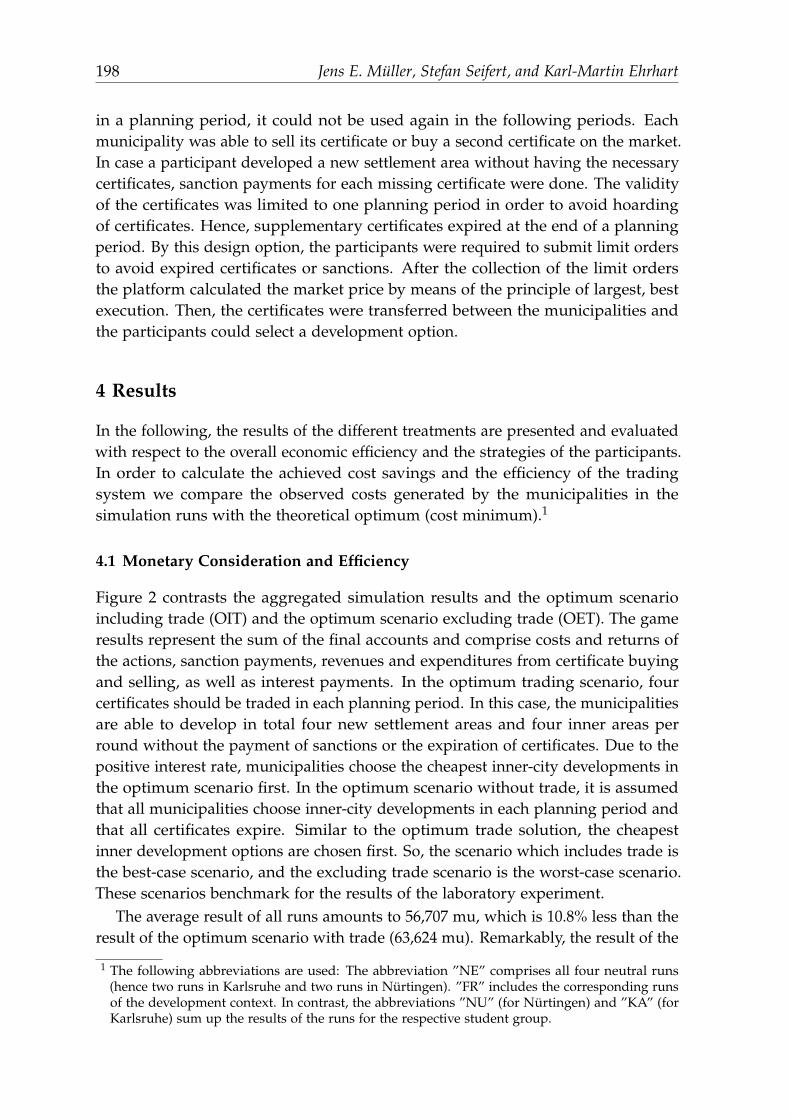
198 Jens E. Muller, Stefan Seifert, and Karl-Martin Ehrhart
in a planning period, it could not be used again in the following periods. Eachmunicipality was able to sell its certificate or buy a second certificate on the market.In case a participant developed a new settlement area without having the necessarycertificates, sanction payments for each missing certificate were done. The validityof the certificates was limited to one planning period in order to avoid hoardingof certificates. Hence, supplementary certificates expired at the end of a planningperiod. By this design option, the participants were required to submit limit ordersto avoid expired certificates or sanctions. After the collection of the limit ordersthe platform calculated the market price by means of the principle of largest, bestexecution. Then, the certificates were transferred between the municipalities andthe participants could select a development option.
4 Results
In the following, the results of the different treatments are presented and evaluatedwith respect to the overall economic efficiency and the strategies of the participants.In order to calculate the achieved cost savings and the efficiency of the tradingsystem we compare the observed costs generated by the municipalities in thesimulation runs with the theoretical optimum (cost minimum).1
4.1 Monetary Consideration and Efficiency
Figure 2 contrasts the aggregated simulation results and the optimum scenarioincluding trade (OIT) and the optimum scenario excluding trade (OET). The gameresults represent the sum of the final accounts and comprise costs and returns ofthe actions, sanction payments, revenues and expenditures from certificate buyingand selling, as well as interest payments. In the optimum trading scenario, fourcertificates should be traded in each planning period. In this case, the municipalitiesare able to develop in total four new settlement areas and four inner areas perround without the payment of sanctions or the expiration of certificates. Due to thepositive interest rate, municipalities choose the cheapest inner-city developments inthe optimum scenario first. In the optimum scenario without trade, it is assumedthat all municipalities choose inner-city developments in each planning period andthat all certificates expire. Similar to the optimum trade solution, the cheapestinner development options are chosen first. So, the scenario which includes trade isthe best-case scenario, and the excluding trade scenario is the worst-case scenario.These scenarios benchmark for the results of the laboratory experiment.
The average result of all runs amounts to 56,707 mu, which is 10.8% less than theresult of the optimum scenario with trade (63,624 mu). Remarkably, the result of the
1 The following abbreviations are used: The abbreviation ”NE” comprises all four neutral runs(hence two runs in Karlsruhe and two runs in Nurtingen). ”FR” includes the corresponding runsof the development context. In contrast, the abbreviations ”NU” (for Nurtingen) and ”KA” (forKarlsruhe) sum up the results of the runs for the respective student group.

Trading Development Rights: A Laboratory Assessment 199
48 000
50.000 mu
52.000 mu
54.000 mu
56.000 mu
58.000 mu
60.000 mu
62.000 mu
64.000 mu
Gam
e Re
sult
40.000 mu
42.000 mu
44.000 mu
46.000 mu
48.000 mu
NU‐Ne NU‐Fr KA‐Ne KA‐Fr NU KA NE FR All OIT OET
Treatments
Figure 2: Simulation Results
students from Karlsruhe (59,683 mu) is 11% higher than the result of the studentsfrom Nurtingen (53,732 mu). More precisely, the efficiency rate
Efficiency =Optimum Excluding Trade - Simulation Result
Optimum Including Trade
shows how much of the cost savings potential of the optimum including trade hasbeen realized compared to the optimum excluding trade. Table 2 summarizes theefficiency rates of the sessions in Nurtingen and Karlsruhe, and in a framed andneutral treatment.
Table 2: Efficiency Rates
NU-Ne NU-Fr AllNurtingen (NU) 50.43% 50.25% 50.34%Karlsruhe (KA) 78.06% 82.37% 80.22%
All 64.24% 66.31% 65.28%
The table shows that the available potential was not completely utilized takinginto account the theoretical possibilities. The efficiency rate of the students fromKarlsruhe (80.22%) is about is about 60% higher than the efficiency rate of the spatialplanning students (50.34%). The statistical evaluation of the simulation resultsreveals significant differences between the two student groups.2 Consequently,the economic experts achieve the reduction goal at lower costs. However, the
2 Student’s t-test for paired samples: n = 32, t = 2,686, p-value = 0.012.

200 Jens E. Muller, Stefan Seifert, and Karl-Martin Ehrhart
efficiency rates of the neutral treatment and the framed treatment with 64.24%and 66.31%, respectively, are almost at the same level. No significant differencescan be observed.3 Therefore, the way of describing of the actual situation has notsignificantly influenced the efficiency of the trading system.
250 mu
300 mu
350 mu
400 mu
450 mu
Avg. Costs
NU
KA
100 mu
150 mu
200 mu
PP 1 PP 2 PP 3 PP 4 PP 5 PP 6 PP 7
Planning Period
NE
FR
Figure 3: Average Cost of Inner-City Developments
In each round, the average costs of the students from Karlsruhe are below thoseof the group from Nurtingen. On average, the costs are 22% lower - with the highestdifference in round six (36%). Considering the aggregated values of the framed andthe unframed treatment, there are no significant differences between the averagecosts, except for round six. However, the average costs for land recycling increaseover the course of the simulation. Sanction payments arose only in the secondrun for the students from Nurtingen and in the second run for the students fromKarlsruhe. No sanctions were paid in the neutral treatments. Overall, the sanctionshave little influence on the simulation results. Comparing the total costs, the costs inthe Nurtingen sessions are 49.8% higher than the comparative value of the studentsfrom Karlsruhe. Some of the cheapest inner-city options remained unused in thegroup from Nurtingen. The results of the framed runs are 7.1% higher than theresults of the context-free runs. Therefore, the description of the actual situationand the related recycling costs have fewer impact on the choice of developmentoptions than the knowledge of the experts, or respectively the background of theparticipants.
3 Student’s t-test for paired samples: n = 32, t = 0.183, p-value = 0.856.

Trading Development Rights: A Laboratory Assessment 201
4.2 Trade and Price Discovery
The price curve in Figure 4 shows that the price of the certificates in each planningperiod is above the theoretical market price. The market price for developmentrights is also increasing significantly within the course of the simulation run.4
However, the difference between the theoretical market price and the price in thesessions of the economic experts is decreasing over the course of the simulation andis reaching its minimum with 150 mu in the last round. This reduction of deviationcould result from learning effects over the course of the experiment.
200 mu
250 mu
300 mu
350 mu
400 mu
450 mu
500 mu
550 mu
rket Price
NU
KA
NE
0 mu
50 mu
100 mu
150 mu
PP 1 PP 2 PP 3 PP 4 PP 5 PP 6 PP 7
Mar
Planning Period
FR
Opt
Figure 4: Development of the Market Price
The market prices of the planning experts are on average 350 mu above theprice of the theoretical optimum, without converging to the theoretical solution.The Nurtingen groups’ market prices for certificates are in each round above therespective prices of the groups from Karlsruhe. Hence, the certificate prices of thegroups from Nurtingen are further away from the reference price than the certificateprices of the groups from Karlsruhe. The development of the market price is moreclosely correlated with the price of the previous rounds (rKA = 0.802, rNU = 0.626)than with the average costs accrued in a period (rKA = 0.485, rNU = 0.341). However,differences between trading with development rights and trading with neutral goodscannot be identified.
Figure 5 contrasts the traded volume of the different treatments with the mini-mum trading volume. The minimum trading volume is the amount of certificates(in ha) that has to be traded in order to achieve the cost optimal result. The referencescenario has a minimum trading volume of 28 ha certificates. With 22.5 ha (KA-NE)
4 Page trend test: n = 7, c = 8, L = 1005, p-value ≤ 0.001.
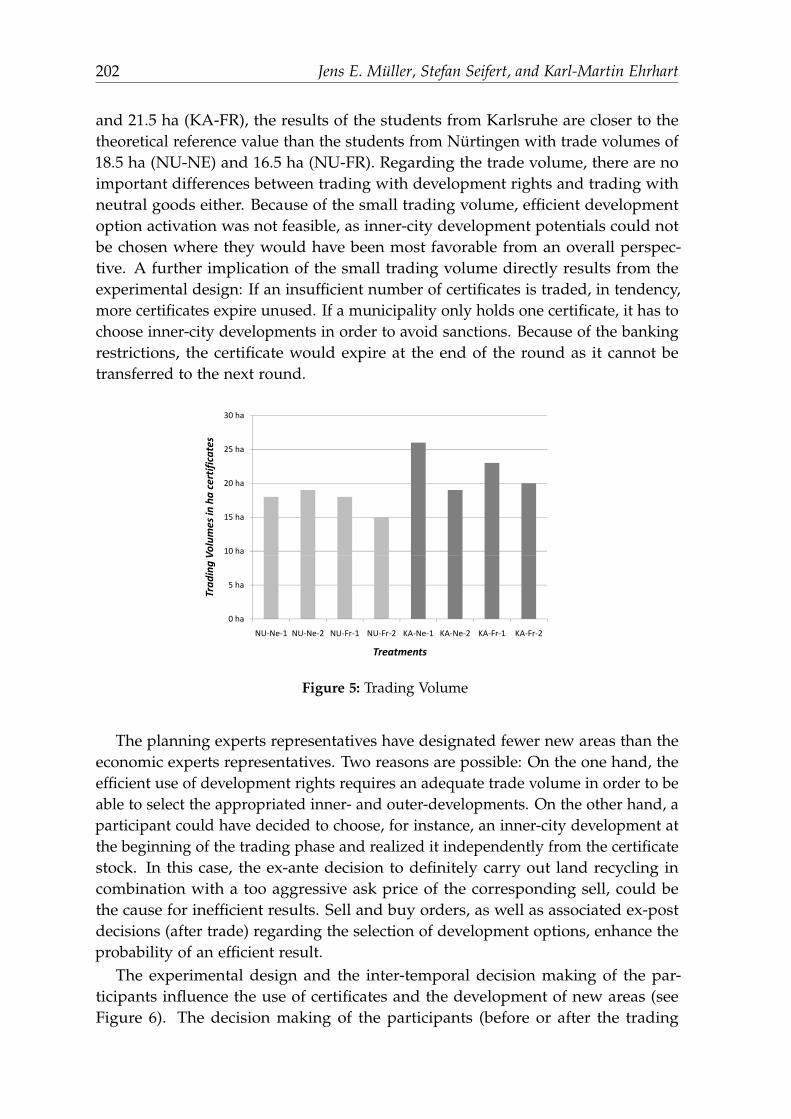
202 Jens E. Muller, Stefan Seifert, and Karl-Martin Ehrhart
and 21.5 ha (KA-FR), the results of the students from Karlsruhe are closer to thetheoretical reference value than the students from Nurtingen with trade volumes of18.5 ha (NU-NE) and 16.5 ha (NU-FR). Regarding the trade volume, there are noimportant differences between trading with development rights and trading withneutral goods either. Because of the small trading volume, efficient developmentoption activation was not feasible, as inner-city development potentials could notbe chosen where they would have been most favorable from an overall perspec-tive. A further implication of the small trading volume directly results from theexperimental design: If an insufficient number of certificates is traded, in tendency,more certificates expire unused. If a municipality only holds one certificate, it has tochoose inner-city developments in order to avoid sanctions. Because of the bankingrestrictions, the certificate would expire at the end of the round as it cannot betransferred to the next round.
10 ha
15 ha
20 ha
25 ha
30 ha
Volumes in
ha certificates
0 ha
5 ha
NU‐Ne‐1 NU‐Ne‐2 NU‐Fr‐1 NU‐Fr‐2 KA‐Ne‐1 KA‐Ne‐2 KA‐Fr‐1 KA‐Fr‐2
Trad
ing V
Treatments
Figure 5: Trading Volume
The planning experts representatives have designated fewer new areas than theeconomic experts representatives. Two reasons are possible: On the one hand, theefficient use of development rights requires an adequate trade volume in order to beable to select the appropriated inner- and outer-developments. On the other hand, aparticipant could have decided to choose, for instance, an inner-city development atthe beginning of the trading phase and realized it independently from the certificatestock. In this case, the ex-ante decision to definitely carry out land recycling incombination with a too aggressive ask price of the corresponding sell, could bethe cause for inefficient results. Sell and buy orders, as well as associated ex-postdecisions (after trade) regarding the selection of development options, enhance theprobability of an efficient result.
The experimental design and the inter-temporal decision making of the par-ticipants influence the use of certificates and the development of new areas (seeFigure 6). The decision making of the participants (before or after the trading
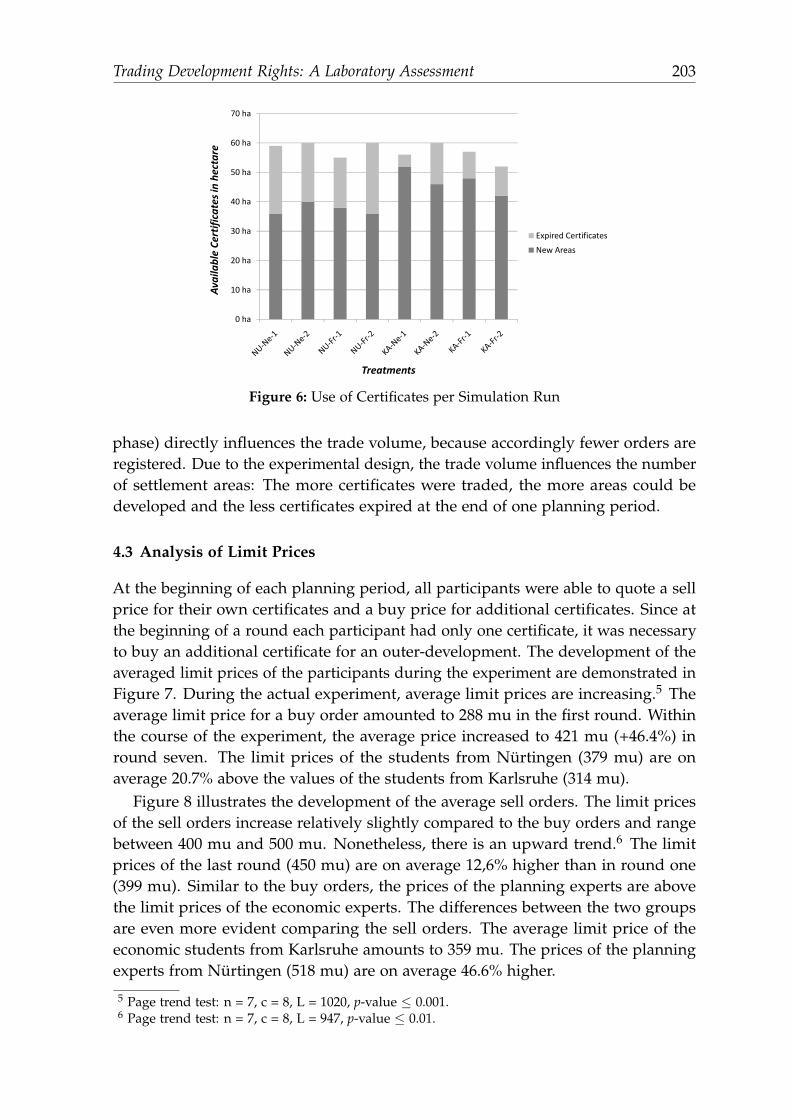
Trading Development Rights: A Laboratory Assessment 203
20 ha
30 ha
40 ha
50 ha
60 ha
70 ha
le Certificates in
hectare
Expired Certificates
New Areas
0 ha
10 ha
20 ha
Availab
Treatments
Figure 6: Use of Certificates per Simulation Run
phase) directly influences the trade volume, because accordingly fewer orders areregistered. Due to the experimental design, the trade volume influences the numberof settlement areas: The more certificates were traded, the more areas could bedeveloped and the less certificates expired at the end of one planning period.
4.3 Analysis of Limit Prices
At the beginning of each planning period, all participants were able to quote a sellprice for their own certificates and a buy price for additional certificates. Since atthe beginning of a round each participant had only one certificate, it was necessaryto buy an additional certificate for an outer-development. The development of theaveraged limit prices of the participants during the experiment are demonstrated inFigure 7. During the actual experiment, average limit prices are increasing.5 Theaverage limit price for a buy order amounted to 288 mu in the first round. Withinthe course of the experiment, the average price increased to 421 mu (+46.4%) inround seven. The limit prices of the students from Nurtingen (379 mu) are onaverage 20.7% above the values of the students from Karlsruhe (314 mu).
Figure 8 illustrates the development of the average sell orders. The limit pricesof the sell orders increase relatively slightly compared to the buy orders and rangebetween 400 mu and 500 mu. Nonetheless, there is an upward trend.6 The limitprices of the last round (450 mu) are on average 12,6% higher than in round one(399 mu). Similar to the buy orders, the prices of the planning experts are abovethe limit prices of the economic experts. The differences between the two groupsare even more evident comparing the sell orders. The average limit price of theeconomic students from Karlsruhe amounts to 359 mu. The prices of the planningexperts from Nurtingen (518 mu) are on average 46.6% higher.
5 Page trend test: n = 7, c = 8, L = 1020, p-value ≤ 0.001.6 Page trend test: n = 7, c = 8, L = 947, p-value ≤ 0.01.
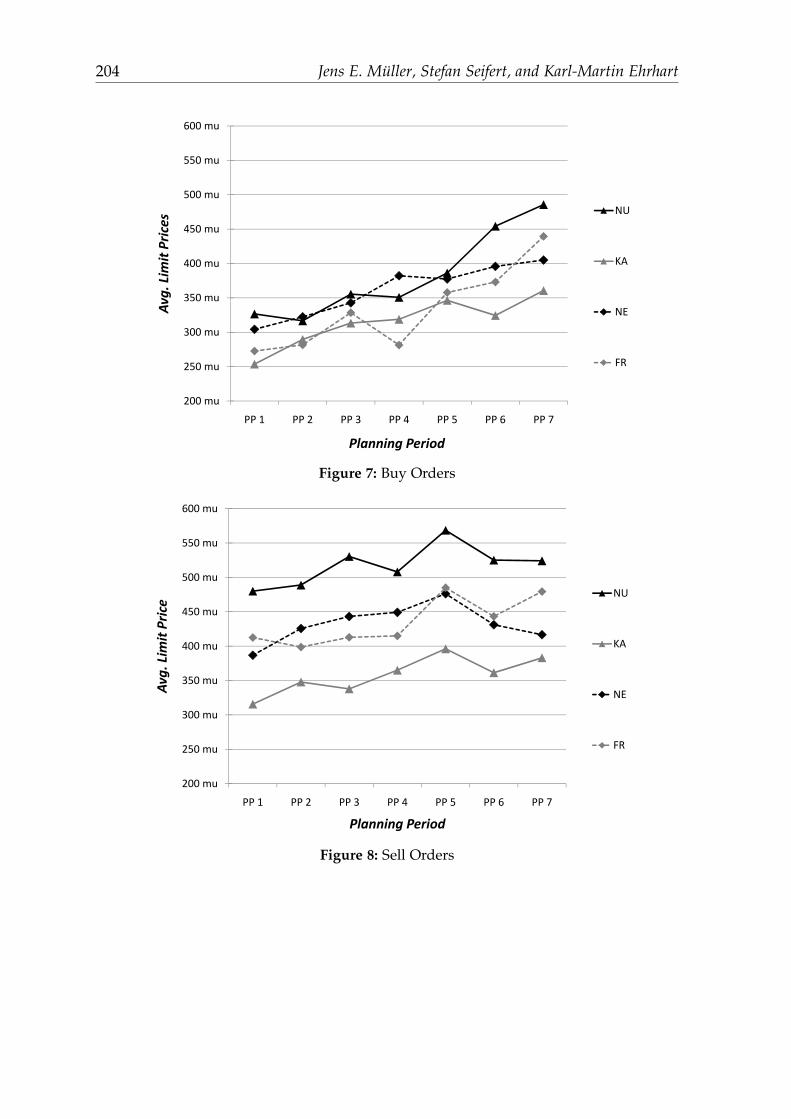
204 Jens E. Muller, Stefan Seifert, and Karl-Martin Ehrhart
350 mu
400 mu
450 mu
500 mu
550 mu
600 mu
vg. Lim
it Prices
NU
KA
200 mu
250 mu
300 mu
PP 1 PP 2 PP 3 PP 4 PP 5 PP 6 PP 7
Av
Planning Period
NE
FR
Figure 7: Buy Orders
350 mu
400 mu
450 mu
500 mu
550 mu
600 mu
vg. Lim
it Price
NU
KA
200 mu
250 mu
300 mu
350 mu
PP 1 PP 2 PP 3 PP 4 PP 5 PP 6 PP 7
Av
Planning Period
NE
FR
Figure 8: Sell Orders
Trading Development Rights: A Laboratory Assessment 205
5 Conclusion
In this article, we presented the results of a laboratory experiment, which wasconducted as a complement to the field study by Ostertag et al. (2009). Withinthe laboratory experiment, city planning development was simulated with eightdecision makers over seven planning periods. In contrast to the field experiment,the laboratory experiment was based on virtual data. In order to address specificresearch questions, a simplified scheme for trading development rights in thelaboratory experiment was developed. Thereby, the influence of external factors wasminimized. Still, the experimental design and the given data reflects the principalmechanism of development rights trading and allows the test of the hypotheses.
Achieving an ecological, quantitative reduction goal was not the focus of thelaboratory experiment. However, the given overall reduction goal was met and evensurpassed. Similar to the field experiment, the theoretical potential to minimizecosts while providing the required floor space was not completely taking intoaccount. Furthermore, the cheaper development actions were carried out first andthe increasing market prices reflected the increasing abatement costs. The resultsunderpin the findings of the field experiment and the results of economic andplanning experts differ significantly regarding the efficiency rates and the pricediscovery process. The difference to the theoretical optimum of the economicexperts was smaller than the difference of the planning experts, which meansthat the economic experts achieved the reduction goal at lower costs due to moreefficient abatement strategies. High sell orders in the group Nurtingen, driven byan endowment effect, led to a higher price level in this sessions. Therefore, workinghypotheses Efficiency II and Price Discovery II were confirmed. Against this, thedescription of the actual situation did not influence the efficiency of the tradingsystem. Within the scope of the laboratory experiment, it did not matter whetherit was dealt with development rights or with neutral goods. Hence, the workinghypotheses Efficiency I and Price Discovery I are not supported.
Some results of our experiment suggest that a trading system will not automat-ically result in the expected cost savings and efficiency gains. In all simulationruns including the field and the lab experiments, the overall incomes were lowerthan expected and we observed a gap between actual and optimal prices. Ac-cording to economic theory, the primary allocation of the certificates should notaffect the efficiency of the trading system. If the initial allocation is inefficient,the secondary market should correct this situation by reallocating the certificatesto the ”right” municipalities. How fast the market can achieve a constellation,where no pareto-efficient transactions are possible, depends on the design and thetrading rules of the secondary market as well as on the trading behavior of theparticipants. Wrongly chosen development options, as observed in the planningexperts groups including field and lab sessions, may support high market prices,slow down the price discovery process and may reduce the efficiency of the tradingsystem. Furthermore, the participants’ lack of experience with this new instrument
206 Jens E. Muller, Stefan Seifert, and Karl-Martin Ehrhart
stresses the need for the local authorities to acquaint themselves with the rulesand the range of possible strategies in a system with TDRs as a supplement to theexisting planning regulation systems. It is necessary to consider these factors alongwith the institutional and legal requirements when choosing a market design fortradable development rights in Germany. For this reason, we suggest to conductadditional surveys and field studies which focus on the mentioned observationsand to investigate and test a market for Tradable Development Rights and newdecision support tools in other planning simulations.
References
Bovet, J. (2006): “Handelbare Flachenausweisungsrechte als Steuerungsinstrumentzur Reduzierung der Flacheninanspruchnahme,” Natur und Recht, 8, pp. 473–479.
Bundesregierung (2002): “Perspektiven fur Deutschland: Unsere Strategie fureine nachhaltige Entwicklung,” http://www.bundesregierung.de/Content/DE/
__Anlagen/2006-2007/perspektiven-fuer-deutschland-langfassung.html.Bundesregierung (2004): “Nationale Nachhaltigkeitsstrategie
der Bundesregierung: Schwerpunktthema Verminderung derFlacheninanspruchnahme,” http://www.bmvbs.de/Anlage/original_22293/
Verminderung-der-Flaecheninanspruch-nahme.pdf.Carpenter, J. P., G. W. Harrison, and J. A. List (2005): “Field experiments in eco-
nomics,” Research in Experimental Economics, 10, pp. 1–16.Evans, M., S. M. Gilpatric, M. McKee, and C. A. Vossler (2008): “Managerial
incentives for compliance with environmental information disclosure programs,”in: T. Cherry, S. Kroll, and J. F. Shogren (eds.), Environmental economics, experimentalmethods, Routledge, pp. 243–260.
Gutsche, J.-M. (2006): Kurz-, mittel- und langfristige Kosten der Baulander-schließung fur die offentliche Hand, die Grundstucksbesitzer und die Allgemeinheit,Forschungsvorhaben im Auftrag des Ministerium fur Landwirtschaft, Umweltund landliche Raume des Landes Schleswig-Holstein, Hamburg.
Gutsche, J.-M. (2007): Von der Außen- zur Innenentwicklung in Stadten und Gemeinden:Erarbeitung von Handlungsvorschlagen sowie Analysen der okologischen, okonomischenund sozialen Wirkungen einer Neuorientierung der Siedlungspolitik – Das Kostenpara-doxon der Baulandentwicklung, Forschungsvorhaben im Auftrag des Umweltbunde-samtes, Dresden/ Hamburg.
Henderson, J. V. and H. G. Wang (2007): “Urbanization and city growth: The role ofinstitutions,” Regional Science and Urban Economics, 37(3), pp. 283–313.
Henger, R. and C. Schroter-Schlaack (2008): “Designoptionen fur den Handelmit Flachenausweisungsrechten in Deutschland: Okonomie und Planung derFlachennutzung,” Land Use Economics and Planning - Working Paper Series,08-02.
Trading Development Rights: A Laboratory Assessment 207
Henrich, J. (2001): “Challenges for everyone - Real people, deception, one-shotgames, social learning, and computers,” Behavioral and Brain Sciences, 24(3), pp.414–415.
Jorissen, J. and R. Coenen (2007): Sparsame und schonende Flachennutzung: Ent-wicklung und Steuerbarkeit des Flachenverbrauchs, Edition Sigma, Berlin.
Ostertag, K., J. Muller, and S. Seifert (2009): “Neue Instrumente zur Verringerungdes Flachenverbrauchs.” Okologisches Wirtschaften, 3, pp. 30–34.
Plott, C. R. and J. P. Cook (2005): “Congestion at locks on inland waterways: Anexperimental testbed of a policy of tradable priority permits for lock access,”Working Papers 1240, California Institute of Technology, Division of the Humani-ties and Social Sciences.
Plott, C. R. and D. P. Porter (1996): “Market architectures and institutional testbed-ding: An experiment with space station pricing policies,” Journal of EconomicBehavior & Organization, 31(2), pp. 237–272.
Preuß, T. (2006): Flachenkreislaufwirtschaft BAND 1. Theoretische Grundlagen und Plan-spielkonzeption: Kreislaufwirtschaft in der stadtischen/ stadtregionalen Flachennutzung.Ein ExWoSt-Forschungsfeld, Bundesamt fur Bauwesen und Raumordnung (BBR).
Preuß, T. (2009): Folgekosten der Siedlungsentwicklung: Bewertungsansatze, Modelle undWerkzeuge der Kosten-Nutzen-Betrachtung, Reihe REFINA, vol. 3, DiFU, Berlin.
Radermacher, F. J. (2004): “Neue Wege zu einem nachhaltigen Flachenmanagementin Baden-Wurttemberg: Sondergutachten,” Stuttgart.
Rolfe, J. and J. Windle (2006): “Using field experiments to explore the use of multiplebidding rounds in conservation auctions: International association of agriculturaleconomists (IAAE),” .
Roth, A. E. (1988): “Laboratory experimentation in economics: A methodologicaloverview,” The Economic Journal, 98(393), pp. 974–1031.
Schlapfer, F. (2007): “Marktwirtschaftliche Instrumente in der Raumplanung: Reak-tion auf den Schwerpunkt ‘Flacheninanspruchnahme’,” GAIA, 17(3), pp. 170–175.
Schleich, J., K. M. Ehrhart, C. Hoppe, and S. Seifert (2006): “Banning banking in EUemissions trading?” Energy Policy, 1(34), pp. 112–120.
Shogren, J. F. (2005): “Experimental Methods and Valuation,” in: K. G. Maler andJ. R. Vincent (eds.), Handbook of Environmental Economics, 2 edition, chapter 19,Elsevier, pp. 969–1027.
Siedentop, S. (2007): Nachhaltigkeitsbarometer Flache: Regionale Schlusselindikatorennachhaltiger Flachennutzung fur Fortschrittsberichte der nationalen Nachhaltigkeitsstrate-gie - Flachenziele, Forschungen / Bundesministerium fur Verkehr, Bau und Stad-tentwicklung, Selbstverlag des Bundesamtes fur Bauwesen und Raumordnung,Bonn.
Smith, V. L. (1994): “Economics in the laboratory,” The Journal of Economic Perspectives,8(1), pp. 113–131.
Suss, A. and M. Gmunder (2005): “Weniger Zersiedlung durch handelbareFlachennutzungszertifikate?” DISP 160 - Urban Sprawl, 41(1).

208 Jens E. Muller, Stefan Seifert, and Karl-Martin Ehrhart
Von Haaren, C. and P. Michaelis (2005): “Handelbare Flachenausweisungsrechteund Planung,” Informationen zur Raumentwicklung, 4/5.
Walz, R. (2005): Handelbare Flachenausweisungskontingente zur Begrenzung desFlachenverbrauchs: Ansatze fur Baden-Wurttemberg, Fraunhofer IRB Verlag.
Walz, R. and K. Ostertag (2007): “Der Flache einen Wert geben,” Umwelt Magazin,7/8, pp. 45–46.
Whitten, S., S. Salzman, D. Shelton, and W. Proctor (2003): “Markets for ecosystemservices: Applying the concepts,” Paper presented of the 47th Annual Conferenceof the Australian Agricultural and Resource Economics Society.

Part IV
Electronic Market Regulation


Electronic Markets and their Mechanisms asIntellectual Property
Tim Klumper and Thomas Dreier
Institute of Information and Economic Law, KITkluemper, [email protected]
Summary. An Electronic Market is the result of a market designing process. Due to thecomplexity of this process, electronic markets are major financial investments for theiroperators. The development of electronic markets is often based on innovative and creativework. However, an electronic market as such is not protected as intellectual property (IP).In this article, the protection of single electronic market elements, especially the protectionof the central market element, the economic mechanism, is questioned, if not denotedotherwise according to German law. The criteria which determine the existence of IP willbe presented. Using these criteria, it will be shown whether single market elements can beexpected to be classified as IP at present and where further approaches can be found.
1 Motivation
Market engineering deals among other things with the creation (the designing) andadvancement of electronic markets. Core area of such markets is the elaboratedallocation design, using a mechanism, which leads the junction of supply anddemand. The economic term ”mechanism” here describes any process that takes asinputs the bids and produces as its output the decision as to which bidder receivesthe item and how much any of the bidders will be required to pay1.
The development of electronic markets as a whole platform, as well as thedevelopment of its inner economic design, happen innovatively and often needmajor investments.
In order to foster innovation in the area of electronic markets, financial benefitsfor the innovator have to be secured. This may be achieved by restricting thecompetitors’ possibility to copy single market elements or even a whole marketconcept. The whole structure of an electronic market and its elements, from singlebasic ideas to the whole system which contains rules and software, are in legal termsintangible items. To restrain the possibility to copy intangible goods, intellectualproperty rights are used.
The question is whether electronic markets, as results of a market designingprocess, are subject to the legal protection of intellectual property rights. To answer
1 McAfee, McMillan in: Journal of Economic Literature, Vol. 25, No. 2. (Jun., 1987), p. 699.
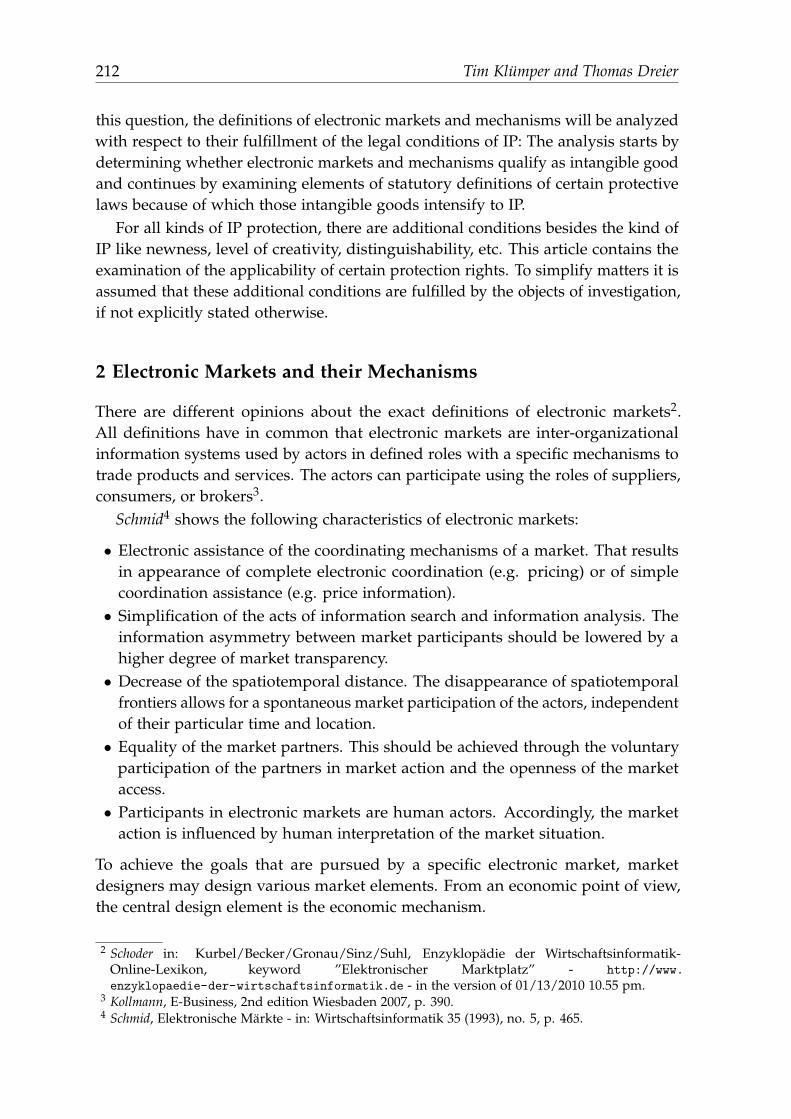
212 Tim Klumper and Thomas Dreier
this question, the definitions of electronic markets and mechanisms will be analyzedwith respect to their fulfillment of the legal conditions of IP: The analysis starts bydetermining whether electronic markets and mechanisms qualify as intangible goodand continues by examining elements of statutory definitions of certain protectivelaws because of which those intangible goods intensify to IP.
For all kinds of IP protection, there are additional conditions besides the kind ofIP like newness, level of creativity, distinguishability, etc. This article contains theexamination of the applicability of certain protection rights. To simplify matters it isassumed that these additional conditions are fulfilled by the objects of investigation,if not explicitly stated otherwise.
2 Electronic Markets and their Mechanisms
There are different opinions about the exact definitions of electronic markets2.All definitions have in common that electronic markets are inter-organizationalinformation systems used by actors in defined roles with a specific mechanisms totrade products and services. The actors can participate using the roles of suppliers,consumers, or brokers3.
Schmid4 shows the following characteristics of electronic markets:
• Electronic assistance of the coordinating mechanisms of a market. That resultsin appearance of complete electronic coordination (e.g. pricing) or of simplecoordination assistance (e.g. price information).• Simplification of the acts of information search and information analysis. The
information asymmetry between market participants should be lowered by ahigher degree of market transparency.• Decrease of the spatiotemporal distance. The disappearance of spatiotemporal
frontiers allows for a spontaneous market participation of the actors, independentof their particular time and location.• Equality of the market partners. This should be achieved through the voluntary
participation of the partners in market action and the openness of the marketaccess.• Participants in electronic markets are human actors. Accordingly, the market
action is influenced by human interpretation of the market situation.
To achieve the goals that are pursued by a specific electronic market, marketdesigners may design various market elements. From an economic point of view,the central design element is the economic mechanism.
2 Schoder in: Kurbel/Becker/Gronau/Sinz/Suhl, Enzyklopadie der Wirtschaftsinformatik-Online-Lexikon, keyword ”Elektronischer Marktplatz” - http://www.
enzyklopaedie-der-wirtschaftsinformatik.de - in the version of 01/13/2010 10.55 pm.3 Kollmann, E-Business, 2nd edition Wiesbaden 2007, p. 390.4 Schmid, Elektronische Markte - in: Wirtschaftsinformatik 35 (1993), no. 5, p. 465.

Electronic Markets and their Mechanisms as Intellectual Property 213
3 Electronic Markets and Their Mechanisms as Intangible Items
In search of the answer to the question, if and how far electronic markets in general,and economic mechanisms in particular within the scope of IP are legally protected,one has to ascertain that electronic markets, respectively economic mechanisms, areintangible items which possibly intensify to IP.
3.1 “Intangible Items”
Intangible items or intangible assets are immaterial economic goods5. These goodscan be subject of protection intensified to industrial property rights or copyrightbut also mere ideas, goodwill or know-how6. Intangible goods are all immaterialitems, independent of their legal protection, as long as the item is the result ofan innovative and commercial-mental act of creation7. The attribute of being aneconomically tradable good does not account for also being legally protected. Forinstance know-how very often is traded, but it is not legally protected by the rulesof IP by implication.
3.2 Electronic Markets as Intangible Items
Electronic markets are intangible items. They consist of a multitude of elements8,whose combination makes the market design. Electronic markets are results ofmarket designing processes with the objectives that have been discussed above,namely creating market transparency, lowering the transaction costs and influencingthe bidder’s behavior9. The specification of the market design may include pureeconomical but also political parameters10. The implementation of the specificationis an innovative act that resorts to scientific disciplines like mathematics, economics,psychology, computer science and even cultural sciences. Therefore, electronicmarkets as result of an innovative commercial-mental creation are immaterial goods.That classification is independent of the legal protectability of the goods and theirpotential intensifying to IP.
3.3 Economic Mechanisms as Intangible Items
Designing electronic markets requires in the first instance the design of a mechanismwhich influences the buyers’ and bidders’ behavior. The design of the economic
5 Putzo in: Palandt - Kommentar zum Burgerlichen Gesetzbuch, 68th edition Munchen 2009, § 453ref. 9.
6 Westermann in: Munchener Kommentar zum BGB, 5th edition Munchen 2008, § 433 ref. 16 f.7 textitAxter/Schutze in: Loewenheim/Meessen/Riesenkampff Kartellrecht, 2nd edition Munchen
2009, Europaisches Recht (Art. 81-86) 3. Teil ref. 1.8 In detail vide infra.9 The influence to the bidder’s behavior is not necessarily centered to profit maximization. Multi-
tude of auction theoretical approaches aim to the target of achieving economically worthwhile(”efficient”) prices and avoiding ruinous bidder’s competition - cf. Berninghaus/Erhart/Guth,Strategische Spiele, 2nd edition Berlin 2005, p. 556 ff.
10 E.g. state auctions of transmitter frequencies, mining rights or oil production rights.
214 Tim Klumper and Thomas Dreier
mechanism as a single market element is like the design of the whole market resultof an innovative commercial creation. Therefore, the designed mechanisms are alsointangible items.
4 Intellectual Property on Electronic Markets and TheirMechanisms
4.1 “Intellectual Property”
According to civil law the term intellectual property or IP describes the perpetua-tion of a right of factual and lawful dominant behavior over an intangible item11.Intangible items as such are not subjects of rights. Furthermore, intangible itemsdiffer from immovable and movable objects (”chattels”). The specific characteristicof intangible items is their ubiquitary and non-rivaling usability: Intangible itemscan be used in different places during the same time without mutual exclusion12.
Offhand there cannot be ownership of “mere” immaterial goods in terms ofperpetuation of a lawful dominant behavior; even if a person exercises actualphysical authority over such an immaterial good, e.g. through nondisclosure ofknow-how. Therefore, strengthening or intensifying of immaterial goods to IPis needed. This intensification which is called a lawful autonomisation does notarise from the BGB (Burgerliches Gesetzbuch - German Civil Code)13. The lawfulautonomisation of immaterial goods to the absolute right of IP is primary legislatedby the (special) statutes of industrial property and copyright14.
The term intellectual property (IP) therefore represents absolute subjective rights(rights entitled to one person with legal effect against everybody) over autonomizedimmaterial goods. Therefore, intellectual property in German is also called ”Imma-terialguterrecht” (intangible property right)15. IP underlies the numerus clausus(”Typenzwang”) and the principle of certainty. That means that IP is limited tothe rights given by the legislator. The law has to define exactly the purpose of theparticular intangible property right16.
In German law literature, the term ”intellectual property” is disputed17. As faras the intellectual property only refers to the incorporeal nature of a legal issue, itconforms to the term immaterial property right. If intellectual property in contrast
11 Bassenge in: Palandt - Kommentar zum Burgerlichen Gesetzbuch, 68th edition Munchen 2009,Uberbl. v. § 903, ref. 1.
12 Dreier in: Dreier/Schulze UrhG, 3rd edition Munchen 2008, Einl. ref. 14.13 Jauernig, BGB, 13th edition Munchen 2009, Vorbem. zu §§ 903-1011 ref. 7.14 Ohly JZ 2003, 545; Gotting GRUR 2006, 353.15 Creifelds, Rechtsworterbuch, 19th edition Munchen 2007, keywords ”Immaterialguterrechte” and
”Geistiges Eigentum”.16 Ohly in: Festschrift Schricker, 2005, p. 105-121; declining the terms ”numerus clausus” and
”Typenzwang” but agreeing with regard to the contents: Kraßer, Patentrecht, 6. edition Munchen2009, 1. Kapitel § 2 I. Nr. 4.
17 Cf. Ohly JZ 2003, 545 ff; Gotting GRUR 2006, 353 ff.
Electronic Markets and their Mechanisms as Intellectual Property 215
means that the legal issue is created by human mind, it only covers a part ofimmaterial property rights. Trade mark rights and rights of company symbols aswell as some of the ”neighboring rights” codified in the UrhG (Urheberrechtsgesetz- German Copyright Act) are not accorded due to human intellectual activity butdue to entrepreneurial effort18. This distinction must not conceal the danger ofconfusion between the similar terms of intangible goods (= incorporeal items) andintangible property rights (= legally protected interest = IP). This distinction is oftenblured, especially in English, where occasionally the terms IP and intangible goodsare often used interchangeably, which is dogmatically incorrect.
According to legal traditions of continental Europe, IP is divided in results ofcommercial innovation on the one hand and artistic-literary innovation on the otherhand. The distinction is reflected in the two fields of law: intellectual propertyrights and copy right. The term intellectual property consolidates both fields of law.This consolidation became internationally accepted19. In its official definition of IPthe World Property Organization (WIPO) adheres to the bisection20
“Intellectual property (IP) refers to creations of the mind: inventions, liter-ary and artistic works, and symbols, names, images, and designs used incommerce. Intellectual property is divided into two categories: Industrialproperty, which includes inventions (patents), trademarks, industrial designs,and geographic indications of source; and Copyright, which includes literaryand artistic works such as novels, poems and plays, films, musical works,artistic works such as drawings, paintings, photographs and sculptures, andarchitectural designs. Rights related to copyright include those of performingartists in their performances, producers of phonograms in their recordings,and those of broadcasters in their radio and television programs.”
In the context of intellectual property, procurable rights are copyrights, patents,Geschmacksmusterrecht (design law), Gebrauchsmuster (utility patent), trademarks,etc. Those rights are partially comparable to ownership rights. They are temporary,exclusive rights and entitle their holder to parry the use of his work by a thirdparty. A major difference between intellectual property and ownership rights is thetemporal limitation. German patent rights are temporary limited up to 20 yearsafter the application day (§ 16 sec. 1 sentence 1 PatG - Patentgesetz - German patentlaw); copyrights are temporary limited up to 70 years post mortem auctoris (§ 64UrhG). There is an exception for trade mark rights that can be renewed without anytemporal limitation.
18 Kraßer, 1. Kapitel § 2 II. Immaterialguterrecht. Geistiges Eigentum (cf. footnote no.16).19 Sambuc in: Harte-Bavendamm/Henning-Bodewig UWG, 2nd edition Munchen 2009, ref. 180.20 http://www.wipo.int/about-ip/en/ - in the version of 12/30/2009 4.00 pm.
216 Tim Klumper and Thomas Dreier
Historic Development21
From the beginning of human creativity limitation of knowledge was considered.The very thought of limitation was originated not only from the idea to givethe creator authority over his work but also from the aspect to grant the creatormonetary advantages. The problem here is the unlimited existence of IP after it wascreated (vide supra).
Already in the ancient world and later in the Middle Ages there were temporaland spatial limited rights of utilization in particular cultures, e.g. in the guildsystem or for recipes.
These ideas were only rudimentary approaches to the idea of IP. Usually theprotection of works was achieved by concealing the work, by only transfering itto followers or offspring, or by recording it in writings which were not readablefor most people at that time. In that period it was for example legal to copy eachbook to which one could get access by transcribing it. Due to the considerableeffort which was needed for obtaining such a copy and due to the small numberof people that were able to write, there was no need for legal protection to controlreproduction.
Furthermore, there was no need for authors to gain monetary outcome by tradinglicenses or rights. Authors were financed by monasteries, of which they wheremembers, or by patrons, often profane monarchs, that engaged academics. Theneed for IP protection changed with the invention of letterpress printing in 1452/54and the spread of the procedure. Well known philosophers like Pufendorf, Fichte,and Kant argued for the protection of mental works and justified their idea ofintellectual property with a natural justice basis22.
The first patent law was established in Venice in 1474; early legal norms about therelationship of authors and publishers can be found in the Allgemeines PreußischesLandrecht (ALR - General state laws for the Prussian states) from 1784. Thedevelopment of the legal norms continued until today’s status quo. In 1965 thecopyright law was comprehensively recodified in the Federal Republic of Germanyfor the first time after World War II and was changed several times since then. Thelast changes were introduced by the so called ”Dritter Korb” 2008 and consider thedifficulties arising from progressive digitalization23.
Today’s Reasons for Protection of Intellectual Property
Today the following reasons motivate the protection of intellectual property24.Competitiveness is supported by the protection from imitation, the assurance
of the pioneers’ earnings and the initiation of cooperation or licensing. In thiscontext, intellectual property is condition to take actions against product piracy. By
21 Ahrens, Gewerblicher Rechtsschutz, Tubingen 2008, p. 38 f.22 Dreier, Einl. ref. 54 (cf. footnote no. 12).23 Cf. Dreier, Einl. ref. 23 ff (cf. footnote no. 12).24 Rebel, Gewerbliche Schutzrechte, 5th edition Koln 2007, p. 1 ff.
Electronic Markets and their Mechanisms as Intellectual Property 217
application of regististration rights25, the subjects of protection are presented tothe public, advancing aspects such as deterrence of imitators, gaining of companyreputation and promotion.
Market members can read up on registered rights, publicity is generated. Wherelicenses for existing proprietary rights are accessible one can safe on nonneededresearch and development costs. Registered rights initiate new product inventions,problem solutions and avoid risks of collision with existing rights.
Employee invention law and its codified duty to register work-related inventionsprevent overreaching the employees and create an incentive for being innovativeat the same time. These targets are achieved with very low costs for the registrycompared to the high expenditure for research and development, manifacturingpreperations, advertising, sales launching, etc. Beyond that the legal protectionmechanisms enable a much cheaper opening up of new markets and market devel-opment: Costs for market development of protected products are lower, because thelaunch of protected products is easier, and therewith, cheaper than of non-protectedproducts.
These targets are archieved by the rights of intellectual properties: By excludingthird parties from using protected goods (absolute rights), intellectual propertyrights generate man-made shortage of infinitely available goods. So the marketabil-ity of the product is created. This is the only means of creating economic benefitsfor the creator. The economic benefit is incentive for innovation, investment, andcreation of new immaterial goods.
What is regarded as Intellectual Property?
The precise subject of protection is defined by the relevant protection laws’ area ofapplication26. Intellectual property in the form of copyright contains not only theprotection of personal mental creations in the field of literature, science and art, butalso the protection of certain mental works that are no creations27. Furthermore,computer programs are protected through copy rights for historical reasons28 (videinfra).
The most famous of the traditional commercially used industrial property rightsare patent rights for technical inventions that are new, beyond the state of theart, and results of an inventive step. Further industrial property rights include
25 Registration rights need application and recordation in a register to become valid. Mostly relevantis the application of patents. On the contrary copy rights arise contemporanous to the act ofcreating and need no application or recordation. Besides copy rights only special rules of theGerman Trademark Act and the Gemeinschaftsgeschmacksmusterrecht (design protection rules ofthe Europian Union) need no application process.
26 Ilzhofer, Patent-, Marken- und Urheberrecht, 7th edition Munchen 2007, ref. 12.27 That does not regard new creations but the (re-)discovery of existing incorporal goods, their
rendering and realization. Beneath this there are scientific editions, interpretations of an exec-utive artist, wors of photography and achievment of sound carrier producers, film producers,broadcasting companies and databank producers.
28 Dreier, Einl. ref. 27 (cf. footnote no. 12).
218 Tim Klumper and Thomas Dreier
trademark law for the protection of trademarks, company symbols, and geographicalindication of source labels, the Geschmacksmusterrecht (German design law) whichprotects aesthetical arranged forms like patterns of cloth, pieces of jewelry, vases,etc., and other rights that are not relevant in the present context, like plant varietyprotection rights that protect new species of plants, or topography protection rightsfor three-dimensional structures of microelectronic semi-conductor circuits29.
4.2 Intellectual Property in Electronic Markets
There is no legally normed protection right that protects electronic markets as awhole. Since intellectual property rights are subjects of numerus clausus (videsupra) there is no possibility of “creating” new protection rights through furtherdevelopment of the law. Thus, an electronic market as such is not protectable.
The integrated concept of an electronic market can be perceived as an idea.However, there is no possibility to protect pure ideas30. Consequently a protectionof electronic markets can only be considered by protecting the sum of its singleelements. The protectability of single electronic market elements has to be examinedindividually.
4.3 Intellectual Property in Single Electronic Market Elements
The outer appearance of an electronic market consists of several elements. Everyelement can be separately protected as IP. Such elements are the name of the marketplace provider (e.g. ”eBay Inc.”), the name of the market place (e.g. ”eBay”), itsinternet domain (e.g. http://ebay.com), the logo of the marketplace, its slogan (e.g.”Buy it, sell it, love it”), or the design of the internet presence. While elements of theouter appearance of the market can be assigned relatively easy to existing protectionrules (the name of the market place as commercial firm name according to § 37 sec.1 HGB31 - Handelsgesetzbuch or German Commercial Code; name and logo of themarket place according the German Trademark Act; also the domain according tothe German Trademark Act or by registration at the responsible domain registrar32;the slogan according to the Trademark Act or under certain circumstances accordingto the Copyright Act; the internet presence design according to the Copyright Act)the question is considerably more complex for the protection of elements of theinner structure of an electronic market.
The inner structure of the electronic market place represents the real resultof the market designing process. It contains the technical, legal, and economic
29 Gotting, Gewerblicher Rechtsschutz, 9.Aufl. Munchen 2007, § 1 Rn. 7 ff.30 Cf. § 1 para. 3 no. 3 PatG; for the protection of ideas in the context of copyright vide infra.31 § 37 sec. 1 HGB ”Wer eine nach den Vorschriften dieses Abschnitts ihm nicht zustehende
Firma gebraucht, ist von dem Registergericht zur Unterlassung des Gebrauchs der Firma durchFestsetzung von Ordnungsgeld anzuhalten.”.
32 DENIC (Deutsches Network Information Center) for domains under the top level doman (TLD)”.de”, VeriSign Inc. for domains under the TLD ”.com”, etc.
Electronic Markets and their Mechanisms as Intellectual Property 219
implementation of the market place design. While the economic market designrepresents the functional core of the market place, the legal framework is theverbalization of the economic design parameters, as well as the technical frameworkis the realization of the functionality of the online software application.
The technical implementation is protected as software according to the § 69aUrhG33. That protection only covers a specific programming solution. According tothe copyright, there is no protection of the idea behind the software.
The copyright also protects the database which may be part of the technicalframework as a database work. The paragraphs to be considered are §§ 4 sec. 2 and87a ff UrhG that are independent with regard to their contents. § 4 sec. 2 UrhGprotects the creative selection and arrangement of a database work, § 87a ff UrhGprotects the investment of a database maker in assembling the data34. In this respect,both rules are independently applicable for a database behind an electronic marketplace. While § 4 sec. 2 UrhG requires a personal mental creation, §§ 87a ff UrhGprotects databases that are no personal mental creation, as far as these comply withthe requirements of the § 87a UrhG. Namely, these requirements are a collection ofworks, data or other independent elements arranged in a systematic or methodicalway, whose elements are individually accessible either by electronic or by othermeans, and whose obtaining, verification or presentation requires a qualitatively orquantitatively substantial investment.
The legal framework for the particular allocation or pricing mechanism describesthe action alternatives and rules for persons acting on the market place. Thatlegal framework is agreed upon by the market place provider and the other actingpersons35. The rules representing the legal framework are drafted for multipleusages from the provider party and usually the other party has no possibility tonegotiate the conditions. So the rules have to be qualified as AGB (AllgemeineGeschaftsbedingungen - general terms and conditions)36. Terms and conditionscan be subject of copyrights if they fulfill certain conditions - e.g. if the wording isremarkably better than standard phrases or if the terms and conditions are basedon a special mental concept or an extraordinary structure37. Again, the protectionrefers to the ”construction” of the terms and conditions - not to the representedcontent.
Therefore, a legal protection of the elements representing the economic designis possible. This protection refers only to the implementation of the design, inparticular the software framework, the aligning database, and the legal framework.
33 Cf. in detail Karl Der urheberrechtliche Schutzbereich von Computerprogrammen, Munchen 2009,p. 189.
34 Dreier, Vor §§ 87a ff ref. 1 (cf. footnote no. 12).35 That agreement and the imperatively resulting disclosure of the rules for the participation on the
market place allow inferences of the participant about the design of the pricing mechanism. Thatis the main reason for the impossibility to protect the inner market design by nondisclosure. Sowithout legal protection the participants can use that knowledge anywhere.
36 Cf. § 305 sec. 1 BGB.37 LG (regional court) Munchen I GRUR 1991, 50, 51 - Geschaftsbedingungen.
220 Tim Klumper and Thomas Dreier
The idea of the design per se is not protected. So the protection of the economicdesign per se is still to be examined.
Besides the regulations concerning the market participants (e.g. restrictionsbecause of the professionalism of the participants - b2b, b2c or c2c market places),the customers’ structure (e.g. ”PowerSeller”, closed, membership-based or openmarket platforms), and often confidence-building systems (e.g. rating systems38),economic market design contains most importantly the economic mechanism. Theeconomic mechanism - in most cases of current market platforms in the shape of anauction design39 - is the real inner core of an electronic market. Using game andauction theoretical findings the mechanism is adjusted to the needs of the particularmarket place. The practical implementations underlie pre-existing scientific findingsas well as extensive models and experiments that are partially tailored to theparticular use case40, and that partially can also be used in other cases.
4.4 Intellectual Property in Economic Mechanisms
A mechanism describes a market economic ruling automatism that regulates thepricing by co-operation of supply and demand. By pricing the production factorsare conducted to the location of most efficient usage and goods are conducted tothe location of best provision of benefits (optimal allocation of resources). Throughthis the efficiency of the political economy is achieved41.
Economic mechanisms may occur for example in the form of a specific auctiondesign or in the form of a simple salesroom. A pricing or allocation mechanism candevelop spontaneously. An example could be the development of a black marketunder an inefficient planned economy. The creation of such mechanisms in the caseof electronic markets often is result of innovative action, as in the example which ispresented and discussed in here.
Economic mechanisms are results of creative and constructive acting; indepen-dent of whether they were developed from a combination of coincidence andempiricism, or from pure innovatively created. As such they are incorporeal goods.Only the protectability in terms of IP is problematic (vide supra).
To examine if and how far a legal protection for mechanisms exists, the first stepconsists in determining into which protection laws’ scope economic mechanismsfall. Every protection law defines its own legal scope. Candidates in the presentcase are the protection of economic mechanisms as technical findings - therefore theextent of protection of (utility) patent law is affected42. Furthermore, the protection
38 About third party rating systems cf. Balboni, Trustmarks in E-Commerce, Den Hague 2009, S. 26 ff.39 The term ”auction” in this context means the economic definition of a pricing by bidding
independent how the winner is identified contrary to the legal sense of the term ”auction” where aknocking down in the end is mandatory, § 156 BGB and § 34b GewO (Gewerbeordnung - GermanTrade, Commerce an Industry Regulation Act) - cf. BGH (Bundesgerichtshof - German FederalCourt of Justice) CR 2002, 213.
40 Berninghaus et al., p. 413 ff (cf. footnote no. 9 in the end).41 Roth, VWL fur Einsteiger, Stuttgart 2006, p. 19.42 Cf. § 1 PatG; § 1 GebrMG.
Electronic Markets and their Mechanisms as Intellectual Property 221
can be seen as a work of language or as an illustration of a scientific or technicalnature - therefore the protection of copyright is extended43. The application of bothof the named scopes of protection is imaginable under certain conditions.
Technical Invention
If a protection is aspired in combination with an implementation in a technical(computer) system the scope of (utility) patent law is affected44. Conditions forthat protection are newness, technical character (”Technizitat”), involvement ofan inventive step, and commercial usability. While most of the conditions do notcause any problems, proving the technical character of software-referred inventionsoften is a challenge. Even though in the last years a liberalization of the traditionalperception, according to which software is only a behavior guideline and not atechnical invention, can be observed, a separate checkup is still required concerningthe technical character of the software-related invention. That checkup consistsof two steps. First, the connection of the underlying algorithm of the programto a conventional technical area (physics, chemistry, biology, engineering science)is questioned. If the connection exists, the technical character will be assumed.If the algorithm has no technical character other characteristics are required thatlegitimate a patent protection considering objective target of German patent law45.Usually this is the case if the software is solving technical tasks46.
As an example for the protection of allocation mechanisms by patent law andutility patent law the utility patent for a computer system of the UBS AG to carryout financial transactions47 shall be named here. The system is protected as a wholeincluding the functionality of the underlieing algorithm, but only in combinationwith the technical arrangement including the computer components. That meansthat the utility patent only is effective as long as the exact combination of allocationalgorithm, software and hardware should be protected. In the named case aComputersystem zur Durchfuhrung einer Finanztransaktion (computer system tocarry out a financial transaction) is protected, that consists of an Indexdatenbank(index data base), a Postendatenbank (entry data base) and a Transaktionseinheit(transaction unit). Already a comparatively small change of the setting eliminatesthe possibility to enforce the patent rights, e.g. the using of a similar working butindependently programmed software running on another computer system thanthe one described in the patent. The patent protection only is efficient against aone-to-one copy of the whole system. A similar protection problem exists for othertrading systems like XETRA or Eurex48.
43 Cf. § 2 sec. 1 UrhG.44 Cf. Gebrauchsmusterschrift (utility patent specification) DE 200 20 859 U1 of the DPMA (Deutsches
Patent- und Markenamt - German Patent and Trademark Office).45 Ilzhofer, Rn. 108 (cf. footnote no. 26).46 BGH GRUR 2000, 498 - Logikverifikation.47 Gebrauchsmusterschrift DE 200 20 589 U1 of the DPMA.48 For the functionality of computer stock markets cf. Kumpel, Bank- und Kapitalmarktrecht, Koln
2004, ref. 17.538 ff.
222 Tim Klumper and Thomas Dreier
Copyright Protection
Object of investigation of this article is the protectability of the mechanism itself.On its own the economic mechanism is no technical invention. A patent or utilitypatent protection only is applicable if the economic mechanism - in the shape ofsoftware - was implemented in a technical system. That causes, as aforementioned,a very limited protection just only in combination with the technical system, themechanism was implemented in. A protection of the mechanism itself can begranted by the copyright as long as the mechanism is qualified as work of languageor illustration of scientific nature (vide supra).
Thus, the evaluation scheme for copyright49 is applicable.First of all, those objects have to be excluded that are not protectable by copy-
right50, even though they fall in the scope of copyrights: copyrights are not appli-cable for mere ideas, themes, or motives for lack of manifestation. Also there isno protection for free research findings (in detail vide infra). For the generally notprotectable content a protection of the specific embodiment has to be considered51.Methods, styles, (fashion) trends in the spirit of a time are also not protectable.While trends and styles are not protected, the works, that follow or change thesetrends, are52. If the arrangement of a work is predetermined, or simply a technicalmust, it is also not protected53. The arrangement and choice of already knowndesign elements is also not protectable - even though the ”Kleine Munze”54 isfulfilled in this case if the compilation is notably well-arranged55.
Irrelevant for the identification of existing copyright protection are criteria likeexpense, costs, or extent of a work56.
After excluding the non-protectable elements, one has to determine if and howthe representational work differs from other works of the same kind. That ratingshould respect the work as a whole but also the single elements of the work57.
By judging the example of mechanisms of electronic markets one has to pay muchattention to the aspect of differences to former existing markets. It is easily possiblethat the newness of a platform is only represented by other market elements thanthe economic mechanism, which may be the same as in some pre-existing platforms.Even pretended new inventions, which are discussed in some disciplines like the
49 Schulze in: Dreier/Schulze, UrhG, 3rd edition Munchen 2008, § 2 ref. 36.50 Schulze, § 2 ref. 36 (cf. footnote 49).51 Schulze, § 2 ref. 42 (cf. footnote 49).52 Schulze, § 2 ref. 45 (cf. footnote 49).53 Schulze, § 2 ref. 47 (cf. footnote 49).54 Kleine Munze is the lowermost limit of the creative expression that is needed for protectability of a
work.55 Cf. OLG (Oberlandesgericht - Higher Regional Court) Nurnberg GRUR-RR 1980, 227, 230 -
Dienstanweisung; LG Koln GRUR 2001, 152 - multiple-choice-Klausuren.56 Schulze, § 2 ref. 53 ff (cf. footnote 49).57 Cf. Schulze GRUR 1984, 400, 402 ff.

Electronic Markets and their Mechanisms as Intellectual Property 223
legal estimation of internet auctions some years ago58, are no creative improvementsfrom an economic point of view.
Nevertheless, especially in the field of strategic games new economic mecha-nisms are invented, based on knowledge from models, experiments, and empiricalresearch.
After the differentness and newness of the work is ascertained, it has to bedetermined which kind of work named in the Copy Right Act is appropriatefor the specific work in question. However, the Copy Right Act enumeration isnon-exhaustive59.
The assignment of the work to a certain kind of work is meaningful if the kindof work requires special rules for application. Different kinds of works that haveto be considered are named in § 2 sec. 2 no. 1-7 UrhG. The named kinds of workshave in common that they require the existence of a personal mental creation forprotection60. In the case of designed markets, the classification as work of languageor as illustration of scientific nature comes in to consideration.
Work of Language
The protection of works of language implies the protection of the self-createdillustration in the first place. The self-created relevance is easier to achieve forthe author of an imaginary work like a poem or a novel than for example for theoriginator of a scientific work which is limited in phrasing and structure by thescientific context61. Anyhow the protection of a work of language also involves theprotection of the content62. But in the first place, the protection concerns the specificlinguistic arrangement.
For the illustration of an economic mechanism, linguistic methods and descriptivemethods of mathematics are used. In principle, both illustration methods havethe protectability as a work of language in common. This protectability does notdepend on the kind of language that is used in the description. However, the strictlyformal mathematical description of a scientific finding does not allow for creativearrangements. Therefore, a copyright protection for mathematical descriptions willhardly be achievable63.
Even if one uses the possibilities of mere descriptive linguistic methods toillustrate scientific findings, the scope of creativity is more limited because of theobligatory use of technical terminology than it would be the case writing a prose
58 Cf. BGH CR 2005, 53 - eBay auctions are no auctions with respect to the legal definition.59 Schulze, § 2 ref. 78 (cf. footnote 49).60 Cf. therefore Loewenheim in: Schricker, Urheberrecht, 3rd edition 2006, § 2 ref. 4 f.; v. Moltke, Das
Urheberrecht an den Werken der Wissenschaft, 1992.61 Schulze, § 2 ref. 83 ff (cf. footnote 49).62 Fabelschutz (“protection of the tale” = protection of the story/content) cf. Oechsler GRUR 2009,
1101, 1104.63 Schulze, § 2 ref. 93 (cf. footnote 49).
224 Tim Klumper and Thomas Dreier
text. So it is nearly impossible to achieve a copyright protection for scientificallycharacterized works of language64.
Illustration of Scientific or Technical Nature
The protection of illustrations of scientific or technical nature covers only form andarrangement65. Scientific cognition, doctrines, and theories are not protected withregard to the content66. The reason therefore is that they are not created by scientistsor researchers. They are not result of a creative act but they already existed, andhave only to be revealed or “simply” be found67. Scientific findings belong tocultural public property which every creator builds on and which shall be commonknowledge68. Scientific doctrines shall be free and public domain69. This strongopinion is based on the ideal of freedom of science and free access to scientificfindings, even if in practice the existence of that ideal is more and more doubted70.
The argumentation that scientific findings are not based on creative but empiricalaction seems to apply to natural sciences at first sight. But already when lookingat applied sciences, one becomes aware that scientific knowledge is also used forproblem solving as a creative act. An example is the usage of scientific findings takenfrom game theoretical research to create an allocation mechanism71. The mechanismdesign is a creative act that falls under the scope of protection of illustrations ofscientific nature.
Even in the stage of acquiring scientific knowledge - in the above-mentionedexample during the gaining of insights about the behavior of players in specificsituations - models and experiments are used that emulate reality, but simplifiedthrough certain hypotheses72. The setting of such models or such experiments is acreative act on its own. That creativity to configure the experimental parametersaffects the results and is reason for some misinterpretation73. It remains arguable,whether the described creativity in setting and configuration of the measurementmethod really leads directly to a creative result. The opinion that creatively chosenmeasurement methods do not lead to a creative result but still to an empiric finding -independent of its defectiveness, reduction or shorting caused by the chosen method- is justifiable.
64 Analyzing the legal situation identical, but critical: Haberstumpf ZUM 2001, 819, 821.65 BGHZ 39, 306, 311 - Rechenschieber; BGH GRUR 1981, 352, 353 - Examensarbeit.66 Schulze, § 2 ref. 41, 93 ff (cf. footnote 49).67 Schulze, § 2 ref. 41 with further cit. (cf. footnote 49).68 BG GRUR 1981, 352, 353 - Examensarbeit.69 BGHZ 39, 306, 311 - Rechenschieber.70 Hilty GRUR 2009, 633-644, 635.71 Berninghaus et. al., (cf. footnote no. 9 in the end). p. 86 ff.72 Brodbeck in: Baudson/Dresler, Kreativitat und Innovation, Stuttgart 2008, p. 16.73 Berninghaus et. al., (cf. footnote no. 9 in the end). p. 86 ff; p. 414; with the extensive result to deny
economics their scientific status: Brodbeck (cf. footnote 72), p. 16.

Electronic Markets and their Mechanisms as Intellectual Property 225
The reason for the very common point of view, science is no matter of creativity,perhaps arises from the effort of especially empiric scientific disciplines to delete allhints of creativity in their methods before publishing74.
Considering the above discussion and all the presented arguments, the prevailingview is that only the representation of the findings, and not for the content itself, isprotectable75. The precise illustration can be protected, if it is adequately individual,e.g. if it is extremely understandable or if it is explained in a different, not pre-givenway76. Problematic here is the borderline between not yet protected content and theprotected precise illustration. This problematic borderline is very obvious in caseswhere courts use content criteria to affirm individuality of the illustration77.
In these cases, the borderline between content and illustration is crossed. Mainargument of critics of this judicature is a very formal one. They point to Art. 9 sec.2 TRIPS78:
“Copyright protection shall extend to expressions and not to ideas, proce-dures, methods of operation or mathematical concepts as such.”
The applicability of that rule in national German right is controversial79 and inall probability has to be seen as a declaration of political intent80. At least thatargument cannot set strong priorities against the habit of high courts in Germanyto verify the individual illustration using the content. But nevertheless, the usageof the content to test the criteria of individuality does not create protection for thecontent. To recapitulate copyright protection of a pricing or allocation mechanismis possible as illustration of technical nature. This protection indeed only covers theform of the illustration, not the mechanism itself. Currently, mechanisms are seenas mere ideas that are not protectable in themselves.
Board Games as Example for Protection of mere Ideas
The refusal of the protection of scientific findings and in particular of ideas has tobe questioned dogmatically. The protection situation of electronic markets and theirmechanisms is comparable to the (not approved) protection of board games that is
74 Joerges Zeitschrift fur allgemeine Wissenschaftstheorie 1977, p. 383.75 Schulze, § 2 ref. 43 (cf. footnote 49).76 BGH GRUR 1986, 739, 741 - Anwaltsschriftsatz; LG Munchen I GRUR 1991, 50, 51 -
Geschaftsbedingungen.77 Cf. overview of such cases in: Oechsler (cf. footnote no. 62), p. 1103.78 TRIPS - Agreement on Trade-Related Aspects of Intellectual Property Rights.79 Again a systematic argument argues against the direct application. In Art. 9 sec. 1 S. 1 TRIPS the
Art. 1 - 21 of the RBU (Revidiertes Berner Ubereinkommen - ”revised accommodation of Bern”)are declared applicable. That means that for member states of TRIPS that were members of theRBU before Art. 9 sec. 2 TRIPS cannot limit the binding effect of the RBU. That is the case for theFederal Republic of Germany.
80 Cf. Oechsler (cf. footnote no. 62), p. 1103 with further cit.
226 Tim Klumper and Thomas Dreier
subject of the current legal discussion81. The discussion already started with theintroduction of the German copy right, but currently revived82.
The analogy arises from the similar construction of board games and electronicmarket places. While in the case of electronic markets the economic market de-sign and especially the mechanism find their representation in the form of theprogrammed market place software and the terms and conditions, the game ideaunderlying a board game is represented in the game articles (boards, figures, cards,etc.) and the rules of the game. In analogy to the protection situation for electronicmarkets and games shown above, the protection is not applicable to the rules andideas of board games with regard to the content, but only to the illustration ofthe rules if they are individual enough83. This opinion is based on the opinionthat board games are neither works of language, nor literature, nor illustrationsof scientific or technical nature regarding to the German UrhG84. These groundsare unpersuadable, because of the non-terminal character of the legal enumerationof kinds of works in § 2 sec. 2 UrhG. Other discussants justify their point of viewwith the argument that game rules are only information and ideas that could not beprotected85.
The differentiation between precise (and possibly protectable) illustration ofa board game and the idea behind it is one, that is also applicable to electronicmarkets. In the field of board games, opinions arise that doubt the general refusalof the protection of mere ideas - at least if these ideas were manifested86. Afterthe manifestation within a certain work an idea has to be protected formally andwith regard to the content as essential component of the protected work. Thecoverage of that protection depends on the affected work. However, the discussionsabout the technical and scientific relevant arrangement have to distinguish betweeneconomic mechanisms and board game ideas. But one can find arguments makingworth considering a more detailed examination of the flat negation of a copyrightprotection for ideas.
5 Conclusion
The constraint of the protection of economic mechanisms only indirectly usingthe illustrating form of its scientific or lingual representation or respectively incombination with a technical implementation as (utility) patent is dissatisfying.
81 Substitutional for the current discussion: Oechsler (cf. footnote no. 62), 1101; Risthaus WRP 2009,698; Schricker GRUR Int. 2008, 200.
82 Starting with a judgement of the BGH GRUR 1962, 51 and renewed because of LG MannheimNJOZ 2008, 3351.
83 Ulmer, Urheber- und Verlagsrecht, 3rd edition Berlin 1980, p. 132; Schulze (cf. footnote no. 49), § 2Rn. 104.
84 Ulmer (cf. footnote No. 83), p. 132.85 Schack, Urheber- und Urhebervertragsrecht, 4th edition Tubingen 2007, p. 168.86 Schricker (cf. footnote no. 81), 203 with further cit.
Electronic Markets and their Mechanisms as Intellectual Property 227
This is especially true with respect to creativity, invention, and investment that areinherent in economic mechanisms.
It has to be kept in mind that economic mechanisms are, despite the afore-mentioned efforts during their creation, only one element of technical systemsrespectively of electronic markets. The mechanism itself is ”just” a scientific findingor an idea, which cannot be protected by itself according to the presently prevailingview.
If a protection of the mechanism is aspired at present, one has to use the indirectlyoperating protection rights.
References
Ahrens (2008): Gewerblicher Rechtsschutz.Axter and Schutze (2009): Kartellrecht, 2 edition.Balboni (2009): Trustmarks in E-Commerce.Bassenge (2009): Kommentar zum BGB, 68 edition.Berninghaus/Erhart/Guth (2005): Strategische Spiele, 2 edition.Brodbeck (2008): Kreativitat und Innovation, Baudson/Dresler.Creifelds (2007): Rechtsworterbuch, 19 edition.Dreier (2008): Urheberrechtsgesetz, 3 edition.Gotting (2006): “Der Begriff des Geistigen Eigentums,” Gewerblicher Rechtsschutz
und Urheberrecht (GRUR), p. 353.Gotting (2007): Gewerblicher Rechtsschutz, 9 edition.Haberstumpf (2001): “Wem gehoren Forschungsergebnisse,” Zeitschrift fur Urheber-
und Medienrecht (ZUM), p. 819.Hilty (2009): “Renaissance der Zwangslizenzen im Urheberrecht? Gedanken zu
Ungereimtheiten auf der urheberrechtlichen Wertschopfungskette,” GewerblicherRechtsschutz und Urheberrecht (GRUR), p. 633.
Ilzhofer (2007): Patent-, Marken- und Urheberrecht.Jauernig (2009): BGB, 13 edition.Joerges (1977): “Wissenschaftliche Kreativitat - Empirische und wissenschaftsprak-
tische Hinweise,” Zeitschrift fur allgemeine Wissenstheorie, p. 383.Karl (2009): Der urheberrechtliche Schutzbereich von Computerprogrammen, Ph.D. thesis.Kumpel (2004): Bank- und Kapitalmarktrecht.Kollmann (2008): E-Business: Grundlagen elektronischer Geschaftsprozesse in der Net
Economy.Kraßer (2009): Patentrecht.Loewenheim (2006): Urheberrecht, 3 edition.McAfee and McMillan (1987): “Auctions and Bidding,” Journal of Economic Literature,
25(2), p. 699.

228 Tim Klumper and Thomas Dreier
Oechsler (2009): “Die Idee als personliche geistige Schopfung - Von Fichtes Lehrevom Gedankeneigentum zum Schutz von Spielideen,” Gewerblicher Rechtsschutzund Urheberrecht (GRUR), p. 1101.
Ohly (2003): “Geistiges Eigentum?” Juristen Zeitung (JZ), p. 545.Ohly (2005): “Gibt es einen Numerus clausus der Immateri-
alguterrechte?” in: Perspektiven des geistigen Eigentums und Wet-tbewerbsrecht. Festschrift fur Gerhard Schricker zum 70. Geburtstag,Ohly/Bodewig/Dreier/Gotting/Haedicke/Lehmann.
Putzo (2009): Kommentar zum BGB, 68 edition.Rebel (2007): Gewerbliche Schutzrechte, 5 edition.Risthaus (2003): “Spiele und Spielregeln im Urheberrecht – Rien ne va plus?”
Wettbewerb in Recht und Praxis (WRP), p. 698.Roth (2006): VWL fur Einsteiger.Sambuc (2009): UWG, 2 edition.Schack (3007): Urheber- und Urhebervertragsrecht, 4 edition.Schmid (1993): “Elektronische Markte,” Wirtschaftsinformatik, 5(35), p. 465.Schoder (2010): Enzyklopadie der Wirtschaftsinformatik-Online-Lexikon, chapter Elek-
tronischer Marktplatz, Kurbel and Becker and Gronau and Sinz andSuhl,http://www.enzyklopaedie-der-wirtschaftsinformatik.de.
Schulze (2008): Urheberrechtsgesetz.Ulmer (1980): Urheber- und Verlagsrecht, 3 edition.v. Moltke (2006): Das Urheberrecht an Werken der Wissenschaft.Westermann (2008): Munchener Kommentar zum BGB, 5 edition.
Municipal Information – Amounts of Data but noStructure? An outline over Legal Aspects ofInformational Technologies Within Public Entities
Simone Traub and Indra Spiecker gen. Dohmann
Institute of Information and Economic Law, KIT simone.traub, [email protected]
1 Introduction
The half-life period of knowledge becomes shorter and shorter. This does not onlyaffect private companies but also the state and its entities. Particularly municipali-ties with their immediate relations to citizens are continuously facing public tasksconnected with lots of information and the need for accurate and quickly accessibleknowledge such as economical or environmental data (e.g. concentration of air pol-lutants) or similar parameters. The necessity of faster and more flexible reactions onthe part of the state demands an intelligent generation, collection and managementof information. Such information management consists of operative and strategicaction on a higher hierarchical level, oriented at the aims of the organization andfocused on the planning and controlling of information and information processeswithin the organization extending to its external communication.1 Informationmanagement provides for the allocation of information infrastructure serving thecapture, generation, consolidation, saving and transfer of information. It aims atutilizing knowledge that diffusely exists but has not been established yet in a usefulway. Hereby, the decision making of both central and peripheral entities shall besupported.2
What does that mean for the information management of municipalities and theirsupervisory authority? The supervisory agency represents a focal point of infor-mation as it controls the municipalities. Therefore it needs information. At thesame time, the supervisory agency controls many different municipalities, so it alsohandles superior knowledge in comparison to the single municipality. Experienceteaches that there is an information asymmetry between the single municipality andthe supervisory authority. The supervisory authority has available more personnel
1 Compare Sigrid Schaefer, Controlling und Informationsmanagement in Strategischen Un-ternehmensnetzwerken: Multiperspektivische Modellierung und interorganisationale Vernet-zung von Informationsprozessen, Wiesbaden 2009, p. 94; compare Vladislav Rajkovic/BlazZupan, Knowledge Management as a Challenge for Public Administration Reengineering, in: JozeFlorjancic/Karl Putz (Eds.), Informatics and Management, Frankfurt/Main 2004, p. 129 (129).
2 Compare Schaefer, see above note 1, p. 94; compare Rajkovic/Zupan, see above note 1, p. 129.
230 Simone Traub and Indra Spiecker gen. Dohmann
know-how than the single municipality and in addition it can resort to the above-mentioned experience of other municipalities by its control activity. To reduce thisproblem, the supervisory authority can provide information by means of databases.From the normative/legal point of view it is questionable whether there are rights ofthe municipalities or third parties that are opposed to the distribution of municipaldata by a database. One of these rights might be Art. 28 sect. 2 German Basic Law(Grundgesetz). In other words: Is the supervisory authority subject of obligationsof secrecy, which debar it from providing such data within a database?The following contribution examines the conditions and limitations of the distribu-tion of municipal data by the supervisory authority. As such a distribution of datais often called for, it is important to demonstrate which rights and obligations haveto be considered. The legislature has so far exercised restraint in this field and theupcoming debate is expected to expose interesting developments. Therefore thiscontribution wants to raise some general questions in order to fuel the discoursewithout attempting to give conclusive answers.
2 Visiting the field of information - the duties of municipalities
To examine the above-mentioned questions appropriately it is necessary to knowwhich kind of information is generated, collected and distributed by the munici-palities that is of interest for a database. In other words, the territory of municipalactivity has to be set out. What is the municipalities´ character and how can theirposition within the state organization be described?
2.1 The competence of municipalities
Municipalities perform two different tasks within the state organization. On theone hand they take care of all activities rooted within the municipal community.Municipal administration concerns people in a very immediate way. Everybody ofus is living in a municipality and takes advantage of it. The tasks of a municipalityare not limited, not strictly listed.3 On the contrary, everything which concernsthe municipality is the duty of the municipality (so-called principle of universal-ity4).5 If problems arise, they are firstly perceived on the administrative grassrootlevel, and they call for a solution which must first and foremost be provided bythe municipality. According to the principle of subsidiarity only in case of themunicipalities´ overload with a specific task or if superior aspects and interests callfor a more extensive or more standardized solution, then the Lander or the FederalGovernment are competent for the administration within the municipalities.6 These
3 Compare the German Constitutional Court Decision, BVerfGE 79, 127 (127).4 E. g. § 1 sect. 3 BauGB: ”The municipalities are obliged to construct the local building plans. . . ”5 Compare the German Constitutional Court (Bundesverfassungsgericht) in its ground-breaking
decision of 1958, BVerfGE 8, 122 (134).6 German Constitutional Court Decision, BVerfGE 79, 127 (127).
Municipal Information – Amounts of Data but no Structure? 231
duties, as described in the following, and connected to the local community, arecalled both ”autonomous tasks” or ”tasks within the jurisdiction of an autonomousmunicipal administration”.7
On the other hand they also perform administrative tasks that fall into the area ofresponsibility of a higher level, that means the Lander or the Federal Government.They are doing this by executing the corresponding laws of the Lander and theFederal State. These duties are transferred to the municipalities for reasons ofexpedience. Therefore they have to be controlled by a higher authority to establishequivalent living conditions throughout the federal territory and to maintain legalor economic unity in the national interest.8 The municipalities fulfill these dutiesbecause they work and act close to the citizens and therefore close to the problem.Moreover they can react more flexible to local specifics than a federal governmentcan. This is why the Lander or the Federal Government transfer a designated partof their duties to the municipalities. In other words, the Lander make use of theadvantages of a locally situated, close to the problem working apparatus while atthe same time retaining the control and possibility of intervention.After all, one can differentiate between two fields of municipal duties: There are theautonomous tasks and the transferred duties.9 The distinction between these twotypes of duties is not always easy. This distinction is, however, important for thequestion to what extent the municipality can act autonomously while performingits tasks, and to what extent the state authorities have the competence to instructand direct. For the data questions of interest here, this means: Who ”owns” thedata – is the municipality owner of its data or is it the supervisory authority andwhat rights can be claimed by the municipality?
2.2 The role of the municipalities within the state framework
a Municipalities - integral part of the state but yet independent entities
After having described the tasks of municipalities, their position within the stateframework has to be considered to elaborate possible municipal rights that areopposed to the distribution of data by the supervisory authority.To properly sort the municipalities and the municipal self-administration into thestate framework, one has to consider two aspects often opposed to each other.From the viewpoint of polity, municipalities have to be classed with the FederalStates. That means that the municipalities are not a ”third level” besides the FederalState and the Lander with own sovereignty. This structure can be derived – interalia – from the fact that according to Art. 106 sect. 9 German Basic Law (theGerman Constitution, Grundgesetz), revenues and expenditures shall be deemed tobe revenues and expenditures of the federal states.10 For this reason municipal tasks7 Diana Zacharias, Nordrhein-Westfalisches Kommunalrecht, Thungersheim/Frankfurt a. M. 2004,
p. 58f.8 Compare the rule of Art. 72 sect. 2 German Basic Law.9 Zacharias, see above note 7, p. 57.
10 Zacharias, see above note 7, p. 25.
232 Simone Traub and Indra Spiecker gen. Dohmann
are essentially defined by the field of duties of the Federal States. The municipalitiesare part of the state administration and thereby executing state sovereignty.On the other hand, the municipal entity is built on democratic elements – compare §1 of the Local Government Law of Baden-Wuerttemberg (Gemeindeordnung Baden-Wurttemberg) – and is a paragon of civil self-administration. Also historically,the tasks of government were first and foremost lodged with the local community.It is not surprising, that Art. 28 sect. 2 German Basic Law and § 2 of the LocalGovernment Law of Baden-Wuerttemberg guarantee to municipalities the right toregulate all local affairs on their own responsibility, within the limits prescribed bythe laws.
b Municipal Supervision
To ensure the lawfulness of municipal acts – both in the field of self administration aswell as if they act as a part of the state administration municipalities must be super-vised by state authorities. Municipal supervision is the downside of the municipalautonomy11: The considerable independence of local authorities is counter-balancedby a strict control of the legality (and more) of their actions. Municipalities shallnot become autonomous entities in the sense that they may act free of legal bounds,and therefore, they need control.According to a more modern understanding however, the supervisory authorityis a partner of the municipality and has the duty to support the municipality bypracticing its self-administration (e.g. § 118 III Local Government Law of Baden-Wuerttemberg, § 11 Local Government Law of North Rhine-Westphalia, Art. 108Local Government Law of Bavaria). The structural inability of municipalities toadopt a highly professional organization providing highly professional servicescalls for support by an institution that is able to provide exactly that.In order to achieve the goal of legal and efficient dealings on the municipal level,municipal supervision is granted a wide array of potential means to assist andcontrol the municipalities.Among these different means, the informational means are of high relevance. Inmost cases they are of a preventive nature. Preventive in this context means, thatthe supervising authority becomes involved before the legally binding act of anautonomous body12. Typical is the instrument of ”prevent consulting” by the su-pervising authority. Preventive Consulting is supposed to guarantee (or at least toallow) lawful administration from the very beginning and prevent later possiblymore invasive action of the authority.13 Consulting also allows for considerablediscretion rather than the invasive, publicised measures. Consulting is thereforegenerally in the interest of both involved actors. The supervising authorities have
11 German Constitutional Court Decision, BVerfGE 6, 104 (118).12 Compare Christoph Gropl/Arnold W. Sonntag, Zeitschrift fur Landes- und Kommunalrecht
Hessen - Rheinland-Pfalz - Saarland (LKRZ) 2009, 326(326).13 Winfried Kluth, in Hans J. Wolff/Otto Bachof/Rolf Stober, Verwaltungsrecht Band 3, 5th Ed., § 94,
n. 137.
Municipal Information – Amounts of Data but no Structure? 233
the advantage that they are able to concentrate and to coordinate special knowl-edge that could not be provided by the individual municipalities.14 Legally, thenecessity of this method is construed as follows: By providing information to themunicipalities, the right of self-administration according to Art. 28 sect. 2 GermanBasic Law (Grundgesetz) is preserved because the municipalities are not forced toaccept the opinion of the supervisory authority, but rather have their discretion indecision-making preserved.Complementary to the consultative rights of the single corporation, the supervisingauthorities have information rights: Only they allow for the supervisor to know therelevant facts and to decide whether consultation (or more) is necessary. Therefore,the supervisory authority is entitled to get information concerning specific mattersof the municipality. Examples of the exercise of these rights are: written questions,access to files or other enquiries addressed towards the municipalities. The authoritycan also conduct on-site inspections of the municipal administration or convene themunicipal council or the mayor.15
In summary: The relationship between the supervisory authority and municipalityis characterized by consultancy and inspection.The emphasis of this contribution shall be on possibilities of the supervisory au-thorities to provide information – that would not be available otherwise – to theirsubordinate, supervised municipalities. Some of the technical possibilities will bedemonstrated first before the technical and particularly the legal limitations will beexamined.
3 Collection and distribution of information - devices and process
The 16 different local government laws of the Lander (Gemeindeordnungen) consti-tute, that the supervisory authorities provide advice to the municipalities concerningtheir tasks to support their constitutionally guaranteed self-administration. Thisrule affects not only the functional supervision but also the legal supervision. Theadvice can concern legal, personnel, economic or technical matters. In many casesthe authority provides specific information to help the municipalities in their de-cision making process. An example for this can be the management of privatepublic partnerships. Therefore, the supervisory authority is challenged to gain andto distribute information effectively. Appropriate information in good time canprevent many inconveniences and invasive procedures to correct serious mistakesby the municipal administration.Within the field of the innumerous municipal competence areas, a number of casesarise that require special expert knowledge. For example, when the municipalitytakes on new tasks or if it plans to introduce new operating procedures like the in-tegration of specific permission proceedings to one central procedure. Attending to14 Kluth, see above note 13, § 94, n. 137.15 Kluth, see above note 13, § 94, n. 142.
234 Simone Traub and Indra Spiecker gen. Dohmann
such innovations, a municipality can conclude private consulting contracts. But thelaw provides for the opportunity to gain knowledge within the state system: It canaddress the supervisory authority and ask for their experiences, their knowledge,their qualification.
In case the supervisory authority processes information and provides consultancy,it has to find instruments to do this effectively. These instruments differ accordingto the type of knowledge processed.16 As far as so-called ”tacit knowledge”17 isconcerned, a continuous dialogue between the supervisory and the supervisedauthority is irreplaceable. Tacit knowledge is knowledge that is difficult to makeexplicit by means of writing it down or verbalizing it and to transfer it to anotherperson.18 Things are different if they concern explicit knowledge. This is the typeof knowledge that has been or can be articulated, codified, and stored in certainmedia.19 As far as this kind of knowledge is concerned – in other words the actualfacts –, the straight implementation of offered technical solutions to simplify theprocedure is conceivable. To some degree, the municipal authority can act like thetop level management of a private company and introduce new procedures in astrictly hierarchical manner. But in other respects it is to a certain extent restrictedbecause it is bound to the rules of public law, for example by the principle ofproportionality, which runs like a golden thread through the public law.This contribution especially seeks to analyze local databases as a means of providinginformation by the supervisory authority.
3.1 Technical aspects
For the sake of illustration, it shall be assumed that a supervisory authority es-tablishes a database containing information on all the private public partnershipprojects of its supervised municipalities. Access to that database is available only tothe municipal administrations supervised by that specific authority. The databasecovers details about the legal design, the financial scale, the public task of thatproject etc. The technical frame of this device can be described as follows:Access to information is marked by online access – for the sake of currentness –,thus independent of distance, time and hierarchy for all the concerned participants.The outreach of a single actor is significantly enlarged. The municipality can re-trieve information about and interact with partners within and beyond the bordersof its territory by using electronic information and transaction possibilities. This
16 Compare Indra Spiecker gen. Dohmann, Informationsgewinnung im dezentralen Mehrebenensys-tem, in: Jan-Bern Oebbecke (Ed.), Nicht-Normative Steuerung in dezentralen Systemen, Stuttgart2005, p. 253, (259f).
17 Jennifer E. Rowley/Richard Hartley, Organizing Knowledge: An Introduction to managing accessto information, 4th. ed., Hampshire (GB), Burlington (USA) 2008, p. 7.
18 Compare Rowley/Hartley, see above note 17, p. 7.19 Compare only Rowley/Hartley, see above note 17, p. 7; fundamentally to the differentiation
between tacit and explicit knowledge: Ikujiro Nonaka/Hirotaka Takeuchi, The knowledge creatingcompany – how Japanese companies create the dynamics of innovation, New York et al. 1995.
Municipal Information – Amounts of Data but no Structure? 235
potential of interactivity was essentially facilitated by the introduction and commonacceptance of the Internet protocol IP (Internet Protocol) standard. Electronic com-munication between persons, data, processes and objects is managed by shapingcontents into IP-standardized data packages and exchanging them between sendersand receivers. Therefore, a major part of vendor-dependant incompatibilities of var-ious technical devices designed to manage information is eliminated. The describedconditions are the ground which makes IT-data bases possible.There exist one not to be underestimated consequence for the digitalization of inter-action between municipalities and their supervising authorities: Crucial elementsof information management in a supervisory process now can be implementedinto complete solutions provided by the supervisory authority including all thenecessary data, linkages, interfaces, processes and objects20. A system can work bysearching the internet sites of the municipalities every day. The single municipalitycan chose the deepness of the search and can define the prioritization system of thesearch results. The responsible civil servant is enabled to have a direct access to therequested site and does not depend on the complicate system of postal requests forinformation or research projects. In addition data bases of private parties that arealready existing and made public could be used.
3.2 Normative aspects
After having described the potential technical background of such an informationsystem, this contribution now turns to the legal questions that are linked to such adevice.
a Requirement to establish data base information system?
The first question arising is that whether there exists a legal obligation for theintroduction of such databases.
aa Efficiency and effectiveness requirements
It could be obligatory for the reason of economy. The principle of cost-effectivenessand thrift according to § 7 Federal Budget Code (Bundeshaushaltsordnung) is ageneral principle for all public entities and thus also applies to municipalities andtheir supervisory agencies. This rule is a consequence of the principle of proportion-ality as state-spent money originates from taxpayers who must not be unnecessarilycharged. The principle of cost-effectiveness and thrift contains two aspects: Firstthe aspect of applying small means aiming at a certain desired result (principle ofminimality) and secondly, the aspect of getting the best result possible by applyinga certain amount of means (principle of productiveness). What are the consequences
20 Heinrich Reinermann, Elektronisierung des staatlichen und kommunalen Leistungsverkehrs,in: Wolfgang Buchner/Alfred Bullesbach (Eds.), E-Government - Staatliches Handeln in derInformationsgesellschaft, Koln 2003, p. 143 (145).
236 Simone Traub and Indra Spiecker gen. Dohmann
of these principles for the application of databases? The establishment of a databaseas described could take the place of an individual, time-consuming one-on-oneconsultation. Rather than having to consult with each municipality interested ina Public Private Partnership, the authority could first refer the interested partyto this database for primary information. The authority could then restrict itselfto particular information that is not generally available or tacit knowledge. Thisis particularly time-saving for the authority, as it can concentrate on the difficultquestions of consulting that need human, especially legal knowledge.If the necessary budget of a public procurement project such as a Public Private Part-nership reaches or exceeds specific values, it has to be licensed by the supervisoryauthority. Therefore there are mandatory consultations between the municipalityand its supervising authority in advance. Without an electronic database, the respon-sible civil servant of the supervisory authority would have to look for reference dataof other municipalities and their experiences with such projects in regard to costsand the different legal arrangements. In time-consuming elaborate correspondencethe responsible civil servant would have to explain the different legal models ofPublic Private Partnership and the associated advantages and disadvantages.
bb Expedience
In addition to the above mentioned cost-effectiveness, there is expedience, which asa principle also binds public activity. Expedience means, that administration has toomit all unnecessary means that are not appropriate to the affected interests.21 Theincrease of information that has to be elaborated within the municipalities demandsthe ability to access data from databases. It is not necessarily the supervisoryauthority who provides the data but the principle of expedience suggests this kindof solution because it is the supervisory authority that has the human resources andmaterial to manage such a project.
cc Summary
There are some legal reasons that suggest the obligation of electronic online databases but these arguments have to be balanced against counter-arguments like thecosts connected with such a device, for example the maintenance charges.
b Restrictions on establishment of data based information system
At a first glance, providing data by using databases seems to serve important legalinterests and appears to have significant advantages – which could not be draftedhere in full extent. However, there are some implicit restrictions for the legal validityand factual success of this procedure.
21 Ferdinand Kopp/Ulrich Ramsauer, Verwaltungsverfahrensgesetz, Kommentar, 10th Ed., Munchen2008, § 10, n. 16.
Municipal Information – Amounts of Data but no Structure? 237
aa Acceptance, legitimization and technical restrictions
On the factual side, an important issue is the necessity of confidence in new mediawhich needs to be built on both sides: on the part of the municipalities as well ason the part of the supervisory authorities.22 The supervisory authority must createthe interfaces to enable it to accept reports in digital format. The municipality on itspart has to trust provision of consultation and to regard it as equal to a personalcontact.While picturing the single municipalities to build up and work with the databases,another condition comes into play. It is the uniformity of technical systems andapplications. Within a company, this might be easily realized but looking at thenumber of municipalities things appear quite different. Without a preparing processthe supervisory authority will not be able to collect data by using just one systemfor every municipality because of the diversity of different existing systems andtheir incompatibility. The autonomy of the municipalities resulted and results intechnical infrastructures built up independently of each other. The only link – inother words the common denominator – are some rules provided by data protectionand privacy law.In order to gain the ability of using information effectively, a stronger intercommu-nication in this field is necessary. In addition, standards have to be developed andaccepted to reach an overall satisfying performance.23 Relevant questions in thiscontext are those of security, storage and especially access security.
bb Standard setting and Art. 28 sect. 2 German Basic Law
The legal problem with the requirement of identical or similar standards toucheson Art. 28 sect. 2 German Basic Law (Grundgesetz) and its guarantee of selfadministration. This right can be described as the general clause for municipalindependence and freedom of action concerning their area of competence. In thisfield, state authorities are not allowed to control and to regulate municipalitieswithout a normative grounding. Therefore municipalities cannot be obliged to useone certain IT-standard (e.g. set by the district government) if only their genuinetasks (Selbstverwaltungsaufgaben) are affected, because the supervision is restrictedto a legal supervision in this field. Binding standards concerning the concreteconduction are unlawful. Even if only tasks are concerned where the municipalitiesperform for the Lander or the Federal Government, the obligation of a certainstandard is problematic. In early decisions, courts ruling on the question of identicalprocedural standards required by the supervisory agencies, partly held, that inthe field of these transferred tasks the supervisory authority has an unlimitedright of instruction24. But today, most lawyers claim the limitation of the right22 Dirk Hoffmann, Kommunen im E-Government - Einblicke in die aktuelle Situation, in: Wolfgang
Buchner/Alfred Bullesbach (Eds.), E-Government - Staatliches Handeln in der Informationsge-sellschaft, Koln 2003, p. 157 (161).
23 Hoffmann, see above note 22, p. 161.24 See Bavarian Administrative Court, Bayerische Verwaltungsblatter (BayVBl.) 1977, 152 (153); Ernst
Forsthoff Lehrbuch des Verwaltungsrechts, Vol. 1, 10th Ed. Munchen 1973, p. 479.

238 Simone Traub and Indra Spiecker gen. Dohmann
of instruction to the subject-matter-field. In personnel and organizational aspects,the municipalities must retain their power to decide.25 But bearing in mind thatdatabases provide a certain level of administration quality, the determination of auniform IT-format concerns subject matter and expedience. It is therefore a questionof functional supervision in which the supervisory authority is competent to definea certain standard.
cc ”Cost-benefit-analysis”
Another legal restriction – due to § 7 Federal Budget Code (Bundeshaushaltsor-dnung) – arises in the conduct of a cost-value-weighting before building up adatabase. The relevant factors within such an analysis are not only monetary figures.Saving on money, personal cost and organizational structures is in general regardedas a valid benefit but also factors such as time, acceleration and transparency haveto be taken into account. On the other hand saving time does not necessarily meancost reduction, for example if a database is only used a very limited number oftimes each year. Another issue is the elimination of errors to guarantee lawfulnessof public acts. Here, a lot of questions still remain to be resolved.
4 Opposing Rights
After having examined the provision of information by IT-databases and argumentsagainst such a line of action, this paper will analyze relevant legal argumentspertaining to the single municipalities. Although the supervisory authority canbe described as a partner of the municipality, municipalities often hesitate to passon information about their concerns to the supervisory authority. What are thereasons for such a thinking? Legal arguments can be procedural rules which bindthe supervisory authority or subjective rights of the municipality. For this purposeit should be distinguished between the generation of information and the provisionof information to other municipalities.
4.1 Generation of information
One of the first questions of the supervisory authorities, that want to introduce adata base must be the method of generating information. Although the 16 Landerhave some differences in their local government laws, the relation between thesupervisory authorities and the single municipalities is construed quite similar.According to most of the local government laws (e.g. § 120 Local Government LawBaden-Wuerttemberg, § 129 Abs. 1 Local Self-Administration-Code of the Saarland,Art. 111 Bavarian Local Government Law), the supervisory authority is allowedto request information about any municipal matter if it is necessary to fulfill its
25 Eberhard Schmidt-Aßmann, in: id. (Ed.), Besonderes Verwaltungsrecht, 12th Ed., Berlin, NewYork 2003, section 1, n. 44.
Municipal Information – Amounts of Data but no Structure? 239
supervising tasks. Supervisory authorities are authorized to visit and inspect on-site,to demand oral and written reports and to access records and other documents.
Notwithstanding, it is necessary that the supervisory authority claims a specificcause for its information request. This does not extend to the necessity of a specialsuspicion concerning a specific unlawful act of the municipality. The request ofinformation is a normal act of supervision and therefore does not need a reason ofjustification on the same level like a state intervention in fundamental rights wouldrequire. Nevertheless, an all-encompassing inquiry would be unlawful because ofits disproportionality26.Therefore, the request for information is primarily a question of discretionary power.This means that there seems to be no limitation of the actual scope of informationrequests aside from restrictions of discretion.In general, a request for information will be covered by the supervisory competence.A limit must, however, be assumed, if the information request turns out to bevexatious.27 This is the case for instance, if – without any concrete indication ofan unlawful municipal act and without any specific legal refrence – information isdemanded, which cannot be provided without tedious efforts.28 This would violatethe right of self-administration of the municipalities according to Art. 28 sect. 2German Basic Law (Grundgesetz) and could be contested in administrative court.29
Furthermore, in case that personal data are concerned the generation of municipaldata is also restricted by § 4 ff. of the Federal Data Protection Act.As a result, one could argue, that for the information request mainly a limitationof chicanery exists. A request must not be obviously and far beyond the scopenecessary for an ordinary supervision.
4.2 The distribution of data
If the supervisory authority provides the collected information to other autonomousmunicipalities, the state no longer acts as a safe institution for information butrather as a distributor within its administrative competence.30 Therefore, the nextstep of the legal test would be to check for potential obstacles to the distribution ofdata.
26 Gropl/Sonntag, see above note 12, p. 327.27 Gropl/Sonntag, see above note 12, p.327.28 Martin Bauer/Thomas Bohle/Gerhard Ecker, Bayerische Kommunalgesetze - Kommentar, 4th.
Ed., Munchen updated: 09/2009, Art. 111 BayGO n. 2.29 Compare Franz-Ludwig Knemeyer, in Bayerische Verwaltungsblatter (BayVBl.) 1977, p. 129 (129).30 For the public sphere compare Indra Spiecker gen. Dohmann, Protection of Confidential Business
Data in the Age of Convergence, in: Stefan Seifert/Jan Kramer (Eds.), International Workshop onCommunication Regulation in the Age of Digital Convergence: Legal and Economic Perspectives,Karlsruhe 2009, p. 29 (35).
240 Simone Traub and Indra Spiecker gen. Dohmann
a Right of self administration according to Art. 28 sect. 2 German Basic Law
The right of self administration according to Art. 28 sect. 2 German Basic Law couldbe an obstacle to data generation and distribution by the supervisory authority.Municipalities are endowed with the right to regulate all local affairs on their ownresponsibility, within the limits prescribed by the laws.31 Claiming the right fromArt. 28 sect. 2 German Basic Law (Grundgesetz) to prevent the distribution ofdata would be possible, if hereby the autonomous fulfillment of its tasks wouldbe endangered. In general, this would not apply for administrative proceduresthat are already settled. In procedures that are still going on, the competence ofindependent decision makings could be excessively restricted.
b Secrecy/ Data Protection
Concerning the information that the supervisory authority gets from its supervisedmunicipalities it is bound to the same rules of secrecy and data protection as the mu-nicipalities.32 File contents that concern third parties, (e.g. prospective constructorsapplying for a building permit) could not be published within databases designed tosupport municipal planning procedures. Concerning personal data, the limitationsof the Federal Data Protection Act have to be observed. In addition, the secrecyin tax matters according to § 30 General Tax Code (Abgabenordnung) must becomplied with although it has to be considered that this rule is only applicable forconcrete personal data and not for details that are made anonymous for statisticalpurposes.Here, a constructive view on databases could consider procedures of pseudonymityor anonymity, as for other municipalities, the exact information might not benecessary.
c Art. 12, 14 German Basic Law for Municipal Enterprises
Substantially more extensive are obligations of secrecy, if data of municipal enter-prises are affected. Opposing rights can particularly emerge concerning commercialdata, if a municipality acts as a public company. It is a consequence of Art. 19 sect.3 German Basic Law, that the company can claim the right of protected ownershipfrom Art. 14 German Basic Law if the influence of the municipality is not dominat-ing. In these cases commercial and business secrets, which are protected under Art.14 German Basic Law constitute the limitation for the distribution of municipal datain databases that are accessible for other municipalities.
31 According to the prevailing opinion, the right of self administration is neither a fundamental rightnor similar to a fundamental right. Nevertheless, it is a subjective right with a scope of protectiondirectly derived from the constitution, compare Michael Nierhaus, in Michael Sachs, Grundgesetz,3rd Ed. Munchen 2003, Art. 28 n. 34.
32 Richard Kunze/Otto Bronner/Alfred Katz, Gemeindeordnung fur Baden-Wurttemberg - Kom-mentar, 4. Ed. Stuttgart, updated: 07/2008; § 120 n. 12.
Municipal Information – Amounts of Data but no Structure? 241
5 Conclusive Remarks
To keep the municipalities empowered to fulfill their original and delegated tasks,a well-organized supervision is necessary. This supervision does not only havethe competence of legal and functional control, but additionally has to provideconsultation to its supervised municipalities. Information plays a central role infulfilling these various tasks in a communicative structure between municipalitiesand supervising authority. The law has so far neglected implications for thegeneration and the transfer of information gathered in the course of this relationship.One of the ways of making use of technical possibilities and enhancing the quality ofcontrol, consultation and supervision is the establishment of a database accessible bymunicipalities. Its advantages are obvious: More efficiency, less double information,quicker access – and the use of well-established instruments from electronic markets.These advantages might even call for databases as a legal obligation. But there aresome downsides to be considered, as well. The implementation of such data basesfor the purpose of information generation and distribution faces actual and legaldifficulties. Particularly monetary reasons but also duties of secrecy binding thesupervisory authority can act as limitations to such a provision of information.
References
Bauer, M., T. Bohle, and G. Ecker (updated: 09/2009): Bayerische Kommunalgesetze -Kommentar, 4th edition, Munchen.
Forsthoff, E. (1973): Lehrbuch des Verwaltungsrechts, vol. 1, 10th edition, Munchen.Gropl, C. and A. W. Sonntag (2009): “Informationsbefugnis der Kommunalaufsicht
und ihre Durchsetzung,” in: Zeitschrift fur Landes- und Kommunalrecht Hessen -Rheinland-Pfalz - Saarland (LKRZ), p. 326 ff.
Hoffmann, D. (2003): “Kommunen im E-Government - Einblicke in die aktuelleSituation,” in: W. Buchner and A. Bullesbach (eds.), E-Government - StaatlichesHandeln in der Informationsgesellschaft, Koln, p. 157 ff.
Knemeyer, F.-L. (1977): “Verwaltungsgerichtliche Uberprufung von Maßnahmender Kommunalaufsicht,” in: Bayerische Verwaltungsblatter (BayVBl.), p. 129 ff.
Kopp, F. and U. Ramsauer (2008): Verwaltungsverfahrensgesetz, Kommentar, 10thedition, Munchen.
Kunze, R., O. Bronner, and A. Katz (updated: 07/2008): Gemeindeordnung furBaden-Wurttemberg - Kommentar, 4th edition, Stuttgart.
Nonaka, I. and H. Takeuchi (1995): The knowledge creating company - how Japanesecompanies create the dynamics of innovation, New York.
Rajkovic, V. and B. Zupan (2004): “Knowledge Management as a Challenge forPublic Administration Reengineering,” Informatics and Management, p. 129.
Reinermann, H. (2003): “Elektronisierung des staatlichen und kommunalen Leis-tungsverkehrs,” in: W. Buchner and A. Bullesbach (eds.), E-Government - StaatlichesHandeln in der Informationsgesellschaft, Koln, p. 143 ff.
242 Simone Traub and Indra Spiecker gen. Dohmann
Rowley, J. E. and R. Hartley (2008): Organizing Knowledge: An Introduction to managingaccess to information, 4th edition, Hampshire (GB), Burlington (USA).
Sachs, M. (2003): Grundgesetz, 3rd edition, Munchen.Schaefer, S. (2009): Controlling und Informationsmanagement in Strategischen Un-
ternehmensnetzwerken: Multiperspektivische Modellierung und interorganisationaleVernetzungvon Informationsprozessen, Wiesbaden.
Schmidt-Aßmann, E. (2003): Besonderes Verwaltungsrecht, 12th edition, Berlin, NewYork.
Spiecker gen. Dohmann, I. (2005): “Informationsgewinnung im dezentralenMehrebenensystem,” in: J.-B. Oebbecke (ed.), Nicht-Normative Steuerung in dezen-tralen Systemen, Stuttgart, p. 253 ff.
Spiecker gen. Dohmann, I. (2009): “Protection of Confidential Business Data in theAge of Convergence,” in: S. Seifert and J. Kramer (eds.), International Workshopon Communication Regulation in the Age of Digital Convergence: Legal and EconomicPerspectives, Karlsruhe, p. 29 ff.
Wolff, H. J., O. Bachof, and R. Stober (2004): Verwaltungsrecht Band 3, 5th edition,Munchen.
Zacharias, D. (2004): Nordrhein-Westfalisches Kommunalrecht,Thungersheim/Frankfurt a. M.
How Design Principles can Govern the KnowledgeCommons: Elinor Ostrom and the Case of Wikipedia
Kathrin Noack1, Christof Weinhardt2, and Thomas Dreier1
1 Institute of Information and Economic Law, KITkathrin.noack, [email protected]
2 Institute of Information Systems and Management, [email protected]
Summary. Through the internet, information and knowledge in general have become easilyaccessible for many people. The free encyclopaedia Wikipedia is a prime example forthe assembling and sharing of knowledge. In her research on collective action regimesgoverning common limited resources, Elinor Ostrom found out that groups or communitiessuccessfully organising their use of a common resource over long time periods tend todisplay similar characteristics irrespective to the nature of the resource. She summarizesthese characteristics into eight design principles for successful regimes governing physicalcommon pool resources. In her later work she discusses the possible application of hermodel for governing the knowledge commons, which, as an immaterial good, will not bedepleted when used. This article follows up on this idea and compares Ostrom’s designprinciples to the case of Wikipedia and in particular the counter-vandalism policy to actagainst deliberate attempts to place false information into the online encyclopaedia. Thethesis will be that Ostrom’s design principle can be used as a valid framework to analyse thecase of Wikipedia as outlined here and that these principles can provide useful parametersfor other online communities dealing with the knowledge commons.
1 Introduction
Information and knowledge have become far more accessible in the digital age.Knowledge is considered a public good and, thanks to the internet, it is easilyavailable for many. In this way, knowledge can be considered as a commons. There-fore it is reasonable to assume that characteristics of self-organised communitiesusing the traditional commons might also be applicable to, or at least interestingfor understanding, virtual groups organizing knowledge on the internet. One ofthe most prominent examples in this respect is the online encyclopaedia Wikipedia,where many individuals work and operate together to create, deliver and archiveinformation and build one of the most considerable and accessible knowledgeresources in the world.
Elinor Ostrom’s focus of research lies on the organization of the usage of thecommons in communities. The nature of the commons analyzed by her was
244 Kathrin Noack, Christof Weinhardt, and Thomas Dreier
originally grounded to limited natural resources. In her research based on variouscase studies, she forms a theoretical approach on collective actions and social rulesin communities using common goods. (Ostrom, 1990, 2000) She found certaindesign principles for common action that indicate that some aspects of organisationare more effective than others for the long-term perspective on the efficient andsustainable use of the commons.1
Together with Charlotte Hess, Ostrom later widens the scope of the commonsalso to the realm of knowledge. She claims that there is a possibility to adapt thedesign principles developed for natural resource commons to the collective actionof creating, organizing and archiving knowledge. Knowledge is a public good, as itis cumulative and potentially everyone can access it. As such it can be analysed onthe aspects of traditional forms of commons. (Hess and Ostrom, 2007, pp.3-14)
The design principles of collective action shall in the following be compared to theexample of Wikipedia. Specifically they are to be analysed using the example of theEnglish Wikipedia policy on how to deal with ’vandalism’, the deliberate attemptto disrupt the integrity of Wikipedia, for example by placing false informationwith malicious intention into articles. This specific set of procedures was chosenbecause it demonstrates the way the community protects the resource knowledge,as any information displayed in the articles of the online encyclopaedia should beas accurate as possible. Without safeguards to protect the knowledge, the existenceof the encyclopaedia would be at risk, because too many disruptions in the articleswould make any information within Wikipedia too unreliable to use.
This article will attempt to follow Ostrom’s call for further research into how thedesign principles can be analysed in the knowledge commons. The thesis followedhere is that Wikipedia’s anti-vandalism policy shows characteristics comparable tothe design principles Ostrom found for long term resource regimes in the traditionalcommons. It will be shown that there are other general characteristics displayed inWikipedia’s organisational structure which can be interpreted by using the designprinciples as well.
Wikipedia can be interpreted as a system of collective action to govern theknowledge commons. As such rules and decision making processes needed to evolveto back the community of users upholding the online encyclopaedia. Specifically,the intent of this article is to verify if Elinor Ostrom’s findings are applicable to thecase of Wikipedia and therefore valid as parameters to research and explain the wayWikipedia’s community governs itself and the knowledge commons. Following upon these thoughts, one could argue that according to Ostrom’s theory the featuresof Wikipedia which are reflected by the design principles support the longevity ofthe community.
Concerning the studying of Wikipedia and collective action in the internet, thereis much research in progress. Stegbauer’s detailed study of the German Wikipediausing empirical methods and network analysis models holds very useful insights1 Special thanks to Ernst Nordtveit, University of Bergen, for providing valuable insight into Elinor
Ostrom’s theories and helpful advice.
How Design Principles can Govern the Knowledge Commons 245
in regards to the structures and rules of Wikipedia (Stegbauer, 2009). Koniecnywrote an article about whether there are oligarchic tendencies to be found inthe community of the online encyclopaedia (Konieczny, 2009). The ’InternationalSymposium on Wikis and Collaboration Systems’ is an annual conference takingplace since 2005.2 Here, the internal development of Wikipedia is also often atopic of discussion. The conference is open to participants from various scientificdisciplines.3 The possibilities of Wikipedia’s success for new economic modelshas been discussed in Tapscott’s and Williams’ book ’Wikinomics’ (Tapscott andWilliams, 2007). These are just some of the more recent examples on research in thefield.
First, in the theoretical part of this article, Ostrom’s thoughts on collective actionand the evolution of rules and norms for common-pool regimes will be discussed.This will be accompanied with a short discourse on rivalrous and nonrivalrousresources, as Ostrom’s original model was derived from regimes on limited formsof commons and will be used on the unlimited resource knowledge. Then Ostrom’sdesign principles on long term self-organised regimes will be explained in detail.As a practical application of the theory the case of the Wikipedia user structureand the basic forms of arbitration will be described in the following. Further onthey will be put into context with the English Wikipedia’s anti-vandalism policy.Finally, the design principles will be analysed for the case of the Wikipedia policyand Wikipedia’s user structure, as far as it is outlined here. It will be discussed inhow far they are suitable for researching the case of the online encyclopaedia.
2 Elinor Ostrom’s Findings on Collective Action
2.1 Collective Action and the Evolution of Social Norms
Elinor Ostrom’s contribution to the research of collective action and the efficientand non-detrimental usage of the commons among her other work has earned herthe Nobel Prize in 2009. In 2000, she wrote a paper on the collective action andthe evolution of social norms in which she outlines the theoretical, experimentaland empirical background of the research of collective action explained on thebackground of evolutionary theories on social norms. These ideas she expands tothe resource of knowledge in her and Charlotte Hess’ book on the ”Understandingof Knowledge as a Commons” (Hess and Ostrom, 2007).
Ostrom asks why voluntary organisations and adherence to social rules andnorms work in general, even if traditional economic theory tends to understand thatrational individuals tend not to act for common interests if it negates their personalgains (Ostrom, 2000, p.137). Her research is based on an experimental approachfounded on game theory as well as on field studies on smaller communities usingcommon natural resources. On this background, Ostrom derives several design
2 See (WikiSym, 2010; WikiSym ’09, 2010).3 Compare (Suh et al., 2009).
246 Kathrin Noack, Christof Weinhardt, and Thomas Dreier
principles on self-organized resource regimes which have the potential to survivefor long time periods (Ostrom, 2000). According to her, these principles holdcertain possibilities to be compared to regimes trying to coordinate the resource ofknowledge (Hess and Ostrom, 2007, p.7).
Within the game theoretical approach, Ostrom found in controlled experimentalconditions that the players tended to behave more cooperatively if they developedtheir own strategy rather than when a cooperative strategy was imposed upon themfrom outside and then taken away. When the players were able to communicatedirectly, cooperative strategies occurred more often than in anonymous games. Someplayers would choose to reward cooperative strategies and sanction uncooperativebehaviour in others. These results were then compared to real world examples onthe evolution of rules and norms in communities collectively managing limitednatural resources. (Ostrom, 2000, p.145ff)
In the field research, there are many contextual variables to be considered fromcase to case, ranging from the type of resource disputed to the leadership modelused to the heterogeneity of the group. Other variable elements could be the scarcityof the good, the level of cooperation, the possible financial benefits, the historyof the group or the cultural background, among others. Many of these aspectsvaried in the groups researched. However, Ostrom found certain consistencieswhen comparing differing kinds of various field studies on communities organisingcommon-pool resources. In those systems it was found that communities whodevelop and enforce norms and rules within their group have a higher probabilityto use the resource in a sustainable and efficient way for long time periods thancommunities where the rules were imposed externally. (Ostrom, 2000, p.148)
As common-pool resources Ostrom understands natural or artificial systemswhere benefits are created up to the limit set by the amount of the resource. Thismeans a participant’s consumption reduces the resource and it is often hard to keepbeneficiaries away from the resource (Ostrom, 2000, p.148). Therefore she uses theterm ’commons’ for the resource knowledge later in her work, as it more generallyfits the unlimited character of this good (Hess and Ostrom, 2007, p.5).
2.2 Design Principles for Long-term Resource Regimes
Ostrom understands the emergence of rules and norms for self-organised collectiveactions on a basis of evolutionary theories, where reciprocity plays an importantrole in forming the behaviour of at least some individuals (Ostrom, 2000, p.149).Collective action, according to Ostrom, is when two or more individuals cooperateto achieve a certain outcome (Hess and Ostrom, 2007, p.5). Members of a groupare likely to restrict their own use of the given resource as long as other membersin the group are willing to do so as well. This behaviour has a high probability toresult in a process of cooperation. When the group has relatively clear conditionson membership and the group boundaries are definable, the trust among themembers and the incentives for cooperation will most likely rise. As a consequence,
How Design Principles can Govern the Knowledge Commons 247
some individuals within the group might take greater responsibility and initiateimprovements for the effective use of the resource (Ostrom, 2000, p.149).
Basing on these underlying thoughts Ostrom proposes eight design principles forlong-term resource regimes organised through the collective action of their members(Ostrom, 1990). The first design principle is the presence of group boundaries thatare accepted by the members and effective externally. ”If a group of users candetermine its own membership - including those who agree to use the recourseaccording to their agreed-upon rules and excluding those who do not agree tothese rules - the group has made an important first step toward the developmentof greater trust and reciprocity.” (Ostrom, 2000, p.149) This means that withinthe community, boundaries can serve to maintain trust and reciprocity which areessential for the members to work efficiently together to govern the commons theycollectively use. Externally, the boundaries will work as a defining factor on whobelongs to the community and who does not.
The second principle is about the rules that actually restrict, organise or managethe resource that is to be used by the collective action. This principle is based on thefairness of the sharing system. (Ostrom, 2000, pp.149f) In the case of the knowledgecommons, it could be adapted to the rules that actually manage the gathering,creating, archiving or maintaining the information resources as well as organisingthe work and input of the members of the group to do so in an efficient way.
The third design principle refers to the ability of the individuals partaking inthe collective action to jointly create and modify the rules and norms they wish allthe members to adhere to. In various field studies concerning the natural common-pool resources, it was found that the members were more willing to follow rulesdeveloped within their group than to adhere to rules at least partially set fromoutside forces such as elites or government institutions independent from the groupusing the resource. Rules derived from within the group are also often perceived asmore fair. (Ostrom, 2000, p.150)
Norms can only be complied with for long time periods if there are certainenforcement mechanisms in place and the members are aware of the consequencesfor not following them. Consequently, the fourth design principle describes thatthe groups select monitors, either accountable to the members or participantsthemselves, to check on the resource conditions and the usage behaviour of theindividual members. The fifths design principle is related to this and says thatthere should be an enforcement mechanism with graduated sanctions based on howserious the community perceives an offence to be. The community legitimates themonitors who can point out a case of possible sanctioning and enforce it. The initialsanctions are often a form of warning and not necessarily on the same level as theoccurred loss. (Ostrom, 2000, p.151) In a sense they work as an educational systemfor the rules within the community.
The sixth design principle demonstrates the need to have efficient, easily to enter,low cost arenas where disputes among the members and with external actors can besettled. These arbitration forums must be transparent to the community and equally
248 Kathrin Noack, Christof Weinhardt, and Thomas Dreier
accessible. Within them, the rules and norms themselves can also be discussed andadjusted if necessary. This leads to the seventh design principle on the decisionmaking procedures on rule making mechanisms. Many common-pool resourcesin the physical world in local arenas rely on unanimous decision, according toOstrom. However, the consequences of this are high transactions costs on thedecision making processes, paid for either in the members’ time and effort. Thiscan lead to a situation where norms are not adjusted and improved in time. Theseprocesses do not have to be backed by official institutions such as governmentalbodies. As long as the members of a community accept them, they are functioning.For large common-pool regimes, Ostrom also recognizes an eighth design principlethat allows different groups dealing with differing functionalities to be nested withinthe greater structure of the collective action in question. (Ostrom, 2000, pp.153f)
These basic design principles can be found in variations in most common-poolresource regimes in the physical world. It can be argued that they are inherentin all forms of democratic organisations. Yet, democracy is not an easy termto define. In political terms it includes broad concepts such as equality, libertyand human rights. The communities researched by Ostrom were often organisedon local levels and therefore limited in the number of members. She sees theseprinciples as possible guidelines on how collective actions concerning the commonscan be efficient for long time periods. The combining factor is that the members ofthese communities organised themselves and their actions this way, irrespective ofthe systems surrounding them, for example the governing structures or the legalframeworks of states.
Ostrom also points out certain threats to the long term viability of such regimes.These threats maybe indigenous or exogenous and can affect the trust and reciprocitywithin the groups. A major threat is the migration into or out of the community,which can change the balance by either influencing the effectiveness of a communitywhen it loses members or when too many new participants join who do notknow or wish to adhere to the norms already established and cannot create anequivalent system balancing the members’ interests. Other threats occur whenofficial institutions impose rules where they had not before concerning the generaldealing with the resource. (Ostrom, 2000, pp.153f)
The term ’rule’ needs more explanation in regards to Ostrom’s design principleson self-organised resource regimes. Defining the meaning of ’rule’ is a matter ofmany discussions, so the article will follow her ideas on what a rule may be fromone of her earlier works. (Ostrom, 1986) There, she defines rules as prescriptionwhich are created and adhered to by a group of participants in order to serve asa framework for their relationships. Within this framework certain actions mustbe taken, are allowed or can be prohibited. These prescriptions are the implicitor explicitly set rules by individuals who need to organise their actions withintheir group and create a predictable environment. They do so by: ”(1) creatingpositions (e.g., member, convener, agent, etc.); (2) stating how participants enter orleave positions; (3) stating which actions participants in these positions are required,
How Design Principles can Govern the Knowledge Commons 249
permitted, or forbidden to take; and (4) stating which outcome participants arerequired, permitted, or forbidden to affect.” (Ostrom, 1986, p.5) Therefore the rulescan be adapted, discarded or changed by the majority of individuals within thegroup or by external entities.
Rules emerging in groups can also be explained through the emergence of socialstructures. According to a social science definition by Stegbauer, social structuresemerge within the complex interaction of differing actors with each other (Stegbauerand Rausch, 2006, p.19). Have these interactions been well established through thecourse of history, they are largely defining what we understand as social structures.They are made up of interconnections and within them norms are formed andgradually accepted as the usual behaviour within a group. Norms correspond tothe expected behaviour and conduct of individuals within the group and will bemirrored in the rules which the members are supposed to follow. Within virtualgroups existing in the internet, often certain positions or roles are formed whichconstitute the social structure. As in real life, their functionality could possibly leadto hierarchies, as often some participants within a group are more experienced thanothers exercising certain functions. (Stegbauer and Rausch, 2006, pp.59-61)
Stegbauer’s theoretical explanation to the norm building aspect within groups inthe virtual as well as the natural world is similar to Ostrom’s understanding howrules evolve. According to this line of thought, rules and norms emerge withingroups parallel to their establishment. For a group to survive, it needs certainaspects which make it distinguishable to other groups, which means there must beat least certain understandings in place who belongs to the group and who doesnot, which essentially establish the boundaries of the group. Ostrom sees this asthe starting point for self-organised collective action which has the potential to becontinued for a long time within the community committed to it.
2.3 Rivalrous and Nonrivalrous Commons
As mentioned above, Ostrom’s design principles relate to the collective action of thephysical forms of commons, which are limited in nature. Yet she also writes aboutthe possibility to adapt them to the knowledge commons. These have changeddrastically through the emergence of the internet. Knowledge becomes far moreaccessible and can also be spread at far lower cost as it was possible before thenew technologies allowed information to be distributed globally (Hess and Ostrom,2007, p.9). Lawrence Lessig also discusses the new way to access and distributeimmaterial forms of commons digitally (Lessig, 2002).
Lessig focuses on the idea of the internet as a commons, independent from whichform of digital content and as a scarcely limited resource. He defines the possiblecircumstances on usage on the internet as a commons in terms of an ”opportunityfor individuals to draw upon resources without connections, permission, or accessgranted by others. They are environments that commit themselves to being open.”(Lessig, 2002, p.85)

250 Kathrin Noack, Christof Weinhardt, and Thomas Dreier
At this point Lessig points out two important differences between rivalrousand nonrivalrous resources. The term nonrivalrous was already used by ThomasJefferson in respect to the resource of ideas, which are in themselves not depletedby another’s use, as Lessig elaborates. Is the resource rivalrous it calls for acontrol mechanism that prevents the overuse of the good while ensuring that is itproduced at the same time. If the resource is nonrivalrous, then only the creation ofthe resource has to be guaranteed and maintained, as nonrivalrous resources areunlimited to use. Lessig refers this to Ostrom’s understanding of a provisioningproblem. (Lessig, 2002, pp.94f) His interpretation of a nonrivalrous resource mightfit the broader concept of the intellectual good knowledge well. This shall be usedhere as a definition of the knowledge commons.
In the case of Wikipedia, the resource knowledge is the one distributed andmanaged. The main concern of Wikipedia is not the space needed to hold thatmuch data, as this is technically possible at relatively low cost, but rather theorganisation needed to archive and sort out what knowledge is to be maintainedand delivered. The organisation and the people involved in it are the scarce resourcewhich Wikipedia needs for its survival. While the knowledge is freely available ingeneral, the effort needed to archive and maintain the knowledge is not and comesat the cost of time and work of the members.
This factor changes also the main dilemma Ostrom discusses. In the case ofphysical resources the use of the resource will deplete it. That means it is inthe interest of each participant that the other participants involved restrain theiruse. At the same time, like in the gaming situation mentioned, their immediateoutcome is often the highest when not cooperating in the beginning. In the caseof Wikipedia the most probable dilemma is free riding, as it is much easier tojust access the knowledge displayed than actively contributing. Most people willaccess the information on the online encyclopaedia and not add to it. However,when people lose interest in spending time and effort to write articles, correctmistakes and keep the information up to date, then the point of Wikipedia as areliable knowledge base becomes more and more obsolete. It is not necessary for themajority of readers of Wikipedia pages to become involved, but a certain amountof people will be necessary to uphold the system. There are no numbers whichpoint out how many members need to work on the information exactly, but a loss ofeditors is of great concern for the longevity of the project as a whole (Angwin andFowler, 2009). Therefore, free riding can become a problem if it leads to dwindlingnumbers of editors to the point where the information in Wikipedia cannot beupdated and archived properly.
Another variation of the commons of knowledge being undermined is the pos-sible sabotage and misuse of the common good for purposes other than the onesoriginally benefitting the community. Sabotage is not part of the tragedy of thecommons in Hardin’s sense (Hardin, 1968), but a disruption to the successful work-ings of a community using a common good, though this problem is certainly notspecific to those. In the case of Wikipedia, the knowledge displayed in the articles
How Design Principles can Govern the Knowledge Commons 251
is meant to be as accurate as possible and should be able to be referred to validsources. To use Wikipedia for other means to intentionally spread personal opinionsor propaganda; or to discredit and insult individuals, for example, is contrary tothe original aim of the community. This goal has remained unchanged as it woulddiminish the worth of the encyclopaedia. Therefore policies and internal rulesexist to weed out disruptions placed in bad faith to the validity of the informationdisplayed. The counter-vandalism policy, which will be discussed in detail below,is one such tool. As Ostrom’s design principles focus on the outline of governingcommon resources successfully, measures against sabotage are also a means toensure the longevity of the collective action. Consequently it will be discussed inthe following how Ostrom’s ideas can be applied as an analytical framework to thepractical example of Wikipedia.
3 The Example of Wikipedia
3.1 Access Levels of Users in the English Wikipedia
Several characteristics of Wikipedia have to be described to outline how the com-munity upholding the online encyclopaedia works against the posting of content itdoes not find suitable to its goals. First of all, the official positions of participantswithin Wikipedia will be lined out by describing the access levels they hold withinthe online encyclopaedia. Then a general definition of what is understood by ’van-dalism’ in Wikipedia will be given followed by the measures and processes to reactupon it. This article looks at the policy and access levels for users of the EnglishWikipedia version.
The English Wikipedia was launched in January 2001 by Jimmy Wales and LarrySanger. With the help of thousands of participants willing to post articles andcorrect the content it became the most widespread, accessible and miscellaneoussource of knowledge in the world with 14 million articles (3.1 million in English) invarious languages. (Wikipedia: About, 2010)
The visitors and participants of Wikipedia, who read, create, add on and correctcontent are distinguished through the access levels they receive which vary in thedegree of the change they are allow to exert on the Wikipedia pages. Accordingto their access levels they take certain official responsibilities within Wikipedia.The main difference between the positions lies between normal users and themore influential roles of so-called ’administrators’, ’bureaucrats’ and ’stewards’.(Wikipedia: User access levels, 2010)
There are four types of regular users. Anonymous users do not hold an account,can read all regular Wikipedia pages and edit pages which are not protected inany way. While they can create ’talk’-pages where they can discuss and writecomments, they cannot upload files or images. They must make themselves knownas human beings and not computers by answering a Captcha, a picture test usingdeformed numbers and letters which cannot be recognized automatically. New
252 Kathrin Noack, Christof Weinhardt, and Thomas Dreier
users have their own account and can start new pages and fill them with content,yet cannot upload files either. Autoconfirmed users are generally recognized by theWikipedia software as users who have upheld their account for four days and made10 edits. They can then also edit semi-protected pages, move pages and uploadfiles or pictures. They are no longer required to pass the Captcha test in most cases.Confirmed users have the same rights as autoconfirmed users, but are granted theirstatus manually by administrators. (Wikipedia: User access levels, 2010)
To become an administrator in the English Wikipedia, the community mustconfirm this right to the user requesting it. There must be a discussion taking placeamong fellow editors about the contributions of the applying individual. Sevendays into the discussion a ’bureaucrat’ will decide upon the consensus reached forgranting administrator rights to do so. Generally, 70% to 80% of the comments in thediscussion should be in favour of the promotion of the applicant, which means thereis not a clear vote or numerical measurement involved. (Wikipedia: Administrators,2010) Only then does the new administrator gain control over certain tools andspecial functions in Wikipedia. For example, they can delete, protect, block orrelease pages. An administrator can remove or grant rights to users and can accessand modify protected pages and the Wikipedia interface. They are also called’sysops’, standing for system operators. (Wikipedia: User access levels, 2010)
’Bureaucrat’ rights are granted by the community and are allowed certain actionson other users’ accounts, for example handing out administrator rights. ’Stewards’are the highest rank within the Wikipedia network itself. They are elected globallyand can evoke and renounce the rights of individuals in the groups below them.They can hand out the special rights to exercise the control mechanisms of ’Oversight’and ’CheckUser’ to other users and implement them themselves. (Wikipedia: Useraccess levels, 2010) These functions are mentioned here as they have the highestenforcement level. ’Oversight’ means that the user exerting this right can hiderevisions of all other users from pages permanently. This tool is among the highestcontrol instruments. (Wikipedia: Oversight, 2010) ’CheckUser’ enables the holderto view the IP addresses of user accounts in case of infringements. These rights areonly granted to those who have identified themselves to the Wikimedia Foundationand are at least 18 years of age. (Wikipedia: Checkuser, 2010)
If disputes arise among the members of the community, about the communicationbetween members and about the handling of the content, there is the possibilityto create ’talk’ pages concerning the single articles. These are the most basic levelforums. If disputes cannot be settled, they can be brought towards the MediationCommittee, whose solutions are not binding but rather suggestions. New membersto the Mediation Committee are selected by the Mediation Committee itself. Anopen discussion by members of the Mediation Committee and non-members alikewill take place beforehand. The Mediation Committee was established next to thehighest ranking Arbitration Committee by Jimmy Wales in 2004 to create bodiesthat can settle disputes. (Wikipedia: Mediation Committee, 2010)

How Design Principles can Govern the Knowledge Commons 253
The Arbitration Committee is elected and can enforce rules and decisions whendisputes cannot be settled otherwise. It will only get involved if the MediationCommittee could not resolve the issue. Its members are elected in an open votethroughout the community. After a certain time period of open discussion aboutthe nominees the vote will take place yearly. Apart from settling disputes andhanding out major sanctions the Arbitration Committee also can decide uponwhich members hold the ’Oversight’ and ’CheckUser’ abilities mentioned above.(Wikipedia: Arbitration, 2010; Wikipedia: Arbitration/Policy, 2010; Wikipedia: Ar-bitration Committee/Procedures, 2010) Election modes in Wikipedia vary accordingto the decision made. Often the simple majority of participants will be sufficient.However, only users with an account can vote. In most cases, the users eligible tovote must have a certain number of edits within a specified time frame, so that theycan be accepted as active editors. This was the case when a discussion took placeabout the Wikipedia content to be migrated to another licence and a vote was heldon the issue. Content in the free encyclopaedia was originally placed under theGNU Free Documentation Licence (GFDL). Now the Creative Commons Attribution-ShareAlike 3.0 Unported Licence was approved of additionally to the GFDL for thetext base, since the majority of the eligible users agreed to the migration by vote in2009. (Wikipedia: Licensing Update, 2010)
Wikipedia is supported through the Wikimedia Foundation, Inc., which gains itsfinancial needs through donations. Some language versions of Wikipedia, like theGerman one, have their own version of the Wikimedia setup.4 Wikimedia is lead bya board of trustees, currently nine persons who are financed by the donations as well.It also supports the other aligned Wiki projects, like, among others, Wikisource forfree source documents, Commons for free media files, Wiktionary for dictionariesor Wikiversity for free learning tools. (Wikimedia Foundation Inc., 2010)
These are only the basic access levels on the English Wikipedia. It alreadyshows that there are many differing roles and functions recognized users can holdwithin the system. Looking at what the holders of these positions can do withinthe Wikipedia community, one can certify a certain regime of rules, positions andenforcement procedures which controls the process of the creation of content inWikipedia. It allows members of the community special forms of access to the partof the knowledge commons within the encyclopaedia.
3.2 The Counter-Vandalism Policy of the English Wikipedia
Elinor Ostrom’s design principles will be compared here to a special process inWikipedia, when the community encounters disruption and has to deal with itto maintain itself. The example of ’vandalism’ in Wikipedia is chosen because itillustrates well how the community wishes to protect its way of creating the resourceknowledge in Wikipedia. ’Vandalism in Wikipedia ”is any addition, removal, or
4 Wikimedia Deutschland is legally organized as an incorporated association (Wikimedia Deutsch-land e.V., 2010).
254 Kathrin Noack, Christof Weinhardt, and Thomas Dreier
change of content made in a deliberate attempt to compromise the integrity ofWikipedia.” (Wikipedia: Vandalism, 2010) Examples for that could be the placementof ill-considered humour, the blanking of articles or inserting intentionally falseand misleading information. There are many types of vandalism, but the definingcharacteristic is that it is not done in good-faith. Any attempt to improve the onlineencyclopaedia, even by accidentally placing false information, is not considered assuch. Therefore, there is a fine line to decide if something counts as deliberatelydisruptive behaviour or not. Any user who finds an article being vandalized canrevert it into the previous state and warn the user, who they can identify under theiralias or IP in the edit page. However, these warnings should be done carefully andthere are special guidelines on when and how to issue them. When a user is foundto committing vandalism regularly, he or she can be reported to the administrators,who are able to block users for some time or protect the article in question to acertain degree. (Wikipedia: Vandalism, 2010)
4 Ostrom’s Design Principles and Wikipedia
As already explained above, Ostrom derived the design principles for self-organisedregimes on common pool resources from her research of the traditional physicalcommons schemes. They can be summarized as follows: (1) Defined boundariesare needed. (2) Rules are in place accepted by the community and adapted tothe circumstances. (3) Those people affected by the rules have the possibilityto participate in the modification of said rules. (4) External bodies respect thecommunities’ members to create their own rules. (5) A recognized system iseffective to self-monitor the members’ behaviour. (6) There is a sanctioning systemfor the enforcement of the rules in place with graduated sanctions. (7) All membershave the possibility to access an easily available conflict-resolution tool. (8) In largersystems nested structures exit within the main frame for the single governancemechanisms. (Hess and Ostrom, 2007, p.7)
The first design principle refers to the boundaries of the regime. In knowledgecommons, where the resource is nonrivalrous, the quantity of the resource doesnot play a role. However, there is a discussion about whether Wikipedia is finallyreaching its growth limit, as most of the more easily achievable knowledge hasalready been inserted into the encyclopaedia. (Suh et al., 2009) Some sources alsosay that there are less editors active than before (Angwin and Fowler, 2009). In caseof the users and participants of Wikipedia the boundaries are more recognizable.Though there are no real restrictions in place on who can access the wiki, everyonewho does and especially everyone who edits something will leave a mark whichcan be traced at least on a digital level through the IP addresses or directly throughtheir account if they created one. Therefore, there are certain boundaries in placethrough the fact that people actively decide which roles and responsibilities theytake through their involvement as users of the encyclopaedia. They follow the rules
How Design Principles can Govern the Knowledge Commons 255
of the community and therefore one can argue that they accept the boundaries setin place of the group.
The second principle states that the members of the community have developedcertain accepted behaviours which they see as commonly accepted rules. They canexist as common practices or in written form. These rules should be adaptable tothe special situation of the regime. In case of Wikipedia, there are many policiesdealing with what is perceived to be good or bad behaviour within the community.The case of the counter-vandalism policy of Wikipedia is in itself an example fora rule in place to organize the resource, more specifically to protect it. For theencyclopaedia to be working effectively and to be useful, its content needs to be asaccurate as possible and cannot be altered for the sake of individuals not interestedin correct articles but deliberately using them for other means, like promoting falseinformation or spreading insults. Such actions would go against the purpose of theWikipedia project as a whole and undermine its effectiveness, therefore lessen thevalue of the knowledge commons contained within, whose main characteristic hasto be a high degree of reliability.
The rules are most effective, according to Ostrom, when they derive from thecommunity itself. Within Wikipedia, this third design principle is generally true.However, because of the large amounts of participants it is not always easy forsingle voices to be heard. Also, it is more likely that participants with high senioritycan initiate discussions on the policies themselves than new users could. Yet, in thecase of the anti-vandalism policy possibilities like talk pages exist to discuss thepolicy. The policy page itself cannot be edited by normal users, as this would beconsidered too much disruption and the rules need to be reliable until a majoritywithin the community attempts for their change.
This point goes along with Stegbauer’s analysis of the German Wikipedia, wherehe found that the positions held previously do have an influence on the levels ofpower single users can exert (Stegbauer, 2009, p.154). In his research, Stegbaueranalysed the German Wikipedia using network analysis models and positionaltheories (Stegbauer, 2009). The later are linked to the position which individualscan occupy in a social setting and are akin to sociological models about identitiesand roles individuals can hold. The position within the setting can in turn influencethe individual to fulfil certain prerequisites, for example successfully accomplishingcertain tasks or acting in a certain way. What the position inclines is always boundto the expectation other individuals have, who in turn derive their expectationsfrom their role, e.g. in a teacher-student relation. These relations are not static andare bound within processes. (Stegbauer, 2009, pp.35f)
When analysing the reactions of individuals to certain kinds of vandalism,Stegbauer finds his positional model verified in that different members of thecommunity act according to certain roles or positions, for example the perpetratorsand the hunters of creating a self-enforcing system that draws on peer supervision(Stegbauer, 2009, pp.155-161). However, he realizes differences between the userlevels concerning their interactions and cooperation tendencies. On the level of
256 Kathrin Noack, Christof Weinhardt, and Thomas Dreier
administrators a relatively strong internal cohesion exists. The lower the level ofusers the degree of heterogeneity increases. This might not necessarily be consideredsurprising, as users with higher access levels in Wikipedia should be expected tohave more experience in cooperation and more connections with other users, whichis natural because the number of individuals within that group is also smaller. Yet itmight make it more difficult for someone on a lower level to exert influence withinthe system and be acknowledged on the higher levels. (Stegbauer, 2009, p.154)
This does not lead inevitably to a form of oligarchy, as Piotr Konieczny observesin his research on governance and democratic tendencies in Wikipedia (Konieczny,2009). He sees many possibilities for individuals in Wikipedia to influence its rulesand policies. At the same time communication is facilitated both through its digitalcharacter and the many opportunities to edit and comment on the content. TheWikipedia community shares a dedication to its main goal, the creation of a reliableonline encyclopaedia, which is generally supported. Unlike Stegbauer’s indication,Konieczny does not think that Wikipedia demonstrates significant power distancesand therefore can keep bureaucracy balanced to the open character in general. Still,he does not negate that oligarchic tendencies could take over in the future if theaforementioned characteristics change (Konieczny, 2009, p.189). This could happenif the group of administrators exerted increasing control over the majority of usersof lower access levels and overrode their opinions, for example.
Back to the question at hand though, the tendencies for oligarchic behaviourmight counter Ostrom’s third design principle for long term self-organised regimes.As she states that rules are most effective when derived and adapted by the membersof a regime itself, the dominance of a group of members over the others might provefatal to the long term reliability of the collective action. If that would be the case,it could lead to a form of migration from one project to another. As knowledge isa nonrivalrous resource and the Wikipedia community works on voluntary basis,there are no restrictions on the creation of possible competitive projects. Thisactually happened to Wikipedia when Larry Sanger, the co-founder of Wikipedianext to Jimmy Wales, decided that he would create a fork to Wikipedia, the onlineencyclopaedia ”Citizendium”. He felt the current Wikipedia community did notwork as efficiently as they used to and the policies are not as openly discussed as hewished. He also felt that the maintaining of the quality standards of articles neededimprovement. His project did not yet become as successful in terms of the numbersof users and articles. (Deterding, 2007) This could be due to the fact that not a largenumber of users of the original Wikipedia migrated to the new platform. It mightalso be the case that because of the increased expectations on the quality standardsthe initial threshold for participation is higher.
In the fourth design principle Ostrom states that external authorities shouldaccept the community’s rules. Considering the global nature of the internet, thereare little restrictions in place by outside authorities on the Wikipedia’s internalrules. The anti-vandalism policy refers directly to matters within the workingsof the community, and as such is not bound by external regulations. In general,
How Design Principles can Govern the Knowledge Commons 257
though, there are areas where the laws and regulations of the different states havean impact, such as the author’s rights and influences on the licensing regime ofWikipedia. Also, the personality rights of living persons and their biographieson Wikipedia are specially protected by internal rules, (Wikipedia: Biographies ofliving persons, 2010) which in itself are not necessarily because of external pressure,though personality rights are also part of external legal frameworks. In states wherecensorship exists, the access to Wikipedia might be limited for political reasons.
In case of Wikipedia in general, it basically survives on peer review. Only by thecorrection of the content by the users is the encyclopaedia able to create reliableknowledge. Therefore self-monitoring as the fifth design principle is an integral partof the system as a whole. In case of the anti-vandalism policy, all users should beaware of possible disruptive behaviour and have the possibility to warn perpetratorsaccording to guidelines which are expected to be used. In case the vandalismneeds to be stopped by actually blocking the trespassing individual’s account orprotecting the article in question, an administrator is at least needed to enforce this.In the English Wikipedia there is even a group of members who see their mainresponsibility within the system to counter vandalism. They do not hold specialrights other than the ability to edit articles that basically any user can gain. Yet theystill can issue warnings or convey the problem to an administrator if nothing elseworks (Wikipedia: Counter-Vandalism Unit, 2010).
As to the sixth principle, the sanctions for causing vandalism are graduallyincreased. Possible first sanctions are rather seen as a reminder or a slight warning.Considering the anti-vandalism policy itself, which considers only deliberate acts ofvandalism as such, it is not always easy to tell if someone acted intentionally in adisruptive way or not, therefore the sanctions need to be low in the beginning. Thesanctions can reach much more severe levels than a posted reminder, though, as hasbeen described above with the ’CheckUser’ or ’Oversight’ abilities, which normallyare only exerted after discussion and wielded only by very high ranking members.
Any system where disputes can arise and where disruptive behaviour is sanc-tioned needs certain possibilities for arbitration, Ostrom states as the seventh designprinciple. As already described above, the English Wikipedia has both a MediationCommittee and an Arbitration Committee, which can settle disputes at the highestlevel. Requests for arbitration can be entered through the Wikipedia system andare generally open to all users. Discussants on lower levels can create pages to thearticles to communicate about diverting opinions.
The eighth design principle underlines the possibility of nested structures withinthe whole framework of the community. In larger successful systems using thecommons, Ostrom often observes ”the presence of governance activities organizedin multiple layers of nested enterprises” (Ostrom, 2000, p.152). Enterprises in thiscase are understood as organised forms of collective action. Within Wikipedia, thereare many projects where many users participate. The general access levels andmajor rules are the same throughout the system, but an inherent characteristic ofsubsidiarity can be observed, meaning that problems are to be solved at the lowest
258 Kathrin Noack, Christof Weinhardt, and Thomas Dreier
levels if possible. Users can warn other users of their infringements, talk pagesallow users to communicate over disputes on the content of articles, for example.Arbitration should come only into play at the last possible level. Therefore one cansay that many projects within Wikipedia are nested in the overall structure.
5 Conclusion
On the whole, the case of the anti-vandalism policy and many traits of Wikipediahold structures and processes that can be considered applicable to the design prin-ciples Elinor Ostrom set out for long term self-organized regimes for traditionalcommon pool resources. Even in the case of Wikipedia, where the resource in ques-tion is knowledge, which is nonrivalrous and where possibly everyone can access itthrough the internet, the principles are adaptable or their main characteristics canbe found. Therefore Ostrom’s model could set valuable parameters for new studieson other forms of knowledge or information commons in the digital world.
One of the major factors in deciding if the design principles reflect successfulcollective action regimes is the longevity of them. In case of Wikipedia, the systemhas been functioning since 2001, which can be considered a long timeframe ininternet history. It also shows that the community has proven resilient to majordisruptions so far. An indicator for this is the amount of knowledge bundled inWikipedia. Following Ostrom’s indications one can argue, that a possible reason forthis might be based on the dispute settlement and arbitration system and the fact ithas so far managed to resolve conflicts within the community successfully.
There are many forms of collaborative actions in the virtual sphere of the internet,which could be of interest for future research. Apart from wikis for all kinds oftopics, there are other collaborative actions such as Open Source projects and othervirtual communities sharing and creating intellectual goods. Some of them areclosely linked with commercial interests, something also often happening with OpenSource Software, or by the advertising marked they provide. These influences couldalso change the dynamics for collective action within some groups. It would openup questions on how Ostrom’s understanding of the commons can be adapted toother virtual communities as well. It might also be worth comparing the parameterssingled out by Ostrom to communities which have not explicitly evolved aroundone form of content, such as social community websites, which still need to organisetheir members’ interactions through rule settings and guidelines.
References
Angwin, J. and G. A. Fowler (2009): “Volunteers Log Off as Wikipedia Ages,” TheWall Street Journal, (27 Nov 2009), online available at: http://online.wsj.com/article/SB125893981183759969.html; accessed 18 Jan 2010.
How Design Principles can Govern the Knowledge Commons 259
Deterding, S. (2007): “Next Wikipedia, take a right. Wikipedia, Citizendium, andthe politics of knowledge: An interview with Larry Sanger,” Bundeszentralefur politische Bildung, (Dossier Open Source. 08 Jan 2007), online available at:http://www.bpb.de/themen/KD5Y51.html; accessed 18 Jan 2010.
Hardin, G. (1968): “The Tragedy of the Commons,” Science, 162(3859), pp. 1243–1248.Hess, C. and E. Ostrom (2007): Understanding Knowledge as a Commons: From Theory
to Practice, The MIT Press, Cambridge, London.Konieczny, P. (2009): “Governance, Organization, and Democracy on the Internet:
The Iron Law and the Evolution of Wikipedia,” Sociological Forum, 24(1), pp.162–192.
Lessig, L. (2002): The Future of Ideas. The Fate of the Commons in a Connected World,2nd; first published 2001, new york: random house, inc. edition, Vintage BooksEdition, New York.
Ostrom, E. (1986): “An Agenda for the Study of Institutions,” Public Choice, 48(1),pp. 3–25.
Ostrom, E. (1990): Governing the Commons: The Evolution of Institutions for CollectiveAction, Cambridge University Press, New York.
Ostrom, E. (2000): “Action and the Evolution of Social Norms,” The Journal ofEconomic Perspectives, 14(3), pp. 137–158.
Stegbauer, C. (2009): Wikipedia. Das Ratsel der Kooperation, VS Verlag fur Sozialwis-senschaften, Wiesbaden.
Stegbauer, C. and A. Rausch (2006): Strukturalistische Internetforschung. Netzwerkanal-ysen internetbasierter Kommunikationsraume, VS Verlag fur Sozialwissenschaften,Wiesbaden.
Suh, B., G. Convertino, E. Chi, and P. Pirolli (2009): “The Singularity is NotNear: Slowing Growth of Wikipedia,” WikiSym ’09, (25-27 Oct 2009, Orlando,Florida), online available at: http://www-users.cs.umn.edu/~echi/papers/
2009-WikiSym/wikipedia-slow-growth-ASC-PARC.pdf; accessed 18 Jan 2010.Tapscott, D. and A. D. Williams (2007): Wikinomics. Die Revolution im Netz, Carl
Hanser Verlag Munchen.Wikimedia Deutschland e.V. (2010): Wikimedia Deutschland e.V.: Satzung, online
available at: http://wikimedia.de/index.php?id=9; accessed 06 Feb 2010.Wikimedia Foundation Inc. (2010): Wikimedia Foundation: Home, online available at:http://wikimediafoundation.org/wiki/Home; accessed 14 Jan 2010.
Wikipedia: About (2010): Wikipedia: The Free Encyclopedia, onlineavailable at: http://en.wikipedia.org/w/index.php?title=Wikipedia&oldid=341846856; accessed 04 Feb 2010.
Wikipedia: Administrators (2010): Wikipedia: The Free Encyclopedia, on-line available at: http://en.wikipedia.org/w/index.php?title=Wikipedia:
Administrators&oldid=341141411; accessed 04 Feb 2010.
260 Kathrin Noack, Christof Weinhardt, and Thomas Dreier
Wikipedia: Arbitration (2010): Wikipedia: The Free Encyclopedia, on-line available at: http://en.wikipedia.org/w/index.php?title=Wikipedia:
Arbitration\&oldid=339214493; accessed 04 Feb 2010.Wikipedia: Arbitration Committee/Procedures (2010): Wikipedia: The Free En-
cyclopedia, online available at: http://en.wikipedia.org/w/index.php?title=Wikipedia:Arbitration_Committee/Procedures&oldid=340711791; accessed 04Feb 2010.
Wikipedia: Arbitration/Policy (2010): Wikipedia: The Free Encyclopedia, on-line available at: http://en.wikipedia.org/w/index.php?title=Wikipedia:
Arbitration/Policy&oldid=332115367; accessed 04 Feb 2010.Wikipedia: Biographies of living persons (2010): Wikipedia: The Free Encyclopedia,
online available at: http://en.wikipedia.org/w/index.php?title=Wikipedia:
Biographies_of_living_persons&oldid=341835264; accessed 04 Feb 2010.Wikipedia: Checkuser (2010): Wikipedia: The Free Encyclopedia, on-
line available at: http://en.wikipedia.org/w/index.php?title=Wikipedia:
CheckUser&oldid=341431596; accessed 04 Feb 2010.Wikipedia: Counter-Vandalism Unit (2010): Wikipedia: The Free Encyclopedia,
online available at: http://en.wikipedia.org/w/index.php?title=Wikipedia:
Counter-Vandalism_Unit\&oldid=329944176; accessed 04 Feb 2010.Wikipedia: Licensing Update (2010): Wikipedia: The Free Encyclopedia, online avail-
able at: http://en.wikipedia.org/w/index.php?title=Wikipedia:Licensing_
update&oldid=335720750; accessed 04 Feb 2010.Wikipedia: Mediation Committee (2010): Wikipedia: The Free Encyclopedia,
online available at: http://en.wikipedia.org/w/index.php?title=Wikipedia:
Mediation_Committee&oldid=336793986; accessed 04 Feb 2010.Wikipedia: Oversight (2010): Wikipedia: The Free Encyclopedia, on-
line available at: http://en.wikipedia.org/w/index.php?title=Wikipedia:
Oversight&oldid=341614245; accessed 04 Feb 2010.Wikipedia: User access levels (2010): Wikipedia: The Free Encyclopedia, online
available at: http://en.wikipedia.org/w/index.php?title=Wikipedia:User_
access_levels&oldid=339364994; accessed 04 Feb 2010.Wikipedia: Vandalism (2010): Wikipedia: The Free Encyclopedia, on-
line available at: http://en.wikipedia.org/w/index.php?title=Wikipedia:
Vandalism&oldid=341625714; accessed 04 Feb 2010.WikiSym (2010): “About WikiSym,” The International Symposium on Wikis and Open
Collaboration, online available at: http://www.wikisym.org/about/; accessed 17Feb 2010.
WikiSym ’09 (2010): “WikiSym 2009 Program and Schedule,” The International Sym-posium on Wikis and Open Collaboration, online available at: http://www.wikisym.org/ws2009/tiki-index.php?page=Program; accessed 17 Feb 2010.