Embed Size (px)
Citation preview

Published OnlineFirst December 22, 2009; DOI: 10.1158/1078-0432.CCR-09-2006
Human Cancer Biology Clinical
CancerResearch
Three DNA Methylation Epigenotypes in HumanColorectal CancerKoichi Yagi1,3, Kiwamu Akagi4, Hiroshi Hayashi1, Genta Nagae1, Shingo Tsuji1, Takayuki Isagawa1,Yutaka Midorikawa1, Yoji Nishimura5, Hirohiko Sakamoto5, Yasuyuki Seto3,Hiroyuki Aburatani1, and Atsushi Kaneda1,2
Abstract
Authors' AAdvancedBiology aGastrointesof Tokyo,Cancer PreCenter, Sai
Note: SuppResearch O
CorresponScience Divku, Tokyo 1E-mail: kan
doi: 10.115
©2010 Am
www.aacr
Do
Purpose: Whereas the CpG island methylator phenotype (CIMP) in colorectal cancer associates withmicrosatellite instability (MSI)-high and BRAF-mutation(+), the existence of an intermediate-methylationsubgroup associated with KRAS-mutation(+) is controversial, and suitable markers for the subgroup haveyet to be developed. Our aim is to clarify DNA methylation epigenotypes of colorectal cancer morecomprehensively.Experimental Design: To select new methylation markers on a genome-wide scale, we did methylated
DNA immunoprecipitation-on-chip analysis of colorectal cancer cell lines and re-expression array analysisby 5-aza-2′-deoxycytidine/Trichostatin A treatment. Methylation levels were analyzed quantitatively in149 colorectal cancer samples using matrix-assisted laser desorption/ionization–time-of-flight mass spec-trometry. Colorectal cancer was epigenotyped by unsupervised two-way hierarchical clustering method.Results: Among 1,311 candidate silencing genes, 44 new markers were selected and underwent quan-
titative methylation analysis in colorectal cancer samples together with 16 previously reported markers.Colorectal cancer was clustered into high-, intermediate-, and low-methylation epigenotypes. Methylationmarkers were clustered into two major groups: group 1 showing methylation in high-methylation epigen-otype, and group 2 showing methylation in high- and intermediate-methylation epigenotypes. A two-stepmarker panel deciding epigenotypes was developed with 95% accuracy: the 1st panel consisting of threegroup-1 markers (CACNA1G, LOX, SLC30A10) to extract high-methylation epigenotype, and the 2ndpanel consisting of four group-2 markers (ELMO1, FBN2, THBD, HAND1) and SLC30A10 again to dividethe remains into intermediate- and low-methylation epigenotypes. The high-methylation epigenotypecorrelated significantly with MSI-high and BRAF-mutation(+) in concordance with reported CIMP. Inter-mediate-epigenotype significantly correlated with KRAS-mutation(+). KRAS-mutation(+) colorectal can-cer with intermediate-methylation epigenotype showed significantly worse prognosis.Conclusions: Three methylation epigenotypes exist in colorectal cancer, and suitable classification
markers have been developed. Intermediate-methylation epigenotype with KRAS-mutation(+) correlatedwith worse prognosis. Clin Cancer Res; 16(1); 21–33. ©2010 AACR.
Colorectal cancer is the fourth most common cancer andthe fourth leading cause of cancer death in the world (1).Cancer arises as a consequence of the accumulation ofepigenetic alterations and genetic alterations (2–5). Gene
ffiliations: 1Genome Science Division, Research Center forScience and Technology (RCAST), 2Translational Systemsnd Medicine Init iat ive (TSBMI), and 3Department oftinal Surgery, Graduate School of Medicine, The UniversityTokyo, Japan; and Divisions of 4Molecular Diagnosis andvention and 5Gastroenterological Surgery, Saitama Cancertama, Japan
lementary data for this article are available at Clinical Cancernline (http://clincancerres.aacrjournals.org/).
ding Author: Atsushi Kaneda and Hiroyuki Aburatani, Genomeision, RCAST, The University of Tokyo, 4-6-1 Komaba, Meguro-53-8904, Japan. Phone: 81-3-5452-5357; Fax: 81-3-5452-5355;[email protected] and [email protected].
8/1078-0432.CCR-09-2006
erican Association for Cancer Research.
journals.org
Researcon July clincancerres.aacrjournals.org wnloaded from
mutations, such as KRAS, p53, and APC, are well-knowngenetic alterations occurring in colorectal cancer, whichwere shown in the model of “adenoma-carcinomasequence” by Bert Vogelstein (6). Microsatellite instabil-ity (MSI) and chromosomal instability are also well-characterized genetic alterations, and these two exclusivepathways suggest the heterogeneous origin of colorectalcancer (7).Gene silencing is an epigenetic gene inactivation mech-
anism by DNA methylation of its promoter region, and isinvolved in the initiation and progression of cancer (4, 8).A genome-wide search of genes using aberrant methyla-tion as markers is useful for identifying novel tumor-suppressor genes and methylation markers (9–12). Severalapproaches to detect aberrantly methylated regions in can-cer have been developed, although most of these methodsutilize methylation-sensitive restriction enzymes and thusonly limited regions of genome can be analyzed (13).
21
h. 20, 2018. © 2010 American Association for Cancer

Translational Relevance
Whereas CpG island methylator phenotype (CIMP)in colorectal cancer is known to associate with micro-satellite instability and BRAF-mutation(+), the exis-tence of an intermediate-methylation subgroupassociated with KRAS-mutation(+), referred to asCIMP-low/CIMP-2, is controversial, and suitable mar-kers for the subgroup have yet to be developed, if suchexist. We identified new colorectal cancer methylationmarkers through genome-wide analyses of DNA meth-ylation and expression, and the new methylation mar-kers classified clinical colorectal cancer cases into threedistinct clusters: high-, intermediate-, and low-methyl-ation epigenotypes. The intermediate-methylation epi-genotype strongly correlated with KRAS-mutation(+).Although microsatellite-stable colorectal cancer withworse prognosis was not stratified by using KRAS sta-tus only, KRAS-mutation(+) colorectal cancer with in-termediate-methylation epigenotype showedsignificantly worse prognosis. Considering that KRAS-mutation(+) colorectal cancer is resistant to anti–epi-dermal growth factor receptor therapy, epigenotypingusing new markers might be useful to stratify KRAS-mutation(+) colorectal cancer with worse prognosis,and alternative therapy targeting for this group is sug-gested to be developed.
6 www.sanger.ac.uk/perl/genetics/CGP
Yagi et al.
22
Published OnlineFirst December 22, 2009; DOI: 10.1158/1078-0432.CCR-09-2006
As for accumulation of gene methylation, the concepttermed “CpG island methylator phenotype” (CIMP) wasfirst represented in 1999 by Toyota et al. CIMP was char-acterized by CpG island methylation in multiple regions,the so-called MINT (methylated-in-tumor) loci, existing ina subset of colorectal cancer, and correlated with MSI (14).In 2006, Weisenberger et al. reported new five CIMP mar-kers to decide CIMP status using quantitative methylationanalysis, Methylight (15). Ogino et al. proposed that theCIMP-low subgroup, which had less extensive methylationof CIMP-related markers, was associated with KRAS muta-tion compared with the CIMP-high and CIMP(−) sub-groups (16). Shen et al. reported that in addition toCIMP correlating with MSI (namely CIMP-1), anotherCIMP (namely CIMP-2) existed in the remaining colorec-tal cancer cases through genetic and epigenetic analysis(17). However, these reports about CIMP-low/2 analyzedmethylation of genes/loci that had been previously re-ported and frequently analyzed, such as p16, hMLH1,and MINT loci. As Ogino and Fuchs suggested, CIMP mar-kers so far were considered to be specific for CIMP-highand not ideal for the identification of CIMP-low, therefore,sensitive and specific markers for CIMP-low needed to beidentified if CIMP-low really existed (18). On the otherhand, Perucho and his colleagues insisted on the absenceof methylator phenotype, by analyzing methylation in asmany as 36 genes (19). These suggest that the existence of
Clin Cancer Res; 16(1) January 1, 2010
Researcon July clincancerres.aacrjournals.org Downloaded from
the CIMP-low/2 subgroup or even CIMP itself is contro-versial, and epigenotyping of colorectal cancer by morecomprehensive approaches, e.g., hierarchical clustering us-ing quantitative methylation data by a single detectionmethod using novel regions selected on a genome-widescale, were required.To enable high-resolution comprehensive mapping of
DNA methylation, we recently reported methylatedDNA immunoprecipitation (MeDIP)-chip analysis onshort oligonucleotide arrays using unbiased amplificationof MeDIP products by in vitro transcription (20). In thisstudy, we did MeDIP-chip analysis of both the MSI-high(MSI-H) colorectal cancer cell line HCT116 and the mi-crosatellite-stable (MSS) colorectal cancer cell line SW480using promoter tiling array to identify promoter regionsmethylated in colorectal cancer on a genome-wide scale.HCT116 and SW480 were treated with 5-aza-2′-deo-xycytidine (5-Aza) and/or Trichostatin A, and gene re-expression of the cell lines was analyzed using expressionmicroarray. Candidate genes silenced by promoter meth-ylation in colorectal cancer were selected using thesemethylation and re-expression data, and methylation ofthese marker genes and reported CIMP markers was ana-lyzed using a single, bisulfite-PCR-based quantitativemethod, matrix-assisted laser desorption/ionization–time-of-flight mass spectrometry (MassARRAY), to epi-genotype colorectal cancer.
Materials and Methods
Clinical samples and cell lines. Two hundred and thirteencolorectal cancer samples and nine normal colon mucosasamples were obtained from colorectal cancer patientswho underwent surgical operation at Saitama Cancer Cen-ter from January 1996 to August 2006, with written in-formed consents, and kept frozen until use. Colorectalcancer samples were microscopically examined for deter-mination of cancer cell contents by two independentpathologists, and were dissected to enrich cancer cellswhen necessary. For molecular analysis, 149 samples thatcontained ≥40% of cancer cells were used. Normal colonmucosa was extracted with enough margin from cancer,and it was confirmed microscopically that neither musclelayer nor cancer cells were included. Three MSI-H colorec-tal cancer cell lines, namely, HCT116, DLD1, and LoVo,and three MSS colorectal cancer cell lines, namely,SW480, T84 and Caco-26 (21–23), were obtained fromthe American Type Culture Collection. DNA of clinicalsamples and cell lines was extracted using QIAamp DNAMicro Kit (QIAGEN). RNA of HCT116 and SW480 was ex-tracted using TRIzol (Invitrogen). Human peripheral lym-phocyte DNA was obtained from Coriell Cell Repositories.RNA samples of normal adult and fetal colon were pur-chased from Ambion and Stratagene, respectively. This
Clinical Cancer Research
h. 20, 2018. © 2010 American Association for Cancer

7 www.r-project.org/8 www.cs.waikato.ac.nz/∼ml/weka/9 www.jmp.com/
Epigenotypes of Colorectal Cancer
Published OnlineFirst December 22, 2009; DOI: 10.1158/1078-0432.CCR-09-2006
study was certified by the Ethics Committee of Tokyo Uni-versity and Saitama Cancer Center.5-Aza and Trichostatin A treatment. HCT116 and SW480
cells were seeded at a density of 3 × 10⁵ cells/10-cm dishon day 0, and exposed to 3 μmol/L 5-Aza on days 1, 2, and3. Trichostatin A treatment was done on day 3 at a dose of300 nmol/L. Medium was changed every 24 h, and cellswere harvested on day 4.MeDIP-Chip analysis. MeDIP-Chip of HCT116 and
SW480 using Human Promoter 1.0R tiling array (Affyme-trix), which covered 199,543,165 bp and 4,071,296 CpGsites around over 25,500 promoter regions, was carriedout as we previously reported with MeDIP-chip using EN-CODE tiling array (20). Briefly, genomic DNA of HCT116and SW480 was fragmented by sonication and immuno-precipitated by anti–5-methylcytocine polyclonal anti-body (Megabase Research Products). MeDIPed sampleand input sample underwent unbiased amplification byin vitro transcription. Amplified cRNA was converted intocDNA. cDNA was hybridized to Promoter tiling array forboth MeDIPed sample and input sample. Hybridizationwas done twice. Within a window of 550 bp, the duplicat-ed data from MeDIP DNA were compared with duplicateddata from input DNA using Wilcoxon rank sum test to cal-culate P values to detect candidate methylation sites. Siteswith P < 10-2 were considered to be candidate methylationsites in this study. MeDIP-chip data are available at GEOdatasets (#GSE14526).Expression microarray analysis. mRNA expression in
HCT116 and SW480 with or without 5-Aza/TrichostatinA treatment and normal adult and fetal colon sampleswere analyzed on GeneChip Human Genome U133 plus2.0 oligonucleotide arrays (Affymetrix). For global nor-malization, the average signal in an array was made equalto 100. Expression array data were used for selection ofmethylation markers. Expression array data are availableat GEO datasets (#GSE14526).Bisulfite treatment. Genomic DNA bisulfite conversion
of clinical samples, cell lines, and control samples wasdone as described previously (24) with some modification(See Supplementary Material and Methods).Methylation analysis. Methylation analysis of clinical
samples, cell lines, and control samples was done usingMassARRAY (Sequenom; ref. 25). Bisulfite-treated DNAwas amplified by PCR, and the PCR product was tran-scribed by in vitro transcription and the RNA was cleavedby RNaseA. Unmethylated cytosine (C) was converted touracil (U) by bisulfite treatment, i.e., thymine (T) in PCRproduct, and finally adenine (A) in in vitro transcriptionproduct. Methylated cytosine (mC) was not converted,i.e., cytosine (C) in PCR product, and finally guanine(G) in in vitro transcription product. RNaseA cleavesRNA at the 3′ site of both T and C; T-specific cleavagewas able to be done by containing dC instead of C inthe mixture, C-specific cleavage by containing dT insteadof T in the mixture. Methylation status was determinedby mass difference between A and G in a cleaved RNAproduct. Quantitative methylation was calculated for
www.aacrjournals.org
Researcon July clincancerres.aacrjournals.org Downloaded from
each cleaved product. This analytic unit containing sever-al CpG sites in a cleaved product was called “CpG unit”.We did only T-specific cleavage analysis because C-specif-ic cleavage is not informative at the high-CpG-density re-gion (26).Primers were designed to include no CpG site or only
one CpG site in 5′ region of primers, and are shown inSupplementary Table S1. Control samples were preparedas follows. First, human peripheral lymphocyte DNA wasused as diploid human DNA, and was amplified by Gen-omiPhi v2 DNA amplification kit (GE Healthcare Life-science). The amplified DNA was not methylated at allin any CpG sites, and was used as unmethylated (0%)control. The amplified DNA was also methylated by SssImethylase (New England Biolabs) and used as fully meth-ylated (100%) control. By mixing the 0% and 100% con-trol samples, partially methylated control samples (25%,50%, and 75%) were generated.Analysis of genetic alterations. Analysis of MSI status
and KRAS mutation (codons 12, 13, and 19) was doneas described previously (27, 28). Samples showing insta-bility in two or more of the Bethesda five markers weredefined as MSI-H, and the ones in none or one as MSS.BRAF mutation (V600E) at exon 15 was determined bydirect sequencing using pyrosequencing. P53 immunohis-tochemistry was done using DO-7 antimouse monoclonalantibody (Santa Cruz Biotechnology), and samples withnucleus staining were determined as p53-IHC (+). Analysisof MSI, KRAS mutation, BRAF mutation, and p53-IHCwere done for all the clinical colorectal cancer samples.Statistical analysis. The correlation between epigen-
otypes and clinicopathologic factors except age was ana-lyzed by Fisher's exact test. About patient age, ANOVAwas used for analysis of significance among three groups,and comparison between two groups was adjusted formultiple comparisons using Holm's method. Unsuper-vised two-way hierarchical clustering was done based onstandard correlation and average linkage clustering algor-ism in sample direction, and Euclid distance and completelinkage clustering algorism in marker direction usingGeneSpring 7.3.1 software (Agilent Technology). Model-based clustering was carried out using R software.7 Deci-sion tree for three epigenotypes was generated using Wekasoftware.8 Kaplan-Meier survival analysis was done byJMP 7 software9 and P value was calculated by log-ranktest. Survival analysis by Cox proportional hazard modelwas done by R software. In survival analysis, the end offollow-up period was 60 mo from the primary surgeryand the mean follow-up time of the cases used for survivalanalysis was 49 mo. Death as a result of colorectal cancerwas the primary end point and deaths by other causeswere censored.
Clin Cancer Res; 16(1) January 1, 2010 23
h. 20, 2018. © 2010 American Association for Cancer

Yagi et al.
24
Published OnlineFirst December 22, 2009; DOI: 10.1158/1078-0432.CCR-09-2006
Results
Generation of colorectal cancer methylation markers. InMeDIP-Chip analysis of HCT116 and SW480 using Pro-moter tiling array, 12,782 and 10,232 candidate methyla-tion sites were detected on a genome-wide scale,respectively, and 3,178 and 3,177 RefSeq genes were
Clin Cancer Res; 16(1) January 1, 2010
Researcon July clincancerres.aacrjournals.org Downloaded from
found to possess candidate methylation sites within 1 kbfrom transcription start site. In expression analysis ofHCT116 and SW480 treated by 5-Aza with or without Tri-chostatin A, 9,988 and 10,550 genes showed re-expression>1.5-fold compared with untreated ones, respectively. Toselect candidate silencing genes, we set up four criteria: (a)genes that possess candidate methylation site within 1 kb
Fig. 1. Gene selection from array-based analysis. A, Venn diagram showed the intersection of two categories acquired by genome-wide array-basedanalysis. Numbers, number of included genes; numbers in parentheses, number of genes selected for MassARRAY analysis (above arrows) and geneswhose primer pairs were validated and used for further analysis (below arrows). B, representative genes selected from three categories. CHFR was selectedfrom HCT116, HLTF from SW480, and SFRP1 from both cell lines. MeDIP score is shown by −10log10 P value and the region over 20 (i.e., P < 10−2)was considered as a candidate methylated site.
Clinical Cancer Research
h. 20, 2018. © 2010 American Association for Cancer

Epigenotypes of Colorectal Cancer
Published OnlineFirst December 22, 2009; DOI: 10.1158/1078-0432.CCR-09-2006
from transcription start site; (b) GeneChip score of normaladult or fetal colon >50; (c) GeneChip score of the cell line<50; and (d) upregulation >1.5-fold after 5-Aza or 5-Azaand Trichostatin A treatment. As shown in Fig. 1, 577,313, and 421 genes were identified as candidate silencinggenes fulfilling the four criteria in HCT116 only, in SW480only, and in both cell lines, respectively. Among these, weselected 21, 10, and 24 genes as candidate new markers,respectively (Fig. 1). In addition, we also selected 13 pre-viously reported CIMP markers and 6 previously reportedsilenced genes.Quantitative methylation analysis. We first validated
quantitativity 74 primer pairs by analyzing control sam-ples (0%, 25%, 50%, 75%, and 100% methylated sam-ples) using MassARRAY (Supplementary Fig. S1). Alinear standard curve was drawn, and correlation coeffi-
www.aacrjournals.org
Researcon July clincancerres.aacrjournals.org Downloaded from
cient (R2) was calculated at each CpG unit. CpG unitswith R2 ≤0.9 were excluded for further analysis. Primerpairs whose amplicon contained <3 CpG units with R2
>0.9 were also excluded or redesigned. Finally, primersfor 60 regions, including 44 candidate new markers, 11CIMP markers, and 5 silencing genes (SupplementaryTable S1), were validated and used in further analysis,whereas the other 14 markers were excluded. The 44new markers included 16, 8, and 20 candidate genes si-lenced in HCT116 only, in SW480 only, and in both celllines (Fig. 1A).The amplicons of 60 analyzed regions included 15,352
base pairs and 791 CpG units derived from 1,455 CpGsites. Methylation scores were measurable at 640 CpGunits by MassARRAY. In addition to CpG units with corre-lation coefficient R2 ≤0.9, CpG units where methylation
Fig. 2. Unsupervised two-way hierarchical clustering. Colorectal cancer cases were clustered into three major epigenotypes: HME were clustered withMSI-H cell lines, and correlated strongly with MSI-H and BRAF-mutation(+). IME were clustered with MSS cell lines, and correlated with KRAS-mutation(+).Methylation markers were clustered into two major groups. Group-1 markers showed high methylation in HME samples, whereas group-2 markersshowed high methylation in HME and LME samples. In heat map: red, 100% methylation; white, 0% methylation; gray, no data. In Origin column at thebottom: red, colorectal cancer; dark blue, colorectal cancer cell lines; light blue, normal colon mucosa.
Clin Cancer Res; 16(1) January 1, 2010 25
h. 20, 2018. © 2010 American Association for Cancer

Yagi et al.
26
Published OnlineFirst December 22, 2009; DOI: 10.1158/1078-0432.CCR-09-2006
score was measured in ≤134 cases (≤90%) among 149 co-lorectal cancer samples were also excluded. After all these,478 CpG units derived from 800 CpG sites were used foreach sample.
Clin Cancer Res; 16(1) January 1, 2010
Researcon July clincancerres.aacrjournals.org Downloaded from
Methylation of 60 markers in HCT116, SW480, and clin-ical samples. Thirty-six markers selected from candidate si-lencing genes in HCT116 were mostly methylated inHCT116 (mean ± SD, 92 ± 11%), and 28 markers from
Table 1. Clinical and molecular characteristics according to three epigenotypes
Clinical ormolecular features
All cases
HME IME LMEh. 20, 2018. ©
Outlier
2010 Ameri
P(3 epigenotypes)
Clinical Ca
can Association fo
P(IME vs LME)
Total sample number
149 (100%) 17 (11%) 60 (40%) 54 (36%) 18 (12%) GenderMale
85 (57%) 5 (29%) 35 (58%) 35 (65%) 10 (56%) 0.038* 0.56 Female 64 (43%) 12 (71%) 25 (42%) 19 (35%) 8 (44%)Age, y
Mean ± SD 62.8 ± 9.4 69.0 ± 8.9 60.9 ± 9.2 62.1 ± 9.6 65.2 ± 6.8 8.5 × 10−3* 0.51Tumor location
Proximal 54 (36%) 15 (88%) 20 (33%) 10 (19%) 9 (50%) 8.7 × 10−7* 0.090 Distal 95 (64%) 2 (12%) 40 (67%) 44 (81%) 9 (50%)Mucinous component
(+) 27 (18%) 9 (53%) 16 (24%) 0 (0%) 2 (11%) 9.7 × 10−8* 1.4 × 10−5†(−)
122 (82%) 8 (47%) 44 (76%) 54 (100%) 16 (89%) Poorly diff. component(+)
20 (13%) 6 (35%) 9 (15%) 3 (6%) 2 (11%) 7.5 × 10−3* 0.13 (−) 129 (87%) 11 (65%) 51 (85%) 51 (94%) 16 (89%)AJCC Stage
I 2 (1%) 2 (12%) 0 (0%) 0 (0%) 0 (0%) 0.053 0.29 II 42 (28%) 6 (35%) 19 (32%) 11 (20%) 6 (33%) III 50 (34%) 6 (35%) 19 (32%) 24 (44%) 1 (6%) IV 55 (17%) 3 (18%) 22 (37%) 19 (35%) 11 (61%)Lymph node metastasis
(+) 90 (60%) 9 (53%) 36 (60%) 38 (70%) 7 (39%) 0.27 0.23 (−) 58 (39%) 8 (47%) 24 (40%) 15 (28%) 11 (61%) Unknown 1 (1%) 0 (0%) 0 (0%) 1 (2%) 0 (0%)Lymph vessel invasion
(+) 117 (79%) 15 (88%) 48 (80%) 40 (74%) 14 (78%) 0.48 0.51 (−) 32 (21%) 2 (12%) 12 (20%) 14 (26%) 4 (22%)Venous invasion
(+) 122 (82%) 12 (71%) 49 (81%) 45 (83%) 16 (89%) 0.48 1 (−) 27 (18%) 5 (29%) 11 (19%) 9 (17%) 2 (11%)Microsatellite
MSI-H 17 (11%) 13 (76%) 2 (3%) 0 (0%) 2 (11%) 4.0 × 10−13* 0.50 MSS 132 (89%) 4 (24%) 58 (97%) 54 (100%) 16 (89%)BRAF mutation
(+) 13 (9%) 12 (72%) 0 (0%) 0 (0%) 1 (6%) 2.0 × 10−13* 1 (−) 136 (91%) 5 (28%) 60 (100%) 54 (100%) 17 (94%)KRAS mutation
(+) 60 (40%) 3 (18%) 38 (63%) 14 (26%) 5 (28%) 2.3 × 10−5* 7.4 × 10−5†(−)
89 (60%) 14 (82%) 22 (37%) 40 (74%) 13 (72%) p53-IHC(+)
70 (47%) 0 (0%) 29 (48%) 30 (56%) 11 (61%) 2.4 × 10−5* 0.50 (−) 75 (50%) 17 (100%) 29 (48%) 22 (41%) 7 (39%) Unknown 4 (3%) 0 (0%) 2 (3%) 2 (3%) 0 (0%)NOTE: The number of samples with each clinical or molecular characteristics is shown. Proximal location, cecum to transversecolon. Distal location, descending colon to rectum. Poorly diff. component, poorly differentiated adenocarcinoma component.Abbreviation: AJCC, American Joint Committee on Cancer.*P value among three epigenotypes < 0.05.†P value between IME and LME < 0.05.
ncer Research
r Cancer
Epigenotypes of Colorectal Cancer
Published OnlineFirst December 22, 2009; DOI: 10.1158/1078-0432.CCR-09-2006
SW480 were mostly methylated in SW480 (80 ± 21%).Of 44 new marker genes, 37 (84%) showed methyla-tion(+) in >10% of the 149 colorectal cancer samples,and 30 of the 37 genes showed methylation(−) in allthe 9 normal samples (Supplementary Fig. S2). Amongthese 30 cancer-specific aberrant-methylation genes, 16(53%) showed methylation(+) in >50% of 149 colorectalcancer samples. On the other hand, all the 11 CIMP-related markers showed methylation(+) in <50% of colo-rectal cancer samples, and 9 of 11 showed methylation(+)in only 8% to 20% of colorectal cancer samples. Consider-ing that the tumor cell content of the sample was ≥40%, aclinical sample with methylation rate >35% was definedmethylation(+).Epigenotyping of colorectal cancer. To epigenotype colo-
rectal cancer by DNA methylation, 149 colorectal cancersamples along with 9 normal colon mucosa samples and6 colorectal cancer cell lines were classified by unsuper-vised two-way hierarchical clustering using the methyla-tion rates of the above 60 markers (Fig. 2). Threemethylation clusters were identified: high-methylationepigenotype (HME), intermediate-methylation epigen-otype (IME), and low-methylation epigenotype (LME).All the 3 MSI-H cell lines and 17 colorectal cancers wereclustered in HME, all the 3 MSS cell lines and 60 colorectalcancers were clustered in IME, and 54 colorectal cancerswere clustered in LME. Nine normal samples were clus-tered outside from three colorectal cancer epigenotypes,
www.aacrjournals.org
Researcon July clincancerres.aacrjournals.org Downloaded from
and 18 outlier samples were excluded for further analysis.The Bayesian information criterion curve constructed bymodel-based clustering revealed that the most optimalnumber of clusters for colorectal cancer was three (datanot shown), supporting the above classification of colorec-tal cancer into three epigenotypes.HME consisted of 17 samples, and included 13 (76%)
MSI-H, 12 (71%) BRAF-mutation(+), 3 (18%) KRAS-mutation(+), and no p53-IHC(+) samples (Fig. 2and Table 1). IME consisted of 60 samples, and included2 (3%) MSI-H, no BRAF-mutation(+), 38 (63%) KRAS-mutation(+), and 29 (48%) p53-IHC(+) samples. LMEconsisted of 54 samples, and included no MSI-H, noBRAF-mutation(+), 14 (26%) KRAS-mutation(+), and 30(56%) p53-IHC(+) samples. There was a significant differ-ence among the three epigenotypes in MSI status (P = 4.0 ×10⁻¹³, Fisher's exact test), BRAF-mutation (P = 2.0 × 10⁻¹³),KRAS-mutation (P = 2.3 × 10⁻⁵), and p53-IHC (P = 2.4 ×10⁻⁵), in concordance with previous reports (17). Whenonly IME and LME were compared, there was a significantdifference in KRAS-mutation (P = 7.4 × 10⁻⁵) and nodifference in p53-IHC status (P = 0.45).As for clinical information (Table 1), gender, proximal
tumor location, mucinous component of the tumor, andpoorly differentiated adenocarcinoma component weresignificantly different among the three epigenotypes(P = 0.038, 8.7 × 10⁻⁷, 9.7 × 10⁻⁸, and 7.5 × 10⁻³, respec-tively), and HME patients were significantly older.
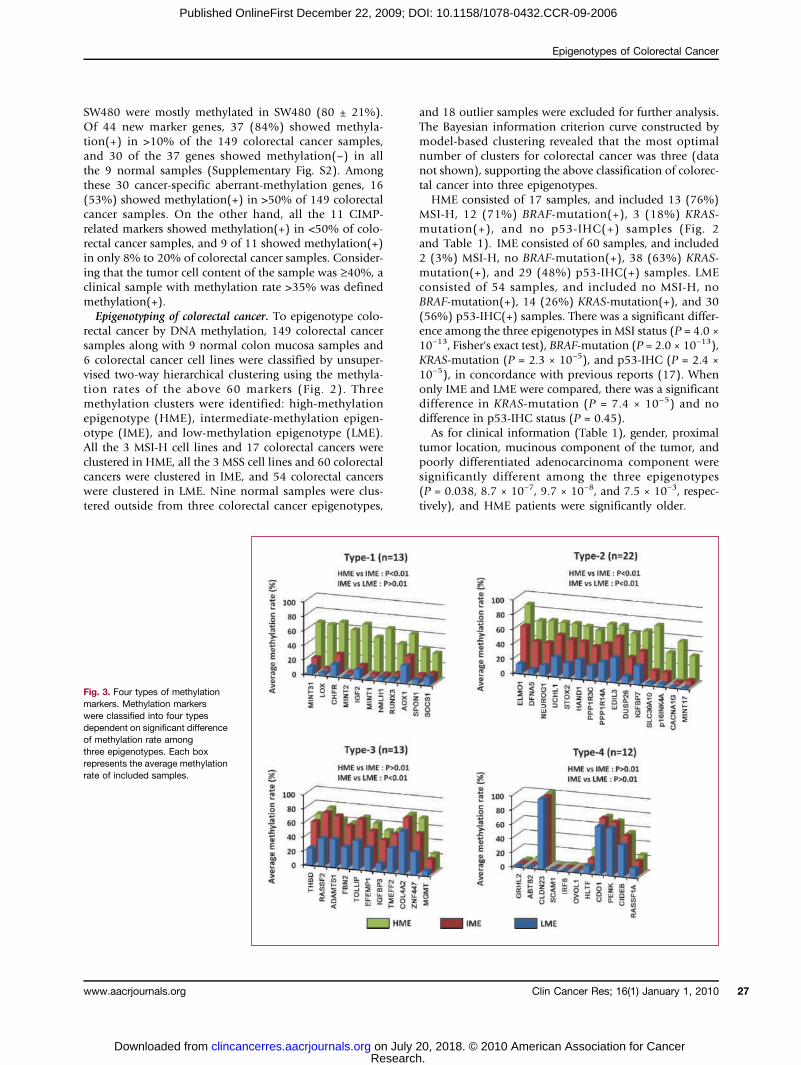
Fig. 3. Four types of methylationmarkers. Methylation markerswere classified into four typesdependent on significant differenceof methylation rate amongthree epigenotypes. Each boxrepresents the average methylationrate of included samples.
Clin Cancer Res; 16(1) January 1, 2010 27
h. 20, 2018. © 2010 American Association for Cancer
Yagi et al.
28
Published OnlineFirst December 22, 2009; DOI: 10.1158/1078-0432.CCR-09-2006
Types of methylation markers. Methylation markers wereclustered into two major groups, group 1 and group 2(Fig. 2). Group-1 markers seemed to be highly methylatedin HME. Group-2 markers seemed to be highly methylatedin both HME and IME, but less in LME. To estimate thesetendencies, we classified 60 markers into four types byaverage methylation rate for each epigenotype (Fig. 3).Type-1 markers (n = 13) showed significantly differentmethylation rate (P < 0.01, t-test) between HME andIME, but no difference (P > 0.01) between IME andLME. Type-2 markers (n = 22) showed significantly differ-ent methylation rate between HME and IME, and also be-tween IME and LME. Type-3 markers (n = 13) showed nodifferent methylation rate between HME and IME, but sig-nificant difference between IME and LME. Type-4 markers(n = 12) showed no difference both between HME andIME, and between IME and LME. Nineteen group-1 mar-kers consisted of 10 type-1 and 9 type-2 markers, whereas
Clin Cancer Res; 16(1) January 1, 2010
Researcon July clincancerres.aacrjournals.org Downloaded from
28 group-2 markers consisted mostly of type-2 (n = 13)and type-3 (n = 11) markers. These indicated that informa-tive methylation markers were classified into two groups:group 1 to distinguish HME from two other epigenotypes,and group 2 to distinguish IME and LME. Among 11CIMP-related markers, 7 were included in type 1; the otherfour were included in type 2, but three of the four exceptNEUROG1 showed very small difference of methylationrate between IME and LME, and therefore were very closeto type 1.Two-step panel method to predict colorectal cancer epigen-
otypes. To decide colorectal cancer epigenotypes easilywithout hierarchical clustering, we first extracted the bestdecision tree model by examining a random combinationof 60 markers by Weka software (Supplementary Fig. S3).This decision tree classified colorectal cancer with 91%accuracy by two steps: the first step was to extract HMEby one type-1 marker, LOX, and the second step was to
h. 20, 2018. © 2010 American A
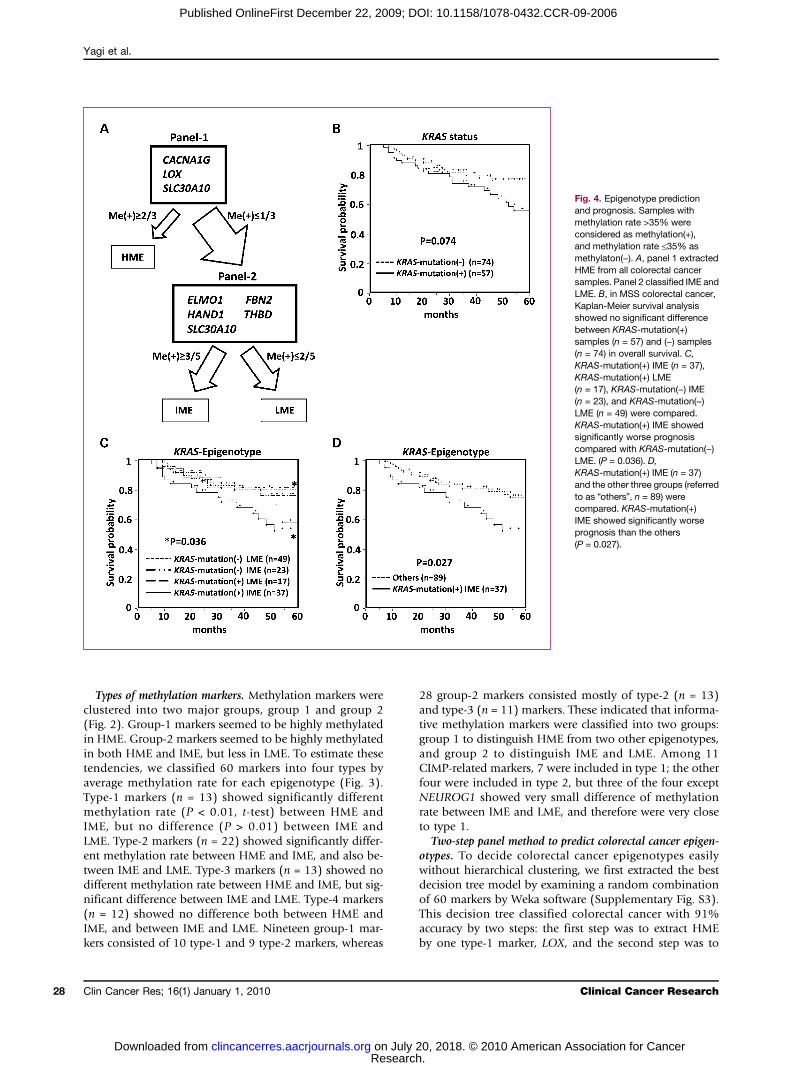
Fig. 4. Epigenotype predictionand prognosis. Samples withmethylation rate >35% wereconsidered as methylation(+),and methylation rate ≤35% asmethylaton(−). A, panel 1 extractedHME from all colorectal cancersamples. Panel 2 classified IME andLME. B, in MSS colorectal cancer,Kaplan-Meier survival analysisshowed no significant differencebetween KRAS-mutation(+)samples (n = 57) and (−) samples(n = 74) in overall survival. C,KRAS-mutation(+) IME (n = 37),KRAS-mutation(+) LME(n = 17), KRAS-mutation(−) IME(n = 23), and KRAS-mutation(−)LME (n = 49) were compared.KRAS-mutation(+) IME showedsignificantly worse prognosiscompared with KRAS-mutation(−)LME. (P = 0.036). D,KRAS-mutation(+) IME (n = 37)and the other three groups (referredto as “others”, n = 89) werecompared. KRAS-mutation(+)IME showed significantly worseprognosis than the others(P = 0.027).
Clinical Cancer Research
ssociation for Cancer

Epigenotypes of Colorectal Cancer
Published OnlineFirst December 22, 2009; DOI: 10.1158/1078-0432.CCR-09-2006
divide the remains into IME and LME using two type-2markers and two type-3 markers. As indicated by cluster-ing method and marker types, this decision tree con-firmed that three epigenotypes could be obtained byextracting HME at the first step and dividing the remainsinto IME and LME at the second step. To avoid high de-pendency on one marker in the decision tree method, wenext set up two marker panels consisting of three to fivemarkers by examining the entire combination of 60 mar-kers again (Fig. 4A). In panel 1, samples were regarded asHME if two or three markers among LOX, CACNA1G,and SLC30A10 were methylation(+). If none or onemarker was methylation(+) in panel 1, the samples wereproceeded to panel 2, in which samples were regarded asIME when three or more markers among ELMO1, FBN2,THBD, HAND1, and SLC30A10 were methylation(+), and
www.aacrjournals.org
Researcon July clincancerres.aacrjournals.org Downloaded from
samples were regarded as LME when two or less markerswere methylation(+). These marker panels were selectedas the best combination using a training set of 90 colo-rectal cancer samples, and validation was done using atest set of 41 colorectal cancer samples, giving 95% accu-racy in epigenotype prediction. Panel 1 markers consistedof one type-1 and two type-2 markers, whereas panel 2markers consisted of three type-2 and two type-3 markers(Figs. 3 and 4A).If all the 149 colorectal cancer samples were classified
by this panel method, there would be 19 HME, 63 IME,and 67 LME cases. Significant differences among three epi-genotypes were maintained in MSI status, BRAF mutation,KRAS mutation, and p53-IHC. Significant difference inKRAS mutation was also maintained between IME andLME (P = 3.9 × 10⁻⁵; Supplementary Table S2).
Fig. 5. Comparison of threecolorectal cancer epigenotypeswith classical CIMP status.A, colorectal cancer withmethylation(+) in ≥6 among 11CIMP markers (CACNA1G, IGF2,NEUROG1, RUNX3, SOCS1,hMLH1, p16INK4A,MINT1, MINT2,MINT17, and MINT31) wasconsidered as CIMP-high; 1 to 5 of11 as CIMP-low; and 0 of 11 asCIMP-negative. B, 113 among 149samples (76%) were classifiedinto the corresponding groups(CIMP-high to HME, CIMP-low toIME, and CIMP-negative toLME). C, genetic and clinicalcharacteristics were compared.Top, classical CIMP; middle,epigenotype decided bytwo-step panel method; bottom,epigenotype by clustering.Difference between CIMP-low andCIMP(−) or between IME and LMEwas analyzed by Fisher's exacttest (**, P < 0.01; *, P < 0.05).
Clin Cancer Res; 16(1) January 1, 2010 29
h. 20, 2018. © 2010 American Association for Cancer

Yagi et al.
30
Published OnlineFirst December 22, 2009; DOI: 10.1158/1078-0432.CCR-09-2006
Prediction of clinical outcome by epigenotype. In MSS co-lorectal cancer samples, unadjusted overall survival ofKRAS-mutation(+) colorectal cancer and KRAS-mutation(−)colorectal cancer was analyzed by Kaplan-Meier method,and showed no significant difference (P = 0.074, log-ranktest; Fig. 4B). If epigenotype information was added,KRAS-mutation(+) colorectal cancer with IME showedsignificantly worse prognosis (P = 0.027, log-rank test;Fig. 4C andD). When clinical factors shown in Table 1 werecompared between KRAS-mutation(+) colorectal cancerwith IME and the others, the mucinous component factorand the tumor location factor showed significant difference(P = 2.4 × 10⁻³ and 1.8 × 10⁻³, respectively). Survival anal-ysis by Cox proportional hazard model was also done;KRAS-mutation(+) colorectal cancer with IME showed sig-nificantly worse prognosis in unadjusted analysis (P =0.027) and in analyses adjusted for the mucinous factor,the location factor, and the both factors (P = 0.018,0.043, and 0.029, respectively). When analyzing colorectalcancer at stages III and IV only, the significant difference wasreproduced (Supplementary Fig. S4). By epigenotype infor-mation only, IME showed no significant difference in over-all survival compared with LME (P = 0.18, log-rank test).The rationale of the sample size is as follows. Consider-
ing the 5-year survival rate of colorectal cancer at each clin-ical stage in Japan10 and the number of samples at eachstage in this study, the average 5-year survival rate was cal-culated to be 49.8%. For both analyses between KRAS-mu-tation(+) colorectal cancer and KRAS-mutation(−)colorectal cancer, and between KRAS-mutation(+) colorec-tal cancer with IME and the others, the sample size of 121patients was calculated to be sufficient to provide a surviv-al rate difference of 25% with significance level of 0.05and power of 80% (29). The sample size used for thesetwo survival analyses were 131 and 126, respectively, bothof which were more than the required numbers.Comparison with classical CIMP classification. To com-
pare the three colorectal cancer epigenotypes with classicalCIMP status, we decided the classical CIMP status of 149colorectal cancer samples using 11 CIMP-related markers(Fig. 5A; refs. 14, 15). In this classification, 113 of 149(76%) colorectal cancer samples were grouped into thecorresponding group (Fig. 5B). There was no significantdifference in KRAS mutation [P = 0.086 among threeCIMP status; P = 0.12 between CIMP-low and CIMP(−);Fig. 5C, Supplementary Table S3]. As for clinical outcome,there was no significant difference in overall survival be-tween CIMP-low and CIMP(−) in MSS colorectal cancer(P = 0.32, log-rank test), nor by adding KRAS-mutationstatus (P = 0.45, log-rank test). CIMP determined by pre-viously reported sets of markers (set 1 with CACNA1G,IGF2, NUROG1, RUNX3, and SOCS1; ref. 15; set-2 withhMLH1, p16INK4A, MINT1, MINT2, and MINT31; refs.30, 31) were also analyzed (Supplementary Fig. S5). There
http://minds.jcqhc.or.jp
10Clin Cancer Res; 16(1) January 1, 2010
Researcon July clincancerres.aacrjournals.org Downloaded from
was no significant difference in KRAS-mutation betweenCIMP-low and CIMP(−), or in clinical outcome (datanot shown).
Discussion
In this study, colorectal cancer was epigenotyped using44 new methylation markers selected through genome-wide methylation and re-expression analyses as well as16 reported genes/loci. Colorectal cancer samples wereclustered into three distinct epigenotypes, HME, IME,and LME. Methylation markers were clustered intogroup-1 markers showing high methylation in HME andgroup-2 markers showing high methylation in HME andIME. Although MSS and MSI-H cell lines were used to se-lect new methylation markers, there was neither MSS-specific nor IME-specific methylation marker identified.Two-step classification was therefore required and devel-oped to classify three epigenotypes: the first step to extractHME using group-1 markers, and the second step to clas-sify IME and LME using group-2 markers.Previous CIMP-related markers were all categorized into
group-1 markers except NEUROG1, indicating that CIMP-related markers were suitable to distinguish HME fromothers. It was reported that BRAF mutation showed non-random pattern of CpG island methylation whereas KRASmutation showed random pattern, by analyzing 16 re-gions (32). In these 16 regions, 13 regions were analyzedin our study, and all the regions except NEUROG1 wereidentified as group-1 markers. It was considered that al-though BRAF-mutation(+) colorectal cancer should shownonrandom pattern of methylation of group-1 markers,KRAS-mutation(+) colorectal cancer should show onlyrare and random methylation of group-1 markers andwould show nonrandom pattern of methylation ofgroup-2 markers if analyzed.Shen et al. reported that colon cancer was classified into
three groups using methylation data of 27 regions, whichwere constructed using four different methylation de-tection methods: 13 regions by pyrosequencing, 7 bycombined bisulfite restriction analysis, 6 by methylatedCpG island amplification, and 1 by methylation-specificPCR (17). In our study, methylation data were obtainedby a single, highly quantitative method, and two-way hi-erarchical clustering analysis showed clearly not only theexistence of three distinct epigenotypes, but also two clus-ters of methylation markers. Correlation of our epigen-otypes with MSI status, and BRAF and KRAS mutationwas similar to Shen's CIMPs, but our study showed no cor-relation of LME with p53 status. This might be due to thedifference between sequencing and immunohistochemis-try. Although some reported that positivity by immuno-histochemistry correlated with the presence of p53mutation (18, 33), others reported that immunohisto-chemistry was not a reliable technique for detectingp53 mutation (34). The second possibility is that ourIME and their CIMP-2 might be different clusters. Infact, they used several MINT loci to detect CIMP-2, by
Clinical Cancer Research
h. 20, 2018. © 2010 American Association for Cancer

Epigenotypes of Colorectal Cancer
Published OnlineFirst December 22, 2009; DOI: 10.1158/1078-0432.CCR-09-2006
analyzing methylation using a competitive PCR method,methylated CpG island amplification. MINT loci showedno or very small difference in methylation rate betweenIME and LME and belonged to group-1 markers in ourstudy, and so were considered to be difficult to classifyIME and LME.In the panel method, panel 1 consisted of three group-1
markers, CACNA1G, LOX, and SLC30A10. CACNA1Gpossesses MINT31, one of the original CIMP markers byToyota et al. (14), at 2 kb upstream of its transcriptionstart site, and also was used as a CIMP-related marker byWeisenberger et al. (15). LOX is a tumor suppressor geneinactivated by methylation in mammalian cancer (11, 35).Panel 2 consisted of four group-2 markers (ELMO1, FBN2,THBD, and HAND1) and SLC30A10 again. Hypermethyla-tion of FBN2, THBD, and HAND1 was reported in cancersother than colorectal cancer, such as pancreatic, gastric,and non–small cell lung cancer (35–37), and the antipro-liferative effect of THBD was reported in melanoma cells(38). ELMO1 was reported to have a role in promotingcancer cell invasion in glioma cells (39), but its promoterhypermethylation was not previously reported. SLC30A10belonged to type 2, showing significant difference inmethylation rate between HME and IME and betweenIME and LME, so it was acceptable to use this marker inboth panel 1 and panel 2.It is interesting that BRAF-mutation(+) and KRAS-
mutation(+) colorectal cancers clearly showed differentepigenotypes, although the reason is unknown. There aresome possibilities. First, activation of these oncogenesitself may induce different epigenetic alterations on agenome-wide scale. In fact, silencing of genes occurred inKras-transformed NIH3T3 but not in untransformedNIH3T3, and essential effectors for the epigenetic genesilencing were reported (40). In addition, oncogene activa-tion in normal cells is known to induce oncogene-inducedsenescence forming senescence-associated heterochromat-ic foci (41), where regions with repression mark, such ashistone H3 lysine K9 methylation, were found to gather(42). Dynamic epigenetic changes including histone mod-ification and DNA methylation might be induced in thisprocess. Second, oncogene activation itself may not causeDNA methylation, but gene inactivation by methylationmight be required to escape oncogene-induced senescenceto be cancer, as disruption of p16 and/or p53 leads to es-cape from oncogene-induced senescence (43). IGFBP7,whose methylation was reported to be essential to escapefrom oncogene-induced senescence in BRAF-mutated mel-anoma cells (44), showed significantly higher methylationrate in HME colorectal cancer (Fig. 3). IGFBP3, reported tobe induced in replicatively senescent human umbilicalvein endothelial cells (45), showed high methylation ratein IME colorectal cancer (Fig. 3). Although colon epitheli-um is different from melanocytes and endothelial cells,these data and reports suggested that Raf and Ras activa-tion may perhaps require different gene inactivation tobe cancer, which might result in different epigenotypes,i.e., HME and IME.
www.aacrjournals.org
Researcon July clincancerres.aacrjournals.org Downloaded from
Whereas previous meta-analysis showed that MSS colo-rectal cancer had worse prognosis than MSI-H colorectalcancer (46), which was correlated with HME and BRAF-mutation(+), our interest was whether epigenotypes andKRAS-mutation status could predict prognosis of MSScolorectal cancer. Correlation between prognosis andKRAS-mutation itself is controversial; KRAS-mutation wasindicative of worse prognosis in 13 reports, but not in 10reports (47). In our study, there was no significant differ-ence in survival rate between KRAS-mutation(+) andKRAS-mutation(−) in MSS colorectal cancer (Fig. 4B).Whereas KRAS-mutation highly correlated to IME, KRAS-mutation(+) colorectal cancer with IME significantly cor-related with poorer survival (Fig. 4C and D). Although theprognostic significance of IME needs to be further investi-gated by additional studies, including a larger cohort ofpatients, this poor prognosis was observed under therapywithout anti–epidermal growth factor receptor (EGFR) oranti–vascular endothelial growth factor antibody. The an-ti-EGFR antibody cetuximab (Erbitux) was recently re-ported to be effective on KRAS-mutation(−) colorectalcancer, but not on KRAS-mutation(+) colorectal cancer(48), suggesting that chemotherapy different from anti-EGFR antibody should be developed especially forKRAS-mutation(+) IME colorectal cancer. Identificationof the existence of IME and its strong correlation toKRAS-mutation(+) is considered to be useful in under-standing the molecular genesis of colorectal cancer in thisunfavorable group, and it might be possible to develop anovel target therapy based on epigenetic alteration and/oroncogene mutation.In conclusion, colorectal cancer was clustered into three
major epigenotypes with different genetic characteristics,suggesting different molecular genesis of colorectal cancer.Methylation markers were clustered into two majorgroups, and a two-step panel method to predict colorectalcancer epigenotypes was constructed. IME with KRAS mu-tation showed significantly worse prognosis in MSS colo-rectal cancer.
Disclosure of Potential Conflicts of Interest
The authors have applied for a patent for a methylationmarker used in colorectal cancer detection.
Acknowledgments
We thank Dr. Shumpei Ishikawa and Dr. KeisukeMatsusaka for pathological diagnosis, and Kaoru Nakano,Hiroko Meguro and Kaori Shiina for technical assistance.
Grant Support
Grants-in-Aid for Scientific Research (B) 19390345 (A.Kaneda) and (S) 20101006 (H. Aburatani), by a grantfor Translational Systems Biology and Medicine Initiative(TSBMI) from the Ministry of Education, Culture, Sports,
Clin Cancer Res; 16(1) January 1, 2010 31
h. 20, 2018. © 2010 American Association for Cancer

Yagi et al.
32
Published OnlineFirst December 22, 2009; DOI: 10.1158/1078-0432.CCR-09-2006
Science and Technology of Japan, and by a Grant-in-Aidfor Cancer Research from the Ministry of Health, Labourand Welfare.The costs of publication of this article were defrayed
in part by the payment of page charges. This article
Clin Cancer Res; 16(1) January 1, 2010
Researcon July clincancerres.aacrjournals.org Downloaded from
must therefore be hereby marked advertisement in accor-dance with 18 U.S.C. Section 1734 solely to indicatethis fact.Received 7/29/09; revised 9/18/09; accepted 9/27/09;
published OnlineFirst 12/22/09.
References
1. Parkin DM, Bray F, Ferlay J, Pisani P. Global cancer statistics, 2002.CA Cancer J Clin 2005;55:74–108.2. Hanahan D, Weinberg RA. The hallmarks of cancer. Cell 2000;100:
57–70.3. Grady WM, Carethers JM. Genomic and epigenetic instability in
colorectal cancer pathogenesis. Gastroenterology 2008;135:1079–99.
4. Jones PA, Baylin SB. The epigenomics of cancer. Cell 2007;128:683–92.
5. Feinberg AP, Ohlsson R, Henikoff S. The epigenetic progenitor originof human cancer. Nat Rev Genet 2006;7:21–33.
6. Vogelstein B, Fearon ER, Hamilton SR, et al. Genetic alterationsduring colorectal-tumor development. N Engl J Med 1988;319:525–32.
7. Lengauer C, Kinzler KW, Vogelstein B. Genetic instability in colorec-tal cancers. Nature 1997;386:623–7.
8. Feinberg AP, Tycko B. The history of cancer epigenetics. Nat RevCancer 2004;4:143–53.
9. Yoshikawa H, Matsubara K, Qian GS, et al. SOCS-1, a negative reg-ulator of the JAK/STAT pathway, is silenced by methylation in humanhepatocellular carcinoma and shows growth-suppression activity.Nat Genet 2001;28:29–35.
10. Suzuki H, Watkins DN, Jair KW, et al. Epigenetic inactivation of SFRPgenes allows constitutive WNT signaling in colorectal cancer. NatGenet 2004;36:417–22.
11. Kaneda A, Wakazono K, Tsukamoto T, et al. Lysyl oxidase is a tumorsuppressor gene inactivated by methylation and loss of heterozygos-ity in human gastric cancers. Cancer Res 2004;64:6410–5.
12. Yu L, Liu C, Vandeusen J, et al. Global assessment of promotermethylation in a mouse model of cancer identifies ID4 as a puta-tive tumor-suppressor gene in human leukemia. Nat Genet 2005;37:265–74.
13. Ushijima T. Detection and interpretation of altered methylation pat-terns in cancer cells. Nat Rev Cancer 2005;5:223–31.
14. Toyota M, Ahuja N, Ohe-Toyota M, Herman JG, Baylin SB, Issa JP.CpG island methylator phenotype in colorectal cancer. Proc NatlAcad Sci U S A 1999;96:8681–6.
15. Weisenberger DJ, Siegmund KD, Campan M, et al. CpG islandmethylator phenotype underlies sporadic microsatellite instabilityand is tightly associated with BRAF mutation in colorectal cancer.Nat Genet 2006;38:787–93.
16. Ogino S, Kawasaki T, Kirkner GJ, Loda M, Fuchs CS. CpG islandmethylator phenotype-low (CIMP-low) in colorectal cancer: possibleassociations with male sex and KRAS mutations. J Mol Diagn 2006;8:582–8.
17. Shen L, Toyota M, Kondo Y, et al. Integrated genetic and epigeneticanalysis identifies three different subclasses of colon cancer. ProcNatl Acad Sci U S A 2007;104:18654–9.
18. Ogino S, Goel A. Molecular classification and correlates in colorectalcancer. J Mol Diagn 2008;10:13–27.
19. Yamashita K, Dai T, Dai Y, Yamamoto F, Perucho M. Genetics super-sedes epigenetics in colon cancer phenotype. Cancer Cell 2003;4:121–31.
20. Hayashi H, Nagae G, Tsutsumi S, et al. High-resolution mapping ofDNA methylation in human genome using oligonucleotide tiling array.Hum Genet 2007;120:701–11.
21. Camps J, Morales C, Prat E, et al. Genetic evolution in colon can-cer KM12 cells and metastatic derivates. Int J Cancer 2004;110:869–74.
22. Gayet J, Zhou XP, Duval A, et al. Extensive characterization of genet-
ic alterations in a series of human colorectal cancer cell lines. Onco-gene 2001;20:5025–32.
23. Yuan Z, Sotsky Kent T, Weber TK. Differential expression of DOC-1in microsatellite-unstable human colorectal cancer. Oncogene 2003;22:6304–10.
24. Kaneda A, Tsukamoto T, Takamura-Enya T, et al. Frequent hypo-methylation in multiple promoter CpG islands is associated withglobal hypomethylation, but not with frequent promoter hypermethy-lation. Cancer Sci 2004;95:58–64.
25. Ehrich M, Nelson MR, Stanssens P, et al. Quantitative high-throughput analysis of DNA methylation patterns by base-specificcleavage and mass spectrometry. Proc Natl Acad Sci U S A 2005;102:15785–90.
26. Coolen MW, Statham AL, Gardiner-Garden M, Clark SJ. Genomicprofiling of CpG methylation and allelic specificity using quantitativehigh-throughput mass spectrometry: critical evaluation and improve-ments. Nucleic Acids Res 2007;35:e119.
27. Ishikubo T, Nishimura Y, Yamaguchi K, et al. The clinical features ofrectal cancers with high-frequency microsatellite instability (MSI-H)in Japanese males. Cancer Lett 2004;216:55–62.
28. Akagi K, Uchibori R, Yamaguchi K, Kurosawa K, Tanaka Y, Kozu T.Characterization of a novel oncogenic K-ras mutation in colon can-cer. Biochem Biophys Res Commun 2007;352:728–32.
29. Machin D, Campell M, Fayers P, Pinol A. Comparing two survivalcurves. In: Machin D, Campell M, Fayers P, Pinol A, editors. Samplesize tables for clinical studies. London: Blackwell Science; 1997, p.174–253.
30. Samowitz WS, Albertsen H, Herrick J, et al. Evaluation of a large,population-based sample supports a CpG island methylator pheno-type in colon cancer. Gastroenterology 2005;129:837–45.
31. Barault L, Charon-Barra C, Jooste V, et al. Hypermethylator pheno-type in sporadic colon cancer: study on a population-based series of582 cases. Cancer Res 2008;68:8541–6.
32. Nosho K, Irahara N, Shima K, et al. Comprehensive biostatisti-cal analysis of CpG island methylator phenotype in colorectalcancer using a large population-based sample. PLoS One 2008;3:e3698.
33. Hall PA, McCluggage WG. Assessing p53 in clinical contexts: un-learned lessons and new perspectives. J Pathol 2006;208:1–6.
34. de Jong KP, Gouw AS, Peeters PM, et al. P53 mutation analysisof colorectal liver metastases: relation to actual survival, angio-genic status, and p53 overexpression. Clin Cancer Res 2005;11:4067–73.
35. Kaneda A, Kaminishi M, Yanagihara K, Sugimura T, Ushijima T. Iden-tification of silencing of nine genes in human gastric cancers. CancerRes 2002;62:6645–50.
36. Chen H, Suzuki M, Nakamura Y, et al. Aberrant methylation of FBN2in human non-small cell lung cancer. Lung Cancer 2005;50:43–9.
37. Hagihara A, Miyamoto K, Furuta J, et al. Identification of 27 5′ CpGislands aberrantly methylated and 13 genes silenced in humanpancreatic cancers. Oncogene 2004;23:8705–10.
38. Zhang Y, Weiler-Guettler H, Chen J, et al. Thrombomodulin modu-lates growth of tumor cells independent of its anticoagulant activity.J Clin Invest 1998;101:1301–9.
39. Jarzynka MJ, Hu B, Hui KM, et al. ELMO1 and Dock180, a bipartiteRac1 guanine nucleotide exchange factor, promote human gliomacell invasion. Cancer Res 2007;67:7203–11.
40. Gazin C, Wajapeyee N, Gobeil S, Virbasius CM, Green MR. Anelaborate pathway required for Ras-mediated epigenetic silencing.Nature 2007;449:1073–7.
Clinical Cancer Research
h. 20, 2018. © 2010 American Association for Cancer

Epigenotypes of Colorectal Cancer
Published OnlineFirst December 22, 2009; DOI: 10.1158/1078-0432.CCR-09-2006
41. Serrano M, Lin AW, McCurrach ME, Beach D, Lowe SW. Oncogenicras provokes premature cell senescence associated with accumula-tion of p53 and p16INK4a. Cell 1997;88:593–602.
42. Narita M, Nunez S, Heard E, et al. Rb-mediated heterochromatin for-mation and silencing of E2F target genes during cellular senescence.Cell 2003;113:703–16.
43. Sharpless NE, DePinho RA. Cancer: crime and punishment. Nature2005;436:636–7.
44. Wajapeyee N, Serra RW, Zhu X, Mahalingam M, Green MR. Onco-genic BRAF induces senescence and apoptosis through pathwaysmediated by the secreted protein IGFBP7. Cell 2008;132:363–74.
45. Kim KS, Kim MS, Seu YB, Chung HY, Kim JH, Kim JR. Regulation
www.aacrjournals.org
Researcon July clincancerres.aacrjournals.org Downloaded from
of replicative senescence by insulin-like growth factor-binding pro-tein 3 in human umbilical vein endothelial cells. Aging Cell 2007;6:535–45.
46. Popat S, Hubner R, Houlston RS. Systematic review of microsatelliteinstability and colorectal cancer prognosis. J Clin Oncol 2005;23:609–18.
47. Castagnola P, Giaretti W. Mutant KRAS, chromosomal instability andprognosis in colorectal cancer. Biochim Biophys Acta 2005;1756:115–25.
48. Karapetis CS, Khambata-Ford S, Jonker DJ, et al. K-ras mutationsand benefit from cetuximab in advanced colorectal cancer. N Engl JMed 2008;359:1757–65.
Clin Cancer Res; 16(1) January 1, 2010 33
h. 20, 2018. © 2010 American Association for Cancer

2010;16:21-33. Published OnlineFirst December 22, 2009.Clin Cancer Res Koichi Yagi, Kiwamu Akagi, Hiroshi Hayashi, et al. CancerThree DNA Methylation Epigenotypes in Human Colorectal
Updated version
10.1158/1078-0432.CCR-09-2006doi:
Access the most recent version of this article at:
Material
Supplementary
http://clincancerres.aacrjournals.org/content/suppl/2010/01/07/1078-0432.CCR-09-2006.DC1
Access the most recent supplemental material at:
Cited articles
http://clincancerres.aacrjournals.org/content/16/1/21.full#ref-list-1
This article cites 28 articles, 4 of which you can access for free at:
Citing articles
http://clincancerres.aacrjournals.org/content/16/1/21.full#related-urls
This article has been cited by 23 HighWire-hosted articles. Access the articles at:
E-mail alerts related to this article or journal.Sign up to receive free email-alerts
Subscriptions
Reprints and
To order reprints of this article or to subscribe to the journal, contact the AACR Publications
Permissions
Rightslink site. Click on "Request Permissions" which will take you to the Copyright Clearance Center's (CCC)
.http://clincancerres.aacrjournals.org/content/16/1/21To request permission to re-use all or part of this article, use this link
Research. on July 20, 2018. © 2010 American Association for Cancerclincancerres.aacrjournals.org Downloaded from
Published OnlineFirst December 22, 2009; DOI: 10.1158/1078-0432.CCR-09-2006