Embed Size (px)
DESCRIPTION
Timing analysis of unusual GRB 090709A observed by Suzaku Wide-band All-sky Monitor. Wataru.Iwakiri (Saitama university). - PowerPoint PPT Presentation
Citation preview
Timing analysis of unusual GRB 090709A observed by Suzaku Wide-band All-sky
Monitor
Wataru.Iwakiri (Saitama university)
Tuneyoshi Kamae (SLAC/KIPAC), Masanori Ohno (ISAS), Yukikatsu Terada, Makoto.S.Tashiro (Saitama Univ.), Yujin.E.Nakagawa (RIKEN), Atsumasa.Yoshida, Kazutaka Yamaoka (Aoyama gakuin Univ.) , Kazuo Makishima (RIKEN & Univ. of Tokyo) and Suzaku-WAM team
2
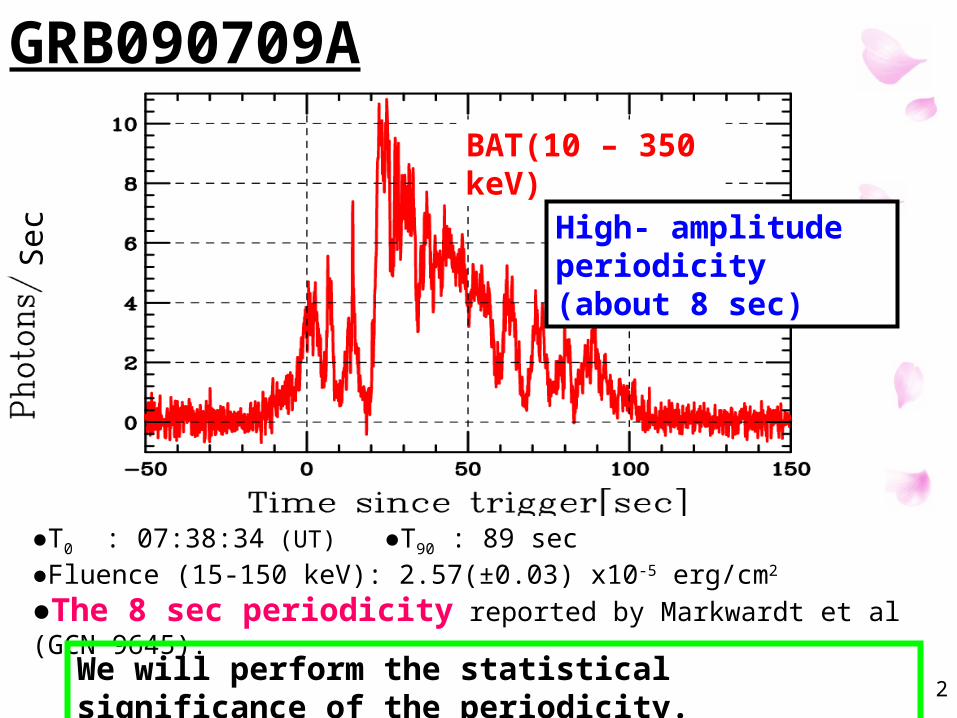
GRB090709A
●T0 : 07:38:34 (UT) ●T90 : 89 sec ●Fluence (15-150 keV): 2.57(±0.03) x10-5 erg/cm2
●The 8 sec periodicity reported by Markwardt et al (GCN 9645).
BAT(10 – 350 keV)
High- amplitude periodicity (about 8 sec)
We will perform the statistical significance of the periodicity.
Sec
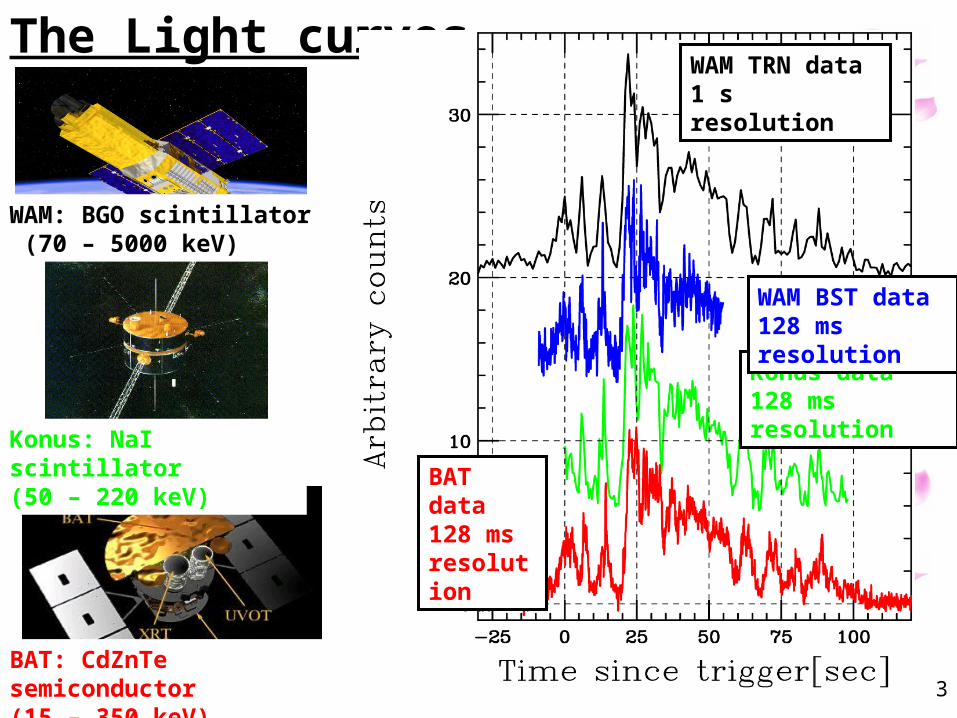
3BAT: CdZnTe semiconductor(15 – 350 keV)
WAM: BGO scintillator (70 – 5000 keV)
Konus: NaI scintillator (50 – 220 keV)
The Light curvesWAM TRN data 1 s resolution
Konus data 128 ms resolution
BAT data 128 ms resolution
WAM BST data 128 ms resolution
44
WAM TRN data 1 s resolution
WAM BST data 128 ms resolution
Konus data 128 ms resolution
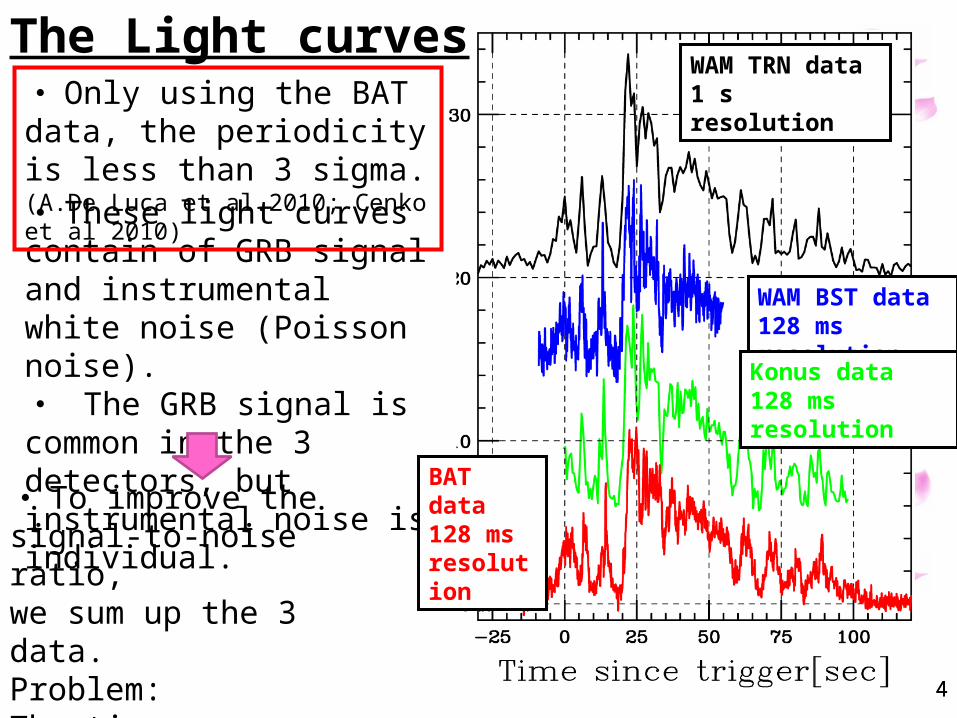
The Light curves
・ These light curves contain of GRB signal and instrumental white noise (Poisson noise). ・ The GRB signal is common in the 3 detectors, but instrumental noise is individual.
・ To improve the signal-to-noise ratio, we sum up the 3 data. Problem:The time resolution and data length is different.
BAT data 128 ms resolution
・ Only using the BAT data, the periodicity is less than 3 sigma. (A.De Luca et al.2010; Cenko et al 2010)
5
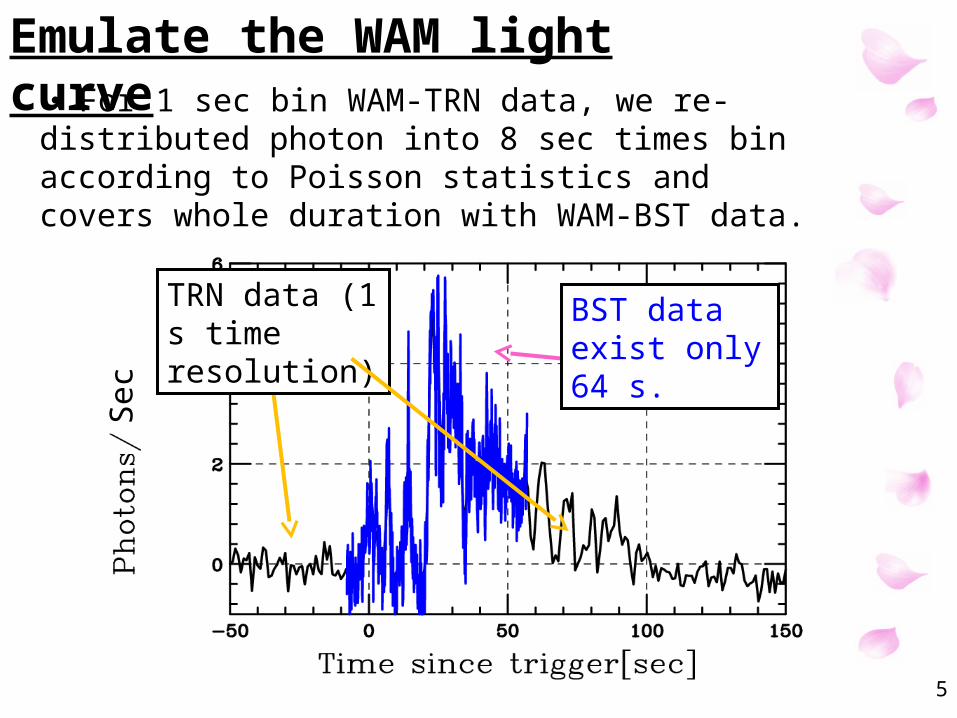
Emulate the WAM light curve・ For 1 sec bin WAM-TRN data, we re-distributed photon into 8 sec times bin according to Poisson statistics and covers whole duration with WAM-BST data.
BST data exist only 64 s.
TRN data (1 s time resolution)
Sec

6
Emulate the WAM light curve
BST data exist only 64 s.
Emulate data (128 ms time resolution)
・ For 1 sec bin WAM-TRN data, we re-distributed photon into 8 sec times bin according to Poisson statistics and covers whole duration with WAM-BST data.
Sec
7
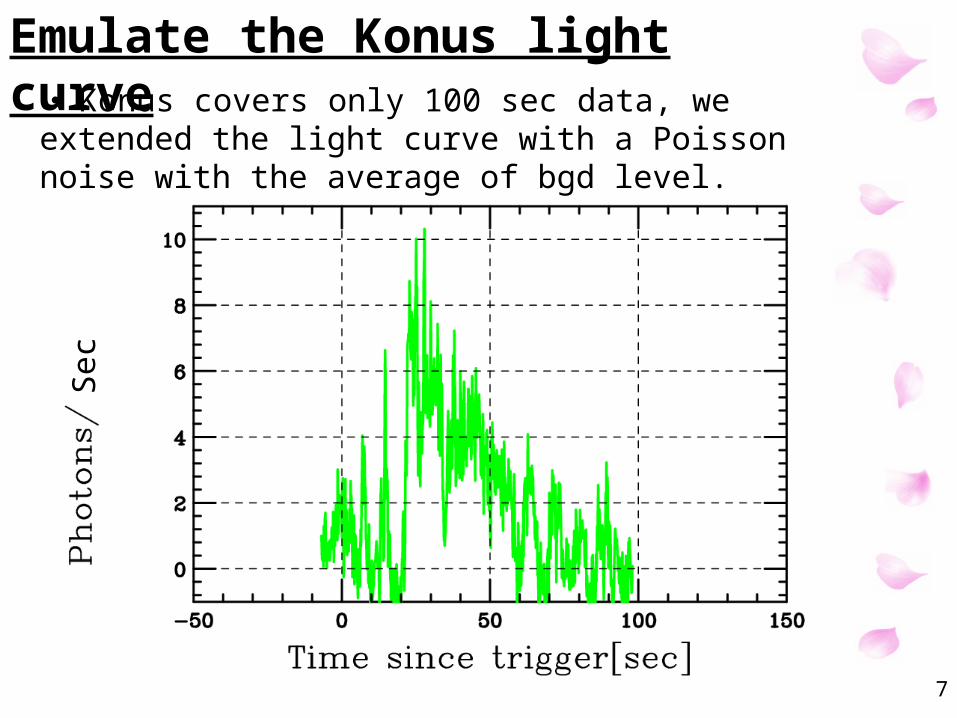
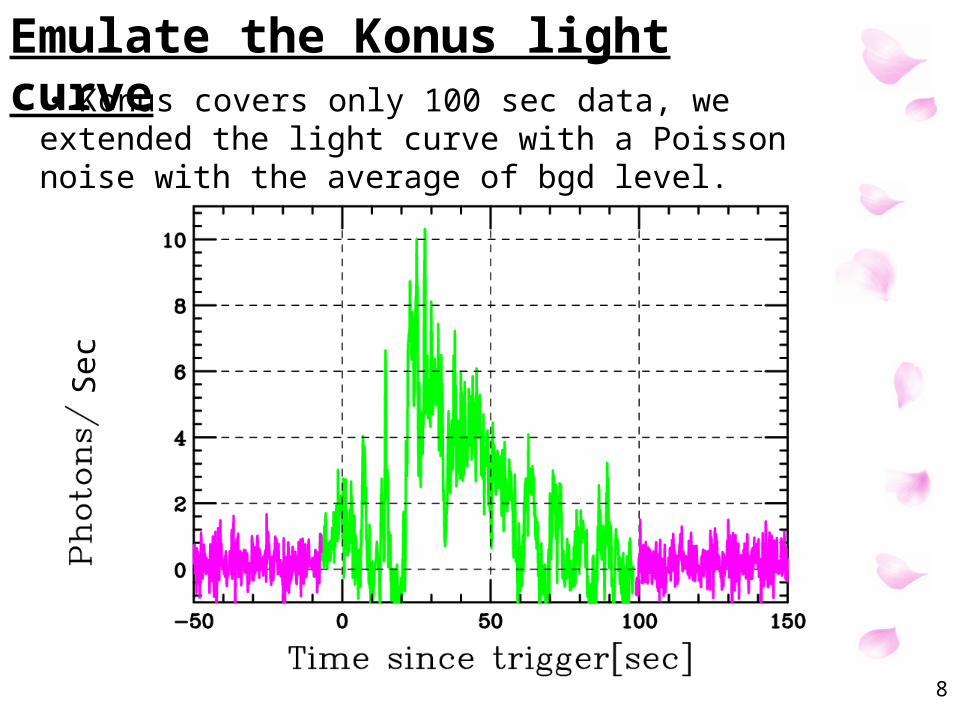
Emulate the Konus light curve・ Konus covers only 100 sec data, we extended the light curve with a Poisson noise with the average of bgd level.
Sec
8
Emulate the Konus light curve・ Konus covers only 100 sec data, we extended the light curve with a Poisson noise with the average of bgd level.
Sec
9
WAM v.s BAT
Cross correlation
WAM v.s Konus
BAT v.s Konus
00.
90.
90
0.9
0
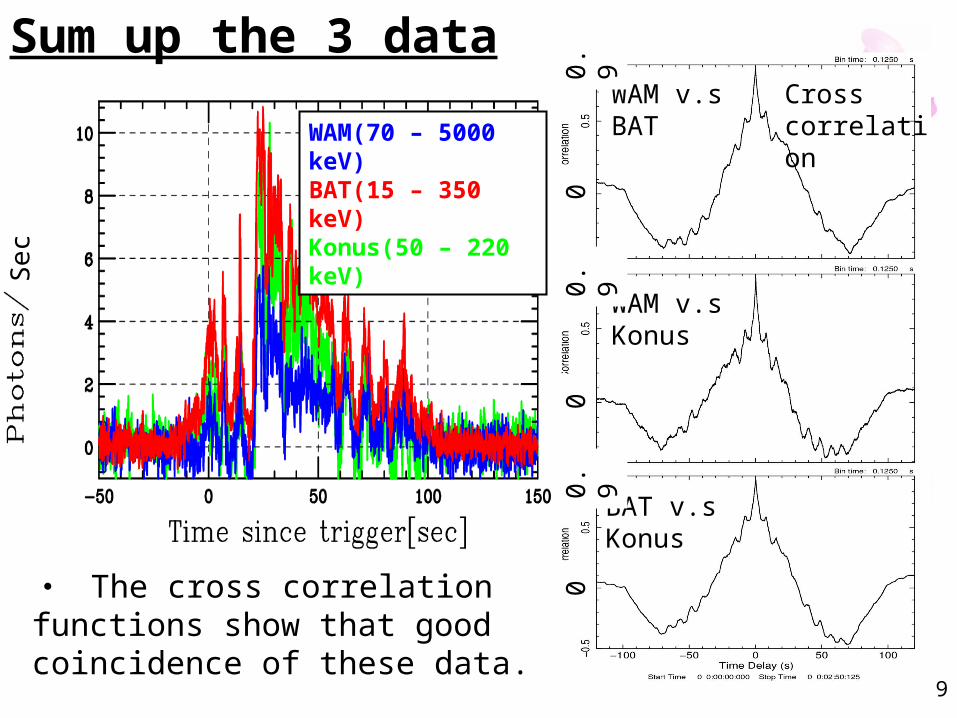
Sum up the 3 data
WAM(70 – 5000 keV)BAT(15 – 350 keV)Konus(50 – 220 keV)
・ The cross correlation functions show that good coincidence of these data.
Sec
10
WAM v.s BAT
Cross correlation
WAM v.s Konus
BAT v.s Konus
00.
90.
90
0.9
0
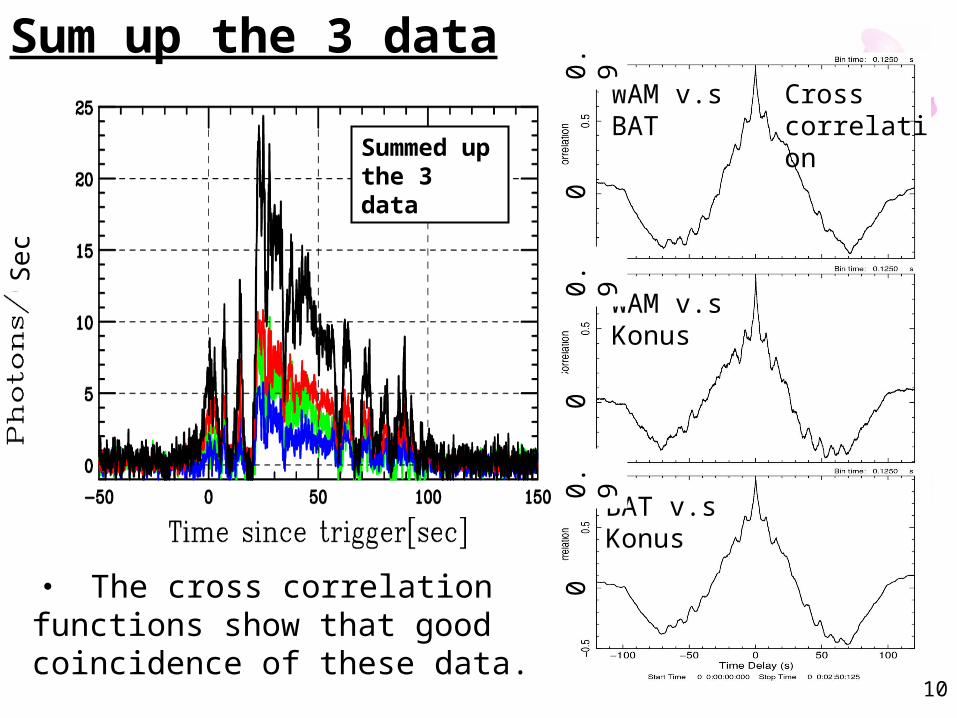
Sum up the 3 data
WAM(50 – 5000 keV)BAT(15 – 300 keV)Konus(10 – 770 keV)
Summed up the 3 data
・ The cross correlation functions show that good coincidence of these data.
Sec
11
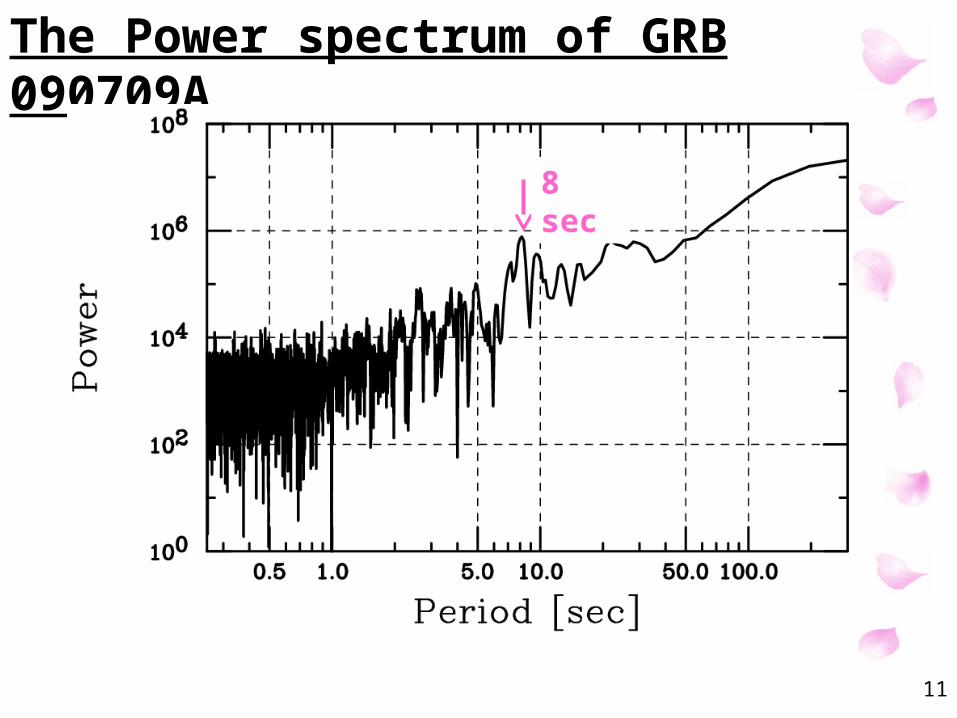
The Power spectrum of GRB 090709A
8 sec
12
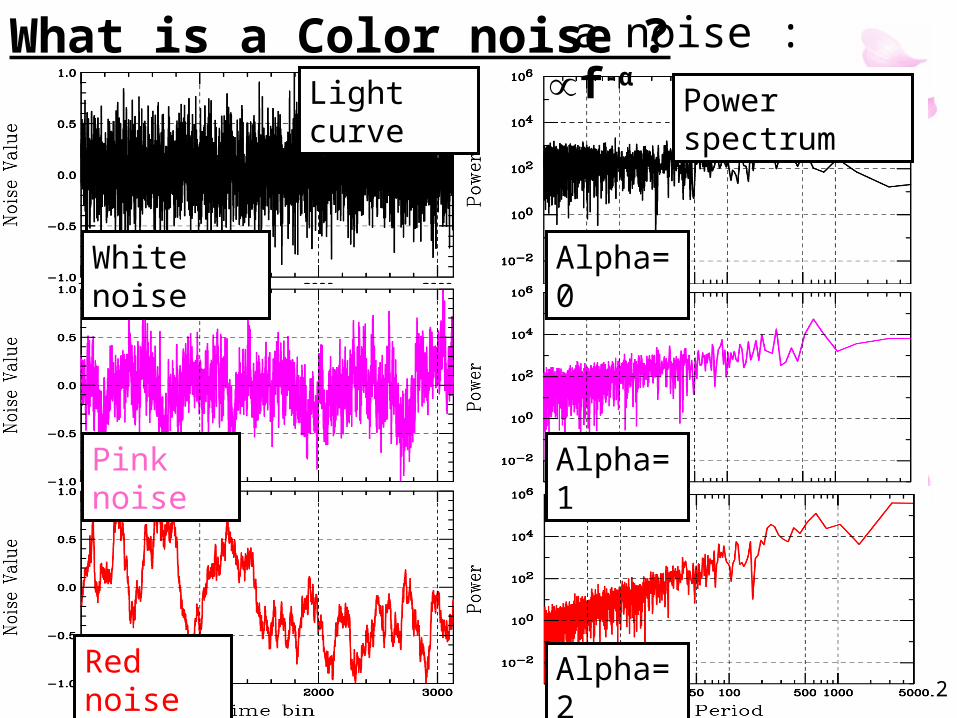
What is a Color noise ?Power spectrum
White noise
Pink noise
Red noise
Alpha=0
Alpha=1
Alpha=2
a noise : ∝ f-α
Light curve
13
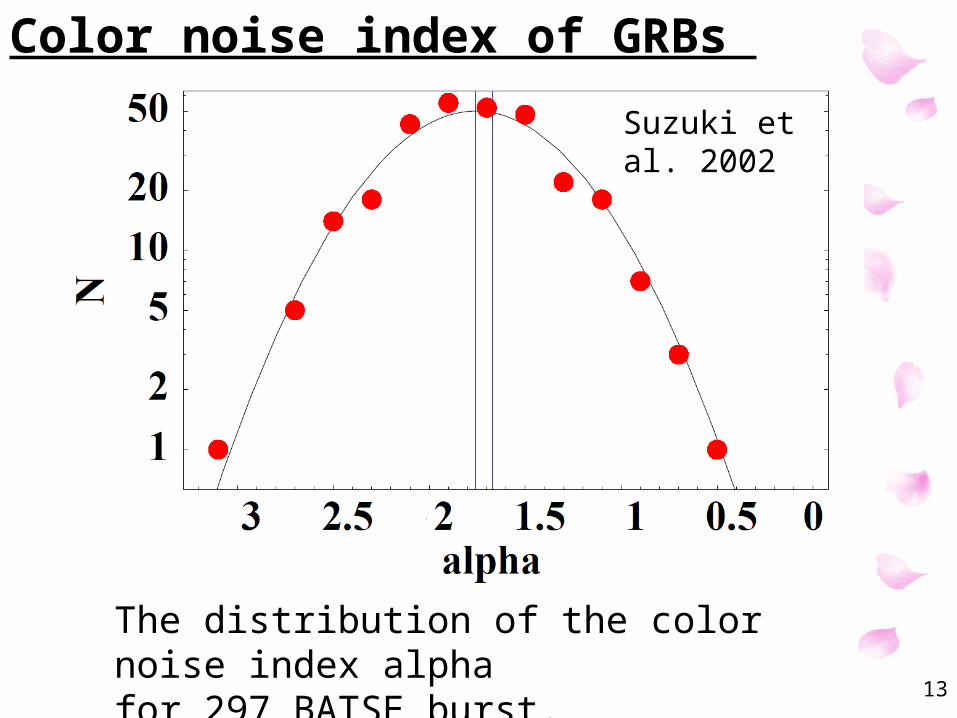
Color noise index of GRBs
The distribution of the color noise index alpha for 297 BATSE burst.
Suzuki et al. 2002
14
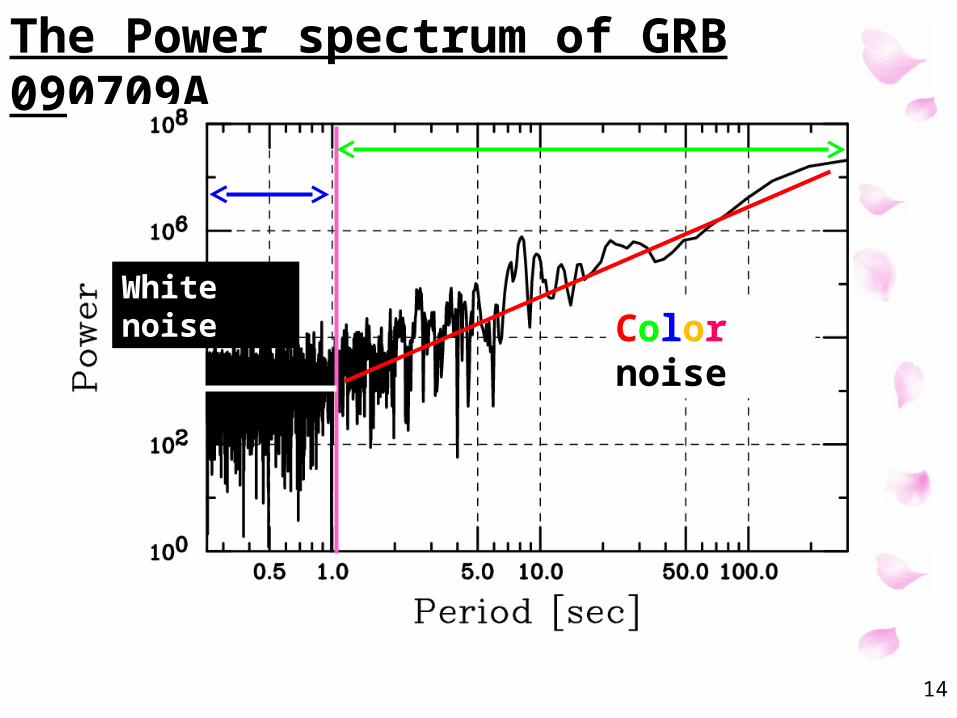
The Power spectrum of GRB 090709A
White noiseColor noise
15
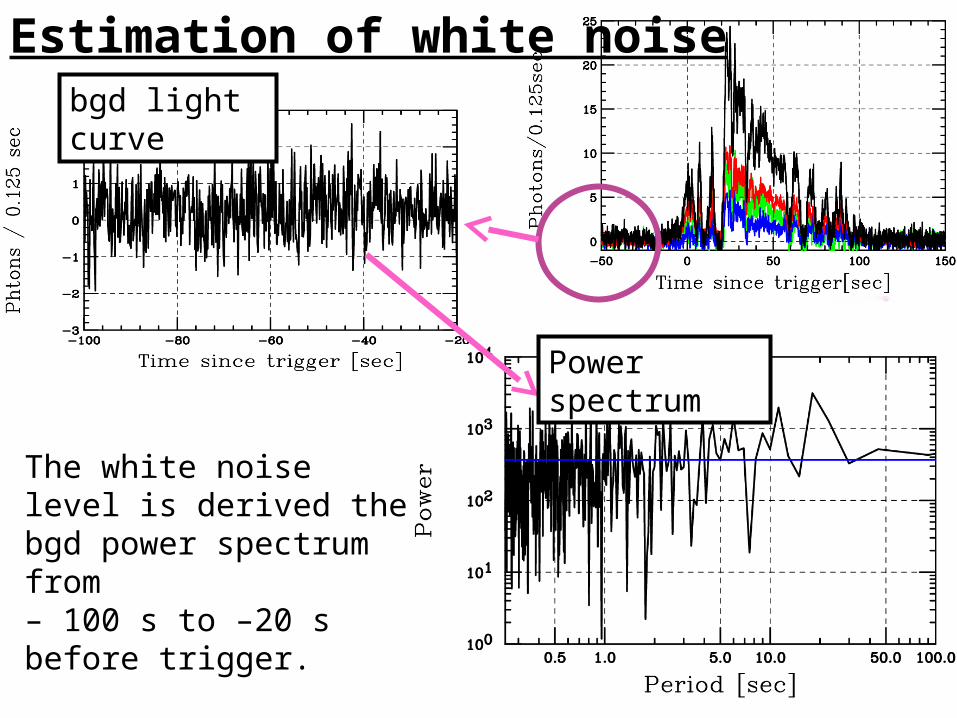
Estimation of white noisebgd light curve
Power spectrum
The white noise level is derived the bgd power spectrum from – 100 s to –20 s before trigger.
16
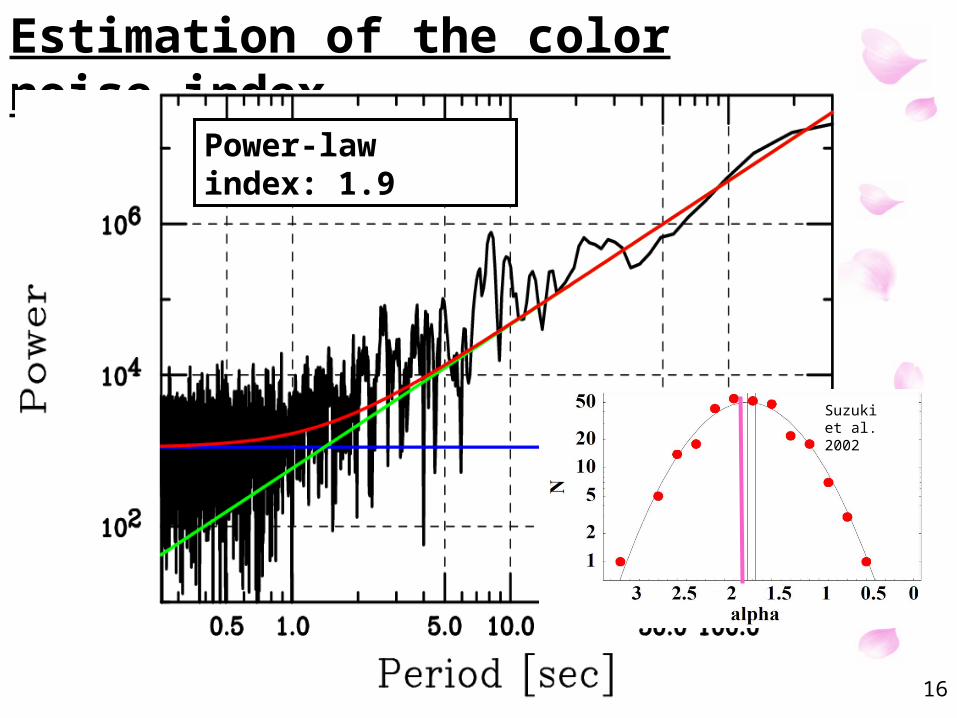
Estimation of the color noise index
Power-law index: 1.9
Suzuki et al. 2002

17
Comparison the simulation and observation Green:average of 1000 times simulated dataMagenta:99.85 % level of deviationRed: 99.9% level
Green:deviation of 1000 times simulated dataBlue:deviation of observed data
Period [sec]
Pow
er
Null hypothesis probability is about 0.1 %
18
Discussion • A period of 8 sec is comparable to typical
time scale of soft gamma-ray repeater in our galaxy.
• However, we see no evidence of periodic oscillation in the afterglow (A.De Luca et al
2010) but see features we often see from GRB afterglows.
(See Nakagawa et al. Poster 064 in this conference; A.De Luca et al 2010; Cenko et al 2010) .
• The origin of the periodicity is a GRB inner engine ??

• GRB090709A detected by WAM, BAT, and Konus.
• We summed up 3 detector’s data to obtain good signal-to-noise ratio data by emulation of the light curve.
• Comparison the 1000 times color noise simulation and observed power spectrum density, we detected the 8 sec periodic signal with the null hypothesis probability of 0.1 %.
19
Summary