Embed Size (px)
Citation preview

Title Evaluation of column hardware for chelating compounds in liquidchromatography-mass spectrometry( 本文(Fulltext) )
Author(s) 坂牧, 寛
Report No.(DoctoralDegree) 博士(工学) 甲第472号
Issue Date 2015-03-25
Type 博士論文
Version ETD
URL http://hdl.handle.net/20.500.12099/51030
※この資料の著作権は、各資料の著者・学協会・出版社等に帰属します。

i
Evaluation of column hardware for chelating compounds
in liquid chromatography-mass spectrometry
Hiroshi Sakamaki
March 2015

i
Evaluation of column hardware for chelating compounds
in liquid chromatography-mass spectrometry
液体クロマトグラフィー質量分析法におけるキレート化合
物のためのカラム材料の評価
Hiroshi Sakamaki
Material Engineering Division
Graduate School of Engineering
Gifu University
JAPAN
March 2015

i
Evaluation of column hardware for chelating compounds
in liquid chromatography-mass spectrometry
A dissertation submitted to the Gifu University
in partial fulfillment of the requirements for
the degree of Doctor of Philosophy in Material Engineering
By
Hiroshi Sakamaki
March 2015

i
Contents
page
Contents i
List of abbreviations iv
Summary vi
Chapter 1 Introduction 1
1.1 High performance liquid chromatography 1
1.2 Liquid chromatography-mass spectrometry 2
1.3 Kind of column hardware 3
1.4 Chelating compounds on liquid chromatography-mass spectrometry 4
1.5 Carryover in bioanalysis 5
1.6 Objectives of present research 6
1.7 References 7
Chapter 2 Evaluation of column hardware on liquid chromatography-mass
spectrometry of phosphorylated compounds 10
2.1 Introduction 10
2.2 Experimental 12
2.2.1 Reagents and chemicals 12
2.2.2 Sample treatment 15
2.2.3 Chromatographic and mass spectrometric conditions 15
2.2.3.1 FAD 16
2.2.3.2 LPA 16
2.2.3.3 AMPs 16
2.2.3.4 Phosphorylated peptides 17

ii
2.2.4 Combinations of chromatographic tubes and frits for column 17
2.3 Results and discussions 20
2.3.1 Evaluation of the prepared columns and the liquid chromatography- mass spectrometry system with non-phosphorylated compounds
20
2.3.2 Comparison of chromatographic tubes 23
2.3.3 Effect of frits 29
2.4 Conclusions 37
2.5 References 38
Chapter 3 Evaluation of column carryover of phosphorylated peptides and
fumonisins by duplicated solvent gradient method in liquid chromatography-tandem mass spectrometry
40
3.1 Introduction 40
3.2 Experimental 43
3.2.1 Reagents and chemicals 43
3.2.2 Sample treatment 45
3.2.3 Chromatographic and mass spectrometric conditions 45
3.2.4 The column hardware 48
3.2.5 Carryover by duplicated solvent gradient method 48
3.2.6 Calibration curve of phosphorylated peptides in bioanalysis 49
3.2.7 Injection carryover 49
3.3 Results and discussion 50
3.3.1 Evaluation of the prepared columns 50
3.3.2 Improvement of adsorption of phosphorylated compounds in the liquid chromatography-tandem mass spectrometry system
52
3.3.3 Carryover by duplicated solvent gradient method 54
iii
3.3.4 Calibration curve of standard samples in phosphorylated peptides 59
3.3.5 Injection carryover 63
3.4 Conclusions 65
3.5 References 66
Conclusions 68
Figure list 70
Table list 72
List of publications 74
List of presentations 75
Curriculum vitae 77
Acknowledgements 78

iv
List of abbreviations
HPLC; High performance liquid chromatography
LC-MS; Liquid chromatography-mass spectrometry
LC-MS/MS; Liquid chromatography tandem mass spectrometry
ESI; Electrode spray ionization
SIM; Selected-ion monitoring
SRM; Selected-reaction monitoring
C18; Octadecylsilyl-silica gel
ICP-MS; Inductively coupled plasma mass spectrometry
S/N; Signal to noise ratio
TF; Tailing factor
SD; Standard deviation
tR; Retention time
N; Number of theoretical plates
ULOQ; Upper limit of quantitation
LLOQ; Lower limit of quantitation
GL; Glass lined stainless steel
Ti; Titanium
PE; Polyethylene
PEEK; Polyetheretherketone
LPA; Lysophosphatidic acid
T18p; NVPLYpK
T19p; HLADLSpK

v
FB1; Fumonisin B1
FB2; Fumonisin B2
FB3; Fumonisin B3
FAD; Flavin adenosine dinucleotide
AMP; Adenosine monophosphate
dAMP; 5-Deoxyadenosine monophosphate
cAMP; Cyclic denosine monophosphate
USP; United States Pharmacopeia

vi
Summary
In recent years, the biological samples are widely analyzed using liquid
chromatography-mass spectrometry (LC-MS) and liquid chromatography tandem mass
spectrometry (LC-MS/MS). However, some compounds, in particular the analysis of
phosphorylated compounds of peptides and small molecules are interacted with a metal
material such as tubings and valves, and the severe peak tailing are caused. As these
improvements, the metal-free and cleaning and masking of the system have been
performed. In addition, metal-free is achieved by monolith column and fused silica
capillary column that does not use the frit in capillary LC. On the other hand, the
common columns for semi-micro LC-MS(/MS) are not achieved the metal-free. In
addition, the column hardware, such as chromatographic tube and frit are not also
evaluated. In this paper, we evaluated two types of chromatography tube (stainless steel
and glass lined stainless steel; GL) and four type of the frits (stainless steel, titanium; Ti,
polyether ether ketone; PEEK, and polyethylene; PE) by LC-MS analysis of chelated
compounds.
The phosphorylated compounds were analyzed by LC-MS, the
chromatography tubes and the frits were evaluated by the value of peak shape, signal to
noise ratio (S/N) and peak intensity. In comparison in 2 kinds of the tubes, the S/N of
flavin adenosine dinucleotide (FAD) with GL tube and stainless steel frits column
(GL-S column) was 6-times higher than that of stainless steel tube and frits column (S-S
column), and the intensity was 4-times larger for the former than the latter. The intensity
and S/N of lysophosphatidic acid (LPA) were 1.7-times higher for GL-S column than
S-S column and the peak tailing factor (TF) of FAD and LPA with GL-S column were

vii
improved, compared to S-S column. In comparison in 4 kinds of the frits, the intensity
and the S/N with GL and PE frits column (GL-PE column) were higher than those of the
other columns. The intensity and the S/N of FAD for GL-PE column were 19-times and
30-times higher than that for GL-S column, respectively. We suggest that the
mechanisms of retention in our system were affected more by the Fe ions present on the
inner surface of the S-S column. Since the specific surface area of a pair of frits was 70
times larger than that of a chromatographic tube (150 mm x 2.1 mm), the frits were
found to have more effective improvement of the S/N as well as the intensity than the
chromatographic tubes, when phosphorylated compounds were analyzed by LC-MS.
When the phosphorylated compounds were analyzed by LC-MS(/MS) using a GL-PE
column, the intensity and S/N were increased.
The different columns of three materials were evaluated by the carryover of
phosphorylated peptides and fumonisins in LC-MS/MS. In order to eliminate carryover
caused by the injection operation in the autosampler, calculated carryover by the
duplicated solvent gradient method was developed. GL tube and PE frits column
(GL-PE column) showed the most effective improvements in peak shape and the
carryover compared to the other columns. Carryovers of fumonisin B1 (FB1) with
GL-PE column could be reduced to 1/10, and lower limit of quantitation of
phosphorylated peptides as well as the range of the calibration curve was also improved.
If the carryovers of FB1 and NVPLYpK (T18p) were not caused by the GL-PE column,
those carryovers calculated by the duplicated solvent gradient method were
corresponded to those of the flow path from the injection port to the inlet frit of the
column. The carryover values of FB1 with stainless steel tube-stainless steel frits (S-S)
column were 1.67% and those of the flow path were 0.23%. On the other hand, those

viii
carryovers of T18p with S-S column were 0.82% and those of the flow path were 0.49%.
We found that the majority carryover has occurred by S-S column in our system and the
duplicated solvent gradient method.

1
Chapter 1
Introduction
1.1. High performance liquid chromatography
High performance liquid chromatography (HPLC) is today the premier
technique for chemical analysis and related applications, with an ability to separate,
analyze, and/or purify virtually any sample.1 It is one of several analytical methods for
the separation and analysis of the mixture. And it is one of the most useful and widely
applied analytical techniques.
In HPLC the mobile phase is liquid and in contrast to gas chromatography,
HPLC is a suitable technique for the analysis of compounds with a wide range of
polarities, high molecular weights, and thermally unstable or could ionize in solution.
The popularity of HPLC came from its flexibility, both in terms of the diverse nature of
the components that can be separated and the different modes that can be used (reverse
phase, ion exchange, analytical and etc.), and also a reliable and reproducible qualitative
and quantitative analytical method. In the development of analytical methods with
HPLC we must determine many variables to have a good separation.2
A column is the heart of HPLC system. Porous microspheres were used in
column in 1969, the high performance and high pressure of LC began.3-5 Alkyl
bonded-silica gels were developed in 1971, has become the prototype of the modern
column.6 The most widely used packed column in HPLC is utilized octadecylsilyl-silica
gel (C18) with the particle size ranges of 2-5 μm.

2
1.2. Liquid chromatography-mass spectrometry
LC-MS has been achieved in 1970s, and one of the most technical
improvements was the interface, such as moving belt, direct liquid introduction,
continuous-flow or frit-terminated fast atom bombardment, electrode spray ionization
(ESI) or atmospheric-pressure chemical ionization, for removing the mobile phase and
ionizing the analyte. The ESI was appeared as a practical atmospheric pressure
ionization method in 1989,7 it was spread rapidly. The Nobel Prize in Chemistry 2002
was awarded "for the development of methods for identification and structure analyses
of biological macromolecules" with one half jointly to John B. Fenn.
Mass spectrometry is performed using one or two mass analyzers (tandem
mass spectrometry: MS/MS), which consist of ion traps, time of flight or predominantly
of quadrupoles. They can operate in the full scan mode or in the more sensitive
selected-ion monitoring mode (SIM). The MS/MS provides some detection mode. The
selected-reaction monitoring (SRM) is most selectivity and quantitative detection
mode.8 As a powerful quantitative and qualitative instrument, the LC-MS(/MS) is used
in the wide fields of medicine, pharmacy, engineering, agricultural science and etc.
LC-MS(/MS) is an excellent analysis method, however, there is a disadvantage
that non-volatile mobile phase is not available. The phosphate, typical buffer of HPLC,
cannot be used, therefore, some applications could not be used.

3
1.3. Type of column hardware
In HPLC, columns are packed with minute packing materials under high
pressure, and in order to avoid the outflow of the packing materials, filters which are
called “frits” are used at both ends of the column. As for the column hardware materials,
stainless steel, PEEK, glass, fused-silica capillary and etc. are normally used. In
reversed-phase HPLC, stainless steel columns are widely used while fused-silica
capillaries are used for capillary columns with inner diameter smaller than 0.5 mm.9 On
the other hand, PEEK columns are normally used in ion chromatography; however,
PEEK or glass columns have low pressure resistance, they are difficult to be used as
separation columns without further modification. Aluminum sleeve PEEK column
packed with 3-μm C18 particle under a pressure of 60 MPa obtained 130000 plates per
meter.10 A GL capillary column (300 mm x 0.3 mm) packed with 3-μm C18 particle
obtained 40000 theoretical plates.11 For the frit materials, sintered stainless, mesh
stainless, Ti, glass, Teflon, PEEK and etc. are used. However, no frit is needed for
monolithic columns.12 The frits in fused silica capillary for capillary LC and
electrochromatography were formed in silica monolith and sintered stainless steel.13-17
In addition, for the case of “integrated spray columns”, which are normally used in nano
LC, self-assembled particle frits are normally utilized.18

4
1.4. Chelating compounds on liquid chromatography-mass spectrometry
The chelating compounds are organic compounds, and are called chelants,
chelators, chelating agents, or sequestering agents. The chelation involves the formation
or presence of two or more separate coordinate bonds between a polydentate ligand and
a single central atom.19
Due to samples adsorption, the detection of chelating compounds on LC-MS is
normally difficult; this is caused by the adsorption of the silanols groups and metal
ions20. Thus, three methods of improvement could be used; (1) Deactivation of
chromatographic system such as valves, needles and tubes21-25; (2) Addition of chelate
regeants in pretreatment and sample solvent20, 26-28; (3) Using alkaline mobile phase as
in immobilized metal affinity chromatography.26, 29 The improvements with methods (1)
and (2) were due to prevention from interaction between chelated compounds and metal
ions on the surface of flow path. Deactivation of the inner wall of fused silica capillary
could be carried out by treatment with dimethyldichlorosilane to prevent hydrogen
bonding between the silanol groups on the inner wall surface of the fused silica
capillary and phosphorylated compounds, thus the adsorption could be minimized25.
Kim et al. improved peak intensity of phosphorylated peptides by adding phosphoric
acid to sample solutions.20 On the other hand, Wakamatsu et al. improved peak intensity
of nucleic acids by flowing 400 mM phosphoric acid to the chromatographic system
involving stainless steel components as a pretreatment.23 Asakawa et al. used carbonate
mobile phase for nucleic acids, which are phosphorylated compounds, in order to reduce
the adsorption of the target compounds.26 It was concluded that this effect would be due
to the desorption of nucleic acid in alkaline mobile phase and the strong buffer capacity
of carbonate mobile phase.

5
1.5. Carryover in bioanalysis
Carryover is a phenomenon in which the sample from the previous injection is
observed or detected during the analysis of the subsequent injections. Carryovers are
often observed when injecting high concentration samples using LC-MS/MS. 30, 31 One
of the criteria for the carryover in bioanalysis is that the peak area of the analyte in a
blank sample that follows an injection of a highest standard sample (i.e. upper limit of
quantitation, ULOQ) should be less than 20% of the peak area of the lower limit of
quantitation (LLOQ) of the sample. 30, 31 Researchers often spend a lot of time and effort
in order to satisfy with this criterion. 32, 33 Therefore, in order to solve this problem, the
ULOQ is set lower while maintaining the LLOQ.34
The carryover is caused by residual materials as well as the irreversible
adsorption occurred in the flow path of the LC-MS/MS system. They occur in the
column35-37 and autosampler38 mainly. In the case of carryover caused by the
autosampler, a peak of the sample is eluted at the same decided retention time, whereas
a carryover in the column does not elute at the same retention time, and phenomena
such as peak tailing or leading are often observed.35 Carryovers are very often observed
for phosphorylated compounds and also basic compounds, in which the former is
adsorbed on the metallic material in the flow path by interacting with the metal ion. On
the other hand, the latter is adsorbed on the residual silanol in the packing material.

6
1.6. Objectives of present research
In recent years, the biological samples are widely analyzed using LC-MS(/MS).
However, some compounds, in particular the analysis of phosphorylated compounds of
peptides and small molecules are interacted with a metal material such as tubings and
valves, the severe peak tailing are caused. In this paper, in order to solve these problems,
we proposed a column which does not contain the metal in the column hardware, and
evaluated two types of chromatography tube (stainless steel and GL) and four type of
the frit (stainless steel, Ti, PEEK, and PE) by LC-MS(/MS) analysis of phosphorylated
compounds.
The objective in chapter 2 is to find the optimum combination of column
hardware for LC-MS analysis of the phosphorylated compound. The phosphorylated
compounds were analyzed by LC-MS, the chromatography tubes and the frits were
evaluated by the value of peak shape, S/N and peak intensity. As comparison of the
chromatographic tube, 2 columns were prepared with a common stainless steel and GL
tube. These frits were made from stainless steel. As comparison of the frit, 4 columns
were prepared with 4 kinds of frits (stainless steel, Ti, PEEK, and PE) and GL tube.
The objective in chapter 3 is to evaluate the carryover effect of column
hardware. The different columns of three materials were evaluated by the carryover of
phosphorylated peptides and fumonisins in LC-MS/MS. In order to eliminate carryover
of injection operation in autosampler, the calculated carryover by the duplicated solvent
gradient method was developed39. It is possible to calculate the carryover of a column
that has never been determined particularly. Calibration curves for the quantification of
phosphorylated peptides are compared, as adapting the criteria of carryover in
bioanalysis.

7
1.7. References
1. L. R. Snyder and J. J. Kirkland, Introduction to modern liquid chromatography, 2nd
ed.,Wiley-Interscience, New York, 1979.
2. J. J. Kirkland, Anal. Chem., 1969, 41, 218.
3. J. J. Kirkland, J. Chromatogr. Sci., 1969, 7, 7.
4. J. J. Kirkland, J. Chromatogr. Sci., 1969, 7, 361.
5. R.F. Venn, Principles and Practice of Bioanalysis, Taylor and Francis, London,
2000.
6. J. J. Kirkland, J. Chromatogr Sci., 1971, 9, 206.
7. J. B. Fenn, M. Mann, C. K. Meng, S. F. Wong, and C. M. Whitehouse, Science,
1989, 246, 64.
8. H. H. Maurer, J. Chromatogr. B, 1998, 713, 3.
9. T. Takeuchi and D. Ishii, J. Chromatogr., 1981, 213, 25.
10. T. Huang and P. T Kissinger, Curr. Sep., 1996, 14, 114.
11. M. Konishi, Y. Mori, and T. Amano, Anal. Chem., 1985, 57, 2235.
12. K. K. Unger, R. Skudas, and M. M. Schulte, J. Chromatogr. A, 2008, 1184, 393.
13. Y. P. Zhang, Y. J. Zhang, W. J. Gong, N. Chen, A. L.Gopalan, and K. P. Lee,
Microchem. J., 2010, 95, 67.
14. J. Park, H. Oh, and I. S. Jeon, J. Chromatogr. A, 2011, 1218, 7895.
15. X. Zhang and S. Huang, J. Chromatogr. A, 2001, 910, 13.
16. M. Kato, M. T. Dulay, B. D. Bennett, J. P. Quirino, and R. N. Zare, J. Chromatogr.
A, 2001, 924, 187.
17. B. Behnke, J. Johansson, S. Zhang, E. Bayer, and S. Nilsson, J. Chromatogr. A,
1998, 818, 257.

8
18. Y. Ishihama, J. Rappsilber, J. S. Andersen, and M. Mann, J. Chromatogr. A, 2002,
979, 233.
19. A. D. McNaught and A. Wilkinson, Compendium of Chemical Terminology, 2nd ed.,
Oxford, Blackwell Science, 1997.
20. J. Kim, D. G. Camp, and R. D. Smith, J. Mass Spectrom., 2004, 39, 208.
21. Behnke, J. Johansson, S. Zhang, E. Bayer, and S. Nilsson, J. Chromatogr. A, 1998,
818, 257.
22. P. C. Sadek, P. W. Carr, L. D. Bowers, and L. C. Haddad, Anal. Biochem., 1985,
144, 128.
23. A. Wakamatsu, K. Morimoto, M. Shimizu, and S. Kudoh, J. Sep. Sci., 2005, 28,
1823.
24. R. Zhao, S. J. Ding, Y. Shen, D. G. Camp II, E. A. Livesay, H. Udseth, and R. D.
Smith, J. Chromatogr. B, 2009, 877, 663.
25. T. De Vijlder, J. Boschmans, E. Witters, and F. Lemière, Inter. J. Mass Spectrom.,
2011, 304, 83.
26. Y. Asakawa, N. Tokida, C. Ozawa, M. Ishiba, O. Tagaya, and N. Asakawa, J.
Chromatogr. A, 2008, 1198, 80.
27. D. Winter, J. Selder, Y. Ziv, Y. Shiloh, and W. D. Lehmann, J. Proteome Res., 2009,
8, 418.
28. D. Siegel, H. Permentier, and R. Bischoff, J. Chromatogr. A, 2013, 1294, 87.
29. R. Tuytten, F. Lemiere, E. Witters, W. Van Dongen, H. Slegers, R. P. Newton, H.
Van Onckelen, and E. L. Esmans, J. Chromatogr. A, 2006, 1104, 209.
30. EMA, Guideline on the validation of bioanalytical methods,
EMA/CHMP/EWP/192217/2009 Rev.1 Corr., 21 July, 2011.

9
31. US FDA, Guideline for Industry; Bioanalytical Method Validation, Draft,
September, 2013.
32. M. Tamura, K. Matsumoto, J. Watanabe, J. Iida, Y. Nagatomi, and N. Mochizuki, J.
Sep. Sci., 2014, 00, 1.
33. T. Gazzotti, E. Zironi, B. Lugoboni, A. Barbarossa, A. Piva, and G. Pagliuca, Food
Chemistry, 2011, 125, 1379.
34. C. Chassaing, J. Luckwell, P. Macrae, K. Saunders, P. Wright, and R. Venn,
Chromatographia, 2000, 53, 122.
35. S. Dolman, S. Eeltink, A. Vaast, and M. Pelzing, J. Chromatogr. B, 2013, 912, 56.
36. R. ter Heine, C. G. Alderden-Los, H. Rosing, M. J. Hillebrand, E. C. van Gorp, A. D.
Huitema, and J. H. Beijnen, Rapid Commun. Mass Spectrom., 2007, 21, 2505.
37. N. C. Hughes, E. Y. Wong, J. Fan, and N. Bajaj, The AAPS Journal, 2007, 9, 353.
38. J. W. Dolan, LC GC North America, 2001, 19, 164.
39. D. H. Vu, R. A. Koster, A. M. A. Wessels, B. Greijdanus, J. W. C. Alffenaar, and D.
R. A. Uges, J. Chromatogr. B, 2013, 917, 1.

10
Chapter 2
Evaluation of column hardware on liquid chromatography-mass spectrometry of
phosphorylated compounds
2.1. Introduction
In HPLC, columns are packed with minute packing materials under high
pressure, and in order to avoid the outflow of the packing materials, filters which are
called “frits” are used at both ends of the column. As for the column hardware materials,
stainless steel, PEEK, glass, fused-silica capillary and etc. are normally used. In
reversed-phase HPLC, stainless steel columns are widely used while fused-silica
capillaries are used for capillary columns with inner diameter smaller than 0.5 mm.1 On
the other hand, PEEK columns are normally used in ion chromatography; however,
PEEK or glass columns have low pressure resistance, they are difficult to be used as
separation columns without further modification. Aluminum sleeve PEEK column
packed with 3-μm C18 particle under a pressure of 60 MPa obtained 130000 plates per
meter.2 A GL capillary column (300 x 0.3 mm) packed with 3-μm C18 particle obtained
40000 theoretical plates.3 For the frit materials, sintered stainless, mesh stainless, Ti,
glass, Teflon, PEEK and etc. are used. However, no frit is needed for monolithic
columns.4 The frits in fused silica capillary for capillary LC and electrochromatography
were formed in silica monolith and sintered stainless steel.5-9 In addition, for the case of
“integrated spray columns”, which are normally used in nano LC, self-assembled
particle frits are normally utilized.10
Due to samples loss, the intensity of phosphorylated compounds on LC-MS is
normally low; this is caused by the adsorption due to the silanols groups and metal

11
ions.11 Thus, three methods of improvement could be used; (1) Deactivation of
chromatographic system such as valves, needles and tubes9, 12-15; (2) Addition of chelate
regeants in pretreatment and sample solvent11, 16-18; (3) Using alkaline mobile phase as
in immobilized metal affinity chromatography.16, 19 The improvements with methods (1)
and (2) were due to prevention from interaction between phosphate compounds and
metal ions on the surface of flow path.
Deactivation of the inner wall of fused silica capillary could be carried out by
treatment with dimethyldichlorosilane to prevent hydrogen bonding between the silanol
groups on the inner wall surface of the fused silica capillary and phosphorylated
compounds, thus the adsorption could be minimized.15
Kim et al. improved peak intensity of phosphorylated peptides by adding phosphoric
acid to sample solutions.11 On the other hand, Wakamatsu et al. improved peak intensity
of nucleic acids by flowing 400 mM phosphoric acid to the chromatographic system
involving stainless steel components as a pretreatment.13 Asakawa et al. used carbonate
mobile phase for nucleic acids, which are phosphorylated compounds, in order to reduce
the adsorption of the target compounds.16 It was concluded that this effect would be due
to the desorption of nucleic acid in alkaline mobile phase and the strong buffer capacity
of carbonate mobile phase.
Our approach was to develop a new column by optimizing the column
hardware for LC-MS analysis of phosphorylated compounds. To the best of our
knowledge, the column hardware was not evaluated on semi-micro flow LC-MS. In this
paper, we evaluated the influence of chromatographic tubes and frits on LC-MS analysis
of some phosphorylated compounds.

12
2.2. Experimental
2.2.1. Reagents and chemicals
Adenosine monophosphate (AMP), 5-deoxyadenosine monophosphate (dAMP)
and cyclic adenosine monophosphate (cAMP) were purchased from Sigma-Aldrich
(Tokyo, Japan). FAD, LPA, formic acid and ammonium acetate were purchased from
Wako Pure Chemical (Osaka, Japan). Phosphorylated peptide standard kit was
purchased from Funakoshi (Tokyo, Japan). Three phosphorylated peptides
(SFVLNPTNIGM-pS-KSSQGHVTK, TRDIYETD-pY-YRK,
DLDVPIPGRFDRRV-pS-VAAE) contained in the kit were used in this paper. Iron
standard solution of 1000 mg/L, phosphoric acid, acetonitrile and methanol were
purchased from Kanto Chemicals (Tokyo, Japan). All other reagents were of analytical
grade and were used without further purification. Water was purified by a Milli-Q
purification system obtained from Millipore (Bedford, MA, USA).

13
O
N
N
N
N
NH2
OH OH
O
P
O
OH
OH
AMP
O
N
N
N
N
NH2
OH
O
P
O
OH
OH
dAMP
O
N
N
N
N
NH2
O
P
O
OHO
cAMP
OH

14
CH3
CH3
O
PO
PO
N
O
NH
O
OH
OHOH
OOH
OH
O
O
OH OHNN
NN NH2
FAD
O
OH
O
P OH
O
OH
O
CH3
LPA
Fig. 2-1 Chemical Structures of AMPs, FAD and LPA.

15
2.2.2. Sample treatment
AMP, dAMP, cAMP and FAD were dissolved separately in water at a
concentration of 100 mg/L as stock solutions. The mixtures composed of AMP, dAMP,
and cAMP were dissolved in water at a concentration of 500 μg/L each as sample
solution. FAD was dissolved in water at a concentration of 10 mg/L as sample solution
while LPA was dissolved in methanol at a concentration of 100 mg/L as a stock solution.
LPA was then diluted to a concentration of 10 mg/L using methanol and used as sample
solution.
3 phosphorylated peptides were dissolved separately in a mixture of 20 mM
phosphoric acid and acetonitrile (1/1) at a concentration of 20 mg/L as stock solutions.
The mixtures composed of phosphorylated peptides at a concentration of 2 mg/L were
dissolved in 0.1% formic acid as sample solution. All stock solutions were stored at
-20 °C, just before analysis, the sample solutions were prepared.
2.2.3. Chromatographic and mass spectrometric conditions
The chromatographic system used was a Waters 2695 Alliance System
(Milford, MA). The stainless steel tubing from autosampler to column and from column
to MS were replaced with PEEK tubing of 400 x 0.13 mm and 600 x 0.13 mm,
respectively. Methanol was used as the needle washing solvent. The sample vials used
were Waters Polypropylene vials for preventing any possible adsorption of
phosphorylated compounds.
The MS used was a Waters ZQ single quadrupole mass spectrometer with ESI
performed in positive and negative mode. Instrument control and data acquisition were
achieved using Waters Masslynx Software. The processing was achieved using Waters

16
Empower Software. MS conditions were optimized by post-column infusion of the
standard solutions.
2.2.3.1. FAD
The chromatographic mobile phase was a mixture of 0.1% formic acid and
acetonitrile (10:90), at a flow rate of 0.3 mL/min. The column temperature was kept at
40 °C throughout the experiment. The injection volume was 5 μL. The MS detection
was carried out by SIM mode at m/z 348 in positive mode. The capillary sprayer voltage
was 4.0 kV and the sample cone voltage was 30 V. The source temperature was 100 °C
and the desolvation temperature was 400 °C. The desolvation and cone gas flow-rates
were set to 400 and 50 L/h, respectively.
2.2.3.2. LPA
The chromatographic mobile phase was a mixture of 5 mM ammonium acetate
and methanol (5:95), at a flow rate of 0.3 mL/min. The injection volume was 1 μL. The
MS detection was carried out by SIM mode at m/z 435.5 in negative mode. The
capillary sprayer voltage was -3.5 kV and the sample cone voltage was -35 V. The
source temperature was 100 °C and the desolvation temperature was 400 °C. The
desolvation and cone gas flow-rates were set to 500 and 50 L/h, respectively.
2.2.3.3. AMPs
The chromatographic mobile phase was a mixture of 0.1% formic acid and
acetonitrile (99:1), at a flow rate of 0.3 mL/min. The injection volume was 5 μL. The
MS detections were carried out by SIM mode at m/z 348 (AMP), 332 (dAMP) and 330
(cAMP) in positive mode. The capillary sprayer voltages were 3.5 kV and the sample

17
cone voltages were 20 V. The source temperature was 100 °C and the desolvation
temperature was 400 °C. The desolvation and cone gas flow-rates were set to 400 and
50 L/h, respectively.
2.2.3.4. Phosphorylated peptides
The chromatographic mobile phase A and B were 0.1% formic acid and 0.1%
formic acid in acetonitrile, respectively. The gradient flow started with 95% A and 5% B,
and linearly reached 50% A and B in 10 min, at a flow rate of 0.3 mL/min. Next, the
washing of chromatographic system including a column was carried out by passing
through 5% A and 95% B for 2 min, at a flow rate of 0.4 mL/min. The injection volume
was 1 μL. In order to minimize carryover of the phosphorylated peptides, a mixture of
50% 20 mM phosphoric acid and 50% acetonitrile was used as the needle washing
solvent.
The MS detections were carried out by SIM mode at m/z 688
(SFVLNPTNIGM-pS-KSSQGHVTK), 568 (TRDIYETD-pY-YRK) and 731
(DLDVPIPGRFDRRV-pS-VAAE) in positive mode. The capillary sprayer voltages
were 3.5 kV. The sample cone voltage for DLDVPIPGRFDRRV-pS-VAAE and
TRDIYETD-pY-YRK were 30 V, and that for the SFVLNPTNIGM-pS-KSSQGHVTK
was 20 V. The source temperature was 100 °C and the desolvation temperature was
400 °C. The desolvation and cone gas flow-rates were set to 400 and 50 l/h,
respectively.
2.2.4. Combinations of chromatographic tubes and frits for column
Chromatographic tubes used were stainless steel tube (150 mm x 2.1 mm

18
I.D.) and GL tube (150 mm x 2.0 mm I.D.) without deactivated treatment. The
sintered frits were made of stainless steel, Ti, PEEK and PE. Table 2-1 shows
combination of the tubes and the frits for the column. All columns were packed with
L-column2 ODS 5 μm particle (Chemicals Evaluation and Research Institute, Tokyo,
Japan) under a pressure of 50 MPa. The numbers of theoretical plates of naphthalene
as a sample were measured for these columns by an optimized semi-micro LC
Shimadzu Prominence 20A series, and we used the columns that produced more than
11000 plates.
Comparisons of S-S and GL-S column mean difference of chromatographic
tubes. FAD, LPA and AMPs were analyzed on LC-MS for the comparisons. In
addition, comparisons of GL-S, GL-Ti, GL-PEEK and GL-PE columns mean
difference of frits. FAD, LPA, AMPs and phosphorylated peptides were analyzed on
LC-MS for the comparisons.

19
Table 2-1 The types of chromatographic tube and frit used in each specific column.
Column Chromatographic tube Frit
S-S column Stainless steel Sintered stainless steel
GL-S column GL Sintered stainless steel
GL-PEEK column GL Sintered PEEK
GL-PE column GL Sintered PE
GL-Ti column GL Sintered Ti

20
2.3. Results and discussions
2.3.1. Evaluation of the prepared columns and the liquid chromatography-mass
spectrometry system with non-phosphorylated compounds
We needed to measure the number of theoretical plates of the five kinds of
columns made from different materials for quality control before evaluating the column
material. These were tested by using an optimized Shimadzu Prominence 20A series
semi-micro LC. Naphthalene was used as a sample for measuring the plates and the TF,
where uracil was used for determining void volume. The reproducibility for 6 columns
of the same material was confirmed, and all columns had good values (Table 2-2). The
plates of S-S column were the highest among all columns. Retention time of uracil for
S-S column was 1.55 minutes, and that for GL-S column was 1.45 minutes. These were
caused by the difference in column volume. Since the retention times in the all GL-
columns were same, we concluded that the volume was same.
The LC-MS system used has large extra column volume for 2.1 mm I.D.
column. Therefore, we evaluated the system by the peak tailing and the number of
theoretical plates of copper oxinate that was a non-phosphorylated compound. The
isocratic mobile phase of acetonitrile / 0.1% formic acid (5/95) was used, at a flow rate
of 0.3 ml/min. As a result, all columns showed 1.01 to 1.11 of TF and 6600 to 8200 of
the plates (Table 2-3). We confirmed that the system did not affect the peak shape and
all columns had similar column performance. The retention time of all GL- columns
was similar and eluted approximately 6% earlier compared with that of the S-S column.
It means that the linear velocity was different. If the materials had same interactions
with the compounds, the retention time had to be shifted 6-7%.

21
Table 2-2 The chromatographic parameters of the prepared 6 columns for quality
control.
to/min tR/min N TF
mean mean SD mean SD mean SD
S-S column 1.55 8.15 0.03 14000 50 1.02 0.01
GL-S column 1.45 7.58 0.03 12300 280 1.05 0.02
GL-Ti column 1.45 7.59 0.03 12000 370 1.12 0.02
GL-PEEK column 1.45 7.56 0.04 12400 410 1.11 0.03
GL-PE column 1.45 7.58 0.03 12900 190 1.11 0.02
The isocratic mobile phase 60% acetonitrile was used for column testing, at a flow
rate of 0.2 mL/min. t0 is retention time of uracil. tR is retention time of naphthalene.
The number of theoretical plates (N) and TF of naphthalene are calculated by United
States Pharmacopeia (USP) method. The values are mean and standard deviation (SD)
of 6 columns.

22
Table 2-3 Comparison of the analysis of copper oxinate (0.4ng) as a
non-phosphorylated compound for prepared 5 kinds of columns.
tR/min) Intensity/cps N TF
mean SD mean SD mean SD mean SD
S-S column 4.09 0.04 1.38E+06 3.95E+04 8200 320 1.01 0.03
GL-S column 3.81 0.05 1.20E+06 4.95E+04 7100 140 1.01 0.02
GL-Ti column 3.84 0.02 1.35E+06 2.76E+04 6600 310 1.11 0.01
GL-PEEK column 3.87 0.04 1.39E+06 2.48E+04 6900 380 1.08 0.01
GL-PE column 3.82 0.04 1.38E+06 2.57E+04 7800 210 1.10 0.01
The isocratic mobile phase of acetonitrile / 0.1% formic acid (5/95) were used, at a
flow rate of 0.3 mL/min. The values are mean and SD of 5 injections.

23
2.3.2. Comparison of chromatographic tubes
Table 2-4 shows the intensity, S/N and TF of FAD, LPA and AMPs analyzed
using GL-S and S-S columns on LC-MS as comparison of chromatographic tubes. The
SIM chromatograms are shown in Fig. 2-2. The S/N of FAD with GL-S column was
6-times higher than that of S-S column, and the intensity was 4-times larger for the
former than the latter. The intensity and S/N of LPA were 1.7-times larger for the former
than the latter and the peak TFs of FAD and LPA with the former were improved,
compared to the latter. Metal ions in the mobile phase, the metal material used and the
silanol groups present on the GL tube and packing material could be considered as the
three reasons of improvements.
First, Kim et al. considered that the silanol groups on C18 stationary phase
caused interaction with phosphate compounds as same as metal ions.11 The silanol
groups were present in minor amounts in the packing materials and the inner surface
of the GL tube. When the 0.1% formic acid as a mobile phase was used for FAD and
AMPs, hydrogen bonding was occurred between the dissociated silanol groups and
the undissociated phosphate groups23. When GL-S column was used for FAD and
AMPs, the peak tailing had to be caused larger than that of S-S column, however,
GL-S column showed good performance clearly. We suggest that the interactions of
metal on the inner surface of the S-S column were greater than those of the silanol and
metal of the inner surface of the GL-S column. Since FAD had 2 phosphate groups,
the improvement effect was larger than that of AMPs. When 5mM ammonium acetate
was used as the mobile phase for LPA, the interactions were suppressed by ion
repulsion caused by between dissociated silanol groups and dissociated phosphate
groups.23

24
Second, the interactions were caused by metal ion eluted from
chromatographic pump, inline frits and column.25 The metal ions in mobile phase of
0.1% formic acid eluted from the LC-MS (including the column) were determined by
inductively coupled plasma mass spectrometry (ICP-MS). The selected metal ions
were Al, Fe, Ti, Ni, Cr and Mo. Fe and Al can cause formation of chelating with
phosphorylated compounds.17, 19, 21, 22 The SUS316 were composed of Fe, Ti, Ni, Cr
and Mo. Fe ions eluted from the S-S column and GL-S column were detected at a
concentration of 1.8 μg/L and 1.3 μg/L, respectively. The concentration of Mo, Al, Cr,
and Ni eluted from those columns were sub-ppb or less.
We investigated whether μg/L level of Fe would affect the chromatographic
separation of LPA or not. We expected to change height and shape of the peak by
mixing Fe3+ and phosphorylated compounds. This test was conducted for a LPA sample
solution that was prepared to include Fe3+ at concentrations of 0, 2, 10, 50 and 200 μg/L.
These peak areas, heights and TF were measured by flow injection-mass spectrometry.
However, because of the matrix effect of NO3-, the distorted peak of LPA could not be
satisfied. Next, LC-MS method using GL-PE column was adopted. The matrix effect
could be avoided by the chromatographic separation. Fig. 2-3 shows a relationship with
the concentration of Fe3+ and peak height and TF of LPA. Fe3+ in the sample solution
was found to have no effect on the peak height and TF at 10 μg/L or less in this testing.
The tailing and the broad peak were detected in chromatogram of LPA sample solution
including 200 μg/L Fe3+. This peak was delayed than the main peak. Fe3+ of 1.8 μg/L
were detected in the mobile phase eluted from the LC system connecting a column, but
these concentrations would not affect the retention behavior. We suggest that chelating
formation of Fe3+ and LPA was performed quickly since samples prepared was so stable

25
from first injection (within 1 minute after prepared). This meant that injected LPA
formed chelating with Fe3+ in the mobile phase.
Third, we considered that the metal ions existing on S-S column inner surface
were richer than GL-S column. The Fe and Al ions caused interaction with the
phosphate groups.17, 19, 21, 22 The S-S column was made from SUS316 which included
50% or more of iron. Glass of GL-S column was made from borosilicate glass which
included 2% aluminum. Since Fe ions on the stainless steel were richer than Al ion on
the glass surface, the S/N and the intensity with GL column were improved. In addition,
the chelating formation between phosphorylated compound and Fe ion was more stable
than Al ion.25
As a result, we suggest that the behaviors of retention in our system were
affected more by the Fe ions present on the inner surface of the S-S column than the
influence of Fe ions contained in the mobile phase and the silanol groups.

26
Table 2-4 Comparison of chromatographic parameter between S-S and GL-S column
with FAD (50 ng), LPA (10 ng) and AMPs (2.5 ng) used as the samples.
(Chromatographic tubes were compared, i.e. between S and GL, while the same S-frit
was used)
tR/min Intensity/cps S/N TF
mean SD mean SD mean SD mean SD
FAD
S-S column
3.69 0.13 4.21E+03 3.27E+02 4 0.3 -* -
GL-S column
3.11 0.02 1.96E+04 2.83E+02 24 3 7.15 0.80
LPA
S-S column
8.23 0.10 5.47E+04 1.06E+04 60 11 2.56 0.18
GL-S column
8.04 0.08 8.90E+04 2.77E+03 104 14 2.21 0.06
cAMP
S-S column
6.92 0.01 1.28E+05 6.06E+03 104 22 1.05 0.03
GL-S column
6.53 0.01 1.50E+05 1.01E+04 137 10 1.04 0.07
dAMP
S-S column
2.82 0.01 5.14E+04 3.05E+03 36 4 2.34 0.32
GL-S column
2.67 0.00 8.60E+04 5.16E+03 83 10 1.62 0.12
AMP
S-S column
2.02 0.02 9.55E+04 2.08E+04 91 29 3.88 0.31
GL-S column 1.91 0.02 1.45E+05 3.21E+04 181 41 2.34 0.06
The values are mean and SD of 5 injections.
* Not be calculated.

27
Time2.00 4.00 6.00 8.00 10.00 12.00
%
0
100
2.00 4.00 6.00 8.00 10.00 12.00
%
0
100
2.00 4.00 6.00 8.00 10.00 12.00STD column LPA 10ppm 1uL 010 SIR of 1 Channel ES-
TIC (LPA)9.87e4
8.10
0.44
SUS LPA 10ppm 1uL 010 SIR of 1 Channel ES- TIC (LPA)
9.87e47.93
0.32
Time2.00 4.00 6.00 8.00 10.00
%
0
100
2.00 4.00 6.00 8.00 10.00
%
0
100
2.00 4.00 6.00 8.00 10.00STDfrit E4506 VB2 010 SIR of 2 Channels ES+
348 (FAD)2.28e4
3.821.190.860.03
3.621.25 2.37 3.06
4.184.64 5.175.79 6.21 7.28 7.75
SUSfrit E4506 VB2 010 SIR of 2 Channels ES+ 348 (FAD)
2.28e43.11
1.11
0.94
0.531.26
2.25
3.18
3.283.493.73
4.15
(a)
(b)
(a)
(b)
Fig. 2-2 SIM chromatograms of FAD (left) and LPA (right) using S-S column (a),
GL-S column (b). A comparison of chromatographic tube is shown.

28
0
50
100
150
200
250
300
2 10 50 200
HeightTF
Hei
ght a
nd T
F(%
of c
ontro
l)
Concentration of Fe ion in LPA sample solution (μg/L)
Fig. 2-3 Effect of concentration of Fe3+ in LPA sample standard solution on the peak
area, peak height and TF of LPA.
Concentration of Fe ion in LPA sample solution /μg L-1
Hei
ght a
nd T
F, %
of c
ontro
l

29
2.3.3. Effect of frits
The specific surface areas of the frits were measured by the Brunauer,
Emmett and Teller method.26 The areas of SUS, Ti, PEEK and PE frits per a column
were 6.4*10-2 m2, 1.1*10-1 m2, 1.2*10-1 m2 and 6.6*10-2 m2, respectively.
The GL-PE column improved intensity, S/N and TF of phosphorylated compounds.
Table 2-5 shows the intensity, the S/N, the retention time and the TF of FAD, LPA and
AMPs analyzed on LC-MS with GL-S, GL-Ti, GL-PEEK and GL-PE columns as
comparison of the frits. The SIM chromatograms of FAD (Right) and LPA (Left) are
shown in Fig. 2-4 (a), (b), (c) and (d), respectively.
The intensity and the S/N for GL-PE column were higher than those for the
other columns. The intensity and the S/N of FAD for GL-PE column were 19-times and
30-times higher than those for GL-S column, respectively. We considered that the
difference were due to the interactions of metal ions in mobile phase and the specificity
of frit materials. The metal ions in mobile phase of 0.1% formic acid eluted from the
LC-MS system were determined by ICP-MS. Fe ions and Al ion were eluted from the
GL-PE column at a concentration of 1.8 μg/L and 0.17 μg/L, respectively . The
concentration of Mo, Cr, and Ni eluted from those columns were sub-ppb or less. Since
the concentration of the metal ions eluted were low and the difference between the
columns were low, we concluded the metal ions contained in the mobile phase could be
excluded. We assumed that reducing the interaction between the phosphorylated
compounds and the residual metal ions in flow path of our system was more effective in
order to improve the S/N and the intensity. We considered that the phosphorylated
compounds were adsorbed onto stainless steel frit of GL-S column as well as the
chromatographic tubes. On the other hand, the metal ions hardly exist on the frits in

30
GL-PEEK column and GL-PE column, however, good performance was clearly
obtained when the GL- PE column was used. We considered that the polarity and the
specific surface area were different between PEEK and PE frits. The latter could not
entrap the FAD, since the difference of polarity between FAD and PE frits is bigger than
that between FAD and PEEK frits. PE has high hydrophobicity, and the powders were
used as packing materials in reversed-phase LC.27 In addition, the specific areas of
PEEK frits were larger than those of PE frits.
The results of the AMPs were similar to those of FAD. However, there was
no difference between the GL-PE column and the GL-PEEK column. High polarity of
AMPs as compared to the FAD caused weak retention. Since the difference in polarity
between the frits was larger, the intensity and S/N could not be improved.
The intensity and S/N of LPA with GL-PE column showed the best
performance among the others, and those were 7-times higher than GL-S column,
respectively. Those with GL-PEEK column were as same as the GL-Ti column, and
they were less than half of the GL-PE column. However, the retention times were
shorter than GL-S columns, and that with GL-Ti column was the shortest in the all.
We considered that the Ti frit had slight or no interactions and other frits had some
interactions. The Ti frit might have a slight chelating interaction or ion repulsion
under neutral mobile phase.28-30 PE and PEEK frit had hydrophobic interactions with
low polar compounds such as LPA. SUS frit had larger chelating interaction.
The GL-PE column improved intensity and S/N of phosphorylated peptides.
Table 2-6 shows the intensity, S/N and the TF of the peptides analyzed on LC-MS
with GL-S, GL-Ti, GL-PEEK and GL-PE columns as comparison of the frits. The
SIM chromatograms of phosphorylated peptides (right: TRDIYETD-pY-YRK, center:

31
SFVLNPTNIGM-pS-KSSQGHVTK, left: DLDVPIPGRFDRRV-pS-VAAE) are
showed in Fig. 2-5. The intensity and S/N of phosphorylated peptides with GL-PE
column were higher than those of the other columns. The symmetric peaks of
phosphorylated compounds were obtained by using the GL-PE column. These results
were the same as the tested phosphorylated compounds.
Since the specific surface area of PE frits (approximately 6.6*10-2 m2 per
column) was ca. 70-fold larger than the chromatographic tube (approximately
9.4*10-4 m2 per column), the improvement for replacement of the frits were more
effective than that of the tube.
As a confirmation of durability, by using the GL-PE column, injection of 500
times or more of riboflavin phosphate was performed. There was no change in the
chromatogram and the chromatographic parameters (not shown data).

32
Table 2-5 Comparison of chromatographic parameters for FAD (50 ng), LPA (10 ng)
and AMPs (2.5 ng). (4 types of frits were compared while the same kind of
GL-chromatographic tube was used)
tR/min Intensity/cps S/N TF
mean SD mean SD mean SD mean SD
FAD
GL-S column
3.11 0.02 1.96E+04 2.83E+02 24 3 7.15 0.80
GL-Ti column
3.04 0.03 4.85E+04 3.47E+03 46 7 6.11 0.43
GL-PEEK column
3.06 0.01 2.96E+05 1.03E+04 551 50 2.76 0.21
GL-PE column
2.97 0.02 3.56E+05 3.81E+03 701 36 2.59 0.15
LPA
GL-S column
8.04 0.08 8.90E+04 2.77E+03 104 14 2.21 0.06
GL-Ti column
3.70 0.02 2.55E+05 5.10E+03 442 22 1.55 0.05
GL-PEEK column
5.06 0.05 2.50E+05 4.76E+03 368 43 2.02 0.07
GL-PE column
4.70 0.00 6.25E+05 1.33E+04 696 88 1.49 0.02
cAMP
GL-S column
6.53 0.01 1.50E+05 1.01E+04 137 10 1.04 0.07
GL-Ti column
6.51 0.03 1.77E+05 1.22E+04 265 41 1.06 0.07
GL-PEEK column
6.48 0.01 1.72E+05 1.00E+04 257 24 0.96 0.04
GL-PE column
6.58 0.03 1.97E+05 5.30E+03 261 22 1.02 0.02
dAMP
GL-S column
2.67 0.00 8.60E+04 5.20E+03 83 10 1.62 0.12
GL-Ti column
2.66 0.00 1.86E+05 5.30E+03 242 23 1.13 0.05
GL-PEEK column
2.67 0.01 1.90E+05 5.80E+03 292 51 1.05 0.02

33
GL-PE column
2.68 0.01 2.15E+05 4.00E+03 331 72 1.05 0.03
AMP
GL-S column
1.91 0.02 1.45E+05 3.20E+04 181 41 2.34 0.06
GL-Ti column
1.90 0.00 3.45E+05 1.70E+04 686 30 -* -
GL-PEEK column
1.92 0.00 4.07E+05 1.10E+04 792 100 1.57 0.01
GL-PE column 1.91 0.01 3.81E+05 1.40E+04 825 65 1.10 0.13
The values are mean and SD of 5 injections.
* Since chromatographic separation of impurity peak was insufficient, this value
could not be calculated.

34
Table 2-6 Chromatographic parameters of phosphorylated peptides.
tR/min Intensity/cps S/N TF
mean SD mean SD mean SD mean SD
TRDIYETD-pY-YRK
GL-S column 6.17 0.00 2.24E+05 5.30E+03 237 5 1.11 0.03
GL-Ti column 6.26 0.00 3.90E+05 8.80E+03 529 43 1.15 0.01
GL-PEEK column 6.33 0.02 4.18E+05 3.50E+03 522 10 1.13 0.01
GL-PE column 6.16 0.02 4.15E+05 1.30E+04 620 30 1.07 0.01
SFVLNPTNIGM-pS-KSSQGHVTK
GL-S column 6.91 0.00 7.70E+03 2.90E+03 10 4 1.29 0.23
GL-Ti column 6.98 0.00 2.19E+05 2.70E+04 448 91 1.21 0.06
GL-PEEK column 7.03 0.02 2.95E+05 5.40E+03 423 97 1.22 0.05
GL-PE column 6.92 0.01 3.95E+05 1.30E+04 590 121 1.18 0.02
DLDVPIPGRFDRRV-pS-VAAE
GL-S column 8.32 0.01 4.34E+04 2.40E+03 53 10 1.03 0.08
GL-Ti column 8.41 0.00 9.94E+04 5.00E+03 234 37 1.05 0.01
GL-PEEK column 8.44 0.02 1.09E+05 6.30E+03 162 12 1.05 0.04
GL-PE column 8.32 0.01 1.11E+05 3.10E+03 230 10 1.05 0.05
The values are mean and SD of 5 injections.

35
Time2.00 4.00 6.00 8.00 10.00
%
0
100
2.00 4.00 6.00 8.00 10.00
%
0
100
2.00 4.00 6.00 8.00 10.00
%
0
100
2.00 4.00 6.00 8.00 10.00
%
0
100SUS LPA 10ppm 1uL 010 SIR of 1 Channel ES-
TIC (LPA)6.28e5
7.93
TiLPA 10ppm 1uL 010 SIR of 1 Channel ES- TIC (LPA)
6.28e5
3.68
PEEK LPA 10ppm 1uL 010 SIR of 1 Channel ES- TIC (LPA)
6.28e5
5.01
PE LPA 10ppm 1uL 010 SIR of 1 Channel ES- TIC (LPA)
6.28e54.70
Time2.00 4.00 6.00 8.00 10.00
%
0
100
2.00 4.00 6.00 8.00 10.00
%
0
100
2.00 4.00 6.00 8.00 10.00
%
0
100
2.00 4.00 6.00 8.00 10.00
%
0
100SUSfrit E4506 VB2 010 SIR of 2 Channels ES+
348 (FAD)3.57e5
3.11
Tifrit E4506 VB2 010 SIR of 2 Channels ES+ 348 (FAD)
3.57e5
3.071.11
PEEKfrit E4506 VB2 010 SIR of 2 Channels ES+ 348 (FAD)
3.57e53.07
1.12
PEfrit E4506 VB2 010 SIR of 2 Channels ES+ 348 (FAD)
3.57e52.98
1.100.99
(a)
(b)
(c)
(d)
(a)
(b)
(c)
(d)
Fig. 2-4 SIM chromatograms of FAD (left) and LPA (right) using GL-S column (a),
GL-Ti column (b), GL-PEEK column(c) and GL-PE column(d). A comparison of frit
is shown.

36
Time2.00 4.00 6.00 8.00
%
0
100
2.00 4.00 6.00 8.00
%
0
100
2.00 4.00 6.00 8.00
%
0
100
2.00 4.00 6.00 8.00
%
0
100test E4506 SUS 6 p pep 2000ug_L 003 SIR of 5 Channels ES+
568 (Kinase Insulin Receptor3)3.97e5
6.17
test E4506 Ti 6 p pep 2000ug_L 003 SIR of 5 Channels ES+ 568 (Kinase Insulin Receptor3)
3.97e56.26
test E4506 PEEK 6 p pep 2000ug_L 003 SIR of 5 Channels ES+ 568 (Kinase Insulin Receptor3)
3.97e56.35
test E4506 PE 6 p pep 2000ug_L 003 SIR of 5 Channels ES+ 568 (Kinase Insulin Receptor3)
3.97e56.14
(a)
(b)
(c)
(d)Time
2.00 4.00 6.00 8.00
%
0
100
2.00 4.00 6.00 8.00
%
0
100
2.00 4.00 6.00 8.00
%
0
100
2.00 4.00 6.00 8.00
%
0
100test E4506 SUS 6 p pep 2000ug_L 003 SIR of 5 Channels ES+
688 (B-casein p-pep)4.33e5
test E4506 Ti 6 p pep 2000ug_L 003 SIR of 5 Channels ES+ 688 (B-casein p-pep)
4.33e5
6.97
test E4506 PEEK 6 p pep 2000ug_L 003 SIR of 5 Channels ES+ 688 (B-casein p-pep)
4.33e5
7.03
test E4506 PE 6 p pep 2000ug_L 003 SIR of 5 Channels ES+ 688 (B-casein p-pep)
4.33e56.90
Time2.00 4.00 6.00 8.00
%
0
100
2.00 4.00 6.00 8.00
%
0
100
2.00 4.00 6.00 8.00
%
0
100
2.00 4.00 6.00 8.00
%
0
100test E4506 SUS 6 p pep 2000ug_L 003 SIR of 5 Channels ES+
731 (PKA Regulatory Subunit2)1.14e5
8.33
test E4506 Ti 6 p pep 2000ug_L 003 SIR of 5 Channels ES+ 731 (PKA Regulatory Subunit2)
1.14e5
6.98
test E4506 PEEK 6 p pep 2000ug_L 003 SIR of 5 Channels ES+ 731 (PKA Regulatory Subunit2)
1.14e5
7.04
test E4506 PE 6 p pep 2000ug_L 003 SIR of 5 Channels ES+ 731 (PKA Regulatory Subunit2)
1.14e5
6.90
(a)
(b)
(c)
(d)
(a)
(b)
(c)
(d)
6.00 8.00
6.165.97
8.096.96 8.39
SIR of 5 Channels ES+
Fig. 2-5 SIM chromatograms of 1 μmol TRDIYETD-pY-YRK (left) ,
SFVLNPTNIGM-pS-KSSQGHVTK(center) and DLDVPIPGRFDRRV-pS-VAAE
(right) using GL-S column (a), GL-Ti column (b), GL-PEEK column (c) and GL-PE
column (d).

37
2.4. Conclusions
We evaluated the influence of column hardware on LC-MS analysis of
phosphorylated compounds. In order to reduce of the interaction with the
phosphorylated compounds, using a GL-PE column could improve the S/N as well as
the detection intensity and the peak tailing. Replacing to PE frits has more effective
improvement of the intensity as well as the S/N than replacing the tubes of the column.
Since the metal ions eluted from our system were less than μg/L level, the
improvements were hardly affected. Thus, we believe that to use GL-PE column is
one of the best method for analysis of phosphorylated compounds.

38
2.5. References
1. T. Takeuchi and D. Ishii, J. Chromatogr., 1981, 213, 25.
2. T. Huang and P. T. Kissinger, Curr. Sep., 1996, 14, 114.
3. M. Konishi, Y. Mori, and T. Amano, Anal. Chem., 1985, 57, 2235.
4. K. K. Unger, R. Skudas, and M. M. Schulte, J. Chromatogr. A, 2008, 1184, 393.
5. Y. P. Zhang, Y. J. Zhang, W. J. Gong, N. Chen, A. L.Gopalan, and K. P. Lee,
Microchem. J., 2010, 95, 67.
6. J. Park, H. Oh and I. S. Jeon, J. Chromatogr. A, 2011, 1218, 7895.
7. X. Zhang and S. Huang, J. Chromatogr. A, 2001, 910, 13.
8. M. Kato, M. T. Dulay, B. D. Bennett, J. P. Quirino, and R. N. Zare, J. Chromatogr.
A, 2001, 924, 187.
9. B. Behnke, J. Johansson, S. Zhang, E. Bayer, and S. Nilsson, J. Chromatogr. A,
1998, 818, 257.
10. Y. Ishihama, J. Rappsilber, J. S. Andersen, and M. Mann, J. Chromatogr. A, 2002,
979, 233.
11. J. Kim, D. G. Camp, and R. D. Smith, J. Mass Spectrom., 2004, 39, 208.
12. P. C. Sadek, P. W. Carr, L. D. Bowers, and L. C. Haddad, Anal. Biochem., 1985,
144, 128.
13. A. Wakamatsu, K. Morimoto, M. Shimizu, and S. Kudoh, J. Sep. Sci., 2005, 28,
1823.
14. R. Zhao, S. J. Ding, Y. Shen, D. G. Camp II, E. A. Livesay, H. Udseth, and R. D.
Smith, J. Chromatogr. B, 2009, 877, 663.
15. T. De Vijlder, J. Boschmans, E. Witters, and F. Lemière, Inter. J. Mass Spectrom.,
2011, 304, 83.

39
16. Y. Asakawa, N. Tokida, C. Ozawa, M. Ishiba, O. Tagaya, and N. Asakawa, J.
Chromatogr. A, 2008, 1198, 80.
17. D. Winter, J. Selder, Y. Ziv, Y. Shiloh, and W. D. Lehmann, J. Proteome Res., 2009,
8, 418.
18. D. Siegel, H. Permentier, and R. Bischoff, J. Chromatogr. A, 2013, 1294, 87.
19. R. Tuytten, F. Lemiere, E. Witters, W. Van Dongen, H. Slegers, R. P. Newton, H.
Van Onckelen, and E. L. Esmans, J. Chromatography. A, 2006, 1104, 209.
20. F. Gaucheron, D. Molle, J. Leonil, and J. L. Maubois, J. Chromatogr. B, 1995, 664,
193.
21. V. Cael, D. Champmartin, and P. Rubini, J. Inorg. Biochem., 2003, 97, 97.
22. S. Liu, C. Zhang, J. L. Campbell, H. Zhang, K. K. Yeung, V. K. Han, and G. A.
Lajoie, Rapid Comm. Mass spectrum., 2005, 19, 2747.
23. J. Zhang, Q. Wang, B. Kleintop, and T. Raglione, J. Pharm. Biomed. Anal., 2014,
98, 247.
24. R. W. Slingsby, A. Bordanov, and M. Grimes, J. Chromatogr. A, 2001, 913, 159.
25. E. Gumienna-Kontecka, R. Silvagni, R. Lipinski, M. Lecouvey, F. C. Marincola, G.
Crisponi, V. M. Nurchi, Y. Leroux, and H. Kozłowski, Inorg. Chim. Acta, 2002, 339,
111.
26. S. Brunauer, P. H. Emmett, and E. Teller, J. Am. Chem. Soc., 1938, 60, 309.
27. Y. Shioi and S. I. Beale, Anal. Biochem., 1987, 162, 493.
28. Y. Ikeguchi and H. Nakamura, Anal. Sci., 1997, 13, 479.
29. I. Kuroda, Y. Shintani, M. Motokawa, S. Abe, and M. Furuno, Anal. Sci., 2004, 20,
1313.

40
30. Q. C. Lee, M. H. Roper, H. Terrisse, and B. Humbert, Colloids Surf. B, 2014, 123,
150.

41
Chapter 3
Evaluation of column carryover of phosphorylated peptides and fumonisins by
duplicated solvent gradient method in liquid chromatography-tandem mass
spectrometry
3.1. Introduction
Carryover is a phenomenon in which the sample from a previous injection is
observed or detected during the analysis of subsequent injections in HPLC. This is a
common problem that can compromise the accuracy of HPLC. Carryover is often
observed when injecting highly concentrated samples using LC/MS/MS. One of the
criteria for carryover in bioanalysis is that the peak area of the a blank sample that
follows an injection of a highest standard sample (i.e., ULOQ) should be less than 20%
of the peak area of the LLOQ of the sample.1, 2 Researchers often spend a significant
amount of time and effort to meet this criterion. Therefore, in order to solve this
problem, the ULOQ is set lower, while the LLOQ is maintained.3
Carryover is caused by residual material as well as irreversible adsorption in
the flow path within the LC/MS/MS system. It primarily occurs within the column4-6
and autosampler.7, 8 In the case of carryover caused by the autosampler, a peak of the
sample is eluted at the same decided retention time, whereas a carryover in the column
does not elute at the same retention time, and phenomena such as peak tailing or leading
are often observed.6 Carryover is often observed with phosphorylated and basic
compounds, in which the former is adsorbed on metallic material in the flow path via
interactions with metal ions. On the other hand, the latter is adsorbed on residual silanol
in the packing material.

42
Carryover in the autosampler can be improved by changing the sampler needle
and valve materials,3, 9-12 minimizing the contact area between the needle and seal, and
optimizing the solvents used to wash the needle.9, 11-13 In general, needle materials are
made of PEEK, stainless steel, and fused silica. Carryover could be minimized by using
modified platinum-coated, stainless steel needles. Carryover is caused by residual
samples between the needle and seal in the autosampler. The outside of the needle is
immersed in the sample in the vial, and the sample adsorbs on the needle. Therefore, the
carryover can be improved by using needle materials that do not adsorb the sample,
and/or by reducing the contact area between the needle and seal. In addition, washing
the needles with certain solvents, such as 100% organic solvents for hydrophobic
compounds and counter ionic solvents for ionic compounds, could be effective.14
Carryover in the column is mainly due to the adsorption of samples on the
packing materials.4-6, 15 The carryover could be improved by changing the washing time
of the column as well as the gradient profile.16 The carryover of fumonisins was
improved by using mobile phase containing 0.3% formic acid.17
On the other hand, in order to eliminate carryover of peptides, Dolman et al.
examined the column washing step in four columns containing different packing
materials.4 The carryover was eliminated by using a poly (styrene-co-divinylbenzene)
monolithic column without mesopores.
In HPLC, columns are packed with minute packing materials under high
pressure, and in order to avoid the outflow of the packing materials, filters which are
called “frits” are used at both ends of the column. As for the column hardware materials,
stainless steel, PEEK, glass, fused-silica capillary etc. are typically used. For the frit
materials, sintered stainless steel, mesh stainless steel, Ti, glass, Teflon, PEEK etc., are

43
used. The samples are adsorbed on the column hardware, and carryover occurs.
Mochizuki et al. eliminated the carryover of fumonisins by using a metal-free PEEK
column.15
The evaluated samples in this study were fumonisins and phosphorylated
peptides. Severe carryover was observed in preliminary studies. Fumonisins produced
by Fusarium species are called mycotoxins, which are toxic to both humans and
animals and may contaminate food and animal feed. Fumonisins contain four carbonyl
groups. Phosphorylated peptides have one or more phosphate groups, which lend a high
affinity towards metals. They are adsorbed on the metal parts of the flow pass in HPLC,
thus causing poor peak symmetry and carryover. The primary carryover occurs in the
column and autosampler, and identifying the carryover in partial HPLC systems is
difficult. Conventional carryover was calculated using the ratio of the peak area of the
previous sample to that of the blank sample. This method included all carryover, such as
in the needle and valves of the autosampler as well as in the column. Therefore, in order
to exclude the carryover of the injection valve operation in the autosampler, the
duplicated solvent gradient method18 was used. Since the injection carryover in the
autosampler was not included in this method, it was possible to limit the carryover in
the column and flow path. This method is ideal for calculating carryover in the column
only. In this paper, the carryover of three columns made of different materials was
evaluated using the duplicated solvent gradient method.
44
3.2. Experimental
3.2.1. Reagents and chemicals
A mixture of phosphorylated peptides, Mass PREP phosphorylated peptide
Sample Kit–Enolase, was purchased from Nihon Waters (Tokyo, Japan). This kit
included four phosphorylated peptides (T18p, T19p, T43p, and T43pp); however, only
two phosphorylated peptides (T18p: NVPLYpK and T19p: HLADLSpK) were used in
this work. A standard solution containing 50 mg/L of Fumonisin B1 (FB1) and B2 (FB2),
and a standard solution containing 50 mg/L Fumonisin B3 (FB3), formic acid,
acetonitrile, methanol, and isopropanol were purchased from Kanto Chemicals (Tokyo,
Japan). FAD was purchased from Wako Pure Chemical (Osaka, Japan). All other
reagents were of analytical grade and were used as received without any further
purification. Water was purified with a Milli-Q purification system obtained from
Millipore (Bedford, MA).
45
CH3
CH3
CH3
O
OOHO
OH
O
O
OH
O
OH
O
R1CH3 NH2
OHR2
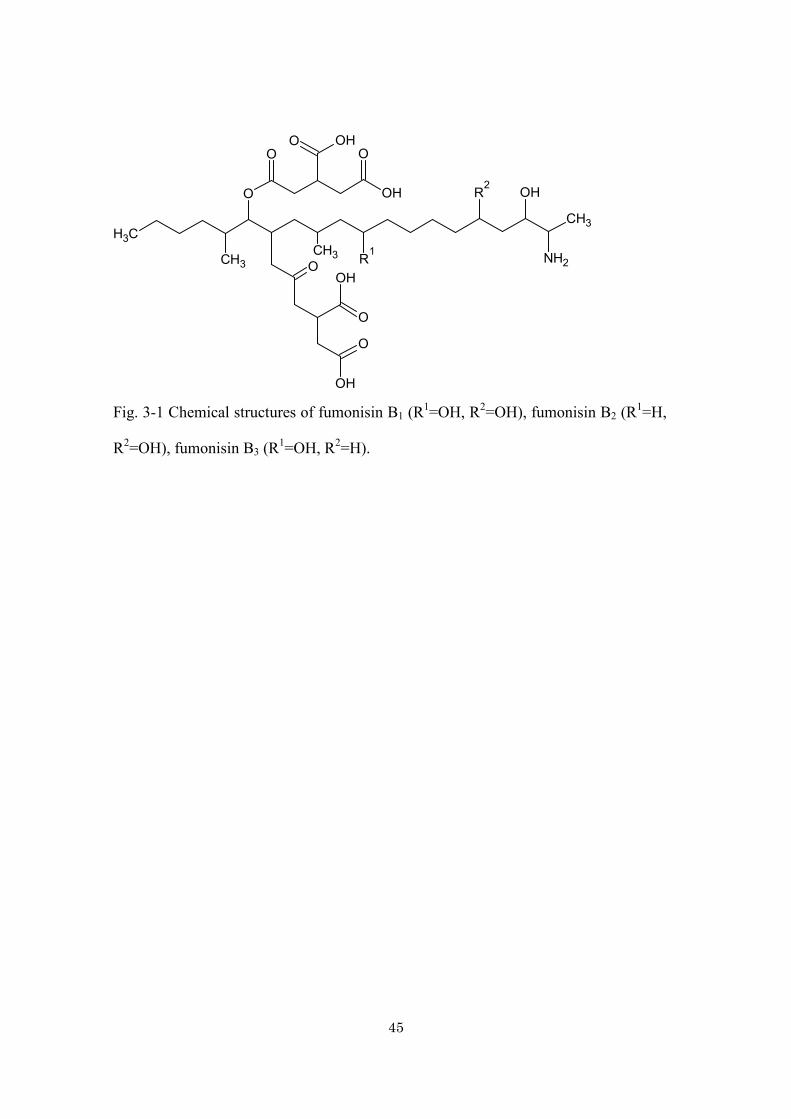
Fig. 3-1 Chemical structures of fumonisin B1 (R1=OH, R2=OH), fumonisin B2 (R1=H,
R2=OH), fumonisin B3 (R1=OH, R2=H).

46
3.2.2. Sample treatment
FAD was dissolved in water at a concentration of 100 mg/L as stock solutions,
and the sample solution was dissolved in water at a concentration of 10 mg/L. The
mixture of FBs was dissolved in acetonitrile at a concentration of 10 mg/L to prepare
the stock solution. The sample solution containing the 3 FBs at a concentration of 1
mg/L was dissolved in water. A mixture of phosphorylated peptides was dissolved in
water at a concentration of 1000 fmol/μL to prepare the stock solution. A sample
solution of the mixture of phosphorylated peptides (500 fmol/μL) was dissolved in 10
mM phosphoric acid. All stock solutions were stored at -20 °C, and the sample solutions
were prepared immediately prior to analysis.
3.2.3. Chromatographic and mass spectrometric conditions
The chromatographic system was a Thermo Scientific Ultimate 3000 BioRS
(Bremen, Germany) with a 10 μL mixer. A mixture of
methanol/acetonitrile/H2O/isopropanol 1:1:1:1 (v/v/v/v) was used as the needle washing
solvent.
Fumonisins: The chromatographic mobile phases A and B were 0.1% formic
acid and acetonitrile, respectively. Using a gradient flow, the separation began with 80%
A and 20% B and reached 30% A and 70% B in 10 min, at a flow rate of 0.2 mL/min.
Next, the chromatographic system, including the column, was washed by passing
through 5% A and 95% B for 4 min. Next, the system was equilibrated by passing
through 80% A and 20% B for 6 min. The second gradient flow of the duplicated
solvent gradient method was the same as the first gradient condition without an
injection. The injection volume was 3 μL.

47
Phosphorylated peptides: The chromatographic mobile phases A and B were
0.1% formic acid and acetonitrile, respectively. Using a gradient flow, the separation
began with 95% A and 5% B and reached 50% A and B in 10 min, at a flow rate of 0.2
mL/min. Next, the chromatographic system, including the column, was washed by
passing through 5% A and 95% B for 4 min, and the system was equilibrated by passing
through 95% A and 5% B for 6 min. The injection volume was 2 μL.
The MS/MS was an AB Sciex 3200QTRAP triple quadrupole ion trap hybrid
mass spectrometer equipped with a Turbo V Ionsource. The measurements were
performed in positive mode with an ionization voltage of 5500 V at a temperature of
550 °C. The curtain gas setting was 30 psi. Gas 1 and Gas 2 were set to 60 psi. The
MS/MS detection was carried out in the SRM mode at m/z 722.4 → 352.4 for FB1 and
at m/z 706.35 → 336.3 for FB2 and FB3. The SRM transition for FB2 and FB3 could not
be independent. In regard to the peptides, the MS/MS detection was carried out in SRM
mode at m/z 407.2 → 186.2 for T18p and at m/z 432.2 → 383.2 for T19p. The other
MS/MS parameters and values are shown in Table 3-1. The MS/MS conditions were
tuned and optimized by the infusion of the sample solutions with a syringe pump.
Instrument control and data acquisition were carried out using Analyst 1.6.1 Software,
and the data was processed using MultiQuant 2.1.1 Software.

48
Table 3-1 MS/MS parameters and values of samples
Parameter Fumonisins Phosphorylated peptides
FB1 FB2 and FB3 T18p T19p
Declustering potential/V 101 66 40 40
Entrance potential/V 10 9.5 4 3
Collision energy/V 39 39 20 20
Collision cell exit potential/V 62 56 25 23
Dwell time per transition/ms 100 100 100 100

49
3.2.4. The column hardware
The chromatographic tubes made of stainless steel (150 mm x 2.1 mm I.D.)
and GL tubes (150 mm x 2.0 mm I.D.) were utilized without any deactivation treatments.
The sintered frits were made of stainless steel, PEEK, and PE. The S-S column was
composed of a stainless steel tube and stainless steel frits. The GL-PEEK column was
composed of a GL tube and PEEK frits. The GL-PE column was composed of a GL tube
and PE frits. Three columns were packed with L-column2 ODS 3 μm particles
(Chemicals Evaluation and Research Institute, Tokyo, Japan) from the same lot.
3.2.5. Carryover by duplicated solvent gradient method
The carryover values were calculated using the peak area ratio that eluted by
the second gradient to the first gradient in the duplicated solvent gradient method.
This peak area ratio was defined as the relative carryover. The use of relative
carryover had two advantages in the evaluation. First, the ratio was not directly related
to the absolute sample concentration. Second, the amount of the absolute carryover in
the analyte could be estimated by the relative carryover and concentration of the
preceding sample.19
The average relative carryovers were calculated by 6 repeated injections
using the duplicated solvent gradient method. The standard sample solutions
contained 1 mg/L fumonisins and 500 fmol/μL phosphorylated peptides. The samples
were evaluated in the three columns made of different materials, and the carryover
values were calculated.
3.2.6. Calibration curve of phosphorylated peptides in bioanalysis

50
The effect of the column hardware on the calibration curve of the standard
solution of phosphorylated peptides was investigated. These investigations involved the
carryover. The ULOQs of T18p and T19p were set to 500 fmol/μL. First, the standard
solutions of the phosphorylated peptides were prepared at concentrations of 5, 10, 25,
50, 100, 250, and 500 fmol/μL. Each standard sample solution was injected 6 times,
from low to high concentrations in each column; the calibration curves of the average
area were determined, and the weighting was found to be 1/x. Next, the relative
carryover of each column was calculated using the blank sample solution and the
ULOQ standard sample solution.
3.2.7. Injection carryover
Samples that were eluted by injection operation were not included in the
carryover calculated by the duplicated solvent gradient method. The injection
carryover could be calculated by subtracting the carryover values calculated by the
duplicated solvent gradient method from the carryover values calculated by the blank
injection. Thus, the method might be useful to compare the carryover in autosamplers.
The carryover of the injection operation in the autosampler was investigated.
The average relative carryovers were calculated for 6 repeated injections of the
standard sample solution and blank sample solution. The standard sample solutions
were the same as those described in the previous section. The GL-PE column was
used for these experiments.

51
3.3. Results and discussion
3.3.1. Evaluation of the prepared columns
The theoretical plates of the three kinds of columns made from different
materials were measured as a quality control measure, before evaluating the column
material, using an optimized Shimadzu Prominence 20A series semi-micro LC.
Naphthalene was used as the sample to measure the plates and TF, and uracil was used
for measuring the void volume. The relative standard deviation of the TF of naphthalene
in 6 columns containing the same material ranged from 1.0% to 2.7%, and all columns
exhibited a TF ranging from 1.02 to 1.11 with 12400 to 14000 plates (Table 3-2). The
number of theoretical plates in the S-S column was the greatest among all the columns.
The retention time of uracil in the S-S column was 1.55 min, and that in the GL-PE and
GL-PEEK column was 1.45 min. This difference was caused by the column volume,
since the retention times in all GL-columns were the same.

52
Table 3-2 The chromatographic parameters of the prepared 6 columns for quality
control.
to/min tR/min N TF
Mean Mean SD Mean SD Mean SD
S-S column 1.55 8.15 0.03 14000 50 1.02 0.01
GL-PEEK column 1.45 7.56 0.04 12400 410 1.11 0.03
GL-PE column 1.45 7.58 0.03 12900 190 1.11 0.02
The isocratic mobile phase 60% acetonitrile was used for column testing, at a flow
rate of 0.2 mL/min. t0 is retention time of uracil. tR is retention time of naphthalene. N
and TF of naphthalene are calculated by USP method. The values are mean and SD of
6 columns.

53
3.3.2. Improvement of adsorption of phosphorylated compounds in the liquid
chromatography-tandem mass spectrometry system
When configuring the MS conditions upon flow injection, tailing peaks of the
phosphorylated compounds were detected. Since this was considered to affect the
interaction between the metal and them, the tubing between the autosampler and column
was replaced with 650 mm x 0.075 mm nanoViper tubing (Thermo Scientific, Bremen,
Germany), and the tubing between the column and MS/MS was replaced with 650 mm
x 0.075 mm PEEKsil tubing. In addition, the stainless steel electrode in the Turbo V
Ionsource was replaced with a PEEKsil hybrid electrode. The inner surface of the
hybrid electrode was made from fused silica capillary, and the peak shape was
significantly improved as compared to that of the stainless steel (Fig. 3-2). The
phosphorylated compounds were reported to interact with stainless steel commonly
used in LC/MS systems, which likely caused the severe peak tailing.20

54
0.0 0.2 0.4 0.6 0.8 1.0 1.2 1.4 1.6 1.80%
5%
10%
15%
20%
25%
30%
35%
40%
45%
50%
55%
60%
65%
70%
75%
80%
85%
90%
95%
100% 0.20
0.0 0.2 0.4 0.6 0.8 1.0 1.2 1.4 1.6 1.80%
5%
10%
15%
20%
25%
30%
35%
40%
45%
50%
55%
60%
65%
70%
75%
80%
85%
90%
95%
0.19
0.0 0.2 0.4 0.6 0.8 1.0 1.2 1.4 1.6 1.80%
5%
10%
15%
20%
25%
30%
35%
40%
45%
50%
55%
60%
65%
70%
75%
80%
85%
90%
95%
100% 0.14
Fig. 3-2 SRM chromatogram of improvement of FAD peak tailing by the LC-MS/MS
system without a column. (a) Standard system, (b) Replaced Nanoviper tubing and
PEEKsil tubing, (c) Replaced connecting tubes and Hybrid electrode.
(a) (b) (c)
Time/min Time/min Time/min
Rel
ativ
e in
tens
ity, %
Rel
ativ
e in
tens
ity, %
Rel
ativ
e in
tens
ity, %

55
3.3.3. Carryover by duplicated solvent gradient method
The carryovers observed from all samples in the duplicated solvent gradient
method did not include those of the blank sample injection. These corresponded to the
sum of the carryover of the tubing in the flow path and column, including the packing
materials and hardware.
The carryover values of FB1 in the S-S column were about 10 times greater
than those in the other columns (Table 3-3a). If the peak separation was not enough,
calculating the peak area was difficult due to the identical SRM transition of FB2 and
FB3. Fig. 3-3 shows the expanded SRM chromatogram of the FBs. The leading peaks
occurred in the carryover peak with the S-S column, and the separation of FB2 and
FB3 could not be achieved and the peak areas could not be calculated. Thus, we
calculated the carryover values using the sum of the peak areas of FB2 and FB3.
Leading peaks were not observed with the other columns. The S-S column showed a
tailing peak that eluted in the first solvent gradient, while the other columns showed
sharp peaks. These results were mainly due to the difference in metal ions on the inner
surface of the column hardware.15 Since metal ions hardly exist on the inner surface of
the GL-PEEK and GL-PE columns, the FBs were not adsorbed. The S/N of FB1 in the
GL-PE column was highest among all columns. Metal ions hardly exist on the inner
surface of the GL-PEEK and GL-PE columns; however, a good performance was
obtained when the GL-PE column was used. The polarity of the PEEK and PE frits
likely differed. The latter could not entrap FB1, since the difference in polarity
between FB1 and the PE frits was larger than that between FB1 and PEEK frits.21 PE is
highly hydrophobic, and powders were used as packing materials in reversed-phase
LC.22

56
The retention times of the carryover peak of FBs were in agreement with
those obtained by adding the start time of the second solvent gradient to the retention
time of the peak in the first solvent gradient. This indicated that FBs were adsorbed in
the tubing and/or in the inlet of the stainless steel frit.6 In addition, the carryover peaks
of FBs showed severe leading, indicating that the samples eluted at shorter retention
times. Therefore, the carryover occurred in the column.6 We considered that the
carryover in the leading peaks was due to the adsorption of FBs on the packing
materials, chromatographic tube, and/or outlet frit of the column made of stainless
steel. However, since the other columns did not show the leading peak, the packing
materials could be excluded. The carryover was caused by the chromatographic tube
and inlet frit because sharp peaks were obtained with the GL column.
In regard to the carryover observed with phosphorylated peptides, the values
and peak shape of the carryover peaks were similar to those of the FBs. The carryover
of T19p with the GL-PE column was reduced to one-tenth compared to that with the
S-S column (Table 3-3b). Fig. 3-4 shows the carryover peaks for T19p, which were
more asymmetric than those of T18p in all columns, likely because of stronger
interactions between T19p and metal ions in the columns.14, 23, 24 The carryover peak
in the S-S column showed leading. The carryover in the leading peaks was likely due
to adsorption of T18p and T19p on the chromatographic tube and/or outlet frit of the
column made of stainless steel.

57
Table 3-3 Comparison of mean and SD of carryover by duplicated solvent gradient
method and S/N using different column hardware.
Table 3-3a 1 mg/L fumonisins
FB1 FB3 FB2 FB2+FB3
Carryover, % S/N Carryover, % Carryover, % Carryover, %
Mean SD Mean SD Mean SD Mean SD Mean SD
S-S column 1.90 0.09 527 14 - - - - 2.76 0.16
GL PEEK column 0.18 0.04 693 12 0.36 0.04 0.56 0.09 0.49 0.07
GL PE column 0.20 0.06 792 15 0.47 0.02 0.68 0.02 0.67 0.05
Table 3-3b 500 fmol/μL phosphorylated peptides
T18p T19p
Carryover, % S/N Carryover, % S/N
Column Mean SD Mean SD Mean SD Mean SD
S-S column 1.31 0.06 396 16 4.28 0.44 323 26
GL PEEK column 0.24 0.02 392 52 0.67 0.18 370 33
GL PE column 0.21 0.04 483 43 0.42 0.12 417 32

58
5 10 15 20 250
2
4
6
8
10
Time/min
Rel
ativ
e in
tens
ity, %
5 10 15 20 250
2
4
6
8
10
Time/min
Rel
ativ
e in
tens
ity, %
5 10 15 20 250
2
4
6
8
10
Time/min
Rel
ativ
e in
tens
ity, %
5 10 15 20 250
2
4
6
8
10
Time/min
Rel
ativ
e in
tens
ity, %
5 10 15 20 250
2
4
6
8
10
Time/min
Rel
ativ
e in
tens
ity, %
5 10 15 20 250
2
4
6
8
10
Time/min
Rel
ativ
e in
tens
ity, %
(a)
(f)
(d)
(e)
(c)
(b)
FB1
Carryover of FB1
Carryover of FB1
FB1
FB1
Carryover of FB1
Carryover of FB2
Carryover of FB2
Carryover of FB2
Carryover of FB3
Carryover of FB3
Carryover of FB3
FB2
FB3
FB2
FB2
FB3
FB3
Fig. 3-3 Expanded SRM chromatograms of fumonisins by the duplicated solvent
gradient method. (a) SRM chromatogram of FB1 using S-S column. (b) SRM
chromatogram of FB3 and FB2 using S-S column. (c) SRM chromatogram of FB1 using
GL-PEEK column. (d) SRM chromatogram of FB3 and FB2 using GL-PEEK column.
(e) SRM chromatogram of FB1 using GL-PE column. (f) SRM chromatogram of FB3
and FB2 using GL-PE column.

59
5 10 15 20 250
2
4
6
8
10
Time/min
Rel
ativ
e in
tens
ity, %
5 10 15 20 250
2
4
6
8
10
Time/min
Rel
ativ
e in
tens
ity, %
5 10 15 20 250
2
4
6
8
10
Time/min
Rel
ativ
e in
tens
ity, %
5 10 15 20 250
2
4
6
8
10
Time/min
Rel
ativ
e in
tens
ity, %
5 10 15 20 250
2
4
6
8
10
Time/min
Rel
ativ
e in
tens
ity, %
5 10 15 20 250
2
4
6
8
10
Time/min
Rel
ativ
e in
tens
ity, %
(a)
(f)
(d)
(e)
(c)
(b)
Carryover of T19p
Carryover of T19p
Carryover of T19pCarryover of T18p
Carryover of T18p
Carryover of T18p
T18p
T18p
T18p
T19p
T19p
T19p
Fig. 3-4 Expanded SRM chromatograms of phosphorylated peptides by the duplicated
solvent gradient method. (a) SRM chromatogram of T18p using S-S column. (b) SRM
chromatogram of T19p using S-S column. (c) SRM chromatogram of T18p using
GL-PEEK column. (d) SRM chromatogram of T19p using GL-PEEK column. (e)
SRM chromatogram of T18p using GL-PE column. (f) SRM chromatogram of T19p
using GL-PE column.
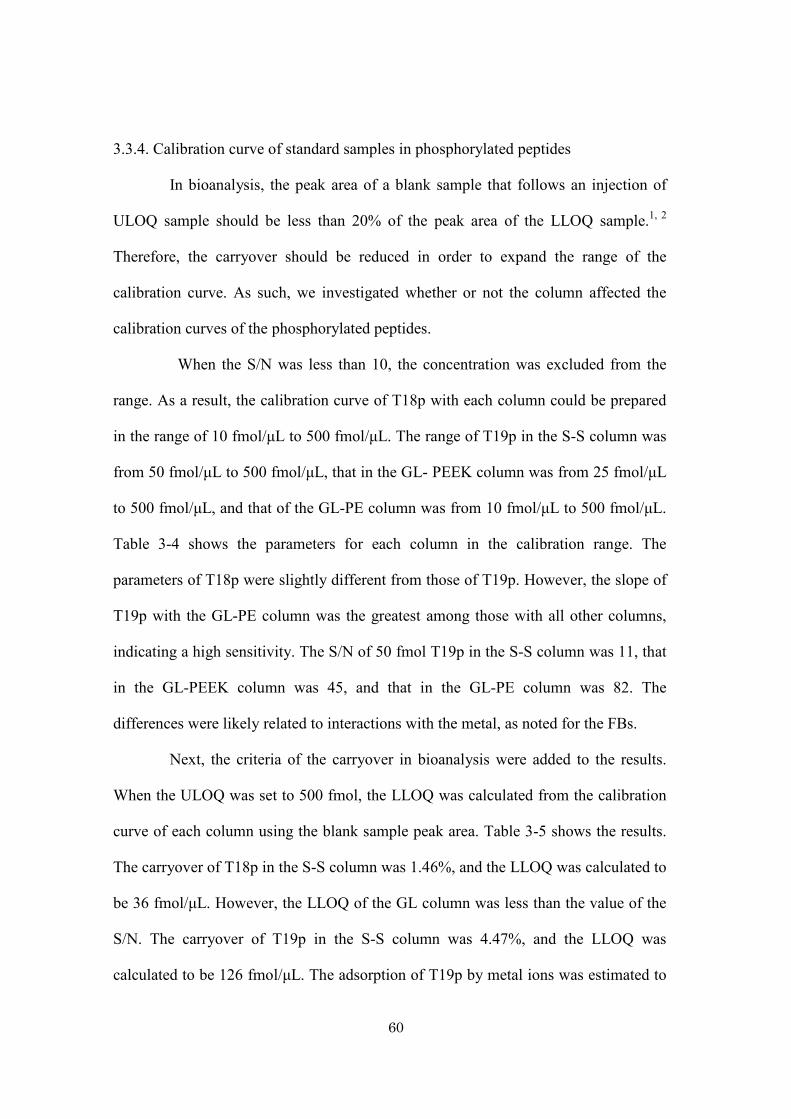
60
3.3.4. Calibration curve of standard samples in phosphorylated peptides
In bioanalysis, the peak area of a blank sample that follows an injection of
ULOQ sample should be less than 20% of the peak area of the LLOQ sample.1, 2
Therefore, the carryover should be reduced in order to expand the range of the
calibration curve. As such, we investigated whether or not the column affected the
calibration curves of the phosphorylated peptides.
When the S/N was less than 10, the concentration was excluded from the
range. As a result, the calibration curve of T18p with each column could be prepared
in the range of 10 fmol/μL to 500 fmol/μL. The range of T19p in the S-S column was
from 50 fmol/μL to 500 fmol/μL, that in the GL- PEEK column was from 25 fmol/μL
to 500 fmol/μL, and that of the GL-PE column was from 10 fmol/μL to 500 fmol/μL.
Table 3-4 shows the parameters for each column in the calibration range. The
parameters of T18p were slightly different from those of T19p. However, the slope of
T19p with the GL-PE column was the greatest among those with all other columns,
indicating a high sensitivity. The S/N of 50 fmol T19p in the S-S column was 11, that
in the GL-PEEK column was 45, and that in the GL-PE column was 82. The
differences were likely related to interactions with the metal, as noted for the FBs.
Next, the criteria of the carryover in bioanalysis were added to the results.
When the ULOQ was set to 500 fmol, the LLOQ was calculated from the calibration
curve of each column using the blank sample peak area. Table 3-5 shows the results.
The carryover of T18p in the S-S column was 1.46%, and the LLOQ was calculated to
be 36 fmol/μL. However, the LLOQ of the GL column was less than the value of the
S/N. The carryover of T19p in the S-S column was 4.47%, and the LLOQ was
calculated to be 126 fmol/μL. The adsorption of T19p by metal ions was estimated to

61
be very high. Therefore, the carryover was high, and the LLOQ also increased. In
contrast, the LLOQ of the GL-PE column was one-tenth that of the S-S column; the
value was 13.4 fmol/μL. Since the GL-PE column and GL-PEEK hardly contain metal
in the flow path, the LLOQ was low, and the range of the calibration curve was
expanded.

62
Table 3-4 Comparison of calibration curves obtained using different column hardware.
T18p T19p
Column Slope Intercept R2 Slope Intercept R2
S-S column 61.3 26 0.992 34.1 -167 0.995
GL-PEEK column 66.8 152 0.990 51.3 -3 0.995
GL-PE column 72.3 119 0.991 72.9 15 0.994

63
Table 3-5 Comparison of carryover and LLOQ of T18p (upper) and T19p (bottom)
obtained using different column hardware.
Area
Column ULOQ/cps Blank/cps Carryover, % LLOQ/fmol μL-1
S-S column 30630 448 1.46 35.8
GL PEEK column 32510 205 0.63 10>*
GL PE column 34450 170 0.49 10>*
Area
Column ULOQ/cps Blank/cps Carryover, % LLOQ/fmol μL-1
S-S column 16940 757 4.47 126.3
GL PEEK column 25250 206 0.82 25>*
GL PE column 35080 211 0.60 13.4
*Less than the range of the calibration curve.

64
3.3.5. Injection carryover
The duplicated solvent gradient method and the blank injection method were
used. The carryover values in the former method were calculated using the value
without the blank sample injection, and the latter included the carryover of the blank
sample injection. The differences corresponded to carryover in the injection operation.
Table 3-6 shows the carryover values of the injection operation calculated by these
methods using the GL-PE column. The calculated carryover of the injection operation
was not dependent on the type of column.
Carryover of FB2 by the blank injection method was 0.79%, and that by the
duplicated solvent gradient method was 0.68%. This difference (0.11%) was due to
carryover in the injection operation. Therefore, improvements in the flow path,
including the inlet frit of the column, were more effective than those in the washing of
the autosampler needle. Using the biocompatible-UHPLC and the conventional needle
washing step, carryover of FBs hardly occurred. The carryover in the injection
operation of T18p and T19p were 0.27 and 0.18%, respectively. The carryover might
be improved by washing the autosampler.
Even though numerous reports indicated that carryover occurs in the
autosampler and column, the percentages were not shown. If the carryover of FB1 and
T18p were not caused by the GL-PE and GL-PEEK columns, the carryover was
calculated by the duplicated solvent gradient method and corresponded to those of the
tubing within the flow path. The carryover value of FB1 with the S-S column was 1.67%
and that of the system was 0.23%. The carryover of T18p with the S-S column was
0.82% and that of the system was 0.49%. We found that the majority of the carryover in
our system was due to the S-S column and the gradient method.

65
Table 3-6 Comparison of mean of carryover (%) obtained using PE column.
Carryover FB1 FB3 FB2 T18p T19p
By the blank injection 0.23 0.53 0.79 0.49 0.60
By the duplicated solvent gradient 0.20 0.47 0.68 0.21 0.42
Injection carryover 0.03 0.06 0.11 0.28 0.18
These values are the average of the percent carryovers calculated by the blank sample
and duplicated solvent gradient method.

66
3.4. Conclusions
The use of a GL-PE column improved the peak shape and carryover more
effectively than the other columns. The GL-PEEK and GL-PE columns greatly
improved the carryover of fumonisins and phosphorylated peptides, and the carryover
of FB1 could be reduced to 1/10. In addition, the duplicated solvent gradient method
could be used to evaluate the column carryover. The use of GL-PEEK and GL-PE
columns also improved the LLOQ of phosphorylated peptides, and the range of the
calibration curve could be expanded. Since carryover peaks in the GL-PE column were
symmetrical peak of the samples, carryover did not occur in the column. The carryover
calculated using the duplicated solvent gradient method corresponded to that within the
tubing within the flow path. The carryover value of FB1 in the S-S column was 1.67%
and that of the system was 0.23%. That of T18p in the S-S column was 0.82% and that
of the system was 0.49%. We found that the majority of the carryover in our system
occurred due to the S-S column and the method.

67
3.5. References
1. EMA, Guideline on the validation of bioanalytical methods,
EMA/CHMP/EWP/192217/2009 Rev.1 Corr., 21 July, 2011.
2. US FDA, Guideline for Industry; Bioanalytical Method Validation, Draft,
September, 2013.
3. C. Chassaing, J. Luckwell, P. Macrae, K. Saunders, P. Wright, and R. Venn,
Chromatographia, 2000, 53, 122.
4. S. Dolman, S. Eeltink, A. Vaast, and M. Pelzing, J. Chromatogr. B, 2013, 912, 56.
5. R. ter Heine, C. G. Alderden-Los, H. Rosing, M. J. Hillebrand, E. C. van Gorp, A. D.
Huitema, and J. H. Beijnen, Rapid Commun. Mass Spectrom., 2007, 21, 2505.
6. N. C. Hughes, E. Y. Wong, J. Fan, and N. Bajaj, The AAPS Journal, 2007, 9, 353.
7. J. W. Dolan, LC GC North America, 2001, 19, 164.
8. J. W. Dolan, LC GC North America, 2001, 19, 478.
9. P. T. Vallano, S. B. Shugarts, E. J. Woolf, and B. K. Matuszewski, J. Pharm. Biomed.
Anal., 2005, 36, 1073.
10. R. P. Grant, C. Cameron, and S. Mackenzie-McMurter, Rapid Commun. Mass
Spectrom., 2002, 16, 1785.
11. K. W. Dunn-Meynell, S. Wainhaus, and W. A. Korfmacher, Rapid Commun. Mass
Spectrom., 2005, 19, 2905.
12. A. Schellen, B. Ooms, D. van de Lagematt, R. Vreeken, and W. D. van Dongen, J.
Chromatogr. B, 2003, 788, 251.
13. Y. Asakawa, C. Ozawa, K. Osada, S. Kaneko, and N. Asakawa, J. Pharm. Biomed.
Anal., 2007, 43. 683.
14. M. Tamura, K. Matsumoto, J. Watanabe, J. Iida, Y. Nagatomi, and N. Mochizuki, J.

68
Sep. Sci., 2014, 00, 1.
15. Shimadzu Technical Report, Vol. 17.
http://www2.shimadzu.com/applications/lcms/Shimadzu_TechReport_Vol17_LCMS
16. M. Tamura, A. Uyama, and N. Mochizuki, Anal. Sci., 2011, 27, 629.
17. T. Gazzotti, E. Zironi, B. Lugoboni, A. Barbarossa, A. Piva, and G. Pagliuca, Food
Chemistry, 2011, 125, 1379.
18. D. H. Vu, R. A. Koster, A. M. A. Wessels, B. Greijdanus, J. W. C. Alffenaar, and D.
R. A. Uges, J. Chromatogr. B, 2013, 917, 1.
19. W. Zeng, D. G. Musson, A. L. Fisher, and A. Q. Wang, Rapid Commun. Mass
Spectrom., 2006, 20, 635.
20. A. Wakamatsu, K. Morimoto, M. Shimizu, and S. Kudoh, J. Sep. Sci., 2005, 28,
1823.
21. H. Sakamaki, T. Uchida, L. W. Lim, and T. Takeuchi, J. Chromatogr. A, 2015, in
press.
22. Y. Shioi and S. I. Beale, Anal. Biochem., 1987, 162, 493.
23. S. Liu, C. Zhang, J. L. Campbell, H. Zhang, K. K. C. Yeung, V. K. M. Han, and G.
A. Lajoje, Rapid Commun. Mass Spectrom., 2005, 19, 2747.
24. T. De Vijlder, J. Boschmans, E. Witters, and F. Lemiere, Int. J. Mass Spectrom.,
2011, 304, 83.

69
Conclusions
We evaluated the influence of column hardware on LC-MS analysis of
phosphorylated compounds. In comparison with 2 kinds of the tubes, the S/N of FAD
with GL-S column was 6 times higher than that of S-S column, and the intensity was 4
times larger for the former than the latter. The intensity and S/N of LPA were 1.7 times
higher for GL-S column than S-S column and the TF of FAD and LPA with GL-S
column were improved, compared to S-S column. In comparison with 4 kinds of the
frits, the intensity and the S/N with GL-PE column were higher than those of the other
columns. The intensity and the S/N of FAD for GL-PE column were 19 times and 30
times higher than that for GL-S column, respectively. We suggest that the mechanisms
of retention in our system were affected more by the Fe ions present on the inner surface
of the S-S column. Since the specific surface area of a pair of frits was 70 times larger
than that of a chromatographic tube (150 mm x 2.1 mm), the frits were found to have
more effective improvement of the S/N as well as the intensity than the
chromatographic tubes, when phosphorylated compounds were analyzed by LC-MS.
When the phosphorylated compounds were analyzed by LC-MS(/MS) using a GL-PE
column, the intensity and S/N were increased.
In order to eliminate carryover of injection operation in autosampler, the
calculated carryover by the duplicated solvent gradient method was developed.GL-PE
column improved most effectively the peak shape and carryover compared to the other
columns. The use of GL-PEEK and GL-PE columns greatly improved the carryover of
fumonisins and phosphorylated peptides, and carryovers of FB1 could be reduced to
1/10. In addition, the duplicated solvent gradient method could be used for evaluating
70
the column carryover. The use of GL-PEEK and GL-PE columns also improved the
LLOQ of phosphorylated peptides, and the range of the calibration curve was able to
expand. If the carryovers of FB1 and T18p were not caused by GL-PE and/or GL-PEEK
columns, those calculate by using the duplicated solvent gradient method were
corresponded to those of the tubings of flow path. The carryover values of FB1 with S-S
column were 1.67% and those of the system were 0.23%. Those of T18p with S-S
column were 0.82% and those of the system were 0.49%. We found that the majority of
carryover has occurred by S-S column in our system and the method.
71
Figure list
Chapter 2
Fig. 2-1 Chemical Structures of AMPs, FAD and LPA.
Fig. 2-2 SIM chromatograms of FAD (left) and LPA (right) using S-S column (a),
GL-S column (b). A comparison of chromatographic tube is shown.
Fig. 2-3 Effect of concentration of Fe3+ in LPA sample standard solution on the peak
area, peak height and TF of LPA.
Fig. 2-4 SIM chromatograms of FAD (left) and LPA (right) using GL-S column (a),
GL-Ti column (b), GL-PEEK column(c) and GL-PE column(d). A comparison of frit
is shown.
Fig. 2-5 SIM chromatograms of 1 μmol TRDIYETD-pY-YRK (left) ,
SFVLNPTNIGM-pS-KSSQGHVTK(center) and DLDVPIPGRFDRRV-pS-VAAE
(right) using GL-S column (a), GL-Ti column (b), GL-PEEK column (c) and GL-PE
column (d).

72
Chapter 3
Fig. 3-1 Structure of fumonisin B1 (R1=OH, R2=OH), fumonisin B2 (R1=H, R2=OH),
fumonisin B3 (R1=OH, R2=H).
Fig. 3-2 SRM chromatogram of improvement of FAD peak tailing by the LC-MS/MS
system without a column. (a) Standard system, (b) Replaced Nanoviper tubing and
PEEKsil tubing, (c) Replaced connecting tubes and Hybrid electrode.
Fig. 3-3 Expanded SRM chromatograms of Fumonisins by the duplicated solvent
gradient method. (a) SRM chromatogram of FB1 using S-S column. (b) SRM
chromatogram of FB3 and FB2 using S-S column. (c) SRM chromatogram of FB1
using GL-PEEK column. (d) SRM chromatogram of FB3 and FB2 using GL-PEEK
column. (e) SRM chromatogram of FB1 using GL-PE column. (f) SRM chromatogram
of FB3 and FB2 using GL-PE column.
Fig. 3-4 Expanded SRM chromatograms of phosphorylated peptides by the duplicated
solvent gradient method. (a) SRM chromatogram of T18p using S-S column. (b) SRM
chromatogram of T19p using S-S column. (c) SRM chromatogram of T18p using
GL-PEEK column. (d) SRM chromatogram of T19p using GL-PEEK column. (e)
SRM chromatogram of T18p using GL-PE column. (f) SRM chromatogram of T19p
using GL-PE column.

73
Table list
Chapter 2
Table 2-1 The types of chromatographic tube and frit used in each specific column.
Table 2-2 The chromatographic parameters of the prepared 6 columns for quality
control.
Table 2-3 Comparison of the analysis of copper oxinate (0.4ng) as a
non-phosphorylated compound for prepared 5 kinds of columns.
Table 2-4 Comparison of chromatographic parameter between S-S and GL-S columns
with FAD (50 ng), LPA (10 ng) and AMPs (2.5 ng) used as the samples.
(Chromatographic tubes were compared, i.e. between S and GL, while the same S-frit
was used)
Table 2-5 Comparison of chromatographic parameters for FAD (50 ng), LPA (10 ng)
and AMPs (2.5 ng). (4 types of frits were compared while the same kind of
GL-chromatographic tube was used)
Table 2-6 Chromatographic parameters of phosphorylated peptides.

74
Chapter 3
Table 3-1 MS/MS parameters and values of samples.
Table 3-2 The chromatographic parameters of the prepared 6 columns for quality
control.
Table 3-3 Comparison of mean and SD of carryover by duplicated solvent gradient
method and S/N using different column hardware.
Table 3-4 Comparison of calibration curves obtained using different column hardware.
Table 3-5 Comparison of carryover and LLOQ of T18p (upper) and T19p (bottom)
obtained using different column hardware.
Table 3-6 Comparison of mean of carryover (%) obtained using PE column.

75
List of publications
1. Hiroshi Sakamaki, Takeharu Uchida, Lee Wah Lim, and Toyohide Takeuchi,
“Evaluation of column hardware on liquid chromatography-mass spectrometry of
phosphorylated compounds”, Journal of chromatography A, 2015, 1381, 125.
2. Hiroshi Sakamaki, Takeharu Uchida, Lee Wah Lim, and Toyohide Takeuchi,
“Evaluation of column carryover of phosphorylated peptides and fumonisins by
duplicated solvent gradient method in liquid chromatography/tandem mass
spectrometry”, Analytical Science, 2015, 31, 91.

76
List of presentations
1. Hiroshi Sakamaki, Yoshihisa Sudo, Lee Wah Lim, and Toyohide Takeuchi,
“Influence of Column Materials on LC/MS analysis of Phosphate Compounds”, The
23rd Conference of the Society for Chromatographic Science, Gifu, November,
14-16, 2012 (Poster Presentation)
2. Hiroshi Sakamaki, Yoshihisa Sudo, Lee Wah Lim, and Toyohide Takeuchi,
“Reduction in the adsorption of phosphorylated compounds in LC-MS”, The 133ed
Annual Meeting of the Pharmaceutical Society of Japan, Yokohama, March, 27-30,
2013 (Poster Presentation)
3. Tomoki Obata, Hiroshi Sakamaki, Yoshihisa Sudo, Lee Wah Lim, and Toyohide
Takeuchi,
“Investigation of analytical conditions for utilizing the characteristic of the
Phenylhexylcolumn effectively” The 133rdAnnual Meeting of the Pharmaceutical
Society of Japan, Yokohama, March, 27-30, 2013 (Poster Presentation)
4. Hiroshi Sakamaki, Yoshihisa Sudo, Lee Wah Lim, and Toyohide Takeuchi,
“Influence of Column Materials on Biocompatible LC/MS/MS Analysis Indicated
by Phosphorylated Compounds” The 24th Conference of the Society for
Chromatographic Science, Tokyo, November 11-13, 2013 (Oral Presentation)
5. Hiroshi Sakamaki, Takeharu Uchida, Lee Wah Lim, and Toyohide Takeuchi,

77
“Evaluation and applications of metal free column in LC/MS/MS “ The 134th
Annual Meeting of the Pharmaceutical Society of Japan, Kumamoto, March, 27-30,
2014 (Poster Presentation)
6. Yuta Nakano, Hiroshi Sakamaki, Takeharu Uchida, Lee Wah Lim, and Toyohide
Takeuchi,
“Effect of Metal Free Column on LC/MS/MS Analysis” The 27th Symposium on
Biomedical-Analytical Sciences, Tokyo, August 20-21, 2014 (Poster Presentation)
7. Hiroshi Sakamaki, Takeharu Uchida, Lee Wah Lim, and Toyohide Takeuchi,
“Reduction of carryover using metal-free column on Biocompatible LC/MS/MS”,
The 25th Conference of the Society for Chromatographic Science, Tokyo, December
11-13, 2014 (Oral Presentation)
78
Curriculum vitae
Hiroshi SAKAMAKI
Born on June 17, 1976 in Aichi prefecture, Japan.
1992 – 1995: Okazaki-nishi High School, Aichi, Japan.
1995 – 1999: Bachelor at Department of Applied Chemistry, faculty of Engineering,
Gifu University, Gifu, Japan.
1999 – 2001: Master Degree at Applied Chemistry Division, Graduate School of
Engineering, Gifu University, Gifu, Japan.
2001 – now: Chemicals Evaluation and Research Institute, Japan (CERI).
2012 – 2015: Doctoral Degree at Material Engineering Division, Graduate School of
Engineering, Gifu University, Gifu, Japan.

79
Acknowledgements
I would like to express my sincerest gratitude and appreciation to my advisor
Professor Toyohide Takeuchi, for great support to me throughout my study with his
wide knowledge, patience and understanding. His precious suggestions, encouragement
and effort have provided a good basis for my dissertation.
I would like to express my heartfelt gratitude to Dr. Lee Wah Lim for each
inspirational, supportive, and helped me in all the time of research and writing
dissertation.
In order to obtain a doctorate, it is deeply grateful to the CERI that had been
provided me a great deal of time and financial support.
Sincere thanks to all members in Takeuchi’s laboratory for their kind support,
and all members of my division in CERI.
I would like to express gratitude for Dr. Tadokoro Hiroshi, Mr. Takeharu
Uchida and late Dr. Yoshihisa Sudo for be giving me the opportunity and many
supports in order to begin this study.
Last but not least, I would like to thank my father and mother, mother in law.
Special word of gratitude to my wife Yoshie and my sons Hodaka, Eita, and Ryowa for
their patience, deep understanding, great support, help and their unconditional love.
Hiroshi Sakamaki
March 2015