Embed Size (px)
Citation preview

Title Genetic population structure of Hemigrammocypris rasborella(Cyprinidae) inferred from mtDNA sequences
Author(s)
Watanabe, Katsutoshi; Mori, Seiichi; Tanaka, Tetsuo;Kanagawa, Naoyuki; Itai, Takahiko; Kitamura, Jyun-ichi;Suzuki, Noriyasu; Tominaga, Koji; Kakioka, Ryo; Tabata,Ryoichi; Abe, Tsukasa; Tashiro, Yushu; Hashimoto, Yoshiki;Nakajima, Jun; Onikura, Norio
Citation Ichthyological Research (2014), 61(4): 352-360
Issue Date 2014-05-08
URL http://hdl.handle.net/2433/200196
Right The final publication is available at Springer viahttp://dx.doi.org/10.1007/s10228-014-0406-y.
Type Journal Article
Textversion author
Kyoto University

1
Genetic population structure of Hemigrammocypris rasborella (Cyprinidae) inferred from mtDNA sequences
Katsutoshi Watanabe · Seiichi Mori · Tetsuo Tanaka · Naoyuki Kanagawa · Takahiko Itai ·
Jyun-ichi Kitamura · Noriyasu Suzuki · Koji Tominaga · Ryo Kakioka · Ryoichi Tabata ·
Tsukasa Abe · Yushu Tashiro · Yoshiki Hashimoto · Jun Nakajima · Norio Onikura
K. Watanabe (*) · K. Tominaga · R. Kakioka · R. Tabata
Department of Zoology, Division of Biological Science, Graduate School of Science, Kyoto
University, Kitashirakawa-Oiwakecho, Sakyo-ku, Kyoto 606-8502, Japan e-mail:
Present Address:
K. Tominaga Kwansei Gakuin Senior High School, 1-155 Uegahara-ichibancho, Nishinomiya,
Hyogo 662-8501, Japan
Present Address:
R. Kakioka Center for Ecological Research, Kyoto University, 509-3 Hirano 2-chome, Otsu, Shiga
520-2113, Japan
S. Mori
Biological Laboratory, Gifu-Keizai University, 5-50 Kitagata, Ogaki, Gifu 503-8550, Japan
T. Tanaka
The Museum of Nature and Human Activities, Hyogo, 6 Yayoigaoka, Sanda, Hyogo 669-1546,
Japan

2
N. Kanagawa
4-3-26 Honmachi, Fujieda, Shizuoka 426-0018, Japan
T. Itai
NPO Network for Shizuoka Prefecture Museum of Natural History, 5-10-28-604 Chiyoda, Aoi-ku,
Shizuoka 420-0803, Japan
J. Kitamura
Mie Prefectural Museum, 3060 Ishinden-Kouzubeta, Tsu, Mie 514-0061, Japan
N. Suzuki
Graduate School of Bioresources, Mie University, 1577 Kurima-machiyamachi, Tsu, Mie 514-8507,
Japan
Chiba Biodiversity Center, Nature Conservation Division, Environmental and Community Affairs
Department, Chiba Prefectural Government, 955-2 Aoba-cho, Chuo-ku, Chiba 260-8682, Japan
T. Abe
Biodiversity Research Division, Lago Co., Ltd, Okayama Freshwater Fish Society, 396-2 Taga,
Omihachiman, Shiga 523-0821, Japan
Y. Tashiro
Sanagochi Nature Center, 5-8 Okawara, Sanagochi, Tokushima 771-4102, Japan
Present Address:
Present Address:
Y. Tashiro
Center of Redevelopment of Pollution-Damaged Areas, Osaka, 1-1-1 Chibune, Nishiyodogawa-ku,
Osaka 555-0013, Japan
Y. Hashimoto

3
Conservation of Fresh-water Fish of Kagawa, 643-2 Yashimanishimachi, Takamatsu, Kagawa
761-0113, Japan
J. Nakajima
Fukuoka Institute of Health and Environmental Sciences, Mukaizano 39, Dazaifu, Fukuoka
818-0135, Japan
N. Onikura
Fishery Research Laboratory, Kyushu University, 4-46-24 Tsuyazaki, Fukutsu, Fukuoka 811-3304,
Japan

4
Abstract The genetic population structure of the small cyprinid Hemigrammocypris rasborella,
distributed widely in lowlands of western Japan, was examined using partial sequence data of
mitochondrial DNA (mtDNA). Molecular phylogenetic analysis revealed that the populations of the
western Kyushu region were markedly differentiated from all eastern populations, such that the
groups would be comparable to different species; their divergence was inferred to have occurred in
the Late Miocene–Pliocene. Also, a largely divergent mtDNA group (with divergence in the early
Pleistocene) was found in the Sanyo and northeastern Shikoku regions, forming a secondary contact
zone in the western Kinki with the eastern mtDNA group. To date, these aspects of the population
structure of H. rasborella appear to be unique among lowland fishes in western Japan. Deeper
understanding of the formation processes of freshwater faunas in western Japan will require further
comparisons of the phylogeographic patterns and ecological traits of constituent species.
Keywords Cytochrome b (cytb) · Molecular dating · Phylogeography · Secondary contact · Western
Japan
5
Introduction
The Japanese Archipelago is an island system extending over 2,000 km in a northeast–southwest
direction at the eastern margin of East Asia. It harbors unique, rich biota with regional heterogeneity.
Strictly freshwater fishes, which live only in fresh waters throughout their life history, are some of
the best organisms with which to investigate historical aspects of such biota, including relationships
between geology and biota formation, because they are easily isolated by geological barriers such as
mountains and straits (Avise 2000). Previous studies have shown that the freshwater fish fauna of
northeastern Hokkaido is primarily divided from the fauna of southwestern areas, and that there is a
secondary large change across the central highlands, or the region around the Fossa Magna, a great
rift valley running north to south through central Honshu (Nishimura 1974; Watanabe 1998, 2012).
Western Japan, comprised of the regions west of the Fossa Magna, including the western part of
Honshu, Shikoku, and Kyushu islands, is known to have especially rich freshwater fish fauna
(Nishimura 1974; Watanabe 2012). There are two major cores of endemicity, as defined by unique
species; i.e., the eastern part of western Japan (Lake Biwa and adjacent areas) and northeastern
Kyushu (Watanabe 2012). Elucidation of the formation processes of the freshwater fish fauna of
western Japan is hence an important step for understanding the origins and development of the
freshwater biota of Japan.
Phylogeographic assessments of the population structure and historical dynamics of species
using molecular genetic markers play an essential role in the study of historical biogeography,
especially over relatively short geological time scales (the Neogene–Quaternary) (Avise 2000). Such
approaches have been previously applied to several freshwater fishes distributed in western Japan.
For example, in some cyprinids widely occurring in the lowlands of western Japan, the easternmost
populations around the Ise Bay area (Fig. 1) exhibit large divergence from other populations, as
evidenced by mitochondrial DNA (mtDNA) data (Watanabe et al. 2010a; Komiya et al. 2013). This
suggests that a mountain system (the Suzuka Mountains), which forms a geological barrier dividing
watersheds, has had a notable impact on population structure and the regional heterogeneity of
freshwater fauna. This also suggests that gene flow existed among populations of those species in
western areas after the uplifting of the mountains since the early Pleistocene (Kawabe 1994). On the
other hand, Minamimedaka, Oryzias latipes (Oryziidae), shows a different population structure, with

6
its westernmost populations in western Kyushu possessing the most divergent mtDNA in western
Japan (Takehana et al. 2003). Phylogeographic studies on freshwater fishes in western Japan have
been fragmentary, and general patterns of population structures and their relations to geological
patterns and processes have not been elucidated sufficiently. Accumulations and comparisons of
phylogeographic information on more fish species (and other aquatic organisms) are necessary to
clarify the faunal history of western Japan.
Hemigrammocypris rasborella is a small cyprinid fish that is endemic to Japan and is a
representative lowland freshwater fish distributed across western Japan (Nakamura 1969; Kanagawa
and Itai 1998). This species was once commonly found in ponds, marshes, and streams in its
distribution range. However, due mainly to habitat degradation (e.g., urbanization and river
improvement) and the introduction of predatory fishes, the species is declining throughout its range
(Kanagawa and Itai 1998; Nakajima et al. 2006), and has been designated as a critically endangered
species by Japanese national and local governments (e.g., Japan Ministry of the Environment 2003).
Previous studies have revealed that some populations of this species have maintained their genetic
diversity and that the species shows clear genetic population structure associated with watersheds in
the eastern part of western Japan (Watanabe and Mori 2008; Watanabe et al. 2009). Variation in
body shape is also reported among populations collected over small scales (¥100 km), suggesting
possible genetic divergence and local adaptation among populations of this species (Akada and
Yodo 2006). The phylogeographic patterns of this species throughout its entire range will provide
important information on and insights into geographical divergence and interchange among regional
populations and faunas in western Japan, as well as the species’ conservation.
This study was conducted primarily to clarify the population structure of H. rasborella using
mtDNA sequence data from specimens collected across the entire range of the species. Then, we
examined whether or not cyprinids found in lowland habitats in western Japan share the same or
similar population structures. Furthermore, estimating the divergence times among the detected
major geographical groups, the distribution and isolation processes of this species are discussed with
reference to potentially associated geological events.
Recently, Zarske (2013) claimed that Barilius neglectus, which was described by Stieler (1907)
based on juveniles of German aquarium fish imported from Japan, is the senior synonym of H.

7
rasborella, which was originally described by Fowler (1910). However, because of the potential for
taxonomic confusion, as raised in this study, we tentatively use H. rasborella in this paper.
Materials and methods
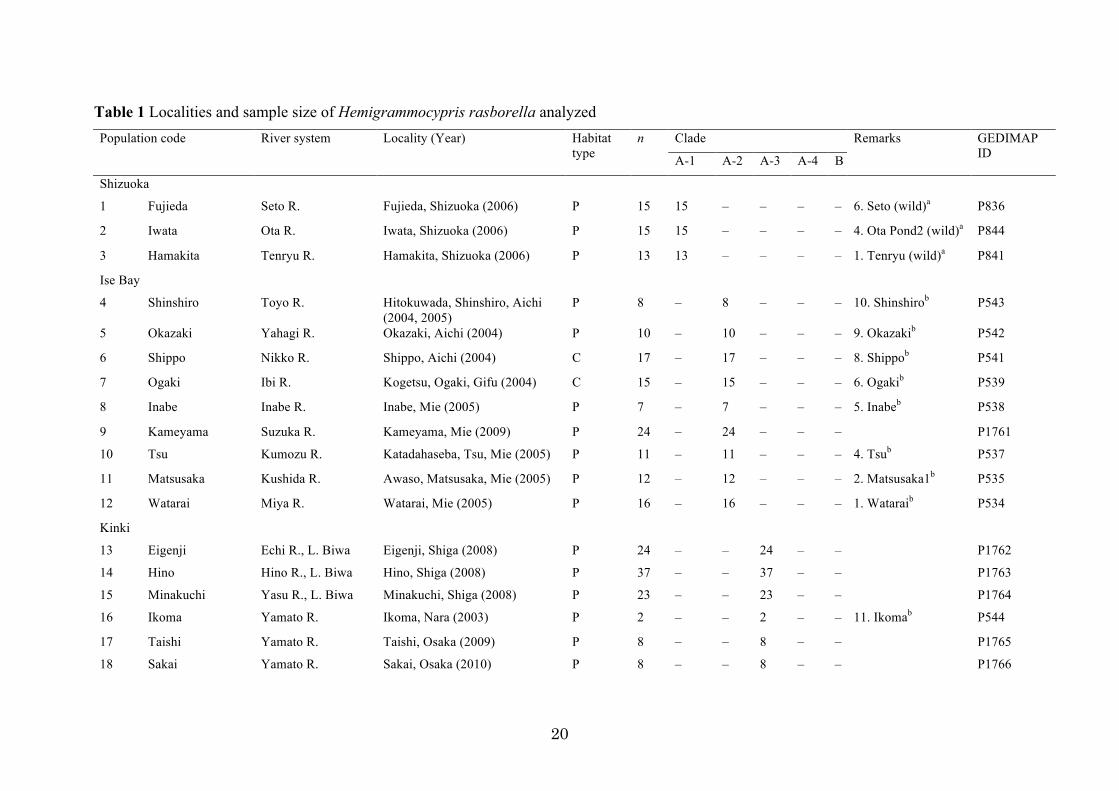
Samples. A total of 509 specimens of Hemigrammocypris rasborella were collected from 35
localities throughout the entire range of the species in Japan (Fig. 1; Table 1). These included 141
specimens from 12 localities that were used in Watanabe and Mori (2008) and Watanabe et al.
(2009). The localities were grouped geographically into six regions: Shizuoka, Ise Bay, Kinki,
Sanyo, Shikoku, and Kyushu (Fig. 1; Table 1). Collection of the specimens was conducted with
permission from local governments when necessary by law (Mie and Kagawa Prefectures), and was
accomplished by short-time trapping or netting in areas estimated to be inhabited by hundreds or
more of the fish. In other cases, fish were temporarily collected and released after the non-invasive
clipping of a small piece of a pelvic fin (several mm2) for genetic analyses. Fish or fin clips were
preserved in 100 % ethanol. Specimens from neighboring sites (e.g., irrigation ponds within an area)
were pooled as a sample. A local sample from Tokushima was collected from a captive population
that had been maintained at the Fisheries Research Division of Tokushima Agriculture, Forestry,
and Fisheries Technology Support Center, Tokushima since 2007.
MtDNA sequencing and analyses. Total genomic DNA was isolated using a Genomic DNA
Purification Kit (Promega, Madison, WI, USA) from fin clips preserved in 100 % ethanol.
Polymerase chain reaction (PCR) amplification was performed using the primer pair L14724
(5′-TGA CTT GAA RAA CCA YCG YYG-3′) (Palumbi et al. 1991) and H15915 (5′-ACC TCC
GAT CTY CGG ATT ACA AGA C-3′) (Aoyama et al. 2000) to obtain the nucleotide sequences of
the mitochondrial cytochrome b gene (cytb). The PCR conditions and sequencing method were as
described in Watanabe and Mori (2008). The newly obtained sequences (690 bp of 3′-half of cytb)
were deposited in the DNA Data Bank of Japan (DDBJ), GenBank, and the European Nucleotide
Archive (EMBL) [accession numbers AB907301–907336; see Electronic Supplementary Material
(ESM) Table S1]. The haplotype frequencies of each population were deposited in the Genetic

8
Diversity and Distribution Map (GEDIMAP) freshwater fish database (Watanabe et al. 2010b) (see
Table 1 for ID numbers).
Genetic diversity indices, i.e., the number of haplotypes (k), haplotype diversity (h), and
nucleotide diversity (π), were calculated for each local sample using ARLEQUIN v3.5 (Excoffier
and Lischer 2010).
For phylogenetic analysis, the following three outgroup sequences were added: Metzia
formosae (HM224304) and Metzia lineata (HM224305) both from Hanoi, Vietnam (Tang et al.
2010), and Aphyocypris chinensis (AB218688; Fukuoka, Japan; Saitoh et al. 2006), referring to the
cyprinid phylogeny proposed by Tang et al. (2010).
The maximum-likelihood (ML) tree for mtDNA haplotypes was estimated using PAUP*4.0b10
(Swofford 2002), with the HKY+G model selected by Akaike’s information criterion (AIC),
implemented in jModeltest v2.1.1 (Darriba et al. 2012). The model parameters were as follows: base
frequencies of A = 0.3102, C = 0.2687, G = 0.1367, and T = 0.2844; kappa = 10.2588; gamma shape
= 0.2310. The robustness of the ML tree was assessed using the bootstrap method (BP) with 300
replicates.
A Bayesian approach was used to estimate the phylogenetic tree and the divergence times of
lineages using the HKY+G model, selected by the Bayesian information criterion (BIC) in
jModeltest, and the Yule (speciation) tree prior using BEAST v1.7.5 (Drummond and Rambaut
2007). We adopted the uncorrelated lognormal relaxed clock (Drummond et al. 2006). To estimate
the time of the most recent common ancestors (tMRCA), two constraints were given: one is
geological and the other is for evolutionary rate. As the geological constraint, the uplift of the
Suzuka Mountains in central Honshu Island 1.0–1.5 million years ago (Mya) (Yokoyama 1988;
Kawabe 1994) was applied for the relevant node age. This constraint was specified as a lognormal
prior distribution, ranging from approximately 1.1 to 1.5 Mya in the 95 % range with mean = 1.3
Mya, log(SD) = 0.1, and offset = 0. Previous estimates of cytb molecular substitution rates for
teleosts range from ~0.3 to 1.5 %/million years (Myr)/lineage (e.g., Burridge et al. 2008; Watanabe
and Takahashi 2010), and a rate of 0.76 %/Myr/lineage has been obtained for cyprinids (Zardoya
and Doadrio 1999). We set a normal prior distribution (mean ± SD) for both the mean molecular
rate and its standard error = 0.76 % and SD = 0.50 %, which is a lax constraint covering 0–1.58 % in
the 95 % interval. All other model parameters used default priors. For each Markov-chain Monte

9
Carlo (MCMC) analysis, we performed two independent runs of 10 million generations. We
sampled every 1,000th generation and removed 10 % of the initial samples as a burn-in period. The
convergence of the chains to stationary distribution and large effective sample size (ESS; >200 were
confirmed using TRACER v1.5 (Rambaut and Drummond 2009). The consensus tree was calculated
using LogCombiner v1.6.2 and TreeAnnotator v1.6.2 in the BEAST package, and the tree was
visualized using FigTree v1.3.1 (Rambaut 2009). The robustness of the Bayesian tree was evaluated
by posterior probability (PP).
Results
A total of 70 haplotypes (690 bp) were obtained from the 509 specimens of Hemigrammocypris
rasborella (ESM Table S1). The number of haplotypes (k) within local samples ranged from 1 to 8
(average ± SD, 2.7 ± 1.9) with h = 0–0.8667 (0.3679 ± 0.3018) and π = 0–0.0124 (0.001600 ±
0.002821). Twelve of the total 35 samples (34 %) were monomorphic.
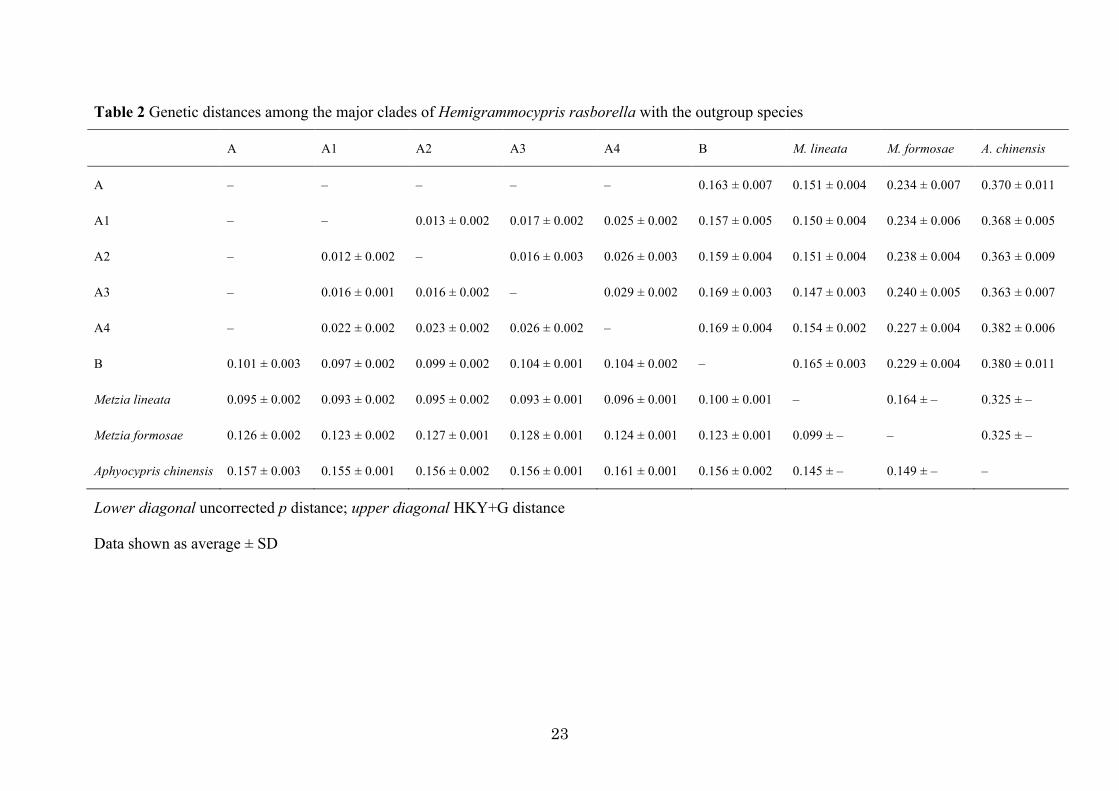
The ML and Bayesian trees of mtDNA haplotypes showed similar tree topologies, and
consistently revealed two deeply diverged clades (A and B) of H. rasborella (clade A, PP=100%,
BP=94%; clade B, PP=100%, BP=100%), with 0.101±0.003 SD in average uncorrected p (pairwise
sequence differences), and 0.163 ± 0.007 SD in HKY+G distance (Fig. 2; Table 2; ESM Fig. S1).
Clade A consisted of haplotypes from the specimens collected from Honshu and Shikoku, whereas
the clade B haplotypes were exclusively from Kyushu.
Clade A was further discriminated into four regional clades (A1–A4) (Fig. 2; ESM Fig. S1).
While clades A1, A2 and A3 formed a monophyletic group (PP = 96 %, BP = 50 %), their
interrelationship was not fully resolved.
Clades A1 and A2 consisted exclusively of the haplotypes from Shizuoka and the Ise Bay area,
respectively (Figs. 1, 2). Clade A3 included the haplotypes from the Kinki region and the eastern
part of Shikoku (Tokushima Prefecture; locality #27). The clade A4 haplotypes originated from the
western Kinki, northeastern Shikoku (Kagawa Pref.), and Sanyo regions. The clade A3 and A4
haplotypes occurred parapatrically or sympatrically in the western Kinki region, suggesting
secondary contact of these divergent haplotype groups in this region.
10
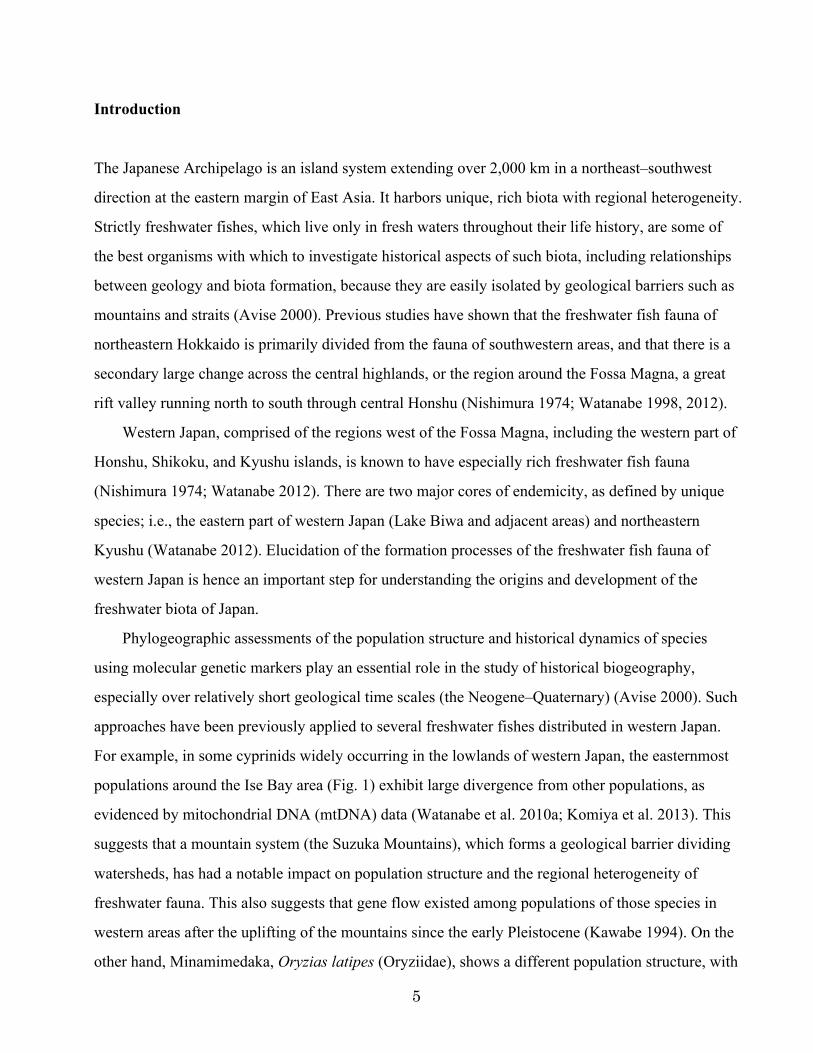
The geological constraint associated with the uplifting of the Suzuka Mountains was given for
the tMRCA of clades A1, A2 and A3. Using this and evolutionary rate constraints, the divergence
times between the major clades were estimated (Fig. 2). The time at the calibration point was
estimated at 1.27 Myr [95 % highest probability density (HPD), 1.04–1.53 Myr]. The divergence
time between clades A1–A3 and clade A4 was estimated at 1.71 Myr (1.15–2.35 Myr). Divergence
between clades A and B was estimated to have occurred at 5.89 Myr (3.78–8.17 Myr). The
estimation of the divergence time between H. rasborella and Metzia lineata was 6.82 Myr (4.44–
9.45 Myr). The estimated evolutionary rate was 0.88 %/Myr/lineage on average (95 % HPD, 0.58–
1.19 %), and did not show large heterogeneity among the major clades (0.87–0.88 %).
Discussion
The present study successfully revealed, using mtDNA divergence, the major regional groups within
Hemigrammocypris rasborella based on specimens collected from the entire distribution range of
the species. Specifically, the populations in western Kyushu, the westernmost populations of the
species, showed remarkable differentiation from the eastern populations, which are geographically
separated from the Kyushu populations by a gap in distribution from westernmost Honshu to eastern
Kyushu (Fig. 1). The two mtDNA groups were estimated to have diverged from each other ca. 3.8–
8.2 Mya, during the Late Miocene–Pliocene, and this divergence is comparable to that from another
species (Metzia lineatus) from the southern part of East Asia, which has not been necessarily proven
to be H. rasborella’s closest relative.
Among the primary freshwater fishes that are widely distributed in western Japan, the largest
intraspecific divergence of Kyushu populations, as shown in H. rasborella, is not common among
the species that have been investigated to date. The divergence is sufficiently wide to be equivalent
to the genetic differentiation (0.088 in GTR+I for ND1 gene) between two subspecies of the
bitterling Rhodeus atremius atremius (distributed in Kyushu) and Rhodeus atremius suigensis
(distributed in the Sanyo region) (Miyake et al. 2011). Oryzias latipes is another exception in which
the most divergent haplotype group is found from western Kyushu to the Ryukyu Islands (Takehana
et al. 2003), although the species shows some salinity tolerance. Rather, the largest divergence is

11
found in the easternmost populations (Ise Bay area and the east) of some cyprinids (e.g., Biwia
zezera, Watanabe et al. 2010a; Sarcocheilichthys variegatus; Komiya et al. 2013). The Ise Bay area
harbors several endemic species and populations, including freshwater fishes (Watanabe 2012) and
marsh plants (Ueda 1989). These support the long, somewhat isolated history of the wetland
environments in this region, which is probably associated with the formation of the Suzuka
Mountains during the early Pleistocene. Also in the case of H. rasborella, the divergence of the
around-Ise Bay population from its neighbors was significant and probably reflects the mountain
formation (Watanabe and Mori 2008; Watanabe et al. 2009; present study). However, the
differentiation of the Kyushu population from the others is much larger than this, indicating that the
isolation of the species’ populations between Kyushu and the eastern regions has been sustained
over a long period during which other lowland fish species maintained gene flow between those
regions. Variations in population structure and presence/absence among species can be attributable
to differences in their dispersal abilities or historic local extinctions. Comparative analyses of faunal
and phylogeographic patterns that explicitly incorporate the ecological traits of species are needed.
It would be possible to treat the two widely divergent H. rasborella groups as different species,
or at least subspecies. No detailed morphological comparisons have been conducted for this species
throughout its distribution range, except for those focusing on a restricted area (the Ise Bay area;
Akada and Yodo 2006) or on specific characteristics (cephalic lateral line canal system; Takeuchi et
al. 2011). Inclusive morphological and taxonomic studies, with particular focus on the status of the
Kyushu populations, are necessary for H. rasborella. To resolve the taxonomy of this species, it is
also important to determine the population from which the syntype specimens of H. neglectus
originated (Stieler 1907; Zarske 2013).
The second largest differentiation was found between clade A4 and clades A1–3 (uncorrected
p-distance, 0.024 on average; estimated divergence time, 1.2–2.4 Myr), which were collected from
the middle part of the around Seto Inland Sea area (Sanyo, western Kinki, and northeastern Shikoku)
and the eastern areas, respectively, with an overlap zone in the western Kinki region (Fig. 1). This
pattern of population structure is also unique among those previously known for freshwater fishes.
That is, although the Sanyo populations of some other freshwater fishes are also genetically unique,
their differentiation from Kinki populations is not so large (the average uncorrected p-distance in
cytb: Biwia zezera, 1.0 %, calculated from Watanabe et al. 2010a; Rhodeus ocellatus kurumeus,

12
0.9 %; Abe et al. 2013) as in H. rasborella (2.6 %). The distribution of clade A3 haplotypes (Kinki
and eastern Shikoku) suggests gene flow via the eastward paleo-river system that flowed from the
eastern Seto Inland Sea region into the Pacific Ocean through the Kii Channel during the Pleistocene
regression periods (Fig. 1; Kuwashiro 1959; Ota et al. 2004). The clade A4 haplotypes, on the other
hand, would have originated from regional populations differentiated from those with the clade A3
haplotypes. Since the former’s distribution area belongs to the eastward paleo-river basin (Ota et al.
2004), the differentiation between A4 and A1–3 might be caused by division of tributaries of the
eastward paleo-river. However, this seems difficult to explain the long isolation (>1 Myr) and
interrelationships among the clades A1–4. Instead, the clade A4 haplotypes might be associated with
the westward paleo-river that flowed into the Pacific Ocean through the Bungo Channel between
Shikoku and Kyushu Islands (Fig. 1), although the species does not presently occur in the westward
paleo-river basin. The partially overlapped distributions of clades A3 and A4 in the western Kinki
region suggest the range expansion of either or both clades and secondary contact between the
differentiated populations (Avise 2000). Analysis using sensitive nuclear DNA markers will reveal
the complex distribution processes of isolation, gene flow and local extinction histories around the
Seto Inland Sea.
In conclusion, we clarified the unique aspects of the phylogeographic pattern of H. rasborella
compared with those of previously studied lowland freshwater fishes in Japan. The distribution
processes of lowland freshwater fishes are generally thought to be affected by geological factors,
such as isolation by mountain uplift, range expansion following sea regression, and isolation and
reduction following sea-level rise. Simultaneously, the effects of such geological factors are, at least
partly, dependent on ecological traits of the species. Deeper understandings of the historical
processes of regional freshwater faunas require comparisons of the distributions and
phylogeographic patterns of constituent species with incorporation of their ecological traits.
The clear genetic differentiation among regional populations of H. rasborella emphasizes the
necessity to protect them separately as important management units. Most of the populations of H.
rasborella now survive in small, isolated ponds, which were not necessarily the main habitat of this
species in the past (i.e., lowland marshes and creeks). Special attention should be paid to
reintroduction plans for this species, as well as potential losses of intra-populational genetic
diversity.

13
Acknowledgments We thank T. Asaka, H. Egi, Z. Shimizu, M. Tsujio, N. Oshima, O. Masuda, S.
Fujita, T. Tanimoto, Y. Yasui, and T. Nishioka for their help with obtaining the specimens. This
study was supported in part by Grants-in-Aid from the Ministry of Education, Culture, Sports,
Science and Technology, Japan (nos. 21370035), and the Global Center of Excellence Program
‘‘Formation of a Strategic Base for Biodiversity and Evolutionary Research: from Genome to
Ecosystem’’ of Kyoto University).
References
Abe T, Kobayashi I, Watanabe K (2013) An extant native population of the Japanese rosy bitterling,
Rhodeus ocellatus kurumeus, in the Sanyo Region, western Japan. Jpn J Ichthyol 60:49–55
Akada J, Yodo T (2006) Geographical and between-habitat variations in the body shape of
Hemigrammocypris rasborella. Jpn J Ichthyol 53:175–179
Aoyama J, Watanabe S, Ishikawa S, Nishida M, Tsukamoto K (2000) Are morphological characters
distinctive enough to discriminate between two species of freshwater eels, Anguilla celebesensis
and A. interioris? Ichthyol Res 47:157–161
Avise JC (2000) Phylogeography: the history and formation of species. Harvard University Press,
Cambridge
Burridge CP, Craw D, Fletcher D, Waters JM (2008) Geological dates and molecular rates: fish
DNA sheds light on time dependency. Mol Biol Evol 25:624–633
Darriba D, Taboada GL, Doallo R, Posada D (2012) jModelTest 2: more models, new heuristics and
parallel computing. Nat Methods 9:772
Drummond AJ, Rambaut A (2007) BEAST: Bayesian evolutionary analysis by sampling trees.
BMC Evol Biol 7:214
Drummond AJ, Ho SYW, Phillips MJ, Rambaut A (2006) Relaxed phylogenetics and dating with
confidence. PLoS Biol 4:699–710
Excoffier L, Lischer HEL (2010) Arlequin suite ver 3.5: a new series of programs to perform
population genetics analyses under

14
Linux and Windows. Mol Ecol Resour 10:564–567
Fowler HW (1910) Descriptions of four new cyprinoids (Rhodeinae). Proc Acad Nat Sci Phila
62:476–486
Japan Ministry of the Environment (2003) Threatened wildlife of Japan, red data book, brackish and
fresh water fishes, 2nd edn.
Ministry of Environment, Tokyo Kanagawa N, Itai T (1998) Habitat of Hemigrammocypris
rasborella and river improvement. In: Mori S (ed) Sakana kara mita mizu kankyo (Freshwater
environments from view of fishes). Shinzansha-Sci-Tech, Tokyo, pp 61–80
Kawabe T (1994) Biwako no oitachi (Formation of Lake Biwa). In: Research Group for Natural
History of Lake Biwa (ed) Biwako no shizenshi (The natural history of Lake Biwa). Yasaka
Shobo, Tokyo, pp 24–72
Komiya T, Fujita-Yanagibayashi S, Watanabe K (2013). Multiple colonizations of Lake Biwa by
Sarcocheilichthys fishes and their population history. Environ Biol Fish. DOI:
10.1007/s10641013-0176-9
Kuwashiro I (1959) Submarine topography of Japanese Inland Sea Setonaikai. Geogr Rev Jpn
32:24–34
Miyake T, Nakajima J, Onikura N, Ikemoto S, Iguchi K, Komaru A, Kawamura K (2011) The
genetic status of two subspecies of Rhodeus atremius, an endangered bitterling in Japan.
Conserv Genet 12:383–400
Nakajima J, Onikura N, Eguchi K, Sugimoto Y, Oikawa S (2006) Distribution and present status of
golden venus chub, Hemigrammocypris rasborella (Cypriniformes, Cyprinidae), in northern
Kyushu Island, Japan. Bull Biogeogr Soc Jpn 61:109–116
Nakamura M (1969) Cyprinid fishes of Japan: studies on the life history of cyprinid fishes of Japan.
Research Institute for Natural Resources, Tokyo
Nishimura S (1974) Nihon-kai no seiritsu (Formation of the Sea of Japan). Tsukiji-Shokan, Tokyo
Ota Y, Naruse T, Tanaka S, Ikada A (2004) Regional geomorphology of the Japanese Islands, vol 6.
Geomorphology of Kinki, Chugoku and Shikoku. University of Tokyo Press, Tokyo
Palumbi S, Martin A, Romano S, McMillian WO, Stice L, Grabowski G (1991) The simple fool’s
guide to PCR. Univ Hawaii, Honolulu

15
Rambaut A (2009) FigTree version 1.3.1. http://tree.bio.ed.ac.uk/ software/figtree/. Accessed 2
December 2010
Rambaut A, Drummond AJ (2009) Tracer version 1.5. http://tree.bio.ed.ac.uk/software/tracer/.
Accessed 13 December 2010
Saitoh K, Sado T, Mayden RL, Hanzawa N, Nakamura K, Nishida M, Miya M (2006) Mitogenomic
evolution and interrelationships of the Cypriniformes (Actinopterygii: Ostariophysi): the first
evidence toward resolution of higher-level relationships of the world’s largest freshwater fish
clade based on 59 whole mitogenome sequences. J Mol Evol 63:826–841
Stieler P (1907) Barilius neglectus sp.n. Blätter für Aquarienund Terrarien-Kunde. Stuttgart
18(17):169
Swofford DL (2002) PAUP*. Phylogenetic analysis using parsimony (*and other methods), version
4b10a. Sinauer Associates, Sunderland
Takehana Y, Nagai N, Matsuda M, Tsuchiya K, Sakaizumi M (2003) Geographic variation and
diversity of the cytochrome b gene in Japanese wild populations of medaka, Oryzias latipes.
Zool Sci 20:1279–1291
Tang KL, Agnew MK, Hirt MV, Sado T, Schneider LM, Freyhof J, Sulaiman Z, Swartz E,
Vidthayanon C, Miya M, Saitoh K, Simons AM, Wood RM, Mayden RL (2010) Systematics of
the subfamily Danioninae (Teleostei: Cypriniformes: Cyprinidae). Mol Phylogenet Evol
57:189–214
Takeuchi H, Tokuda K, Kanagawa N, Hosoya K (2011) Cephalic lateral line canal system of the
golden venus chub, Hemigrammocypris rasborella (Teleostei: Cypriniformes). Ichthyol Res
58:175–179
Ueda K (1989) Phytogeography of Tokai Hilly land element I. Definition. Acta Phytotax Geobot
40:190–202
Watanabe K (1998) Parsimony analysis of the distribution pattern of Japanese primary freshwater
fishes, and its application to the distribution of the bagrid catfishes. Ichthyol Res 45:259–270
Watanabe K (2012) Faunal structure of Japanese freshwater fishes and its artificial disturbance.
Environ Biol Fish 94:533–547

16
Watanabe K, Mori S (2008) Comparison of genetic population structure between two cyprinids,
Hemigrammocypris rasborella and Pseudorasbora pumila subsp., in the Ise Bay basin, central
Honshu, Japan. Ichthyol Res 55:309–320 (Errata: Ichthyol Res 56:108)
Watanabe K, Takahashi H (2010) Tansuigyorui chiri no shizenshi (Natural history of freshwater fish
geography). Hokkaido University Press, Sapporo
Watanabe K, Kanagawa N, Kakioka R, Itai T, Mori S (2009) Genetic diversity and conservation
units in wild and captive populations of endangered freshwater fishes: a case of
Hemigrammocypris rasborella in Shizuoka, Japan. Ichthyol Res 56:411–416
Watanabe K, Kawase S, Mukai T, Kakioka R, Miyazaki J-I, Hosoya K (2010a) Population
divergence of Biwia zezera (Cyprinidae: Gobioninae) and the discovery of a cryptic species,
based on mitochondrial and nuclear DNA sequence analyses. Zool Sci 27:647–655
Watanabe K, Kano Y, Takahashi H, Mukai T, Kakioka R, Tominaga K (2010b) GEDIMAP: a
database of genetic diversity for Japanese freshwater fishes. Ichthyol Res 57:107–109
Yokoyama T (1988) Seinan Nihon no Shizenshi (Natural history of southwestern Japan).
Sanwa-shobo, Kyoto
Zardoya R, Doadrio I (1999) Molecular evidence on the evolutionary and biogeographical patterns
of European cyprinids. J Mol Evol 49:227–237
Zarske A (2013) Barilius neglectus Stieler, 1907 – ein Seniorsynonym von Hemigrammocypris
rasborella Fowler, 1910 (Teleostei: Cypriniformes: Cyprinidae). Vert Zool 63:253–257

17
Figure legends
Fig. 1 Sampling localities of Hemigrammocypris rasborella. Numbers of localities correspond to
those in Table 1. Open squares the localities where clade A1 haplotypes were collected, closed
squares clade A2 haplotypes, close circles clade A3 haplotypes, open circles clade A4 haplotypes,
circled bullets clade A3 and A4 haplotypes, triangles clade B haplotypes. Photographs: H.
rasborella from Hyogo Prefecture, western Kinki, by K. Tominaga (right), and Saga Prefecture,
northwestern Kyushu, by J. Nakajima (left), both uncatalogued
Fig. 2 Bayesian phylogenetic tree of Hemigrammocypris rasborella with outgroups based on the
mtDNA cytochrome b sequences (690 bp) with the HKY+G model. The tree is dated by the
uncorrelated lognormal relaxed clock model with a node-age constraint (*) and molecular
evolutionary rate (see text). The numbers at nodes correspond to Bayesian posterior probabilities on
the left and ML bootstrap probabilities on the right. Bars show credibility intervals as 95 % HPD

32
33 34 35
27
28
29 30 31
25 26
13 14
15 16
17 18
19 20
21
22 23
24 6
7
9 10
11 12
Sea of Japan
Pacific Ocean
Ise Bay
Lake Biwa
Seto Inland Sea
Fig. 1
Shikoku Is.
Sanyo
Kyushu Is.
Kinki Honshu Is.
1 2
3 4 5 8
The Central
Highlands�
Suzuka Mts.
Shizuoka Sangun Mts.
Kii Channel
Bungo Channel

0.02.55.07.510.012.5
h57
h16
h53
h31
h46
h06
h41
h07
h35
h44
h42
h26
h11
h39
h14
h05
h22
M_lineata_HM224305
h64
h51
Ac_AB218688
h36
h66
h02
h33
h20
h03
h13
h37
h70
h60
h30
h08
h52h56
h28
h55
h24
h59
h19
h18
h32
h68
h43
h61h63h67
h49
h65
h34
h50
h27
h09
h48
h69
h62
M_formosae_HM224304
h23
h47
h15
h38
h04
h40
h01
h21
h45
h10
h54
h25
h12
h29
h58
h17
��������
0
Metzialineata:HM224305�Metziaformosae:HM224304�Aphyocyprischinensis:AB218688�
Mya2� 1�35� 4�7� 6�8�
*�
CladeA�
CladeB�Kyushu�
A1�
A2�
A3�
A4�
100/86�
86/85�
100/100�
100/94�
100/80�
96/50�
100/77�
94/65�
99/52�
100/95�
100/87�
Shizuoka�
IseBay�
KinkiShikoku(Tokushima)�
Kinki(west)SanyoShikoku(Kagawa)
Fig. 2
20
Table 1 Localities and sample size of Hemigrammocypris rasborella analyzed Population code River system Locality (Year) Habitat
type n Clade Remarks GEDIMAP
ID A-1 A-2 A-3 A-4 B
Shizuoka
1 Fujieda Seto R. Fujieda, Shizuoka (2006) P 15 15 – – – – 6. Seto (wild)a P836
2 Iwata Ota R. Iwata, Shizuoka (2006) P 15 15 – – – – 4. Ota Pond2 (wild)a P844
3 Hamakita Tenryu R. Hamakita, Shizuoka (2006) P 13 13 – – – – 1. Tenryu (wild)a P841
Ise Bay
4 Shinshiro Toyo R. Hitokuwada, Shinshiro, Aichi (2004, 2005)
P 8 – 8 – – – 10. Shinshirob P543
5 Okazaki Yahagi R. Okazaki, Aichi (2004) P 10 – 10 – – – 9. Okazakib P542
6 Shippo Nikko R. Shippo, Aichi (2004) C 17 – 17 – – – 8. Shippob P541
7 Ogaki Ibi R. Kogetsu, Ogaki, Gifu (2004) C 15 – 15 – – – 6. Ogakib P539
8 Inabe Inabe R. Inabe, Mie (2005) P 7 – 7 – – – 5. Inabeb P538
9 Kameyama Suzuka R. Kameyama, Mie (2009) P 24 – 24 – – – P1761
10 Tsu Kumozu R. Katadahaseba, Tsu, Mie (2005) P 11 – 11 – – – 4. Tsub P537
11 Matsusaka Kushida R. Awaso, Matsusaka, Mie (2005) P 12 – 12 – – – 2. Matsusaka1b P535
12 Watarai Miya R. Watarai, Mie (2005) P 16 – 16 – – – 1. Wataraib P534
Kinki
13 Eigenji Echi R., L. Biwa Eigenji, Shiga (2008) P 24 – – 24 – – P1762
14 Hino Hino R., L. Biwa Hino, Shiga (2008) P 37 – – 37 – – P1763
15 Minakuchi Yasu R., L. Biwa Minakuchi, Shiga (2008) P 23 – – 23 – – P1764
16 Ikoma Yamato R. Ikoma, Nara (2003) P 2 – – 2 – – 11. Ikomab P544
17 Taishi Yamato R. Taishi, Osaka (2009) P 8 – – 8 – – P1765
18 Sakai Yamato R. Sakai, Osaka (2010) P 8 – – 8 – – P1766

21
19 Nishinomiya Muko R. Nishinomiya, Hyogo (2007) P 16 – – 16 – – P1767
20 Sanda_1 Muko R. Kashita, Sanda, Hyogo (2005, 2007)
P 16 – – 16 – – P1768
21 Sanda_2 Muko R. Aino, Sanda, Hyogo (2008, 2009)
P 16 – – 8 8 – P1769
22 Hasetani Akashi R. Hasetani, Kobe, Hyogo (2007, 2009)
P 15 – – – 15 – P1770
23 Miki_1 Kako R. Kuchiyokawa, Miki, Hyogo (2009)
P 13 – – 9 4 – P1771
24 Kasai Kako R. Shimoakuta, Kasai, Hyogo (2009)
P 5 – – – 5 – P1772
Sanyo
25 Okayama Asahi R. Higashi-ku, Okayama, Okayama (2009, 2010)
C 44 – – – 44 – P1773
26 Kurashiki Kurashiki R. Minami-ku, Okayama, and Kurashiki, Okayama (2009)
C 39 – – – 39 – P1774
Shikoku
27 Naruto Yoshino R. Otsu, Naruto, Tokushima (2011) C 14 – – 14 – – c P1775
28 Sanuki Kabe R. Sanuki, Kagawa (2010) P 8 – – – 8 – P1776
29 Higashikagawa Yoshino R. Higashikagawa, Kagawa (2010) P 6 – – – 6 – P1777
30 Miki_2 Shin R. Miki, Kagawa (2010) P 8 – – – 8 – P1778
31 Takamatsu Kasuga R. Takamatsu, Kagawa (2010) P 15 – – – 15 – P1779
Kyushu – – – – –
32 Takada Yabe R. Takada, Miyama, Fukuoka (2011)
C 8 – – – – 8 P1780
33 Kase Kase R. Kase, Saga, Saga (2008) C 7 – – – – 7 P1781
34 Taku Rokkaku R. Nouso, Taku, Saga (2011) C 8 – – – – 8 P1782
35 Kashima Shiota R. Kashima, Saga (2011) C 6 – – – – 6 P1783
Habitat type: P pond, C creek

22
a Watanabe et al. (2009)
b Watanabe and Mori (2008)
c Collected from a captive population founded in 2007
23
Table 2 Genetic distances among the major clades of Hemigrammocypris rasborella with the outgroup species
A A1 A2 A3 A4 B M. lineata M. formosae A. chinensis
A – – – – – 0.163 ± 0.007 0.151 ± 0.004 0.234 ± 0.007 0.370 ± 0.011
A1 – – 0.013 ± 0.002 0.017 ± 0.002 0.025 ± 0.002 0.157 ± 0.005 0.150 ± 0.004 0.234 ± 0.006 0.368 ± 0.005
A2 – 0.012 ± 0.002 – 0.016 ± 0.003 0.026 ± 0.003 0.159 ± 0.004 0.151 ± 0.004 0.238 ± 0.004 0.363 ± 0.009
A3 – 0.016 ± 0.001 0.016 ± 0.002 – 0.029 ± 0.002 0.169 ± 0.003 0.147 ± 0.003 0.240 ± 0.005 0.363 ± 0.007
A4 – 0.022 ± 0.002 0.023 ± 0.002 0.026 ± 0.002 – 0.169 ± 0.004 0.154 ± 0.002 0.227 ± 0.004 0.382 ± 0.006
B 0.101 ± 0.003 0.097 ± 0.002 0.099 ± 0.002 0.104 ± 0.001 0.104 ± 0.002 – 0.165 ± 0.003 0.229 ± 0.004 0.380 ± 0.011
Metzia lineata 0.095 ± 0.002 0.093 ± 0.002 0.095 ± 0.002 0.093 ± 0.001 0.096 ± 0.001 0.100 ± 0.001 – 0.164 ± – 0.325 ± –
Metzia formosae 0.126 ± 0.002 0.123 ± 0.002 0.127 ± 0.001 0.128 ± 0.001 0.124 ± 0.001 0.123 ± 0.001 0.099 ± – – 0.325 ± –
Aphyocypris chinensis 0.157 ± 0.003 0.155 ± 0.001 0.156 ± 0.002 0.156 ± 0.001 0.161 ± 0.001 0.156 ± 0.002 0.145 ± – 0.149 ± – –
Lower diagonal uncorrected p distance; upper diagonal HKY+G distance
Data shown as average ± SD

ESM Fig. S1 The maximum likelihood tree of Hemigrammocypris rasborella with outgroups
based on the mtDNA cytochrome b sequences (690 bp) with the HKY+G model. The numbers at
nodes indicate ML bootstrap probabilities

ESM Table S1 Haplotype frequency and genetic diversity of the local samples of Hemigrammocypris rasborella
Population code Clade
n A-1 A-2 A-3 A-4 B k h π
Shizuoka
1 Fujiedaa, c 15 h05(7), h06(3), h10(3), h11(2)
4 0.7333 0.003423
2 Iwataa 15 h01(6), h03(1), h04(1), h07(2), h08(1), h09(4)
6 0.7905 0.002816
3 Hamakitaa 13 h02(12), h07(1) 3 0.1538 0.000669
Ise Bay
4 Shinshirob 8 h12(8) 1 0.0000 0.000000
5 Okazakib 10 h12(2), h13(1), h14(2), h19(2), h33(3)
5 0.8667 0.003349
6 Shippob 17 h14(11), h15(1), h16(1), h17(1), h18(1), h20(1), h22(1)
7 0.5956 0.001662
7 Ogakib 15 h14(1), h19(10), h21(1), h23(3)
4 0.5429 0.001573
8 Inabeb 7 h29(4), h30(3) 2 0.5714 0.002484
9 Kameyamaa 24 h31(24) 1 0.0000 0.000000
10 Tsub 11 h12(5), h32(6) 2 0.5455 0.001581
11 Matsusakab 12 h27(7), h28(5) 2 0.5303 0.000769
12 Wataraib 16 h24(13), h25(1), h26(2)
3 0.3417 0.000519
Kinki
13 Eigenji 24 h35(17), h41(7) 2 0.4312 0.000625
14 Hino 37 h35(23), h39(1), h42(13)
3 0.5030 0.001515

15 Minakuchi 23 h35(9), h36(10), h40(4)
3 0.6561 0.001180
16 Ikomab 2 h34(2) 1 0.0000 0.000000
17 Taishi 8 h36(8) 1 0.0000 0.000000
18 Sakai 8 h36(8) 1 0.0000 0.000000
19 Nishinomiya 16 h36(10), h37(6) 2 0.5000 0.000725
20 Sanda_1 16 h36(16) 1 0.0000 0.000000
21 Sanda_2 16 h36(8) h44(8) 2 0.5333 0.012367
22 Hasetani 15 h48(2), h54(13) 2 0.2476 0.001077
23 Miki_1 13 h38(9) h53(4) 2 0.4615 0.012040
24 Kasai 5 h44(5) 1 0.0000 0.000000
Sanyo
25 Okayama 44 h44(30), h45(2), h47(1), h50(3), h57(2), h58(2), h59(4)
7 0.5275 0.001002
26 Kurashiki 39 h44(26), h46(3), h49(1), h51(1), h52(2), h57(3), h59(2), h60(1)
8 0.5506 0.001001
Shikoku
27 Naruto 14 h43(14) 1 0.0000 0.000000
28 Sanuki 8 h55(8) 1 0.0000 0.000000
29 Higashikagawa 6 h56(6) 1 0.0000 0.000000
30 Miki_2 8 h61(8) 1 0.0000 0.000000
31 Takamatsu 15 h61(6), h62(4), h63(5)
3 0.7048 0.001297
Kyushu
32 Takada 8 h64(4), h66(1), h67(2), h68(1)
4 0.7500 0.001501
33 Kase 7 h67(7) 1 0.0000 0.000000
34 Taku 8 h64(5), h65(1), h67(2)
3 0.6071 0.000983

35 Kashima 6 h64(1), h69(3), h70(2)
3 0.7333 0.002029
a Data from Watanabe K, Kanagawa N, Kakioka R, Itai T, Mori S (2009) Genetic diversity and conservation units in wild and captive populations of endangered freshwater fishes: a case of Hemigrammocypris rasborella in Shizuoka, Japan. Ichthyol Res 56:411–416 a Data from Watanabe K, Mori S (2008) Comparison of genetic population structure between two cyprinids, Hemigrammocypris rasborella and Pseudorasbora pumila subsp., in the Ise Bay basin, central Honshu, Japan. Ichthyol Res 55:309–320 c Haplotype frequency is partly corrected from that in Watanabe et al. (2009) DDBJ/EMBL/GenBank accession nos. of haplotypes: h01 AB469829, h02 AB469830, h03 AB469838, h04 AB469839, h05 AB469840, h06 AB469841, h07 AB469831, h08 AB469832, h09 AB469833, h10 AB469836, h11 AB469835, h12 AB354663, h13 AB354664, h14 AB354670, h15 AB354669, h16 AB354667, h17 AB354666, h18 AB354668, h19 AB354657, h20 AB354659, h21 AB354658, h22 AB354660, h23 AB354662, h24 AB354673, h25 AB354675, h26 AB354674, h27 AB354676, h28 AB354677, h29 AB354678, h30 AB354679, h31 AB469843, h32 AB354671, h33 AB354672, h34 AB354680, h35 AB907301, h36 AB907302, h37 AB907303, h38 AB907304, h39 AB907305, h40 AB907306, h41 AB907307, h42 AB907308, h43 AB907309, h44 AB907310, h45 AB907311, h46 AB907312, h47 AB907313, h48 AB907314, h49 AB907315, h50 AB907316, h51 AB907317, h52 AB907318, h53 AB907319, h54 AB907320, h55 AB907321, h56 AB907322, h57 AB907323, h58 AB907324, h59 AB907325, h60 AB907326, h61 AB907327, h62 AB907328, h63 AB907329, h64 AB907330, h65 AB907331, h66 AB907332, h67 AB907333, h68 AB907334, h69 AB907335, h70 AB907336


![Observatorul militar - Ilie Rad · condus` de [eful Statului Major General, amiralul dr. Gheorghe Marin, a efectuat o vizit` oficial` în Japonia, la invita]ia generalului Oriki Ryoichi,](https://img.pdfslide.tips/doc/110x75/5e4f6064a3bd485bdc32afda/observatorul-militar-ilie-rad-condus-de-eful-statului-major-general-amiralul.jpg)