Embed Size (px)
Citation preview
UDOP: Final Review and Recommendations
Thermopylae PhD Consulting Team
Sean C. Ahearn, Joshua S. Campbell, André Skupin & JuanCarlos Villagran
19 July 2010
2
Table of Contents
Executive Summary ………………………………………….……………………….….…………….…………………4
1. Introduction ………………………………………………………………………………………………………………5
2. Review……………………………………………………………….…………………………………………………….. 6
2.1 The UDOP Vision………….………………………….…………………………………………………… 6
2.2 UDOP Overview ………………………………………..………………………………………/………..6
2.3 Analytic Framework …………………………………………………………………….……………….7
2.4 Content Issues with UDOP ………………………………………………………….………………..8
3. Role of the UDOP Ontology ……………………………………………………………………………………….10
3.1 Directory Structure ……………………………………………………………………………………….14
3.2 User Profiles …………………………………………………………………………………………………18
3.3 Search based on Tagging ………………………………………………………………………………21
3.4 RDBMS Implementation………………………………………………………………………………. 22
3.5 Semantic Web Implementation …………………………………………………………………….26
3.6 Collaborative Ontology Development…………………………………………………………… 27
4. Symbology ………………………………………………………………………………………………………………….29
4.1 Physiological and technological constraints………………………………………………….. 29
4.2 Symbology standards……………………………………………………………………………………. 30
5. Data Issues …………………….……………………………………………………………………………………………30
5.1 “Sources” ……………………………………………………………………………………………………….31
5.1.1 Network links…………………………………………………………………………………………….. 31
6. Process Issues ……………………………………………………………………………………………………………..32
6.1 Types of data and users ……………….………………………………………………………………….33
6.2 Work flow of input process ……………………………………………………………………………..33

3
7. UDOP Architecture ……………………………………………………………………………………………………….35
7.1 Architecture ……………………………………………………………………………………………………..35
8. Conclusion ……………………………………………………………………………………………………………………..38
9. References ……………………………………………………………………………………………………………………. 39
10. Appendix A: Ontology Tutorial (attached) …………………………………………………………………….39
11. Appendix B: Key data sets for military and HA/DR applications …………………………………….39
4
Executive Summary
The UDOP Ph.D. team was tasked with providing guidance for improving the 3D UDOP geospatial portal
though a set of short term solutions and long term recommendations for its future development. It examined
the strengths and weaknesses of UDOP and interviewed system users to obtain their perception of the
problems. Two issues stood out: (1) the lack of a scalable paradigm for content management and (2) the
limitations of the system architecture which relies on a filebased approach for representing geographic layers,
rather than an entitybased approach afforded by a geospatial database management system. Other issues
related to: data used in UDOP and the need to understand and represent its providence, accuracy and
reliability; the need for processes associated with data input and management; and an approach to symbology
that was userappropriate.
The first step the team made was to establish a vision for the analytic evolution of UDOP which fulfills its
promise of providing the user with an environment that filters and synthesizes a myriad of spatial/temporal
data points, from a wide variety of sources and modalities, into a coherent understanding of the user’s area of
operation. The vision we present shows the potential roadmap for evolution from where the system was at
the project’s inception through the development of domain ontology, the introduction of a spatial database,
and creation of an environment that provides “situation awareness”, “sensemaking”, prospective analysis and
simulation. At the foundation of this evolution is the domain ontology which organizes HA/DR domain
knowledge in a coherent hierarchy/network of classes and relationships among classes (i.e. concepts). The
root “concepts” for this ontology were established to be ActorConcept, DataConcept and SituationConcept. From these three concepts over 750 concepts that capture the knowledge domain of UDOP were created
during the course of this project. This ontology was used as the basis for reorganization of the folder structure
of UDOP midway through the project. An ontology tutorial was developed to enable SouthCom to continue
the development of the ontology in a collaborative manner.
A fundamental tenet of UDOP is to get the right data to the right user for the problems at hand. This is
exemplified by the interplay of the concepts of actors, situations, and data in the domain ontology, aimed at
capturing the idea of a user profile directing a user towards a basket of relevant data/services. We make two
recommendations to implement the ontology and the concept of a user profile: one using an RDBMS and for
which we have developed a scheme for implementing aspects of the ontology; the second using a semantic
web environment which we believe to be the more powerful of the two approaches but perhaps the more
difficult to implement in the shorter term.
The current UDOP system architecture is a singletier, filebased system that has significant limitations with
respect to data management, spatial/temporal analysis and modeling. To make UDOP more versatile and
powerful, we propose a threetiered OGC compliant architecture composed of the data tier, the web services tier and the client tier. The data tier consists of one or more PostgreSQL/PostGIS databases (e.g. separate
databases for different classification levels or networks) which form the heart of the geospatial system. The web service tier is an OGC Web Services layer that provides a range of services supporting various types of
geospatial data. The client tier includes the UDOP and additional thick, thin, and mobile clients. The advantage
of this architecture is that it places all of the development efforts in the data and web services tiers and gives
flexibility in choosing a client that is optimal for a particular set of functionality. The implementation of UDOP
within this framework will take it further down the evolutionary path outlined above.
Finally, we discuss data issues, processes and symbology in the context of improving UDOP’s reliability,
integrity and interpretability. Infused throughout our discussion is the importance of interoperability at the
system level, syntactic level and semantic level.
We believe that the solutions and recommendations described herein provide a path to achieving the
promise of the UDOP to create a unique and powerful usercentered environment for situation awareness,
sensemaking and complex modeling.
5
1 Introduction
The primary goal of this report is to suggest shortterm solutions to enhance the capability of the 3D UDOP
and longterm recommendations for its future development. UDOP is an integrative platform that brings a
wide range of data and services from disparate sources together into one user defined operational picture.
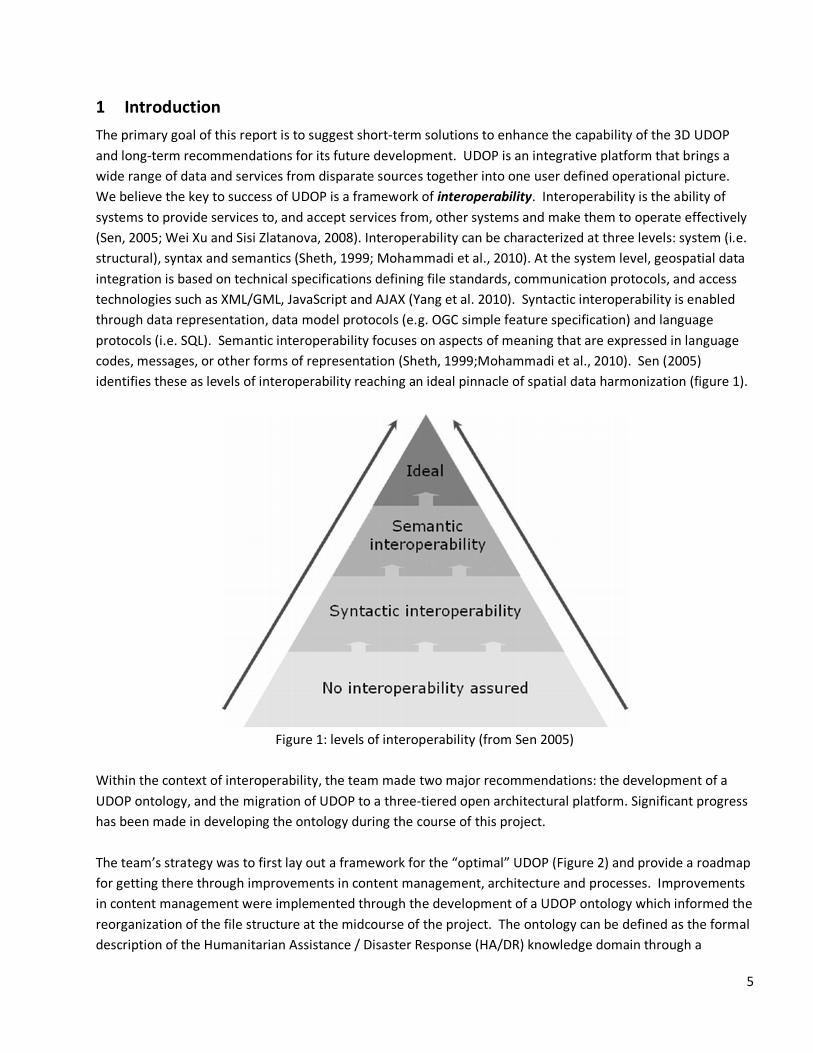
We believe the key to success of UDOP is a framework of interoperability. Interoperability is the ability of
systems to provide services to, and accept services from, other systems and make them to operate effectively
(Sen, 2005; Wei Xu and Sisi Zlatanova, 2008). Interoperability can be characterized at three levels: system (i.e.
structural), syntax and semantics (Sheth, 1999; Mohammadi et al., 2010). At the system level, geospatial data
integration is based on technical specifications defining file standards, communication protocols, and access
technologies such as XML/GML, JavaScript and AJAX (Yang et al. 2010). Syntactic interoperability is enabled
through data representation, data model protocols (e.g. OGC simple feature specification) and language
protocols (i.e. SQL). Semantic interoperability focuses on aspects of meaning that are expressed in language
codes, messages, or other forms of representation (Sheth, 1999;Mohammadi et al., 2010). Sen (2005)
identifies these as levels of interoperability reaching an ideal pinnacle of spatial data harmonization (figure 1).
Figure 1: levels of interoperability (from Sen 2005)
Within the context of interoperability, the team made two major recommendations: the development of a
UDOP ontology, and the migration of UDOP to a threetiered open architectural platform. Significant progress
has been made in developing the ontology during the course of this project.
The team’s strategy was to first lay out a framework for the “optimal” UDOP (Figure 2) and provide a roadmap
for getting there through improvements in content management, architecture and processes. Improvements
in content management were implemented through the development of a UDOP ontology which informed the
reorganization of the file structure at the midcourse of the project. The ontology can be defined as the formal
description of the Humanitarian Assistance / Disaster Response (HA/DR) knowledge domain through a
6
network of concepts (e.g., “Country”, “Transnational Organization”), instances (e.g., “United States”, “NATO”),
and relational properties (e.g., “contains”, “needs data about”). The UDOP ontology discussed below now
includes over 750 concepts and over 1100 relationships between those concepts. Recommendations for
architectural changes are focused on the introduction of a spatial database at the top of a threetiered
structure for data management, web services and clients. Additionally, recommendations are made for
addressing data issues, like metadata requirements and data currency, process issues associated with data
access and input, and symbology. The following recommendations are given in the context of fulfilling the
vision of UDOP that is discussed below.
2 Review
2.1 The UDOP Vision
The promise of the User Defined Operating Picture (UDOP) is to create an environment for the user that filters
and synthesizes a myriad of spatial/temporal data points from a wider variety of sources and modalities into a
coherent understanding of the user’s area of operation. The term sense-making has been coined to capture
this concept (Pirolli and Card, 2005). The intent of UDOP is to enable sense-making at different levels of
abstraction and geographic/temporal scales. Levels of abstraction may range from the person in the field who
needs information about what is happening around them and is tapping into the core data more directly, to
those operating at a higher level of abstraction that require more complex interpretations and
transformations of the data. An analogy for this type of abstraction is the difference between tactical, and
strategic thinking; tactical thinking tends to be “closer” to the data, while strategic thinking tends to be a
further abstraction of the data into more complex ideas and concepts.
These hierarchies of abstraction also correspond to different spatial and temporal scales. For example, a
logistical manager needs access to the realtime data on transportation networks and the number of people in
an IDP camp. A theater commander correspondingly needs a weekly summary of all logistics shipments and
the location of all IDP camps. In this example, the information required for sensemaking is user dependent; it
is this notion that forms the foundation of the UDOP’s “user defined” concept. Therefore an operational UDOP
system requires an intelligent user profile component that defines the appropriate data a user needs. Other
key characteristics of UDOP are that it is a “netcentric” environment that enables shared situation awareness
or sensemaking among many individuals, and that it is a dynamic environment in which realtime events can
be monitored and the significance of change can be understood.
2.2 UDOP Overview
The 3D UDOP is currently built on a Google Earth (GE) Enterprise core, in the form of the GE web browser
plugin, with customized ExtJS controls for the Table of Contents (TOC) and other userinterface controls.
Certain base layers, primarily imagery, are custom loaded into the GE Enterprise server. Additional datasets
can also be created and stored within the 3D UDOP. These are generally created by digitizing and annotating
areas on screen. Individual files created within the 3D UDOP are stored in the Keyhole Markup Language
(KML/KMZ) format as flatfiles on the UDOP backend. Storing datasets, which are essentially collections of
7
geographic objects and their attributes, as KML files poses some challenges for improving the UDOP. It means
that geographic data layers are filebased; any featurebased information associated with an individual
geographic data entity (i.e., individual points, lines, or polygons) are ‘locked’ in the file and cannot be handled
individually. Given the rapid standup of the 3D UDOP application after the Haitian Earthquake, this was the
logical framework for development. However, the lack of entitylevel processing imposes significant
constraints on the evolution of UDOP as a robust system for data organization, access, management, sense
making, and analytic modeling.
2.3 Analytic Framework
The analytic framework suggested by the team is meant to provide a vision for the development of UDOP
from its origins as a Google Earth Plugin to its endpoint as a complex modeling environment. The vision as
shown in Figure 2 shows an analytic framework for a geospatial portal from a simple data viewing and
visualization platform to a complex modeling platform that supports sensemaking, decision support,
prospective analysis and simulation. The current UDOP architecture either supports or could potentially
support aspects of the analytic capabilities along the yellow line including: data viewing and visualization,
delivering user relevant data, intelligent browsing, and situation awareness. However even these functions are
restricted given the current architecture. The use of the ontology will enhance all of these functions but the
constraints associated with the lack of a featurebased spatial database management system limit what is
possible. The more complex, higher level functionality shown along the white portion of the arrow are not
supported in the current architecture of UDOP and would require a spatial database management system.

8
Figure 2: UDOP Evolution and Analytical Framework
2.4 Content Issues with UDOP
In this section we discuss current impediments to achieving the UDOP vision of delivering the right
information to the right person at the right time. It should be noted that the UDOP vision taken to its fullest
extent represents a ‘grand challenge’ in information science; solving this problem is a major research initiative
for many organizations. However, improvement to the current 3D UDOP is an iterative process and we have
identified several areas that can be rapidly improved. These areas can be condensed into three general
categories: content access, content organization, and content management. Ultimately these categories are
interrelated, as are the solutions for improving them. Specifically, we proposed to generate an overall UDOP
ontology that will simultaneously address content access, organization, and management. In fact, during the
course of this project, we initiated the development of such a UDOP ontology (see also the appended tutorial).
Its first iteration already informed a first set of modifications to how data are organized in the UDOP table of
contents (TOC), implemented in midJune. We have since continued to modify the ontology, based on client
input. Continued evolution of the formal ontology – combining stakeholder knowledge feedback and IT
capacity building – will be crucial in addressing content access, organization and management, towards a more
“user defined” environment.
9
Before we describe the initial use of ontology as an organizing force for UDOP, it is useful to see the solution in
the context of the problems we documented during our examination of UDOP and in our discussions with
SouthCom personnel. We divided these issues into problems associated with content access, organization and
management. In Table 1 problems associated with content access are clearly the most pressing problem from
the UDOP users’ perspective. Finding specific content within the mass of data that is accumulating in the
system is a major challenge for users. Because of how the 3D UDOP is currently constructed, users have
difficulty navigating through the table of contents interface, finding data related to their specific interest,
knowing if data is current, organizing new data, and extracting data for use in presentations. Of the five
content access items in Table 1: (a – c) are search related problems, which may have short term fixes, (d) is a
fundamental problem which strikes at the foundation of the current systems and its lack of a “user defined”
operational picture, and (e) and (f) relate to the limitations of the system architecture and the lack of a spatial
database management system as a back end. Of the seven content organization items in Table 1 all are
related to the lack of a consistent methodology for organization which we believe the development of the
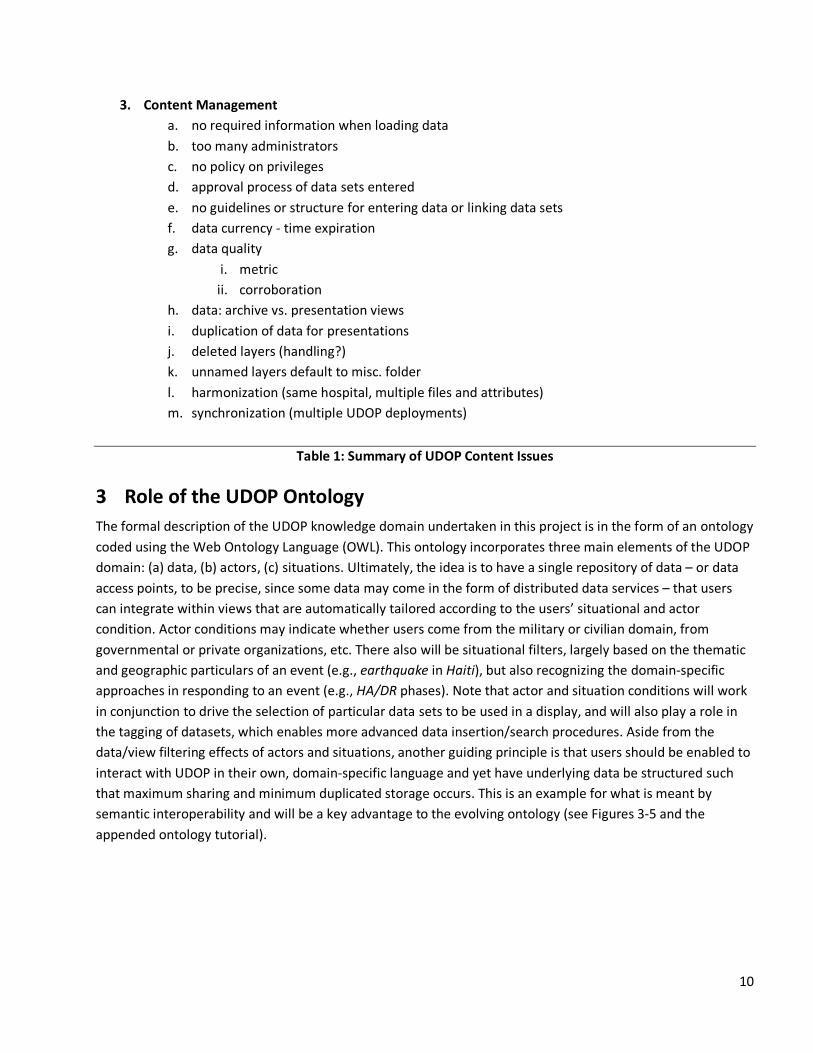
ontology can address. The thirteen items in content management can be grouped into administrative issues
(ae), data issues (fk) and system management issues (kj). These items are all process related that can be
addressed through procedures, work flow and data policy. Some of the issues like k and l could be addressed
with the ontology.
1. Content Access
a. Sort by Name and Sort by Date within individual folders
b. Keyword search within folders is lacking
c. iHarvest search
i. returns top level of folder hierarchy in which search item was found
d. file organization display is the same regardless of user type
e. Feature and attributebased queries aren’t possible
f. Spatial queries aren’t possible.
2. Content Organization
a. lack of naming conventions (file names)
b. single tagbased classification
c. easier way to find data (data v. actor v. situation)
d. current organizational structure doesn’t place layers at the appropriate level of the
information hierarchy.
e. current organization doesn’t place similar layers under the same parent in the hierarchy
f. content is not tailored to user specific needs
g. organization is not intuitive
10
3. Content Management
a. no required information when loading data
b. too many administrators
c. no policy on privileges
d. approval process of data sets entered
e. no guidelines or structure for entering data or linking data sets
f. data currency time expiration
g. data quality
i. metric
ii. corroboration
h. data: archive vs. presentation views
i. duplication of data for presentations
j. deleted layers (handling?)
k. unnamed layers default to misc. folder
l. harmonization (same hospital, multiple files and attributes)
m. synchronization (multiple UDOP deployments)
Table 1: Summary of UDOP Content Issues
3 Role of the UDOP Ontology
The formal description of the UDOP knowledge domain undertaken in this project is in the form of an ontology
coded using the Web Ontology Language (OWL). This ontology incorporates three main elements of the UDOP
domain: (a) data, (b) actors, (c) situations. Ultimately, the idea is to have a single repository of data – or data
access points, to be precise, since some data may come in the form of distributed data services – that users
can integrate within views that are automatically tailored according to the users’ situational and actor
condition. Actor conditions may indicate whether users come from the military or civilian domain, from
governmental or private organizations, etc. There also will be situational filters, largely based on the thematic
and geographic particulars of an event (e.g., earthquake in Haiti), but also recognizing the domainspecific
approaches in responding to an event (e.g., HA/DR phases). Note that actor and situation conditions will work
in conjunction to drive the selection of particular data sets to be used in a display, and will also play a role in
the tagging of datasets, which enables more advanced data insertion/search procedures. Aside from the
data/view filtering effects of actors and situations, another guiding principle is that users should be enabled to
interact with UDOP in their own, domainspecific language and yet have underlying data be structured such
that maximum sharing and minimum duplicated storage occurs. This is an example for what is meant by
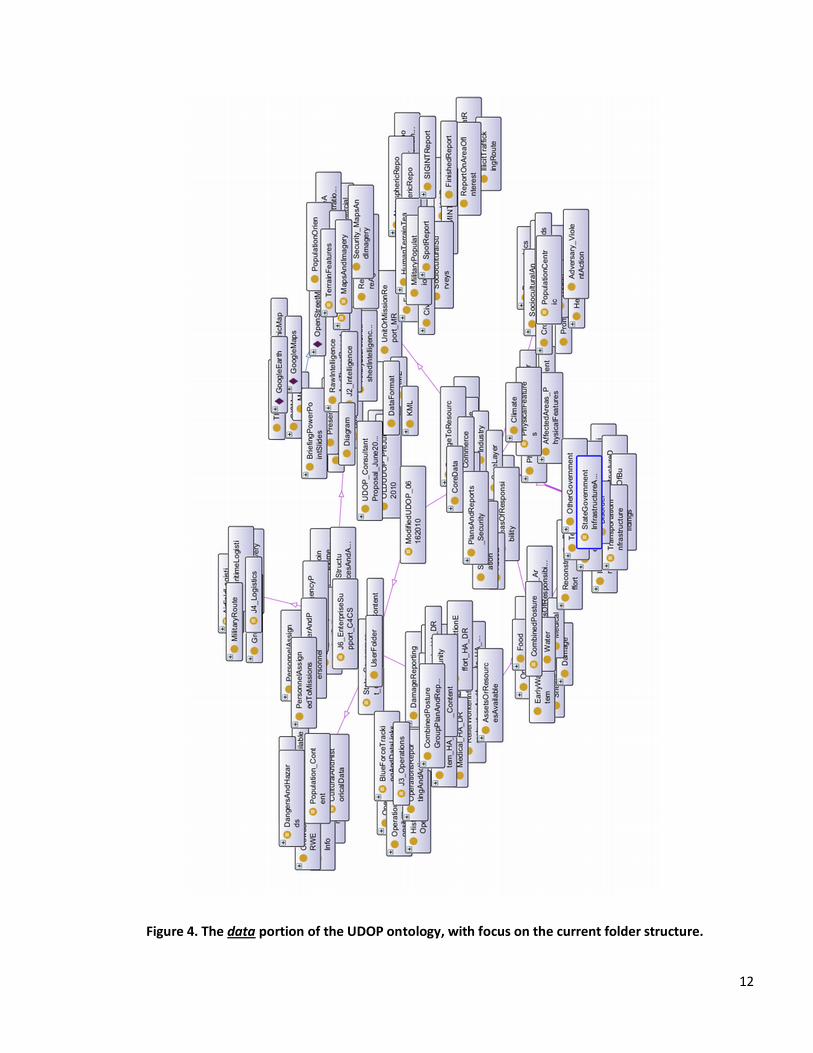
semantic interoperability and will be a key advantage to the evolving ontology (see Figures 35 and the
appended ontology tutorial).

11
Figure 3. The actor portion of the UDOP ontology.
12
Figure 4. The data portion of the UDOP ontology, with focus on the current folder structure.

13
Figure 5. The situation portion of the UDOP ontology

14
Note that the hierarchical structure that formed the backbone of the initial ontology design (following an
industrystandard approach), has been accompanied by a large number of functional crossconnections. For
example, specific phases during the response to an event (i.e., what defines a situation) will have particular
data needs. The ontology attempts to make those links explicit. That is what will enable advanced situation
driven filtering. It will also make shared data access the norm, while allowing modulation in terms of access
permissions via the actor component.
Among short to midterm implications of the ontology, three stand out: (1) reorganization of the “directory”
structure presented to UDOP users, (2) user profiling in generation of key view defaults, and (3) support for
advanced tagging.
3.1 Directory Structure
The table of contents (TOC) presented in the UDOP interface is the main organizational instrument in a
particular UDOP view. It is the user’s view onto the existing data ontology and shapes his/her perception of
how UDOP could [not] support a particular application requirement. Note that, in that sense, an ontology
already exists – as far users are concerned, the current TOC is the UDOP data ontology! The problem is that it
was initially devised in accordance with the main actor’s organizational structure, as opposed to the inherent
ontology of the data or situation (Figure 6).
Figure 6. Initial ontology of UDOP as reflected in the TOC folder structure.
That singleactor, shallowstructure ontology was the root cause for the eventual devolution of the data
organization and the ensuing difficulties experienced by users. To begin addressing these issues, we compiled
various sources about data requirements of military and civil users into the data concepts portion of the
ontology. In the mideffort report we proposed a separation of core data from event and actorspecific data
(Figure 7). Core data would be characterized by (a) having a very large user base, (b) correspondence to
commonly and often openly available sources, and (c) the ability of being generated/maintained before an
event/action. Core data can thus serve as base line data. During an event/action, such core data may be
supplemented with additional attributes (e.g., damage estimate attached to hospitals) or more
comprehensive, eventspecific data generation may be required (e.g., damage assessment based on new
aerial photography) and put in relation to core data (e.g., preevent imagery).

15
Figure 7. Coarse and Finegrained views onto data concepts in the UDOP ontology, as introduced in the mid
effort report.
Note the scalable makeup of the organization allowing for data to be placed/accessed with varying
conceptual granularity. For example, currently a user might deal with a single kml file containing buildings of
various types. For such a heterogeneous file, the “CoreData/Building” concept location would be most
appropriate. On the other hand, if the user wants to add a file containing only hospitals, then the
“CoreData/Building/Hospital” would be more appropriate. Anyone looking for buildings would now be able to
get more specific files as well (assuming proper permissions).
Duplicate access without duplicate storage is another important aspect. For example, the “Hospital” concept
may be found in multiple places in the ontology, including “CoreData/Building/Hospital”,
“CoreData/Infrastructure/Medical/Hospital” and “CoreData/Population/Health/Hospital”. Inserting a file
under any category will make it accessible under all of the others. This will make it easier to find data, both by
browsing and by search (where searching for “Building”, “Health”, or “Hospital” would all be able to yield data
on hospitals). It is all about enabling users to think more about what data they want and less about where in
the system it might be located. Note that there must be an indication to the user regarding this ontological
structure, to avoid confusion, along the lines of “also in ‘Building’ and ‘Health’”, plus linked checkboxes, etc...
16
Apart from a concept pointing to multiple superclasses, the ontology also supports equivalence of concepts,
such as when “Imagery” is explicitly modeled to be equivalent to “Remote Sensing” or “Sewage” being
equivalent to “WasteWater”. That feature is especially useful for search functionality.
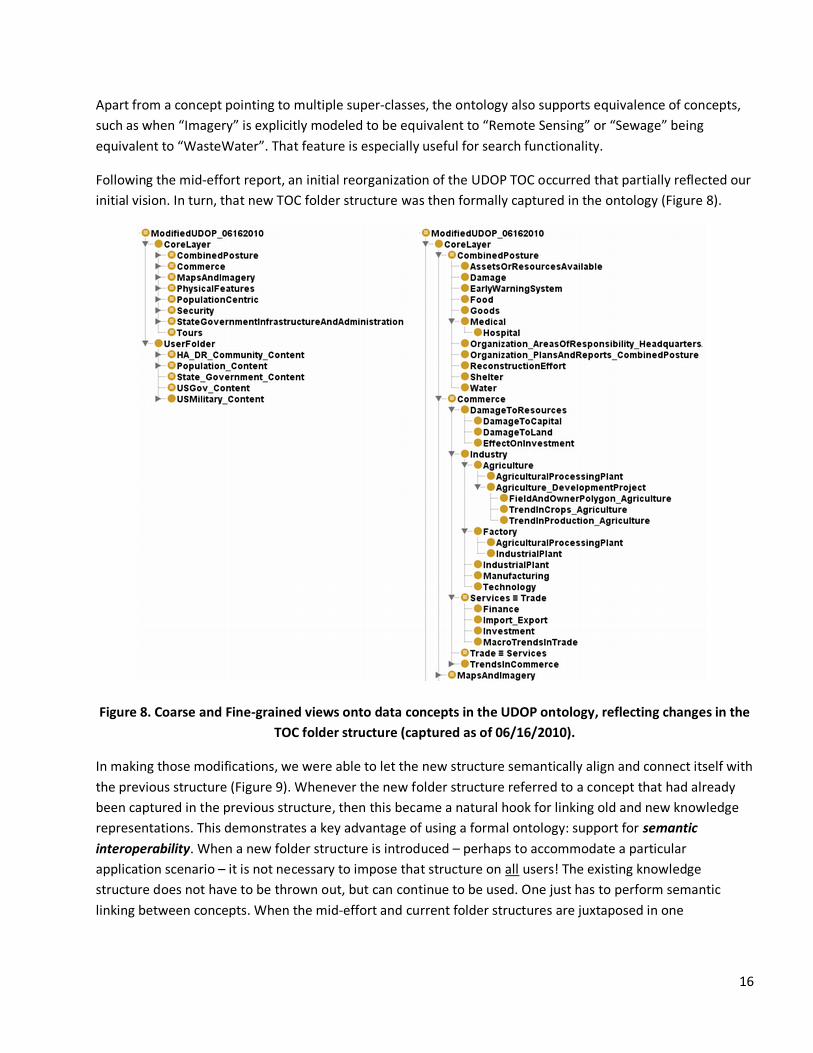
Following the mideffort report, an initial reorganization of the UDOP TOC occurred that partially reflected our
initial vision. In turn, that new TOC folder structure was then formally captured in the ontology (Figure 8).
Figure 8. Coarse and Finegrained views onto data concepts in the UDOP ontology, reflecting changes in the
TOC folder structure (captured as of 06/16/2010).
In making those modifications, we were able to let the new structure semantically align and connect itself with
the previous structure (Figure 9). Whenever the new folder structure referred to a concept that had already
been captured in the previous structure, then this became a natural hook for linking old and new knowledge
representations. This demonstrates a key advantage of using a formal ontology: support for semantic
interoperability. When a new folder structure is introduced – perhaps to accommodate a particular
application scenario – it is not necessary to impose that structure on all users! The existing knowledge
structure does not have to be thrown out, but can continue to be used. One just has to perform semantic
linking between concepts. When the mideffort and current folder structures are juxtaposed in one
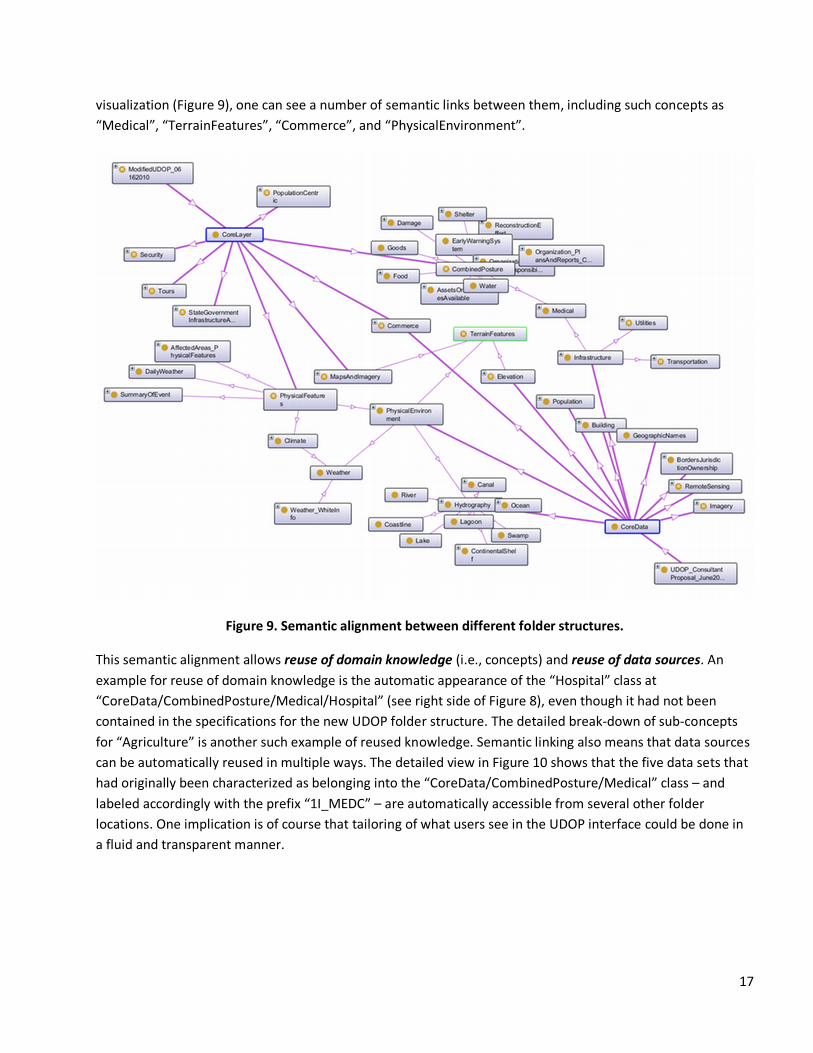
17
visualization (Figure 9), one can see a number of semantic links between them, including such concepts as
“Medical”, “TerrainFeatures”, “Commerce”, and “PhysicalEnvironment”.
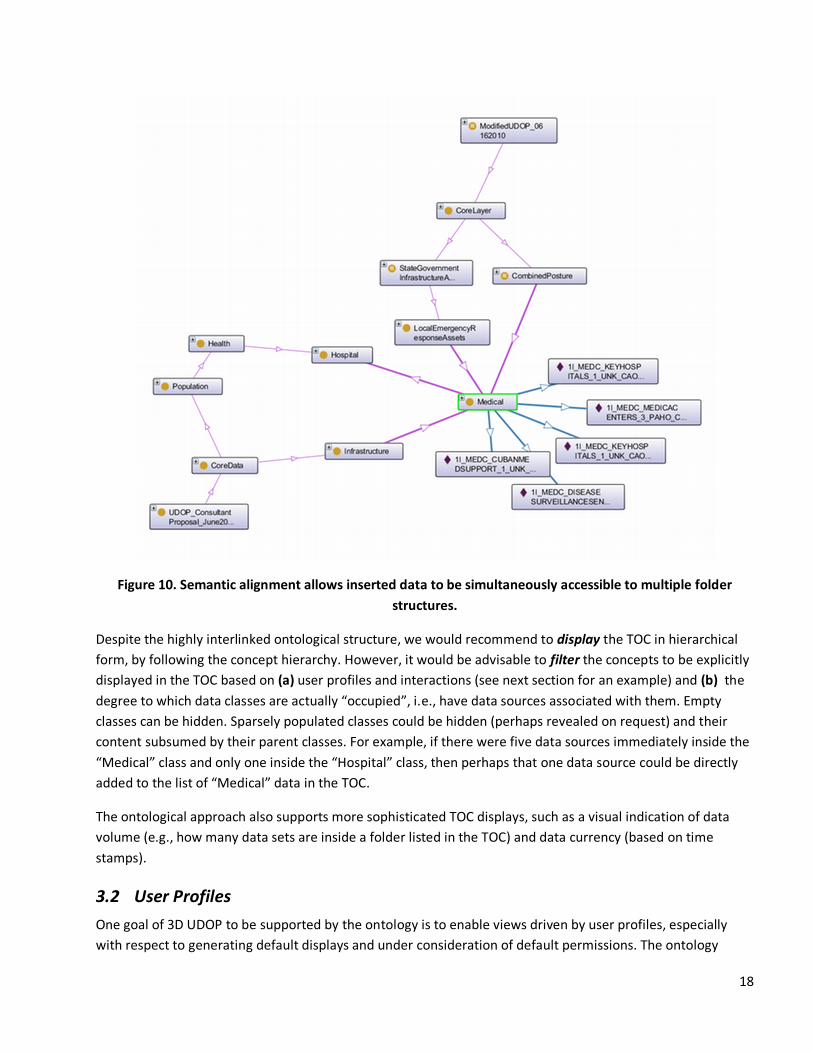
Figure 9. Semantic alignment between different folder structures.
This semantic alignment allows reuse of domain knowledge (i.e., concepts) and reuse of data sources. An
example for reuse of domain knowledge is the automatic appearance of the “Hospital” class at
“CoreData/CombinedPosture/Medical/Hospital” (see right side of Figure 8), even though it had not been
contained in the specifications for the new UDOP folder structure. The detailed breakdown of subconcepts
for “Agriculture” is another such example of reused knowledge. Semantic linking also means that data sources
can be automatically reused in multiple ways. The detailed view in Figure 10 shows that the five data sets that
had originally been characterized as belonging into the “CoreData/CombinedPosture/Medical” class – and
labeled accordingly with the prefix “1I_MEDC” – are automatically accessible from several other folder
locations. One implication is of course that tailoring of what users see in the UDOP interface could be done in
a fluid and transparent manner.
18
Figure 10. Semantic alignment allows inserted data to be simultaneously accessible to multiple folder
structures.
Despite the highly interlinked ontological structure, we would recommend to display the TOC in hierarchical
form, by following the concept hierarchy. However, it would be advisable to filter the concepts to be explicitly
displayed in the TOC based on (a) user profiles and interactions (see next section for an example) and (b) the
degree to which data classes are actually “occupied”, i.e., have data sources associated with them. Empty
classes can be hidden. Sparsely populated classes could be hidden (perhaps revealed on request) and their
content subsumed by their parent classes. For example, if there were five data sources immediately inside the
“Medical” class and only one inside the “Hospital” class, then perhaps that one data source could be directly
added to the list of “Medical” data in the TOC.
The ontological approach also supports more sophisticated TOC displays, such as a visual indication of data
volume (e.g., how many data sets are inside a folder listed in the TOC) and data currency (based on time
stamps).
3.2 User Profiles
One goal of 3D UDOP to be supported by the ontology is to enable views driven by user profiles, especially
with respect to generating default displays and under consideration of default permissions. The ontology
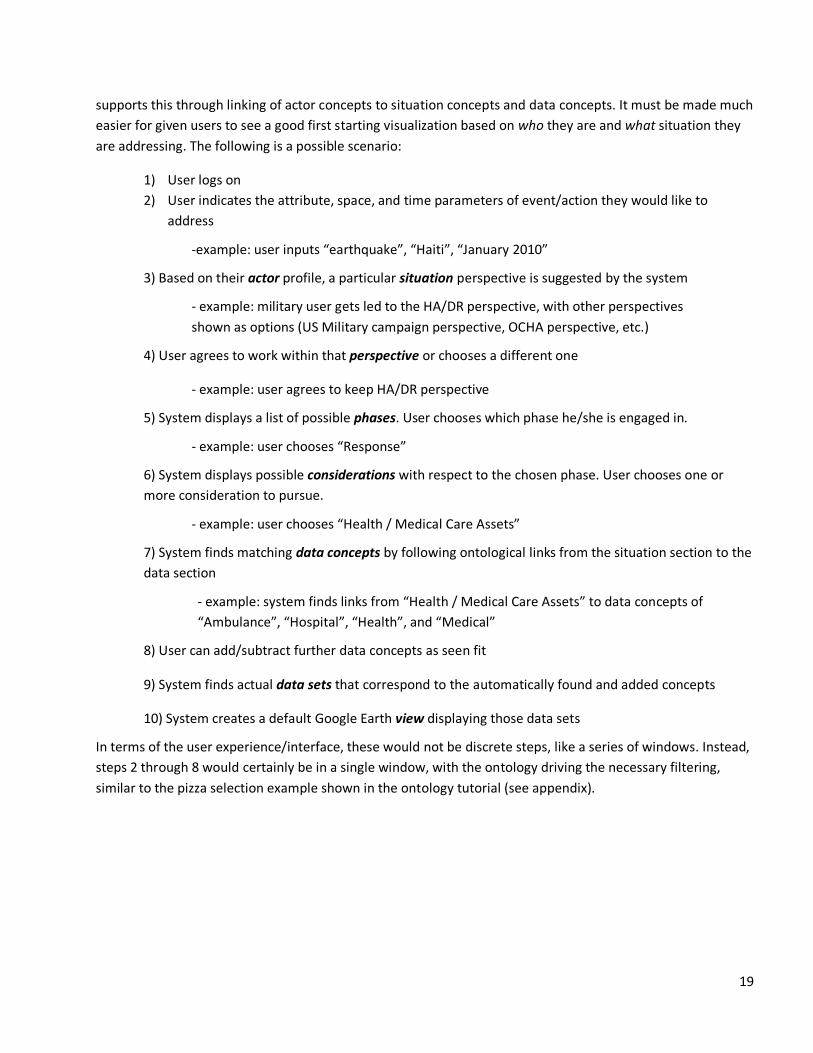
19
supports this through linking of actor concepts to situation concepts and data concepts. It must be made much
easier for given users to see a good first starting visualization based on who they are and what situation they
are addressing. The following is a possible scenario:
1) User logs on
2) User indicates the attribute, space, and time parameters of event/action they would like to
address
example: user inputs “earthquake”, “Haiti”, “January 2010”
3) Based on their actor profile, a particular situation perspective is suggested by the system
example: military user gets led to the HA/DR perspective, with other perspectives
shown as options (US Military campaign perspective, OCHA perspective, etc.)
4) User agrees to work within that perspective or chooses a different one
example: user agrees to keep HA/DR perspective
5) System displays a list of possible phases. User chooses which phase he/she is engaged in.
example: user chooses “Response”
6) System displays possible considerations with respect to the chosen phase. User chooses one or
more consideration to pursue.
example: user chooses “Health / Medical Care Assets”
7) System finds matching data concepts by following ontological links from the situation section to the
data section
example: system finds links from “Health / Medical Care Assets” to data concepts of
“Ambulance”, “Hospital”, “Health”, and “Medical”
8) User can add/subtract further data concepts as seen fit
9) System finds actual data sets that correspond to the automatically found and added concepts
10) System creates a default Google Earth view displaying those data sets
In terms of the user experience/interface, these would not be discrete steps, like a series of windows. Instead,
steps 2 through 8 would certainly be in a single window, with the ontology driving the necessary filtering,
similar to the pizza selection example shown in the ontology tutorial (see appendix).
20
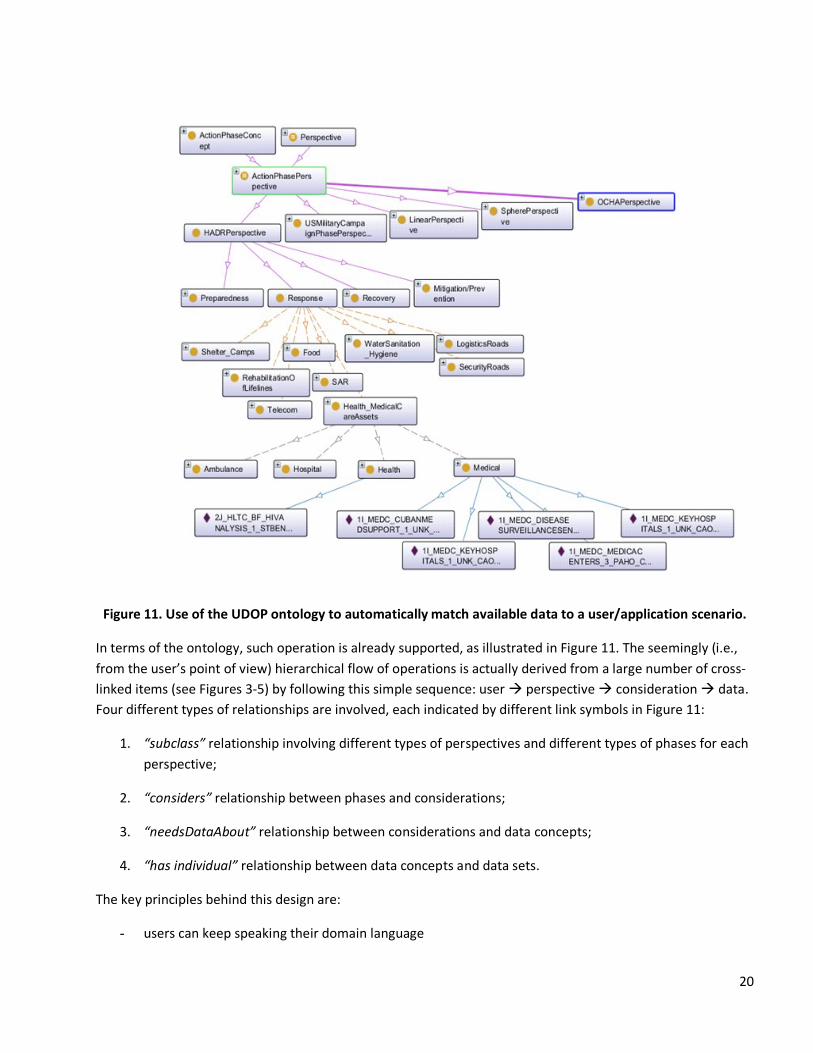
Figure 11. Use of the UDOP ontology to automatically match available data to a user/application scenario.
In terms of the ontology, such operation is already supported, as illustrated in Figure 11. The seemingly (i.e.,
from the user’s point of view) hierarchical flow of operations is actually derived from a large number of cross
linked items (see Figures 35) by following this simple sequence: user � perspective � consideration � data.
Four different types of relationships are involved, each indicated by different link symbols in Figure 11:
1. “subclass” relationship involving different types of perspectives and different types of phases for each
perspective;
2. “considers” relationship between phases and considerations;
3. “needsDataAbout” relationship between considerations and data concepts;
4. “has individual” relationship between data concepts and data sets.
The key principles behind this design are:
- users can keep speaking their domain language
21
- users can get meaningful views faster
- data remain separate from situation and actor, which enables reuse across situations and actors
3.3 Search based on Tagging
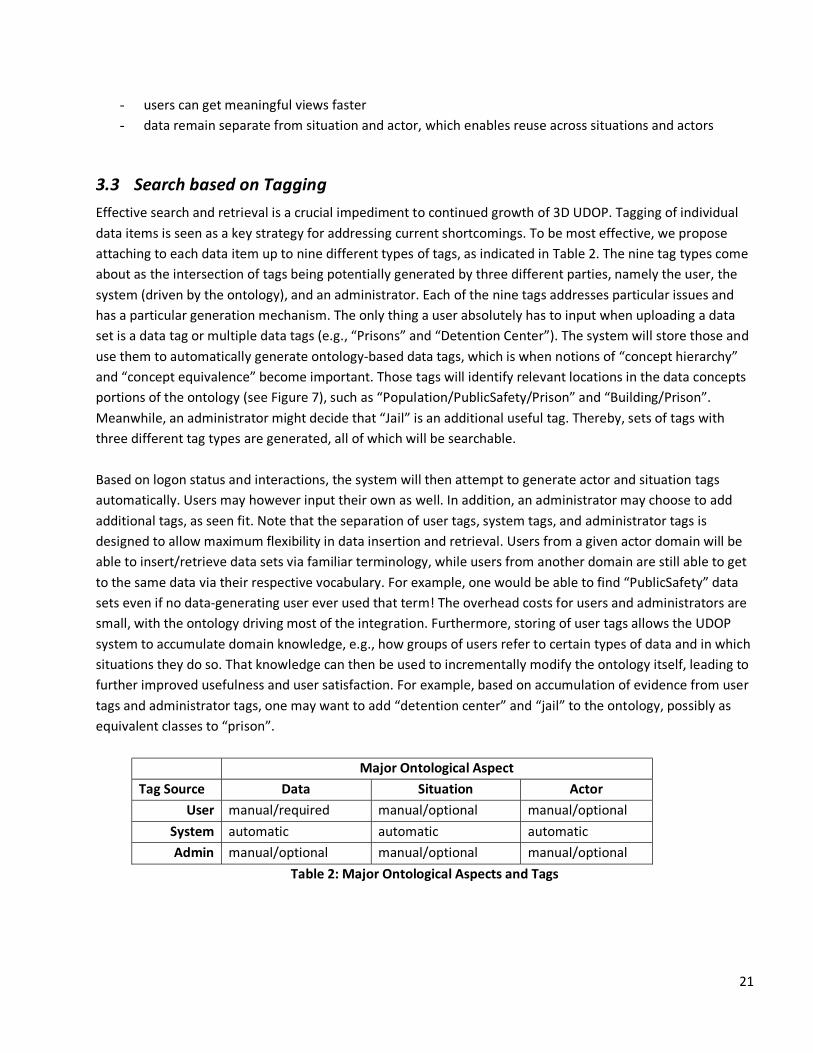
Effective search and retrieval is a crucial impediment to continued growth of 3D UDOP. Tagging of individual
data items is seen as a key strategy for addressing current shortcomings. To be most effective, we propose
attaching to each data item up to nine different types of tags, as indicated in Table 2. The nine tag types come
about as the intersection of tags being potentially generated by three different parties, namely the user, the
system (driven by the ontology), and an administrator. Each of the nine tags addresses particular issues and
has a particular generation mechanism. The only thing a user absolutely has to input when uploading a data
set is a data tag or multiple data tags (e.g., “Prisons” and “Detention Center”). The system will store those and
use them to automatically generate ontologybased data tags, which is when notions of “concept hierarchy”
and “concept equivalence” become important. Those tags will identify relevant locations in the data concepts
portions of the ontology (see Figure 7), such as “Population/PublicSafety/Prison” and “Building/Prison”.
Meanwhile, an administrator might decide that “Jail” is an additional useful tag. Thereby, sets of tags with
three different tag types are generated, all of which will be searchable.
Based on logon status and interactions, the system will then attempt to generate actor and situation tags
automatically. Users may however input their own as well. In addition, an administrator may choose to add
additional tags, as seen fit. Note that the separation of user tags, system tags, and administrator tags is
designed to allow maximum flexibility in data insertion and retrieval. Users from a given actor domain will be
able to insert/retrieve data sets via familiar terminology, while users from another domain are still able to get
to the same data via their respective vocabulary. For example, one would be able to find “PublicSafety” data
sets even if no datagenerating user ever used that term! The overhead costs for users and administrators are
small, with the ontology driving most of the integration. Furthermore, storing of user tags allows the UDOP
system to accumulate domain knowledge, e.g., how groups of users refer to certain types of data and in which
situations they do so. That knowledge can then be used to incrementally modify the ontology itself, leading to
further improved usefulness and user satisfaction. For example, based on accumulation of evidence from user
tags and administrator tags, one may want to add “detention center” and “jail” to the ontology, possibly as
equivalent classes to “prison”.
Major Ontological Aspect
Tag Source Data Situation Actor
User manual/required manual/optional manual/optional
System automatic automatic automatic
Admin manual/optional manual/optional manual/optional
Table 2: Major Ontological Aspects and Tags
22
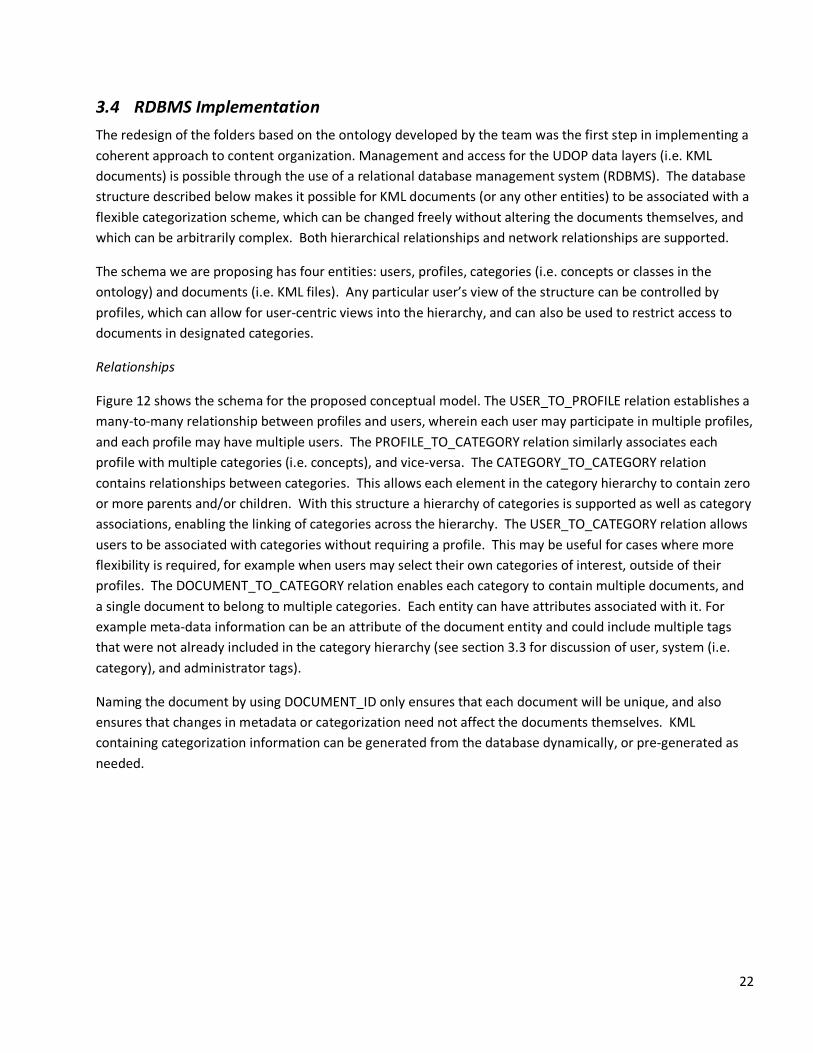
3.4 RDBMS Implementation
The redesign of the folders based on the ontology developed by the team was the first step in implementing a
coherent approach to content organization. Management and access for the UDOP data layers (i.e. KML
documents) is possible through the use of a relational database management system (RDBMS). The database
structure described below makes it possible for KML documents (or any other entities) to be associated with a
flexible categorization scheme, which can be changed freely without altering the documents themselves, and
which can be arbitrarily complex. Both hierarchical relationships and network relationships are supported.
The schema we are proposing has four entities: users, profiles, categories (i.e. concepts or classes in the
ontology) and documents (i.e. KML files). Any particular user’s view of the structure can be controlled by
profiles, which can allow for usercentric views into the hierarchy, and can also be used to restrict access to
documents in designated categories.
Relationships
Figure 12 shows the schema for the proposed conceptual model. The USER_TO_PROFILE relation establishes a
manytomany relationship between profiles and users, wherein each user may participate in multiple profiles,
and each profile may have multiple users. The PROFILE_TO_CATEGORY relation similarly associates each
profile with multiple categories (i.e. concepts), and viceversa. The CATEGORY_TO_CATEGORY relation
contains relationships between categories. This allows each element in the category hierarchy to contain zero
or more parents and/or children. With this structure a hierarchy of categories is supported as well as category
associations, enabling the linking of categories across the hierarchy. The USER_TO_CATEGORY relation allows
users to be associated with categories without requiring a profile. This may be useful for cases where more
flexibility is required, for example when users may select their own categories of interest, outside of their
profiles. The DOCUMENT_TO_CATEGORY relation enables each category to contain multiple documents, and
a single document to belong to multiple categories. Each entity can have attributes associated with it. For
example metadata information can be an attribute of the document entity and could include multiple tags
that were not already included in the category hierarchy (see section 3.3 for discussion of user, system (i.e.
category), and administrator tags).
Naming the document by using DOCUMENT_ID only ensures that each document will be unique, and also
ensures that changes in metadata or categorization need not affect the documents themselves. KML
containing categorization information can be generated from the database dynamically, or pregenerated as
needed.
23
CATEGORY
PK CATEGORY_ID
CATEGORY_NMOthers...
DOCUMENT
PK DOCUMENT_ID
FK1 UPLOADED_BY_IDOther metadata...
DOCUMENT_TO_CATEGORY
PK,FK2 CATEGORY_IDPK,FK1 DOCUMENT_ID
USER
PK USER_ID
USER_NMFIRST_NMLAST_NMTITLE_TXTELEPHONE_TXEMAIL_TXOthers...
PROFILE
PK PROFILE_ID
PROFILE_NMOthers...
USER_TO_PROFILE
PK,FK2 USER_IDPK,FK1 PROFILE_ID
PROFILE_TO_CATEGORY
PK,FK2 PROFILE_IDPK,FK1 CATEGORY_ID
USER_TO_CATEGORY
PK,FK1 USER_IDPK,FK2 CATEGORY_ID
KML filenamedusing
document id
CATEGORY_TO_CATEGORY
PK,FK2 CATEGORY1_IDPK,FK1 CATEGORY1_ID
Figure 12. RDBMS implementation of aspects of the UDOP ontology
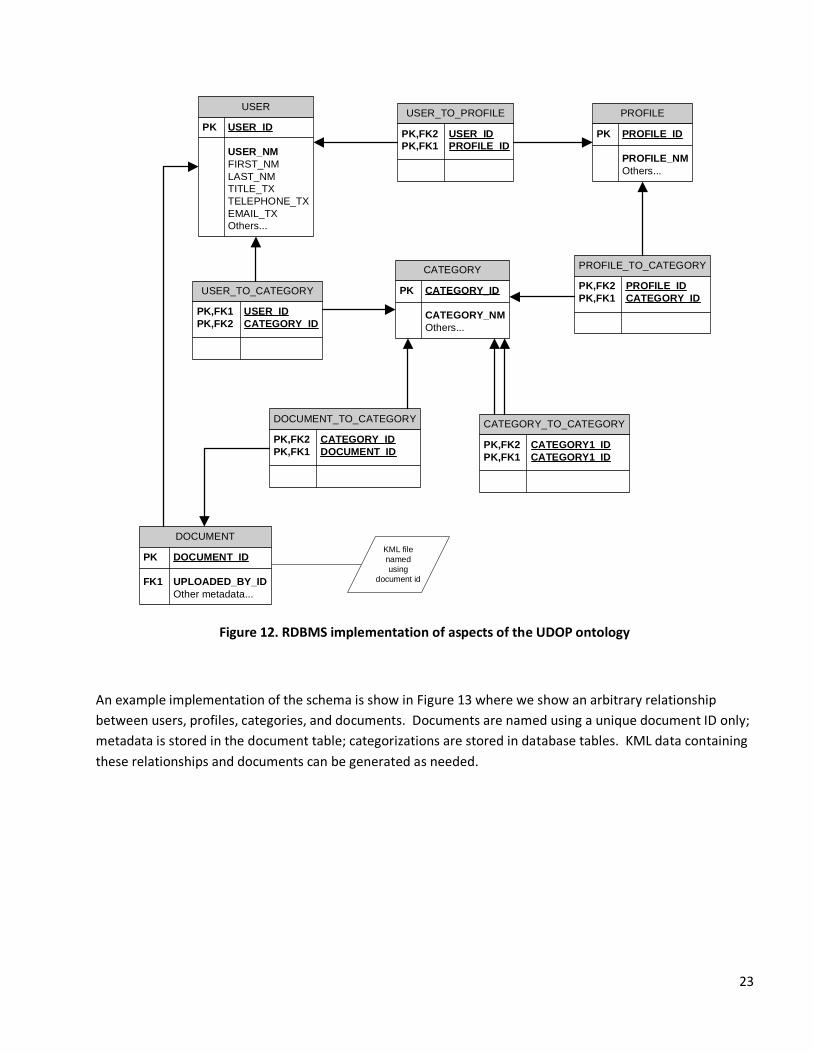
An example implementation of the schema is show in Figure 13 where we show an arbitrary relationship
between users, profiles, categories, and documents. Documents are named using a unique document ID only;
metadata is stored in the document table; categorizations are stored in database tables. KML data containing
these relationships and documents can be generated as needed.
24
Figure 13. User, Profile, Category and Document relationships
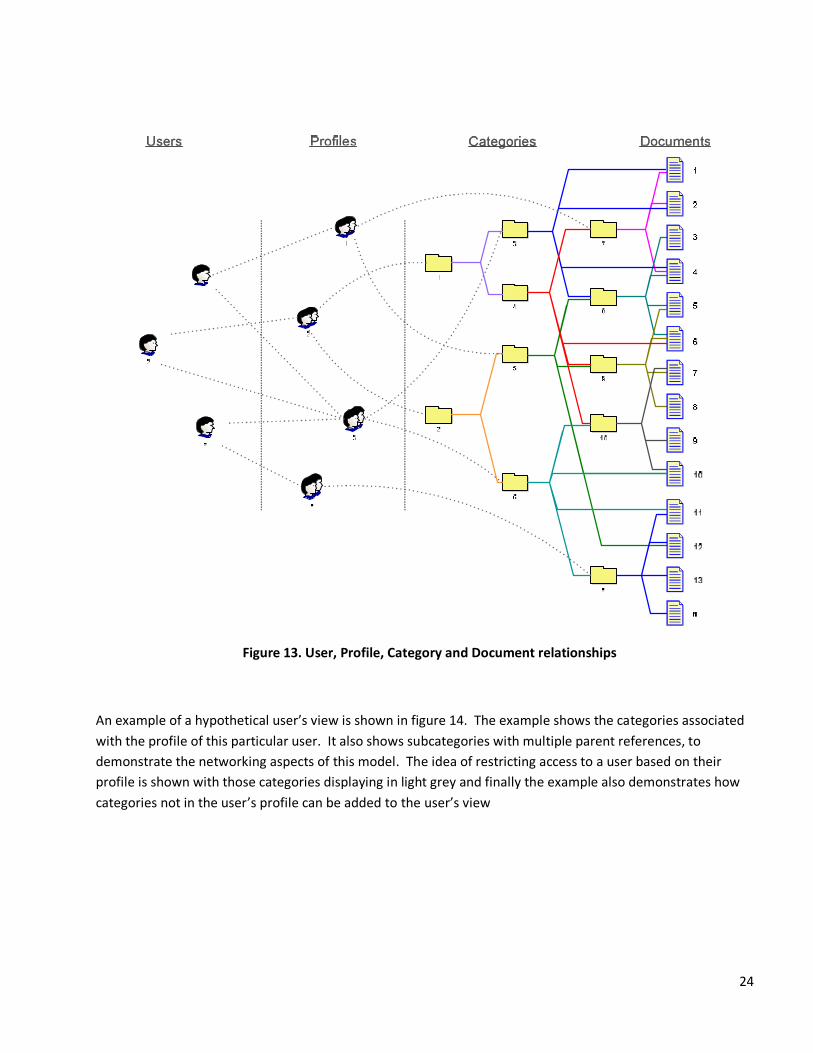
An example of a hypothetical user’s view is shown in figure 14. The example shows the categories associated
with the profile of this particular user. It also shows subcategories with multiple parent references, to
demonstrate the networking aspects of this model. The idea of restricting access to a user based on their
profile is shown with those categories displaying in light grey and finally the example also demonstrates how
categories not in the user’s profile can be added to the user’s view
25
Figure 14. Sample view that a user might have, with annotations.
26
3.5 Semantic Web Implementation
An RDBMS approach to ontology implementation limits the type of relationships that can be exploited among
elements (e.g. classes in the ontology) to “has Subclass” or “has Superclass” type relationships. As indicated
above, the variety of the types of relationships potentially supported by the ontology is however much larger,
with examples like “hasJurisdictionOver”, “isPartOf”, or “needsDataAbout”. The ability to automatically infer
implicit relationships – as opposed to tracing just the asserted ones is also executed with greater ease within
a full semantic web software development environment.
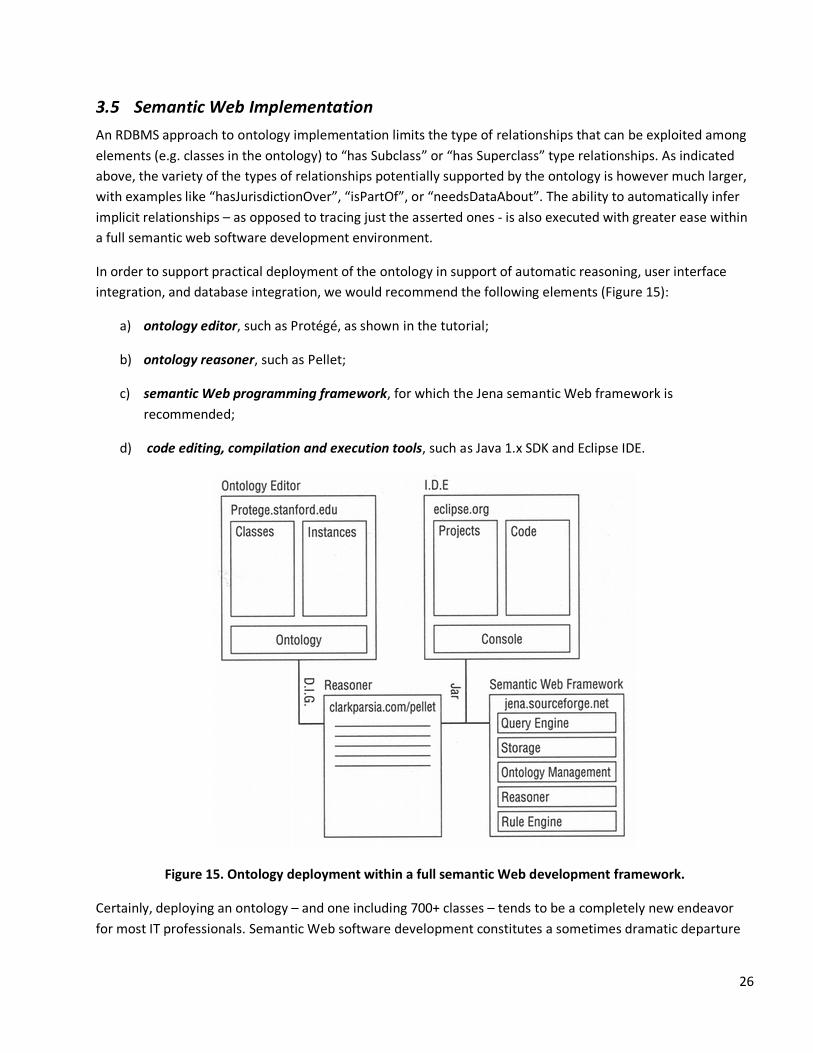
In order to support practical deployment of the ontology in support of automatic reasoning, user interface
integration, and database integration, we would recommend the following elements (Figure 15):
a) ontology editor, such as Protégé, as shown in the tutorial;
b) ontology reasoner, such as Pellet;
c) semantic Web programming framework, for which the Jena semantic Web framework is
recommended;
d) code editing, compilation and execution tools, such as Java 1.x SDK and Eclipse IDE.
Figure 15. Ontology deployment within a full semantic Web development framework.
Certainly, deploying an ontology – and one including 700+ classes – tends to be a completely new endeavor
for most IT professionals. Semantic Web software development constitutes a sometimes dramatic departure
27
from traditional database design and computer programming. Here are some key readings for technical
professionals involved, especially when there is no or limited previous exposure to the topic:
� Hitzler et al (2010) Foundations of Semantic Web Technologies. CRC Press.
� Allemang & Hendler (2008) Semantic Web for the Working Ontologist: Effective Modeling in RDFS and
OWL. Morgan Kauffman Publishers.
� Hebeler et al (2009) Semantic Web Programming. Wiley Publishing Inc.
With respect to the end users and other stakeholders, technical aspects of ontology deployment should be
largely transparent. However, that is not the case for the content of the ontology. This is where UDOP users
must be intimately involved, and in a highly collaborative manner.
3.6 Collaborative Ontology Development
As a formal description of a knowledge domain, any ontology can only be useful to the degree that it succeeds
in capturing explicit and implicit knowledge held by a given community. The ontology presented in its current
form was created on the basis of only limited interaction with and with practically no feedback from the
community of UDOP stakeholders. As far as receiving input from the stakeholders, we utilized a number of
documents put together by TST (especially regarding the military side of the UDOP community). This greatly
helped in shaping the broad structure – especially the division into actor, data, and situation components –
and in incorporating militaryspecific aspects, especially with respect to Humanitarian Assistance/Disaster
Relief (HA/DR). In addition, we profited from information that was provided regarding UNbased approaches.
The proposed work flow “user � perspective � consideration � data” was the results of our
conceptualization of UDOP use, based on the available sources of domain knowledge.
In addition to actually incorporating community knowledge, we attempted to build into the ontology a variety
of different elements that point to the range of potential applications, beyond the more immediate goals. The
location concepts are a prime example for this pedagogic goal, with its incorporation of the hierarchical
organization into “countryprovincecountymunicipalityneighborhood”. It is an example where the
hierarchically nested realworld organization of administrative entities should actually not be translated into a
hierarchy of concepts, despite the temptation. Instead, the realworld hierarchy is expressed through
dedicated object properties (see the appended tutorial for details). Seeing this in action is meant to make it
easier to envision the scope of future UDOP ontology efforts.
With the combination of actual domain knowledge (as conceptualized by the consultants) and the
demonstration of broader uses and ontological design patterns, the UDOP ontology is now at a stage where
collaborative inspection, reflection, feedback, and modification by the stakeholders is of the utmost
importance, with the following steps:
(1) Stakeholders should become familiarized with the ontology via the tutorial. Ideally, this should occur in
conjunction with having the ontology file (UDOP.owl) and the editor application (Protégé) available, though it
may not be necessary for all parties and at this immediate stage.
28
(2) The ontology has to be checked for correctness, i.e., whether its formal content is in accordance with
community knowledge. This should start with the most obvious elements, i.e., classes, individuals, object
properties, data properties on their own (e.g., naming), followed by simple class hierarchies and membership
of individuals in classes, and then followed by investigation of how object properties have been used to link
different elements.
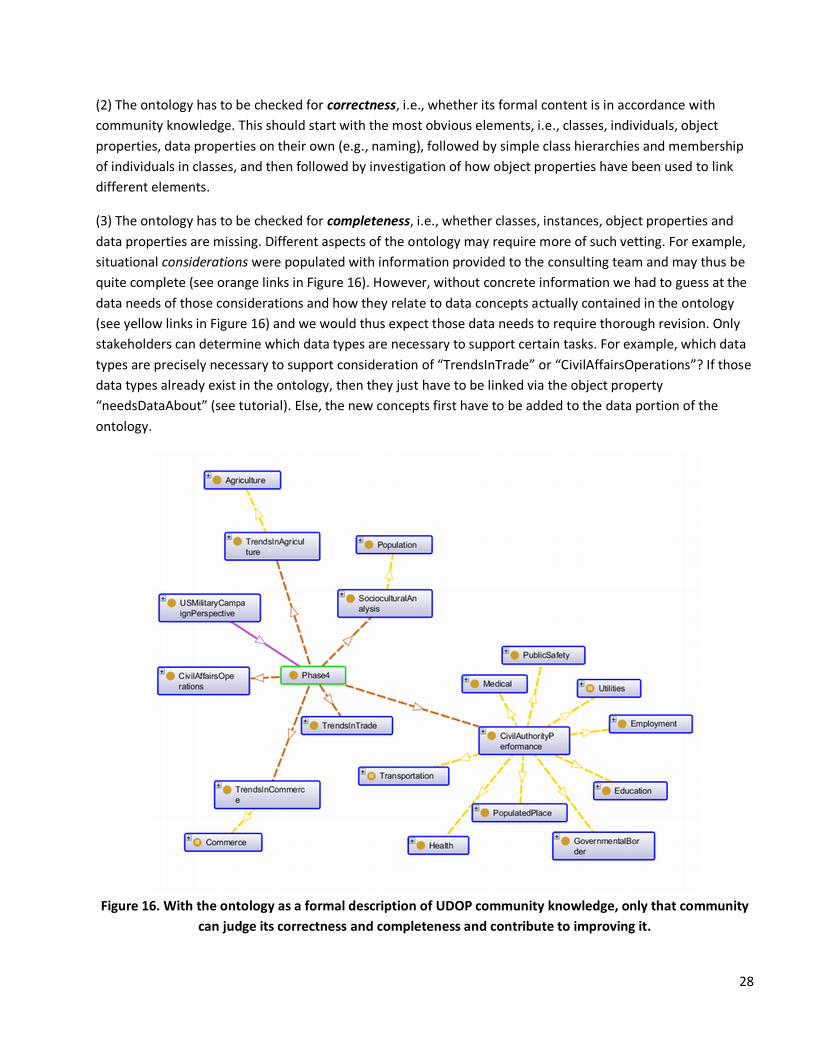
(3) The ontology has to be checked for completeness, i.e., whether classes, instances, object properties and
data properties are missing. Different aspects of the ontology may require more of such vetting. For example,
situational considerations were populated with information provided to the consulting team and may thus be
quite complete (see orange links in Figure 16). However, without concrete information we had to guess at the
data needs of those considerations and how they relate to data concepts actually contained in the ontology
(see yellow links in Figure 16) and we would thus expect those data needs to require thorough revision. Only
stakeholders can determine which data types are necessary to support certain tasks. For example, which data
types are precisely necessary to support consideration of “TrendsInTrade” or “CivilAffairsOperations”? If those
data types already exist in the ontology, then they just have to be linked via the object property
“needsDataAbout” (see tutorial). Else, the new concepts first have to be added to the data portion of the
ontology.
Figure 16. With the ontology as a formal description of UDOP community knowledge, only that community
can judge its correctness and completeness and contribute to improving it.
29
(4) The ontology has to be checked for consistency, such as in terms of the granularity of concepts. Is it ok if
some data types have a detailed breakdown into subtypes while others remain at a coarser level? Again, it is
impossible to answer this without detailed stakeholder involvement.
(5) It should be identified which additional features the ontology should support and how. For example, it
might be useful to integrate permissions, presumably originating with actors, but what is the appropriate
granularity at which to differentiate actors in terms of permissions?
(6) The questions, concerns, and critique raised by stakeholders may point towards a need to import existing
ontologies (e.g., for geographic names and coordinate systems) and how to prioritize such imports. Not that
the current ontology utilized no formal ontology import (apart from informal incorporation of country names),
in order keep complexity manageable.
4 Symbology
One of the critical factors in successful and continued adoption of the 3D UDOP system is the use of effective
symbol sets. Currently, default symbol sets are used whose generic nature does not allow quick visual
recognition of the underlying meaning. That is why users currently have to rely on TOC interaction to associate
given symbols with their meaning, for example by switching layers on/off. Ideally, one would have symbol sets
that satisfy physiological, technological, and standardization requirements.
4.1 Physiological and technological constraints
Physiological constraints play a role mainly in terms of minimum symbol size in conjunction with symbol
complexity. Simple geometric symbols (e.g., circles, squares, triangles) are recognizable at relatively small size,
which enables placing larger numbers of symbols and potentially less crowding/overplotting. However, such
symbols nearly always require explanation via legend or TOC, since their meaning is completely ambiguous
(apart from certain accepted standards, like blue/red for different forces).
Graphically more complex symbols (e.g., pictographic signs) are meant to be more easily associated with a
particular meaning. However, their graphic complexity requires them to have larger symbols size, which
means that one can only display a smaller number of features, as compared to simple geometric symbols.
The specific display technology, especially display resolution, plays a role in determining whether symbols of a
given size can actually be graphically reproduced. For example, symbols on a paper map can be comparatively
small, as compared to a computer display. Consider that paper maps reproduced by inkjet, laser, or offset
printing technology typically have a resolution of 300600 dpi (dots per inch), while most computer monitors
have around 100150 ppi (pixels per inch). A small number of smartphones are approaching 300 ppi, but are of
course highlighting another technology constraint in symbol design, display size.
30
4.2 Symbology standards
Standardization of symbols is particularly important in timecritical applications, as exemplified by emergency
response and military combat situations, in other words, exactly the scenarios that 3D UDOP is meant to
address! However, we do not recommend pursuing a single standard for 3D UDOP symbology, due to (1) the
variety of user groups and application scenarios and (2) the evolving nature of standards in this area.
Note that symbol standards should never be imposed onto users, due to the factors mentioned above
(physiological and technological), not to mention organizational factors (i.e., stakeholder engagement).
Stakeholders must be consulted indepth, and any proposed symbol set must undergo serious user studies
involving realworld data sets and use scenarios (e.g., testing for how well symbols can actually be detected
and deciphered by users). Since such studies would seem outside the scope of 3D UDOP, our recommendation
is to avoid generating new symbol designs whenever possible and to either use simple geometric symbols or
turn to existing standards.
Research on existing map symbology standards relevant to UDOP is currently ongoing (and not yet published),
for example one at Pennsylvania State University funded by DHS. These efforts are motivated by the lack of
standardization in map symbols used across DHS and the simultaneous realization that ANSI INCITS 4152006,
while intended for emergency management mapping, has in practice been poorly adopted. Results from that
study should be published in the near future and should be considered then.
At this point, it is advisable to incorporate into UDOP a small number of existing standards according to their
current specifications and in recognition of their ongoing evolution. “Incorporation into UDOP” here refers to
making it easier for users to use those symbol sets with their respective UDOP layers, if they so choose.
The two most obvious standards to make available to UDOP users are ANSI INCITS 415 and MILSTD2525.
ANSI INCITS 415 is meant to support crossagency coordination during emergency response and was
developed by the FGDC (Federal Geographic Data Committee) Homeland Security Working Group and Kent
State University. Symbols can be freely downloaded at http://www.fgdc.gov/HSWG/index.html. MILSTD
2525, also known as DoD Common Warfighting Symbology, is accessible by searching for Document ID “MIL
STD2525C” at http://www.assistdocs.com/search/search_basic.cfm.
Other relevant standards to consider include the Australasian AllHazards Symbology Project
(http://www.anzlic.org.au/symbology.html), which has symbol sets downloadable at
http://www.anzlic.org.au/get/2456956750.zip, and – especially for demining purposes – the Information
Management System for Mine Action (IMSMA http://www.gichd.org/operationalassistance
research/informationmanagementimsma/imsma/symbology/), with symbol sets at
http://www.gichd.org/fileadmin/user_upload/zip/IMSMA%20V4%20Symbology%20font%20files.zip
5 Data Issues
Three issues associated with data quality were identified that impact the UDOP: data providence, accuracy,
and currency. Data providence relates to the source and continuity of the data; this is complicated by the fact
the UDOP can import data from outside sources. Accuracy involves the reliability of both the spatial and
31
attribute components of data. Data currency relates to the changing nature of data and the ability of the
system to identify and symbolize outdated data. The relative importance of each issue is also influenced by
who the user is, and for what purpose it is being used. These qualities and a host of others are usually
contained in the metadata associated with a given data set. Metadata is literally “data about data”. The most
widely accepted format for metadata is the International Organization for Standardization metadata standard
(ISO 19115). Many of the requisite data fields for ISO 19115 (user, content, extent…) could be collected
implicitly by the system as data is uploaded or digitized on screen. Most data released by government
organizations have a complete set of metadata, so the focus of metadata collection is on the user submitted
data. Not tracking or providing metadata is cause for questioning the reliability of the data.
5.1 “Sources”
The UDOP system has three “sources” of data that populates the system: data “layers” that are brought into
the Enterprise server, userdigitized entities onscreen (i.e. “headsup digitizing”), and ‘network links’ to data
that are served from other systems. Using network links, the UDOP only stores a small KML file containing the
URL address of the server that is providing the data. The critical difference between these methods is how
data are stored in the UDOP system. Data layers brought into the Enterprise server and onscreen digitization
of the actual data entities, are stored within a kml file on the UDOP, and in the latter only the URL to the data
is stored.
Data layers
These layers can be characterized as “base map” or foundational layers that include infrastructure,
topography, demographics and hydrography. The “core layers” are those that are in place prior to an event
and “event layers” are those that are created post event. . Metadata associates with the “core layers” tends
to more complete and reliable whereas metadata associated with the “event layers” tends to be less
complete and reliable if processes to insure standardization, integrity and completeness aren’t followed in its
collection, compilation and quality assurance. Having a sound organizational structure in place to insure
adherence to the ontological framework and the processes to conform to it is even more critical in emergency
situations.
Data created from “headsup digitizing” is highly dependent on the accuracy of the basemap used for the
digitizing and needs some form of quality control if it is to be a reliable source of information to the UDOP.
5.1.1 Network links
By opening the UDOP platform to outside users, the UDOP hopes to utilize data streams were previously
difficult to tap into. Opening the UDOP to outside users follows a software paradigm generically known as
Web 2.0; one tenet of Web 2.0 principles is that users provide value by contributing to the system. Exploiting
‘usergenerated content’ or ‘crowdsourced’ data has proven very successful for firms, but its use in disaster
situations has raised questions about the accuracy and timeliness of crowdsourced data. The issue of
intentionally bogus data has been a significant criticism to the use of crowdsourced data in disasters.
Addressing this issue has been a major focus of the Ushahidi team (http://ushahidi.com/), and Patrick Meier,
an Ushahidi team member and outspoken proponent of crowdsourcing, has written of the utility and accuracy
32
of crowdsourced data (http://irevolution.wordpress.com/2010/04/16/photosynthtoallsynth/). Another blog
post by Anahi Ayala details how the Chile Ushahidi instance received intentionally misleading information and
how that was discovered (http://crisismapper.wordpress.com/2010/06/28/ushahidichileanexampleof
crowdsourcingverificationofinformation/)
Assessing the accuracy and expiration of usergenerated content has elsewhere been accomplished using two
general approaches. The first uses a Wikipediatype approach in which ‘editors’ are responsible for reviewing
all incoming information. This approach has been adopted for the geospatial world by Open Street Map
(OSM), which uses a wikistyle approach where users can modify any map element in the database. The wiki
tracks all the revisions and an editor can revert to a previous version if an edit is wrong (Answer 1.3 in
http://wiki.openstreetmap.org/wiki/FAQ). In this case, it does not matter if the error is for malicious or
unintentional reasons. By tracking the number of inputs, edits, and revisions, users with a quality record
bubble to the surface. For the UDOP, the question of who should be the editors is a tricky issue, specifically as
it relates to possible military oversight and trust issues from both military and nonmilitary users, with editors
representing heterogeneous user groups.
The second approach would track the reliability of a user through some form of online reputation system,
similar to systems employed by Amazon.com or Ebay.com. In this case the collective users of UDOP would be
responsible for providing feedback on the quality of data a user provides. In this way quality data (and the
submitting user) would be ranked higher than lower quality data (and users). This method relies on a human
evaluation and ranking of the information. It may also be possible to adopt some automated methods for
evaluating data quality. The Ushahidi project has released an alpha version of software called ‘SwiftRiver’
(http://swift.ushahidi.com/) that uses algorithms and statistical verification of crowdsourced data. While
SwiftRiver is focused on text, it may be possible to adapt this type of approach for spatial data.
While either of the above methods could track the reliability of a user and contributed data, the use of
network links creates an additional issue: data continuity. In a network link, the UDOP would simply store the
URL of a data resource that another user was publishing. The UDOP could import that link and display the data
in the network link. However, the UDOP would not store the data in its native form, nor have a mechanism to
control the data that gets displayed, or more importantly, control the update cycle of the data. The fear here
is that a UDOP user would rely on a dataset that could change significantly or be removed with no warning or
recourse. This downside stems for the same factor that provides the benefit of using network links. From the
positive perspective, the military gains access to datasets that it does not have to maintain and because the
network link is a type of web service, the data can update on the backend and reflect that change immediately
without the user having to worry about downloading the latest copy of the data or multiple users having
different copies of the data. This is the doubleedged sword: how does the military open its platform to
outside users and also be able to rely on contributed information it does not control?
6 Process Issues
One of the problems recognized by the team early on was the need for process associates with data input and
access. Read and write permissions need to be set for each user profile. Those profiles reference types of
33
data layers that are accessible or writeable by the users that are included in that profile as well as the
individual data layers themselves. These constraints can all be modeled by the ontology.
Through our interviews of SouthCom users, we identified two main ways the UDOP is used, specifically, as a
geospatial input and viewing tool, and as a tool for generating briefing documents. Recognizing these different
uses has implications for the way user profiles are constructed and how data layers are structured within the
UDOP. The ontology and system architecture components of this report deal directly with these topics,
however, issues associated with the current configuration of the system should be highlighted.
Because the UDOP currently uses the filebased architecture for data storage (as opposed to an entitybased
approach), there is a significant degree of data duplication. In a briefing document, the user may only be
interested in a few entities within several different files. Producing a graphical view of the data means the user
has to duplicate the entities of interest and produce a new kml file to contain them. Besides the extra effort
involved in duplicating existing entities, these ‘oneoff’ kml files begin to accumulate on the system backend
and tend to have a rapid expiration date. The short relevance duration of these duplicated kml files bring the
issue of temporal expiration and data overload to the fore.
Fully implementing the ontology and system architecture changes recommended herein will ameliorate some
of the duplication issues, but it is also important to recommend that files created for the purpose of briefing
documents be stored separately from ‘core’ datasets, and that some notion of the temporal duration or
update frequency of a data entity be recorded when loaded into the system. Recording an expiration date for
a dataset would inform a user that the information may be out of date, and help data administrators
understand when a dataset should be removed from the system.
6.1 Types of data and users
To address these issues the ontology dictated three types of system data: core/event data; user data and
ephemeral data. Processes managing the core/event data would be the strictest requiring administrative
approval and input by a “super user”, which have the highest level of accuracy and management approval;
user data which would have an intermediate level of management and ephemeral data which may have the
lowest level management oversight and would generally be used for briefings and have a short lifespan (figure
17).
6.2 Work flow of input process
If we simplify the user types to include regular users, super users and administrators a workflow for each of
the different data types can be defined. For “core/event data”, only a super user could populate the data base
with required administrative approval (Figure 17a). This could also be the case for “linked data” from external
URLs. For “user data” super users could create layers without administrative approval but with possible
administrative review (17b). For “ephemeral data” an any user could create the data which would be viewed

34
solely by them or another user of their choice (17c). Permanency of the data would be assured by longterm
archival of core/event data (17a), optional archival of user data (17b), and time limited persistence of the
ephemeral data. Both the data types and user roles can be modeled by the ontology.
Figure 17. Workflow for users given data layer types.

35
7 UDOP Architecture
7.1 Architecture
As discussed in Section 2.2 UDOP Overview, the current UDOP software architecture has significant limitations
and cannot support the sophisticated ontologybased data management scheme, or the spatial/temporal
analysis and modeling capabilities we recommend. In order to create the software environment capable of
achieving the UDOP vision of a system “that filters and synthesizes a myriad of spatial/temporal data points
from a wider variety of sources and modalities into a coherent understanding of the user’s area of operation”
and can handle complex spatial analysis, we believe that UDOP needs to evolve to a multitiered service
oriented architecture. This evolution would enable our recommendations and increase the interoperability of
the UDOP to interface with a range of other systems. The recommend architecture is composed of three
layers: the data tier, the web services tier and the client tier (Figure 18). Communication between layers in the
stack is based on open standards and protocols.
The data tier is composed of a spatiallyenabled relational database, specifically the combination of a
PostgreSQL database and the spatial extension PostGIS. This combination offers the most mature open source
object/relational solution available for DBMS and that supports the OGC Simple Features Interface Standard
(SFS), the industry standard for representing spatial data types. The GiST indices within PostGIS provide for
highperformance spatial indexing and have been tested for performance on large geospatial data sets.
PostGIS is also built with the GEOS (Geographic Engine – Open Source) library which provides the full suite of
spatial predicate functions and spatial operators found in SFS. The end result of this combination of
technologies is an enterpriselevel spatial database capable of supporting large numbers of simultaneous
users, transactional edits, and conducting standard vector spatial operations in the database using SQL
commands.
The web service tier is based on a series of OGC Web Services that support the range of spatial data formats.
The goal of the web services tier is to act as an intermediary between client applications that want access to
the data and the data itself. Supporting the range of OGC Web Services (web mapping service, web feature
service, web feature servicetransactional, web coverage service, and web processing service) is all about
interoperability and providing access to the greatest range of client applications possible. The recent
announcement by ESRI that it will openly publish its heretofore proprietary REST interface means the web
services tier could also directly support ESRI applications.
In the current UDOP, when a user requests a file it is downloaded in its entirety from the server and rendered
on the client side. This can result in significant lag time on the network and can require the rendering of a
large amount of vector objects, occasionally overloading the Google Earth plugin. Using a web service, the
client application would make a structured request to UDOP for a specific configuration of view extent and
data layers. The web service tier would interpret that request, make the corresponding SQL call to the PostGIS
database, and return the data in the format requested by the client. The range of formats includes map tiles,
raster values, or actual vector features; the range of outputs is extensible, meaning new output schema can be
written in as needed. It is also important to note that KML is also an accepted OGC standard, and while it is
typically used at the client tier, it is possible to setup web services that render data stored in a PostGIS
36
database into KML. Therefore, these changes do not mean that the Google Earth plugin component of the
UDOP has to change. To the contrary, performance would like increase as the rendering component is off
loaded from the UDOP client.
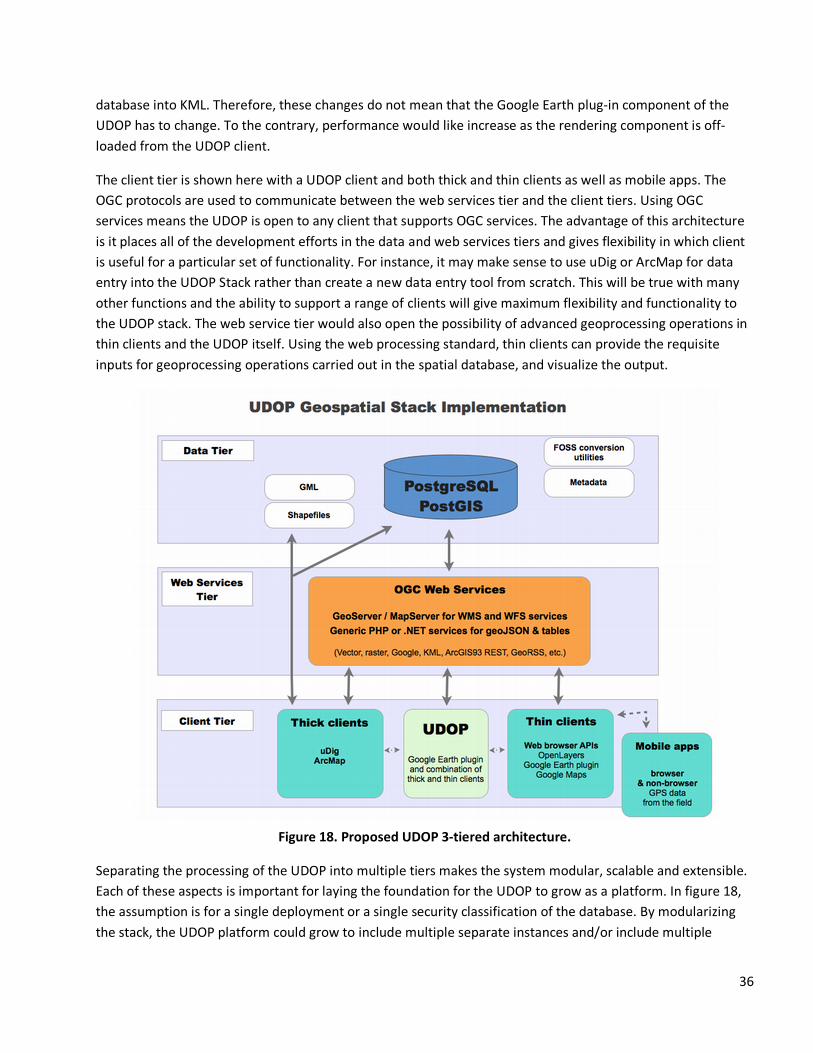
The client tier is shown here with a UDOP client and both thick and thin clients as well as mobile apps. The
OGC protocols are used to communicate between the web services tier and the client tiers. Using OGC
services means the UDOP is open to any client that supports OGC services. The advantage of this architecture
is it places all of the development efforts in the data and web services tiers and gives flexibility in which client
is useful for a particular set of functionality. For instance, it may make sense to use uDig or ArcMap for data
entry into the UDOP Stack rather than create a new data entry tool from scratch. This will be true with many
other functions and the ability to support a range of clients will give maximum flexibility and functionality to
the UDOP stack. The web service tier would also open the possibility of advanced geoprocessing operations in
thin clients and the UDOP itself. Using the web processing standard, thin clients can provide the requisite
inputs for geoprocessing operations carried out in the spatial database, and visualize the output.
Figure 18. Proposed UDOP 3tiered architecture.
Separating the processing of the UDOP into multiple tiers makes the system modular, scalable and extensible.
Each of these aspects is important for laying the foundation for the UDOP to grow as a platform. In figure 18,
the assumption is for a single deployment or a single security classification of the database. By modularizing
the stack, the UDOP platform could grow to include multiple separate instances and/or include multiple
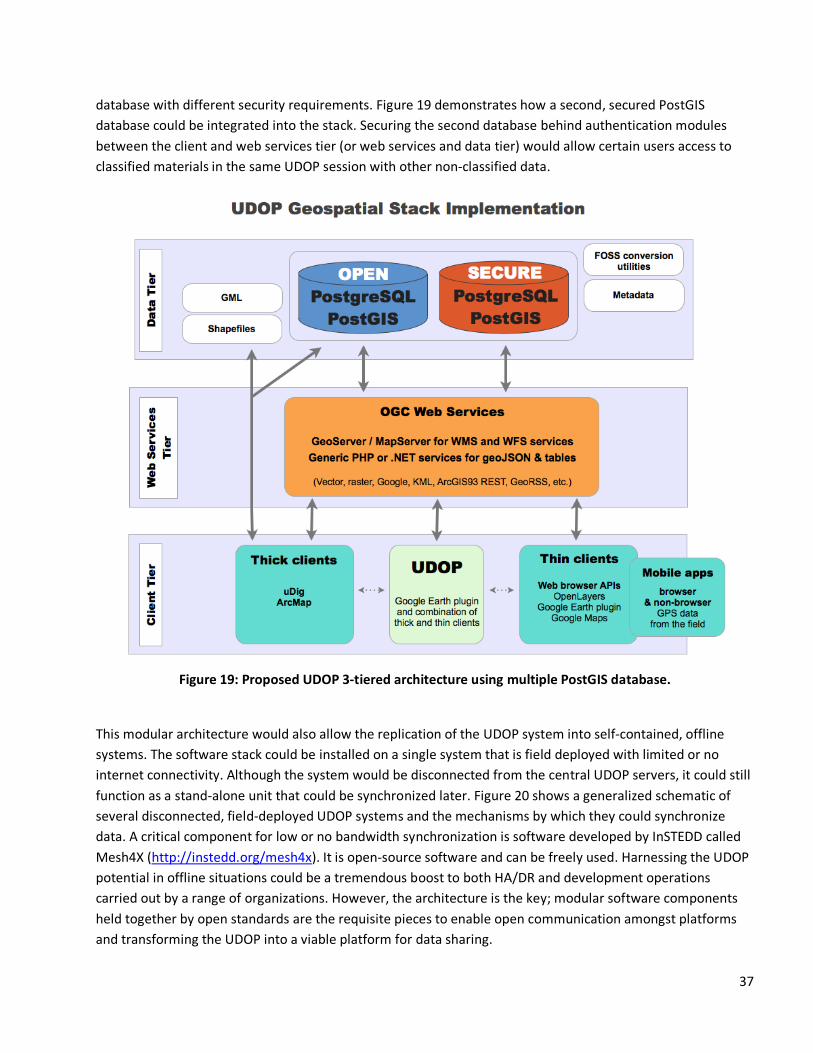
37
database with different security requirements. Figure 19 demonstrates how a second, secured PostGIS
database could be integrated into the stack. Securing the second database behind authentication modules
between the client and web services tier (or web services and data tier) would allow certain users access to
classified materials in the same UDOP session with other nonclassified data.
Figure 19: Proposed UDOP 3tiered architecture using multiple PostGIS database.
This modular architecture would also allow the replication of the UDOP system into selfcontained, offline
systems. The software stack could be installed on a single system that is field deployed with limited or no
internet connectivity. Although the system would be disconnected from the central UDOP servers, it could still
function as a standalone unit that could be synchronized later. Figure 20 shows a generalized schematic of
several disconnected, fielddeployed UDOP systems and the mechanisms by which they could synchronize
data. A critical component for low or no bandwidth synchronization is software developed by InSTEDD called
Mesh4X (http://instedd.org/mesh4x). It is opensource software and can be freely used. Harnessing the UDOP
potential in offline situations could be a tremendous boost to both HA/DR and development operations
carried out by a range of organizations. However, the architecture is the key; modular software components
held together by open standards are the requisite pieces to enable open communication amongst platforms
and transforming the UDOP into a viable platform for data sharing.
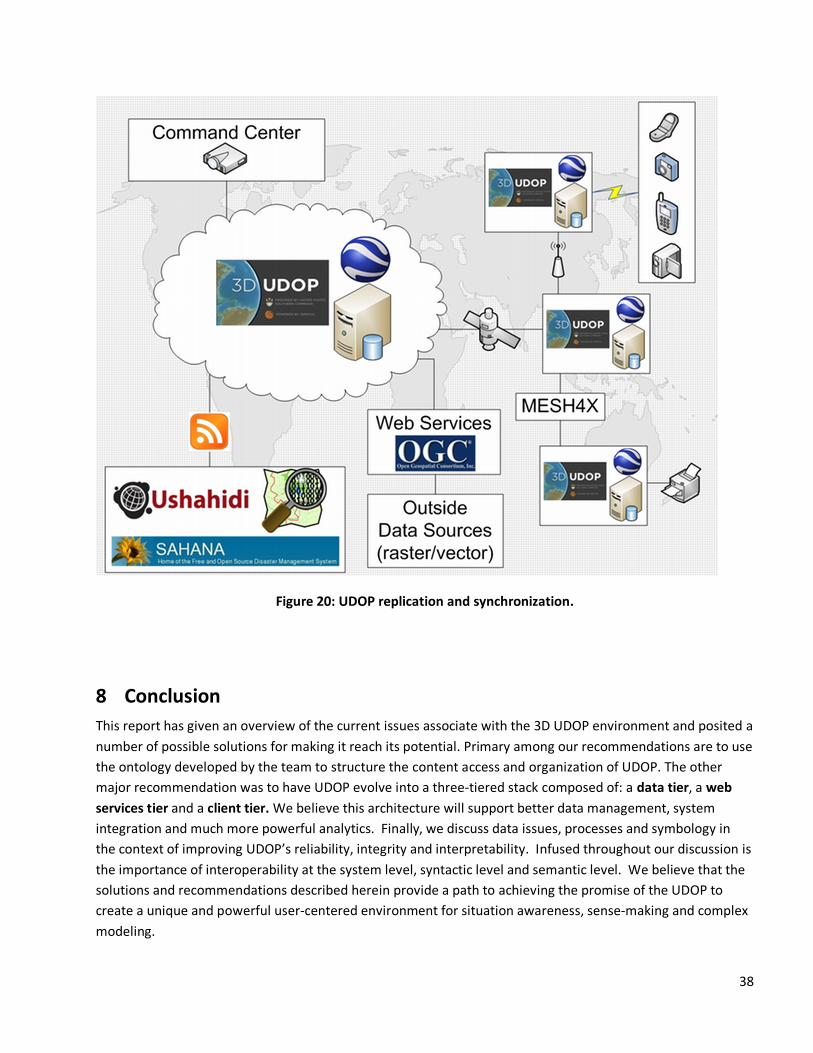
38
Figure 20: UDOP replication and synchronization.
8 Conclusion
This report has given an overview of the current issues associate with the 3D UDOP environment and posited a
number of possible solutions for making it reach its potential. Primary among our recommendations are to use
the ontology developed by the team to structure the content access and organization of UDOP. The other
major recommendation was to have UDOP evolve into a threetiered stack composed of: a data tier, a web
services tier and a client tier. We believe this architecture will support better data management, system
integration and much more powerful analytics. Finally, we discuss data issues, processes and symbology in
the context of improving UDOP’s reliability, integrity and interpretability. Infused throughout our discussion is
the importance of interoperability at the system level, syntactic level and semantic level. We believe that the
solutions and recommendations described herein provide a path to achieving the promise of the UDOP to
create a unique and powerful usercentered environment for situation awareness, sensemaking and complex
modeling.
39
9 References
PIROLLI, P., AND CARD, S. Sensemaking Processes of Intelligence Analysts and Possible Leverage Points as
Identified Through Cognitive Task Analysis. In Proceedings of 1st International Conference on Intelligence
Analysis (2005).
Hossein Mohammadi, Abbas Rajabifard* and Ian P. Williamson, Development of an interoperable tool to
facilitate spatial data integration in the context of SDI2010 International Journal of Geographical Information
Science Vol. 24, No. 4, April 2010, 487–505
Sen, S., 2005. Semantic interoperability of geographic information. GIS Development, 9, 18–21.Sheth, 1999;
Xu, W and Sisi Zlatanova, Modeling emergency response processes: Carative study on OWL and UML,
Proceedings of the joint ISCRAMCHINA and GI$DM Conference Harbin, China, 2008
Yang C. , Robert Raskin, Michael Goodchild, and Mark Gahegan. 2010. “Geospatial Cyberinfrastructure: Past,
present and future”, Computers, Environment and Urban Systems 34 (2010) 264–277
10 Appendix A: Ontology Tutorial (attached)
11 Appendix B: Key data sets for military and HA/DR applications
The increasing value of geospatial data in HA/DR events has been demonstrated repeatedly throughout the
last ten years (9/11, Katrina, Indian Ocean Tsunami, Haiti, etc...). As identified in the literature, and built into
our ontology, critical datasets are divided into several categories. While conceptually similar, the various
classification schemes contain slightly different ways of parsing the HA/DR knowledge domain into groups. In
this section, we will review specific datasets that apply to HA/DR events, discuss the relative importance of
each given the changing disaster cycle, and list where to acquire them.
The disaster cycle is a conceptual model for describing the phases of response after a disaster occurs (Figure
7). The cycle analogy provides a mechanism for linking together disaster response with the longerterm
activities of development. Each of the phases of the cycle (Response, Recovery, Mitigation/Prevention, and
Preparedness) can overlap in time and space, and often have different data needs. The role of individual
datasets, and their value, is often dependent upon the current phase of the disaster cycle .
In the initial response phase, understanding the situation and quickly accessing baseline information is critical.
Information needs in this phase are based on speed and temporal currency; situations change quickly, so a
rapid update cycle is needed. In the transition to the recovery phase the focus changes to logistics and
managing the situation. Temporal frequency of updates begins to slow, but is still a priority. The mitigation
phase is the beginning of a systemic shift to deeper processes, those associated with spatial modeling and

40
infrastructure projects. Finally, the preparedness phase is more closely associated with development goals,
the temporal frequency of updates slows and the focus is on longerterm projects. Preparedness also involves
an earlywarning and detection component, meaning that observation systems can be deployed to give a
greater lead to time for future disasters. The variation in these phases means the importance of a dataset may
fluctuate throughout the cycle or could be high throughout.
Figure 14: The Disaster Cycle
The Haiti Earthquake disaster demonstrated the growing power of imagery and a new mechanism for
acquiring data. ‘Crowdsourcing’ of data came of age in the Haiti Earthquake, as evidenced by the development
of the Open Street Map (OSM) database and the use of the Ushahidi platform for aggregating SMS / text
messages on a map display. Ushahidi is credited with saving many lives and provided the type of high
frequency update information needed in the response phase. The success of the OSM database is just as
significant, and by most accounts, is the de facto basemap for the country. Volunteers from throughout the
world worked to build the Haiti OSM basemap from nearly nothing before the earthquake to a highquality,
incredibly detailed basemap that will likely become the operational basis for the next Haitian government.
OSM is more than a road map, almost any entity can be mapped in the database, so it also contains structures,
IDP camps, facilities, and walking trails to name a few. While the volunteer efforts of both these projects
should be applauded, what often gets left out of the story is the largescale infrastructure required to make
them happen. In the case of Ushahidi it is the cellular network and for OSM it was the release of publicly
available high spatial resolution satellite imagery.
The value of imagery in disasters has grown alongside other geospatial data, and is perhaps more important
because it can be used to generate many derivative data products. With the Haiti example, it is clear that the
release of imagery can mobilize a global volunteer force capable of producing highquality geospatial datasets.
The question for the 3D UDOP (in Haiti and going forward) is what imagery to use, how to handle the
collection and dissemination of imagery, and how to participate in the communities using imagery to produce
41
derivative products. Answering these questions requires a bit of background on the nature of remotely sensed
image data and a review of some lessons learned from previous disasters.
Remotelysensed imagery is collected by a range of different sensors that each have a unique set of
capabilities. Potential variations include whether it is an ‘active’ or ‘passive’ sensor, meaning does it measure
reflected sunlight (most sensors) or provide its own energy source (radar or microwave), is it airborne or
satellite, and the various resolutions intrinsic to the senor. These resolutions are critical to determining the
utility of a given sensor and are described in four ways:
Spatial: what is the pixel size
Spectral: what wavelengths are being collected
Temporal: how often does the sensor pass overhead
Radiometric: how finely does it measure the intensity of the incoming signal
There are often tradeoffs inherent to these various resolutions, meaning if you want a sensor with a high
spatial resolution, it likely has a lower temporal resolution (or takes more time to pass overhead again).
Determining the appropriate mix of capabilities is dependent upon the needs of the user, which is dictated by
the disaster cycle. The immediate needs of the response and recovery phases are best met with high spatial
resolution (0.5 meter) color imagery. Contrast this with the developmenttype needs of the preparedness
phase; for example, if a given crisis is caused by a drought or deforestation, then you need a significantly
different sensor to monitor these situations. Often this sensor would have a higher temporal frequency (daily
or with weekly composites), a lower spatial resolution (2501,000 meters), and record spectral wavelengths
outside the visible spectrum (near and middle infrared). The mitigation phase could fall somewhere in
between the two and require some high resolution imagery as well as some with a moderate spatial resolution
(30 meters) with a two week temporal frequency and infrared spectrum.
This variation in needs and capabilities means that the ‘best’ imagery is depends on the situation. However, it
is clear that many different types of imagery are valuable and need to be available throughout the disaster
cycle. Much of the coarse spatial resolution imagery if freely available from NASA and other space agencies,
however, the value of that data is the analytical products derived from it. This requires professional expertise
typically found in universities with established research agendas in specific topics (agricultural modeling,
drought modeling, deforestation, ...). Encouraging and/or financing academic research groups would be the
best mechanism for producing the types of imageryderived analytical products that would either function in
the early warning and detection phase of a disaster
If the 3D UDOP is to be adopted as a standard for NGOs, then there needs to be an explicit benefit to using it
over comparable opensource projects. This benefit comes from information sharing. The military benefit will
be increased access to NGO data, but the military must give something back. The most valuable thing would
be imagery, and high spatial resolution imagery at that. By working with NGA and DoS, the 3D UDOP could be
the delivery platform for the most valuable (most expensive) datasets, and empower the volunteer movement
to generate much needed derivative products (i.e., OSM) from that imagery.
42
One lesson learned from the use of geospatial data in disaster response is the need to preposition data
assets. Meaning that data needs to be collected, processed and packaged prior to the disaster. In this way
when a disaster strikes the response community can focus efforts on responding, rather than compiling data.
This has implications for several other types of spatial data, besides imagery
Assessing the damage caused by a disaster requires imagery collected before the event, therefore it is
important to have a standing body of high resolution imagery available. In areas where understanding
structural damage is critical, LiDAR (Light Detection and Ranging) data is a key dataset. Modeling landslide risk
from a hurricane requires digital elevation models, soils and geological data. Knowing how many supplies to
ship to a given location requires a population dataset combined with a damage assessment, and then
intersected against a transportation dataset
The prepackaging of data is an activity that requires a fair amount of expertise. It’s utility would be quickly
recognized in both the response phase when time is critical, and in the subsequent phases when having data
for geographic modeling becomes more important. With the idea of adding in more data to the 3D UDOP, the
list below contains links to several different types of data resources.
Data Catalogs:
� GeoCommons Finder! (http://finder.geocommons.com/)
� GeoNetwork metadata catalogs (many different URLs, used by most UN agencies)
� World Bank (http://data.worldbank.org/)
Imagery:
� Commercial Sources (Digital Globe, GeoEye, RapidEye)
� International Charter Space and Major Disasters
� National GeospatialIntelligence Agency
Population:
� LandScan 30 arc second resolution (http://www.ornl.gov/sci/landscan/index.html)
� Populations at Risk, Demobase, US Census, 100 meter resolution (https://www.geoint
online.net/community/haitiearthquake/default.aspx)
Transportation:
� Open Street Map (OSM) (http://www.openstreetmap.org/)
� UN Spatial Data Infrastructure for Transportation (UNSDIT)
o (http://www.logcluster.org/tools/mapcentre/unsdi/unsditv2.0)
� Commercial Providers (NavTeq and TeleAtlas)
Infrastructure:
� Open Street Map (OSM) (http://www.openstreetmap.org/)
43
Human Health:
� Sahana missing people registry and medical facilities (http://haiti.sahanafoundation.org/prod/)
� Ushahidi sms based reporting of events (http://haiti.ushahidi.com/)
Physical Environment
� Geology: OneGeology (http://www.onegeology.org/)
� Soils: Global Soils Map (http://www.globalsoilmap.net/)
Elevation
� SRTM 90 meter global (http://srtm.csi.cgiar.org/)
� ASTER GDEM 30 meter global (http://www.gdem.aster.ersdac.or.jp/)
Hydrology
� Atlas of the Biosphere, Univ. of Wisconsin (http://www.sage.wisc.edu/atlas/maps.php)
Land Cover
� USGS Landcover Institute: Landcover data page (http://landcover.usgs.gov/landcoverdata.php)
� 2004/2005 Global Land Cover data from European Space Agency (http://ionia1.esrin.esa.int/)
Geographic Names:
� GeoNames (http://www.geonames.org/)
National Boundaries:
� U.S.sanctioned world boundaries maintained by the Office of the Geographer and Global Issues, US
Department of State (highresolution boundaries)
� ESRI boundary data (~1:2,000,000)
Cadastre: locally derived
Weather: Radar, Satellite, Forecasts
Economic Development
� World Bank (http://data.worldbank.org/)
Map Resources:
• Joint Operations Graphic topographic maps (1:250k)
� Defense Mapping Agency topographic maps
� PerryCastenada Map Library, University of Texas (http://www.lib.utexas.edu/maps/)
� ReliefWeb (http://www.reliefweb.int)
Table 3: List of Data Sources and Links