Embed Size (px)
Citation preview
THE REPUBLIC OF UGANDA
Strengthening Statistics for Development Planning
UGANDA POLICE FORCE SECTOR STRATEGIC PLAN FOR STATISTICS
(2006/07 - 2010/11)
i
UGANDA POLICE FORCE Sector Strategic Plan for Statistics 2006/07-2010/11
Uganda Police Force
P.O. Box 6329
Kampala
Email: [email protected]
Website: http://www.upf.go.ug
October 2007
Copyright © 2007 Uganda Police Force The material in this document may be freely reproduced provided due acknowledgement is made to the publisher and source.
ii
Table of Contents
Acronyms ......................................................................................................................................... iv
Foreword ........................................................................................................................................... v
Executive Summary .......................................................................................................................... 1
1 BACKGROUND .................................................................................................................. 1
1.1 Mandate Analysis ........................................................................................................... 1
1.2 Process of Developing the Plan ..................................................................................... 2
1.3 Structure of the Plan ...................................................................................................... 2
2 SITUATIONAL ANALYSIS .................................................................................................. 3
2.1 Stakeholder Analysis ...................................................................................................... 3
2.2 Status of data production and use ................................................................................. 4
2.3 Quality of data produced ................................................................................................ 5
2.4 Challenges in Police Statistics Production ..................................................................... 8
2.5 SWOT Analysis .............................................................................................................. 8
3. STRATEGIC FRAMEWORK FOR THE SSPS .................................................................. 11
3.1 Vision ........................................................................................................................... 11
3.2 Mission ......................................................................................................................... 11
3.3 Strategic Objectives ..................................................................................................... 11
3.4 Values and Principles ................................................................................................... 11
4 STRATEGY FOR IMPROVING STATISTICS PRODUCTION ............................................... 12
4.1 SO1: Coordination and Management .......................................................................... 12
4.2 SO2: Human Resource Development and Management ............................................ 13
4.3 SO3: Statistical Development Programmes ................................................................. 14
5 IMPLEMENTATION PLAN ................................................................................................ 15
5.1 Mechanisms ................................................................................................................. 15
5.2 Monitoring and Evaluation ............................................................................................ 15
5.3 Risk Analysis ................................................................................................................ 16
ANNEX A: STATISTICS PRODUCTION SCHEDULE ............................................................... 17
ANNEX B: LOGICAL FRAMEWORK ......................................................................................... 21
ANNEX C: ACTIVITY SCHEDULE (2006/07-2010/11) .............................................................. 26
ANNEX D: BUDGET ESTIMATES (2006/07- 2010/11) (Uganda Shillings “000”) ..................... 28
ANNEX E: CHALLENGES, STRATEGIES AND PRIORITY ACTIVITIES (2007) ...................... 30
ANNEX F: POLICE INFORMATION SYSTEM (POLIS) ............................................................. 31
iii
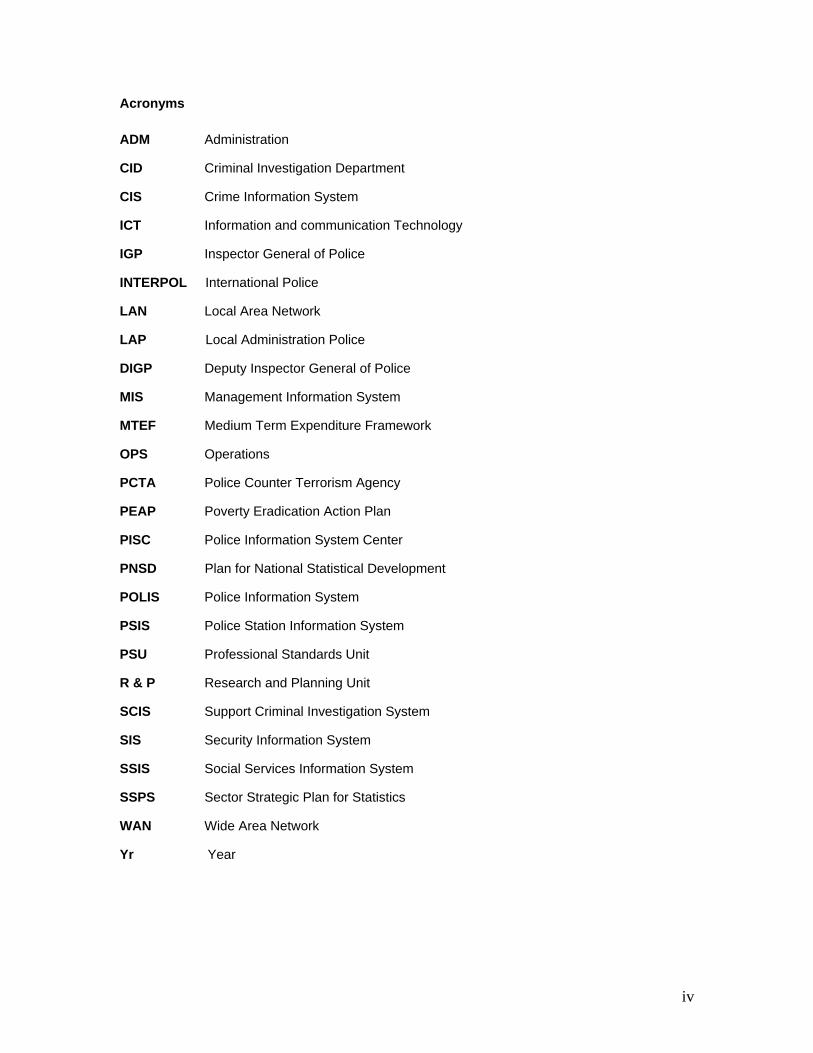
Acronyms
ADM Administration
CID Criminal Investigation Department
CIS Crime Information System
ICT Information and communication Technology
IGP Inspector General of Police
INTERPOL International Police
LAN Local Area Network
LAP Local Administration Police
DIGP Deputy Inspector General of Police
MIS Management Information System
MTEF Medium Term Expenditure Framework
OPS Operations
PCTA Police Counter Terrorism Agency
PEAP Poverty Eradication Action Plan
PISC Police Information System Center
PNSD Plan for National Statistical Development
POLIS Police Information System
PSIS Police Station Information System
PSU Professional Standards Unit
R & P Research and Planning Unit
SCIS Support Criminal Investigation System
SIS Security Information System
SSIS Social Services Information System
SSPS Sector Strategic Plan for Statistics
WAN Wide Area Network
Yr Year
iv
Foreword
The fragile status of Police statistical capacity has been discussed at numerous management
fora. Most discussions have zeroed on the weaknesses in statistical development particularly the
collection, analysis and dissemination of statistics. Currently, the statistical process in the
Uganda Police is poor, inaccurate, uncoordinated and not time sensitive.
This strategic plan is an outcome of the statistical committee of the Uganda Police Force
Research and Planning Department, in consultation with all police departments and the technical
support of consultants hired by UBOS. I am grateful for all the support UBOS has provided
during the development of this strategic plan. The plan will help put up a computerized and
integrated information system that will contribute to proper planning, formulation of policies,
monitoring and evaluation of projects and programmes.
I call upon all police personnel at all levels to support this plan to enable generation, analysis,
storage and dissemination of quality statistical information and embrace statistics as an
indispensable tool for day to day decision making, operational and administrative work.
Finally, the plan provides a framework for generating reliable information which is critical in policy
formulation, planning, programming, monitoring and evaluation.
Without doubt, this is a step forward towards realizing the vision of producing an enlightened and
motivated police that is efficient and accountable to the people.
For God and my Country
v
Executive Summary
The Mandate of the Uganda Police Force (UPF) is derived from the 1995 Constitution of the
Republic of Uganda under article 212. It is charged with advancement and enhancement of
peace and stability, order and adherence to the rule of law and good governance to ensure
internal co-existence with the public. The Police therefore, contribute directly to the realization of
the strategic objectives under pillars 3 and 4 of the Poverty Eradication Action Plan (PEAP)
through securing life and property, managing disasters and contributing to good governance and
democratization.
The Police SSPS covers 5 years (2006/7 – 2010/11) and provides a framework and mechanisms
for further reform and acceleration of statistical development in the Police statistical system. This
plan is intended to develop an integrated, harmonised, coordinated and coherent Statistical
System which ensures harmonised data production processes in the at all levels of
administration.
One important step in the SSPS process was the comprehensive assessment of the current
status of the statistical status including its challenges. The challenges identified related to:
• limited co-ordination arrangements within and among producers and users of statistics at
all levels of administration;
• user capacity and demand
• existing capacity (institutional, infrastructural, technical and resources) to meet these
needs and fill existing capacity gaps;
• how statistics are collected, processed, and analysed; and
• how statistical data are disseminated and stored (IT policies, standards and databases).
In order to successfully implement this statistical plan, setting up mechanisms for coordination
and data production and management is important. Such a system will guarantee the production
of accurate and reliable statistics at all levels. It is also fundamental to motivate and build
capacity for existing human resource engaged in data compilation, processing and analysis as
well as secure and deploy supportive financial resources to boost the planned activities.
1
2
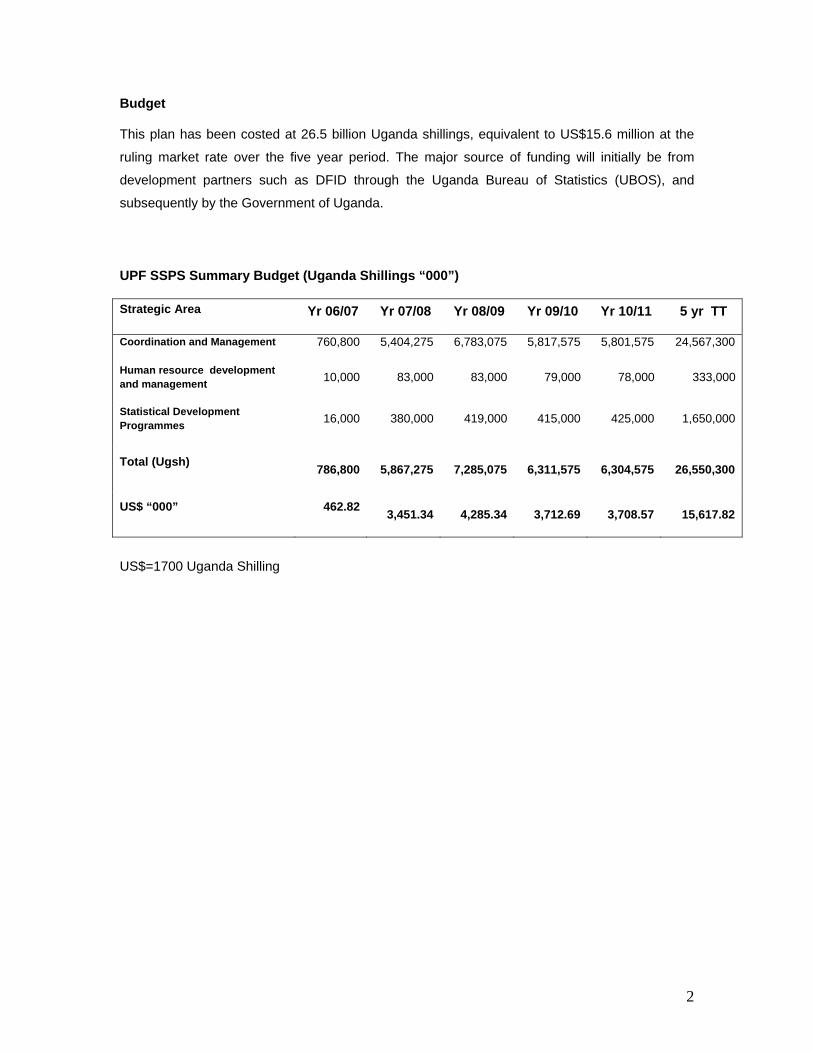
Budget
This plan has been costed at 26.5 billion Uganda shillings, equivalent to US$15.6 million at the
ruling market rate over the five year period. The major source of funding will initially be from
development partners such as DFID through the Uganda Bureau of Statistics (UBOS), and
subsequently by the Government of Uganda.
UPF SSPS Summary Budget (Uganda Shillings “000”)
Strategic Area Yr 06/07 Yr 07/08 Yr 08/09 Yr 09/10 Yr 10/11 5 yr TT
Coordination and Management 760,800 5,404,275 6,783,075 5,817,575 5,801,575 24,567,300
Human resource development and management 10,000 83,000 83,000 79,000 78,000 333,000
Statistical Development Programmes 16,000 380,000 419,000 415,000 425,000 1,650,000
Total (Ugsh) 786,800
5,867,275
7,285,075
6,311,575
6,304,575
26,550,300
US$ “000” 462.82 3,451.34
4,285.34
3,712.69
3,708.57
15,617.82
US$=1700 Uganda Shilling
1 BACKGROUND
1.1 Mandate Analysis
Uganda Police Force became a fully fledged institution on 25th May 1906. Before that it was a
Para-military force called The Uganda Armed Constabulary whose main function was to quell
riots and unrest in the different parts of the then British Protectorate. Since then it has undergone
institutional metamorphosis which culminated into the current Uganda Police Force which was
established under Article 212 of the 1995 Constitution of the Republic of Uganda. It is charged
with advancement and enhancement of peace and stability, order and adherence to the rule of
law and good governance to ensure internal co-existence of the public.
Police Force under article 212 of the Constitution of the Republic of Uganda is mandated to:
(i) Protect life and property
(ii) Preserve law and order
(iii) Prevent and detect crime
(iv) Cooperate with civilian authority and other security organs established under the
Constitution and the population generally.
The police force is further mandated under Section 4 of the Police Act CAP 303 to:
(i) Protect other rights of the individual
(ii) Maintain security within Uganda.
(iii) Ensure public safety.
(iv) Perform the functions of a military force.
Police therefore, contributes directly to the realization of the strategic objectives under pillars 3
and 4 of the Poverty Eradication Action Plan (PEAP) through securing life and property,
managing disasters and contributing to good governance and democratization. It contributes
indirectly to PEAP pillars 1, 2 and 5 by:
Providing a secure environment within which individuals/households can work towards
improving their incomes and livelihoods
Providing an environment conducive to investment.
Enforcing individuals’ rights, including the right to property.
Taking services nearer to the people, especially the marginalized and the poor.
Providing emergency rescue services for any form of distress.
1
1.2 Process of Developing the Plan
The Uganda Bureau of Statistics identified a contact person in the Uganda Police Force to
coordinate the process. Strategically, the person was drawn from the research and planning
department since it technically coordinates all the departments in police as far as information
management is concerned. The contact person in consultation with the immediate supervisors
constituted a strategic working committee. Top management was further sensitized to support
the process.
The committee comprised of representatives from each of the departments in the Police force. It
was given specific terms of reference under which to operate. Each of the committee members
was requested to identify their data needs after consultations with their respective departments.
Supported by a strategic management consultant hired by UBOS, findings from the internal
consultative meetings were shared with other sectors in the first phase in a number of Inter-
Agency Committee meetings. These findings were an input into the Police strategic plan for
Statistics
1.3 Structure of the Plan
The plan is divided into six sections with the first section giving the background information, the
second providing a situational analysis of the sector, the third and the fourth sections addressing
strategic issues for statistics including the vision, mission and the strategy for improving statistical
production. Section five presents the implementation plan while the last section presents
appendices.
2
2 SITUATIONAL ANALYSIS
2.1 Stakeholder Analysis
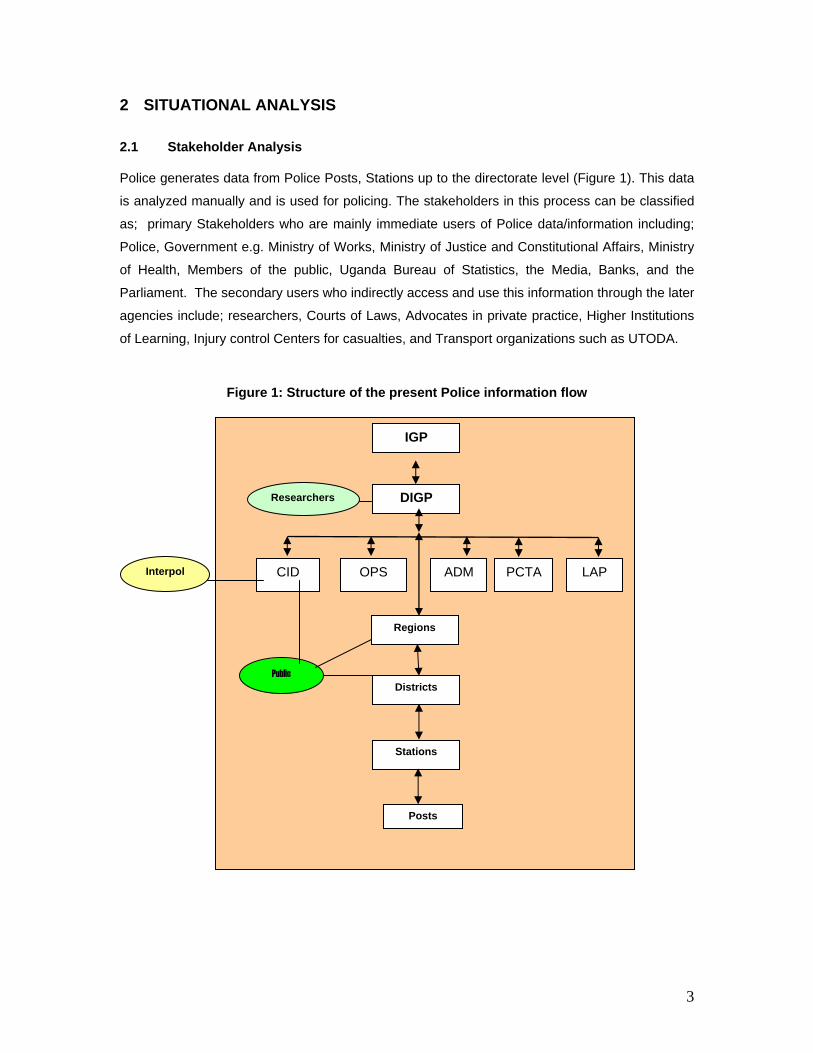
Police generates data from Police Posts, Stations up to the directorate level (Figure 1). This data
is analyzed manually and is used for policing. The stakeholders in this process can be classified
as; primary Stakeholders who are mainly immediate users of Police data/information including;
Police, Government e.g. Ministry of Works, Ministry of Justice and Constitutional Affairs, Ministry
of Health, Members of the public, Uganda Bureau of Statistics, the Media, Banks, and the
Parliament. The secondary users who indirectly access and use this information through the later
agencies include; researchers, Courts of Laws, Advocates in private practice, Higher Institutions
of Learning, Injury control Centers for casualties, and Transport organizations such as UTODA.
Figure 1: Structure of the present Police information flow
IGP
PCTA
Researchers
OPS ADM CID
Districts
Regions
Public
Interpol
DIGP
LAP
Stations
Posts
3
2.2 Status of data production and use
Police Information flow is still through the old vertical procedure of operations. The information
flows through the channels of command, even if it is classified as distributable. For instance, a
researcher in need of crime statistics from CID must get a written permission from the department
of research and planning under DIGP prior to requesting the AIGP - CID and finally to the Crime
intelligence Section. Likewise an officer from Police Counter Terrorism Agency (PCTA) in need of
traffic information must access it through Central Police/Traffic instead of obtaining it directly from
the traffic records office. The process is time consuming and calls for a more efficient horizontal
procedure of information flow.
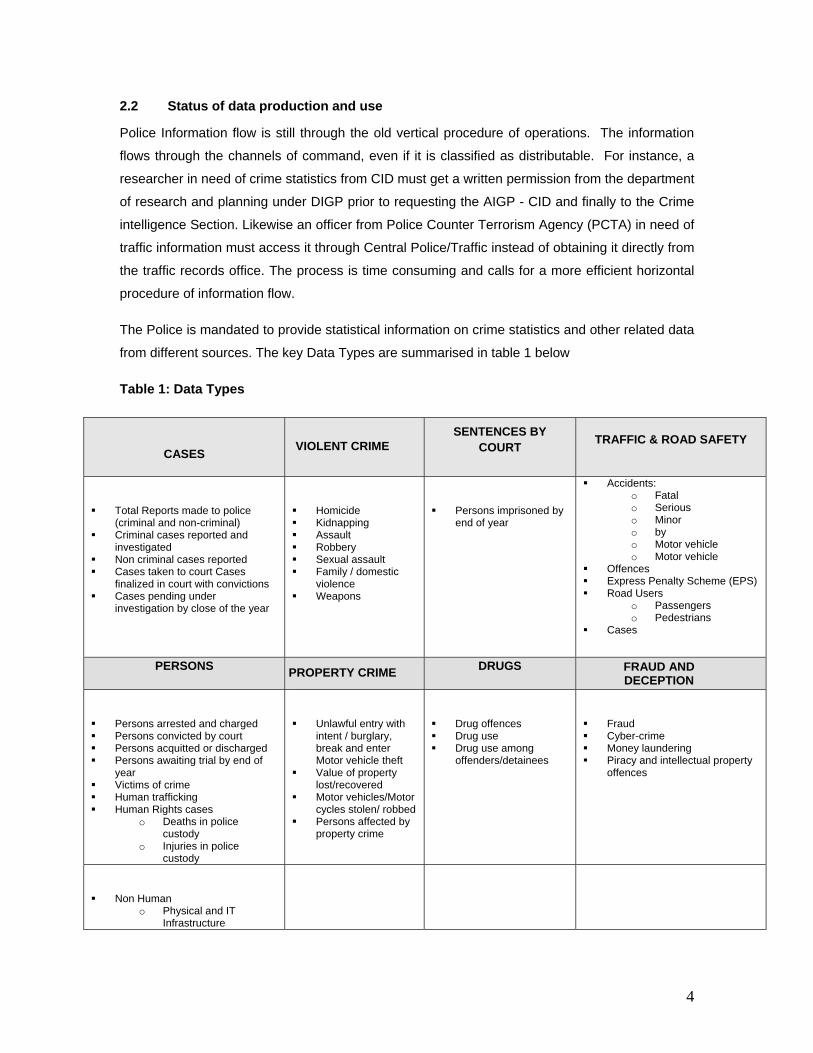
The Police is mandated to provide statistical information on crime statistics and other related data
from different sources. The key Data Types are summarised in table 1 below
Table 1: Data Types
CASES VIOLENT CRIME
SENTENCES BY COURT TRAFFIC & ROAD SAFETY
Total Reports made to police (criminal and non-criminal)
Criminal cases reported and investigated
Non criminal cases reported Cases taken to court Cases
finalized in court with convictions Cases pending under
investigation by close of the year
Homicide Kidnapping Assault Robbery Sexual assault Family / domestic
violence Weapons
Persons imprisoned by end of year
Accidents: o Fatal o Serious o Minor o by o Motor vehicle o Motor vehicle
Offences Express Penalty Scheme (EPS) Road Users
o Passengers o Pedestrians
Cases
PERSONS PROPERTY CRIME
DRUGS FRAUD AND DECEPTION
Persons arrested and charged Persons convicted by court Persons acquitted or discharged Persons awaiting trial by end of
year Victims of crime Human trafficking Human Rights cases
o Deaths in police custody
o Injuries in police custody
Unlawful entry with intent / burglary, break and enter Motor vehicle theft
Value of property lost/recovered
Motor vehicles/Motor cycles stolen/ robbed
Persons affected by property crime
Drug offences Drug use Drug use among
offenders/detainees
Fraud Cyber-crime Money laundering Piracy and intellectual property
offences
Non Human o Physical and IT
Infrastructure
4
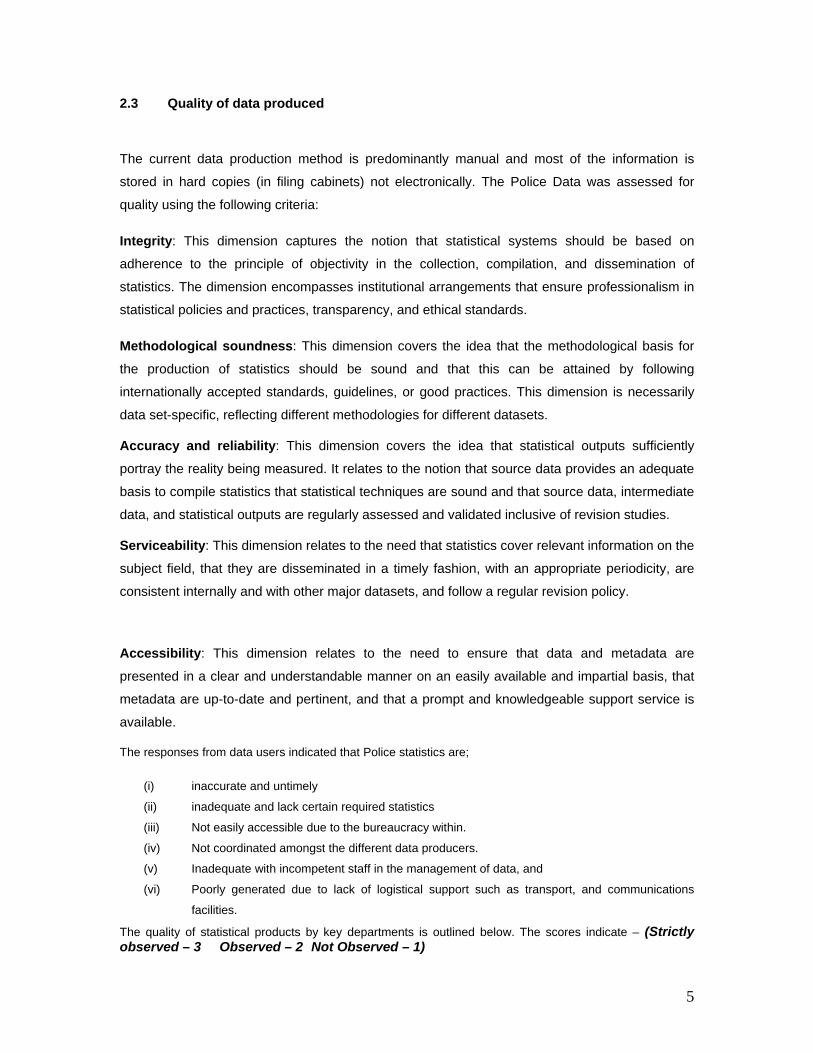
2.3 Quality of data produced
The current data production method is predominantly manual and most of the information is
stored in hard copies (in filing cabinets) not electronically. The Police Data was assessed for
quality using the following criteria:
Integrity: This dimension captures the notion that statistical systems should be based on
adherence to the principle of objectivity in the collection, compilation, and dissemination of
statistics. The dimension encompasses institutional arrangements that ensure professionalism in
statistical policies and practices, transparency, and ethical standards.
Methodological soundness: This dimension covers the idea that the methodological basis for
the production of statistics should be sound and that this can be attained by following
internationally accepted standards, guidelines, or good practices. This dimension is necessarily
data set-specific, reflecting different methodologies for different datasets.
Accuracy and reliability: This dimension covers the idea that statistical outputs sufficiently
portray the reality being measured. It relates to the notion that source data provides an adequate
basis to compile statistics that statistical techniques are sound and that source data, intermediate
data, and statistical outputs are regularly assessed and validated inclusive of revision studies.
Serviceability: This dimension relates to the need that statistics cover relevant information on the
subject field, that they are disseminated in a timely fashion, with an appropriate periodicity, are
consistent internally and with other major datasets, and follow a regular revision policy.
Accessibility: This dimension relates to the need to ensure that data and metadata are
presented in a clear and understandable manner on an easily available and impartial basis, that
metadata are up-to-date and pertinent, and that a prompt and knowledgeable support service is
available.
The responses from data users indicated that Police statistics are;
(i) inaccurate and untimely
(ii) inadequate and lack certain required statistics
(iii) Not easily accessible due to the bureaucracy within.
(iv) Not coordinated amongst the different data producers.
(v) Inadequate with incompetent staff in the management of data, and
(vi) Poorly generated due to lack of logistical support such as transport, and communications
facilities.
The quality of statistical products by key departments is outlined below. The scores indicate – (Strictly observed – 3 Observed – 2 Not Observed – 1)
5
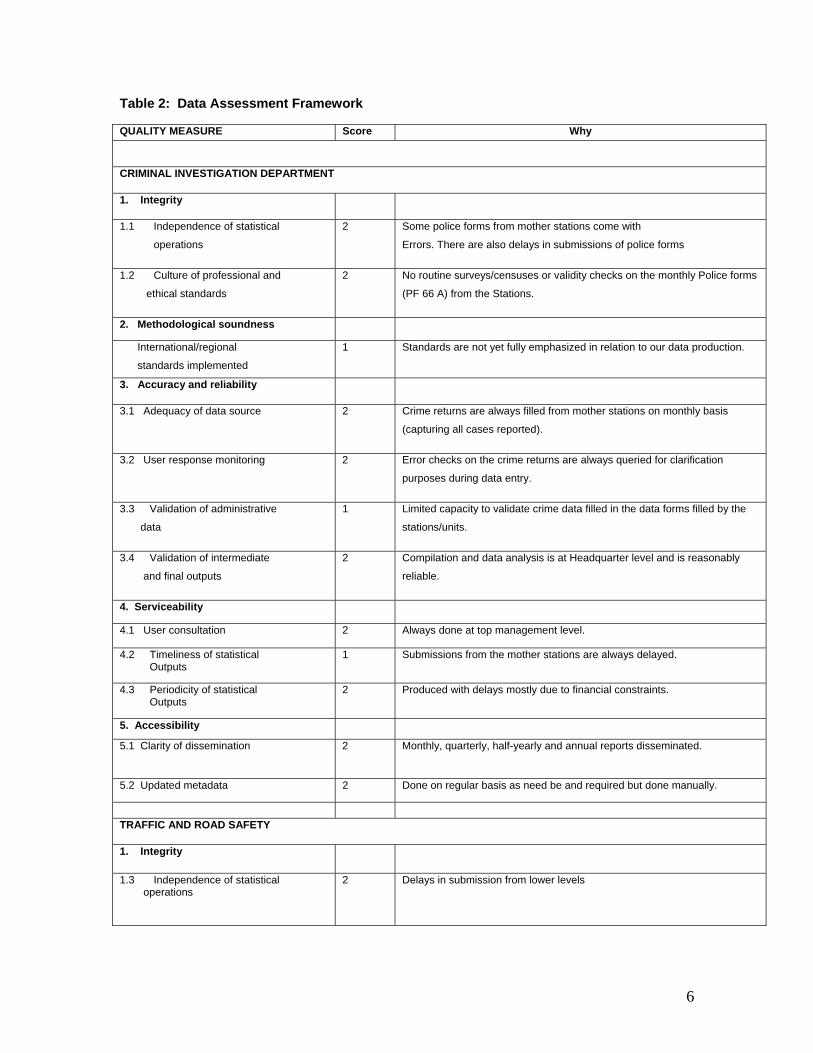
Table 2: Data Assessment Framework
QUALITY MEASURE Score Why
CRIMINAL INVESTIGATION DEPARTMENT
1. Integrity
1.1 Independence of statistical
operations
2 Some police forms from mother stations come with
Errors. There are also delays in submissions of police forms
1.2 Culture of professional and
ethical standards
2 No routine surveys/censuses or validity checks on the monthly Police forms
(PF 66 A) from the Stations.
2. Methodological soundness
International/regional
standards implemented
1 Standards are not yet fully emphasized in relation to our data production.
3. Accuracy and reliability
3.1 Adequacy of data source 2 Crime returns are always filled from mother stations on monthly basis
(capturing all cases reported).
3.2 User response monitoring 2 Error checks on the crime returns are always queried for clarification
purposes during data entry.
3.3 Validation of administrative
data
1 Limited capacity to validate crime data filled in the data forms filled by the
stations/units.
3.4 Validation of intermediate
and final outputs
2 Compilation and data analysis is at Headquarter level and is reasonably
reliable.
4. Serviceability
4.1 User consultation 2 Always done at top management level.
4.2 Timeliness of statistical Outputs
1 Submissions from the mother stations are always delayed.
4.3 Periodicity of statistical Outputs
2 Produced with delays mostly due to financial constraints.
5. Accessibility
5.1 Clarity of dissemination 2 Monthly, quarterly, half-yearly and annual reports disseminated.
5.2 Updated metadata 2 Done on regular basis as need be and required but done manually.
TRAFFIC AND ROAD SAFETY
1. Integrity
1.3 Independence of statistical operations
2 Delays in submission from lower levels
6
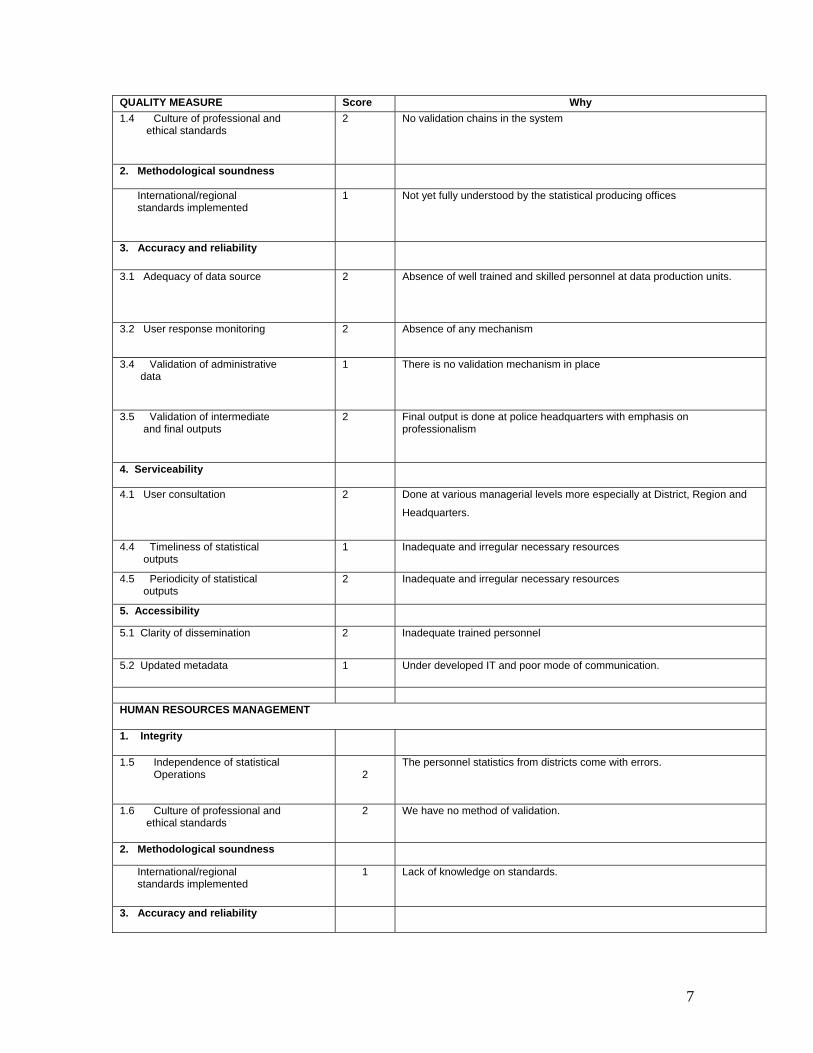
QUALITY MEASURE Score Why 1.4 Culture of professional and ethical standards
2 No validation chains in the system
2. Methodological soundness
International/regional standards implemented
1 Not yet fully understood by the statistical producing offices
3. Accuracy and reliability
3.1 Adequacy of data source 2 Absence of well trained and skilled personnel at data production units.
3.2 User response monitoring 2 Absence of any mechanism
3.4 Validation of administrative data
1 There is no validation mechanism in place
3.5 Validation of intermediate and final outputs
2 Final output is done at police headquarters with emphasis on professionalism
4. Serviceability
4.1 User consultation 2 Done at various managerial levels more especially at District, Region and
Headquarters.
4.4 Timeliness of statistical outputs
1 Inadequate and irregular necessary resources
4.5 Periodicity of statistical outputs
2 Inadequate and irregular necessary resources
5. Accessibility
5.1 Clarity of dissemination 2 Inadequate trained personnel
5.2 Updated metadata 1 Under developed IT and poor mode of communication.
HUMAN RESOURCES MANAGEMENT
1. Integrity
1.5 Independence of statistical Operations
2
The personnel statistics from districts come with errors.
1.6 Culture of professional and ethical standards
2 We have no method of validation.
2. Methodological soundness
International/regional standards implemented
1 Lack of knowledge on standards.
3. Accuracy and reliability
7
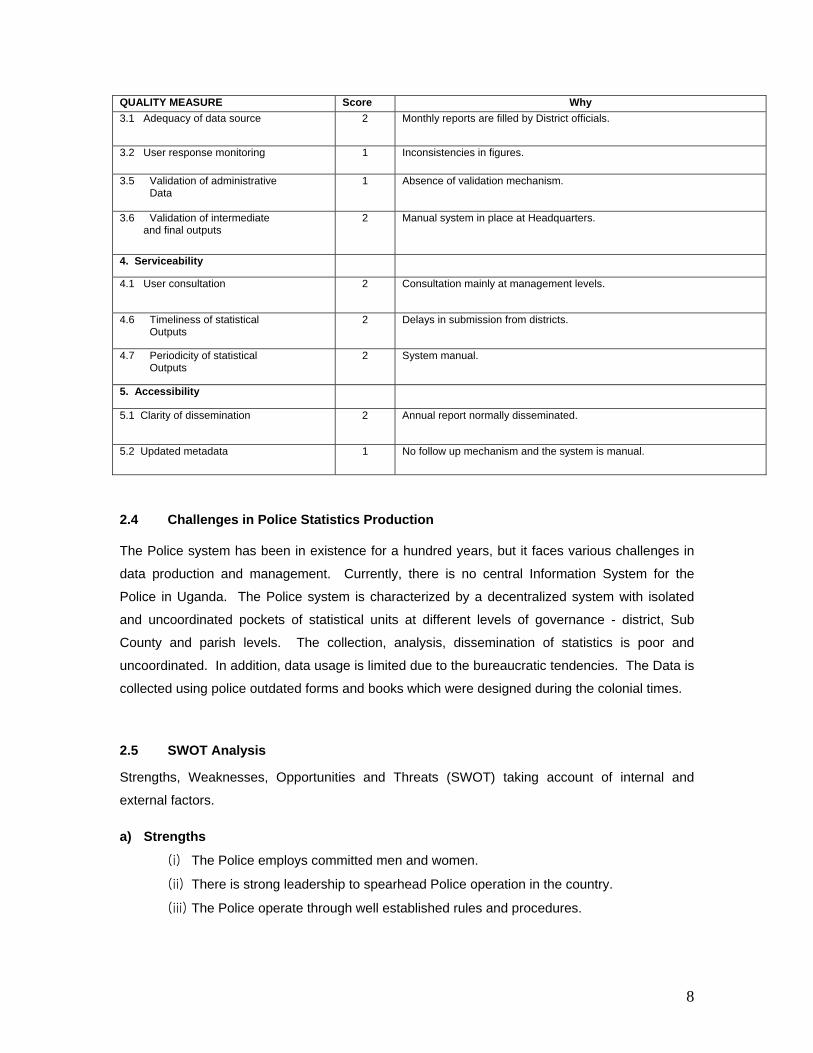
QUALITY MEASURE Score Why 3.1 Adequacy of data source 2 Monthly reports are filled by District officials.
3.2 User response monitoring 1 Inconsistencies in figures.
3.5 Validation of administrative Data
1 Absence of validation mechanism.
3.6 Validation of intermediate and final outputs
2 Manual system in place at Headquarters.
4. Serviceability
4.1 User consultation 2 Consultation mainly at management levels.
4.6 Timeliness of statistical Outputs
2 Delays in submission from districts.
4.7 Periodicity of statistical Outputs
2 System manual.
5. Accessibility
5.1 Clarity of dissemination 2 Annual report normally disseminated.
5.2 Updated metadata 1 No follow up mechanism and the system is manual.
2.4 Challenges in Police Statistics Production
The Police system has been in existence for a hundred years, but it faces various challenges in
data production and management. Currently, there is no central Information System for the
Police in Uganda. The Police system is characterized by a decentralized system with isolated
and uncoordinated pockets of statistical units at different levels of governance - district, Sub
County and parish levels. The collection, analysis, dissemination of statistics is poor and
uncoordinated. In addition, data usage is limited due to the bureaucratic tendencies. The Data is
collected using police outdated forms and books which were designed during the colonial times.
2.5 SWOT Analysis
Strengths, Weaknesses, Opportunities and Threats (SWOT) taking account of internal and
external factors.
a) Strengths
(i) The Police employs committed men and women.
(ii) There is strong leadership to spearhead Police operation in the country.
(iii) The Police operate through well established rules and procedures.
8
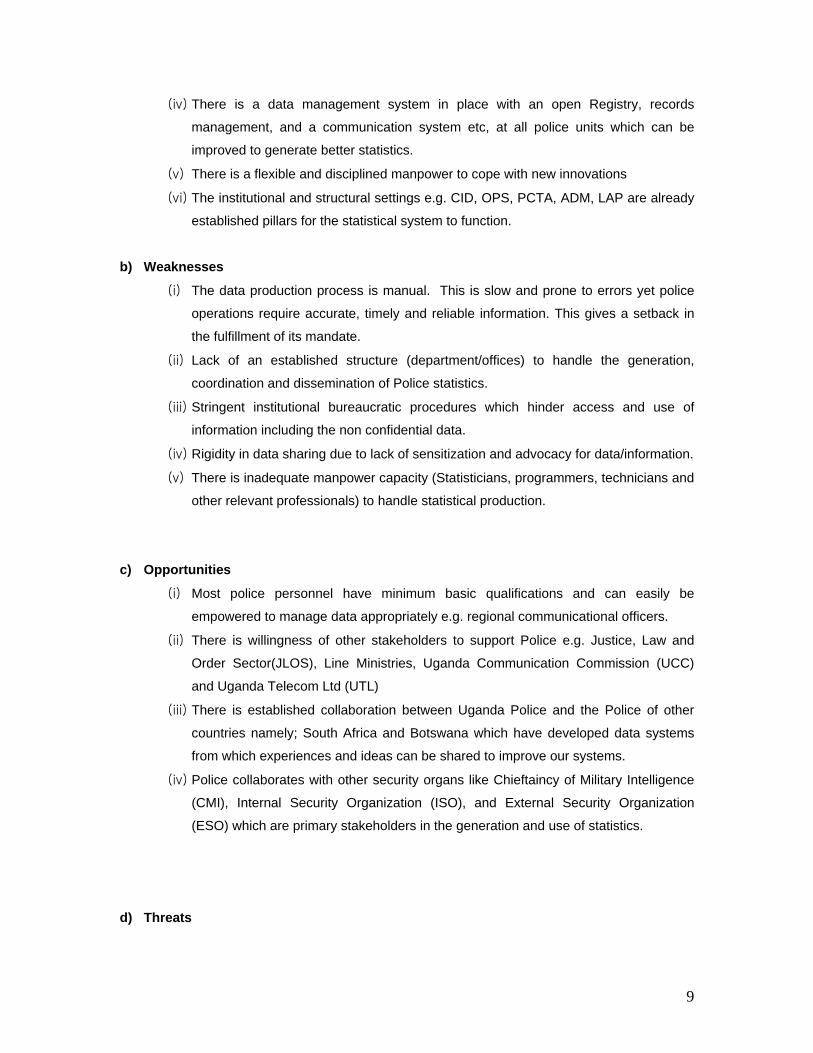
(iv) There is a data management system in place with an open Registry, records
management, and a communication system etc, at all police units which can be
improved to generate better statistics.
(v) There is a flexible and disciplined manpower to cope with new innovations
(vi) The institutional and structural settings e.g. CID, OPS, PCTA, ADM, LAP are already
established pillars for the statistical system to function.
b) Weaknesses
(i) The data production process is manual. This is slow and prone to errors yet police
operations require accurate, timely and reliable information. This gives a setback in
the fulfillment of its mandate.
(ii) Lack of an established structure (department/offices) to handle the generation,
coordination and dissemination of Police statistics.
(iii) Stringent institutional bureaucratic procedures which hinder access and use of
information including the non confidential data.
(iv) Rigidity in data sharing due to lack of sensitization and advocacy for data/information.
(v) There is inadequate manpower capacity (Statisticians, programmers, technicians and
other relevant professionals) to handle statistical production.
c) Opportunities
(i) Most police personnel have minimum basic qualifications and can easily be
empowered to manage data appropriately e.g. regional communicational officers.
(ii) There is willingness of other stakeholders to support Police e.g. Justice, Law and
Order Sector(JLOS), Line Ministries, Uganda Communication Commission (UCC)
and Uganda Telecom Ltd (UTL)
(iii) There is established collaboration between Uganda Police and the Police of other
countries namely; South Africa and Botswana which have developed data systems
from which experiences and ideas can be shared to improve our systems.
(iv) Police collaborates with other security organs like Chieftaincy of Military Intelligence
(CMI), Internal Security Organization (ISO), and External Security Organization
(ESO) which are primary stakeholders in the generation and use of statistics.
d) Threats
9

(i) Technological changes: Technology challenges in today’s digital world require
redesigning the organization and building new communication architecture and
information technology (IT) infrastructure.
(ii) Security of the system to safeguard highly confidential information.
(iii) Hackers and crackers may pose a big threat and therefore requiring building a robust
system.
10
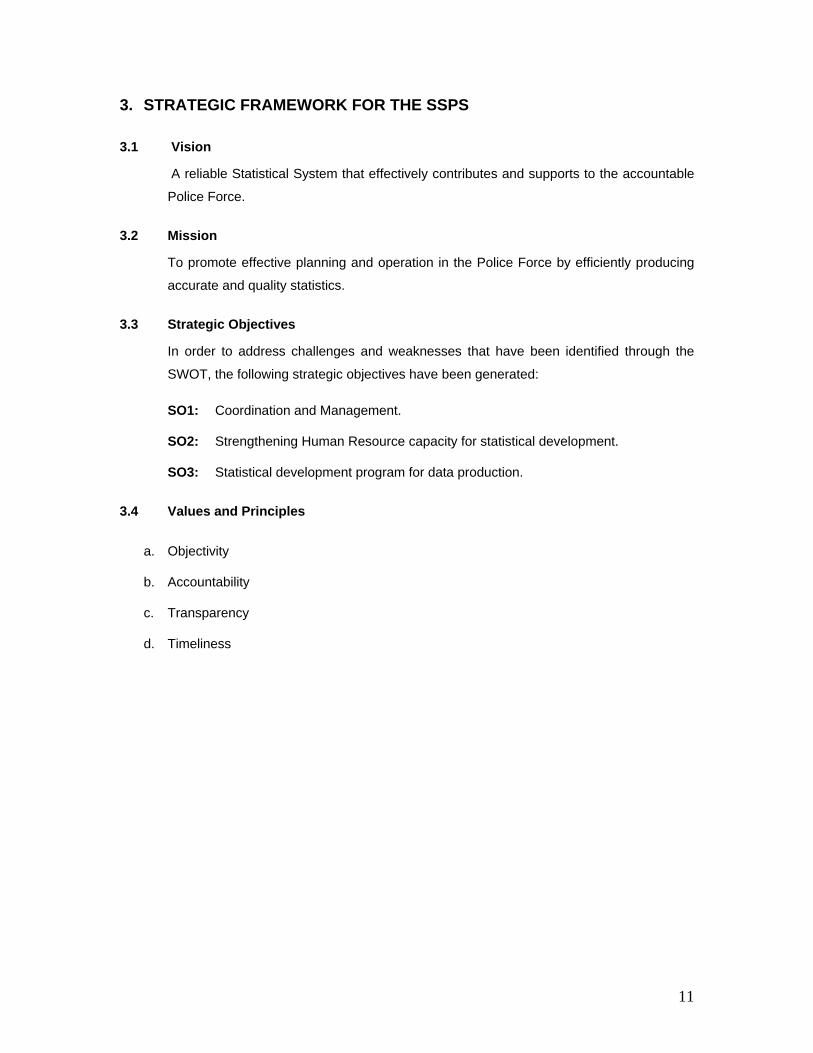
3. STRATEGIC FRAMEWORK FOR THE SSPS
3.1 Vision
A reliable Statistical System that effectively contributes and supports to the accountable
Police Force.
3.2 Mission
To promote effective planning and operation in the Police Force by efficiently producing
accurate and quality statistics.
3.3 Strategic Objectives
In order to address challenges and weaknesses that have been identified through the
SWOT, the following strategic objectives have been generated:
SO1: Coordination and Management.
SO2: Strengthening Human Resource capacity for statistical development.
SO3: Statistical development program for data production.
3.4 Values and Principles
a. Objectivity
b. Accountability
c. Transparency
d. Timeliness
11
4 STRATEGY FOR IMPROVING STATISTICS PRODUCTION
In order to realize the vision and mission for the police sector, specific actions in the next five
years (2006/7 – 2010/11) will be targeted on the strategic objectives mentioned herein.
4.1 SO1: Coordination and Management
The Issue.
Police statistics are generated through regular administrative records at all levels. However, the
methodology and mechanisms underwhich they are generated affects the quality. There is
inadequacy in coordination and management at all levels of administration that affect the
accuracy, completeness, timeliness and consistency of statistics produced. Effective
coordination and management of statistics production will ensure that data producers at all levels
produce accurate, efficient and quality statistics.
Main Strategies
In order to address the above issue the following strategies will be pursued;
• Institutionalising the function of the statistical committee for the Uganda Police Force
• Harmonising statistical production processes within the sector.
• Collaborating with UBOS in implementing the SSPS and Plan for National Statistics
Development.
Specific Actions
SO 4.1.1 Promote the role of statistics in designing strategies for crime prevention and
reduction among policy makers in the Police.Operationalise the police sector
statistical structures (committees) - PSIC.
SO 4.1.2 Advocate and sensitize the UPF fraternity about the need and importance of
good statistics
SO 4.1.3 Coordinate and harmonise statistical production activities of all stakeholders in
the Police fraternity.
SO 4.1.4 Monitor implementation of the SSPS to ensure quality and availability of the
Police statistics is strengthened.
SO 4.1.5 Set up and equip statistical units at Directorate & Departmental levels
12
SO 4.1.6 Establish and equip a central statistical Unit (One Stop Centre) at the Police
headquarters, properly equipped to oversee the generation, storage,
dissemination and usage of statistics.
SO 4.1.7 Procure and apply relevant Statistical packages
SO 4.1.8 Computerize and integrate the system into a LAN and WAN to ensure all police
departments have access to timely, accurate and usable data.
4.2 SO2: Human Resource Development and Management
The Issue
There is need for well qualified, motivated and well equipped staff to produce quality statistics.
On the other hand, data users also need to be empowered to access the data and information
produced.
Main Strategies
In order to address the above issue, the following strategy will be pursued;
• Providing support to stakeholders to enhance the quality of generation, analysis,
dissemination and use of statistics.
• Strengthening skills for data collection, analysis, management and dissemination.
• Strengthening skills in GIS design and application
Specific Actions
To achieve the above strategies following activities have been identified for implementation.
SO 4.2.1 Train IT analysts/data managers/ programmers in conventional IT competences
SO 4.2.2 Train relevant staff involved in production and management of statistics in data
collection and analysis.
SO 4.2.3 Train and apply skills in the use of the Geographical information system
SO 4.2.4 Organize induction courses and short specialized refresher courses, study tours
and attachments.
13
4.3 SO3: Statistical Development Programmes
The Issue
Most of the police statistics is generated through regular administrative records or through
investigative activities. Statistics are produced as a routine and sometimes quality may not be
given due attention. Data producers and users need to be empowered to appreciate the
importance of producing and using good statistics.
Main Strategies
In order to address the above issue, the following strategy will be pursued;
• Improving and standardising data collection tools
• Updating statistical definitions, terminologies and concepts in line with international
standards
• Developing data bases for all crime statistics
• Developing and regularly updating crime and related meta data
Specific Actions
Operationalisation of the above strategies will depend on the implementation of the following
activities.
SO3.1 Review and standardize the data collection tools,
SO 3.2 Establish a GIS facility to spatially map Police statistics (crime, traffic statistics, among others
SO 3.3 Develop and continuously update a Statistics web page for dissemination.
SO 3.4 Produce Hard copies of comprehensive statistics in form of reports, facts and figures, bulletins, statistics abstracts, calendars, CDs, etc.
SO 3.5 Carry out crime and user satisfaction surveys after every three years.
SO 3.6 Develop and regularly update the metadata
SO 3.7 Develop statistics indicators that would be linked to MDGs & PEAP and update them regularly.
SO 3.8 Conduct periodic statistical audits in sampled regions and districts.
SO 3.9 Develop a statistics repository centre with updates in the UPF Library
SO 3.10 Data collection & verification from Partners (hospitals, Local Councils, and others)
SO 3.11 Develop Database Management Systems and a computerized Police Information System (POLIS)
14
5 IMPLEMENTATION PLAN
This plan will upgrade the present Police Information System (POLIS) see Appendix F, which is
mainly manual with some isolated computer databases into an integrated computerized
nationwide database network system. POLIS will be supervised by PISC and will establish
network with all support directorates, departments, regional headquarters, districts and gazetted
stations as shown in Annex A.
5.1 Mechanisms
This strategic plan is estimated to be implemented in the period of five years. The first year will
cover Police Headquarters directorates and departments. The second year will cover specialized
units and two regional Headquarters of Kampala Extra and Central. During the third year, the plan
will extend to cover the remaining ten regional headquarters. In the fourth year the plan will have
covered all district headquarters. By the end of the fifth year, the implementation plan should
have covered all policing areas of Uganda up to gazetted Police Stations.
The priorities for the implementation of this plan during the first year and subsequent years will be
based on the need for strengthening the state of statistical production and usage. The priorities
will be guided by the principle of sustainability putting into consideration the basic strategies of
statistical advocacy, organizational and institutional development, physical and statistical
infrastructure, Information Technology, Human resource Development, Data development, Data
dissemination and Monitoring and evaluation.
Furthermore, the established statistics committee in collaboration with Research and Planning as
an implementing department will serve as the steering committee for the development of this
Plan. The detailed activities are given in the logical framework and activity schedule.
5.2 Monitoring and Evaluation
This will be accomplished through regular technical support supervision on data management at
all levels. Data Quality Audits (DQA) will be carried out at different levels of data collection,
collation and analysis by the technical staff of Police Statistics Committee and PNSD as need
arises. The Inspector General of Police (IGP) will be the overseer. The Commissioner of
Research and Planning will be responsible for the overall implementation of the activities on
behalf of the Inspector General of Police. Progress reports will be submitted on a quarterly basis
to the key stakeholders. These reports will be distributed to IGP, all Directors, Executive Director
15
16
UBOS and other relevant key stakeholders. Monitoring the implementation of activities will also
be undertaken using agreed upon indicators. A mid-term and final evaluation exercise will also
be conducted to assess the extent to which the objectives will have been achieved.
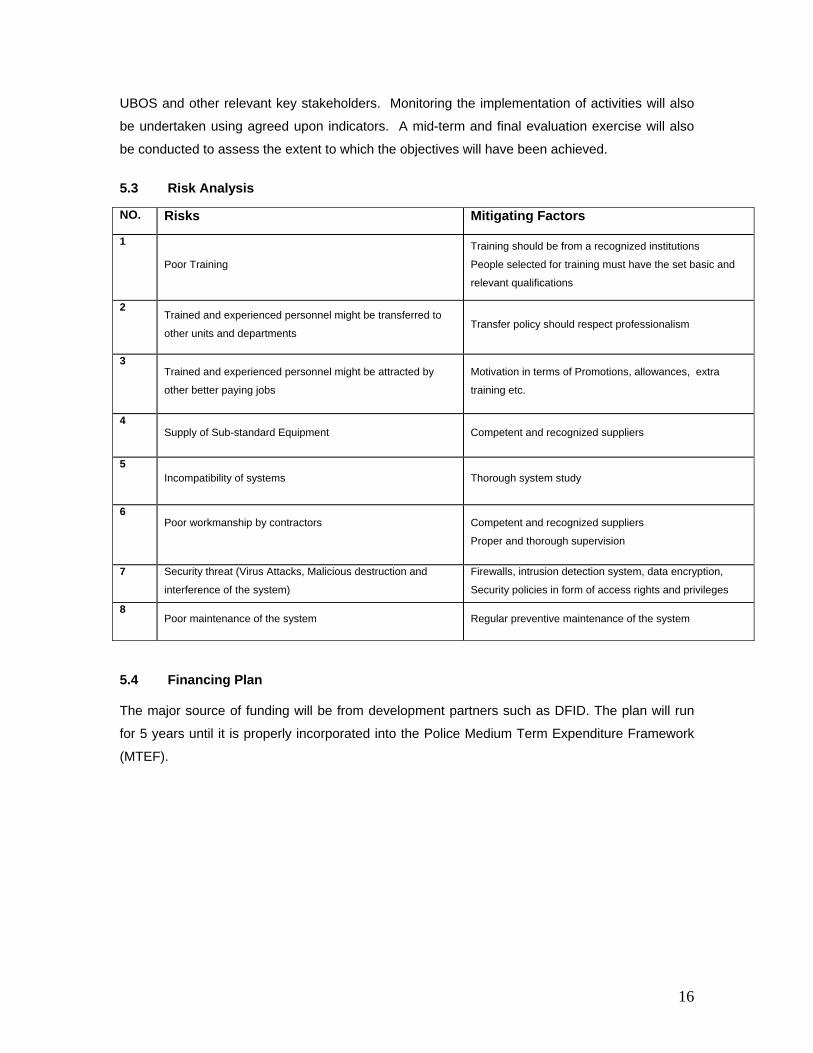
5.3 Risk Analysis
NO. Risks Mitigating Factors
1
Poor Training
Training should be from a recognized institutions
People selected for training must have the set basic and
relevant qualifications
2 Trained and experienced personnel might be transferred to
other units and departments Transfer policy should respect professionalism
3 Trained and experienced personnel might be attracted by
other better paying jobs
Motivation in terms of Promotions, allowances, extra
training etc.
4 Supply of Sub-standard Equipment Competent and recognized suppliers
5 Incompatibility of systems Thorough system study
6 Poor workmanship by contractors
Competent and recognized suppliers
Proper and thorough supervision
7 Security threat (Virus Attacks, Malicious destruction and
interference of the system)
Firewalls, intrusion detection system, data encryption,
Security policies in form of access rights and privileges
8 Poor maintenance of the system Regular preventive maintenance of the system
5.4 Financing Plan
The major source of funding will be from development partners such as DFID. The plan will run
for 5 years until it is properly incorporated into the Police Medium Term Expenditure Framework
(MTEF).
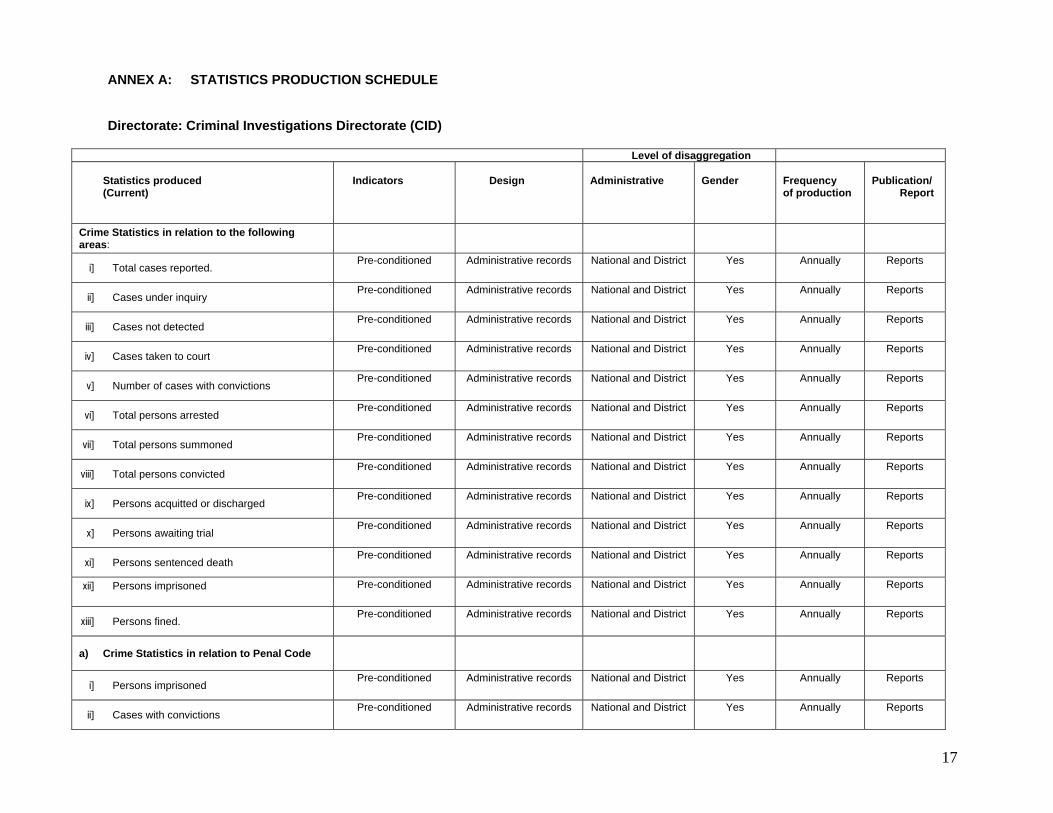
ANNEX A: STATISTICS PRODUCTION SCHEDULE Directorate: Criminal Investigations Directorate (CID)
Level of disaggregation Statistics produced (Current)
Indicators
Design
Administrative
Gender
Frequency of production
Publication/
Report
Crime Statistics in relation to the following areas:
i] Total cases reported. Pre-conditioned Administrative records National and District Yes Annually Reports
ii] Cases under inquiry Pre-conditioned Administrative records National and District Yes Annually Reports
iii] Cases not detected Pre-conditioned Administrative records National and District Yes Annually Reports
iv] Cases taken to court Pre-conditioned Administrative records National and District Yes Annually Reports
v] Number of cases with convictions Pre-conditioned Administrative records National and District Yes Annually Reports
vi] Total persons arrested Pre-conditioned Administrative records National and District Yes Annually Reports
vii] Total persons summoned Pre-conditioned Administrative records National and District Yes Annually Reports
viii] Total persons convicted Pre-conditioned Administrative records National and District Yes Annually Reports
ix] Persons acquitted or discharged Pre-conditioned Administrative records National and District Yes Annually Reports
x] Persons awaiting trial Pre-conditioned Administrative records National and District Yes Annually Reports
xi] Persons sentenced death Pre-conditioned Administrative records National and District Yes Annually Reports
xii] Persons imprisoned
Pre-conditioned Administrative records National and District Yes Annually Reports
xiii] Persons fined. Pre-conditioned Administrative records National and District Yes Annually Reports
a) Crime Statistics in relation to Penal Code
i] Persons imprisoned Pre-conditioned Administrative records National and District Yes Annually Reports
ii] Cases with convictions Pre-conditioned Administrative records National and District Yes Annually Reports
17
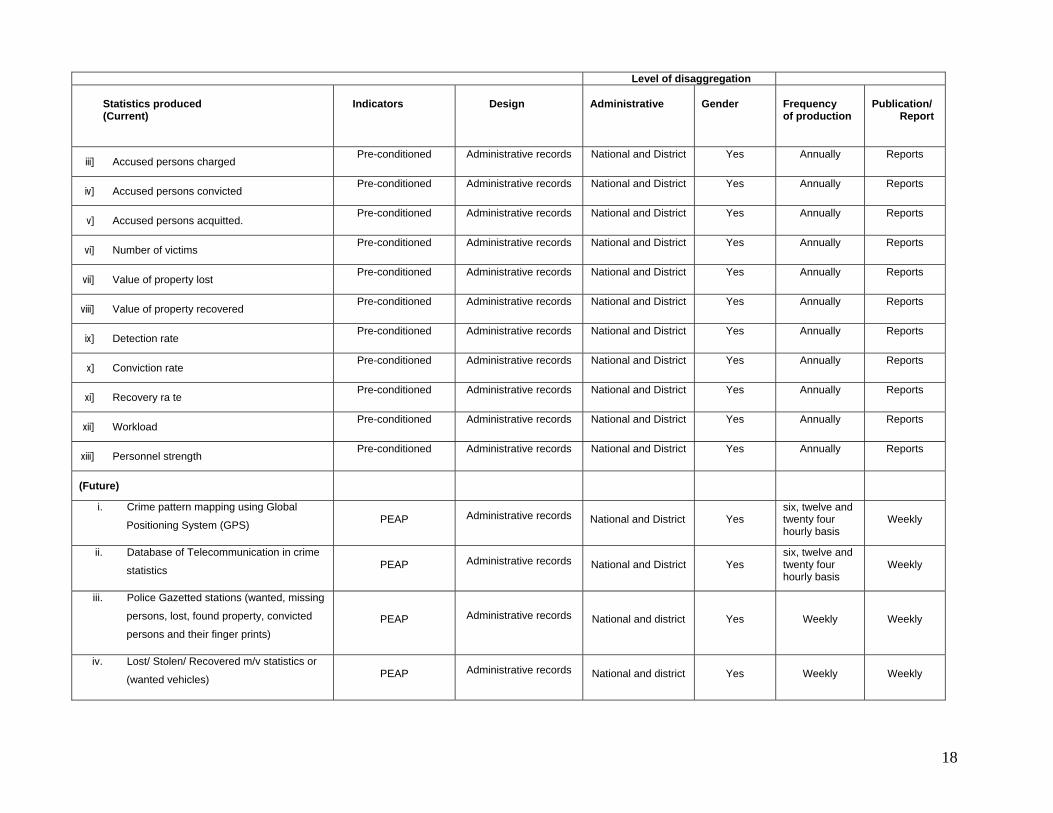
Level of disaggregation Statistics produced
Indicators
Design
Administrative
Gender
Frequency of production
Publication/
Report (Current)
iii] Accused persons charged Pre-conditioned Administrative records National and District Yes Annually Reports
iv] Accused persons convicted Pre-conditioned Administrative records National and District Yes Annually Reports
v] Accused persons acquitted. Pre-conditioned Administrative records National and District Yes Annually Reports
vi] Number of victims Pre-conditioned Administrative records National and District Yes Annually Reports
vii] Value of property lost Pre-conditioned Administrative records National and District Yes Annually Reports
viii] Value of property recovered Pre-conditioned Administrative records National and District Yes Annually Reports
ix] Detection rate Pre-conditioned Administrative records National and District Yes Annually Reports
x] Conviction rate Pre-conditioned Administrative records National and District Yes Annually Reports
xi] Recovery ra te Pre-conditioned Administrative records National and District Yes Annually Reports
xii] Workload Pre-conditioned Administrative records National and District Yes Annually Reports
xiii] Personnel strength Pre-conditioned Administrative records National and District Yes Annually Reports
(Future)
i. Crime pattern mapping using Global
Positioning System (GPS) PEAP Administrative records National and District Yes six, twelve and twenty four hourly basis
Weekly
ii. Database of Telecommunication in crime
statistics PEAP Administrative records National and District Yes six, twelve and twenty four hourly basis
Weekly
iii. Police Gazetted stations (wanted, missing
persons, lost, found property, convicted
persons and their finger prints) PEAP Administrative records National and district Yes Weekly Weekly
iv. Lost/ Stolen/ Recovered m/v statistics or
(wanted vehicles) PEAP Administrative records National and district Yes Weekly Weekly
18
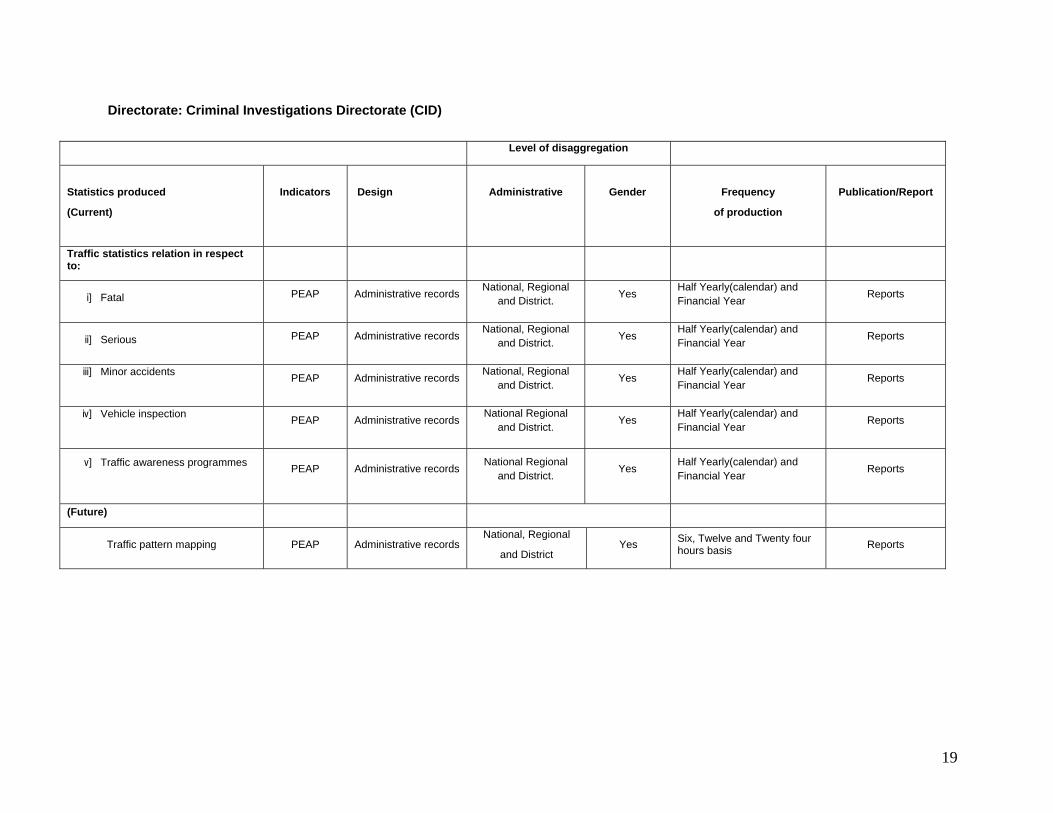
Directorate: Criminal Investigations Directorate (CID)
Level of disaggregation
Statistics produced
(Current)
Indicators
Design
Administrative
Gender
Frequency
of production
Publication/Report
Traffic statistics relation in respect to:
i] Fatal PEAP Administrative records National, Regional and District. Yes Half Yearly(calendar) and
Financial Year Reports
ii] Serious PEAP Administrative records National, Regional and District. Yes Half Yearly(calendar) and
Financial Year Reports
iii] Minor accidents
PEAP Administrative records National, Regional
and District. Yes Half Yearly(calendar) and Financial Year Reports
iv] Vehicle inspection
PEAP Administrative records National Regional
and District. Yes Half Yearly(calendar) and Financial Year Reports
v] Traffic awareness programmes
PEAP Administrative records National Regional
and District. Yes Half Yearly(calendar) and
Financial Year Reports
(Future)
Traffic pattern mapping PEAP Administrative records National, Regional
and District Yes Six, Twelve and Twenty four
hours basis Reports
19
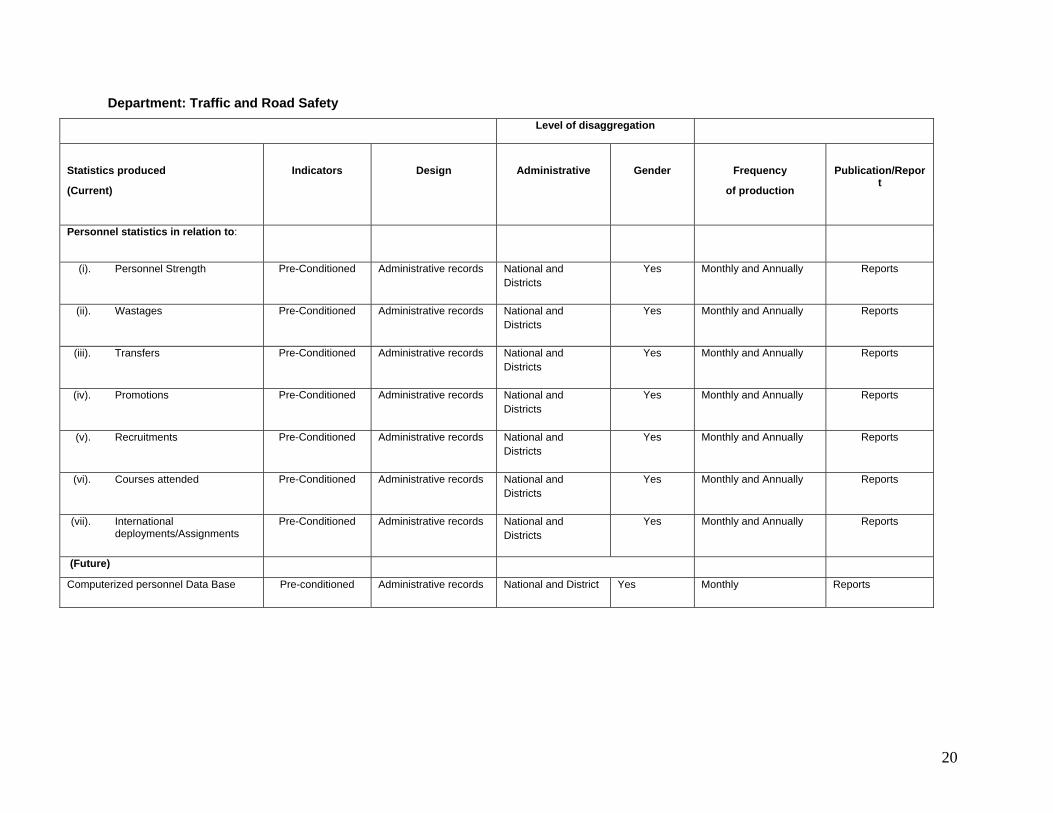
Department: Traffic and Road Safety
Level of disaggregation
Statistics produced
(Current)
Indicators
Design
Administrative
Gender
Frequency
of production
Publication/Report
Personnel statistics in relation to:
(i). Personnel Strength Pre-Conditioned Administrative records National and Districts
Yes Monthly and Annually Reports
(ii). Wastages Pre-Conditioned Administrative records National and Districts
Yes Monthly and Annually Reports
(iii). Transfers Pre-Conditioned Administrative records National and Districts
Yes Monthly and Annually Reports
(iv). Promotions Pre-Conditioned Administrative records National and Districts
Yes Monthly and Annually Reports
(v). Recruitments Pre-Conditioned Administrative records National and Districts
Yes Monthly and Annually Reports
(vi). Courses attended Pre-Conditioned Administrative records National and Districts
Yes Monthly and Annually Reports
(vii). International deployments/Assignments
Pre-Conditioned Administrative records National and Districts
Yes Monthly and Annually Reports
(Future)
Computerized personnel Data Base Pre-conditioned Administrative records National and District Yes Monthly Reports
20
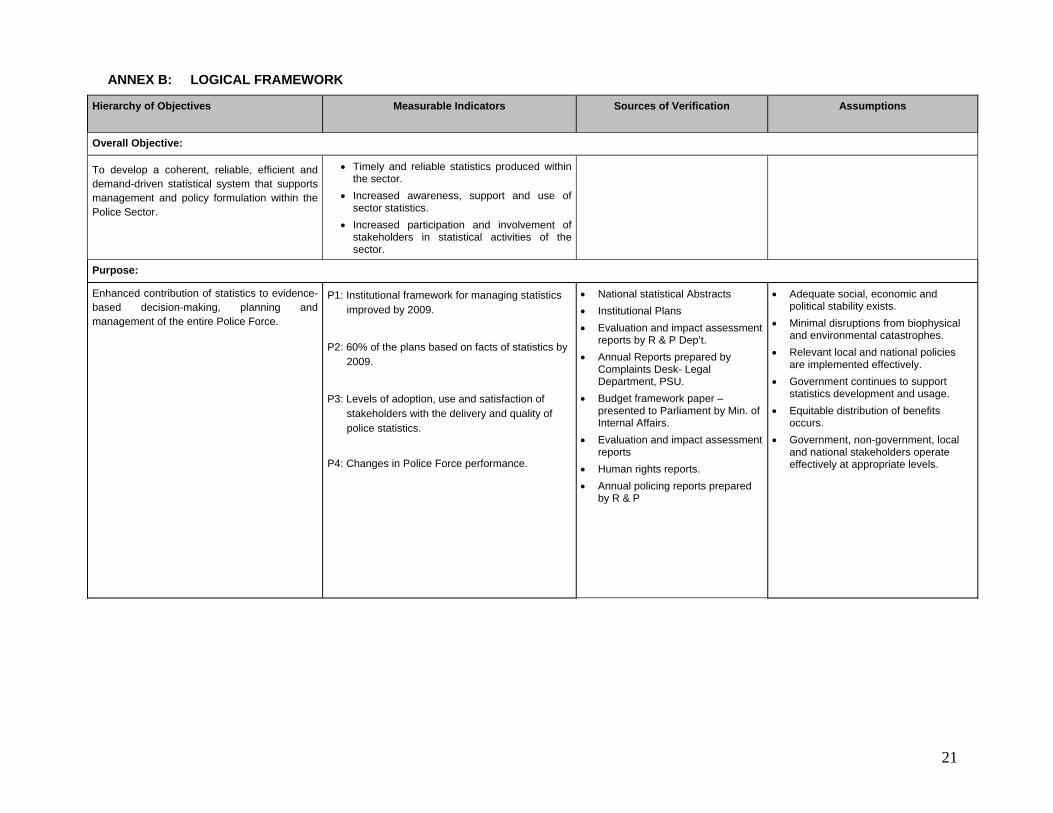
ANNEX B: LOGICAL FRAMEWORK Hierarchy of Objectives Measurable Indicators
Sources of Verification Assumptions
Overall Objective:
To develop a coherent, reliable, efficient and demand-driven statistical system that supports management and policy formulation within the Police Sector.
• Timely and reliable statistics produced within the sector.
• Increased awareness, support and use of sector statistics.
• Increased participation and involvement of stakeholders in statistical activities of the sector.
Purpose:
Enhanced contribution of statistics to evidence-based decision-making, planning and management of the entire Police Force.
P1: Institutional framework for managing statistics improved by 2009.
P2: 60% of the plans based on facts of statistics by 2009.
P3: Levels of adoption, use and satisfaction of stakeholders with the delivery and quality of police statistics.
P4: Changes in Police Force performance.
• National statistical Abstracts • Institutional Plans • Evaluation and impact assessment
reports by R & P Dep’t. • Annual Reports prepared by
Complaints Desk- Legal Department, PSU.
• Budget framework paper –presented to Parliament by Min. of Internal Affairs.
• Evaluation and impact assessment reports
• Human rights reports. • Annual policing reports prepared
by R & P
• Adequate social, economic and political stability exists.
• Minimal disruptions from biophysical and environmental catastrophes.
• Relevant local and national policies are implemented effectively.
• Government continues to support statistics development and usage.
• Equitable distribution of benefits occurs.
• Government, non-government, local and national stakeholders operate effectively at appropriate levels.
21
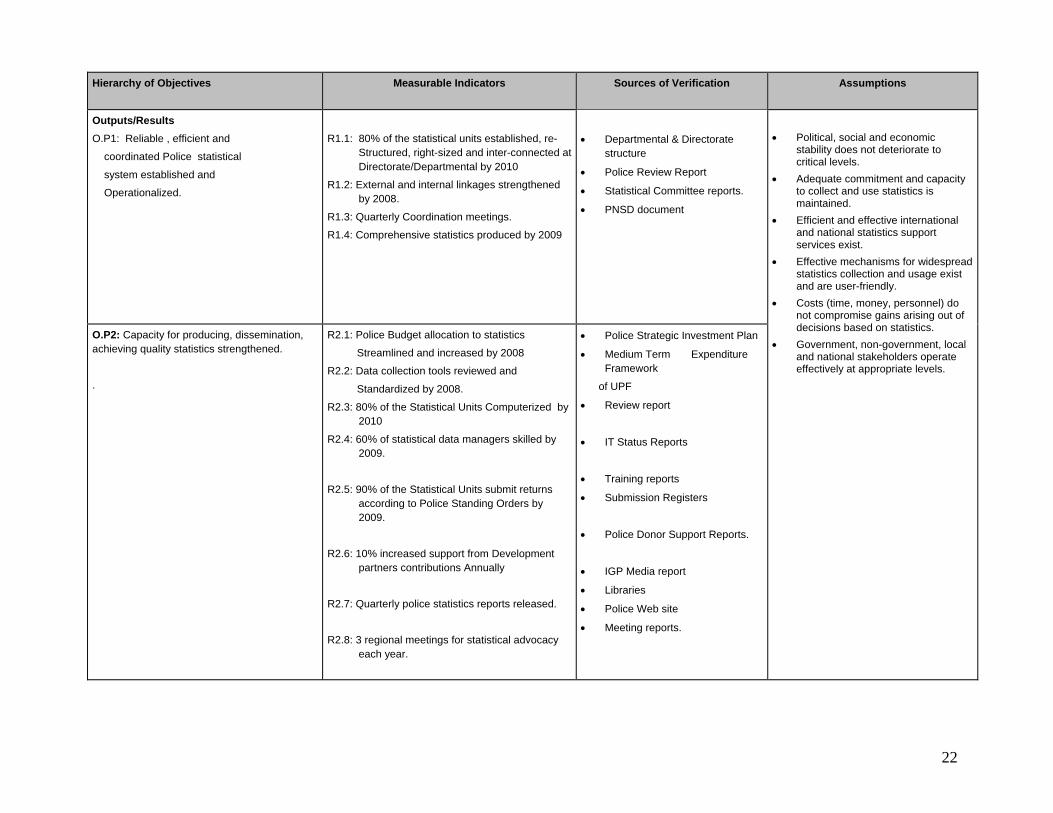
Hierarchy of Objectives Measurable Indicators
Sources of Verification Assumptions
Outputs/Results O.P1: Reliable , efficient and
coordinated Police statistical
system established and
Operationalized.
R1.1: 80% of the statistical units established, re-
Structured, right-sized and inter-connected at Directorate/Departmental by 2010
R1.2: External and internal linkages strengthened by 2008.
R1.3: Quarterly Coordination meetings.
R1.4: Comprehensive statistics produced by 2009
• Departmental & Directorate structure
• Police Review Report
• Statistical Committee reports.
• PNSD document
• Political, social and economic
stability does not deteriorate to critical levels.
• Adequate commitment and capacity to collect and use statistics is maintained.
• Efficient and effective international and national statistics support services exist.
• Effective mechanisms for widespread statistics collection and usage exist and are user-friendly.
• Costs (time, money, personnel) do not compromise gains arising out of decisions based on statistics.
• Government, non-government, local and national stakeholders operate effectively at appropriate levels.
O.P2: Capacity for producing, dissemination, achieving quality statistics strengthened.
.
R2.1: Police Budget allocation to statistics
Streamlined and increased by 2008
R2.2: Data collection tools reviewed and
Standardized by 2008.
R2.3: 80% of the Statistical Units Computerized by 2010
R2.4: 60% of statistical data managers skilled by 2009.
R2.5: 90% of the Statistical Units submit returns according to Police Standing Orders by 2009.
R2.6: 10% increased support from Development partners contributions Annually
R2.7: Quarterly police statistics reports released.
R2.8: 3 regional meetings for statistical advocacy each year.
• Police Strategic Investment Plan
• Medium Term Expenditure Framework
of UPF
• Review report
• IT Status Reports
• Training reports
• Submission Registers
• Police Donor Support Reports.
• IGP Media report
• Libraries
• Police Web site
• Meeting reports.
22
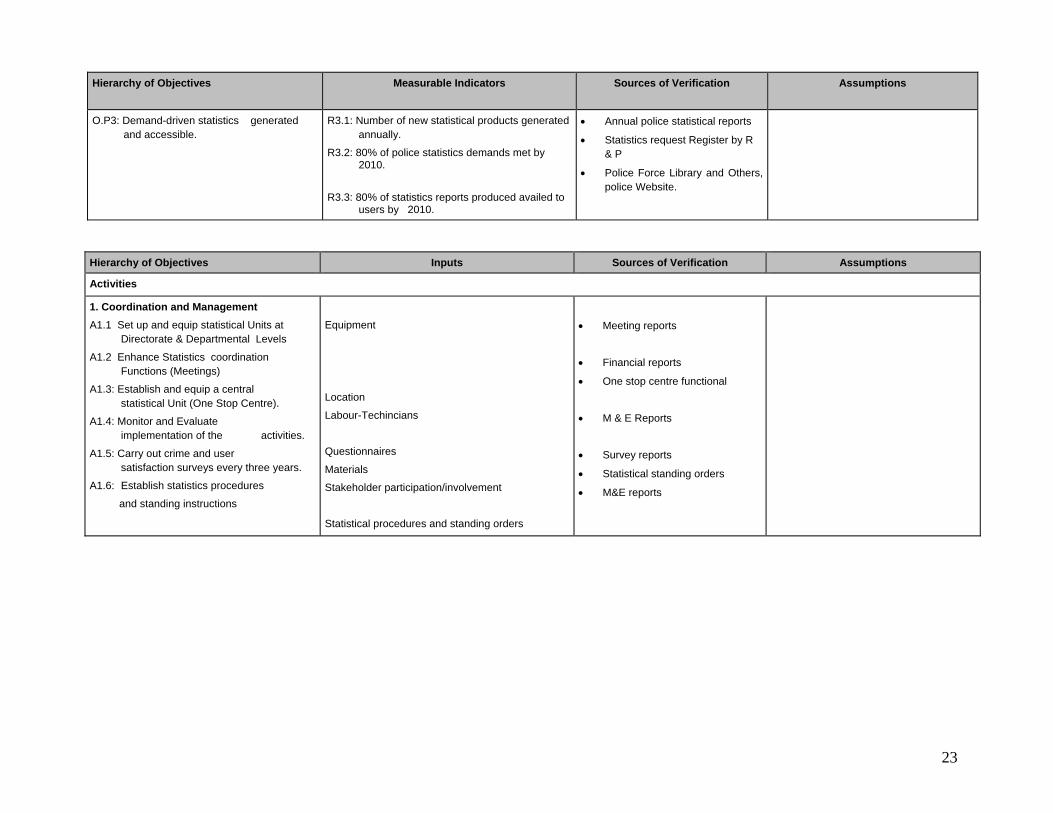
Hierarchy of Objectives Measurable Indicators Sources of Verification Assumptions
O.P3: Demand-driven statistics generated and accessible.
R3.1: Number of new statistical products generated annually.
R3.2: 80% of police statistics demands met by 2010.
R3.3: 80% of statistics reports produced availed to
users by 2010.
• Annual police statistical reports
• Statistics request Register by R & P
• Police Force Library and Others, police Website.
Hierarchy of Objectives Inputs Sources of Verification Assumptions
Activities
1. Coordination and Management A1.1 Set up and equip statistical Units at
Directorate & Departmental Levels
A1.2 Enhance Statistics coordination Functions (Meetings)
A1.3: Establish and equip a central statistical Unit (One Stop Centre).
A1.4: Monitor and Evaluate implementation of the activities.
A1.5: Carry out crime and user satisfaction surveys every three years.
A1.6: Establish statistics procedures
and standing instructions
Equipment
Location
Labour-Techincians
Questionnaires
Materials
Stakeholder participation/involvement
Statistical procedures and standing orders
• Meeting reports
• Financial reports
• One stop centre functional
• M & E Reports
• Survey reports
• Statistical standing orders
• M&E reports
23
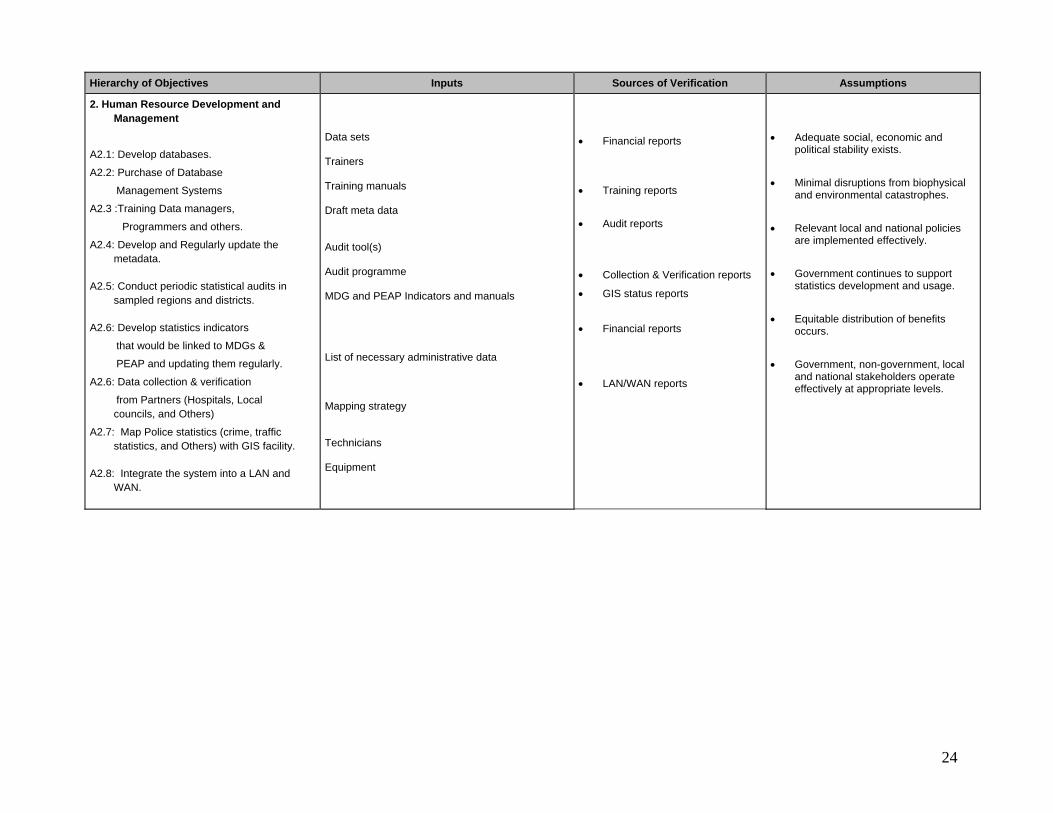
Hierarchy of Objectives Inputs Sources of Verification Assumptions
2. Human Resource Development and Management
A2.1: Develop databases.
A2.2: Purchase of Database
Management Systems
A2.3 :Training Data managers,
Programmers and others.
A2.4: Develop and Regularly update the metadata.
A2.5: Conduct periodic statistical audits in sampled regions and districts.
A2.6: Develop statistics indicators
that would be linked to MDGs &
PEAP and updating them regularly.
A2.6: Data collection & verification
from Partners (Hospitals, Local councils, and Others)
A2.7: Map Police statistics (crime, traffic statistics, and Others) with GIS facility.
A2.8: Integrate the system into a LAN and WAN.
Data sets Trainers Training manuals Draft meta data Audit tool(s) Audit programme MDG and PEAP Indicators and manuals List of necessary administrative data Mapping strategy Technicians Equipment
• Financial reports • Training reports • Audit reports
• Collection & Verification reports
• GIS status reports
• Financial reports
• LAN/WAN reports
• Adequate social, economic and
political stability exists. • Minimal disruptions from biophysical
and environmental catastrophes. • Relevant local and national policies
are implemented effectively. • Government continues to support
statistics development and usage. • Equitable distribution of benefits
occurs. • Government, non-government, local
and national stakeholders operate effectively at appropriate levels.
24
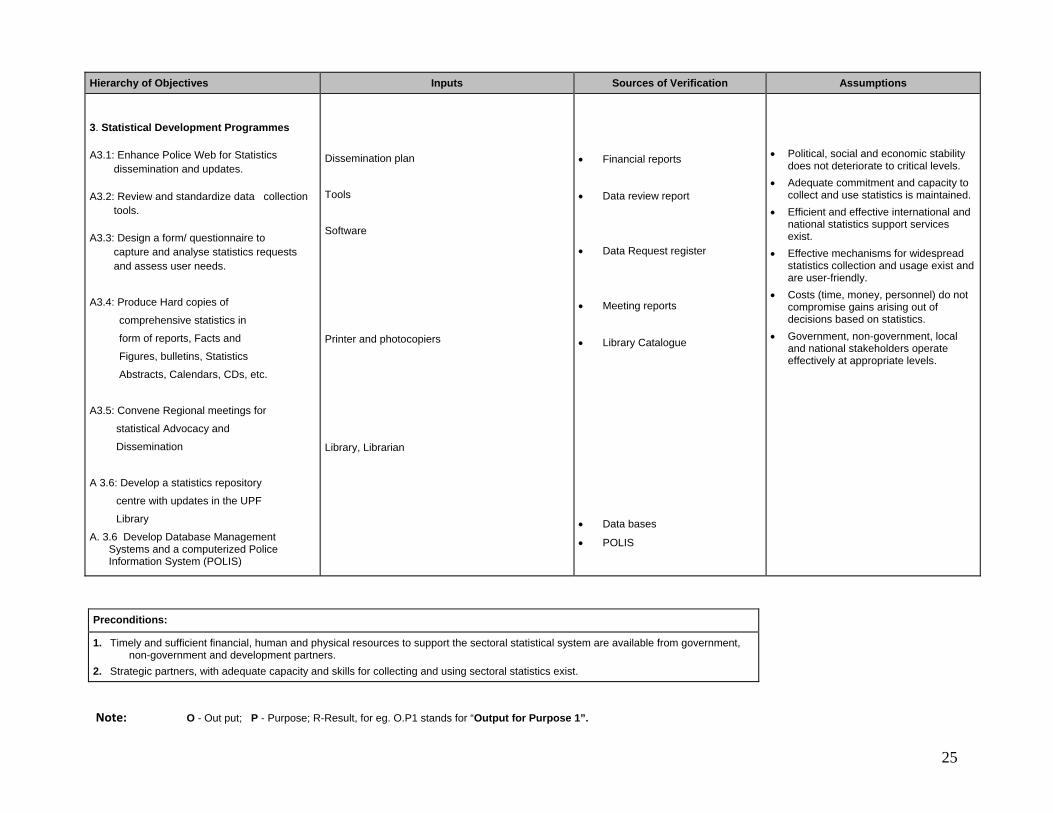
Hierarchy of Objectives Inputs Sources of Verification Assumptions
3. Statistical Development Programmes
A3.1: Enhance Police Web for Statistics dissemination and updates.
A3.2: Review and standardize data collection tools.
A3.3: Design a form/ questionnaire to capture and analyse statistics requests and assess user needs.
A3.4: Produce Hard copies of
comprehensive statistics in
form of reports, Facts and
Figures, bulletins, Statistics
Abstracts, Calendars, CDs, etc.
A3.5: Convene Regional meetings for
statistical Advocacy and
Dissemination
A 3.6: Develop a statistics repository
centre with updates in the UPF
Library
A. 3.6 Develop Database Management Systems and a computerized Police Information System (POLIS)
Dissemination plan
Tools
Software
Printer and photocopiers
Library, Librarian
• Financial reports
• Data review report
• Data Request register
• Meeting reports
• Library Catalogue
• Data bases
• POLIS
• Political, social and economic stability
does not deteriorate to critical levels. • Adequate commitment and capacity to
collect and use statistics is maintained. • Efficient and effective international and
national statistics support services exist.
• Effective mechanisms for widespread statistics collection and usage exist and are user-friendly.
• Costs (time, money, personnel) do not compromise gains arising out of decisions based on statistics.
• Government, non-government, local and national stakeholders operate effectively at appropriate levels.
Preconditions:
1. Timely and sufficient financial, human and physical resources to support the sectoral statistical system are available from government, non-government and development partners.
2. Strategic partners, with adequate capacity and skills for collecting and using sectoral statistics exist.
Note: O - Out put; P - Purpose; R-Result, for eg. O.P1 stands for “Output for Purpose 1”.
25
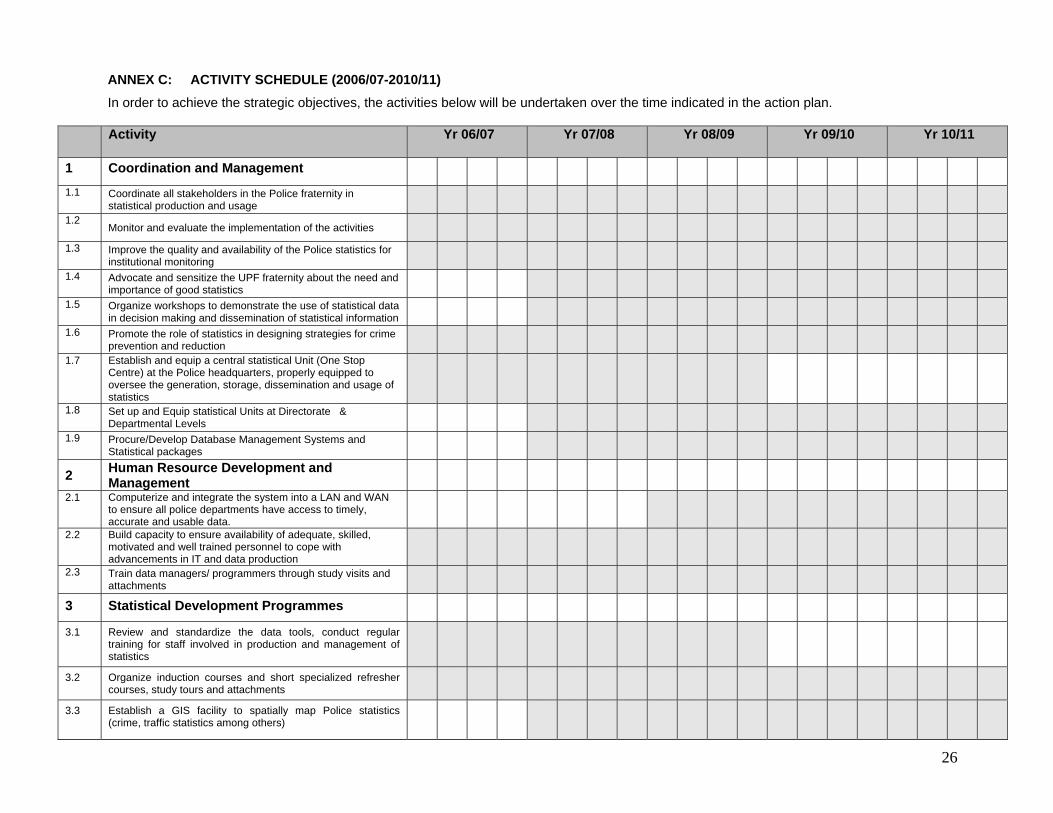
ANNEX C: ACTIVITY SCHEDULE (2006/07-2010/11) In order to achieve the strategic objectives, the activities below will be undertaken over the time indicated in the action plan.
Activity Yr 06/07 Yr 07/08 Yr 08/09 Yr 09/10 Yr 10/11
1 Coordination and Management
1.1 Coordinate all stakeholders in the Police fraternity in statistical production and usage
1.2 Monitor and evaluate the implementation of the activities
1.3 Improve the quality and availability of the Police statistics for institutional monitoring
1.4 Advocate and sensitize the UPF fraternity about the need and importance of good statistics
1.5 Organize workshops to demonstrate the use of statistical data in decision making and dissemination of statistical information
1.6 Promote the role of statistics in designing strategies for crime prevention and reduction
1.7 Establish and equip a central statistical Unit (One Stop Centre) at the Police headquarters, properly equipped to oversee the generation, storage, dissemination and usage of statistics
1.8 Set up and Equip statistical Units at Directorate & Departmental Levels
1.9 Procure/Develop Database Management Systems and Statistical packages
2 Human Resource Development and Management
2.1 Computerize and integrate the system into a LAN and WAN to ensure all police departments have access to timely, accurate and usable data.
2.2 Build capacity to ensure availability of adequate, skilled, motivated and well trained personnel to cope with advancements in IT and data production
2.3 Train data managers/ programmers through study visits and attachments
3 Statistical Development Programmes
3.1 Review and standardize the data tools, conduct regular training for staff involved in production and management of statistics
3.2 Organize induction courses and short specialized refresher courses, study tours and attachments
3.3 Establish a GIS facility to spatially map Police statistics (crime, traffic statistics among others)
26
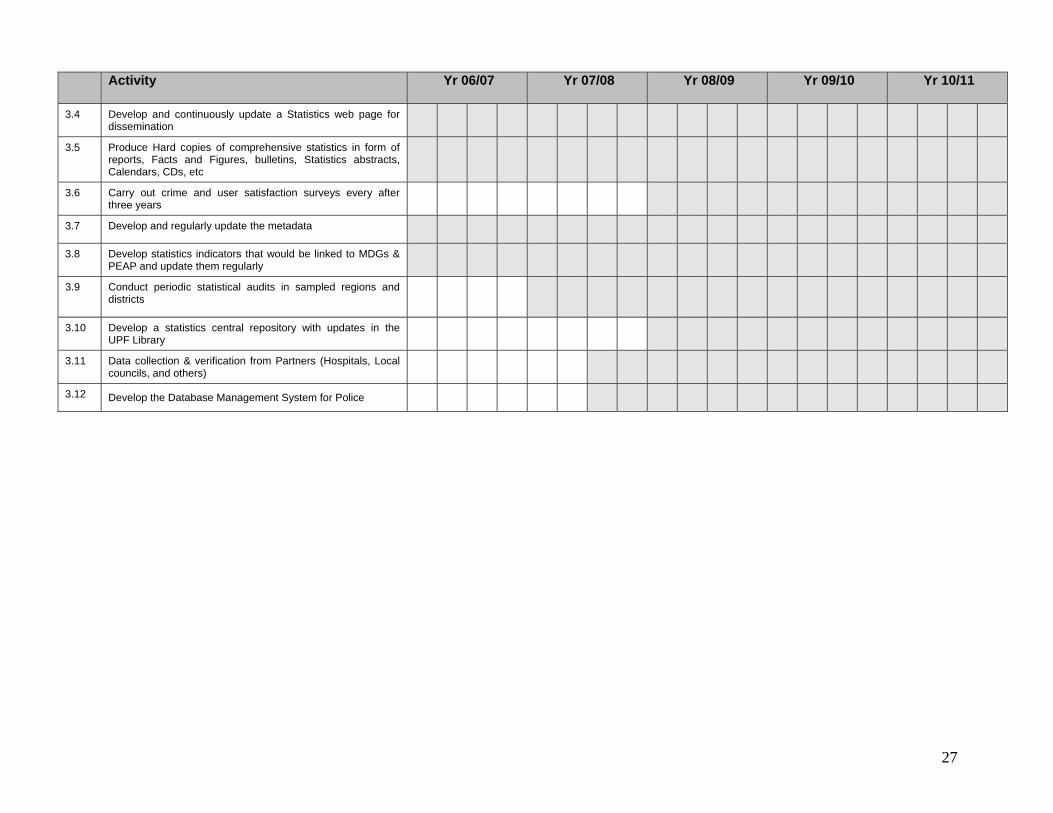
Activity Yr 06/07 Yr 07/08 Yr 08/09 Yr 09/10 Yr 10/11
3.4 Develop and continuously update a Statistics web page for dissemination
3.5 Produce Hard copies of comprehensive statistics in form of reports, Facts and Figures, bulletins, Statistics abstracts, Calendars, CDs, etc
3.6 Carry out crime and user satisfaction surveys every after three years
3.7 Develop and regularly update the metadata
3.8 Develop statistics indicators that would be linked to MDGs & PEAP and update them regularly
3.9 Conduct periodic statistical audits in sampled regions and districts
3.10 Develop a statistics central repository with updates in the UPF Library
3.11 Data collection & verification from Partners (Hospitals, Local councils, and others)
3.12 Develop the Database Management System for Police
27
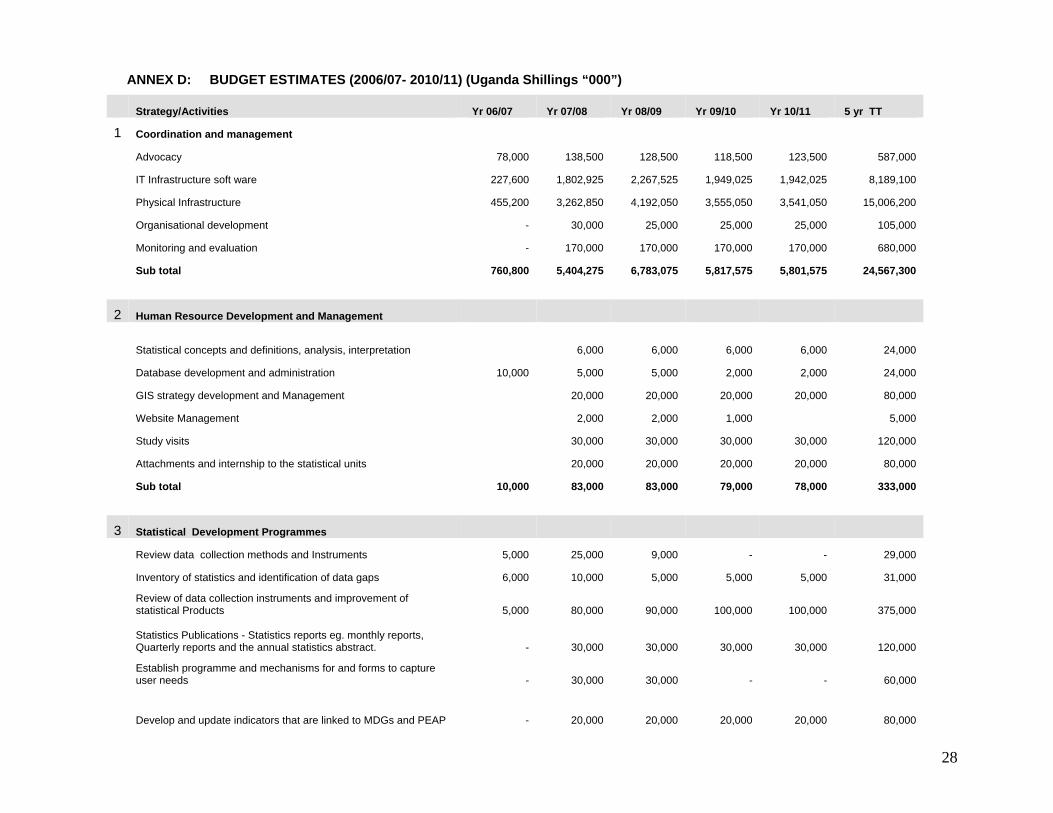
ANNEX D: BUDGET ESTIMATES (2006/07- 2010/11) (Uganda Shillings “000”)
Strategy/Activities Yr 06/07 Yr 07/08 Yr 08/09 Yr 09/10 Yr 10/11 5 yr TT
1 Coordination and management
Advocacy 78,000 138,500 128,500 118,500 123,500 587,000
IT Infrastructure soft ware 227,600 1,802,925 2,267,525 1,949,025 1,942,025 8,189,100
Physical Infrastructure 455,200 3,262,850 4,192,050 3,555,050 3,541,050 15,006,200
Organisational development - 30,000 25,000 25,000 25,000 105,000
Monitoring and evaluation - 170,000 170,000 170,000 170,000 680,000
Sub total 760,800 5,404,275 6,783,075 5,817,575 5,801,575 24,567,300
2 Human Resource Development and Management
Statistical concepts and definitions, analysis, interpretation 6,000 6,000 6,000 6,000 24,000
Database development and administration 10,000 5,000 5,000 2,000 2,000 24,000
GIS strategy development and Management 20,000 20,000 20,000 20,000 80,000
Website Management 2,000 2,000 1,000 5,000
Study visits 30,000 30,000 30,000 30,000 120,000
Attachments and internship to the statistical units 20,000 20,000 20,000 20,000 80,000
Sub total 10,000 83,000 83,000 79,000 78,000 333,000
3 Statistical Development Programmes
Review data collection methods and Instruments 5,000 25,000 9,000 - - 29,000
Inventory of statistics and identification of data gaps 6,000 10,000 5,000 5,000 5,000 31,000
Review of data collection instruments and improvement of statistical Products 5,000 80,000 90,000 100,000 100,000 375,000
Statistics Publications - Statistics reports eg. monthly reports, Quarterly reports and the annual statistics abstract. - 30,000 30,000 30,000 30,000 120,000
Establish programme and mechanisms for and forms to capture user needs - 30,000 30,000 - - 60,000
Develop and update indicators that are linked to MDGs and PEAP - 20,000 20,000 20,000 20,000 80,000
28
29
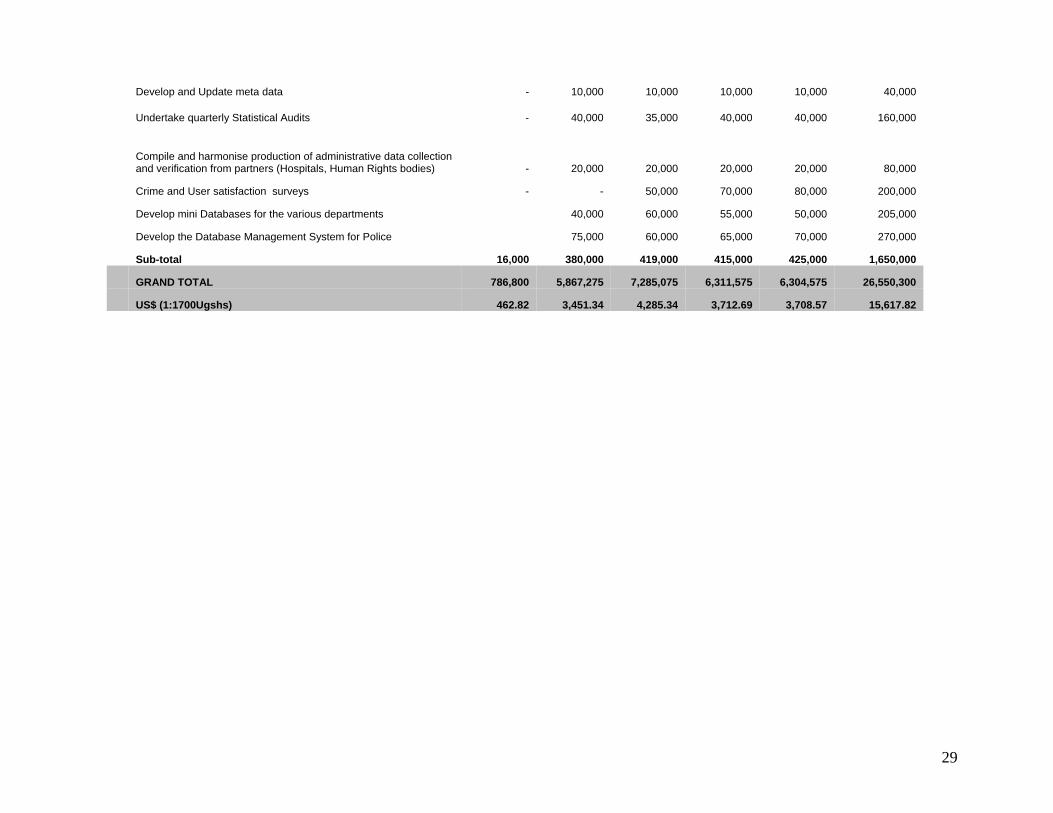
Develop and Update meta data - 10,000 10,000 10,000 10,000 40,000
Undertake quarterly Statistical Audits - 40,000 35,000 40,000 40,000 160,000
Compile and harmonise production of administrative data collection and verification from partners (Hospitals, Human Rights bodies) - 20,000 20,000 20,000 20,000 80,000
Crime and User satisfaction surveys - - 50,000 70,000 80,000 200,000
Develop mini Databases for the various departments 40,000 60,000 55,000 50,000 205,000
Develop the Database Management System for Police 75,000 60,000 65,000 70,000 270,000
Sub-total 16,000 380,000 419,000 415,000 425,000 1,650,000
GRAND TOTAL 786,800 5,867,275 7,285,075 6,311,575 6,304,575 26,550,300
US$ (1:1700Ugshs) 462.82 3,451.34 4,285.34 3,712.69 3,708.57 15,617.82
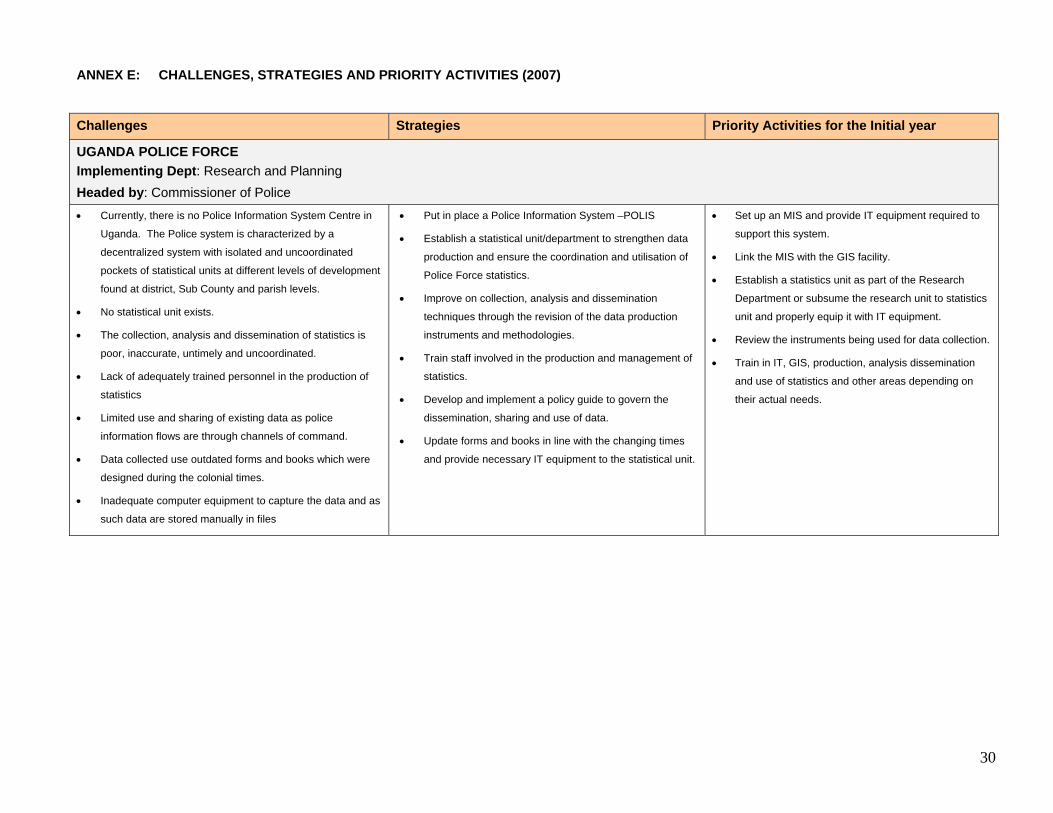
ANNEX E: CHALLENGES, STRATEGIES AND PRIORITY ACTIVITIES (2007)
Challenges Strategies Priority Activities for the Initial year
UGANDA POLICE FORCE Implementing Dept: Research and Planning Headed by: Commissioner of Police • Currently, there is no Police Information System Centre in
Uganda. The Police system is characterized by a
decentralized system with isolated and uncoordinated
pockets of statistical units at different levels of development
found at district, Sub County and parish levels.
• No statistical unit exists.
• The collection, analysis and dissemination of statistics is
poor, inaccurate, untimely and uncoordinated.
• Lack of adequately trained personnel in the production of
statistics
• Limited use and sharing of existing data as police
information flows are through channels of command.
• Data collected use outdated forms and books which were
designed during the colonial times.
• Inadequate computer equipment to capture the data and as
such data are stored manually in files
• Put in place a Police Information System –POLIS
• Establish a statistical unit/department to strengthen data
production and ensure the coordination and utilisation of
Police Force statistics.
• Improve on collection, analysis and dissemination
techniques through the revision of the data production
instruments and methodologies.
• Train staff involved in the production and management of
statistics.
• Develop and implement a policy guide to govern the
dissemination, sharing and use of data.
• Update forms and books in line with the changing times
and provide necessary IT equipment to the statistical unit.
• Set up an MIS and provide IT equipment required to
support this system.
• Link the MIS with the GIS facility.
• Establish a statistics unit as part of the Research
Department or subsume the research unit to statistics
unit and properly equip it with IT equipment.
• Review the instruments being used for data collection.
• Train in IT, GIS, production, analysis dissemination
and use of statistics and other areas depending on
their actual needs.
30
31
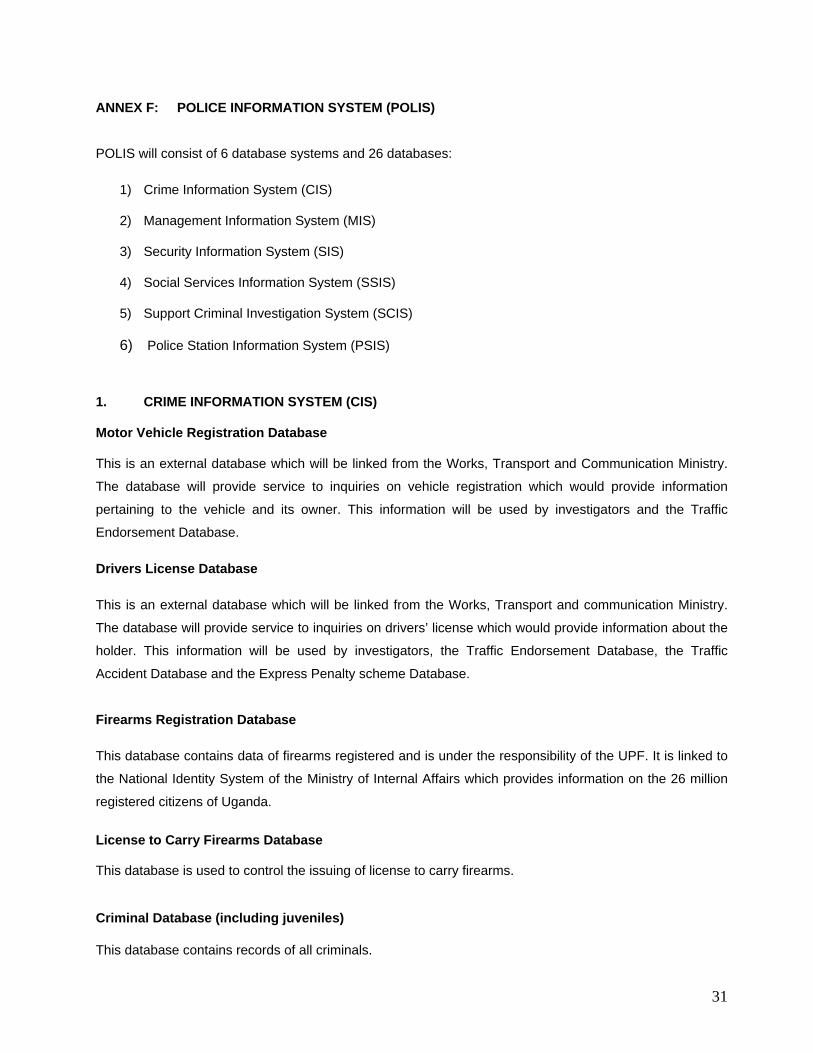
ANNEX F: POLICE INFORMATION SYSTEM (POLIS)
POLIS will consist of 6 database systems and 26 databases:
1) Crime Information System (CIS)
2) Management Information System (MIS)
3) Security Information System (SIS)
4) Social Services Information System (SSIS)
5) Support Criminal Investigation System (SCIS)
6) Police Station Information System (PSIS)
1. CRIME INFORMATION SYSTEM (CIS)
Motor Vehicle Registration Database
This is an external database which will be linked from the Works, Transport and Communication Ministry.
The database will provide service to inquiries on vehicle registration which would provide information
pertaining to the vehicle and its owner. This information will be used by investigators and the Traffic
Endorsement Database.
Drivers License Database
This is an external database which will be linked from the Works, Transport and communication Ministry.
The database will provide service to inquiries on drivers’ license which would provide information about the
holder. This information will be used by investigators, the Traffic Endorsement Database, the Traffic
Accident Database and the Express Penalty scheme Database.
Firearms Registration Database
This database contains data of firearms registered and is under the responsibility of the UPF. It is linked to
the National Identity System of the Ministry of Internal Affairs which provides information on the 26 million
registered citizens of Uganda.
License to Carry Firearms Database This database is used to control the issuing of license to carry firearms. Criminal Database (including juveniles) This database contains records of all criminals.
32
Crime Statistics Database This database is a collection of data of all criminal cases throughout the country for use in statistical
analysis, investigation and evaluation of efficiency in police operations.
Traffic Accident Database This database is a collection of data of all reported traffic accidents throughout the country for use in
statistical analysis in efforts to minimize the number of traffic accidents.
Lost Property Database This database is used to collect information on all reported lost items ranging from motor vehicles to
household items.
Missing Persons Database This database contains details of missing persons and will be linked to information relating to unidentified
bodies in the Coroner Database.
Arrest Warrant Database This database contains details of issued arrest warrants and will be automatically linked to other related
databases.
Ex-convict Database
This database contains details of criminals who have been released from prison. The information will be
provided to the respective jurisdiction of residence.
Fingerprint Database This database contains finger prints of all criminals and is linked to the Criminal Database.
2. MANAGEMENT INFORMATION SYSTEM (MIS)
Salary Database
This database contains salary records of every police officer and is linked to the Personnel Database.
Personnel Database
This database contains records of police officers and provides services to inquiries on personnel records
such as position appointments, movements, disciplinary actions, education, etc.
33
Planning and Budgeting Database
This database is used to provide trial balance sheet, check use of budget, control use of budget, used for
setting up budget for the following year and to manage an efficient use of the budget.
Logistic Database
This database is used to collect data relating to all equipment and supplies from the acquisition stage to
their registration, distribution, maintenance and withdrawal from registration. Examples include office
equipment, motor vehicle, communication equipment, firearms, land property and construction.
3. SECURITY INFORMATION SYSTEM (SIS)
Special Branch Database
This database contains secret data on persons suspected of breach of national security such as terrorism
and espionage.
International Criminal Database
This database contains data on foreigners who may commit crimes in Uganda or may be wanted by other
countries. This data is obtained from INTERPOL and direct requests from other countries.
Questionable Persons Database
This database contains secret data on persons suspected of criminal acts such as being involved in
organized crime, being hired assassins and drug dealers.
4. SOCIAL SERVICES INFORMATION SYSTEM (SSIS)
Traffic Endorsement Database
This is a central database for traffic endorsements and for Express penalty scheme.
Coroner Database
This database contains data on the unidentified bodies and records of autopsies.
5. SUPPORT CRIMINAL INVESTIGATION SYSTEM (SCIS)
Investigative System (I2)
34
This system will assist the investigating officers in their search for relevant information such as persons,
activities and property, by automatically linking with related databases. For example, a search for "Mr. X"
will invoke automatic searches in Criminal Database, Firearms Database, Missing Persons Database,
Arrest Warrant Database, and Ex-convict Database.
Other than this, Information to Image (I2) software is also used to provide graphical images of relationships
between persons and events, where events may be telephone numbers, vehicle registration or location.
This will lead investigators to the networking of gang operations.
Photograph Database
This database contains all graphical images related to other databases.
6. POLICE STATION INFORMATION SYSTEM (PSIS)
Police Station Management Database
This database contains all information needed to manage a police station, such as personnel, finance and
logistics. The information is used to prepare schedule of operations, control the use of budget and control
the use of police equipment.
Case Tracking Database
This database contains all the details of cases that occur in each police station's jurisdiction, such as case
number, date/time, type of offense, details of the injured party, investigating officer and outcome of the
case, and is linked to the Arrest Warrant Database, Stolen Property Database etc. This is used for keeping
track of cases through their judicial processes up to the final verdict.
Traffic Endorsement Database
This database contains on traffic endorsements issued by each police station and details of receipts
issued for fine payments. This is used for local management and for evaluating performance of each traffic
police officer.
Crime Prevention and Suppression Database
This database contains details of local suspected persons or persons with tendency towards mischief, such
as motorcycle taxi operators, local influential persons and local bullies.