Embed Size (px)
Citation preview

ÇUKUROVA UNIVERSITY
INSTITUTE OF NATURAL AND APPLIED SCIENCES
MSc THESIS
Ahmet ŞEKER
STATISTICAL ANALYSIS OF TRAFFIC ACCIDENTS IN GENDARMERIE ZONES OF TURKEY BETWEEN 2000 AND 2005
DEPARTMENT OF MECHANICAL ENGINEERING
ADANA, 2007

Not: Bu tezde kullanılan özgün ve başka kaynaktan yapılan bildirişlerin, çizelge, şekil ve fotoğrafların kaynak gösterilmeden kullanımı, 5846 sayılı Fikir ve Sanat Eserleri Kanunundaki hükümlere tabidir.
ÇUKUROVA ÜNİVERSİTESİ
FEN BİLİMLERİ ENSTİTÜSÜ
STATISTICAL ANALYSIS OF TRAFFIC
ACCIDENTS IN GENDARMERIE ZONES
OF TURKEY BETWEEN 2000 AND 2005
Ahmet ŞEKER
YÜKSEK LİSANS TEZİ
MAKİNA MÜHENDİSLİĞİ ANABİLİM DALI
Bu Tez 26/09/2007 Tarihinde Aşağıdaki Jüri Üyeleri Tarafından Oybirliği İle
Kabul Edilmiştir.
İmza: İmza: İmza:
Prof. Dr. Kadir AYDIN Prof. Dr. Abdulkadir EKŞİ Doç. Dr. Rızvan EROL
DANIŞMAN ÜYE ÜYE
Bu Tez Enstitümüz Makina Mühendisliği Anabilim Dalında Hazırlanmıştır.
Kod No:
Bu çalışma Çukurova Üniversitesi, Bilimsel Araştırmalar Projesi Birimi’nce desteklenmiştir.
Proje No : MMF2006YL32

I
ABSTRACT
MSc THESIS
STATISTICAL ANALYSIS OF TRAFFIC ACCIDENTS IN GENDARMERIE ZONES OF TURKEY BETWEEN 2000 AND 2005
Ahmet ŞEKER
DEPARTMENT OF MECHANICAL ENGINEERING
INSTITUTE OF NATURAL AND APPLIED SCIENCES UNIVERSITY OF ÇUKUROVA
Supervisor : Prof. Dr. Kadir AYDIN
Year: 2007, Pages: 115
Jury : Prof. Dr. Kadir AYDIN
Prof. Dr. Abdulkadir EKŞİ
Assoc. Prof. Dr. Rızvan EROL
The human factor in traffic accidents holds the first place in the distribution
of failure as the statistics about traffic accidents were analyzed. It is observed that
traffic accidents are not only limited by injuries and deaths, but also causes some
psychological illness of injured person and his/her relatives. Beside this, the loss
caused by traffic accidents to country’s economy is very huge and amount should not
be underestimated.
In this study; all types of available informations about traffic accidents in
Gendarmerie zones of Turkey between year 2000 and 2005 are collected from traffic
Agency Department of General Department of Gendarmerie. SPSS statistical
package computer program is used for the prosessing of the data. Regression and
correlation analyses are used to find degree of the relations between all possible
factors which effect the traffic accidents. Solutions for the decreasing of the traffic
accidents which cause many dead and injured people are proposed.
Keywords: The Gendarmerie region, traffic, traffic accidents, statistics.

II
ÖZ
YÜKSEK LİSANS TEZİ
TÜRKİYE’DE JANDARMA BÖLGELERİNDE 2000-2005 YILLARI ARASINDA MEYDANA GELEN TRAFİK KAZALARININ
İSTATİSTİKSEL ANALİZİ
Ahmet ŞEKER
ÇUKUROVA ÜNİVERSİTESİ FEN BİLİMLERİ ENSTİTÜSÜ
MAKİNA MÜHENDİSLİĞİ ANABİLİM DALI Danışman : Prof. Dr. Kadir AYDIN
Yıl : 2007, Sayfa Sayısı : 115
Prof. Dr. Kadir AYDIN
Prof. Dr. Abdulkadir EKŞİ
Doç. Dr. Rızvan EROL
Trafik kazaları ile ilgili istatistikler incelendiğinde, kazalardaki kusur
dağılımında insan faktörünün başta geldiği görülmektedir. Ülkemizde trafik
kazalarının neticesinin sadece ölüm ve yaralanmalarla sınırlı kalmadığı, trafik kazası
sonrasında mağdur ve yakınlarında psikolojik rahatsızlıkların da oluştuğu
gözlenmektedir. Bununla birlikte kazaların ülke ekonomisinde meydana getirdiği
kayıplar küçümsenmeyecek kadar büyüktür.
Bu çalışmada, 2000-2005 yılları arasında Türkiye’de Jandarma bölgesinde
meydana gelen kazalarla ilgili veriler Jandarma Genel Komutanlığı Trafik Şube
Müdürlüğü’nden alınmıştır. Bu verilerin analizinde SPSS istatistiksel analiz
programı kullanılmıştır. Regrasyon ve Kolerasyon analizleri kullanılarak trafik
kazalarına etki eden bütün faktörlerin arasındaki ilişkiler saptanmıştır. Birçok ölüm
ve yaralanmanın meydana geldiği trafik kazalarının azaltılmasına yönelik çözüm
önerilerinde bulunulmuştur.
Anahtar Kelimeler: Jandarma bölgesi, trafik, trafik kazaları, istatistik.

III
ACKNOWLEDGEMENTS
Initially, I am grateful to my supervisor Prof. Dr. Kadir AYDIN for his
extensive advice, guidance and encouragement throughout my thesis. I would like to
thanks to Gendarmerie Captain Murat TÜTÜNCÜ, especially by helping me to
achieve data, Research Assistants Mustafa ÖZCANLI, and technician of our
laboratory Cevdet YILDIRIM for their help and interests. Last but not least, my
special thanks to my family for their interests and supports.

IV
CONTENTS
PAGE
ABSTRACT.......................................................................................................... I
ÖZ.......................................................................................................................... II
ACKNOWLEDGMENTS..................................................................................... III
CONTENT…………………………………………………………………….... IV
NOMENCLATURE…………………………………………………………….. VIII
LIST OF TABLES……………………………………………………………… IX
LIST OF FIGURE................................................................................................. XI
1. INTRODUCTION............................................................................................. 1
2. PREVIOUS STUDIES...................................................................................... 3 3. TRAFFIC ACCIDENTS, REGULATIONS AND ORGANIZATIONS OF
TURKEY........................................................................................................... 6
3.1 Traffic Accident ...…………………………………………………. 6
3.1.1 Definitions.………………………………………………… 6
3.1.2 General Explanation of Faults.................................................. 7
3.1.2.1 Driver Faults................................................................... 7
3.1.2.2 Passenger Faults............................................................. 8
3.1.2.3 Vehicle Faults................................................................. 8
3.1.2.4 Pedestrian Faults............................................................ 9
3.1.2.5 Road Faults..................................................................... 9
3.2 Traffic Regulations.............................................................................. 10
3.3 Charged Units and Organization......................................................... 11
3.3.1 Present organization related to traffic....................................... 11
3.3.2 The Duties and Responsibilities of Ministries……………….. 13

V
3.4 Traffic Units in Charge in Turkey...................................................... 15
3.4.1 Councils in Charge.................................................................... 15
3.5 Charged Foundations and Institutions................................................. 15
3.5.1 General Security Chairmanship................................................ 15
3.5.2 Highway General Chairmanship............................................... 16
3.5.3 Ministry of Education................................................................ 17
3.5.4 Ministry of Health..................................................................... 18
3.5.5 Ministry of Transportation........................................................ 18
3.5.6 Ministry of Agriculture and Province Labor............................. 18
3.5.7 Ministry of Forest...................................................................... 19
3.5.8 Towns …………………………………………………........... 19
3.6 Commissions in Charge …………………………………………..... 20
3.6.1 City traffic commission ………………………………..……. 20
3.6.2 District Traffic Commission ……………………………..….. 21
3.7 People in Charge ………………………………………………...…. 21
3.7.1 Honorary Traffic Inspectors ……………………………….... 21
3.7.2 School passage officers …………………………………..…. 22
3.8 Traffic Policemen ………………………………………………..… 22
3.8.1 The organization of traffic policemen in Turkey ………...….. 22
3.9 Gendarmerie Organization in Traffic Services…………………....... 23
3.9.1 Traffic Teams ………………………………………………... 25
3.10 Traffic Policemen Organization in Europe ……………………...... 26
3.10.1 The Staff and Equipment of Traffic Policemen …………..... 27
3.11 Factors Affecting the Accidents ………………………………...… 28

VI
3.11.1 Weather conditions ……………………………………..….. 28
3.11.2 Human …………………………………………………...…. 30
3.11.3 Speed ………………………………………………….......... 31
3.11.4 Alcohol ………………………………………………...…… 34
3.11.5 Age, Gender and Education ……………………………...… 37
3.11.6 Psychology ……………………………………………...….. 39
3.11.7 First Aid ………………………………………………...….. 40
3.11.8 Unplanned Urbanization and Substructure ……………...…. 40
3.11.9 The Effect of Transporting Business …………………......... 41
3.12 Inspection and Security ………………………………………..…. 42
3.12.1 Traffic Inspection Procedures …………………………..…. 44
3.12.2 Technology in Traffic Inspections ………………………..... 48
3.12.3 Lack of Inspection ………………………………………...... 48
3.12.4 Other Preventions ………………………………………...… 49
3.13 Geographic Information System in Transportation …………...…... 49
3.13.1 Why Geographical Information System? ………………....... 50
3.13.2 Data Saving and Examination System on GIS …………...… 50
4. MATERIAL and METHOD……………….………….…………………....... 52
4.1 Material ………………………………………………………...…... 52
4.2 Method ……………………………………………………………... 66
4.2.1 Statistical Package for the Social Sciences (SPSS) …….……. 66
4.2.2 Regression Analysis (Reg.)………………...………………… 66
4.2.3 Correlation Analysis (Cor.)………………...………………… 67
5. RESULT AND DISCUSSION ……………………………………………… 69

VII
5.1. General Accident Data of Turkey………………………………….. 71
5.2. Correlation Analyses……………………………………………….. 89
5.3. Regression Analyses …………………………………………...….. 99
6. CONCLUSION................................................................................................. 104
REFERENCES...................................................................................................... 108
CURRICULUM VITAE ……………………………………………………….. 115

VIII
NOMENCLATURE
Corr. : Correlation
ECE : Economic Commission for Europe
GDH : General Directorate of Highways
GGC (TBD): Gendarmerie General Commandership, Traffic Branch Directorship
GIS : Geographical Information System
GPS : Geographic Place Systems
HCC : Highway Central Chairmanship
HGD : Highways General Directorate
HTL : Highways Traffic Law
HTR : Highways Traffic Regulations
IRTAD : International Road Traffic and Accident Database
N : Number of data
r : Relation (Correlation) Between Datasets
R : Correlation number
Reg. : Regression
SGD : Security General Directorate
SIS : State Institute of Statistics
SPSS : Statistical Package for the Social Sciences
TRL : Transportation Research Laboratory
TGNA : Turkish Grand National Assembly

IX
LIST of TABLES PAGE
Table 3.1. Present organizations related to traffic in Turkey………………………12
Table 3.2. Gendarmerie Traffic Section Administration establishment……………25
Table 3.3. Gendarmerie traffic team establishment………………………………....25
Table 3.4. Number of Traffic Personnel in Some Centres………………………..…27
Table 3.5. The equipment levels of Traffic establishments in Turkey……………..28
Table 3.6. Speed Limit for the Minimum Cost According to the Road Type……....32
Table 3.7. Speed and Alcohol Limits in Europe While Driving………………….....35
Table 3.8. Alcohol Quantity in Blood and Effects……………………………….…37
Table 3.9. Inspection intensity and changes in accidents…………………………..47
Table 4.1. Data of the Accidents in the Gendarmerie Zone in the year 2000 …….....52
Table 4.2. Data of the Accidents in the Gendarmerie Zone in Total……………….53
Table 4.3. Gendarmerie Zone Accident Data……………………………………….53
Table 4.4. Data of the Accidents in the Gendarmerie Zone in 2005……………….54
Table 4.5. Distribution of Operation Which Pertain To Gendarmerie Traffic
Teams According to Cities in Year 2005………………………………..54
Table 4.6. Fault Ratio of Occurred Accident According to Years…………………58
Table 4.7. Table 4.7. Distribution of Operation Which Pertain To Gendarmerie
Traffic Teams According to Cities in Year 2005………………………..55
Table 4.8. Traffic Accidents in Gendarmerie Traffic Commitment Region in
Year 2005………………………………………………………………...58
Table 4.9. Monthly Activities of Gendarmerie Traffic Teams in Year 2005………60
Table 4.10. Traffic Accidents in Gendarmerie Traffic Commitment Region in
Year 2005…………………………………………………………….…61
Table 4.11. Percentages of Motorized Vehicle, Population and Accident Numbers.62
Table 4.12. Accident number, Dead number and Injured number at Million
Vehicles………………………………………………………………....62
Table 4.13. Ratio of Automobiles in Some Country, 2003………………………....63
Table 4.14. Legal Speed Limit of Vehicles Which Are Obey in Turkey…….……..64
Table 4.15. Amount of Vehicle According to Years ……………………..………...65

X
Table 5.1. Police Region (Inside of City)…………………………………………..89
Table 5.2. Police Region (Outside of City)…………………………………………90
Table 5.3. Police Region (Total)……………………………………………………91
Table 5.4. Gendarmerie Region (Total)…………………………………………….92
Table 5.5. General Total (Police and Gendarmerie)………………………………..93
Table 5.6. Gendarmerie According to Cities……………………………………….94
Table 5.7. Gendarmerie According to Years……………………………………….97
Table 5.8. Estimate of Gendarmerie Region Accidents with Regression Analyze...99
Table 5.9. Estimate of Gendarmerie Region Deaths with Regression
Analyze………………...…………………………………………….…101

XI
LIST of FIGURES PAGE
Figure 4.1. Ratio of Transport……………………………………………………….63
Figure 5.1. Total Number of Accidents between years 2000 and 2005 in Turkey…71
Figure 5.2. Total Number of Dead between years 2000 and 2005 in Turkey……...72
Figure 5.3. Total Number of Injuries between years 2000 and 2005 in Turkey…...73
Figure 5.4. Total Years Amount of Material Damage between years 2000 and
2005 in Turkey……………………………………………………….....73
Figure 5.5. Number of Materially Damaged Accidents in Gendarmerie zones
of Turkey between years 2000 and 2005…………………………….…74
Figure 5.6. Total Number of Accidents between years 2000 and 2005 in
Gendarmerie zones of Turkey………………………………………......75
Figure 5.7. Numbers of Dead between years 2000 and 2005 in Gendarmerie
Zones of Turkey…………………………………………………….…..75
Figure 5.8. Number of Injuries in Gendarmerie zones of Turkey between
2000 and 2005………………………………………………………..….76
Figure 5.9. Number of Drivers Fined Gendarmerie Zones of Turkey between
2000 and 2005……………………………………………………..……77
Figure 5.10. Amount of Years Fines Applied in the Gendarmerie Zones
of Turkey Between 2000 and 2005………………………………..…...78
Figure 5.11. Number of Drivers Banned from Traffic in the Gendarmerie
Zones of Turkey between 2000 and 2005…………………………..….79
Figure 5.12. Number of Driver License Revoked in the Gendarmerie
zones of Turkey between 2000 and 2005...............................................80
Figure 5.13. Total Accidents Reasons in Gendarmerie Zones of Turkey Between
2000 and 2005…………………………………………………….……81
Figure 5.14. Number of Accidents in Gendarmerie Zones of Turkey in year 2005..82
Figure 5.15. Numbers of Dead in Gendarmerie Zones of Turkey in 2005…………83
Figure 5.16. Number of Injuries in Gendarmerie Zones of Turkey in 2005………..83
Figure 5.17. Amount of Material Damage in Gendarmerie Zones of Turkey
in 2005…………………………………………………………………84

XII
Figure 5.18. Fault Types of Faults Ratios in Gendarmerie Zones of Turkey
in 2005…………………………………………………………………85
Figure 5.19. Accident Numbers in big cities in Gendarmerie zones of Turkey
in 2005…………………………………………………………………85
Figure 5.20. Dead Numbers in big cities in Gendarmerie zones of Turkey in 2005..86
Figure 5.21. Injured Numbers in big cities in Gendarmerie zones of Turkey
in 2005…………………………………………………………………87
Figure 5.22. Amount of Material Damage in big cities in Gendarmerie zones
of Turkey in 2005……………………………………………………....87
Figure 5.23. Number of Driving Licenses revoked DUI in big cities in
Gendarmerie zones of Turkey in 2005…………………………………88
Figure 5.24. Number of Driving Licenses revoked in big cities in Gendarmerie
zones of Turkey in 2005……………………...………………………..88
Figure 5.25. Relationships between Total Vehicle (TV) and Total Accident
Number (TAN)…………………………………………………….....100
Figure 5.26. Relationships between Population (POP) and Total Vehicle
(TV)…………………………………………………………………...100
Figure 5.27. Relationships between Total Accident Number (TAN) and Amount
of Punished…………………..……………………………………......102
Figure 5.28. Relationships between Auto Number (AUTO) and Total Accident
Number (TAN)……………………………………………………......102

1. INTRODUCTION Ahmet ŞEKER
1
1. INTRODUCTION
In traffic accidents many people can be wounded, injured and died. This huge
problem occurs in Turkey and our country has to deal with these problems which
cause virtual and is about economical losses. More importantly; the cost of the ones
who died in accident is about $ 100,000 in some countries, but the life can not only
be measured because; psychological and sociological problems like nightmares, fear,
sleeping sicknesses and high suicide probability that the friends and relatives face
with weakens the societies mentally.
The general definition of traffic accidents is; “incidents including one or more
cars on the way causing death or injury or substantial damage”.
The components of a traffic accident are as follows:
a) Accident occurred in a street, on a main road open to traffic.
b) One or more people may have died, injured, or substantial damage may
have been taken in the accident.
c) The accidents need at least one moving vehicle.
The accidents caused by the components above include;
1) Crash of two vehicles.
2) The collision of people and vehicles.
3) The collision of vehicles and animals or fixed obstacles (SIS, 2005).
Traffic: The situation and movement of pedestrians, animals, and vehicles on
the road (Çakmak, 2000).
As it can be understood from the definition of the traffic; traffic has three
main components:
1-People, 2-Vehicle, 3-Road
According to the report of Research Commission of High National Council of
Turkey, shows that accident are caused mainly human fault and accidents in the
highways is in the third place in the order of death reasons (Zador, 2000). Our
country has one of the highest accidents in the world. For example, when compared
with developed countries, our country has the highest ratios (accidents per traffic
volume) of accidents and deaths (HTR, 1998).

1. INTRODUCTION Ahmet ŞEKER
2
The traffic accidents do not cause only deaths and injuries, but also create
psychological problems of relatives, and friends in Turkey (depression, fear,
digestion problems, feeling of revenge, loss of memory, etc), lack of job and
education success (28% of the injured people has decreased their efficiency at work,
14.4% changed his work), and relations with his friends and relatives effect badly
(10.2% of the injured ones’ relationships with their friends, 6.8% of the injured ones’
relationship with their family effected badly).
The accidents occurring in the highways have a characteristic to cause serious
health problems. A scientific questionnaire showed that 4% of the people whose
relative has died in a traffic accident and 7% of the people that got injured in a traffic
accident and his relatives and friends start using drugs, and 37% of the people whose
relative has died in a traffic accident and 17% of the people injured in a traffic
accident and his relatives and friends thought of attempting suicide (Darçın, 2002).
In a research conducted by World Bank, it is predicted that the socio-
economic cost of traffic accidents to Turkey is 2.1% of the total expenditure of
Turkey (This value is estimated in between 5 and 6 billion USD) (Darçın, 2002).
The main reason behind the increasing number of traffic accidents is the lack
of determining the real reason of the accident. The fact is a sorrowing reality an
unidentified problem can not be resolved. In our country it is believed that a traffic
accident can be caused by either vehicles or pedestrians; which prevent the
controlling of service and management systems. Even though driver faults are in the
first place in the order of faults, other reasons should not be ignored. Under these
circumstances, the purposes of this research are:
1- To take the data of the Gendarmerie zone into account and come up with
significant issues.
2- Analyze the reasons of the traffic accidents occurring in Turkey especially
in Gendarmerie zones, and indicate the precautions that should be taken in order to
prevent these accidents.

2. PREVIOUS STUDIES Ahmet ŞEKER
3
2. PREVIOUS STUDIES
Bağırgan (2006) studied “the traffic security estimation of intercity
highways”. In this study he evaluated by observing factors such that the geometric
features of highways, environment effect and speed causing traffic accidents on two-
lane undivided highways. A model, in which every variable are considered together,
is developed by using fuzzy logic approach. By developing this model, Black spots
caused by the highway geometric failure on the used two-lane undivided highways
are detected. Necessary precautions and determined possible accident regions during
the projectivization, construction and on the existent parts are proposed.
Bilim (2006) analyzed “determining of critical points and analyzing traffic
accidents in Konya inner-city”. Study consists of three stages. At first stages, the
traffic accidents statistics in inner-city of Konya between the years 2004 and 2005, at
second stage he made a survey to indicate the view point of Konya’s people to inner-
city traffic and traffic rules, at third stage some observations and analyses the reason
why in 10 places where the accidents happened most are analyzed. Some suggestions
by giving necessary actions in order to decrease the traffic accidents in these 10
regions are given.
Tuncuk (2004) studied “Isparta case: Traffic accident analyses via
geographical information system”. The intensive accident happened points and
accident black spots are determined via geographical information system (GIS). The
black spots and possible accident regions on the digitalized planning map of the
province Isparta by using the program Arcinfo 7.21 are shown. A database by the
fact-finding reports of traffic accidents during the years 1998-2002 taken from the
Traffic District Office of Isparta is developed. A topology by using collision
diagrams of traffic accidents and geographical coding reference systems is
developed. The black spots on the intersection of streets of cross roads and the
number of accidents by giving charts are shown. Tables from the derived results and
interpreted them are constructed.
Yaşatır (2006) studied “The problems of Gendarmerie Municipal Police about
driver during working and the proposals to this problem”. The main aim of studying
2. PREVIOUS STUDIES Ahmet ŞEKER
4
this thesis is to make general view of traffic psychology, in order to prevent
accidents, which still exists as a problem in most of other countries especially Turkey
and give solutions to the problems that Gendarmerie Municipal Polices faced with.
To indicate and gave suggestions to the problems that Gendarmerie Municipal Police
faced with by a survey and statistical study are tried. Especially by the survey, he
tried to display the relation between Gendarmerie Traffic team and driver, the traffic
psychology of driver, the traffic management of Gendarmerie Traffic team and of
human relations.
Mirasyedi (2006) analyzed “the analysis of effects of seasons on traffic
accidents in Turkey and accident estimation models”. The main factors that affect
humans in the view of traffic accidents as, the geometric feature of way, volume of
traffic, population density, and vehicle feature, visibility range of driver, reaction
time and weather condition are introduced. All factors except weather can be
considered as numerical variable and weather condition can be considered as a non-
numerical independent variable. In his thesis he researched the effects of seasons, as
an independent non-numerical variable, to the numbers of injuries and deaths in
accidents. By expanding the scope of the study he searched some social factors
beside weather. Models by deriving benefit from the statistics of traffic accidents in
Turkey between years 1978-2003 with multiple regression analysis are introduced.
Finally he got the results “Injured number – Accident number” curves by using the
past 26 years’ data for each season.
Darçın (2002) studied the analysis of “How to make controls in order to
reduce the number of accidents in the responsible areas of Gendarmerie”. The
Gendarmerie traffic supervision activity and also gave information about the units
that are related with the traffic security are searched. On the education skills
technical equipment, organization and personnel and supervision units of
Gendarmerie on the field of traffic security are emphasized. He compared Turkish
Gendarmerie and other countries on the skills of supervision, technical equipment,
and appliance. Suggestion about encountering methods and legal regulations and
mentioned drunk-driving and excessive speeding are given.

2. PREVIOUS STUDIES Ahmet ŞEKER
5
Hisar (2004) studied “A study on the necessary precautions in order to reduce
traffic accidents and reasons of accidents in Turkey”. By the statistical data, on the
driver failure that is the biggest proportion in the traffic accidents are emphasized.
Solutions to the issues mentioned supervision activities, substructure condition of
Turkey and other countries, technological beneficial conditions and health and first
aid are given.

3. TRAFFIC ACCIDENTS, REGULATIONS AND ORGANIZATIONS OF TURKEY Ahmet ŞEKER
6
3. TRAFFIC ACCIDENTS, REGULATIONS AND ORGANIZATIONS OF
TURKEY
3.1. Traffic Accidents
3.1.1. Definitions
Traffic is an Italian originated word. It passed to our language from French. It
is expressed "Traffikco” in Italian and “Trafic” in French. The corresponding word
in Ottoman language is “Seyrüsefer” (coming and going).
Traffic is mainly means transportation and transportation includes the
conditions and movements of vehicles, pedestrians, and animals by train in railroads,
by plane in air, by ship in sea, and by vehicle on highways.
Specifically the definition of traffic is the union of rules regulating the
movement of vehicles, pedestrians and animals (Larousse Encyclopaedia).
Traffic; is the situation and movement of pedestrians, animals, and vehicles
on the road (Çeliker, 1998). Therefore 3 main elements are involved in the traffic
which are;
-People,
-Vehicle,
-Road.
People: Traffic’s most important element is people. It is separated into three
branches; driver, pedestrian and passenger. If the fault percentages are analyzed, it
can be easily seen that the people is in the first place.
Road: Nearly everyday, we are reading from newspapers and watching from
television the daily accidents. The major part which can not be neglected could be
listed as spoiled roads, gaps insufficient substructures, narrow roads, etc. If the
priorities are not set and importance is not given, many more lives will be lost on
these roads everyday. As a result for the safety of people the roads should be at
optimum condition.

3. TRAFFIC ACCIDENTS, REGULATIONS AND ORGANIZATIONS OF TURKEY Ahmet ŞEKER
7
Vehicle: One of traffic’s elements is vehicle. Today automobile industry is
growing rapidly and manufacturing new car models. With the developing technology
today, many cars are manufactured towards the needs of the era. Although these facts
exist, many old cars which can not reach the requirements are still in use. These
inadequate cars should be banned from traffic since they are a part of fault reasons.
Moreover required regulations should be made and the cars who reach the standards
should be allowed to be used in traffic.
3.1.2. General Explanation of Faults (Çakmak, 2000).
3.1.2.1. Driver Faults
Essential Faults:
1- Not stopping in red lights or stop sign of the officer in charge.
2- Entering roads that have the no entrance sign or entering the opposite road,
conjunction or ramp where the roads are double tracked.
3- Entering the opposite road where the road has double or more track.
4- Crashing from the backside.
5- Passing from areas having trespassing prohibition.
6- Lack of maneuver when changing direction.
7- Violating a track.
8- Violating the passing priority at junctions.
9- Violating the priority rule where the coating is narrow.
10- Violating the general conditions regulating the maneuvers.
11- Parking or stopping in highways outside the settlement area when it is not
obligatory, and not taking the necessary precautions.
12- Crashing to vehicles that have parked in parking lots or properly parked
outside highways.

3. TRAFFIC ACCIDENTS, REGULATIONS AND ORGANIZATIONS OF TURKEY Ahmet ŞEKER
8
Secondary Faults:
1- Not stopping at the stop sign.
2- Loading and unloading passengers or load in a place or form prohibited.
3- Carry passengers in a place or form prohibited.
4- Continuing to travel with a vehicle which is not proper to traffic.
5- Driving a vehicle in a sleepy, exhausted, ill or absent-minded condition.
6- Not using the dimmer switch or short headlights in an approach.
7- Not having a reflector in the vehicle.
8- Not having a pulling rope, wooden wedge or chain.
9- Driving a car drunk.
10- Driving a car over speed limits.
3.1.2.2. Passenger Faults
1- Hanging out from the vehicle.
2- Mount on or off without informing.
3- Moving in the vehicle improperly.
4- Traveling outside the car (mudguard).
5- Jumping out from a moving a car.
6- Passenger being ill.
7- Passenger being drunk.
8- Traveling on an open load or improperly and dangerously.
3.1.2.3 Vehicle Faults
1- Broken brakes.
2- Broken rod.
3- Broken spring.
4- Broken tire.
5- Broken shaft.
6- Broken headlights.

3. TRAFFIC ACCIDENTS, REGULATIONS AND ORGANIZATIONS OF TURKEY Ahmet ŞEKER
9
7- Other light problems.
8- Broken door.
9- Broken window cleaner.
10- Broken horn.
11- Deflation of tire.
12- Breaking of the axle.
13- Failure in gear-shift system.
14- Broken steering-wheel.
3.1.2.4. Pedestrian Faults
1- Passing at red light.
2- Violating the vehicle priority when passing.
3- Appearing on the road suddenly.
4- Appearing on the back or the front of a stationary vehicle.
5- Sitting, playing or lingering on the road.
6- Hanging over a moving vehicle.
7- Pedestrian being drunk.
8- Pedestrian being blind.
9- Pedestrian being deaf.
10- Pedestrian entering the highway.
3.1.2.5. Road Faults
1- Collapse of bridge.
2- Collapse of a road.
3- Low banquet.
4- Loose equipment on the road.
5- A gap on the road.
6- Lack of sign.
7- An obstacle on or near road that reduces sight.

3. TRAFFIC ACCIDENTS, REGULATIONS AND ORGANIZATIONS OF TURKEY Ahmet ŞEKER
10
8- Dangerous inclination.
3.2. Traffic Regulations
Active laws, regulations and instructions related to Traffic in Turkey are
shown below:
A) Laws
1- Highway Law Number 2918.
2- Law of Communication Control on Highways Number 1593.
3- Vehicle Law Number 237.
4- Law of Carrying on Highways Number 4925.
B) Regulations
1- Highway Traffic Regulation.
2- Highway Transportation Regulation.
3- Regulation about Traffic Signs.
4- Regulation about any indicator, sign, light that will inform about traffic
security, road construction that will be on or near the highways.
5- Regulation about the any establishment that will be opened or built near the
highway.
6- Regulation about the banning the advertisement on commercial vehicles.
7- Regulation about the montage, manufacture, and modification of any vehicle.
8- Regulation about the transportation of toxic substances on highways.
9- Highway Traffic Insurance Guarantee Account Regulation.
10- Regulation about the fine collection procedure.
11- Vehicle Driver Course Regulation.
12- Improvement of Traffic Services Fund Regulation.
13- Commercial Vehicle Driving Certificate Regulation.
14- Commercial Vehicle Driving Certificate Education and Examination
Regulation.
15- Honorary Traffic Inspection Duty and Labor Regulation.
16- Auto Park Regulation.

3. TRAFFIC ACCIDENTS, REGULATIONS AND ORGANIZATIONS OF TURKEY Ahmet ŞEKER
11
17- Regulations about the transportation of passengers between cities on
highways.
18- Regulations about the international transportation of passengers on highways.
19- Control of Toxic Waste Regulation.
20- School Bus Service Regulation.
21- Highway Security High Council’s Establishment, Duty and Labor Regulation.
22- Central Chairmanship of Traffic Service and Provincial Traffic Foundation
Duty and Labor Regulation.
23- Central Chairmanship of Traffic Research Establishment, Duty and Labor
Regulation.
24- Regulation about the montage and application of parts used in vehicles with
tires.
25- Trailer an Vehicle Qualification Type Regulation.
26- Vehicle Regulation on Agriculture or Woods Qualification Type Regulation.
27- Qualification Type Regulation of Vehicles with two or three tires.
C) Instruction GGI: 27-2 Gendarmerie Traffic Service Instruction (used by
Gendarmerie General Commandership)
3.3. Charged Units and Organization (Darçın, 2002)
3.3.1. Present Organization Related to Traffic
Present organizations scheme related to traffic in Turkey is summarized in the
table which shown below:

3. TRAFFIC ACCIDENTS, REGULATIONS AND ORGANIZATIONS OF TURKEY Ahmet ŞEKER
12
Table 3.1. Present organizations related to traffic in Turkey (Swe Road, 2001) Association Area of Responsibility
Parliament Laws
Budget
Government
• Government Planning
Organization
Sector investment plan for periods of 5 years and one
year.
Ministry of Internal Affairs
• Security General Directorate
• Gendarmerie
Application and inspection of laws
Registration of vehicles.
Delivering driver certificates
Accident statistics
Reporting the traffic accidents and violations.
Ministry of Development and in habit
• Highway Central Chairmanship (HCC)
Acknowledge the necessary regulations and indications on
the highways it is responsible from.
Applications related to signs and indications.
The convenience of establishments’ aside the road.
Periodic vehicle inspection
The stationary and mobile control of vehicle weight.
Ministry of Education
Regulations related to driver courses and distribution of
driver certificates.
Education before school, primary education and high
school education.
Inform the public
Ministry of Health Applications related to first aid, therapeutic and
rehabilitation.
Ministry of Industry and Trade Approval of Vehicle Types
Ministry of Transportation Regulations and applications (including coordination)
about transportation.
Ministry of Forest Regulations related to forest roads.
Ministry of Government
General Chairmanship of Province Services Application related to province roads.
Ministry of Justice Acquiring the needed help to revise the law.
Cities
• State traffic commission
• Administrative district traffic commission
City traffic security issues.
Towns
• Town traffic units Town traffic security issues

3. TRAFFIC ACCIDENTS, REGULATIONS AND ORGANIZATIONS OF TURKEY Ahmet ŞEKER
13
Ministry of Finance is responsible from collecting some of the fines.
Besides, there are some private organizations dealing with the traffic security;
1- Turkey Driver and Automobile Owners Federation.
2- Automobile Industry Association.
3- Preventing Traffic Accidents Association.
4- Traffic Accident Aid Association.
3.3.2. The Duties and Responsibilities of Ministries and Organizations
Ministry of Internal Affairs - General Chairmanship of Security and
Gendarmerie General Commandership:
1- Application of rules (traffic control and inspection).
2- Application and inspection of laws.
3- Registration of vehicles, delivering driver certificates.
4- Actions needed to create a secure zone for people other than the ones having the
accident (reporting the traffic accidents and violations are included).
5- All the statistics related to registration of vehicles, driver certificates, and
accidents.
6- Informing the public.
Ministry of Development and Inhabit-Highway Central Chairmanship (HCC):
1- Acknowledge the necessary regulations and indications on the highways it is
responsible from.
2- Applications related to signs and indications.
3- Decisions related to standardization of signs.
4- The convenience of establishment aside the road (gas station and lighting
systems).
5- Periodic vehicle inspection.
6- The stationary and mobile control of vehicle weight.

3. TRAFFIC ACCIDENTS, REGULATIONS AND ORGANIZATIONS OF TURKEY Ahmet ŞEKER
14
Ministry of Education:
1- Regulations related to driver courses and distribution of driver certificates.
2- Public traffic education at before school, primary school and high school.
3- Informing the public
Ministry of Health:
• Regulations related to first aid and inspection afterwards, and medical
applications and rehabilitation.
Ministry of Industry and Trade:
• Approving vehicle types.
Ministry of Transportation:
• Coordination of transportation (publishing regulations related to transportation
sector).
Ministry of Forest:
• Traffic regulations related to forest roads.
Ministry of Government-General Chairmanship of Province Services:
• Traffic regulations related to province roads.
Ministry of Justice:
• Acquiring the needed help to revise the law.
Towns:
• The application and regulation of maintaining the conditions of highways which
is related traffic security.

3. TRAFFIC ACCIDENTS, REGULATIONS AND ORGANIZATIONS OF TURKEY Ahmet ŞEKER
15
3.4. Traffic Units in Charge in Turkey (Darçın, 2002)
3.4.1. Councils in Charge
To identify the goals, apply and coordinate these goals rules below are made.
Highway Security High Council:
This council is lead by the Prime minister and includes, Ministries of Justice,
Internal Affairs, Finance, Education, Development and Inhabit Industry, Health,
Transportation, Forest and the ministry which Province Service is bound to,
Gendarmerie General Commandership, Prime minister Government Planning
Councilor, Chairman of General Security and Highway General Chairman. If
required, other ministries are also invited (HGD, 1998).
High Council of Highway Security decides with the help of chosen suggestions
from Council of Traffic Security which is prepared by Traffic Service Chairmanship.
The council is gathered once in two years or when the prime minister’s request. The
duty of the secretary is done by General Security Chairmanship.
3.5. Charged Foundations and Institutions
3.5.1. General Security Chairmanship
The duties given by Highway Traffic Rules to General Security Chairmanship
is executed Traffic Service Chairmanship which is related to General Security
Chairmanship. The Chairmanship of Traffic Service is run by General Security Vice
President. General Security Chairmanship central region, city and county traffic
police is bounded to Traffic Service Chairmanship.
Applications about vehicles and drivers, distributing license plate and its
certificates and any activity towards these services are done in registered bureaus
which are in necessary places in towns and cities.

3. TRAFFIC ACCIDENTS, REGULATIONS AND ORGANIZATIONS OF TURKEY Ahmet ŞEKER
16
Security services, apart from their personnel could work with hire other
personnel up to the number in the decided staff amount at registered sections or
bureaus.
General Security Chairmanship’s duties and authorities related traffic;
1- Inspect the proper ness of vehicles, necessary certificates and equipments,
drivers and certificates belonging to them, drivers and other people’s conditions,
and inspect the convenience of regulations and some establishment’s to laws.
2- Control the stationary and mobile traffic.
3- Conducting a report for the accidents it has laid hands upon.
4- Reporting about the ones who have violated traffic rules, do the necessary
applications and inspect the further applications.
5- Help to achieve the necessary conditions for the injured people and
communicate with their relatives.
6- Register vehicles and distribute the license plates.
7- Distribute the driver licenses.
8- Make the judicial record of vehicles and drivers, process the technical and legal
alteration, gather the statistical data and evaluate them.
9- Gather and evaluate the reasons for the traffic accidents and their statistics
including all the issues, and take the necessary precautions and report to the
establishments according to the result.
10- Provide the necessary information and documents to fasten the payment of
damage indemnity.
11- Apply other regulations given by Highway Traffic Law (HTR, 1998).
3.5.2. Highway General Chairmanship
The duties and authorities of Highway General Chairmanship are these;
1- To provide and maintain the necessary precautions and signs for life and
property security.
2- Stabilize, provide and control the signing standards on all highways.
3- Approve and analyze projects related to highway security, and publish ideas for
3. TRAFFIC ACCIDENTS, REGULATIONS AND ORGANIZATIONS OF TURKEY Ahmet ŞEKER
17
traffic and vehicle technique.
4- Determine and highlight the over and below values for the speed limits on the
roads which it is responsible from.
5- Provide the necessary data according to the reasons of accidents and take the
required precautions to prevent new accidents.
6- Build bus stops, parking lots, lighting systems, junction and etc on the roads
which it is responsible from.
7- Improving the physical condition of the road and taking the necessary
precautions as a result of reports conducted from officers in charge, and accidents
occurred.
8- Weighing the vehicles and reporting any violation about the rules.
9- Testing or sending to examination the registered cars and any violation of
Highway Traffic Law (item number 13), protection of highway structure and
traffic signs (item number 14), other signs, lights and indications on or beside the
road (item number 16), any structure or establishment beside the road outside the
county (item number 17), any structure or establishment beside the road in the
county (item number 18), establishments authorized for examination (item
number 35), acknowledging the warnings of the officer in charge for regulation
and inspection of traffic (item number 47/a), loading of vehicles (item number
65), reporting anyone whose violating the rules, obeying the traffic lights, signs,
rules and obligations (item 47/b,c,d) and report and hand over anyone to the
nearest place for the application of the necessary process if there is a violation
(HTR, 1998).
3.5.3. Ministry of Education
Ministry of Education has the following responsibilities;
1- Education of vehicle drivers, opening driver courses and letting private courses,
and controlling them.
2- Making the examination of the ones educated in private and official courses, and
handing certificates to the successful ones.

3. TRAFFIC ACCIDENTS, REGULATIONS AND ORGANIZATIONS OF TURKEY Ahmet ŞEKER
18
3- Arranging the general traffic education plan for inside and outside the school
and applying this plan with the help of necessary establishments.
4- Requesting an obligatory first aid and traffic lessons at the primary and high
schools.
5- Determining the essential authorities and rules of building, opening and
inspection of children traffic education parks.
3.5.4. Ministry of Health
Planning and applying the first aid related to the accidents on the highways,
providing a health service to the injured people in the shortest time. Building first aid
stations with the approval of Ministry of Internal Affairs and Highway general
Chairmanship, recruiting the required personnel, equipment for these stations, and
having enough first aid and emergency ambulances and personnel for each city are
the duties of the Ministry of Health (GDH, 1998).
3.5.5. Ministry of Transportation
Making the required regulations and laws according to the negotiations
between two or more countries even though these are secret, taking precautions and
coordinating the highway transportation according to Highway Traffic Rules and
regulations related to these rules (GDH, 1998).
3.5.6. Ministry of Agriculture and Province Labor
Taking the necessary precautions on province roads for order and security,
observing the projects related to road security about junctions, bus stops, parking
lots, lighting and similar systems and approving the necessary ones; letting the
establishment of structures providing connection to other roads, taking the necessary
precautions according to the reports of the officers and analyze of traffic accidents
are the responsibilities of Ministry of Agriculture and Province Labor (HTR, 1998).

3. TRAFFIC ACCIDENTS, REGULATIONS AND ORGANIZATIONS OF TURKEY Ahmet ŞEKER
19
3.5.7. Ministry of Forest
The duty of the Ministry of Forest is to put signs as a precaution on necessary
forest roads and on main forest roads which are important for the order and safety of
traffic.
3.5.8. Towns
In towns, town traffic department chairmanship, town traffic chief, and town
traffic official post are established according to the capacity of work and service by
Ministry of Internal Affairs.
In bigger cities traffic bureau authority is build which are bounded to town
traffic department chairmanship.
In these units, the number of technical and departmental personnel number is
determined by the chairman of the town.
To maintain their work related to traffic by obeying the decisions of City and
County Traffic Commissions, and coordinating with the town traffic policemen. The
authorities and the responsibilities of town traffic services are these;
1- Maintain the road structure to have the required traffic order and security in the
town.
2- Construct road and junction.
3- Provide necessary traffic signs, lighting systems, indicators and the continuity of
the functioning of these equipments.
4- Ease the traffic flow, and have a systematic chart for the buses’ transportation
times to minimize the unnecessary stopping time.
5- Taking the necessary precautions for the security and order of the traffic in a
construction on the road.
6- Build, and run parking lots, high and low passages.
7- Approving the construction of new establishments aside the road according to
requirements.
8- Constructing children traffic parks to take part in the education of the

3. TRAFFIC ACCIDENTS, REGULATIONS AND ORGANIZATIONS OF TURKEY Ahmet ŞEKER
20
public.
9- Removing any obstacle other than parked vehicles that is making the traffic flow
difficult, indicating the obstacles that can be removed so that it can be easily seen
day and night.
10- Taking the precautions where there is an accident because of the insufficient
indication or road structure.
11- Register any vehicle that has no engine if necessary except the ones used on the
agriculture sector.
Towns can not inspect or report of any other situation if it is not included in
the above services (HTR, 1998).
3.6. Commissions in Charge
3.6.1. City Traffic Commission
City traffic commission has Town, Security, Gendarmerie, Education, Turkey
Driver and Highway Federation plus any university, bureau, foundation and civil
association that is approved by the Province as participants (HTL, 1998).
The number of participants of any university, bureau, foundation and civil
association that is approved by the Province can not be more than three in the
commission. Current topics are decided by the governor of province. Decisions are
set by vote numbers. If the votes are equal the decision is made on the side of the
president of the commission.
The decisions of City Traffic Commission are made effective by the approval
of the governor of province. If the commission is lead by the governor of province
there is no need to take an approval.
Duties and Authorities;
1- Taking the necessary precautions to achieve the security and order of the traffic
in the city.
2- Taking the related precautions and improving services to achieve a convenient
traffic flow, and reporting anything that may be related to the country to Ministry

3. TRAFFIC ACCIDENTS, REGULATIONS AND ORGANIZATIONS OF TURKEY Ahmet ŞEKER
21
of Internal Affairs.
3- Determining convenient place and number for commercial vehicles for traffic
order and security, while the laws of highway transportation is kept secret.
To approve the construction for lands which are convenient for establishing
parking lots, and to let the establishments run by other investors (HTR, 1998).
3.6.2. District Traffic Commission
District Traffic Commission has the City Traffic Commission’s administrator
members or charged representatives as participants, and is gathered according to the
conditions and needs of the district (HTL, 1998).
The authority and duty of the district commission is decided by City traffic
Commission and approved by the governor of province.
3.7. People in Charge
3.7.1. Honorary Traffic Inspectors
People who are suggested by Highway Traffic Council and approved by
Highway Traffic High Council to help the people who are responsible from the
inspection of drivers and their properness to traffic rules are put to duty as honorary
traffic inspector by the governor of province.
The qualifications of honorary traffic inspectors are as follows:
• To be a Turkish citizen.
• To be at least 40 years old.
• To be graduated from a university.
• To have a drivers license at least for ten years.
• Not to be a direct responsible of a traffic accident.
• Not to have lost the driver license because of losing 100 points by
traffic rules violations in the 5 year period after the application.
• Not to be banned from public service.

3. TRAFFIC ACCIDENTS, REGULATIONS AND ORGANIZATIONS OF TURKEY Ahmet ŞEKER
22
• Not to have a criminal record.
The number of inspectors is determined by the one of the thousand of
vehicles in the city, but the number may be increased according to the socio-cultural,
tourist, economic and similar levels of the city if requested by the governor of the
province (VTIDOR, 1998).
3.7.2. School Passage Officers
These are the officers with uniforms and necessary indicators and approved by
the traffic policemen, they are charged to secure the flow of traffic in front of the
primary and high school exits.
All drivers should obey the indications and commands of anyone who has the
approved documentation by Security Chairmanship and writing “school passage
officer”.
3.8. Traffic Policemen
3.8.1. The Organization of Traffic Policemen in Turkey
The main duty of traffic policemen is to carry out the traffic services. Traffic
policemen are obliged to carry out the service of policemen in an emergency
condition.
Except obligatory conditions caused by security and order, traffic policemen
are not expected Civil Management Chief to carry out policemen services, and traffic
policemen can not use the equipments and vehicles given for personal use (HTL,
1998).
In places where the number of traffic policemen is insufficient, other
policemen or in areas outside the duty zone of traffic organization officers or low
ranked officers trained in traffic education may be obliged to carry out the traffic
services and report any violation (HTL, 1998).
In Turkey the policemen are branched into three main sections; judicial,

3. TRAFFIC ACCIDENTS, REGULATIONS AND ORGANIZATIONS OF TURKEY Ahmet ŞEKER
23
administrative, political. Other than these groupings policemen is branched into two,
Traffic Policemen and Agile Force Policemen. In Turkey, there are 16,380 traffic
policemen (12% of the total number of policemen) (Akçay, 1998).
Police has been organized to traffic inspection departments, traffic registration
departments, traffic department administrative and some organization based on this,
and road service throughout the country other than organization under the name
Traffic Services Chairmanship. Gendarmerie has not been fully cooperative with
police organizations in traffic because of change in Highway Traffic Law number
2918 (Darçın, 2002).
3.9. Gendarmerie Organization in Traffic Services
The highways which Gendarmerie or policemen will be responsible from is
determined by protocol made by a commission lead by governor of the province.
While this protocol is made Gendarmerie receives the areas where policemen
has no control over them, and other areas are given to policemen.
In places where the number of traffic policemen is insufficient, other
policemen and in areas outside the duty zone of traffic organization, officers or low
ranked officers trained in traffic education are obliged to carry out the traffic services
and report any violation (HTL, 1998).
The duties, authorities, qualities and qualification requirements of traffic
services of Gendarmerie Organization are determined by General Gendarmerie
Commandership.
The personnel in charge of traffic service has to inspect the drivers and
vehicles, take over any accident, provide the flow of traffic and first aid services,
inspect the establishments like gas stations according to the rules as responsibilities
(HTR, 1998).
Duty and Authority
The personnel in charge of traffic service who is obliged to inspect the drivers
and vehicles, take over any accident have the following responsibilities (Highway
Traffic Regulations/ Item number 9);

3. TRAFFIC ACCIDENTS, REGULATIONS AND ORGANIZATIONS OF TURKEY Ahmet ŞEKER
24
a. To check the necessary licenses and equipments of a driver and his vehicle,
and inspect the conditions of drivers and passengers conditions, plus regulation and
control of the flowing traffic on roads where he is responsible.
b. Take over any traffic accident, examining the total conditions leading to
the accident, determining the evidences for statistics and criminal operations.
Conducting the report based on the facts examined.
c. If the road is closed because of an accident, indicating any evidence so that
they will not disappear, taking the necessary precautions for traffic security.
d. In traffic accidents resulted in deaths or injuries, applying the first aid
techniques to these people, and taking these people to the nearest health centre if
possible or, providing an ambulance to come to the accident area.
e. Inspecting the gas stations and health equipments they should have
according to the laws, checking the required equipments in the cars, and reporting
any of the violation in these situations.
f. Examining the reasons of traffic accidents, taking the precautions according
to the result, and informing the needed facility if required.
g. Reporting any violation of driver according to the Highway Traffic Law,
handing over the necessary documents to the courts in 7 working days and providing
the necessary documentation in 7 days to the required department in a traffic
punishment fine.
h. Sending the report in an unregistered license plate event to traffic
policemen department in charge or to City Traffic Establishment by the 116th law.
i. Taking the necessary precautions provided by the laws in a nation or
international race if it is under the responsibility zone of the Gendarmerie.
j. Helping to determine the specific borders of duty zone and coordinating
with the traffic policemen if needed, providing suggestions to civil administrative,
and obeying the protocols set by these actions.
k. Creating daily, weekly and monthly programs to maintenance of security
and order on the road where it is responsible from according to national and religious
festivals, important dates, days of the week, tourism periods etc.
l. Taking the necessary precautions for some people, association or

3. TRAFFIC ACCIDENTS, REGULATIONS AND ORGANIZATIONS OF TURKEY Ahmet ŞEKER
25
foundation in a construction on the road according to the Highway Traffic Law,
removing any obstacle that is created throughout the construction, reporting any
violation.
m. Reporting any failure in the indication panels, signs, and similar traffic
equipment outside the network Highway General Chairmanship to the necessary
departments.
n. Plus, carrying out any duty given to Gendarmerie by Highway Traffic Law.
3.9.1. Traffic Teams
Traffic Section Administrations and Traffic Teams are established in order to
take over traffic crime under the name of Gendarmerie Commanderships.
Table 3.2. Gendarmerie Traffic Section Administration establishment (GGC, 2001) GENDARMERIE TRAFFIC SECTION ADMINISTRATION
(IN CITY GENDARMERIE COMMANDERSHIPS)
DUTY RANK PRESENCE
Section Commander Captain-Major 1
Process Low Rank Officer Low Rank Officer 1
Typewriter Officer Civil Officer 1
Table 3.3. Gendarmerie traffic team establishment (GGC, 2001) GENDARMERIE TRAFFIC SECTION ADMINISTRATION
(IN TOWN GENDARMERIE COMMANDERSHIPS) DUTY RANK PRESENCE
Team Commander Low Rank Officer 1
Team Member Gendarmerie Sergeant 2
Driver Soldier 1

3. TRAFFIC ACCIDENTS, REGULATIONS AND ORGANIZATIONS OF TURKEY Ahmet ŞEKER
26
3.10. Traffic Policemen Organization in Europe
The inspection organization in traffic varies according to the political and
administrative structures of a country, it could be under the power of a central (Ex:
Italy), regional (Ex: Germany), place (Ex: Sweden) authorities. Except Spain, the
authorities responsible from central road security are not directly authorized with the
traffic-inspection services. As a result, these don’t have a power over police
organizations or operation strategies.
On the other hand, the other countries do not have a responsibility to provide
the needs of road security authorities. The same is valid for subjects related to their
budgets (SGD (Turkey), 1998).
There exists some organization structures based on one or more police forces
about activities in the country, and responsibilities on the whole road network;
1- A national force for the whole road network (Ex: Holland)
2- Few national forces for the whole road network (Ex: France)
3- One or more forces and forces attached to towns (Spain, Italy, France, Norway)
4- Regional forces and forces attached to towns (Germany, England, Sweden)
Some countries have chosen specialized highway policemen which have their
essential duty as the regulation of traffic and attached to central, regional and place
levels under national police force. The situation is this in Spain (Agrupacion de
Trafico) and Italy (Polizia Stradale). But the other countries have adapted the varying
specialization of policemen with its own equipment system. These specialized units
are generally responsible from road network and large passage roads. Countries at
this situation are Germany, England, Sweden and Holland.
Even though many countries have decided to give this responsibility to police
forces attached to towns, the authorizations vary from one country to another. For
example, in Italy police forces have a large extent of violation reporting authority
like recording the violations of a moving vehicle. This enables the activities of
Polizia Stradale to a great extent. However in France, the situation is the opposite,
policemen are authorized to record small number of violations (parking, violation of
driver security) in the towns (SGD (Turkey), 1998).

3. TRAFFIC ACCIDENTS, REGULATIONS AND ORGANIZATIONS OF TURKEY Ahmet ŞEKER
27
3.10.1. The Staff and Equipment of Traffic Policemen
The traffic service has been carried on with 19,451 personnel in districts and
163 personnel in centers with a total of 19,614 personnel in total (SGD, 2000).
Table 3.4. Number of Traffic Personnel in Some Centers (SGD, 2000) CENTRE POPULATION TRAFFIC POLICEMEN
London 9,000,000 10,000
Vienna 2,000,000 4,000
Tokyo 18,000,000 11,000
İstanbul 11,000,000 2,300
In our country the number of vehicle, equipment and personnel number of
traffic policemen and gendarmerie is insufficient. Since there is an insufficient
number team car, motorcycle and equipment with it in an effective traffic inspection,
the duty is not done properly. Especially on duties where there is a vehicle to be
escorted there are not convenient level of benefit from the vehicles. Although there is
no limitation of gasoline usage to team vehicles because of budget shortage plans
there is a specified amount of gasoline that can be consumed. As a result, there is no
chance of using the vehicle or the equipment beneficially.
The insufficiency or in other words the equipment levels of Turkey is seen
clearly in table 3.5.

3. TRAFFIC ACCIDENTS, REGULATIONS AND ORGANIZATIONS OF TURKEY Ahmet ŞEKER
28
Table 3.5. The equipment levels of Traffic establishments in Turkey (SGD, 2000) THE EQUIPMENT LEVELS OF TRAFFIC ESTABLISHMENTS (2001)
KIND INSIDE CITY INTERCITY TOTAL
STATIONARY.TABLE RADIOPHONE 201 320 521
HAND RADIOPHONE 1,961 700 2,661
AUTO RADIOPHONE 1,568 1,453 3,021
2.440.MOTORCYCLE RADIOPHONE 547 17 564
RADAR 123 252 375
POLICEMEN-GENDARMERIE LAMP OF STOP-PASS 1,020 1,252 2,272
OVERHEAD LAMP 1,522 1,353 2,875
WITH REFLECTOR VEST 1,820 1,090 2,910
FIRST AID BAG 927 2,270 3,197
RAINCOAT 4,525 2,560 7,015
ALCOHOLMETER 1,587 428 2,015
TELEVISION 200 124 324
3.11. Factors Affecting the Accidents
3.11.1. Weather Conditions (Karakuş, 2006)
Inconvenient weather conditions which affect the vehicle equipments, driver
and road negatively can be ordered as below:
- Humidity
- Snow
- Temperature
- Fog
- Fall (rain, snow etc)
- Wind
- Other
1- Humidity; Excessive humidity can cause the existence of negative effects
on drivers during drive leading to the detracting of attention and getting bored of the
driver. Also in the region where humidity percentage is high, the vehicle equipments
of which resistance to corrosion is low expose to corrosion and become useless after

3. TRAFFIC ACCIDENTS, REGULATIONS AND ORGANIZATIONS OF TURKEY Ahmet ŞEKER
29
a short time.
2- Snow; After snow falls ,the snow accrues on roads melts by the sunlight
and turns into sliding ice layer after sunset as a decrease in the temperature below 0
Celsius. Ice layers are seen more in winter.
3- Temperature; Temperature is low in regions where altitude is higher than
sea level and in the roads passing through mountain areas because of the altitude
difference. As a result it causes ice up and becomes an important risk factor on traffic
accidents.
4- Fog; At critical heat changing times, the moisture in the air become fog as
hanging in the air. Fog absorbs flowing of lights to the direction and diffuses it.
Hence while driving, visibility range decreases and the perception of coming
vehicles from opposite direction. The probability of making accident of a fog light
broken car appears.
5- Fall; In the case of rain fall in an event depending on the thickness of the
water layer on the road and the profile of the tire decrease the force acting on tire.
This event, the water cleat between tire and road, is called aqua-planning. This event
happens more easily in rough profile tire and bald tire. If your car tire is bald enough,
the chance of happening of this event is high.
6- Wind; Vehicle’s moving direction, velocity, the direction of the wind and
the wind factor that affects the endurance of the vehicle depending on the vehicle’s
velocity make a contribution to accidents .In this situation the endurance of the
vehicle can vary according to the linkage of the tire and the floor because of the
aerodynamic forces are affected by the wind. Driver coerces in order to control the
inconsistent endurance vehicle. As a result accidents may happen.
7- Other; beside the climatologically conditions, the physical conditions are
important factors in the increase of traffic accidents. Highway markers, directly
contact with the out surroundings reflective surface are exposed to sunlight,
ultraviolet light, rain, humidity and different temperatures. Because of this air
conditions roads signs wear in time. It is unavoidable to make an accident in the case
of not recognizing of this worn road signs.

3. TRAFFIC ACCIDENTS, REGULATIONS AND ORGANIZATIONS OF TURKEY Ahmet ŞEKER
30
3.11.2. Human
As it can be remembered from table 4.1, the biggest portion in causing traffic
accidents is the human factor. Human failure can be analyzed in three titles.
1 - Personal effects
2 - Psychological effects
3 - Physiological effects
1-Personal Effects
Experience, age, gender, physiology, education, alcohol, exhaustion,
sleeplessness, taking medicine, drug using are considered as the factors of the
personal effects of the human failure in accidents. Inexperienced drivers who enter
into traffic cause a lot of accidents because of the lack of experience. Beside this, in
our country as a consequence of lack of effective driver education course, traffic
giants are brought up rather than educated and sensitive drivers.
2- Psychological effects
Psychological effects also play an important role in traffic accidents. As long
as drivers, who get used to drinking alcohol, burning up (high speed), behave
negative attitudes towards other drivers ,in other words, sickly characters , are on
highways, traffic accidents are unavoidable. Furthermore, being exquisite, depressed,
sadness and feeling of personal show off and using of stolen vehicles are some of the
psychological factors that directly affect accidents.
3- Physiological effects
Being high weighted in front of steering wheel causes early exhaustion. It is
also observed that reflexes are getting weaken and slower in high weighted drivers.
As a result, it is unavoidable not to happen accidents while the driver is
incompetent and ineffective in the cases of instantaneous gear shifting. Hearing
disorders are especially effective factors in local traffic. It is still seen handicapped
citizens in the traffic who uses normal cars instead of using invalid cars. They
threaten not also their lives but also other drivers.

3. TRAFFIC ACCIDENTS, REGULATIONS AND ORGANIZATIONS OF TURKEY Ahmet ŞEKER
31
3.11.3. Speed
High speed, heads the list of fatal accidents on highways since it shortens the
time that is needed to escape from collision and increases the effect of collision.
Exceeding the speed limit is one of the most committed traffic crimes. High speed
problem or inadequate speed problem is a very serious and most seen way security
problem. Additionally, as speed gets high the ratio and seriousness of accidents
increases. It must be supported the attempts of decreasing the injuries, especially
fatal injuries. On average, a 1 km/h decrease in speed, leads to a 4% decrease in
accidents. In this situation, a great benefit is obtained: especially the 85% dead ratio
of foot passengers at a speed of 50 km/h decreases to 10% when speed decrease to 30
km/h (SGD, 2000).
Speed is closely related with two physic laws. Firstly stopping distance (at
emergency situations) is proportional to the square of the speed. By grounding on
empiric data Transportation Research Laboratory (TRL) attains this result: If average
speed is decreased by 1 km/h, accidents and injuries will decrease by 3% on average
(SGD (Traffic Culture-1), 1999).
In an accident done by an automobile, if collision speed is increased from 40
km/h to 60 km/h, the risk of foot passenger death is multiplied by a factor of 5 (SGD
(Highway Traffic), 1999).
The fatality ratio of the collision of a vehicle having a speed of 50 km/h to a
foot passenger is about 85%. Beside this, if the vehicle has an average speed of 30
km/h the fatality ratio comes on to scene by 10%. Former studies which were done to
identify the relation between the speed and fatality rate shows that a 1 km/h increase
in speed causes 3% increase in fatality ratio. According to the result of the analyze of
the 36 former studies it is understood that, a 2% decrease in accidents in suburban
regions which are done by vehicles having a speed about 50 km/h and 4% decrease
in accidents in urban regions when vehicles having a speed of 50 km/h, decrease
their speed by 1 km/h. In the basis of high speeding problem it is caused by the
refusing to accept that the drivers do speeding and high speeding is a dangerous
thing. Moreover drivers believe that high speeding has advantages sides likes

3. TRAFFIC ACCIDENTS, REGULATIONS AND ORGANIZATIONS OF TURKEY Ahmet ŞEKER
32
shortening the time of travel, enjoying of high speeding, getting excitement by
speeding and testing the abilities of themselves during high speeding. High speeding
behavior has negative results such as decreasing of the perception of the risk of
accidents and feeling of lack of confidence (SGD, 2000).
In most of European countries, fines related to violations such as exceeding
the speed limit and crossing against the red light are detected automatically and
recorded. Such approaches are very advantages according to cost-benefit and it must
be applied widely in regulations related with the applications of law (SGD, 2000).
Denmark Highway Administration determines an active number about the
cost of cost of highway accidents. The cost of a fatal accident is determined as
1,181,000 Danish Krone. If the campaign is continued one year, 364 million Danish
Krone if it is continued in a very short time period, 60 million will be saved. This
savings make a balance as a 4.5 million Danish Krone against campaign investment.
Even if it is seen from the worse side campaign will yield a revenue of 13 times
bigger than the investment and by an optimistic perspective it yields an 80 times
bigger revenue (SGD (Highway Traffic), 1999).
According to the Handbook of Norwegian Traffic Security the lowest speed
limit which gives the lowest cost according road types as in the table 3.6.
Table 3.6. Speed Limit for the Minimum Cost According to the Road Type (SGD (Traffic Culture-1), 1999)
ROAD TYPE SPEED PROVIDE LOWEST COST (km/h)
HIGHWAY 95
7 m wide ROAD 60
11 m wide ROAD 70
13 m wide ROAD 80
The main aim of speed control is to; provide a portion of speed that is
determined by the law on the ways where drivers happened to make accidents. Also,
the speed supervision leads drivers to be accurate and sensitive and give rise to a
decrease in accidents, number of injuries, deaths, and minimum economic loss.

3. TRAFFIC ACCIDENTS, REGULATIONS AND ORGANIZATIONS OF TURKEY Ahmet ŞEKER
33
Another effect of speed supervision is to make a contribution to country’s economy
by providing fuel saving.
A study has done in U.S.A. shows that the speed limitation causes a 3%
saving in fuel consumption. In the same country, by decreasing of the speed limits
deaths after accidents decreases by 24% (SGD (Traffic Inspections), 1998).
By 16 studies done in the past, it is stated that speed controls which are done
separately and in the combination with other applications affect to decrease the
accidents by 6% and deaths in the accidents by 14%. It is put forward for
consideration in the cost-benefit analysis that immobile speed control type is 3 to 14
times cheaper than those in mobile speed control. Speed applications must be done
longer and more intensively and the maximum benefit must be gotten (SGD (Traffic
Inspections), 1998).
As in previous years, the camera technology measures speed is a very
efficient application both financially and beneficially. 11 studies which were done to
consider the effects of these cameras show that it has an effect decreasing the
accidents by 19%. This decline is shows more effectiveness in urban areas (28%)
rather than in suburban areas (4%). It is deduced that in a member country, cost-
benefit analyses benefit which is gained by speed measure cameras 5 times more in a
year and 25 times in a period of 5 years. The reaction of community got in a positive
manner while it is started to apply widely. Shortly, it is seen that a brother who may
kill you is chosen rather than a brother watches you (SGD, 2000).
Speed Cameras
Putting of speed cameras into practice into traditional speed law application
has many new positive contributions. After analyzing of the results of 11 former
studies which were done before show that speed cameras and precautions taken by
speed cameras cause to affect to reduce the number of accidents approximately by
19%. This decline is shows more effectiveness in urban areas (28%) rather than in
suburban areas (4%). In many countries the speed controls which are done
automatically in a particular part of the highways expressed to drivers by cautionary
signboard beside the roads. It is detected that the halo effect of distance of speed

3. TRAFFIC ACCIDENTS, REGULATIONS AND ORGANIZATIONS OF TURKEY Ahmet ŞEKER
34
cameras is about 500 m in urban areas and 1,000 m in suburban areas. In a study
done by Finland people it is stated that halo effect distance of speed cameras is
approximately between 4 km and 10 km. The information about the distribution of
effects of speed cameras may depend on the method of evaluation (SGD (Traffic
Inspections), 1998).
The acceptance degree of speed cameras in Norway, Finland and England is
in wide range. In a research done in Norway that 67% of the participants of the
survey state are positive thoughts about speed control cameras. In England 57% of
the participants are contented, 24% support to increase the number, 16% demand to
decrease the number of positioned speed cameras. In a research in Sweden 44% of
participants deliver positive 46% of participants deliver negative opinion (SGD,
2000).
3.11.4. Alcohol
The 48th item of the 2918th Highway Traffic Law as in below:
It is forbidden for people to drive vehicles on highways who take narcotic or illicit
drugs and drunken alcoholic beverage because of the lack of the ability of secure
driving.
Drunken-Driving
Alcohol basically affects the reaction time, ability of sight, behavior and
adaptation ability (gear shift).This effect can reduce according to the endurance of
the drunken driver with respect to the age, experience, feature of brought up (Özüm,
1982).
Drunken-driving is one of the important factors that affect the resulting of
traffic accidents. Studies show that, drunken-driving is responsible for the 47% of
fatal accidents, 20% of injuries and 10% physically damaged accidents (Evans,
1999).
A very low 0.02% alcohol blood level is also damage the driving ability.
Increases the level of alcohol in blood also increases the risk of involvement of a
driver in an accident. Even if alcohol is very low in blood, it affects adolescents more

3. TRAFFIC ACCIDENTS, REGULATIONS AND ORGANIZATIONS OF TURKEY Ahmet ŞEKER
35
and more. With the braveness that alcohol brings, adolescent drive faster and
dangerously and increases the level of alcohol in blood increases the risk of making
accidents. Researches show that drivers aged 16-19 have a higher risk of attempting
accidents rather than the older drivers whatever the level of alcohol is. It shows that
the risk of injuries in both males and females increases (Zador, 2000).
Table 3.7. Speed and Alcohol Limits in Europe While Driving (SGD, 2000) COUNTRY NAME
URBAN (km/h) SUBURBAN (km/h) HIGHWAY (km/h) ALCOHOL LIMIT (ppm)
Belgium 50 90 120 0.5
Bulgaria 60 80 120 0.5
Denmark 50 80 110 0.8
Germany 50 100 1301 0.8
Finland 50 80 120 0.5
France 50 90 1302 0.5
Greece 50 110 120 0.5
England 48 96 112 0.8
Ireland 48 96 112 0.8
Italy 50 90 130 0.8
Luxemburg 50 90 120 0.8
Holland 50 80 120 0.5
Norway 50 80 90 0.5
Austria 50 100 130 0.8
Poland 60 90 110 0.2
Portugal 60 90 120 0.5
Sweden 50 70 110 0.2
Swiss 50 80 120 0.8
Slovenia 60 80 120 0.0
Spain 50 90 120 0.8
Turkey 50 90 120 0.5
Hungary 50 80 120 0.0
1Advised speed limit 2 In wet and rainy weather it changes as 80 and 100

3. TRAFFIC ACCIDENTS, REGULATIONS AND ORGANIZATIONS OF TURKEY Ahmet ŞEKER
36
Supervision of Alcohol in Turkey
The reason of many accidents happen in our country is drunken-driving.
Because of the alcohol level increases, the quantity of oxygen in blood decreases.
Brain loses it functions because of the lack of oxygen. It shows simulative and
narcotizes effects on drivers. In both circumstances, the probability of making
accident increases (SGD (Police Traffic), 1998).
As the quantity of alcohol in blood increases, Brain functions such as balance,
sight and hearing increases. Many important sense and control abilities such as
muscle control, accuracy, reaction time decreases. Stopping distance will increase in
the case of an overtaking of a person or vehicle in front of a drunken driver rather
than a driver without alcohol. Parallel with the stopping distance, the probability of
accident risk also increases.
Drunken-driving is not prevalent when it is considered with the other traffic
crimes, but it is a very dangerous behavior. If E.U. countries taken in hand.
The averages of 3% of all travels are done by the drivers who take alcohol
above alcohol limit, and 30% of all injured drivers are drunken-drivers. Alcohol is
the main factor of accidents and increases the seriousness of injuries (GGC, 1999).
In recent years, it is seen a decrease in the number of drunken-driving, as a
result of an increase in sense about health and an increase in successive applications
the security precautions. But international researches and experiences shows that the
combination of drinking alcohol and driving is still the most important factor that
affects the traffic security.
Alcohol and The performance of Driving
The effects of alcohol on drivers show very big differences such that it varies
from loss of hearing in the case of highly drunken-driver case, to decline in the
ability of behave and recognition. Alcohol causes an increase, and increases the
competition behavior or the speeding which results in decreasing of the accordance
of motivation to security standards. Generally all functions having an importance in
driving a motor vehicle in a secure way can be negatively affected by the level of
taken alcohol (GGC, 2001).

3. TRAFFIC ACCIDENTS, REGULATIONS AND ORGANIZATIONS OF TURKEY Ahmet ŞEKER
37
Information about the effects of alcohol on driving, the general results of
attempting a traffic accident and driving vehicle without alcohol can be considered as
a lecture that in school course programs. These subjects must be positioned in the
existent health education and traffic security programs. Necessary importance must
be given to this subject in driver education programs. At every turn it must be remind
to drivers that their own faults affect not only themselves but also the other drivers
and this is a responsibility for them. Because of the tendency to misestimating of the
result of the risk of the activities, it must be focused on to the probable events that
may happen to foot passengers and the other individuals using highways (GGC,
2001).
Table 3.8. Alcohol Quantity in Blood and Effects (http://www.alkol.gen.tr/alkol/content/alkolun-vucuda-etkileri)
ALCOHOL QUANTITY IN BLOOD(ML/DL)
EFFECTS
50 ml. (bellow) Feeling fever, coloring of face, slowing of perception,
relaxing
100 ml.
(Open Drunk)
Slowing of perception, unbridling himself, detracting
attention, losing control. Slowing of reflexes, unable to
control muscles.
150 ml.
(Drunk)
Feeling of stupefaction, muscles, unable to control
movements, unable to speak clearly, to see double, memory
and perception loss.
250 ml.(Excessive Drunk) Unable to stand on foot, disgorging, oozing away.
350 ml.
(Coma)
Loss of consciousness, unable to control excreting , low
temperature, low blood pressure, slowing of breathing,
perspiration
500 ml. Risk of death
3.11.5. Age, Gender and Education
As a user of highways, a person’s age, body feature, sight, hearing reaction
abilities are the important physical features that have effects on the accidents. Such

3. TRAFFIC ACCIDENTS, REGULATIONS AND ORGANIZATIONS OF TURKEY Ahmet ŞEKER
38
situations exhaustion, illness, psychological state, being drunk is effective situations
to be involved in accidents. Social structure, level of education, structure of
intelligence, adaptation to environmental conditions, experience and knowledge level
are other effective features that can be listed to involve in accidents (GDH, 2001).
In summary, we can sum up the features of the drivers that can cause the
accidents (GDH, 2001).
• Insufficient level of education
• Insufficient level of knowledge
• Inexperience
• Negative physical features
• Mental features
• Temporary physical features
Age
In developing countries and countries where the males are reproductive; the
deaths caused by accidents is in the third place after tuberculosis and AIDS in the
death reasons. In 1996 in Mexico accident deaths were in the third place in the death
reasons and 74% of the people who has died were between their most reproductive
era; they were between 15-64 years old (Hijar, 2000). The accident death in Greece
is in the first place for the age between 18 and 24 (SGD (Turkey and Europe), 1998).
With the increase of age, the traffic security is affected. Because with the
aging of the individual, the mental health of him changes, reflexes start to fail; there
is a lack of adapting and decision making, and rapid exhaustion. This situation may
have effect the condition of the driver, and age becomes an important risk factor. In
the researches made, it is shown that there is an increase of errors and traffic accident
numbers as the age increases.
Gender
As Tavris and his friend’s points out, Barancik and his friends (1981), Karpf
and Williams (1984), Baker and his friends (1992), men are injured and died more
than women in traffic accidents. However the factors of this difference can not be

3. TRAFFIC ACCIDENTS, REGULATIONS AND ORGANIZATIONS OF TURKEY Ahmet ŞEKER
39
determined. Wang and Chou have seen about 3.2 times of deaths of men caused by
traffic accidents when compared to woman (Wang, 1997), Lee and his friends
explained the large number of death of man could cause from that men travel longer
distances and they die more (Li, 1998).
Education Level
In our country education, level increases by each day. The main reason
beneath the accidents is disobey of drivers, pedestrians and passenger to rules. Illegal
behavior could be caused by ignorance or doing it on purpose. The minimizing of
these illegal behaviors will definitely minimizes the number of accidents, injury and
death numbers. However this should not be expected so quickly because learning and
increase in the sensitivity of people takes time.
In a traffic accident, the most important factor is the uneducated person, or a
place where there was no sufficient opportunity for teaching the proper traffic
education.
Traffic education is the need of the developing area and should be an
obligatory goal of Ministry of Education.
Traffic education should not be teaches just to students in schools; it should
be teaches to instructors. Plus, the educations of traffic regulators are very important.
The flaw in the traffic should be overcome not by scientific experiments, but
by modifications in the regulations and laws. Traffic can not overcome the chaos it is
in. Education and first aid, regulation and construction duties are way before the
modern era.
3.11.6. Psychology
Traffic accidents not only show itself as death, injury, and socio-economic
loss but also affect the relatives and friends of the one who has died or injured. In a
scientific questionnaire done in the 9 countries of Europe with 800 friend or relative
of a death and 564 injured people and their relatives and friends; it is shown that
these individual go through problems like using psychotropic substances, loss of

3. TRAFFIC ACCIDENTS, REGULATIONS AND ORGANIZATIONS OF TURKEY Ahmet ŞEKER
40
family relations, changing jobs because of the physical conditions after the accident,
divorce (Işıldar, 1998).
The socio-economic harms caused by traffic accidents is related with the loss
of productivity of died and injured people, medication costs, recovery of car costs,
the cost of harmed goods transported, or carried (lost wallet, torn clothes).
In developed countries there is about a loss of 1-2% of national income, according to
the assumed calculations in 1997 the cost of traffic accidents to our country was 2
billion YTL, 250 billion dollars to Europe, and 1 quintillion to the whole world
(Işıldar et al, 1998).
3.11.7. First Aid
It is said that 10% of all deaths in the accidents are caused in the first five
minute, 50% of deaths are caused in half hour. Because of this, any minimization of
time for reaching the accident area and helping the ones who had the accident has
great importance. Researches have shown that proper first aid and emergency
services decreased the number of deaths by 20%. There is no suspicion that this fact
will also decrease the number of handicapped people (GDH, 2001).
There is an increasing demand for people who are trained in first and
emergency aid. Health work high school and universities total graduates of
paramedics are 5,000 per year and it is clearly insufficient. Addition to these
trainings, the public must be educated under the name “essential life support” by
voluntary foundations and associations (GDH, 2001).
3.11.8. Unplanned Urbanization and Substructure
Unplanned Urbanization
Because of an unplanned development which is not unified throughout our
country there is a drastic immigration to major cities. Parallel to this fact the city has
a tendency to increase its population over its limits. As a result the insufficient
transportation substructures become worse. Rapid population increases brings the

3. TRAFFIC ACCIDENTS, REGULATIONS AND ORGANIZATIONS OF TURKEY Ahmet ŞEKER
41
usage of unplanned land with itself. While there should be an extended analyze
between substructures and unplanned urbanization of an area, there is no such effort,
and the urbanization problem still continues.
The 90% of intercity transportation is run on double tracked roads. In this
situation some demands about road capacity is aroused. As a result of this
insufficiency there is a lack of flow and increasing risk of an accident. The statistics
showed that no matter which issue is taken as the bases there is much more death
casualties compared with the developed countries.
Substructure
When we say transportation substructure, we mean road, junction, terminal,
stop, station, parking lots, indications and signs for the mobile vehicles and facilities
related to these indication for any vehicle. When we look at the situation of our
country on these facts, we could obviously see that it is unsatisfactory. The road
distances are insufficient, plus they are not in convenient physical and geometrical
conditions. The main road networks are not able to enable the shortest distance for
drivers. The number of radial roads carrying the heavy traffic flow of the city,
junction connections and ring roads that will connect these two types to each other is
extremely low in number. Also, the number of secondary routes is almost not
present.
3.11.9. The Effect of Transporting Business
The effect of transporting business in traffic accidents should be taken
seriously. When look at the structure of transportation business we can see that road
transportation usage is after railroad transportation usage in Europe. And the problem
of transportation business accidents is overcome by this usage. However in our
country nearly everything is transported through highways.
In our country 95.02% of passenger transportation is done on highways, 3.4%
of passenger transportation is done by railroad, and 0.1% passenger transportation is
done through sea. And the percentages of load transportation are as follows, 91.38%

3. TRAFFIC ACCIDENTS, REGULATIONS AND ORGANIZATIONS OF TURKEY Ahmet ŞEKER
42
by highways, 5.21% by railroad and 3.24% by sea (SIS, 2003). The developed
abundance in ratio to the side of the highway brings the life loss, physical and
spiritual losses, air pollution, loss of energy and time, loss of money to country
economy and to public.
3.12. Inspection and Security
Inspection
The traffic accidents are a serious threat for the world which requires a strong
organization attack to solve the problem. In this attack inspectors and inspections
play an important role.
Turkey is in a very bad situation on the issue traffic accidents. This sorrowing
fact should not be the destiny of Turkey. Serious steps should be taken to invest
money and come up with convenient regulations in order to prevent accidents.
Inspection plays an important role to minimize the accident numbers. It is
obvious that if the traffic inspection units are activated important developments will
be achieved.
If the road users are prevented to commit crime, there will be an important
benefit gained. The assumptions vary on this issue but it is predicted to minimize the
cost of all losses by 50% at minimum. There can not be only one precaution
preventing the accidents. Also traffic law applications bring in benefits related to
cost-benefit relations. In the past, the law related to use vehicle drunk has proven to
be very useful on the basis of cost and benefit relation in Sweden. This analyze also
covers all of the accident types. Excessive speed, alcohol control and safety belt
usage laws have proven to be useful in the cost-benefit relations (Darçın, 2002).
The organization of police forces in EU varies. First, some countries like
Belgium, France, Italy and Spain have attached the military officers to help the
police officers in traffic. These military police units are organized to be attached to
center, and have duties on the same area with other civil policemen, and the
organization of civil policemen is different it is has organizational autonomic
characteristic. In some other countries, the traffic policemen works isolated from

3. TRAFFIC ACCIDENTS, REGULATIONS AND ORGANIZATIONS OF TURKEY Ahmet ŞEKER
43
other policemen. The reason for this structure is that the police have regional or
national duty share. As a result the strategic structure of policemen varies from
country to country. For example, in England each police chief works independently
in its area, this situation may be organized with central level in other countries.
Basically, these regulations enable a coordinative and transparent structure
(Darçın, 2002).
Regulation can be though as a process in steps. The first step is to set the law.
In many countries there are series of laws determining the responsibilities of vehicle
users. In some countries, this may be a very general series of rules (ex: highway
law), in some other countries traffic rules define specific processes for specific
conditions. The specification level of rules plays an important role in the automation
probabilities. Because of this, setting convenient laws is an important step. The
second step includes the police control of the convenience of general behaviours on
roads to laws. If different cases appear, some alternative operations are processed
according to the intensity of the case. The driver maybe warned but not reported, or
maybe fined and reported, or banned from traffic for an hour and his car taken over
or the driver being arrested. Basing on the laws the officer may write the license
plate number of a mobile car and report. In the third step of the inspection phase, the
recording of the violation is done and reported for legal procedures. Again many
different operations may be processed. In some countries speed and parking
violations is punished by the stable punishment system. In other countries
punishment system point is used. More serious punishments end up in the court, but
before that the public prosecutor makes an agreement to be the claimant. In the case
of a trial in the court there are many options for the claimant and the defendant. Since
these cases take a long time of the prosecutor and the policemen, the prosecutor may
classify the folder until he finds strong evidence. As a result police officers often
make a warning punishment in these cases (SGD, 2001).
The dissuasiveness of punishments and setting the criminals is only effect
according to the specific law sanction. This fact contrasts with the flexibility of the
policemen’s actions. For example, a policeman may fine a driver or warn him. The

3. TRAFFIC ACCIDENTS, REGULATIONS AND ORGANIZATIONS OF TURKEY Ahmet ŞEKER
44
millions of punishment trials have forced the country to find alternative ways to
solve the problems. Moreover all these actions are taken to ease the burden over the
shoulders of the court, not to increase the affectivity of the laws. In some countries,
especially countries speaking German, studies have been focused on the re-education
of the drivers rather than punishments. This process has been quite successful on the
decrease of punishments related to alcohol usage and valid for other punishments.
Punishment point system that is used level by level is used in member countries of
European Union, which have increased the dissuasiveness and the authorities of the
policemen.
The observations written above are also applied in the laws helping the
appliance of punishments. But there are still many varying controls like random
breath controls for alcohol. Although this is a known control and approved by many
European Countries, this control is not approved as evidence. In some countries
speed cameras are used to determine the driver in the car however in some other
countries the driver who’s registered to own the car is punished no matter who drives
the car. Basically these law differences determine the affectivity of the area of the
law.
3.12.1. Traffic Inspection Procedures
The control of the convenience of vehicles to traffic, the required equipment
and licenses of the vehicle and the driver according to the present law, the properness
of the passenger and the driver on the basis of rules and reporting any violation if
necessary are the responsibilities (SGD, 1982).
The traffic regulations in Europe focus on the speed limit, alcohol usage,
safety belt usage rules (SGD, 2000).
Highway traffic accidents cause loss of thousands of lives, ten thousands of
permanent injuries, and trillions of money. To maintain the security there are some
changes that may be titled as reform with the law numbered 4199 in the Highway
Traffic Law number 2198. The traffic units are reformed according to the law
change. With this new establishment designing new projects and carrying them out

3. TRAFFIC ACCIDENTS, REGULATIONS AND ORGANIZATIONS OF TURKEY Ahmet ŞEKER
45
as soon as possible, high levels planning of regulations were set as goals (Darçın,
2002).
In a research carried out related to establishments causing accidents the
percentages of the faults are as follows; 31% engineers, 15% strengthening of the
foundations, 9% security controls, and 6% education of the drivers. As seen if the
regulation and inspections are properly done the accidents will decrease 12% (SGD
(Traffic Inspections), 1998).
The controls carried out by traffic policemen may change the behaviors of the
drivers if done frequently and properly.
Not always do the users are aware that the traffic control rules are for the
security of themselves. This situation makes the traffic controls obligatory.
The purpose of traffic control is to increase the sensitivity of the users to the
rules that are set for their own benefits. The main approach manner should show that
the purpose of the control is for the security of the driver. The approach manner
should be reliable. The increase of the number of controls and control manner should
be systematic. Control subjects, should be issues important for traffic security (speed,
alcohol). Increasing the control purpose acceptance ratio is important (SGD
(Highway Traffic), 1999).
Traffic inspections are done according to the essential rules as follows
(Darçın, 2002).
1- Mobile Inspection
2- Notified Inspection
3- Fixed Inspection.
Mobile inspection is the inspection of mobile traffic. The purpose is to
determine the driver and the exact violation with exact time and place, and carry out
the necessary reports and processes (Darçın, 2002).
In Europe there are two kinds of police methods are used to prevent the speed
violations, only one of them is proved to be effective in changing the attitudes and
accident numbers. The first one was with the inspection of a one fixed car hiding
besides the road, and another unit waiting ahead of the road, the one hiding reports
(by measuring the speeds with a device) to the one ahead of the road any violation,

3. TRAFFIC ACCIDENTS, REGULATIONS AND ORGANIZATIONS OF TURKEY Ahmet ŞEKER
46
and that unit stops the car and fines the driver. The mobile inspections are defined as
the application of traffic behavior and are done by a car that drivers may or may not
notice. These mobile inspections proved to be useless on the decrease of speed
violations. At the same time has no effect on traffic behaviors like alcohol usage
(SGD, 2000).
According to the researches conducted in Europe, fixed speed controls are
beneficial for cost-benefit relation. Automatic speed control is more beneficial for
cost-benefit relation. Patrolling units do not have any sign of evidence that they are
economically beneficial (SGD (Highway Traffic), 1999).
Some Research Data of European Community is given as below (SGD
(Highway Traffic), 1999).
Fixed Speed Control:
As result of 16 researches;
Benefit/ cost= 7 and is very beneficial.
Automatic Speed Control:
As a result of 10 researches
Benefit/Cost=8 and is very beneficial
Mobile Speed Control
In the benefit/cost ratio the cost come out to be more and decided that this
was not beneficial. The success of the inspection and its ability to create a specific
and general dissuasiveness is an acceptable characteristic of the punishment. General
dissuasiveness is directly related to the reliability of appliance of rules, any
punishment required etc. in the heads of the drivers. Specific dissuasiveness is
related with the experience of the individuals related to control punishment etc.
(SGD (Highway Traffic), 1999).
The important essentials of traffic inspection are (SGD (Highway Traffic),
1999).
Before the inspections and through inspections the purpose is to give
information. The purpose of this is to give a sense that there is an increase on the

3. TRAFFIC ACCIDENTS, REGULATIONS AND ORGANIZATIONS OF TURKEY Ahmet ŞEKER
47
number of inspections (driver, pedestrian, and passenger). By giving information
there maybe a positive effect of on the increase of support by the public, this will
affect the traffic security positively.
Improved and successful Police Inspection (application) is based on a good
system, better education and information, better motivation, better usage of present
information and experience, and strong coordination attached with strong
connections. The priority should be given to use the present information before
demanding for more personnel and equipment (SGD (Highway Traffic), 1999).
In a research conducted in Holland, the cost is returned as a gain about 200%,
this proves that the profits gained from the maintaining the security is 2 times greater
than the cost (SGD (Inspection Profits), 1999).
As it is seen from table 4.9 increasing the inspections should not be neglected
because they are effective in the increase and decrease of accident number.
Table 3.9. Inspection intensity and changes in accidents (SGD, 2001) Decreasing the inspections 50% Reported accidents:+11%
Normal level No change
Increasing the inspections between 100-300% Reported accidents:-11%
Increasing the inspections between 300-500% Reported accidents:-12%
Increasing the inspections between 500-800% Reported accidents:-19%
Increasing the inspection intensity less than 3 times is said to have no effect
on the number of speed violations, accident numbers, determining risk situations.
Increasing the inspection intensity between 3 and 5 times is said to decrease the
number of speed violations, accident numbers, and increase determining risk
situations, decrease the criminal numbers and lowers the number accidents by 10-
20%. Increasing the inspection intensity more than 5 times has a decreasing effect on
the number of speed violations, accident numbers, and decreasing effect on
determining risk situations, and may stop the number of accidents by 20-30% (SGD,
2001).

3. TRAFFIC ACCIDENTS, REGULATIONS AND ORGANIZATIONS OF TURKEY Ahmet ŞEKER
48
3.12.2. Technology in Traffic Inspections:
In the last few years it is proven that the usage of automatic police control
equipments has positive effect on obeying the traffic rules. In a study in Germany it
is found that a speed limit put on the specific part of the road decreases the average
speed limits by 30 km/h. By putting an automatic speed control the average speed
limit decreased by an additional 20 km/h. The accidents decreased by 91% on that
part of the road and the average decrease in the accidents on all of the roads is 56%.
However it shouldn’t be forgotten that this result is achieved by using speed limit
indication plus automatic speed control. By using red light cameras, the red light
violations have decreased by 40% in Singapore. The same cameras have decreased
the violations by 32% in the state of Australia which is Victoria (SGD, 2001).
A continuing speed inspection study in Norway has shown that there is a 10
km/hr decrease in an area where the speed limit is 80 km/h. These effects have been
spotted 2 years later. Crime ratio has lowered from 43% to 14% in an area, and
lowered in another area from 35% to 7%, when the information is compared with the
time where there was no inspection it seen that there is a 69% decrease. Our study
has shown that the positive effect still continues for two months even when the
cameras do not work (SGD, 2001).
3.12.3. Lack of Inspection
The essentials of a proper secure and mobile traffic are achieved by traffic
management and organization plus traffic control. To give up from one of these
essentials will be a big mistake. Because the aimed secure and flowing traffics is
only possible with a good traffic control. However in our country traffic policemen
deal mostly with the regulation of the traffic order.
Traffic inspection services should be one of the major duties of the traffic
policemen; however most of the personnel deals with the escort of some people
intercity and in the city which takes most of his time, and results in the lack of
services (Çakmak, 2000).

3. TRAFFIC ACCIDENTS, REGULATIONS AND ORGANIZATIONS OF TURKEY Ahmet ŞEKER
49
3.12.4. Other Preventions
Lagget gives information about the long term short intense random speed law
he has applied in Australia Tasmania in 1998. This strategy needs the positioning of
three traffic policemen vehicle units where they can be easily seen on along a 16-20
km road where traffic accidents happen rapidly. The separated parts of the road are
separated into smaller parts about 1 km long, each vehicle is set to control randomly
for two hours when the traffic accidents happen more. The real application of the law
is processed in different areas for each week for a period of two years, and the
statistical data is made from the results. The average speed is decreased about 3.6
km/hr. As a result of these applications there is a decrease of 58% in the total number
of accidents. The cost-benefit analyze of Lagget has come up with a ratio of 1 to 4
(SGD, 2000).
Bareckett and Beecher have made a large extended study about the principals
of learning theory in Texas. There were applications of speed control with fixed
radar in randomly chosen 24 roads. The information achieved from these chosen 24
roads is then compared with other 24 roads where there is no speed control. This
application is continued for 18 months. After the end of this trial, there is a general
decrease of 1.8 km/hr in speeds and 9% in drivers’ tendency to reach over the speed
limits, and there were decreases on fatal accidents by 15%, accidents including an
injured by 9% and material damage by 3%. This study is also covers the motivation
of the policemen in charge. Generally there is no close data achieved as a result of
the study. In this study the motivation is watched over randomly and the application
of the law was more concerned (SGD, 2000).
3.13. Geographic Information System in Transportation
The severe traffic problems in our country add up to a cost of 8 to 9 billion
dollars of loss. The number of injured people’s loss of work effort and recovery costs
is not included (TGNA, 2001). When Turkey is compared with other countries in
traffic accident ratios, the result is terrifying. The ratio of accidents in 100 million

3. TRAFFIC ACCIDENTS, REGULATIONS AND ORGANIZATIONS OF TURKEY Ahmet ŞEKER
50
vehicles/km is 0.9, 1.1, 1.6 in England, USA, and Germany respectively. This ratio is
20 for Turkey. This ratio has increased more than two times in the last decade of
Turkey. When compared with the other countries Turkey has a smaller amount of
vehicles in use, but Turkey is one of the worst countries in the death ratios.
The usage of geographical information systems need for traffic security is
clear. Geographic Information System (GIS) is a data management system aimed to
solve any problem and data analysis related to regions in traffic. This system is
composed of a program, technical hardware (computer, GPS equipment etc) and
data. GIS provide great advantages on solving problems related to the geographic
conditions.
3.13.1. Geographical Information System
One of the most important information that a traffic engineer requires in an
analysis of an accident is the geographic condition it has occurred in. Geographic
location gives a lot of information for the analysis of the problem. The search of
similar or different accidents in the same location has great importance to the
security of the traffic. Similar accidents are like the languages of that location.
Accident reasons in the accident reports enlighten much information. As a result, the
pursuit of accidents according to the location it has occurred is very important.
Because of this GIS supported accident analyses is very convenient and accurate for
usage in traffic security.
3.13.2. Data Saving and Examination System on GIS Environment
To determine the real reasons of the traffic accidents, traffic engineer should
know the place, frequency, intensity and type information. As long as there are no
reasons to explain the flow chart of the accidents, there is no possibility of
determining the solutions. The integration of GIS and Geographic Place Systems
(GPS) will get the missing information of the incomplete accident record
(McPherson, 1996).

3. TRAFFIC ACCIDENTS, REGULATIONS AND ORGANIZATIONS OF TURKEY Ahmet ŞEKER
51
It is predicted that the truck traffic will increase by 40% by 2020 in South
California. Since 28% truck accidents are in this city, Los Angeles is the place for
rapid truck accidents. Economic growing may be long termed if the transportation is
secured and on time. A CBS based process model uses the daily traffic and truck
traffics to analyze the risk levels according to the accident data of the past (Parentela,
2001).
In a study carried out by Spring and Hummer in 1995 has connected the GIS
and the present detailed map of Guildford to show the use of engineering knowledge
in the determination of risky regions. The main purpose is to make an example study
of how the GIS will operate to solve the special problems. The Accident Record
System of North Carolina and the map data of Guildford city is used together. This
project has shown the advantages of engineering information for the determination of
accident reasons and the benefits and difficulties of GIS for ARS applications.

4. MATERIAL and METHOD Ahmet ŞEKER
52
4. MATERIAL and METHOD
4.1. Material
Especially, all the data about the traffic accidents happened during 2000-2005
are on national scale taken from the Turkish Institute of Statistics (TIS), the Security
General Directorate (SGD), the General Directorate of Highways (GDH), the
General Directorate of Meteorology, the General Department of Gendarmerie
(GDG), the Redevelopment of Highways and Traffic Security Project (RHTS)
Reports, the State Planning Agency (SPA), the Custom Specialization Commission
of Transportation Reports, the General Directorate of Basic Health Services of
Ministry of Health statistics of traffic accidents and Internet base. Also studies done
on the international stage were analyzed and other countries’ applications about
traffic accidents are run an eye over. Especially in the Gendarmerie region some
details and data are not on the internet and they are edited as excel data by analyzing
the recorded data in the AS-400 program used by the Traffic Agency Department of
General Department of Gendarmerie.
Faults caused traffic accident in the Gendarmerie zones of Turkey in 2000 are
given in table 4.1 below. If the pedestrian fault is added to the human fault, result is
catastrophic and 96.66 % of the accidents are caused by human error. The main
human error is driver fault.
Table 4.1. Data of the Accidents in the Gendarmerie Zone in the year 2000 (GGC (TBD), 2005) FAULTS NUMBER RATIO (%)
DRIVER FAULT 41,451 93.89
PEDESTRIAN FAULT 658 1.49
PASSENGER FAULT 564 1.28
VEHICLE FAULT 572 1.30
ROAD FAULT 912 2.07

4. MATERIAL and METHOD Ahmet ŞEKER
53
Table 4.2. Data of the Accidents in the Gendarmerie Zone in Total (2000-2005) (GGC (TBD), 2005)
Years Number of
Mortal Accident
Number of Injured
Accident
Number of Material
Damage Accident
Total Accident Number
Number of Drivers
Punished
2000 1,268 9,434 23,577 34,279 367,033
2001 1,175 10,143 22,235 33,553 341,769
2002 1,166 9,938 21,751 32,855 325,322
2003 966 10,036 22,363 33,365 308,631
2004 1,083 12,332 29,118 42,533 353,686
2005 1,059 14,020 35,685 50,764 347,874
By the data provided in the traffic statistics made by General Gendarmerie
Commandership Head of Traffic Department, a total number of 34,279 accidents
occurred in year 2000 in which 1,268 of it included death, 9,434 of it included injury,
23,577 of it included substantial damage. As a result of these accidents 1,625 people
died, 20,529 people got injured; total cost of substantial damage was 31,238,699
YTL. Accident number is increased to 50,764 in 2005 and caused 1,310 deaths,
30,109 injuries and substantial damage of 126,876,873 YTL.
The table 4.3 provides the number of accidents, deaths, injuries and
substantial damages in the Gendarmerie zone according to the years. If we consider
that the people died in the hospitals are not included in this number of deaths, we
could see the tragedy of our traffic system much more clearly.
Table 4.3. Gendarmerie Zone Accident Data (GGC (TBD), 2005) Years Accident Number Death Number Injured Number Material Damage (YTL) 2000 34,279 1,625 20,529 31,238,699
2001 33,553 1,432 21,705 41,436,103
2002 32,855 1,269 21,820 50,977,480
2003 33,365 1,148 21,944 66,873,083
2004 42,533 1,346 26,548 95,729,840
2005 50,764 1,310 30,109 126,876,873
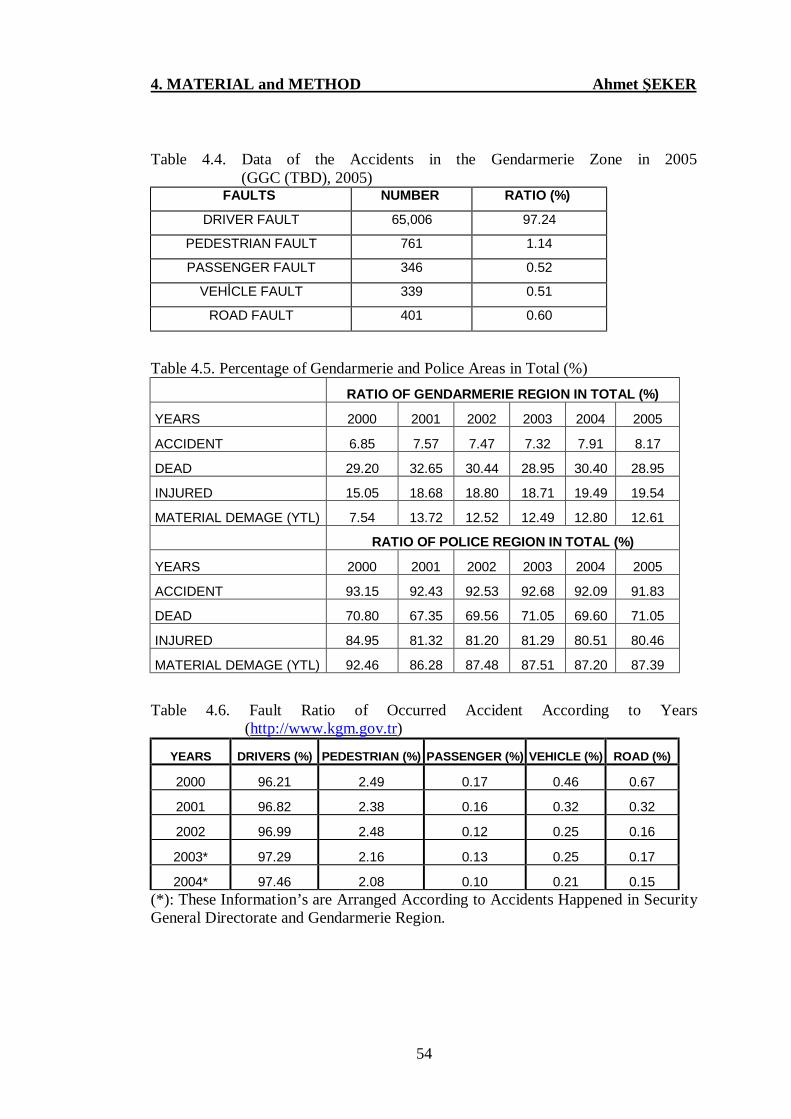
4. MATERIAL and METHOD Ahmet ŞEKER
54
Table 4.4. Data of the Accidents in the Gendarmerie Zone in 2005 (GGC (TBD), 2005)
FAULTS NUMBER RATIO (%)
DRIVER FAULT 65,006 97.24
PEDESTRIAN FAULT 761 1.14
PASSENGER FAULT 346 0.52
VEHİCLE FAULT 339 0.51
ROAD FAULT 401 0.60
Table 4.5. Percentage of Gendarmerie and Police Areas in Total (%) RATIO OF GENDARMERIE REGION IN TOTAL (%)
YEARS 2000 2001 2002 2003 2004 2005
ACCIDENT 6.85 7.57 7.47 7.32 7.91 8.17
DEAD 29.20 32.65 30.44 28.95 30.40 28.95
INJURED 15.05 18.68 18.80 18.71 19.49 19.54
MATERIAL DEMAGE (YTL) 7.54 13.72 12.52 12.49 12.80 12.61
RATIO OF POLICE REGION IN TOTAL (%)
YEARS 2000 2001 2002 2003 2004 2005
ACCIDENT 93.15 92.43 92.53 92.68 92.09 91.83
DEAD 70.80 67.35 69.56 71.05 69.60 71.05
INJURED 84.95 81.32 81.20 81.29 80.51 80.46
MATERIAL DEMAGE (YTL) 92.46 86.28 87.48 87.51 87.20 87.39
Table 4.6. Fault Ratio of Occurred Accident According to Years (http://www.kgm.gov.tr)
YEARS DRIVERS (%) PEDESTRIAN (%) PASSENGER (%) VEHICLE (%) ROAD (%)
2000 96.21 2.49 0.17 0.46 0.67
2001 96.82 2.38 0.16 0.32 0.32
2002 96.99 2.48 0.12 0.25 0.16
2003* 97.29 2.16 0.13 0.25 0.17
2004* 97.46 2.08 0.10 0.21 0.15 (*): These Information’s are Arranged According to Accidents Happened in Security General Directorate and Gendarmerie Region.


4. MATERIAL and METHOD Ahmet ŞEKER
62
Table 4.11. Percentages of Motorized Vehicle, Population and Accident Numbers (http://www.kgm.gov.tr, 2005)
YEARS
MOTORIZED
VEHICLE
NUMBER
RISE
% POPULATION
RISE
%
DRIVING
LICENCES
NUMBERS
RISE
%
ACCIDENT
NUMBER
RISE
%
1994 5,606,712 6,35 60,637,000 1,85 8,794,843 7,74 233,803 11,96
1995 5,922,859 5,34 61,763,000 1,82 9,388,630 6,75 279,663 19,61
1996 6,305,707 6,07 62,909,000 1,82 10,242,628 9,10 344,641 23,23
1997 6,863,462 8,13 64,064,000 1,80 11,297,235 10,30 387,533 12,44
1998 7,371,241 6,89 65,215,000 1,76 12,277,101 8,67 440,149 13,58
1999 7,758,511 4,99 66,350,000 1,71 13,151,950 7,13 438,338 -0,41
2000* 8,320,449 6,75 67,420,000 1,59 14,109,116 7,28 500,663 12,45
2001* 8,521,956 2,36 68,365,000 1,38 14,767,116 4,67 442,960 -13,03
2002* 8,655,170 1,54 69,302,000 1,35 15,285,187 3,51 439,958 -0,68
2003* 8,903,843 2,79 70,231,000 1,32 15,787,933 3,29 455,667 3,45
2004* 10,236,358 13,02 71,152,000 1,29 16,468,317 4,31 537,384 15,21 Source: State Institute of Statistics, Motorized Vehicle Statistics, July (2005) (*): These Informations Are Arranged According to Occurred Accidents in Security General Directorate and Gendarmerie Region.
Table 4.12. Accident number, Dead number and Injured number at Million Vehicles x Km. (http://www.kgm.gov.tr)
YEARS TOTAL VEHICLES X KM
(MILLION) ACCIDENDT DEAD INJURED
2000 56,151 172 7 115
2001 52,631 151 6 102
2002 51,664 149 6 104
2003 52,349 157 6 111
2004 57,767 175 6 119 (*): These Informations Are Arranged According to Occurred Accidents in Security General Directorate and Gendarmerie Region

4. MATERIAL and METHOD Ahmet ŞEKER
63
Table 4.13. Ratio of Automobiles in Some Country, 2003 (IRTAD, 2005) COUNTRY AUTOMOBILE
(x1000) TOTAL (x1000)
AUTOMOBILE RATIO %
AUSTRIA 3,987 5,114 77.96
BELGIUM 4,821 5,980 80.62
GREECE 3,195 5,061 63.13
CZECH REPUBLİC 3,647 4,490 81.22
DENMARK 1,888 2,502 75.46
FINLAND 2,195 2,657 82.61
FRANCE 29,160 36,198 80.56
NETHERLAND 6,855 8,387 81.73
ENGLAND 26,953 31,950 84.36
IRELAND 1,507 1,937 77.80
SPAIN 18,688 25,170 74.25
SWEDEN 4,045 4,998 80.93
SWEDZERLAND 3,754 4,888 76.80
USA 131,072 230,788 56.79
HUNGARY 2,630 3,141 83.73
NORWAY 1,900 2,752 69.04
POLOND 11,244 15,899 70.72
PORTUGAL 3,683 5,197 70.87
JAPAN 54,541 80,970 67.36
TURKEY * 5,401 10,236 52.76 (*): Data belongs to 2004
95,02 91,38
3,4 5,210,01 3,24 1,57 0,17
0
20
40
60
80
100
RATIO
Highw ay Railw ay Seaw ay Airline
TYPE OF TRANSPORT
%passenger
%load
Figure 4.1. Ratio of Transport (http://www.die.gov.tr, 2003)

4. MATERIAL and METHOD Ahmet ŞEKER
64
Table 4.14. Legal Speed Limit of Vehicles Which Are Obey in Turkey (http://www.kgm.gov.tr, 2005)
VEHICLE TYPES
IN SETTLEMENT
PLACE
OUT SETTLEMENT
PLACE ON
HIGHWAY
(Km/Hour) (Km/Hour) (Km/Hour)
Automobile 50 90 120
Bus 50 80 100
Minibus, lorry and pickup 50 80 90
Ground vehicle and motorbike 50 70 80 Vehicles which carry dangerous matter and vehicles which have load carrying permission certificate or special certificate (if there is not adverse command at the certificate)
30 50 60
Motorized and motorless bicycle 30 50 - Rubber wheel tractor, vehicle, work machines which pull a defective Vehicle 20 20 -


4. MATERIAL and METHOD Ahmet ŞEKER
66
4.2. Method
Some important, considerable tables and graphics are derived by using
‘‘SPSS 11.0’’ program and office applications after considering all data and
statistics, especially data and statistics sticking out between years 2000-2005.
4.2.1. Statistical Package for the Social Sciences (SPSS)
The “Statistical Package for the Social Sciences” (SPSS) is a package of
programs for manipulating, analyzing, and presenting data; the package is widely
used in the social and behavioral sciences. There are several forms of SPSS. The core
program is called SPSS Base and there are a number of add-on modules that extend
the range of data entry, statistical, or reporting capabilities. In our experience, the
most important of these for statistical analysis are the SPSS Advances Models and
SPSS Regression Models add-on modules. SPSS Inc. also distributes stand-alone
programs that work with SPSS (Sabine, 2004).
4.2.2. Regression Analysis (Reg.)
In statistics, regression analysis examines the relation of a dependent variable
(response variable) to specified independent variables (explanatory variables). The
mathematical model of their relationship is the regression equation. The dependent
variable is modeled as a random variable because of uncertainty as to its value, given
only the value of each independent variable. A regression equation contains
estimates of one or more hypothesized regression parameters ("constants"). These
estimates are constructed using data for the variables, such as from a sample. The
estimates measure the relationship between the dependent variable and each of the
independent variables. They also allow estimating the value of the dependent
variable for a given value of each respective independent variable.
Uses of regression include curve fitting, prediction (including forecasting of
time-series data), modeling of causal relationships, and testing scientific hypotheses

4. MATERIAL and METHOD Ahmet ŞEKER
67
about relationships between variables
(http://en.wikipedia.org/wiki/Regression_analysis).
Regression analyze is a method to explain the correlation mathematically.
This explanation is called as “regression equation”.
In general a regression equation likes:
Y` = a + bX
X: The independent variable that have been chosen.
Y`: The estimated value of Y with respect to X value.
a: The value of Y-axis at the point of intersection of line and Y-axis.
b: Slope of the equation.
a and b: Coefficients of regression.
4.2.3. Correlation Analysis (Cor.)
In probability theory and statistics, correlation, also called correlation
coefficient, indicates the strength and direction of a linear relationship between two
random variables. In general statistical usage, correlation or co-relation refers to the
departure of two variables from independence. In this broad sense there are several
coefficients, measuring the degree of correlation, adapted to the nature of data.
A number of different coefficients are used for different situations. The best
known is the Pearson product-moment correlation coefficient, which is obtained by
dividing the covariance of the two variables by the product of their standard
deviations. Despite its name, it was first introduced by Francis Galton.
The correlation is defined only if both of the standard deviations are finite and
both of them are nonzero. It is a corollary of the Cauchy-Schwarz inequality that the
correlation cannot exceed 1 in absolute value.
The correlation is 1 in the case of an increasing linear relationship, −1 in the
case of a decreasing linear relationship, and some value in between in all other cases,
indicating the degree of linear dependence between the variables. The closer the
coefficient is to either −1 or 1, the stronger the correlation between the variables.
If the variables are independent then the correlation is 0, but the converse is

4. MATERIAL and METHOD Ahmet ŞEKER
68
not true because the correlation coefficient detects only linear dependencies between
two variables (http://en.wikipedia.org/wiki/Correlation).

5. RESULTS and DISCUSSIONS Ahmet ŞEKER
69
5. RESULTS and DISCUSSIONS
In this study, the reasons of traffic accidents happened between the years
2000-2005 on the Gendarmerie zones of Turkey are investigated and analyzed some
important statistical results and developments in the world are considered beside the
conditions of Gendarmerie and Police forces. And the following results listed below
are derived in the study.
Traffic accidents, in some countries it can be measure of hundred thousands
of dollars, but the injuries and deaths which can not be evaluated in monetarily
cause not only to break down of people in the accidents, his/her families and
relatives psychologically and sociologically but also affects society in both ways. In
a scientific survey done on the damning of the injured and relatives of injured and
death people, it is declared that 4% of relatives and 7% of injured people started to
use illegal drugs, 37% of relatives of death people and 17% of injured and his/her
relatives wanted to suicide during the first 3 years after accidents (Karakuş, 2006).
Traffic accidents must be considered as the grim realities such that the results of the
accidents are not news on the newspaper, not a study of statistical results or not a
digital number on an activity, but they are the social problems that must be
considered sensitively.
• After an accident, almost everyone firstly tries to understand that how the
accident happened and what the failure or mistake caused the accident. In the world
and also in our country the answer of this question is that about 97% of accidents
caused by human failure. When the Gendarmerie data of year 2000 (Table 5.1) is
considered, the sum of driver, pedestrian and passenger failure is 96.66% and it is the
biggest proportion in the factors of accidents. Other faults are 1.30% vehicle faults
and 2.07% road faults. Even if the driver fault is the biggest portion, the other faults
can not be neglected. Driver faults decreases in parallel with the redevelopment of
enterprise and supervision.
• When fault ratios are analyzed, it is seen that driver faults were never lower
than 96%. This ratio is followed by 2-2.5% by pedestrian faults. Studies should be
conducted in order to decrease these faults firstly in driver faults and then pedestrian

5. RESULTS and DISCUSSIONS Ahmet ŞEKER
70
faults.
• Studies show that, drunken-driving is responsible for the 47% of fatal
accidents, 20% of injuries and 10% physically damaged accidents (Evans, 1999).
• When it is looked at the accident happened in the Gendarmerie region
between the years 2000-2005 (Table 5.2), there is no change in between the years
2000-2003, but between the years 2004-2003 and 2004-2005, the number of
accidents increased by 27.48% and 19.35% respectively.
• When it is observed carefully in the year 2000 the number of deaths per 100
accidents is 4.74, this ratio for year 2001 is 4.26, year 2002 is equal to year 2003
there is a reduction to 3.44, year 2004 there is still decrease to 3.16, and in the year
2005 there is sharp decrease to 2.58 per 100 accidents. As understood by the values,
a continuous decrease will be observed for the future. The reason for the decrease of
death ratio per every year is increasing of vehicle safety with new models and new
safety standards and as well as improvement of emergency medical services in
Turkey.
Because of the linear increase in the number of accidents, numbers of injured
and monetary are also increased. Although in year 2005; the numbers of deaths are
less than in year 2004, but the number of injuries are increased in year 2005 with
respect to year 2004.
• As seen from table the numbers of traffic personnel according to population
are very in adequate in Turkey. In London, there are 10,000 traffic polices for every
9,000,000 people, In Vienna, 4000 for 2,000,000, in Tokyo 11,000 for 18,000,000
people. In Turkey there are only 2300 traffic policemen for every 11,000,000 people.
• As long as there are no reasons to explain the flow chart of the accidents,
there is no possibility of determining the solutions. Moreover GIS systems can
provide these kinds of information. The integration of GIS and Geographic Place
Systems (GPS) provides all the missing information of the incomplete accident
record (William, 1998). The usage of Geographical Information Systems (GIS)
provides great advantages on visualizing the data, on analyzing the results and on
solving problems related to the geographic conditions. The investments and studies
about this issue are insufficient. The required investments should be made on this

5. RESULTS and DISCUSSIONS Ahmet ŞEKER
71
subject whom its benefits clear in minimum time. Otherwise our country will lose
money and time plus mislead information.
• Based on Transportation Research Laboratory’s (TRL) experimental data, if
average speed decreases 1 km/h, accidents and injuries decrease by a proportion of
3% (SGD, 2000). The situation is that obvious. Everybody easily calculates that a 1
km/h decrease will prevent to loss of many lives and capital. If the collision speed of
the car increases from 40km/h to 60km/h the death risk of a foot passenger increases
five times than in the former case (SGD (Highway Traffic), 1999). This can be
recorded as an important research result that must not be forgotten.
5.1. General Accident Data of Turkey Figure 5.1 shows that total number of accidents between years 2000 and 2005
in Turkey. There is a slight reduction at the total number accident in years 2001 and
2002. Total accident number is slightly increased in years 2004, but there is an
important increase in 2005 because of the financial development in the rural area of
Turkey, and many people in these areas are having tractors, agriculture machineries
and vehicles.
0100000200000300000400000500000600000700000
2000 2001 2002 2003 2004 2005
YEARS
TO
TAL
AC
CID
ENT
NU
MB
ER
Figure 5.1. Total Number of Accidents between years 2000 and 2005 in Turkey
Figure 5.2 shows that total number of casualties between years 2000 and 2005

5. RESULTS and DISCUSSIONS Ahmet ŞEKER
72
in Turkey from the figure there is a linear correlation between the total number of
accidents and dead numbers. But the dead number is slightly less if it is compared
with accident numbers in 2005. The reason for this is increased safety of vehicles,
road, consciousness and emergency medical treatments.
0
1000
2000
3000
4000
5000
6000
2000 2001 2002 2003 2004 2005
YEARS
TO
TAL
DEA
D N
UM
BER
Figure 5.2. Total Number of Dead between years 2000 and 2005 in Turkey
Figure 5.3 shows the total number of injuries between years 2000 and 2005 in
Turkey. Total numbers of injuries are slightly decreased in year 2001, because of
strict control of traffic, but increased continuously in between years 2002-2005. The
reason for the increase of the number of injuries is the increase the total number of
vehicle, vehicle speed and young drivers.

5. RESULTS and DISCUSSIONS Ahmet ŞEKER
73
0
50000
100000
150000
200000
2000 2001 2002 2003 2004 2005
YEARS
TO
TAL
INJU
RED
N
UM
BER
Figure 5.3. Total Number of Injuries between years 2000 and 2005 in Turkey
Figures 5.4 indicates the total amount of material damage between years 2000
and 2005 in Turkey in 2001, there was very strict traffic control in Turkey and huge
amount of penalties were applied. After 2001, amount of material damage is
increased sharply because of increased vehicle and part price of advanced and
comfortable vehicles.
0
200000000
400000000
600000000
800000000
1000000000
1200000000
2000 2001 2002 2003 2004 2005
YEARS
AM
OU
NT
OF
MA
TER
IAL
DA
MA
GE
(YTL
)
Figure 5.4. Total Years Amount of Material Damage between years 2000 and 2005
in Turkey
Figures from 5.5 to 5.13 in below are the results of data retrieved only from
Gendarmerie zones of Turkey between years 2000 and 2005.

5. RESULTS and DISCUSSIONS Ahmet ŞEKER
74
Figure 5.5 illustrates the number of materially damaged accident in
Gendarmerie zones of Turkey between years 2000 and 2005. The number of
materially damaged accident is almost same in between year 2000 and 2003, but
sharp increase in years 2004 and 2005. This increase can easily be explained by the
increased by the increase in the total number of accidents.
0
500010000
1500020000
25000
30000
35000
40000
2000 2001 2002 2003 2004 2005
YEARS
NU
MB
ER O
F M
ATE
RIA
L D
AM
AG
ED A
CC
IDEN
T
Figure 5.5. Number of Materially Damaged Accidents in Gendarmerie zones of
Turkey between years 2000 and 2005
Figure 5.6 indicates that total number of accidents between years 2000 and
2005 in Gendarmerie zones of Turkey. Total number of accidents in Gendarmerie
zones of Turkey is almost constant in between years 2000 and 2003. But followed
years (2004 and 2005) there are sharp increase on the number of accidents because of
increased number of vehicles in the rural areas of Turkey.

5. RESULTS and DISCUSSIONS Ahmet ŞEKER
75
0100002000030000400005000060000
2000 2001 2002 2003 2004 2005
YEARS
NU
MB
ER O
F A
CC
IDEN
T
Figure 5.6. Total Number of Accidents between years 2000 and 2005 in Gendarmerie
zones of Turkey
Figure 5.7 indicates the number of dead between years 2000 and 2005 in
Gendarmerie zones of Turkey. The total number of dead in Gendarmerie zones of
Turkey is decreased instead of the total number of accident in between years 2000
and 2003. There is a slightly increased in 2004 after that slight decrease in 2005
when the number of vehicles and accidents are increased, because of better
emergency aid and medical treatments in Turkey. Also increased safety equipments
in the vehicles (ABS, Airbag etc) and drivers getting more conscious are the main
reasons of this conflict.
0
500
1000
1500
2000
2000 2001 2002 2003 2004 2005
YEARS
NU
MB
ER O
F D
EAD
Figure 5.7. Numbers of Dead between years 2000 and 2005 in Gendarmerie Zones of
Turkey

5. RESULTS and DISCUSSIONS Ahmet ŞEKER
76
Figure 5.8 shows that the number of injuries in Gendarmerie zones of Turkey
between years 2000 and 2005.
From figure 5.6 and figure 5.8 it is clear that there are similar trends between
number of injuries and the total number of accidents.
0
5000
10000
15000
20000
25000
30000
35000
2000 2001 2002 2003 2004 2005
YEARS
NU
MB
ER O
F IN
JUR
IES
Figure 5.8. Number of Injuries in Gendarmerie zones of Turkey between 2000 and
2005
Figure 5.9 illustrates that the number of drives fined in the Gendarmerie
zones of Turkey between years 2000 and 2005. In 2000, Turkish Government
pressurized on the fine policy to discourage the drivers. Therefore, the number of
fined drivers made a peak in 2000. The Government lifted the pressure on the fire
policy, the number of fined drivers is decreased between year 2001 and 2003. There
is again a sharp increase in year 2004 and slight decrease in year 2005.
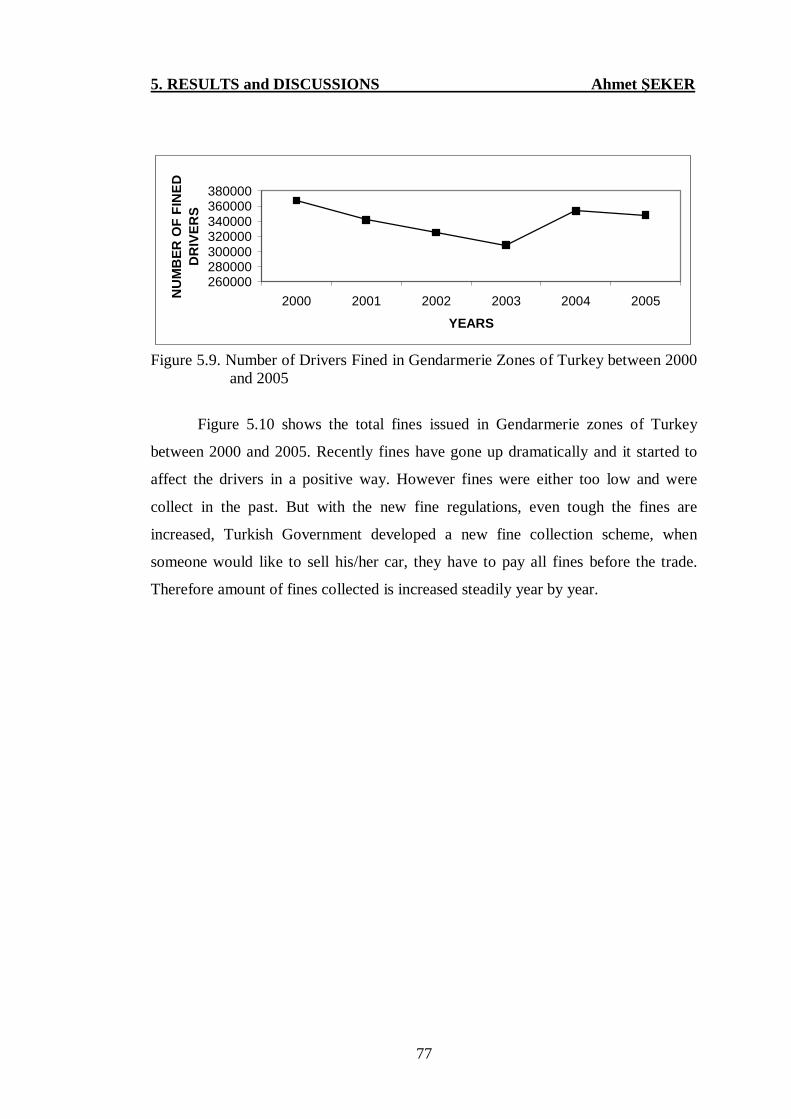
5. RESULTS and DISCUSSIONS Ahmet ŞEKER
77
260000280000300000320000340000360000380000
2000 2001 2002 2003 2004 2005
YEARS
NU
MB
ER O
F FI
NED
D
RIV
ERS
Figure 5.9. Number of Drivers Fined in Gendarmerie Zones of Turkey between 2000
and 2005
Figure 5.10 shows the total fines issued in Gendarmerie zones of Turkey
between 2000 and 2005. Recently fines have gone up dramatically and it started to
affect the drivers in a positive way. However fines were either too low and were
collect in the past. But with the new fine regulations, even tough the fines are
increased, Turkish Government developed a new fine collection scheme, when
someone would like to sell his/her car, they have to pay all fines before the trade.
Therefore amount of fines collected is increased steadily year by year.

5. RESULTS and DISCUSSIONS Ahmet ŞEKER
78
0
5000
10000
15000
20000
25000
30000
35000
40000
45000
50000
2000 2001 2002 2003 2004 2005
YEARS
AM
OU
NT
OF
FIN
ES (Y
TL)
Figure 5.10. Amount of Fines Applied in the Gendarmerie Zones of Turkey between
2000 and 2005
Figure 5.11 demonstrates the number of drivers banned from traffic in the
Gendarmerie zones of Turkey between years 2000 and 2005. Number of drivers
banned from traffic in the Gendarmerie zones of Turkey is almost constant between
years 2000 and 2005, but sudden increase in year 2005 with excessive control.

5. RESULTS and DISCUSSIONS Ahmet ŞEKER
79
0
10000
20000
30000
40000
50000
60000
70000
2000 2001 2002 2003 2004 2005
YEARS
NU
MB
ER O
F D
RIV
ERS
BA
NN
ED
FRO
M T
RA
FFIC
Figure 5.11. Number of Drivers Banned from Traffic in the Gendarmerie Zones of
Turkey between 2000 and 2005
Figure 5.12 illustrates number of drivers licence revoked in the Gendarmerie
zones of Turkey between 2000 and 2005. There is a sharp, increase for revoked
driver license in Gendarmerie zones of Turkey between 2000 and 2002. There is a
slight decrease in year 2003 constantly in between years 2003 and 2005. In between
2000 and 2002, new regulations were effected and driver licenses have started to
revoke for DUI driver.

5. RESULTS and DISCUSSIONS Ahmet ŞEKER
80
0
2000
4000
6000
8000
10000
12000
14000
2000 2001 2002 2003 2004 2005
YEARS
NU
MB
ER O
F D
RIV
ING
LIC
ENC
E R
EVO
KED
Figure 5.12. Number of Driver License revoked in the Gendarmerie zones of Turkey
between 2000 and 2005
Figure 5.13 shows that the total accident reasons in Gendarmerie zones of
Turkey between 2000 and 2005. As seen from the figure that, the most important
reason for the accidents is the drivers’ carelessness. Excessive speed, faulty
overtakes and drunk driver is the other important reasons. On the contrast to the
general opinion, technical problem have a little share to the traffic accidents.

5. RESULTS and DISCUSSIONS Ahmet ŞEKER
81
133652
31248
11357
1918 1794 5157 3969
0
20000
40000
60000
80000
100000
120000
140000
160000
CARELESSNESS
EXTREMELY SPEED
FAULTY O
VERTAKE
MISTA
KE OF PEDESTRIAN
TECHNICAL B
REAKDOWN
USING VEHIC
LE A
S ALC
OHOLICS
DRIVING W
ITHOUT DRIV
ING LI
CENCE
REASONS
NU
MB
ER O
F A
CC
IDEN
T
Figure 5.13. Total Accidents Reasons in Gendarmerie Zones of Turkey between
2000 and 2005
Figure 5.14 indicates the number of accidents happened in Gendarmerie

5. RESULTS and DISCUSSIONS Ahmet ŞEKER
82
zones of Turkey in year 2005. As seen from the figure that, the number of accidents
is increased in summer period of time because of heavy traffic in holiday season, as
well as using and moving all types of agricultural machineries because of cultivation
period of agricultural products.
0
1000
2000
3000
4000
5000
6000
JANUARY
FEBRUARY
MARCHAPRIL
MAYJU
NEJU
LY
AUGUST
SEPTEMBER
OCTOBER
NOVEMBER
DECEMBER
MONTHS
NUM
BER
OF
ACCI
DENT
Figure 5.14. Number of Accidents in Gendarmerie Zones of Turkey in year 2005
Figure 5.15 demonstrates the number of dead in the Gendarmerie zones of
Turkey in year 2005. As seen from the figure, number of casualties is increased in
summer time again due to the increase in number of accidents.
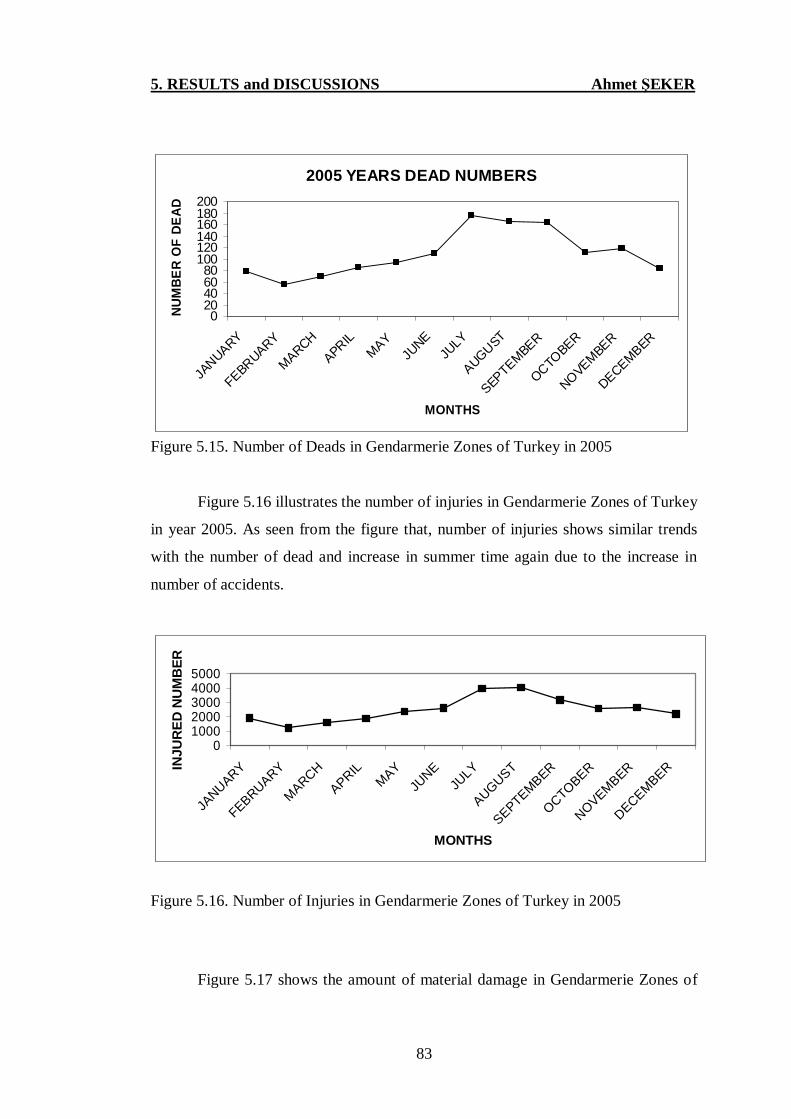
5. RESULTS and DISCUSSIONS Ahmet ŞEKER
83
2005 YEARS DEAD NUMBERS
020406080
100120140160180200
JANUARY
FEBRUARY
MARCHAPRIL
MAYJU
NEJU
LY
AUGUST
SEPTEMBER
OCTOBER
NOVEMBE
R
DECEMBER
MONTHS
NUM
BER
OF
DEAD
Figure 5.15. Number of Deads in Gendarmerie Zones of Turkey in 2005
Figure 5.16 illustrates the number of injuries in Gendarmerie Zones of Turkey
in year 2005. As seen from the figure that, number of injuries shows similar trends
with the number of dead and increase in summer time again due to the increase in
number of accidents.
010002000300040005000
JANUARY
FEBRUARY
MARCHAPRIL
MAYJU
NEJU
LY
AUGUST
SEPTEMBER
OCTOBER
NOVEMBER
DECEMBER
MONTHS
INJU
RED
NU
MB
ER
Figure 5.16. Number of Injuries in Gendarmerie Zones of Turkey in 2005
Figure 5.17 shows the amount of material damage in Gendarmerie Zones of

5. RESULTS and DISCUSSIONS Ahmet ŞEKER
84
Turkey in year 2005. It is expected that the cost of physical damage is increased with
the increased number of accidents. Again the cost of physical damage is increased
especially in summer time.
02000000400000060000008000000
10000000120000001400000016000000
JANUARY
FEBRUARY
MARCHAPRIL
MAYJU
NEJU
LY
AUGUST
SEPTEMBER
OCTOBER
NOVEMBER
DECEMBER
MONTHS
AM
OU
NT
OF
MA
TER
IAL
DA
MA
GE
( YTL
)
Figure 5.17. Amount of Material Damage in Gendarmerie Zones of Turkey in 2005
Figure 5.18 indicates types of faults occurred in Gendarmerie Zones of
Turkey in year 2005.
Similar trends like general in Turkey have been observed in Gendarmerie
zones. Driver’s faults are the major issue and other faults have little share on general
distribution. This result medicates that drivers in Turkey are not well educated in the
driving courses.

5. RESULTS and DISCUSSIONS Ahmet ŞEKER
85
%97,24
%1,14 %0,52 %0,51 %0,600
20
40
60
80
100
DRIVERFAULT
PEDESTRIANFAULT
PASSENGERFAULT
VEHICLEFAULT
WAY FAULT
TYPES OF FAULTS
FA
ULT
RA
TIO
(%)
Figure 5.18. Fault Types of Faults Ratios in Gendarmerie Zones of Turkey in 2005
Figure 5.19 indicates the number of accidents in big cities happened in
Gendarmerie zones of Turkey in year 2005. The most of accidents have accurate in
İstanbul. Because of densely populated and vehicle city in big cities attributing to
densely populated and vehicle the number of accidents increase. Due to high
population and vehicle density in big cities, these results seem normal.
1164
45102914
1774
14141
02000400060008000
10000120001400016000
ADANA ANKARA BURSA İSTANBUL İZMİR
CITYS
NU
MB
ER O
F A
CC
IDEN
T
Figure 5.19. Accident Numbers in big cities in Gendarmerie zones of Turkey in 2005
Figure 5.20 indicates the number of deads in Gendarmerie zones of Turkey in
year 2005. It was expected that İstanbul would have been on the top of the list.

5. RESULTS and DISCUSSIONS Ahmet ŞEKER
86
However, Adana has the 1st rank and İzmir is the 2nd rank. Especially in summer
months tractor and agriculture machines are involved in the accidents, the
proportional of deaths increase it brought about the increasing the proportional of the
deaths in Adana.
46
26
5255 53
0
10
20
30
40
50
60
ADANA ANKARA BURSA İSTANBUL İZMİR
CITYS
NU
MB
ER O
F D
EAD
Figure 5.20. Dead Numbers in Big Cities in Gendarmerie zones of Turkey in 2005
Figure 5.21 illustrates the number of injuries in big cities in Gendarmerie
Zones of Turkey in year 2005. It is observed that there is a correlation with the total
number of accidents in the Gendarmerie zones of Turkey.
993
1.586
1.011
2.115
1.090
0
500
1.000
1.500
2.000
2.500
ADANA ANKARA BURSA İSTANBUL İZMİR
CITYS
INJU
RED
NU
MB
ER
Figure 5.21. Injured Numbers in Big Cities in Gendarmerie Zones of Turkey in 2005

5. RESULTS and DISCUSSIONS Ahmet ŞEKER
87
Figure 5.22 illustrates the number of materially damaged accident in big cities
in Gendarmerie zones of Turkey in year 2005. The number of material damage
is proportional whit the number of accidents. Because of this, the numbers of
material damage in big cities are similar to the number accident graph.
05.000.000
10.000.00015.000.00020.000.00025.000.00030.000.00035.000.000
ADANA ANKARA BURSA İSTANBUL İZMİR
CITYS
AM
OU
NT
OF
MA
TER
IAL
DA
MA
GE
( YTL
)
Figure 5.22. Amount of Material Damage in Big Cities in Gendarmerie Zones of
Turkey in 2005
Figure 5.23 illustrates number of driving licenses revoked DUI in big cities in Gendarmerie zones of Turkey in 2005. The driving licences are taken back for driving car while drunk. Considering this, a plenty of the entertainment place and holiday territories are proportional of the traffic accidents. Because this, İzmir, İstanbul and Bursa list in the first three order.

5. RESULTS and DISCUSSIONS Ahmet ŞEKER
88
0
500
1.000
1.500
ADANA ANKARA BURSA İSTANBUL İZMİR
CITYS
NU
MB
ER O
F D
RIV
ING
LI
CEN
CES
Figure 5.23. Number of Driving Licenses revoked DUI in big cities in Gendarmerie
zones of Turkey in 2005 Figure 5.24 illustrates number of drivers licence revoked in big cities in the
Gendarmerie zones of Turkey. In 2005, the number of driving licences were taken
back are discussed the number of the former graph similarity.
190450
965 956
1977
0
500
1000
1500
2000
2500
ADANA ANKARA BURSA İSTANBUL İZMİR
CITYS
NU
MB
ER O
F D
RIV
ING
LI
CEN
CES
Figure 5.24. Number of Driving Licenses revoked in big cities in Gendarmerie zones
of Turkey in 2005

5. RESULTS and DISCUSSIONS Ahmet ŞEKER
89
5.2. Correlation Analyses
Table 5.1. Police Region (Inside of City) Correlations
1 ,705 -,751 ,334 ,819*, ,118 ,086 ,518 ,0466 6 6 6 6
,705 1 -,092 ,898* ,957**,118 , ,863 ,015 ,003
6 6 6 6 6-,751 -,092 1 ,345 -,325,086 ,863 , ,503 ,529
6 6 6 6 6,334 ,898* ,345 1 ,756,518 ,015 ,503 , ,082
6 6 6 6 6,819* ,957** -,325 ,756 1,046 ,003 ,529 ,082 ,
6 6 6 6 6
Pearson CorrelationSig. (2-tailed)NPearson CorrelationSig. (2-tailed)NPearson CorrelationSig. (2-tailed)NPearson CorrelationSig. (2-tailed)NPearson CorrelationSig. (2-tailed)N
YEAR
ACCIDENT
DEAD
INJURED
P.DAMAGE
YEAR ACCIDENT DEAD INJURED P.DAMAGE
Correlation is significant at the 0.05 level (2-tailed).*.
Correlation is significant at the 0.01 level (2-tailed).**.
The correlation in the table 5.1 shows a high level positive relations r = 0.705
on intersection cell of year row and accident column, a high level negative relations r
= -0.751 on intersection cell of year row and dead column, a middle level positive
relations r = 0.334 on intersection cell of year row and injured column, a important
high level positive relations r = 0.819* on intersection cell of year row and material
damage column at table 5.1.
The correlation in the table 5.1 demonstrates an important high level positive
relations r = 0.898* between accident and injured numbers, a very important high
level positive relations r = 0.957* between accident and material damage.

5. RESULTS and DISCUSSIONS Ahmet ŞEKER
90
Table 5.2. Police Region (Outside of City) Correlations
1 ,391 -,121 ,375 ,745, ,444 ,819 ,464 ,089
6 6 6 6 6,391 1 ,811 ,988** ,901*,444 , ,050 ,000 ,014
6 6 6 6 6-,121 ,811 1 ,857* ,551,819 ,050 , ,029 ,257
6 6 6 6 6,375 ,988** ,857* 1 ,895*,464 ,000 ,029 , ,016
6 6 6 6 6,745 ,901* ,551 ,895* 1,089 ,014 ,257 ,016 ,
6 6 6 6 6
Pearson CorrelationSig. (2-tailed)NPearson CorrelationSig. (2-tailed)NPearson CorrelationSig. (2-tailed)NPearson CorrelationSig. (2-tailed)NPearson CorrelationSig. (2-tailed)N
YEAR
ACCIDENT
DEAD
INJURED
P.DAMAGE
YEAR ACCIDENT DEAD INJURED P.DAMAGE
Correlation is significant at the 0.01 level (2-tailed).**.
Correlation is significant at the 0.05 level (2-tailed).*.
The correlation in the table 5.2 illustrates a middle level positive relations r =
0.391 on intersection cell of year row and accident column, a low level negative
relations r =-0.121 on intersection cell of year row and dead column, a middle level
positive relations r = 0.375 on intersection cell of year row and injured column, a
high level positive relations r = 0.745 on intersection cell of year row and material
damage column at table 5.2.
The correlation in the table 5.2 shows a very important high level positive
relations r = 0.988* between accident and injured numbers, an important high level
positive relations r = 0.901* between accident and material damage, an important
high level positive relations r = 0.857* between dead and injured numbers, an
important high level positive relations r = 0.895* between injured and amount of
material damage.

5. RESULTS and DISCUSSIONS Ahmet ŞEKER
91
Table 5.3. Police Region (Total) Correlations
1 ,666 -,433 ,364 ,797, ,149 ,392 ,478 ,0586 6 6 6 6
,666 1 ,348 ,932** ,958**,149 , ,499 ,007 ,003
6 6 6 6 6-,433 ,348 1 ,664 ,188,392 ,499 , ,150 ,722
6 6 6 6 6,364 ,932** ,664 1 ,836*,478 ,007 ,150 , ,038
6 6 6 6 6,797 ,958** ,188 ,836* 1,058 ,003 ,722 ,038 ,
6 6 6 6 6
Pearson CorrelationSig. (2-tailed)NPearson CorrelationSig. (2-tailed)NPearson CorrelationSig. (2-tailed)NPearson CorrelationSig. (2-tailed)NPearson CorrelationSig. (2-tailed)N
YEAR
ACCIDENT
DEAD
INJURED
P.DAMAGE
YEAR ACCIDENT DEAD INJURED P.DAMAGE
Correlation is significant at the 0.01 level (2-tailed).**.
Correlation is significant at the 0.05 level (2-tailed).*.
The correlation in the table 5.3 demonstrates a middle level positive relations
r = 0.666 on intersection cell of year row and accident column, a middle level
negative relations r =-0.433 on intersection cell of year row and dead column, a
middle level positive relations r = 0.364 on intersection cell of year row and injured
column, a high level positive relations r = 0.797 on intersection cell of year row and
material damage column at table 5.3.
It shows a very important high level positive relations r = 0.932** between
accident and injured numbers, a very important high level positive relations r =
0.958** between accident and amount of material damage, an important high level
positive relations r = 0.836* between injured and amount of material damage.
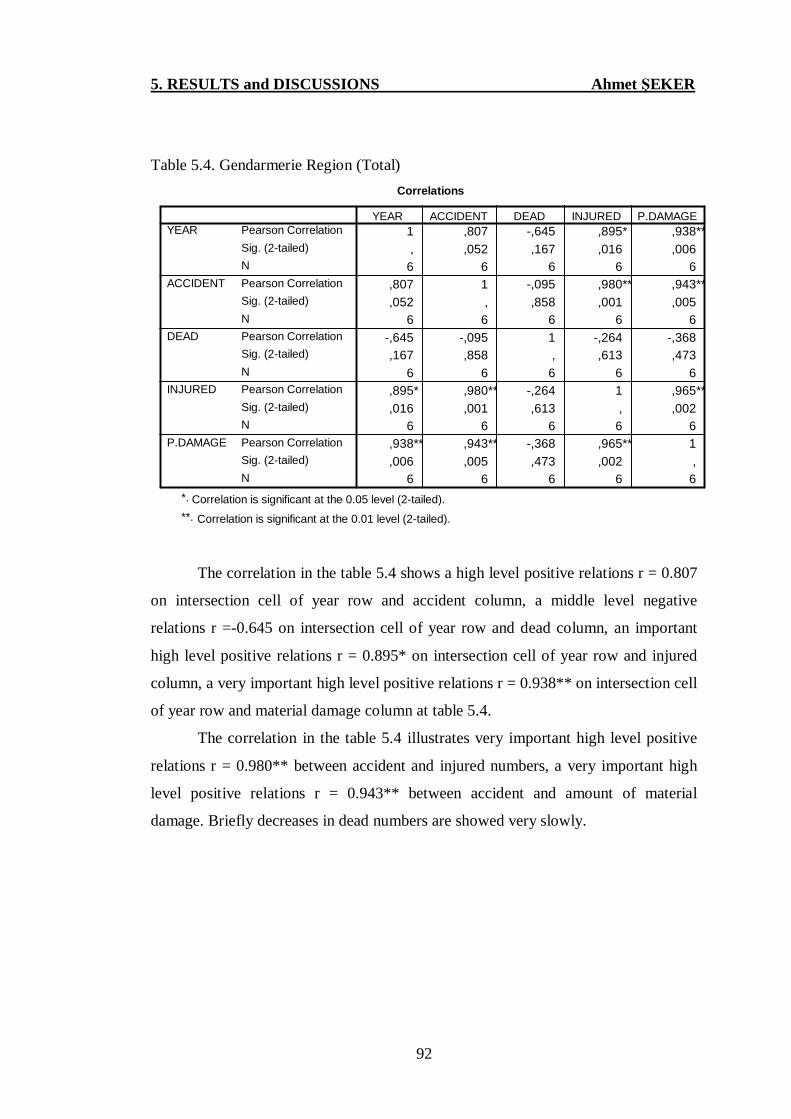
5. RESULTS and DISCUSSIONS Ahmet ŞEKER
92
Table 5.4. Gendarmerie Region (Total) Correlations
1 ,807 -,645 ,895* ,938**, ,052 ,167 ,016 ,006
6 6 6 6 6,807 1 -,095 ,980** ,943**,052 , ,858 ,001 ,005
6 6 6 6 6-,645 -,095 1 -,264 -,368,167 ,858 , ,613 ,473
6 6 6 6 6,895* ,980** -,264 1 ,965**,016 ,001 ,613 , ,002
6 6 6 6 6,938** ,943** -,368 ,965** 1,006 ,005 ,473 ,002 ,
6 6 6 6 6
Pearson CorrelationSig. (2-tailed)NPearson CorrelationSig. (2-tailed)NPearson CorrelationSig. (2-tailed)NPearson CorrelationSig. (2-tailed)NPearson CorrelationSig. (2-tailed)N
YEAR
ACCIDENT
DEAD
INJURED
P.DAMAGE
YEAR ACCIDENT DEAD INJURED P.DAMAGE
Correlation is significant at the 0.05 level (2-tailed).*.
Correlation is significant at the 0.01 level (2-tailed).**.
The correlation in the table 5.4 shows a high level positive relations r = 0.807
on intersection cell of year row and accident column, a middle level negative
relations r =-0.645 on intersection cell of year row and dead column, an important
high level positive relations r = 0.895* on intersection cell of year row and injured
column, a very important high level positive relations r = 0.938** on intersection cell
of year row and material damage column at table 5.4.
The correlation in the table 5.4 illustrates very important high level positive
relations r = 0.980** between accident and injured numbers, a very important high
level positive relations r = 0.943** between accident and amount of material
damage. Briefly decreases in dead numbers are showed very slowly.

5. RESULTS and DISCUSSIONS Ahmet ŞEKER
93
Table 5.5. General Total (Police and Gendarmerie) Correlations
1 ,683 -,507 ,516 ,821*, ,135 ,304 ,295 ,0456 6 6 6 6
,683 1 ,260 ,976** ,955**,135 , ,619 ,001 ,003
6 6 6 6 6-,507 ,260 1 ,463 ,059,304 ,619 , ,355 ,911
6 6 6 6 6,516 ,976** ,463 1 ,892*,295 ,001 ,355 , ,017
6 6 6 6 6,821* ,955** ,059 ,892* 1,045 ,003 ,911 ,017 ,
6 6 6 6 6
Pearson CorrelationSig. (2-tailed)NPearson CorrelationSig. (2-tailed)NPearson CorrelationSig. (2-tailed)NPearson CorrelationSig. (2-tailed)NPearson CorrelationSig. (2-tailed)N
YEAR
ACCIDENT
DEAD
INJURED
P.DAMAGE
YEAR ACCIDENT DEAD INJURED P.DAMAGE
Correlation is significant at the 0.05 level (2-tailed).*.
Correlation is significant at the 0.01 level (2-tailed).**.
The correlation in the table 5.5 show to be a middle level positive relations r
= 0.683 on intersection cell of year row and accident column, a middle level negative
relations r =-0.507 on intersection cell of year row and dead column, a middle level
positive relations r = 0.516 on intersection cell of year row and injured column, an
important high level positive relations r = 0.821* on intersection cell of year row and
material damage column at table 5.5.
The correlation in the table 5.5 demonstrates very important high level
positive relations r = 0.976** between accident and injured numbers, a very
important high level positive relations r = 0.955** between accident and amount of
material damage, an important high level positive relations r = 0.892* between
injured and amount of material damage.


5. RESULTS and DISCUSSIONS Ahmet ŞEKER
95
Abbreviations: accident number (ACCIDENT), dead number (DEAD),
injured number (INJURED), number of drivers which are punished (NDP), number
of drivers which are sent law court (NDSLC), number of vehicles which are
forbidden from traffic (NVFT), number of driving licences which are taken back (
NDLTB), total population (TP), city population (CP), village population (VP), total
vehicle (TV), auto number (AN).
The correlation in the table 5.6 demonstrates very important high level
positive relations r = 0.591** on intersection cell of accident row and dead column,
a very important high level positive relations r =0.814** on intersection cell of
accident row and injured column, a very important high level positive relations r =
0.939** on intersection cell of accident row and, number of drivers which are
punished ,a very important high level positive relations r = 0.744** on intersection
cell of accident row and number of drivers which are sent law court, a very important
high level positive relations r = 0.711** on intersection cell of accident row and
number of vehicles which are forbidden from traffic column, a very important high
level positive relations r = 0.738** on intersection cell of accident row and number
of driving licenses which are taken back column, a very important middle level
positive relations r =386** on intersection cell of accident row and total population
numbers column, a very important high level positive relations r = 0.963** on
intersection cell of accident row and total vehicle numbers column at table 5.6.
The correlation in the table 5.6 illustrates very important middle level positive
relations r = 0.519** between total population and dead numbers, a very important
middle level positive relations r = 0.611** between automobile numbers and dead
numbers a very important high level positive relations r = 0.981** between total
accident numbers and injured accidents, an important high level positive relations r =
0.841* between total population numbers and injured accident, a very important high
level positive relations r = 0.989** between total vehicle number and injured
accidents, a wonderful level positive relations r = 0.999** between total accident
numbers and amount of material damage, a very important high level positive
relations r = 0.981** between total accident numbers and injured accidents, a very
important high level positive relations r = 0.980** between total accident numbers
5. RESULTS and DISCUSSIONS Ahmet ŞEKER
96
and injured numbers, a very important high level positive relations r = 0.981**
between total accident numbers and total vehicle numbers. When we look dead
numbers row, in general decrease in dead numbers are showed very slowly. If row
which comprises total population and vehicle numbers are determined, a positive
relation is showed for only injured numbers.


5. RESULTS and DISCUSSIONS Ahmet ŞEKER
98
Abbreviations: number of mortal accident (NMA), number of injured
accident (NIA), number of material damage accident (NMDA), total accident
number (TAN), dead number (DN), injured number (IN), number of drivers which
are punished (NDP), amount of punishment (AP), total population (POP), total
vehicle (TV), auto number (AUTO).
The correlation in the table 5.7 illustrates high level negative relations r = -
0.769 on intersection cell of year row and mortal accident column, a high level
positive relations r =0.881* on intersection cell of year row and injured accident
column, a high level positive relations r = 0.786 on intersection cell of year row and
material damage column, a high level positive relations r = 0.807 on intersection cell
of year row and total accident column , a middle level negative relations r = -0.645
on intersection cell of year row and dead column ,an important high level positive
relations r = 0.895* on intersection cell of year row and injured column, a low level
negative relations r =-0.196 on intersection cell of year row and number of drivers
which are punished column, a very important high level positive relations r =
0.973** on intersection cell of year row and amount of punishment column , a very
important high level positive relations r = 0.922** on intersection cell of year row
and total population column, an important high level positive relations r = 0.899* on
intersection cell of year row and total vehicles column , a very important high level
positive relations r = 0.921** on intersection cell of year row and automobile
numbers column at table 5.7.
The correlation in the table 5.7 shows an important high level positive
relations r = 0.879* between mortal accidents and dead numbers , a very important
high level positive relations r = 0.969** between injured accident and amount of
material damage, a very important high level positive relations r = 0.981** between
total accident numbers and injured accidents , an important high level positive
relations r = 0.841* between total population numbers and injured accident, a very
important high level positive relations r = 0.989** between total vehicle number and
injured accidents a wonderful level positive relations r = 0.999** between total
accident numbers and amount of material damage, a very important high level
positive relations r = 0.981** between total accident numbers and injured accidents,

5. RESULTS and DISCUSSIONS Ahmet ŞEKER
99
a very important high level positive relations r = 0.980** between total accident
numbers and injured numbers, a very important high level positive relations r =
0.981** between total accident numbers and total vehicle numbers.
5.3. Regression Analysis
Table 5.8. Estimate of Gendarmerie Region Accidents with Regression Analysis Variables Entered/Removed b
NDP, POP,TV
a , Enter
Model1
VariablesEntered
VariablesRemoved Method
All requested variables entered.a.
Dependent Variable: TANb.
ANOVAb
2,65E+08 3 88311894,59 4726,640 ,000a
37367,727 2 18683,8632,65E+08 5
RegressionResidualTotal
Model1
Sum ofSquares df Mean Square F Sig.
Predictors: (Constant), NDP, POP, TVa.
Dependent Variable: TANb.
Coefficientsa
112589,6 9589,565 11,741 ,0079,583E-03 ,000 1,449 43,960 ,001-2,20E-03 ,000 -,516 -15,746 ,004-2,85E-02 ,006 -,082 -4,908 ,039
(Constant)TVPOPNDP
Model1
B Std. Error
UnstandardizedCoefficients
Beta
StandardizedCoefficients
t Sig.
Dependent Variable: TANa.

5. RESULTS and DISCUSSIONS Ahmet ŞEKER
100
TV
12000000110000001000000090000008000000
TAN
60000
50000
40000
30000
Figure 5.25. Relationships between Total Vehicle (TV) and Total Accident Number
(TAN)
8
9
10
11
12
67 68 69 70 71 72 73POP
(Millions)
TV(M
illio
ns)
Figure 5.26. Relationships between Population (POP) and Total Vehicle (TV) At table 5.8, SPSS statistic program gives R and R2 which pertain to model,
straightened R2 and standard failure (Model Summary) regression analyses table
(ANOVA) and coefficient guess. According to this guess equation as follows
Y = 112,589.6 - 0.0285X1 - 0.0022X2 + 0.0096X3

5. RESULTS and DISCUSSIONS Ahmet ŞEKER
101
Dependent variable Y is to represent accident numbers. X1 which is defined
as independent variable is to represent number of drivers which are punished. X2 is to
represent total populations. X3 is to represent total vehicle numbers.
Table 5.9. Estimate of Gendarmerie Region Deaths with Regression Analysis Variables Entered/Removed b
POP, NDP,TAN, AUTO
a , Enter
Model1
VariablesEntered
VariablesRemoved Method
All requested variables entered.a.
Dependent Variable: DNb.
ANOVAb
130911,8 4 32727,952 122,032 ,068a
268,191 1 268,191131180,0 5
RegressionResidualTotal
Model1
Sum ofSquares df Mean Square F Sig.
Predictors: (Constant), POP, NDP, TAN, AUTOa.
Dependent Variable: DNb.
Coefficientsa
1191,722 2084,899 ,572 ,6691,100E-02 ,011 ,495 1,037 ,4886,168E-03 ,001 ,795 7,814 ,081-2,25E-04 ,000 -,760 -,955 ,515-1,79E-05 ,000 -,188 -,479 ,716
(Constant)TANNDPAUTOPOP
Model1
B Std. Error
UnstandardizedCoefficients
Beta
StandardizedCoefficients
t Sig.
Dependent Variable: DNa.

5. RESULTS and DISCUSSIONS Ahmet ŞEKER
102
05000
100001500020000250003000035000400004500050000
30000 35000 40000 45000 50000 55000
TAN
AM
OU
NT
OF
FIN
ES
(YTL
)
Figure 5.27. Relationships between Total Accident Number (TAN) and Amount of
Fines
05000
10000150002000025000300003500040000450005000055000
4 4,25 4,5 4,75 5 5,25 5,5 5,75 6
AUTO(Millions)
TAN
Figure 5.28. Relationships between Auto Number (AUTO) and Total Accident ……………...Number (TAN)

5. RESULTS and DISCUSSIONS Ahmet ŞEKER
103
At Table 5.9, SPSS statistic program gives R and R2 which pertain to model,
straightened R2 and standard failure (Model Summary) regression analyses table
(ANOVA) and coefficient guess. According to this guess equation as follows
Y = 1191,722 + 0.011X1 + 0.0062X2 - 1.79*10-5X3 - 2.25*10-4 X4
Our dependent variable Y is to dead numbers. X1 which is defined as
independent variable is to represent accident numbers. X2 is to represent number of
drivers which are punished. X3 is to represent total population. X4 is to represent
automobile numbers.

6. CONCLUSION Ahmet ŞEKER
104
6. CONCLUSION
In this search, it is tried to reach some results using the data taking from the
Gendarmerie General Commandership. If the data covers 15-20 years, it is possible
that more accurate results should be reached.
The number of people killed in the traffic accidents of Turkey in general can
be shown against per 100 accidents as follows; in year 2000 dead ratio is 1.11, in
year 2001 dead ratio is 0.99, in year 2002 dead ratio is 0.95, in year 2003 dead ratio
is 0.87, in year 2004 dead ratio is 0.82 and in year 2005 dead ratio is 0.73. These
results indicate that despite the increase in the number of accidents, there is a steady
decrease in the number of deaths. The reason for the decrease is improvements of
vehicle safety systems and as well as the better treatments in the emergency units of
Turkey. The percentage of deaths is decreased each year and this is wonderful result
for Turkey.
The number of people injured in the traffic accidents of Turkey in general can
be shown against per 100 accidents as follows; in year 2000 injury ratio is 27.24, in
year 2001 injury ratio is 26.23, in year 2002 injury ratio is 26.37, in year 2003 injury
ratio is 25.73, in year 2004 injury ratio is 25.35, and in year 2005 injury ratio is
24.80. There is a small decrease in number of injured people in last 6 years.
The number of deaths between 2000-2005 in Gendarmerie zones of Turkey
per 100 accidents can be concluded as follows; in year 2000 dead ratio is 4.74, in
year 2001 dead ratio is 4.26, in year 2002 dead ratio is 3.86, in year 2003 dead ratio
is 3.44, in year 2004 dead ratio is 3.16 and in year 2005 dead ratio is 2.58. There is a
substantial amount of decrease in the number of people killed in the per 100
accidents in the Gendarmerie zones, however it this data is compared with the
general data of Turkey, dead ratio is still very high in Gendarmerie zones, because of
Gendarmeries are responsible the tourist areas of Turkey and during the summer
periods, dead ratio is very high in these regions.
The other reasons for the decrease in the number of deaths are the increased
number of traffic controls in Turkey and drivers have become more conscious. As
the controls are done more frequently and the fine rates have been increased, the fine

6. CONCLUSION Ahmet ŞEKER
105
rates also has been increased in Gendarmerie territories in between 2000-2005.
The accidents occurred mostly in July and August. As it is holiday period
time, the traffic is the densest in these months. As a result, the number of accidents,
the number of deaths and the number of injuries have reached its top level in these
months.
The number of injuries between 2000-2005 in Gendarmerie zones of Turkey
per 100 accidents can be concluded as follows, in year 2000 injury ratio is 59.88, in
year 2001 injury ratio is 64.65, in year 2002 injury ratio is 66.41, in year 2003 injury
ratio is 65.76, in year 2004 injury ratio is 62.41 and in year 2005 injury ratio is 59.31.
When these results are considered, there has been neither increase nor decrease in the
number of injuries.
When the accidents which occurred in the Gendarmerie territory between
years 2000 and 2005 are considered, the number of people dead in the traffic
accidents of 5 big cities of Turkey can be summarized against per 100 accidents as
follows: in Adana dead ratio is 5.67, in Ankara dead ratio is 1.18, in Bursa dead ratio
is 1.84, in İstanbul death ratio is 0.58 and İzmir dead ratio is 3.5. According to these
results, Adana and İzmir have the highest death rates. Therefore more traffic control
and more attentions must be done in these ragions.
When the reasons for the accidents which occurred in the Gendarmerie
territories, between 2000 and 2005 are examined, there has been increase in
carelessness, imprudence and alcoholic driving whereas there has been decrease in
speed exceeding and careless overtaking.
In the analysis conducted in SPSS (figure 5.25), according to the 6 years data
relating to the total number of cars and accidents, there has been great increase in the
last 2 years whereas there has been no changes in the first 4 years.
There has been consistent increase in population and the number of cars
(figure 5.26).
The relation between the number of cars and the total number of accidents
(figure 5.28) shows that the total numbers of accidents increases as the number of
cars increases. If the factors that directly and indirectly affect the accidents are listed
and specified and studied deeply and take the precautions as a result, it is certain that

6. CONCLUSION Ahmet ŞEKER
106
the accidents will drastically decrease. The list of subject that should be discussed
and studied is as follows:
Ø How to be a good driver and who should be allowed to be a driver? The
responsibilities for individuals, for public; law topics, the sufficiency of the
authority given to police and gendarmerie.
Ø The present condition of the roads in our country, the condition that it should
be, standardization studies, engineering activities.
Ø How should a conscious pedestrian be like? How can this condition be
improved? The expectations from conscious pedestrians and how should a
conscious pedestrian be educated? What should be the contributions of the
media and the education activities?
Ø The present conditions of the vehicles in our country, their sufficiency,
standards and the affectivity and authority of the associations and
establishments in charge.
Ø The organization’ and the charged units’ structures and the authorities of thee
units, authority confusions.
Ø The effectiveness, compliance, authorization, organization of traffic polices.
Ø Proceeding and planning of short and long term projects.
Ø Necessary and special precautions for weather conditions.
Ø Wide spreading and implementing of speed cameras.
Ø Efficiency and effectiveness of sanctions on drunken-driving.
Ø Necessary precautions and sanctions against excessive speeding.
Ø Adequate technical equipment and equipments of Police and Gendarmerie.
Ø Regulations about psychological condition, educational background and age.

6. CONCLUSION Ahmet ŞEKER
107
Ø Gaining the present standards and existent conditions about health and first
aid activities.
Ø Legal regulations and sanctions about unplanned urbanization and
infrastructure.
Ø Activities that increases the control and security.
Ø Deterrence of punishment and existence condition.

108
REFERENCES
AKÇAY, O., 1998. Trafik Hukuku ve Yönetimi. Higher Education Council Press,
Ankara, 27-76, 210-243.
ANSARİ, S, AKHDAR, F., MANDOORAH, M., MAUTACRAY, K., 2000. Causes
and effects of Road Accidents in Suudi Arabia. Public Healh, 37-39, 114.
ASSOCIATION FOR SAFE INTERNATIONAL ROAD TRAVEL,
http://www.asirt.org/
BEDARD, M., 2002. The Independent Contribution of Driver, Crash, and Vehicle
Characteristic to Driver Fatalities Accident. 717-727.
BAĞIRGAN, N., 2006. Prediction of the traffic safety on rural highways. Doctorate
Thesis, Institute of Science and Technology, Süleyman Demirel University,
Isparta.
BEKIARIS, E., CODA, A. AND BATEN, G., 2000. The Use of Telematics and
Interactive Evulation Tools to Establish and Advanced and Reliable Driver
Training and Assessment System. 7th World Congress on Intelligent
Transport System, Turin, Italy.
BERGER, E.D., SNORTUM, J.R., 1986. A Structural Model of Drinking and
Driving: Alcohol Consumption, Social norms and Moral Commitments.
Criminology, 139-153.
BİLİM, A., 2006. Analysis of traffic accidents which occurs in Konya of city center
and determination of critical points. Thesis of MSc, Graduate School of
Natural and Applied Sciences Department of Civil Engineering, Selçuk
University, Konya.
CHLIAOUTAKIS, J.E., GNARDELLIS, C., DRAKOU, I., DRAVIRI, C.,
SBOUKIS, V., 2000. Modeling The Factors to Seatbelt Use by The Young
Drivers of Athens. Accident Analysis and Prevention, 32, 815-825.
CHRISTIE, N., TOWNER, E., CAIRNS, S., WARD, H., 2004. Children’s Road
Safety: An Int. Survey of Policy and Practice. Road Safety R.R: No. 47, DT.,
London.

109
COOK, L.J., KNIGHT, S., OLSON, L.M., NECHODOM, P.J., DEAN, J.M., 2000.
Motor Vehicle Crash Characteristics and Medical Outcomes Among Older
Drivers in Utah, 1992-1995. Annals of Emergency Medicine, 585-591.
ÇAKMAK, Y., 2000. Trafik Kazalarına Etki Eden Unsurlar ve Önlenmesi İçin
Tedbirler. Thesis of MSc, Institute of Science and Technology, Gazi
University, Ankara.
ÇELİKER, M., 1998. 2918 Sayılı Karayolları Trafik Kanunu İle İlgili
Yönetmelikler. Ankara.
DARÇIN, M., 2002. How to make controls in order to reduce the number of
accidents in the responsible areas of Gendarmerie. MSc Thesis, Institute of
Science and Technology, Gazi University, Ankara.
ECONOMIC COMMISSION FOR EUROPE (ECE), 2004. Statistic Of Road Traffic
Accidents In Europe and North America. Vol. XLIX, U.N., Geneva.
EVANS, L., 1999. Traffic Safety and Driver. Van Nosttrand Reinhold, Newyork.
FOSS, R.D., BEIRNESS, D.J., SPRATTLER, K., 1994. Seat Belt Use Drinking
Drivers in Minnessota. American Journal of Public Health, 1732-1737.
GENDARMERIE GENERAL COMMANDERSHIP, Traffic Branch Directorship,
2005. Ankara.
GENDARMERIE GENERAL COMMANDERSHIP, Traffic Branch Directorship,
1999. Jandarmanın Trafik Hizmetleri. Gendarmerie Periodical(October),
Ankara, 42.
GENDARMERIE GENERAL COMMANDERSHIP, 2001. Temel Trafik (J. Ok.
Öğt. Bşk.lığı). General Command of Gendarmerie Printing House, Ankara, 7.
GENERAL DIRECTORATE OF HIGHWAYS, 8th Five-Year Development Plan.
1998. Ankara.
GENERAL DIRECTORATE OF HIGHWAYS, 8th Five-Year Development Plan
(Communications), 2001. Trafik Düzeni, Karayollarında Can Güvenliği.
Special Committee Report No: State Planning Organization: 2579-SCR: 591,
Ankara, 2-34.
HIGHWAYS GENERAL DIRECTORATE, 1998. Karayolları Trafik Güvenliği
Yüksek Kurulu Kuruluş, Görev ve Çalışma Yönetmeliği. Ankara.

110
HIGHWAYS GENERAL DIRECTORATE, Upkeep Department, Traffic Branch
Directorship, 2005. Trafik Kazaları Özeti 2004. http://www.kgm.gov.tr.
HIGHWAYS GENERAL DIRECTORATE, Upkeep Department, Traffic Branch
Directorship, 2003. Trafik Kazaları Özeti 2001. http://www.kgm.gov.tr.
HIGHWAYS TRAFFIC LAW, 1998. Ankara.
HIGHWAYS TRAFFIC REGULATIONS, 1998. Ankara.
HIJAR, M., CARRILLO, C., FLORES, M., ANAYA, R., LOPEZ, L., 2000. Risk
Factors in Highway Traffic Accident: A Case Control Study. Accident
Analysis and Prevention, 32, 703-709.
HISAR, M.K., 2004. Türkiye’de Meydana Gelen Trafik Kazalarının Oluş Nedenleri
ve Bu Kazaların Azaltılması İçin Gereken Önlemler Üzerine Bir Araştırma.
Thesis of MSc, Institute of Science and Technology, Gazi University,
Ankara.
http://www.alkol.gen.tr/alkol/content/alkolun-vucuda-etkileri
http://en.wikipedia.org/wiki/Correlation
http://en.wikipedia.org/wiki/Regression_analysis
INTERNATIONAL ROAD TRAFFIC AND ACCIDENT DATABASE (IRTAD),
OECD, 2004. http://www.bast.de./htdocs/fachthemen/irtad/enlish/we2.html.
INTERNATIONAL ROAD TRAFFIC AND ACCIDENT DATABASE (IRTAD),
2005.
IŞILDAR, S., YIDIRIM, U., AYDOĞDU, F., 1998. Trafik Kazalarının Önemi ve
Mağdurların Psikolojik Rahatsızlıkları. Police Periodical, 5(17): 29-34.
IŞILDAR, S., 1998. Yaralanma ve Ölümle Sonuçlanan Trafik Kazaları ve Bu
Kazalarda Yaralanan ve Ölen Yakınlarının Karşılaştıkları Sorunlar. Thesis for
PhD (Unpublished), Institute of Science and Technology, Gazi University,
Ankara.
KARAKUŞ, M., BAYRAKÇEKEN, H., MUTLU, İ., 2006. Hava Şartlarının Taşıt ve
Kazalara Etkisi. 3rd Traffic and Road Safety Assembly, volume-2, Ankara,
812-820.

111
LEI, L., KIM, K., NITZ, L., 1999. Predictors of Safety Belt Use Among Crash-
Involved Drivers and Front Seat Passengers Adjusting for Over-Reporting.
Accident Analysis and Preventation, 31, 631-638.
LI, G., BAKER, S.P., LANGLOIS, J.A., 1998. Are Female Drivers Safer?.
Epidemiology, 9(4): 379-384.
LAROUSSE ENCYCLOPEDIA, 174.
MİRASYEDİ, F., 2006. Research concerning the effects of weathers on traffic
accidents in Turkey and prediction models of accidents. MSc Thesis, Institute
of Science and Technology, Kırıkkale University, Kırıkkale.
MCPHERSON, L., SHULLER E., ROSENDAHL, F., AND TILLEY C., 1996. A
GIS Application Used For Highway Safety Studies. Proceedings of the CBS
T-1996 Symposium, AASHTO, Washington, D.C., 324-351.
NATIONAL HIGHWAY TRAFFIC SAFETY ADMINISTRATION (NHTSA),
2002. Are you Using it Right?. U.S. Department of Transportation,
Washington, DC.
ÖZÜM, K., 1982. Sarhoşluk ve Direksiyon. Nur Printing, Ankara.
PARENTELA, E. M., CHEOMA, G., 2001. GIS-Based Risk Analysis for
Commercial Goods Transport in Southern California. ESRI Users Conf,
USA.
REINFURT, D., WILLIAMS, A.F., WELLS, J., RODGMAN, E., 1996.
Characteristics of Drivers not Using Seat Belt in High Belt Use State. Journal
of Safety Research, 27, 209-215.
ROSE, H., 1995. Assessing Learnin in VR: Towoardc Developing a Paradigm
Virtual Reality Roving Vehicles (VRRV) Project. Human Interface
Technology Laboratory, University of Washington, R-95-1.
SABINE, L., EVERITT, B.S., 2004. A Handbook of Statistical Analyses using
SPSS. London.
SANDER, E., 1997. Olay Yerinde Kriminalistik. Yardımcı Printing, Ankara
SECURITY GENERAL DIRECTORATE, 1998. Trafikte Kullanılan Teknik Cihaz
ve Malzemeler Hakkında Kılavuz. Ankara.

112
SECURITY GENERAL DIRECTORATE, 1998. Türkiye ve Avrupa’da Karayolu
Trafiğini Düzenleyen Yasal Dayanaklar, Trafik Suçlarının Takibi ile
Cezalandırılması ve Trafik Polisi. Ankara, 1-130.
SECURITY GENERAL DIRECTORATE, 2000. Karayolu Trafik Güvenliği
Hakkında Derlemeler ve Trafik Kültürü-2. Traffic Research Centre Press,
Ankara, 3-150.
SECURITY GENERAL DIRECTORATE, 1999. Karayolu Trafik Güvenliği
Hakkında Derlemeler ve Trafik Kültürü-1. Anakara, 26-30.
SECURITY GENERAL DIRECTORATE, 1998. Trafik Denetimleri, Polis Okulu
Ders Kitabı. Ankara, 8-10, 40-44, 82-90.
SECURITY GENERAL DIRECTORATE, 1982. Trafik Kontrollerine İlişkin
Yönerge. Ankara.
SECURITY GENERAL DIRECTORATE, 1999. Denetim Ödüllendirme Stratejiler
ve Etkiler. Traffic Research Centre Press, Ankara.
SECURITY GENERAL DIRECTORATE, 2001. Türkiye ve Dünyada Karayolu
Trafik Kazaları Değerlendirmeleri II. Security General Directorate Printing
House, Ankara, 106.
SECURITY GENERAL DIRECTORATE, 1998. Polis Trafik. Volume-I, Traffic
Research Centre Press, Ankara, 41, 45.
SECURITY GENERAL DIRECTORATE, 1999. Karayolu Trafik Güvenliğinde
Uzun Dönemli Planlama. Traffic Research Centre Press, Ankara, 12.
SCHLAG, B., 1993. Elderly Drivers in Germany-Fitness and Driving Behavior.
Accident Analysis and Prevention, 25(1): 47-55.
SPINE CARE FOUNDATION, A Research and Information Brochure, 2005. The
Wearing of Seat Belts by Children-Position Statement.
http://www.spinecarefoundation.org/pdfs/seatbeltsseatbelts_download05.pdf .
SPRING, G. S., HUMMER, J., 1995. Identification of Hazardous Highway
Locations Using Knowledge-Based GIS: A Case Study, Transportation
Research Record. 83-90, 1497.
STATE INSTITUTE OF STATISTICS, 2003. Trafik Kazaları İstatistikleri.
http://www.die.gov.tr.

113
STATE INSTITUTE OF STATISTICS, 2005. http://www.die.gov/communications.
SWE ROAD, 2001. Türkiye Cumhuriyeti Karayolu İyileştirme ve Trafik
Güvenliği(Kitgi) Trafik Güvenliği Projesi Türkiye İçin Ulusal Trafik
Güvenliği Programı. Main Report and Appendixes, Ankara, Appendix B 3-7
and 1-5.
TAVRIS, D.R., KUHN E.M., LAYDE, P.M., 2001. Age and Gender Pattern in
Motor Vehicle Crash Injuries: Importance of Type of Crash and Occupant
Role. Accident Analysis and Prevention, 33, 167-172.
T.C. Ministry of the Interior Security General Directorate Traffic Facilities
Presidency, 1999. 1999 Trafik İstatistik Yıllığı. Ankara.
T.C. Ministry of the Interior Security General Directorate Traffic Facilities
Presidency, 1999. Trafik Güvenliği Hakkında Derlemeler ve Trafik Kültürü.
Ankara.
TUNCUK, M., 2004. Traffic accident analysis by using geographic information
systems: A sample study of Isparta. MSc Thesis, Institute of Science and
Technology, Süleyman Demirel University, Isparta.
TURKISH GRAND NATIONAL ASSEMBLY, Traffic Safety Research Committee
Report, 2001.
TURKISH STATISTICAL INSTITUTE, 2006. www.turkstat.gov.tr.
VOLUNTARY TRAFFIC INSPECTORSHIPS DUTY AND OPERATIONS
REGULATIONS, 1998. Ankara.
WANG, C.S., CHOU, P., 1997. An Analysis of Unnatural Deaths Between 1990 and
1994 in A-Lein Taiwan. Injury, 28(3): 203-208.
WILLIAM R., SHANE M., ROGER P., PRASSAS ELENA S., 1998. Traffic
Engineering. Second Edition, Prentice Hall, NJ.
YAŞATIR, H.İ., 2006. The problems of gendarmerie traffic teams on mission
concerning the drivers and solution proposal. MSc Thesis, Institute of Science
and Technology, Gazi University, Ankara.

114
ZADOR, P.L., KRAWCHAK, S.A., VOAS, R.B., 2000. Alcohol-Related Relative
Risk of Driver Fatalities and Driver Involvement in Fatal Crashes in Relation
to Driver Age and Gender: An Updata Using 1996 Data. Journal of Studies
on Alcohol, 61, 387-395.
ZADOR, P.L., 1991. Alcohol-Related Relative Risk of Fatal Driver Injuries in
Relation to Driver Age and Sex. Journal of Studies on Alcohol, 52(4): 303-
310.
2918 HIGHWAYS TRAFFIC LAW (About Drunk Driver), 2002.

115
CURRICULUM VITAE
Ahmet ŞEKER was born in Şanlıurfa, 1981. After being graduated from
Adana İncirlik High School, he enrolled in Mechanical Engineering Department of
Mersin University. He graduated from Mersin University in July 2003. He started his
Master Science education in Mechanical Engineering Department of Çukurova
University in 2003. He has been working as an officer in Gendarmerie General
Commander since 2005.