Embed Size (px)
Citation preview
UNIVERSIDADE DE LISBOA
Faculdade de Ciências
Departamento de Física
Cytoreductive Surgical Treatment of Pleural Mesothelioma
Márcia Filipa Martinho Costa
DISSERTAÇÃO
Mestrado em Engenharia Biomédica e Biofísica
Radiações em Diagnóstico e Terapia
2012

UNIVERSIDADE DE LISBOA
Faculdade de Ciências
Departamento de Física
Cytoreductive Surgical Treatment of Pleural Mesothelioma
Márcia Filipa Martinho Costa
Dissertação orientada pelos Professores Doutores Jaime Mata e Eduardo Ducla-Soares
Mestrado em Engenharia Biomédica e Biofísica
Radiações em Diagnóstico e Terapia
2012

v
Abstract
Malignant mesothelioma is a rare type of tumor that carries poor prognosis, being the life
expectancy generally less than one year after diagnosis. Mesothelioma affects primarily the
mesothelium that covers the lungs, but it can also affect the heart, abdomen and other organs. The
most common approach to the cytoreduction of the primary tumor is surgery, but the majority of
mesothelioma patients cannot tolerate it. Ablative procedures, such as the ones that use
radiofrequency or ultrasound waves, become an attractive approach since they are much less
invasive. In both cases, ablation is achieved by increasing the tissue temperature to over 60ºC,
leading to cell death almost instantly. In the first case, however, the heat generated from a high
frequency alternating current is used to ablate the damaged tissue, while in the second case the heat
source is an ultrasound beam focused through a transducer completely external to the patient.
The objective of this study was to determine and to compare the feasibility of
transcutaneous and percutaneous mesothelioma debulking with Magnetic Resonance guided
Focused Ultrasound Surgery (MRgFUS) and Radiofrequency Ablation (RFA), respectively, in a
porcine model of mesothelioma. The tumor model was developed through the injection of a human
mesothelioma cell line (MSTO-211H) in the right lower hemithorax of 13 Yorkshire pigs. Pigs
were imaged using Magnetic Resonance Imaging (MRI) every 4 weeks post-inoculation. In T2-
wighted MRI pulse sequences, signs of pleural effusion, presence of adhesions and an increase in
diaphragm thickness were observed in several animals, then confirmed during post-treatment
necropsy procedure.
Five pigs were treated with RFA (guided by fluoroscopy imaging), while other four animals
were treated with MRgFUS. The ablation areas obtained with both techniques were approximately
the same, but MRgFUS has the advantage of being a non-invasive technique. Furthermore,
treatment planning was more accurate since the position of the target areas were confirmed right
vi
prior to the treatment through MRI, which it was not possible with fluoroscopy imaging before
RFA.
With this study, we were able to create a successful mesothelioma tumor model in pigs and
study its characteristics in-vivo using MRI and post-mortem during necropsy. Furthermore, it was
possible to prove the feasibility to both techniques, as well as to investigate the best parameters to
apply them in large animal.
Keywords: Malignant pleural mesothelioma, tumor model, swine, Magnetic Resonance Imaging,
Radiofrequency Ablation, Ultrasound, Magnetic Resonance-guided Focused Ultrasound Surgery.
vii
Resumo
Mesotelioma pleural maligno (MPM) é um tipo de neoplasia rara que afecta a pleura, ou
seja, a membrana que reveste os pulmões. A principal causa epidemiológica desta doença é a
exposição a asbesto, também conhecido como amianto. Apesar das restrições impostas à utilização
deste material nos anos 70, o período de latência da doença varia entre 20 e 50 anos o que significa
que o pico de casos de MPM está previsto entre 2010 e 2020, podendo ocorrer até 2050 em alguns
países.
Para além do alargado período de latência, esta neoplasia é também agressiva com um
tempo de sobrevivência médio inferior a um ano, mesmo com um tratamento adequado. As terapias
convencionais para tratamento de cancro, como a quimioterapia e radioterapia, não têm demostrado
resultados satisfatórios. Mais recentemente, uma terapia multimodal tem sido adoptada em que a
redução do tumor primário é efectuada através de dois tipos de cirurgia, pleurectomia / decorticação
ou pneumonectomia extrapleural. À cirurgia é associada quimioterapia ou radioterapia, para
remover as margens do tumor primário que não tenham sido completamente extraídas e também
para tratamento de metástases que se tenham desenvolvido noutros órgãos. Um problema, contudo,
com este tipo de terapia é que a grande maioria dos pacientes quando diagnosticados apresentam já
um estado de saúde muito debilitado, que não lhes permite suportar procedimentos cirúrgicos tão
agressivos. Deste modo outras opções para a redução primária do tumor têm sido exploradas. No
contexto deste projecto, serão abordadas as ablações percutânea por radiofrequência e transcutânea
por ultra-sons (US) focalizados.
A técnica de ablação por radiofrequência consiste na introdução de um eléctrodo no
paciente, percutaneamente, ate alcançar a lesão a ser tratada. Este eléctrodo é ligado a um gerador
de corrente de radiofrequência, que é transportada até à lesão, provocando a vibração das moléculas
de água neste tecido. Este movimento de vibração leva á deposição de energia e, consequentemente,
a um aumento da temperatura do tecido. Quando a temperatura aumenta acima dos 60ºC, ocorre a
viii
desnaturação das proteínas celulares e as células morrem, num processo denominado de coagulação
necrótica. O tratamento é, geralmente, guiado através de técnicas de imagiologia médica, como
ultra-sons, tomografia computorizada (TC) e Ressonância Magnética (RM). Esta técnica tem sido
comummente utilizada para o tratamento de tumores no fígado (carcinoma hepatocelular).
A terapia por ultra-sons focalizados de alta frequência, por outro lado, tal como a
denominação sugere, utiliza ondas de ultra-sons para obter a deposição de calor no tumor e,
consequentemente, aumentar a temperatura no tecido. Tal como no caso da ablação por
radiofrequência, quando as temperaturas obtidas são acima dos 60ºC, é possível obter-se a morte
das células cancerígenas. O tratamento é, geralmente, guiado por US e RM. A grande vantagem
deste método é que o transdutor que transfere a energia para a lesão é completamente externo ao
paciente e este é, portanto, considerado um tratamento não invasivo. Em 2004, a Food and Drug
Administration (FDA) aprovou a aplicação de ultra-sons focalizados no tratamento de fibróides
uterinos, utilizando um sistema desenvolvido pela empresa Insightec (Israel), que utiliza RM para
planear e guiar o tratamento. Na Europa a Comissão Europeia aprovou o uso dos equipamentos
Phillips Sonalleve MR-HIFU e Haifu JC.
O principal objectivo deste estudo é comprovar a exequibilidade de aplicar as técnicas
anteriormente mencionadas no tratamento do mesotelioma pleural induzido em porcos e comparar
os resultados entre as duas terapias. No total, a doença foi induzida em onze animais, sendo que
dois deles não receberam qualquer tratamento, pois eram animais de controlo para avaliar o
desenvolvimento do tumor. Cinco animais foram tratados através da terapia de ablação por
radiofrequência e quatro porcos foram tratados recorrendo a ulta-sons focalizados. O estudo foi
efectuado no Departamento de Radiologia da Universidade da Virgínia.
A indução da neoplasia foi efectuada recorrendo a uma linhagem de células humanas de
msotelioma, MSTO-211H. As células foram injectadas na cavidade torácica dos animais (porcos da
raça Yorkshire), previamente imunossuprimidos com ciclosporina (Gengraf), perto da base do
pulmão direito. Os animais receberam diferentes quantidades de células, variando entre 6x10⁶ e
ix
13x106 células. Para mimetizar o aparecimento de metástases provocadas por este tipo de tumor, as
células foram ainda injectadas no lobo direito do fígado dos animais, à excepção dos animais de
controlo. A inoculação foi guiada através de imagens de fluoroscopia. Imagens de RM (scanner de
1.5 T, Avanto, Siemens) foram adquiridas anteriormente à inoculação e, posteriormente, a cada
quatro semanas, para avaliar o aparecimento de sinais de MPM, até à data da eutanásia ou
tratamento. O período decorrido desde a inoculação até ao tratamento foi variável entre porcos, num
mínimo de 8 semanas e máximo de 16 semanas.
Para a ablação por radiofrequência um eléctrodo expansível (2.0 cm de diâmetro e 15 cm de
comprimento, LeVeen), ligado a um gerador com capacidade até 200 W (Boston Scientific). O
tratamento foi guiado através de imagens de fluoroscopia. Os tratamentos de ablação por
radiofrequência foram efectuados em ambos os lados e no fígado, sendo aplicados diferentes
valores de potência para cada animal. A duração dos tratamentos foi também variável. Os animais
foram eutanizados no final do tratamento.
Para os tratamentos com ultra-sons focalizados, foi utilizado o equipamento da Insightec
anteriormente mencionado, utilizado na prática clínica para tratar fibróides uterinos. Os animais
foram tratados no Focused Ultrasound Center da Universidade da Virgínia. Dado nenhum outro
estudo de ultra-sons focalizados aplicados ao tratamento de mesotelioma ter sido efectuado (no
nosso conhecimento), foi efectuado um escalamento da energia acústica depositada ao longo do
tratamento dos animais. Cada animal foi tratado em apenas um lado da pleura e no fígado. Os
animais foram eutanizados no final do tratamento.
Ao longo do período de desenvolvimento da doença, o sinal mais comum de mesotelioma
foi a presença de efusão pleural, caracterizada por áreas hiper-intensas nas sequências ponderadas
em T2. Outro sinal também associado à neoplasia foi o aumento da espessura do diafragma, devido
ao aumento do esforço dos animais para respirar. Apesar de não terem sido detectadas massas
tumorais, na maioria dos animais eram observáveis adesões pleurais. Durante a necropsia, a maioria
dos porcos revelou adesões pleurais, embora em diferentes graus de desenvolvimentos, bem como o
x
aumento do espessamento do diafragma. No entanto, em apenas dois porcos foi verificada a
presença de fluido, provavelmente porque após os tratamentos o fluido evaporou.
As zonas de ablação obtidas após o tratamento por radiofrequência na pleura tinham um
tamanho variável entre 2 cm e 3 cm, com uma forma aproximadamente circular tal como expectável
pelo design do eléctrodo. O tratamento era mais facilmente completado no lado direito, mas em
ambos os lados as zonas de ablação correspondiam à área inicialmente escolhida pata ser tratada.
No fígado, no entanto, havia uma distância superior a 10cm entre a lesão e a zona de ablação.
Nos tratamentos com ultra-sons focalizados, as áreas de ablação tinham um tamanho
variável entre 2 e 3 cm. Todos os tratamentos foram concluídos sem haver grande dispersão do
feixe, sendo que em apenas um porco o feixe teve que ser ajustado para evitar a reflexão do mesmo
pelas costelas. Em 3 dos 4 porcos tratados, contudo, foram verificadas queimaduras. No entanto,
diversos estudos propuseram já mecanismos para evitar este tipo de lesão, sendo que para estudos
futuros medidas devem ser adoptadas para evitá-los. Comparativamente à ablação por
radiofrequência, esta técnica permitiu obter lesões de tamanho semelhante, sendo o tempo de
tratamento, aproximadamente, o mesmo e evitando recorrer a incisões.
Em resumo, com este projecto foi possível desenvolver um modelo de mesotelioma eficaz,
em porcos, bem como acompanhar a sua evolução e caracterizá-lo. Foi ainda possível demonstrar a
exequibilidade das terapias ablativas, obtendo lesões de tamanho aproximadamente igual com
ambos os tratamentos, sendo que a ablação por ultra-sons focalizados apresenta a clara vantagem de
ser um tratamento não-invasivo.
xi
Acknowledgements
During my academic journey, several people have been by my side, showing their support
and believing in my abilities. To all of them, I would like to write a few lines to show my gratitude.
First of all, I’m thankful for Professor Jaime Mata receiving me in the University of
Virginia, for the second time. He greatly contributed for my education and showed me what doing
research abroad is all about.
I would also like to show my appreciation for professor Eduardo Ducla-Soares help, most
of all for all the support and encouragement that he provided during the five years I’ve been a
student in the Faculty of Sciences. Professor Ducla-Soares was always the kind of teacher that
believed in his students and, therefore he is an inspiration as an individual.
I’m also grateful for the friends I met in the University, Carolina, Rafael, Ana Sofia, Joana
and Catarina, because they have been by my side in my (very few!) down moments, but even better
because we celebrated together our achievements… I leave a special word to Carolina, who shared
a house with me across the Atlantic Ocean and made me grow so much as a person.
Finally, I would like to dedicate this thesis for my parents and my brother for always
believing in me. They are the people who know me better and they always made a great effort to
provide me the economical and emotional structures that I needed to successfully achieve all my
goals.
xii
Contents
Abstract ............................................................................................................................................... v
Resumo .............................................................................................................................................. vii
Acknowledgements ............................................................................................................................ xi
List of tables ..................................................................................................................................... xiv
List of Figures ................................................................................................................................... xv
List of Acronyms ............................................................................................................................... xx
Introduction ......................................................................................................................................... 1
Chapter I: Malignant Pleural Mesothelioma ....................................................................................... 3
Chapter II: Ablative Therapies ............................................................................................................ 9
2.1 Radiofrequency Ablation .................................................................................................... 9
2.2 High Intensity Focused Ultrasound Therapy..................................................................... 14
Chapter III: Materials and Methods .................................................................................................. 23
3.1 Tumor Induction ................................................................................................................ 23
3.2 Radiofrequency Ablation Procedures ................................................................................ 25
3.3 MRgFUS procedures ......................................................................................................... 27
Chapter IV: Results ........................................................................................................................... 29
4.1 Tumor model ..................................................................................................................... 29
4.2 Radiofrequency Ablation .................................................................................................. 36
4.2.1 Pleura treatment ................................................................................................................ 36
4.2.1.1 Treatment of pig #4 ....................................................................................... 36
4.2.1.2 Treatment of pig #9 ....................................................................................... 38
4.2.1.3 Treatment of pig #6 ....................................................................................... 40
4.2.1.4 Treatment of pig#3 ........................................................................................ 42
4.2.1.5 Treatment of pig #7 ....................................................................................... 44
4.2.2 Liver treatment ................................................................................................................. 46
xiii
4.2.2.1. Treatment of pig #4 ...................................................................................... 46
4.2.2.2. Treatment of pig #9 ...................................................................................... 47
4.2.2.3. Treatment of pig #6 ...................................................................................... 48
4.2.2.4. Treatment of pig #3 ...................................................................................... 48
4.2.2.5. Treatment of pig #7 ...................................................................................... 50
4.3 Magnetic Resonance-guided Focused Ultrasound Surgery ............................................... 52
4.3.1 Pleura treatment ................................................................................................................ 52
4.3.1.1 Treatment of pig #8 ....................................................................................... 52
4.3.1.2 Treatment of pig #10 ..................................................................................... 53
4.3.1.3 Treatment of pig #12 ..................................................................................... 54
4.3.1.4 Treatment of pig #13 ..................................................................................... 54
4.3.2 Liver treatment ................................................................................................................. 56
4.3.2.1 Treatment of pig #8 ....................................................................................... 56
4.3.2.2 Treatment of pig #10 ..................................................................................... 57
4.3.2.3 Treatment of pig #12 ..................................................................................... 58
4.3.2.4 Treatment of pig #13 ..................................................................................... 59
Chapter V: Discussion ....................................................................................................................... 61
Conclusion......................................................................................................................................... 67
References ......................................................................................................................................... 69
xiv
List of tables
Table 1 – Quantity of cell solution (106 cells/mL) injected in the liver and right pleural space, as
well as the dose and ending time-point for cyclosporine administration. ………………………...24
Table 2 – Evolution of pigs’ symptoms over time………………………………………………….33
Table 3 – Degrees of disease severity……………………………………...……………………….34
Table 4 – Macroscopic features observed in all pigs during necropsy. The severity of the disease
was defined based on the number of features observed and their extension on pleural cavity,
according to a reviewer. Stage one corresponds to the lowest severity degree and IV the highest...35
Table 5 – Summary of the power applied in the pleural treatments and correspondent ablation
size..........................................................................................................................................45
Table 6 – Summary of the power applied in the liver treatments and correspondent ablation
size..………………………………………………………………………………………………..51
Table 7 – Summary of the different parameters of the MRgFUS treatments in the pleura and
correspondent ablation sizes (Values of power, duration and energy parameters correspond to each
focal spot)…………………………………………………………………………………………55
Table 8 – Summary of the different parameters of the MRgFUS treatments in the liver and
correspondent ablation sizes (Values of power, duration and energy parameters correspond to each
focal spot)………………………………………………………………………….……………..60
xv
List of Figures
Figure 1 – Asbestos-related deaths in United States (2002) comparatively with other conditions. The
number of deaths is superior to conditions such as skin cancer, asthma, hepatitis and Hodgkins
disease…………………………………………………………………………………………...……3
Figure 2 - Staging on Malignant Pleural Mesothelioma, by characteristics of tumor, lymph nodes
and metastases………………………………………………………………………………………..5
Figure 3 – Contrast enhanced coronal T1-weighted image and axial LAVA images of a patient
diagnosed with pleural mesothelioma, revealing circumferential pleural nodules, without
diaphragmatic (white arrow) or chest wall invasion……………………………………………...….7
Figure 4 – A: RFA ‘circuit’. Electrode acts like the cathode and the grounding pads as the anode.
The procedure is very dependent on tissues electric and thermal conductivity since the patients is
part of the circuit; B: The RFA electrode produces an alternating electromagnetic field, resulting in
the adjacent molecules motion, that are act as a source of heat for the RFA procedure……………10
Figure 5 – Comparison between the ablation results with slower and faster temperature rise. The
final ablation area of the top row is larger than the one in the bottom row, since the faster
temperature increase resulted in desiccated tissue around electrode tip before the maximum ablation
area has been achieved. Further deposition of energy in the adjacent tissue is hard to obtain because
resistance become too high………………………………………………………………………….10
Figure 6 – Different types if RFA probes. A: ‘Christmas tree’ configuration by RITA Medical
Systems; B: ‘Umbrella’ shaped array from Radiotherapeutics, similar to the one used in this project;
C: Single cooled-tip needle from Radionics………………………………………………………...11
Figure 7 – Color simulation of a cross section of an RF ablation local temperature effect: on the left,
an image without any blood vessel; on the right, an image simulation temperature disturbance due
to the presence of a blood vessel (white)………………………………………………..…………..12
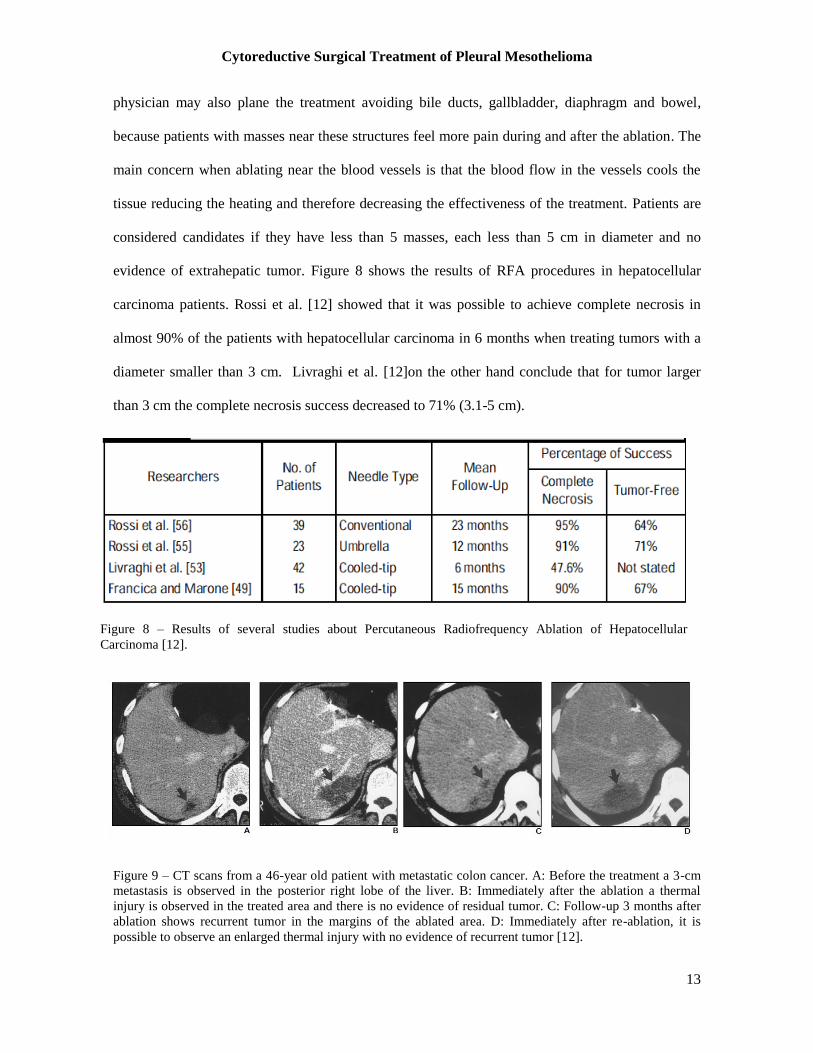
Figure 8 – Results of several studies about Percutaneous Radiofrequency Ablation of Hepatocellular
Carcinoma…………………………………………………………………………………………...13
Figure 9 – CT scans from a 46-year old patient with metastatic colon cancer. A: Before the
treatment a 3-cm metastasis is observed in the posterior right lobe of the liver. B: Immediately after
the ablation a thermal injury is observed in the treated area and there is no evidence of residual
tumor. C: Follow-up 3 months after ablation shows recurrent tumor in the margins of the ablated
area. D: Immediately after reablation, it is possible to observe an enlarged thermal injury with no
evidence of recurrent tumor…………………………………………………………………………13
xvi
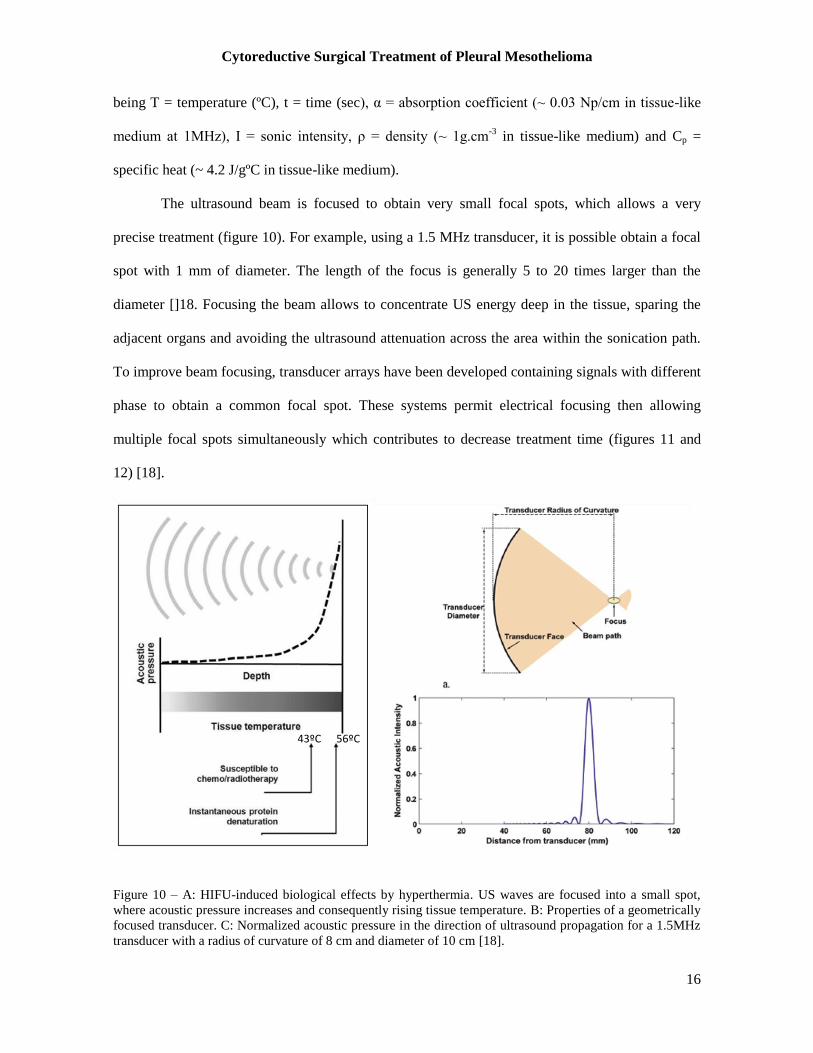
Figure 10 – A: HIFU-induced biological effects by hyperthermia. US waves are focused into a
small spot, where acoustic pressure increases and consequently rising tissue temperature. B:
Properties of a geometrically focused transducer. C: Normalized acoustic pressure in the direction
of ultrasound propagation for a 1.5MHz transducer with a radius of curvature of 8 cm and diameter
of 10 cm……………………………………………………………………………………………16
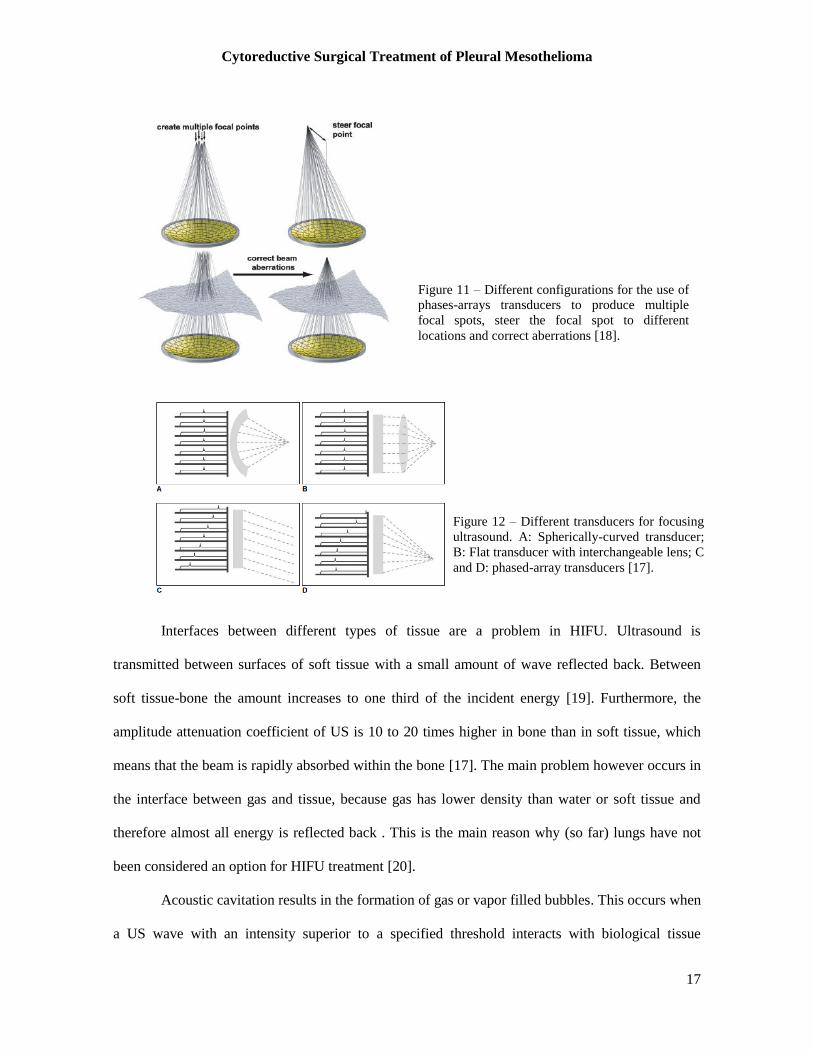
Figure 11 – Different configurations for the use of phases-arrays transducers to produce multiple
focal spots, steer the focal spot to different locations and correct aberrations……………………...17
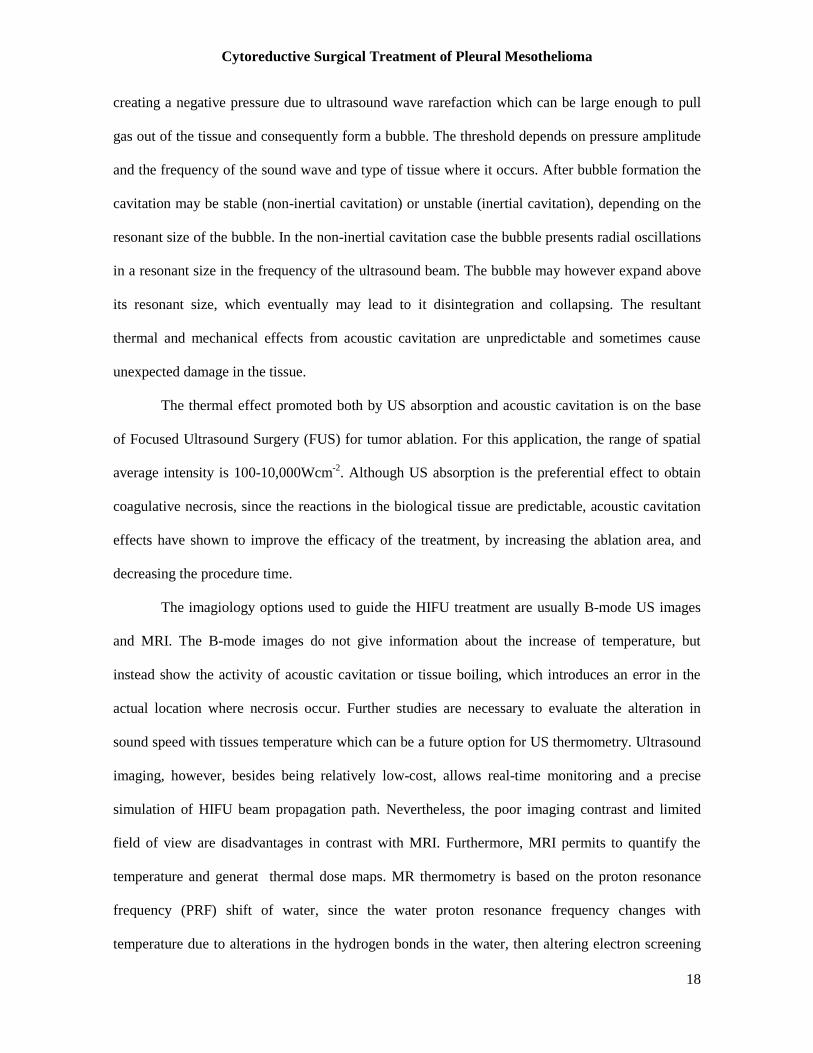
Figure 12 – Different transducers for focusing ultrasound. A: Spherically-curved transducer; B: Flat
transducer with interchangeable lens; C and D: phased-array transducers…………………………17
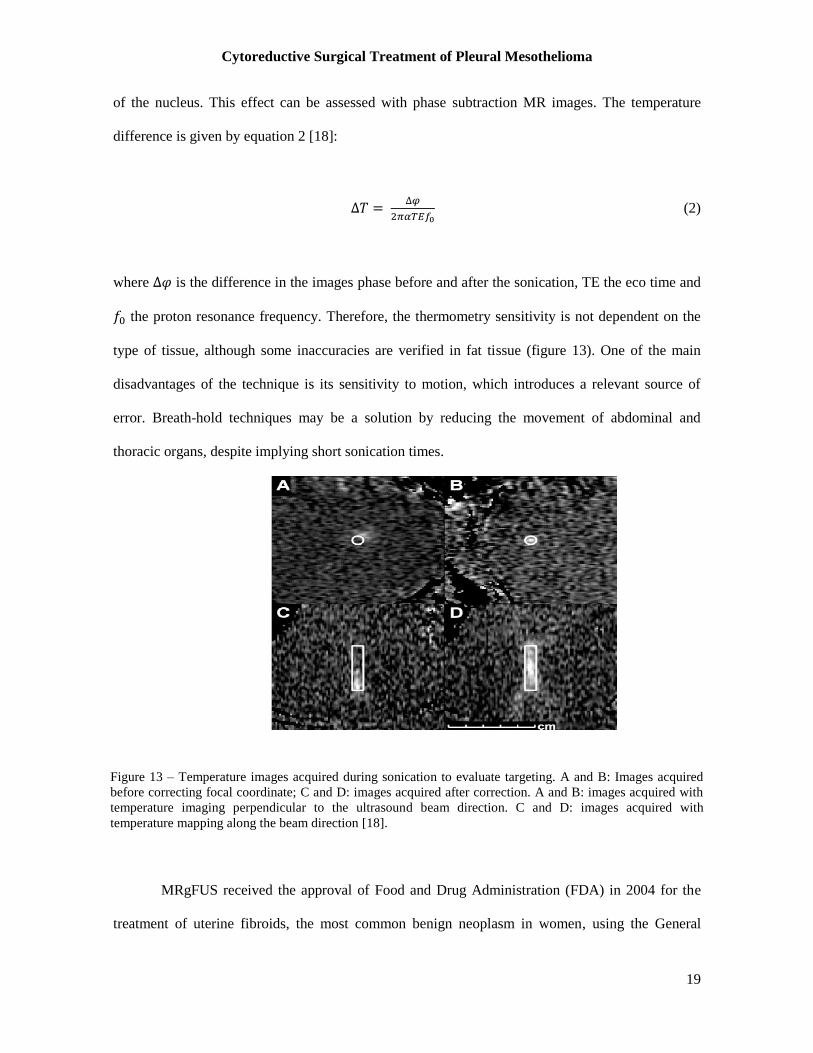
Figure 13 – Temperature images acquired during sonication to evaluate targeting. A and B: Images
acquired before correcting focal coordinate; C and D: images acquired after correction. A and B:
images acquired with temperature imaging perpendicular to the ultrasound beam direction. C and D:
images acquired with temperature mapping along the beam direction……………………………19
Figure 14 – MRgFUS of hepatocellular carcinoma. Left: Post-treatment image in coronal plane
showing entire thermal dose. Right: contrast-enhanced MRI showing focal nonperfusion………...21
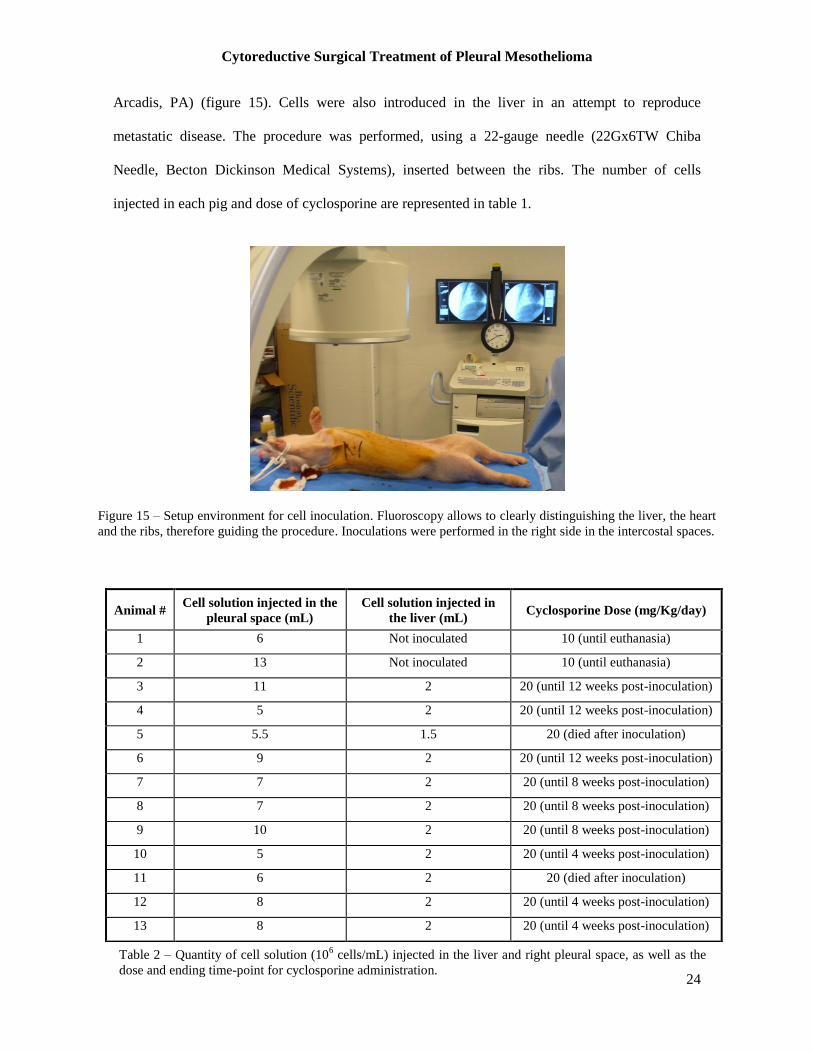
Figure 15 – Setup environment for cell inoculation. Fluoroscopy allows to clearly distinguishing the
liver, the heart and the ribs, therefore guiding the procedure. Inoculations were performed in the
right side in the intercostal spaces…………………………………………………………………..24
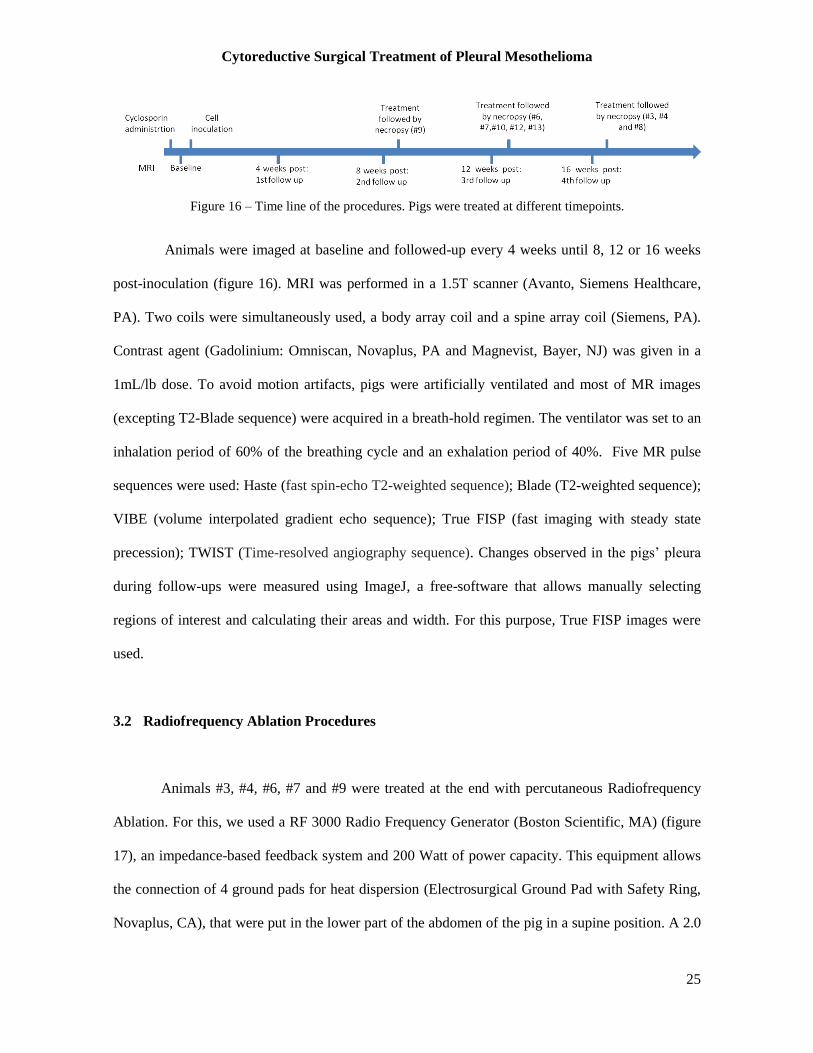
Figure 16 – Time line of the procedures. Pigs were treated at different time points……………….25
Figure 17 - 3000 Radio Frequency Generator………………………………………………………26
Figure 18- ‘Umbrella’ needle used for the RFA treatments. Left: ‘umbrella’ needle from Boston
Scientific. Right: 2.0 cm needle used for the project……………………………………………......26
Figure 19 – Software for MRgFUS treatment planning by Insightec. The region colored green
corresponds to the planned ablation area (pig #8). The green square represents the position of the
transducer. Sonication spots were defined within this region……………………………………....27
Figure 20 – Left: The blue circles above the diaphragm represent two the focal spots planned to
treat the lesion, both localized inside the green square. Right: Saggital view of the image used for
treatment planning. The rectangles represent the depth of the focal spots. The blue region
corresponds to the beam path across the adjacent tissue……………………………………………28
Figure 21 – Main mesothelioma findings in MRI. Left: True FISP transversal image of pig #8
showing pleural thickening (blue arrow); Middle: True FISP coronal image of pig #8 showing
pleural fluid (yellow arrow) and the increased thickness of diaphragm (red arrow); Right: True FISP
coronal image of pig #8 showing adhesions (orange arrow)………………………………………..30

xvii
Figure 22 – Macroscopic findings during necropsy: adhesions (blue arrow), increased diaphragm
thickness (red arrow), abnormal color in the lungs (purple arrow) and increased pericardium
thickness (green arrow)……………………………………………………………………………..34
Figure 23 – A: MR image (True FISP) used for treatment planning in the right (white arrow) and
the left (blue arrow) sides. B: Needle placement in the right side (Fluoroscopy image); C: Post-
ablation MRI (True FISP), showing the ablated area in the right side (green arrow); D: Necropsy
image showing the ablated area in the right side (purple arrow). E: Needle placement in the left side
(Fluoroscopy image); F: Post-ablation MRI (True FISP), showing the ablated area in the left side
(red arrow); G: Necropsy image showing the ablated area in the left side (yellow arrow)…………38
Figure 24 – A: MR image (True FISP) used for treatment planning in the right (white arrow) and
the left (blue arrow) sides. B: Needle placement in the right side (Fluoroscopy image); C: Post-
ablation MRI (True FISP), showing the ablated area in the right side (green arrow); D: Necropsy
image showing the ablated area in the right side (purple arrow). E: Needle placement in the left side
(Fluoroscopy image); F: Post-ablation MRI (True FISP), showing the ablated area in the left side
(red arrow); G: Necropsy image showing the ablated area in the left side (yellow arrow)…………40
Figure 25– A: MR image (True FISP) used for treatment planning in the right (white arrow) and the
left (blue arrow) sides. B: Needle placement in the right side (Fluoroscopy image); C: Post-ablation
MRI (True FISP), showing the ablated area in the right side (green arrow); D: Necropsy image
showing the ablated area in the right side (purple arrow). E: Needle placement in the left side
(Fluoroscopy image); F: Post-ablation MRI (True FISP), showing the ablated area in the left side
(red arrow); G: Necropsy image showing the ablated area in the left side (yellow arrow)…………42
Figure 26 – A: MR image (True FISP) used for treatment planning in the right (white arrow) and
the left (blue arrow) sides. B: Needle placement in the right side (Fluoroscopy image); C: Post-
ablation MRI (True FISP), showing the ablated area in the right side (green arrow); D: Necropsy
image showing the ablated area in the right side (purple arrow). E: Needle placement in the left side
(Fluoroscopy image); F: Post-ablation MRI (TrueFISP), showing the ablated area in the left side
(red arrow); G: Necropsy image showing the ablated area in the left side (yellow arrow)……….43
Figure 27– A: MR Needle placement in the right side (Fluoroscopy image); B: Post-ablation MRI
(True FISP), showing the ablated area in the right side (green arrow); D: Necropsy image showing
the ablated area in the right side(purple arrow). E: Needle placement in the left side in the 1st and
2nd positioning of the probe (Fluoroscopy image); F: Post-ablation MRI (True FISP), showing the
ablated areas in the left side (red and blue arrows); G: Necropsy image showing the ablated areas in
the left side (yellow and white arrow)………………………………………………………………45
xviii
Figure 28 – A: MR image (TWIST 4D) used for treatment planning in the liver (white arrow) B:
Needle placement in the liver (Fluoroscopy image); C: Post-ablation MRI (True FISP), showing the
ablated area in the liver (green arrow); D: Necropsy image showing the ablated area in the liver
(purple arrow). ……………………………………………………………………………………...46
Figure 29 – A: MR image (VIBE) used for treatment planning in the liver (white arrow) B: Needle
placement in the liver (Fluoroscopy image); C: Post-ablation MRI (True FISP), showing the ablated
area in the liver (green arrow); D: Necropsy image showing the ablated area in the liver (purple
arrow)……………………………………………………………………………………………….48
Figure 30 – A: MR image (TWIST 4D) used for treatment planning in the liver (white arrow) B:
Needle placement in the liver (Fluoroscopy image); C: Post-ablation MRI (True FISP), showing a
very small ablated area near the gallbladder in (green arrow); D: Necropsy image showing the
ablated area in the liver (purple arrow). Probably, during the treatment probe was moved into the
gallbladder…………………………………………………………………………………………..48
Figure 31 – A: MR image (TWIST 4D) used for treatment planning in the liver (white arrow); B
and D: Needle placement in both target areas (Fluoroscopy image); C and E: Post-ablation MRI
(True FISP), showing the resultant two ablated areas (green and yellow arrows); F: Necropsy image
showing two ablated area in the liver (purple and red arrows)……………………………………49
Figure 32 – A: MR image (VIBE, transversal) used for treatment planning in the liver (white arrow)
B: Needle placement in the liver (Fluoroscopy image); C: Post-ablation MRI (True FISP), showing
a very large ablated area in the liver (green arrow); D: Necropsy image showing a large ablated area
in the liver (purple arrow)…………………………………………………………………………...51
Figure 33 – A: MR image (FIESTA) used for treatment planning in the pleura (white arrow) B:
Post-ablation MRI (subtraction of LAVA images before and after ablation), showing a very small
ablated area near the heart (green arrow); C: Necropsy image showing the ablated area in the pleura
(purple arrow)……………………………………………………………………………………….53
Figure 34 – A: MR image (FIESTA) used for treatment planning in the pleura (white arrow) B:
Post-ablation MRI (subtraction of LAVA images before and after ablation), showing a very small
ablated area near the heart (green arrow); C: Necropsy image showing the ablated area in the pleura
(purple arrow)……………………………………………………………………………………….53
Figure 35 – A: MR image (Localizer) used for treatment planning in the pleura (white arrow) B:
Post-ablation MRI (subtraction of LAVA images before and after ablation), showing a very small
ablated area near the diaphragm (green arrow); C: Necropsy image showing the ablated area in the
pleura (purple arrow)………………………………………………………………………………..54
xix
Figure 36 – A: MR image (FIESTA) used for treatment planning in the pleura (white arrow) B:
Post-ablation MRI (subtraction of LAVA images before and after ablation), showing a very small
ablated area near the diaphragm (green arrow); C: Necropsy image showing the ablated area in the
pleura, in the diaphragm (purple arrow) and in the surface of the lung (yellow arrow)……………55
Figure 37 – Burns were observed in 3 of the 4 pigs treated with MRgFUS. Left: pig # 10 revealed a
burn in the muscle between skin and sternum; Middle: skin burn of pig #12; Left: skin burn of pig
#13…………………………………………………………………………………………………..56
Figure 38 – A: MR image (VIBE) used for treatment planning in the liver (white arrow) B: Post-
ablation MRI (subtraction of LAVA images before and after ablation), showing a very small ablated
area far below the target area (green arrow); C: Necropsy image showing the ablated area in the
liver (purple arrow)………………………………………………………………………………….57
Figure 39 – A: MR image (VIBE) used for treatment planning in the liver (white arrow) B: Post-
ablation MRI (subtraction of LAVA images before and after ablation), showing a very small ablated
area near the diaphragm (green arrow); during necropsy, no ablated area was observed…………..58
Figure 40 – A: MR image (VIBE) used for treatment planning in the liver (white arrow) B: Post-
ablation MRI (subtraction of LAVA images before and after ablation), showing a large ablated area
correspondent to the target area (green arrow); C: Necropsy image showing the ablated area in the
liver (purple arrow)………………………………………………………………………………….59
Figure 41 – A: MR image (VIBE) used for treatment planning in the liver (white arrow) B: Post-
ablation MRI (subtraction of LAVA images before and after ablation), showing a large ablated area
correspondent to the target area (green arrow); C: Necropsy image showing the ablated area in the
liver (purple arrow)………………………………………………………………………………….60
xx
List of Acronyms
MRgFUS: Magnetic Resonance-guided Focused Ultrasound Surgery
RFA: Radiofrequency Ablation
MRI: Magnetic Resonance Imaging
MPM: Malignant Pleural Mesothelioma
CT: Computed Tomography
IMIG: The International Mesothelioma Interest Group
P/D: Pluerectomy/Decortication
EPP: Extrapleural Pneumonectomy
T1-w: T1-weighted
T2-w: T2-weighted
Gd: Gadolinium
TE: Echo Time
EM: Electromagnetic
HIFU: High Intensity Focused Ultrasound
US: Ultrasound
PRF: Proton Resonance Frequency
FDA: Food and Drug Administration
GE: General Electrics
CE: European Commission
ATCT: American Type Cell Culture
ACUC: Animal Care and Use Committee (ACUC).
Cytoreductive Surgical Treatment of Pleural Mesothelioma
1
Introduction
Malignant Pleural Mesothelioma (MPM) is an aggressive, although relatively rare, tumor,
arising from the surface serosal cells of the pleural cavity. Epidemiological studies reveal that the
exposure to asbestos fibers is the main cause of mesothelioma. The patients affected by this
condition carry a poor prognosis (generally they survive less than one year) so it is important the
development of imagiology techniques. So far, the preferred techniques in the assessment of the
disease are Computed Tomography (CT) and Magnetic Resonance Imaging (MRI). MRI, besides
avoiding the use of radiation in the already debilitated patients, also permits to obtain images with
better contrast.
Although the use of asbestos has been forbidden in most developed countries since the 70’s,
this type of cancer has a long latency period that ranges from 20 to 50 years, which means that for
most countries the peak in mesothelioma cases is predicted to take place in the period between 2010
and 2020. Therefore, developed countries have a great social and economic interest in the research
of an effective therapy in the next years. Recently, multimodality therapy has been used to treat
mesothelioma patients. Its main goal is the cytoreduction of the primary tumor by surgery, radiation
or ablative therapy and hence, the volume of tumor debulking must be maximized. The primary
option for mesothelioma cytoreduction is surgery. However, 90% of mesothelioma patients cannot
tolerate it, since by the time they are diagnosed their general health condition is very poor. In this
sense, ablative procedures, such as the ones that use radiofrequency or ultrasound waves, become
an attractive approach.
While Radiofrequency Ablation has been widely used in clinical practice for the treatment
of solid tumors (particularly hepatocellular carcinoma in the liver) as well as other heart conditions,
Focused Ultrasound only in the last decade got the approval from Food and Drug Administration
for the treatment of uterine fibroids. This technique, however, has showed promising results and,
Cytoreductive Surgical Treatment of Pleural Mesothelioma
2
therefore, a wide range of applications are being investigated and it is one of the most
groundbreaking non-invasive cancer therapies.
The first aim of this project is to develop and to characterize a successful mesothelioma
tumor model in pigs (12 animals). Animals will be divided in two groups (each group with six
animals) and one pig from each group will be used as a control animal to characterize the tumor
model. The second aim of this project is to treat one group of animals with RFA and the other group
with MRgFUS, and therefore to investigate the feasibility of percutaneous RFA and transcutaneous
MRgFUS in a swine mesothelioma tumor model.
The first chapter of this dissertation will be a theoretical background of the aforementioned
disease and the ablative procedures. The second and third chapters will describe the methods used
to achieve the goals proposed and the results obtained with the experiment, respectively. In the
fourth chapter, the successful points and pitfalls of the study, as well as the comparison between
both therapies, will be discussed. Finally, the future directions of MRgFUS will be briefly
approached in the section dedicated to the final conclusions.
Cytoreductive Surgical Treatment of Pleural Mesothelioma
3
CHAPTER I
Malignant Pleural Mesothelioma
Malignant Pleural Mesothelioma (MPM) is an aggressive type of cancer that develops from
mesothelial cells lining in the pleura. Epidemiological studies reveal that the exposure to asbestos
fibers, from industrial and environmental sources, is the main cause of mesothelioma [1, 2].
Although it is believed that in the United States the peak of mesothelioma occurred in 2004, this
condition is still a problem worldwide, with an increasing number of diagnosed cases in Europe
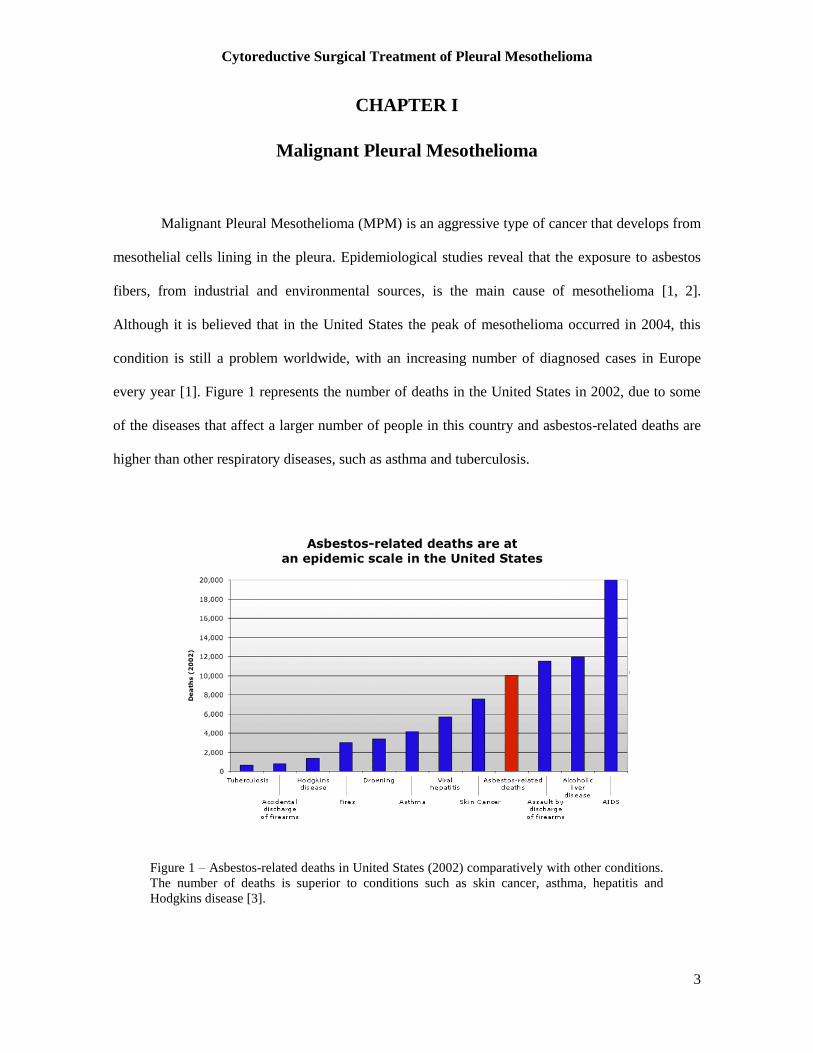
every year [1]. Figure 1 represents the number of deaths in the United States in 2002, due to some
of the diseases that affect a larger number of people in this country and asbestos-related deaths are
higher than other respiratory diseases, such as asthma and tuberculosis.
Figure 1 – Asbestos-related deaths in United States (2002) comparatively with other conditions.
The number of deaths is superior to conditions such as skin cancer, asthma, hepatitis and
Hodgkins disease [3].
Cytoreductive Surgical Treatment of Pleural Mesothelioma
4
Asbestos utilization was forbidden in most developed countries in the70’s. Malignant
pleural mesothelioma, however, is associated with a long period of latency between the exposure
and the expression of the disease, ranging from 20 to 50 years, since the mineral fibers get lodge in
the pleura and the organism cannot eliminate them easily, which permits them to be embedded in
the pleural space for decades, continuously damaging the tissue [4]. This means that for most
European and Asiatic countries the peak is predicted between 2010 and 2020 and it is expected
more than 250,000 deaths in Western Europe and more than 100,000 in Japan. Patients have a
dismal prognosis and the average survival time ranges between 4 and 12 months, regardless of stage
[1]. MPM occurs more frequently in men and risk increases with age [1,2].
MPM can be histologically classified in three subtypes: epithelial, the most common type
with 50% to 60% of cases, sarcomatoid, comprising 10% of cases and biphasic, the combination of
the other two types. Epithelial mesotheliomas have a better prognosis than the two other forms. On
the other hand, sarcomatoid mesotheliomas are very resistant to therapy [1].
Besides the long latency period, pleural mesothelioma has a difficult diagnosis and it is
very challenging to understand the early events in the malignant mesothelioma development [5]. A
study by Hiroshima et al. [6] evaluated the early histopathological characteristics of mesothelioma
and found out in eight early stage patients (six with epithelioid and two with biphasic
mesothelioma) that macroscopically there was no visible tumor, but both visceral and parietal
pleura were thickened and several adhesions were observed between them. Therefore, in early
stages, it is not always possible to distinguish tumor masses, but adhesions and pleural effusion. In
the advanced stages, however, nodules become larger and more confluent. Approximately 30% of
pleural mesothelioma cases directly invade the parietal pericardium [6]. Metastatic disease is often
associated with pleural mesothelioma. The most common site is the lymph nodes, followed by the
visceral pleural surface of the contralateral lung. Mesothelioma may also invade the diaphragm and
even progressively encase organs in the abdominal cavity, such as the liver, brain and bone [1, 2].
Cytoreductive Surgical Treatment of Pleural Mesothelioma
5
Figure 2 - Staging on Malignant Pleural Mesothelioma, by
characteristics of tumor, lymph nodes and metastases [7].
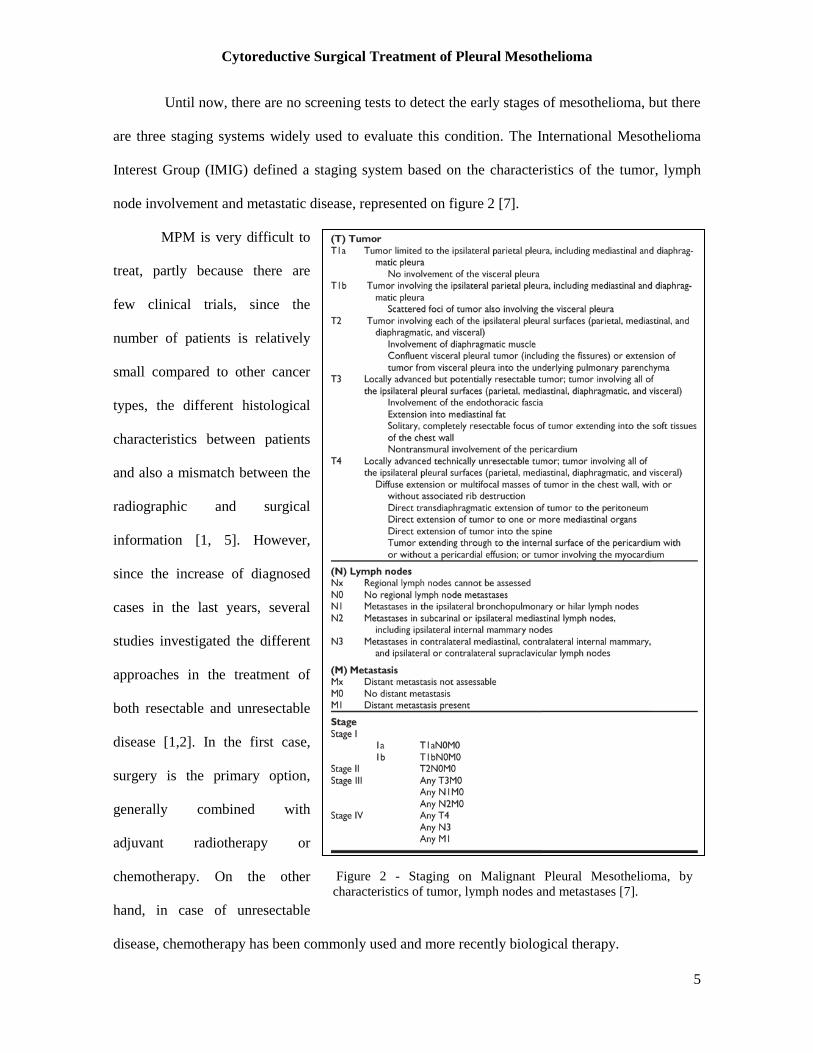
Until now, there are no screening tests to detect the early stages of mesothelioma, but there
are three staging systems widely used to evaluate this condition. The International Mesothelioma
Interest Group (IMIG) defined a staging system based on the characteristics of the tumor, lymph
node involvement and metastatic disease, represented on figure 2 [7].
MPM is very difficult to
treat, partly because there are
few clinical trials, since the
number of patients is relatively
small compared to other cancer
types, the different histological
characteristics between patients
and also a mismatch between the
radiographic and surgical
information [1, 5]. However,
since the increase of diagnosed
cases in the last years, several
studies investigated the different
approaches in the treatment of
both resectable and unresectable
disease [1,2]. In the first case,
surgery is the primary option,
generally combined with
adjuvant radiotherapy or
chemotherapy. On the other
hand, in case of unresectable
disease, chemotherapy has been commonly used and more recently biological therapy.
Cytoreductive Surgical Treatment of Pleural Mesothelioma
6
For MPM patients, two types of surgery are performed, pluerectomy/decortication (P/D)
and extrapleural pneumonectomy (EPP), both very aggressive procedures. P/D is an open
thoracotomy for removal of parietal and visceral pleura as well as the mesothelium covering the
pericardium and diaphragm. EPP consists of removal of the affected tissue in the hemithorax,
including visceral and parietal pleura, diseased lung, mediastinal lymph nodes, pericardium and
diaphragm [1, 2, 5]. This procedure is associated with higher morbidity rates. One of the problems
with surgery is both local and distant recurrence of the tumor, because neither of the procedures has
the ability of completely eliminating the residual microscopic disease [1]. Therefore the use of
adjuvant therapies is necessary to complete the treatment. Radiotherapy is used either in the surgical
incision sites to prevent tumor seeding or in the entire hemithorax to avoid the recurrence of the
tumor in the thoracic cavity and the spread of tumor cells to distant organ. This is the only adjuvant
therapy that prevents local recurrence of the disease. Chemotherapy may also be used as an
adjuvant or neoadjuvant therapy for resectable disease, concurrent with radiotherapy, permitting an
overall survival variable between 16.6 and 25.5 months [1].
Chemotherapy is, nevertheless, the primary choice for MPM treatment when the disease is
unresectable, although MPM is more resistant to this kind of treatment than other tumors. Cisplatin
has been the most common agent used [1, 2]. However, several studies showed that the combination
of cisplatin with other agents, such as pemetrexed, increased the overall survival rate from 9.5
months using only cisplatin to 12.1 months, as well as a general increase of patients life quality in
the first weeks of treatment. Until this point, pemetrexed has been used as front-line chemotherapy
and no salvage regimen has been approved yet to MPM. Jassem et al. however conducted a phase
III clinical trial to prove that a salvage setting in pemetrexed administration improves tumor
response, although they were not able to show an increase in the overall survival for patients that
did not have a positive response in a front-line regimen of chemotherapy [1].
Several imagiology techniques are available for the diagnosis of MPM. Computed
Tomography (CT) has been used as the primary imaging modality for the diagnosis, staging and
Cytoreductive Surgical Treatment of Pleural Mesothelioma
7
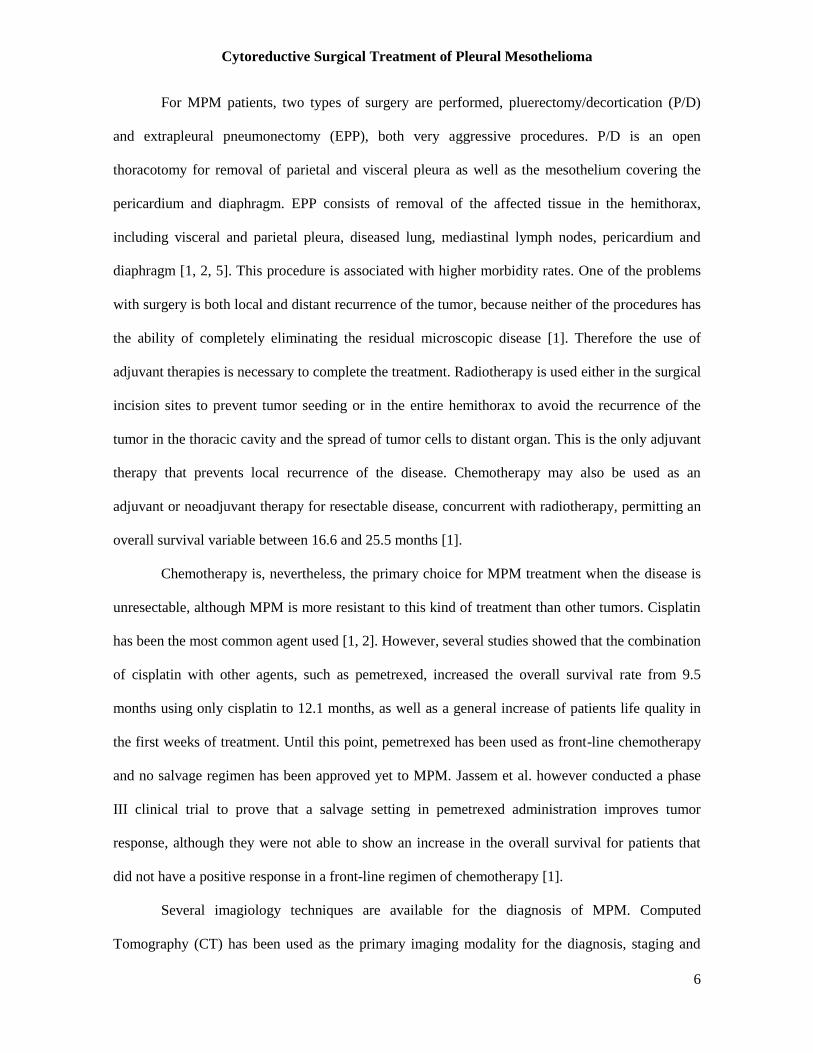
Figure 3 – Contrast enhanced coronal T1-weighted image and axial LAVA images of a
patient diagnosed with pleural mesothelioma, revealing circumferential pleural nodules,
without diaphragmatic (white arrow) or chest wall invasion [9].
monitoring of mesothelioma treatment. Magnetic Resonance Imaging (MRI), however, provides
additional information to CT because of the excellent contrast resolution, advantageous in the
differentiation of malignant from benign disease and metastatic involvement of chest wall and
diaphragm [8].
Perfusion MRI has been widely used to assess tumor vascularity and vascular permeability.
To detect tumor invasions of the adjacent structures it is common to use contrast-enhanced T1 fat-
suppressed sequences. High signal intensity comparatively to the adjacent musculature suggests
malignant disease. High intensity is visible in T1-weighted (T1-w) and T2-weighted (T2-w)
sequences (figure 3). Furthermore, it is possible to distinguish pleural effusion, frequently observed
as focal areas of very high signal intensity on T2- w images. The most promising MR approach,
however, is to use perfusion MRI, with the injection of a contrast agent. Generally, in clinical
practice, gadolinium (Gd) is the chosen contrast agent [8, 9].
Cytoreductive Surgical Treatment of Pleural Mesothelioma
8
To perform MR imaging in mesothelioma patients one has to take in consideration that the
protocol needs to be done in a reasonable time frame (in 15 to 30 minutes). The most common
approach to MR image mesothelioma protocols is to use fast sequences for single or multiple
breath-hold imaging, permitting a reasonably high spatial resolution imaging and short echo time
(TE). The main goal is to obtain as much signal as possible before the signal decays [8,9].
Cytoreductive Surgical Treatment of Pleural Mesothelioma
9
CHAPTER II
Ablative Therapies
2.1 Radiofrequency Ablation
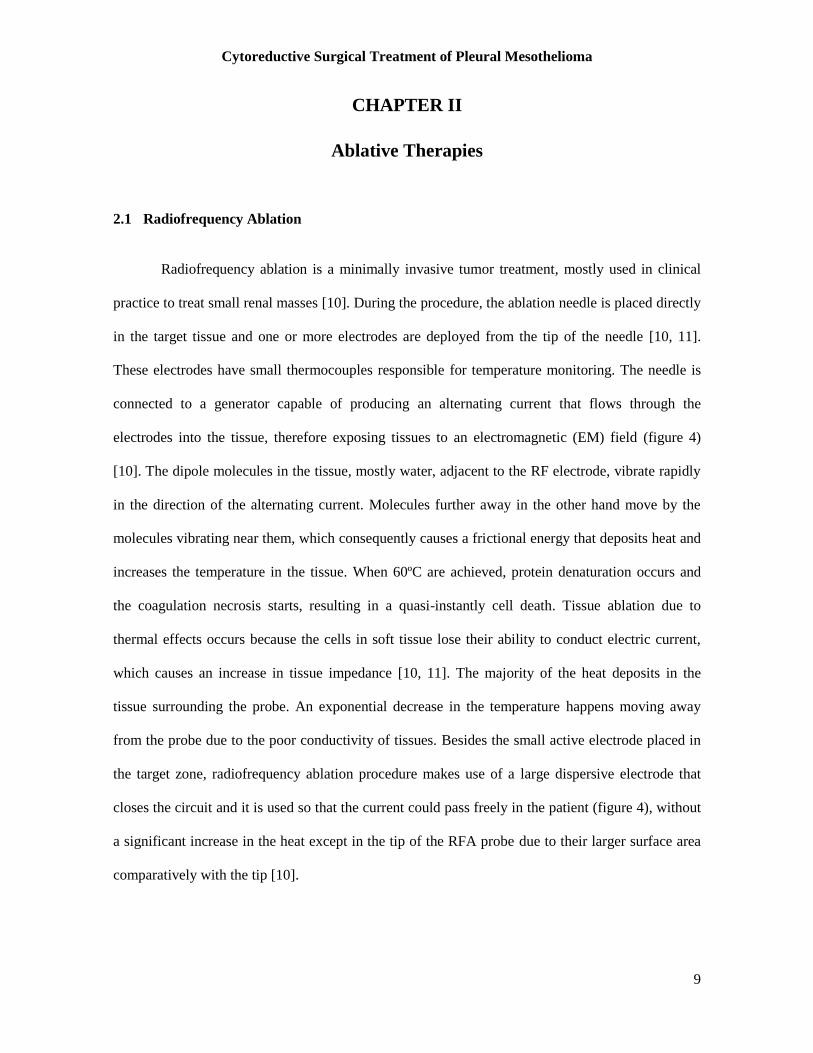
Radiofrequency ablation is a minimally invasive tumor treatment, mostly used in clinical
practice to treat small renal masses [10]. During the procedure, the ablation needle is placed directly
in the target tissue and one or more electrodes are deployed from the tip of the needle [10, 11].
These electrodes have small thermocouples responsible for temperature monitoring. The needle is
connected to a generator capable of producing an alternating current that flows through the
electrodes into the tissue, therefore exposing tissues to an electromagnetic (EM) field (figure 4)
[10]. The dipole molecules in the tissue, mostly water, adjacent to the RF electrode, vibrate rapidly
in the direction of the alternating current. Molecules further away in the other hand move by the
molecules vibrating near them, which consequently causes a frictional energy that deposits heat and
increases the temperature in the tissue. When 60ºC are achieved, protein denaturation occurs and
the coagulation necrosis starts, resulting in a quasi-instantly cell death. Tissue ablation due to
thermal effects occurs because the cells in soft tissue lose their ability to conduct electric current,
which causes an increase in tissue impedance [10, 11]. The majority of the heat deposits in the
tissue surrounding the probe. An exponential decrease in the temperature happens moving away
from the probe due to the poor conductivity of tissues. Besides the small active electrode placed in
the target zone, radiofrequency ablation procedure makes use of a large dispersive electrode that
closes the circuit and it is used so that the current could pass freely in the patient (figure 4), without
a significant increase in the heat except in the tip of the RFA probe due to their larger surface area
comparatively with the tip [10].
Cytoreductive Surgical Treatment of Pleural Mesothelioma
10
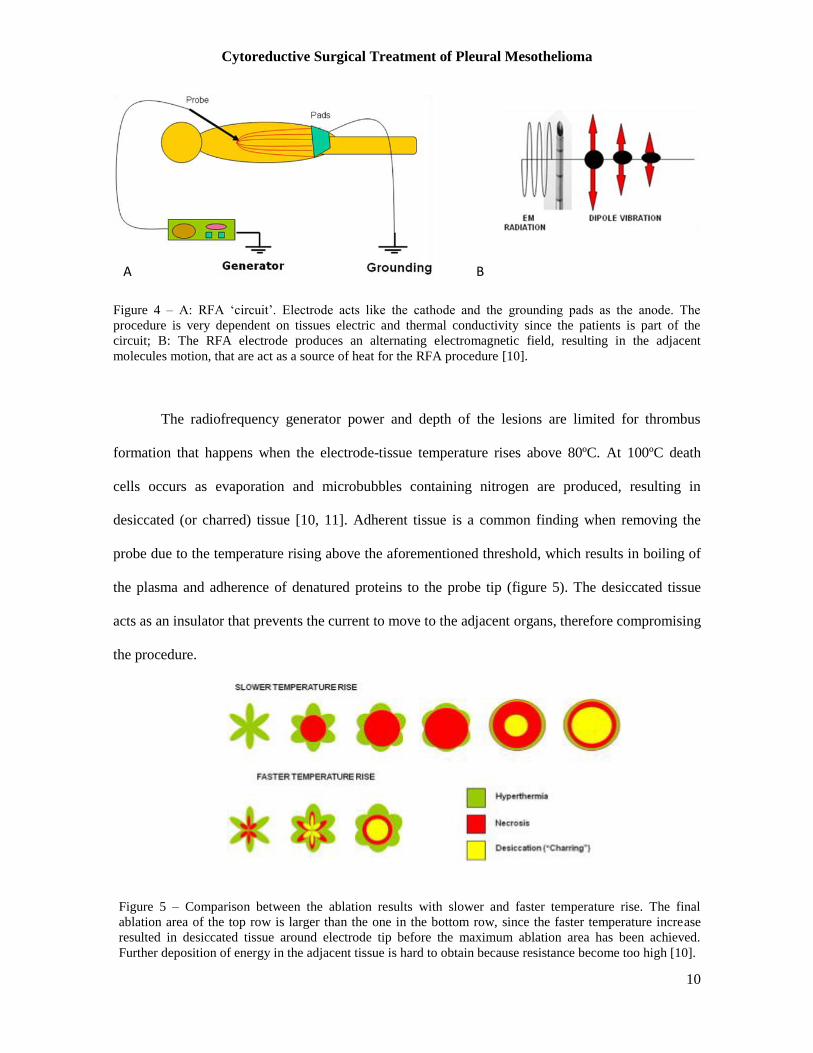
The radiofrequency generator power and depth of the lesions are limited for thrombus
formation that happens when the electrode-tissue temperature rises above 80ºC. At 100ºC death
cells occurs as evaporation and microbubbles containing nitrogen are produced, resulting in
desiccated (or charred) tissue [10, 11]. Adherent tissue is a common finding when removing the
probe due to the temperature rising above the aforementioned threshold, which results in boiling of
the plasma and adherence of denatured proteins to the probe tip (figure 5). The desiccated tissue
acts as an insulator that prevents the current to move to the adjacent organs, therefore compromising
the procedure.
Figure 4 – A: RFA ‘circuit’. Electrode acts like the cathode and the grounding pads as the anode. The
procedure is very dependent on tissues electric and thermal conductivity since the patients is part of the
circuit; B: The RFA electrode produces an alternating electromagnetic field, resulting in the adjacent
molecules motion, that are act as a source of heat for the RFA procedure [10].
A B
Figure 5 – Comparison between the ablation results with slower and faster temperature rise. The final
ablation area of the top row is larger than the one in the bottom row, since the faster temperature increase
resulted in desiccated tissue around electrode tip before the maximum ablation area has been achieved.
Further deposition of energy in the adjacent tissue is hard to obtain because resistance become too high [10].
Cytoreductive Surgical Treatment of Pleural Mesothelioma
11
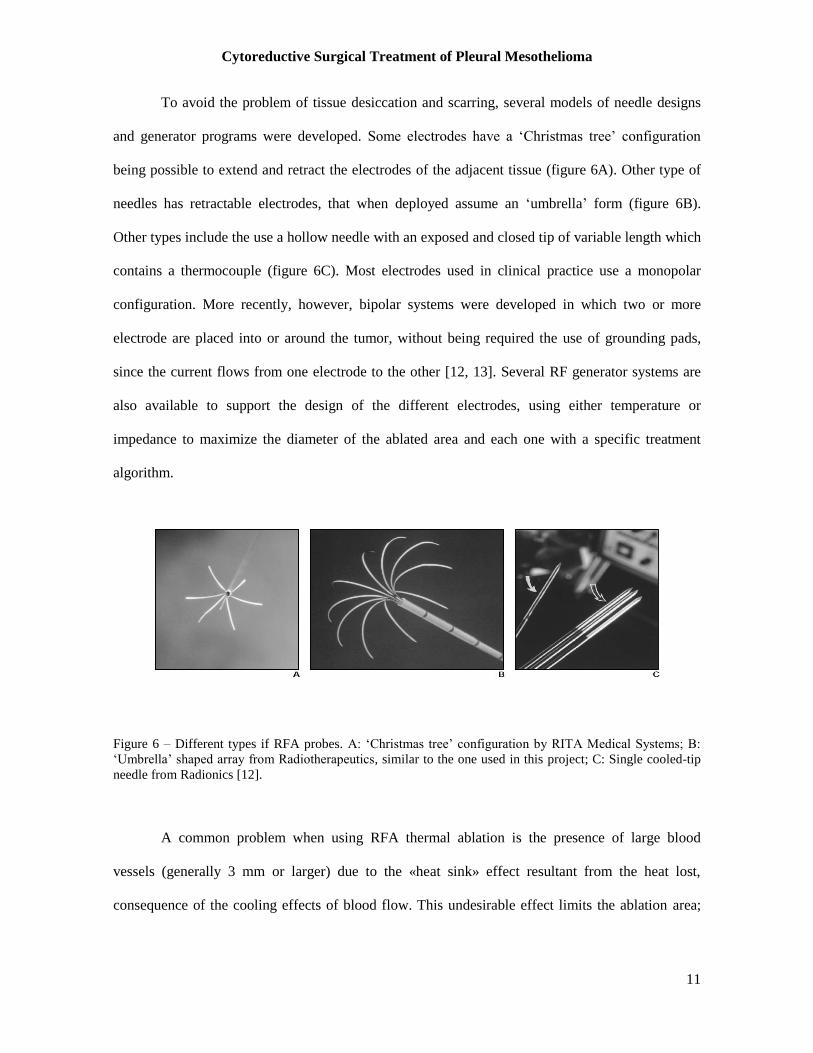
To avoid the problem of tissue desiccation and scarring, several models of needle designs
and generator programs were developed. Some electrodes have a ‘Christmas tree’ configuration
being possible to extend and retract the electrodes of the adjacent tissue (figure 6A). Other type of
needles has retractable electrodes, that when deployed assume an ‘umbrella’ form (figure 6B).
Other types include the use a hollow needle with an exposed and closed tip of variable length which
contains a thermocouple (figure 6C). Most electrodes used in clinical practice use a monopolar
configuration. More recently, however, bipolar systems were developed in which two or more
electrode are placed into or around the tumor, without being required the use of grounding pads,
since the current flows from one electrode to the other [12, 13]. Several RF generator systems are
also available to support the design of the different electrodes, using either temperature or
impedance to maximize the diameter of the ablated area and each one with a specific treatment
algorithm.
A common problem when using RFA thermal ablation is the presence of large blood
vessels (generally 3 mm or larger) due to the «heat sink» effect resultant from the heat lost,
consequence of the cooling effects of blood flow. This undesirable effect limits the ablation area;
Figure 6 – Different types if RFA probes. A: ‘Christmas tree’ configuration by RITA Medical Systems; B:
‘Umbrella’ shaped array from Radiotherapeutics, similar to the one used in this project; C: Single cooled-tip
needle from Radionics [12].
Cytoreductive Surgical Treatment of Pleural Mesothelioma
12
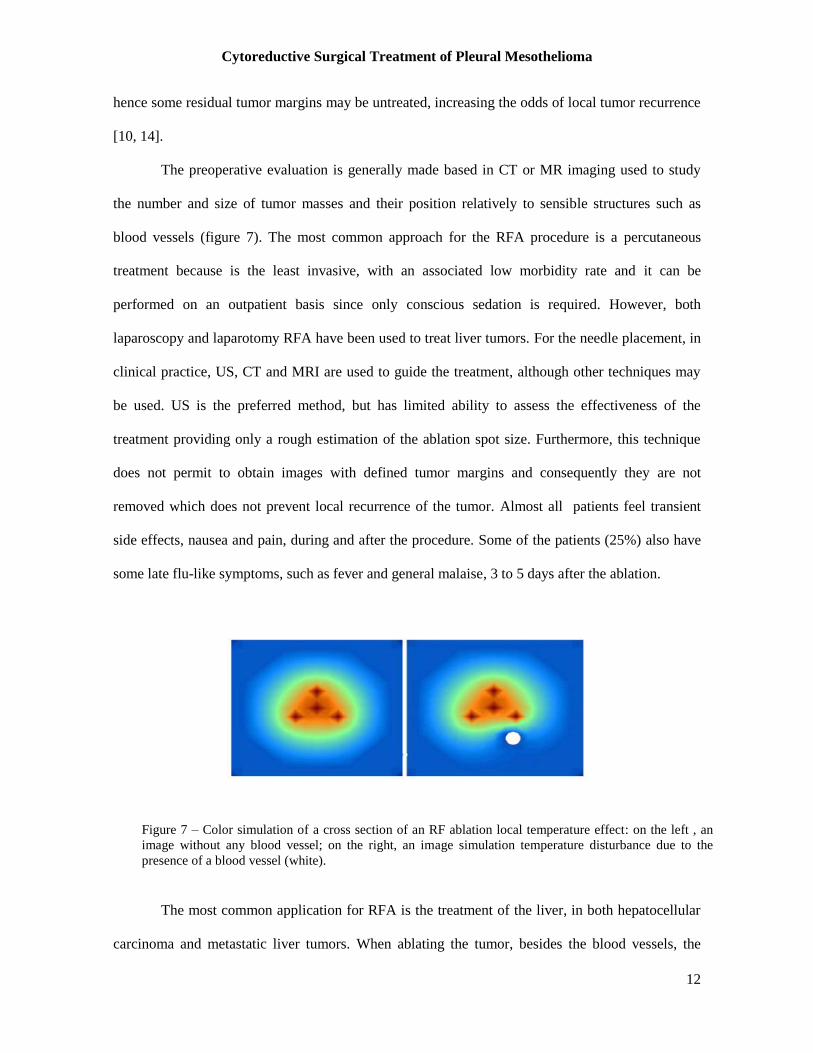
Figure 7 – Color simulation of a cross section of an RF ablation local temperature effect: on the left , an
image without any blood vessel; on the right, an image simulation temperature disturbance due to the
presence of a blood vessel (white).
hence some residual tumor margins may be untreated, increasing the odds of local tumor recurrence
[10, 14].
The preoperative evaluation is generally made based in CT or MR imaging used to study
the number and size of tumor masses and their position relatively to sensible structures such as
blood vessels (figure 7). The most common approach for the RFA procedure is a percutaneous
treatment because is the least invasive, with an associated low morbidity rate and it can be
performed on an outpatient basis since only conscious sedation is required. However, both
laparoscopy and laparotomy RFA have been used to treat liver tumors. For the needle placement, in
clinical practice, US, CT and MRI are used to guide the treatment, although other techniques may
be used. US is the preferred method, but has limited ability to assess the effectiveness of the
treatment providing only a rough estimation of the ablation spot size. Furthermore, this technique
does not permit to obtain images with defined tumor margins and consequently they are not
removed which does not prevent local recurrence of the tumor. Almost all patients feel transient
side effects, nausea and pain, during and after the procedure. Some of the patients (25%) also have
some late flu-like symptoms, such as fever and general malaise, 3 to 5 days after the ablation.
The most common application for RFA is the treatment of the liver, in both hepatocellular
carcinoma and metastatic liver tumors. When ablating the tumor, besides the blood vessels, the
Cytoreductive Surgical Treatment of Pleural Mesothelioma
13
physician may also plane the treatment avoiding bile ducts, gallbladder, diaphragm and bowel,
because patients with masses near these structures feel more pain during and after the ablation. The
main concern when ablating near the blood vessels is that the blood flow in the vessels cools the
tissue reducing the heating and therefore decreasing the effectiveness of the treatment. Patients are
considered candidates if they have less than 5 masses, each less than 5 cm in diameter and no
evidence of extrahepatic tumor. Figure 8 shows the results of RFA procedures in hepatocellular
carcinoma patients. Rossi et al. [12] showed that it was possible to achieve complete necrosis in
almost 90% of the patients with hepatocellular carcinoma in 6 months when treating tumors with a
diameter smaller than 3 cm. Livraghi et al. [12]on the other hand conclude that for tumor larger
than 3 cm the complete necrosis success decreased to 71% (3.1-5 cm).
Figure 9 – CT scans from a 46-year old patient with metastatic colon cancer. A: Before the treatment a 3-cm
metastasis is observed in the posterior right lobe of the liver. B: Immediately after the ablation a thermal
injury is observed in the treated area and there is no evidence of residual tumor. C: Follow-up 3 months after
ablation shows recurrent tumor in the margins of the ablated area. D: Immediately after re-ablation, it is
possible to observe an enlarged thermal injury with no evidence of recurrent tumor [12].
Figure 8 – Results of several studies about Percutaneous Radiofrequency Ablation of Hepatocellular
Carcinoma [12].
Cytoreductive Surgical Treatment of Pleural Mesothelioma
14
Radiofrequency ablation has also been used for lung cancer treatment. Simon et al. [15] in
2007 published a study about long-term survival, local tumor progression and complications rates in
153 patients submitted to CT-guided RFA in the lung between 1998 and 2005. The overall
conclusions were that the treatment has promising results in long-term survival rates (1-, 2-, 3-, 4-,
and 5-year survival rates, respectively, were 78%, 57%, 36%, 27%, and 27%) and local tumor
progression outcomes (1-, 2-, 3-, 4-, and 5-year local tumor progression–free rates, respectively,
were 83%, 64%, 57%, 47%, and 47% for tumors 3 cm or smaller and 45%, 25%, 25%, 25%, and
25% for tumors larger than 3 cm). Nevertheless, there was a significant difference between the
survival curves of patients with large (> 3cm) and small tumors, a common finding in studies with
RFA.
Research on RFA for kidney, breast and bone tumors has also been widely developed.
Besides tumor ablation, RFA has been applied in cardiac arrhythmia and pain management. RFA
was introduced in clinical use for cardiac arrhythmia to replace the direct-current shocks, therefore
avoiding the stimulation of cardiac and skeletal muscle, minimum discomfort and the discrete
resultant lesions from ablation that combined with the short treatment time reduce post procedural
complications [16]. Therefore it presents the advantages of symptoms relief, improvement in the
quality of life, discards the need for lifelong antiarrhythmic-drug therapy and allows long-term cost
savings.
2.2 High Intensity Focused Ultrasound Therapy
High Intensity Focused Ultrasound (HIFU) therapy is an emergent, non-invasive treatment
with great potential for tumor ablation, hemostasis, thrombolysis and targeted drug/gene delivery
[17, 18]. This therapy relies on the effects of Ultrasound (US) waves when focused on specific
target tissue of the body, resulting in an increase of tissues temperature that play an important role
in tumor ablation and hemostasis, or other non-thermal effects, significantly important in
Cytoreductive Surgical Treatment of Pleural Mesothelioma
15
thrombolysis or targeted drug/gene-delivery through cavitation mechanisms. For these last
applications low intensities US are used [17].
Ultrasound has a frequency higher than human ear can detect (superior to 20,000 Hz). By
definition, sound is a disturbance of mechanical energy travelling to a medium, which implies that a
medium has to be present for sound propagation. As the ultrasound wave propagates molecules
within the medium oscillate around their rest position in the direction of the wave, forming
compressions and rarefactions that propagate the wave. The ultrasound energy attenuates
exponentially as the wave travels through the tissue [17]. An important parameter when
characterizing ultrasound wave propagation is the acoustic intensity that it is defined as the rate of
energy flow through a unit area, normal to the direction of the propagation. US have been mostly
used in a diagnosis sense, showing minimal effects in the biological tissue. However, by being able
to maximize the energy accumulation in a specified target point it is possible to induce significant
changes in the definite biological tissue while sparing the adjacent organs as well as the skin [17].
As aforementioned, thermal effect and acoustic cavitation are the mechanisms more
significant in US and, therefore the resulting reactions in tissue by these effects have been widely
investigated and are now relatively well-understood. The first one results from the absorption of US
energy by the tissue, since the waves cause vibration and rotation of the molecules present in the
tissue and consequently frictional heat is generated. The US-induces changes by hyperthermia are
dependent on the temperature (T) reached and the duration of beam contact in the tissue. Hence, the
result may be an increase in tissues susceptibility for chemotherapy or radiotherapy (T>43ºC during
1 hour) or protein denaturation, also referred as coagulative necrosis (T=56ºC during 1 second)
[17]. The increase in the temperature is linearly-proportional to sonic intensity, as demonstrated by
equation 1 [17]:
(1)
Cytoreductive Surgical Treatment of Pleural Mesothelioma
16
being T = temperature (ºC), t = time (sec), α = absorption coefficient (~ 0.03 Np/cm in tissue-like
medium at 1MHz), I = sonic intensity, ρ = density (~ 1g.cm-3
in tissue-like medium) and Cp =
specific heat (~ 4.2 J/gºC in tissue-like medium).
The ultrasound beam is focused to obtain very small focal spots, which allows a very
precise treatment (figure 10). For example, using a 1.5 MHz transducer, it is possible obtain a focal
spot with 1 mm of diameter. The length of the focus is generally 5 to 20 times larger than the
diameter []18. Focusing the beam allows to concentrate US energy deep in the tissue, sparing the
adjacent organs and avoiding the ultrasound attenuation across the area within the sonication path.
To improve beam focusing, transducer arrays have been developed containing signals with different
phase to obtain a common focal spot. These systems permit electrical focusing then allowing
multiple focal spots simultaneously which contributes to decrease treatment time (figures 11 and
12) [18].
Figure 10 – A: HIFU-induced biological effects by hyperthermia. US waves are focused into a small spot,
where acoustic pressure increases and consequently rising tissue temperature. B: Properties of a geometrically
focused transducer. C: Normalized acoustic pressure in the direction of ultrasound propagation for a 1.5MHz
transducer with a radius of curvature of 8 cm and diameter of 10 cm [18].
43ºC 56ºC
Cytoreductive Surgical Treatment of Pleural Mesothelioma
17
Figure 11 – Different configurations for the use of
phases-arrays transducers to produce multiple
focal spots, steer the focal spot to different
locations and correct aberrations [18].
Interfaces between different types of tissue are a problem in HIFU. Ultrasound is
transmitted between surfaces of soft tissue with a small amount of wave reflected back. Between
soft tissue-bone the amount increases to one third of the incident energy [19]. Furthermore, the
amplitude attenuation coefficient of US is 10 to 20 times higher in bone than in soft tissue, which
means that the beam is rapidly absorbed within the bone [17]. The main problem however occurs in
the interface between gas and tissue, because gas has lower density than water or soft tissue and
therefore almost all energy is reflected back . This is the main reason why (so far) lungs have not
been considered an option for HIFU treatment [20].
Acoustic cavitation results in the formation of gas or vapor filled bubbles. This occurs when
a US wave with an intensity superior to a specified threshold interacts with biological tissue
Figure 12 – Different transducers for focusing
ultrasound. A: Spherically-curved transducer;
B: Flat transducer with interchangeable lens; C
and D: phased-array transducers [17].
Cytoreductive Surgical Treatment of Pleural Mesothelioma
18
creating a negative pressure due to ultrasound wave rarefaction which can be large enough to pull
gas out of the tissue and consequently form a bubble. The threshold depends on pressure amplitude
and the frequency of the sound wave and type of tissue where it occurs. After bubble formation the
cavitation may be stable (non-inertial cavitation) or unstable (inertial cavitation), depending on the
resonant size of the bubble. In the non-inertial cavitation case the bubble presents radial oscillations
in a resonant size in the frequency of the ultrasound beam. The bubble may however expand above
its resonant size, which eventually may lead to it disintegration and collapsing. The resultant
thermal and mechanical effects from acoustic cavitation are unpredictable and sometimes cause
unexpected damage in the tissue.
The thermal effect promoted both by US absorption and acoustic cavitation is on the base
of Focused Ultrasound Surgery (FUS) for tumor ablation. For this application, the range of spatial
average intensity is 100-10,000Wcm-2
. Although US absorption is the preferential effect to obtain
coagulative necrosis, since the reactions in the biological tissue are predictable, acoustic cavitation
effects have shown to improve the efficacy of the treatment, by increasing the ablation area, and
decreasing the procedure time.
The imagiology options used to guide the HIFU treatment are usually B-mode US images
and MRI. The B-mode images do not give information about the increase of temperature, but
instead show the activity of acoustic cavitation or tissue boiling, which introduces an error in the
actual location where necrosis occur. Further studies are necessary to evaluate the alteration in
sound speed with tissues temperature which can be a future option for US thermometry. Ultrasound
imaging, however, besides being relatively low-cost, allows real-time monitoring and a precise
simulation of HIFU beam propagation path. Nevertheless, the poor imaging contrast and limited
field of view are disadvantages in contrast with MRI. Furthermore, MRI permits to quantify the
temperature and generat thermal dose maps. MR thermometry is based on the proton resonance
frequency (PRF) shift of water, since the water proton resonance frequency changes with
temperature due to alterations in the hydrogen bonds in the water, then altering electron screening
Cytoreductive Surgical Treatment of Pleural Mesothelioma
19
Figure 13 – Temperature images acquired during sonication to evaluate targeting. A and B: Images acquired
before correcting focal coordinate; C and D: images acquired after correction. A and B: images acquired with
temperature imaging perpendicular to the ultrasound beam direction. C and D: images acquired with
temperature mapping along the beam direction [18].
of the nucleus. This effect can be assessed with phase subtraction MR images. The temperature
difference is given by equation 2 [18]:
(2)
where is the difference in the images phase before and after the sonication, TE the eco time and
the proton resonance frequency. Therefore, the thermometry sensitivity is not dependent on the
type of tissue, although some inaccuracies are verified in fat tissue (figure 13). One of the main
disadvantages of the technique is its sensitivity to motion, which introduces a relevant source of
error. Breath-hold techniques may be a solution by reducing the movement of abdominal and
thoracic organs, despite implying short sonication times.
MRgFUS received the approval of Food and Drug Administration (FDA) in 2004 for the
treatment of uterine fibroids, the most common benign neoplasm in women, using the General

Cytoreductive Surgical Treatment of Pleural Mesothelioma
20
Electrics (GE) Insightec ExAblate 2000 equipment. Additionally, Philips Sonalleve MR-HIFU and
Haifu JC and JC200 have European Commission (CE) approval [18]. Until 2004, the long term
option for women with this condition were radical hysterectomies, a very aggressive approach, or
no treatment at all, resulting in anemia, chronic pain or prolonged infertility. Although
myomectomy and uterine artery embolization are now viable options, FUS results are very
promising. MRgFUS allows an outpatient procedure, with a short recovery time and minimal post-
procedural complications [21]. At our center, this treatment is performed with the ExAblate 2000
device, from InSightec and MR images are used to plane tumor treatment in all three planes.
Ultrasound beam path is carefully defined in order to avoid bowel loops, bladder, scar tissue and the
sciatic nerve. Initially a low-power sonication is performed to detect the focal spot, providing if
necessary, the images for the operator to redefine the focal spot position. After the focal spot is
located in the ablation area, the power is increased and temperature is monitored until increases
over 60ºC. Several sonicatons are performed to ensure that the entire area is treated and by the end
of procedure the necrotic area is imaged with contrast enhancement, to verify the extension of
nonperfused necrotic tissue. By 2011, more than 6000 patients have been treated with MRgFUS,
5400 in clinical practice. Most of the times, it is possible to obtain more than 50% of fibroid volume
reduction with minimal or no side effects [18].
One of the problems when treating larger volumes is the time required to cover the entire
mass, particularly due to the cooling time required between sonications to avoid a thermal build-up
that occurs if the beam energies overlap. Several strategies have been developed, such as redefining
sonication order or the use of microbubbles that enhance the heating if within the focal spot,
reducing energy deposition in the adjacent tissue [18].
Several studies have developed to evaluate the feasibility of FUS in the treatment of liver
(figure 14), prostate and breast cancer. In the liver, image-guided FUS has been used in both focal
ablation and palliative tumor reduction [22]. This application, however, presents several challenges,
such as the presence of the rib cage that blocks the beam passage, leading to a restriction in the

Cytoreductive Surgical Treatment of Pleural Mesothelioma
21
volume to be treated. Respiratory motion of the liver also makes it difficult for an accurate targeting
and introduces errors in the thermometry values. Nevertheless, bread-hold approaches, as well as
technological developments (transducer designs and arrays alignment) will allow the increase in the
interest of this application over other thermal therapies widely used, such as radiofrequency ablation
and cryotherapy, since FUS is non-invasive and can be repeated as needed [18].
Most of prostate cancer treatment with FUS have been guided by US, making use of two
particular devices, Ablatherm and Sonablate, that combine a FUS transducer with a US rectal probe.
FUS with a trans-urethral approach is also being investigated. These procedures are performed
under anesthesia. The studies, however, show better results when combining FUS with hormonal
therapy. Several adverse effects from FUS treatment of the prostate, including urinary retention,
stress incontinence, bladder outlet obstruction, urinary tract infection and urethrorectal fistula, as
well as high degrees of impotence. The side effects are in-line with the ones experienced using
other types of prostate therapy.The use of MR as the imaging guidance method could benefit FUS
Figure 14 – MRgFUS of hepatocellular carcinoma. Left: Post-treatment image in coronal plane showing
entire thermal dose. Right: contrast-enhanced MRI showing focal nonperfusion [18].

Cytoreductive Surgical Treatment of Pleural Mesothelioma
22
treatment of prostate cancer through improved thermometry and tumor visualization, reducing the
adverse effects [18].
Cytoreductive Surgical Treatment of Pleural Mesothelioma
23
CHAPTER III
Materials and Methods
In this chapter, the methods and equipment used to induce the disease in the animals will be
described, as well as the approaches developed to treat the pigs with RFA and MRgFUS. Protocol
for all the procedures was approved by the Animal Care and Use Committee (ACUC).
3.1 Tumor Induction
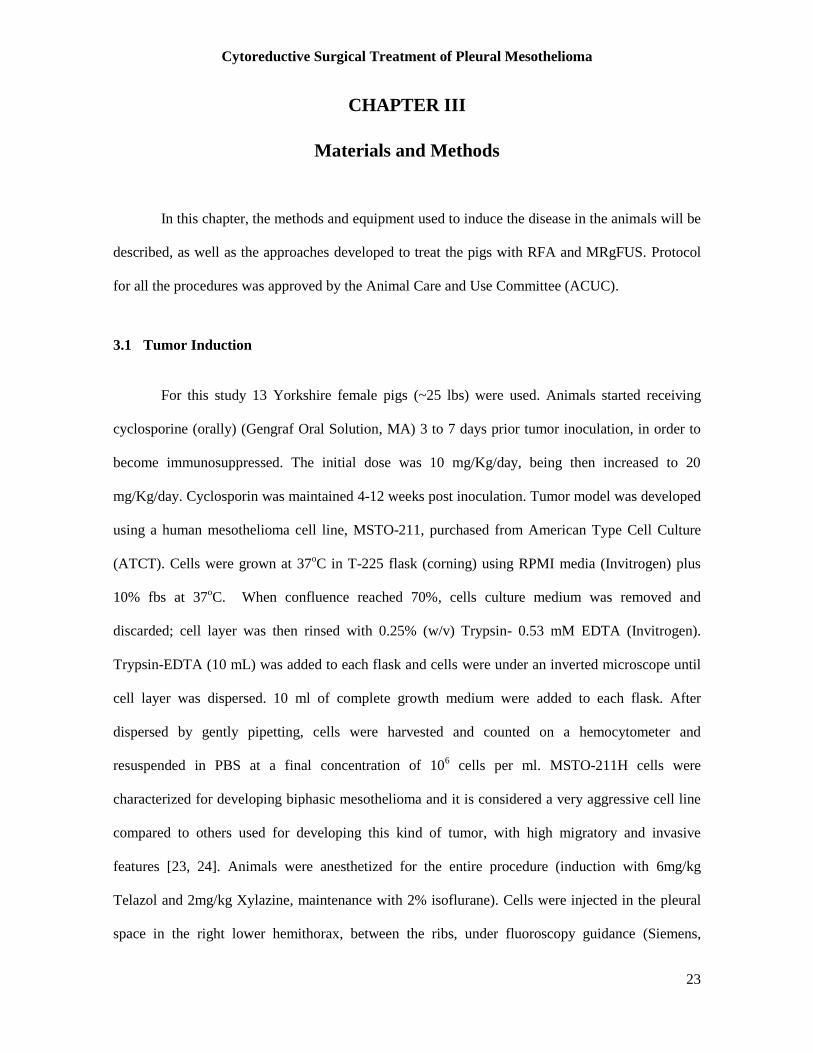
For this study 13 Yorkshire female pigs (~25 lbs) were used. Animals started receiving
cyclosporine (orally) (Gengraf Oral Solution, MA) 3 to 7 days prior tumor inoculation, in order to
become immunosuppressed. The initial dose was 10 mg/Kg/day, being then increased to 20
mg/Kg/day. Cyclosporin was maintained 4-12 weeks post inoculation. Tumor model was developed
using a human mesothelioma cell line, MSTO-211, purchased from American Type Cell Culture
(ATCT). Cells were grown at 37oC in T-225 flask (corning) using RPMI media (Invitrogen) plus
10% fbs at 37oC. When confluence reached 70%, cells culture medium was removed and
discarded; cell layer was then rinsed with 0.25% (w/v) Trypsin- 0.53 mM EDTA (Invitrogen).
Trypsin-EDTA (10 mL) was added to each flask and cells were under an inverted microscope until
cell layer was dispersed. 10 ml of complete growth medium were added to each flask. After
dispersed by gently pipetting, cells were harvested and counted on a hemocytometer and
resuspended in PBS at a final concentration of 106 cells per ml. MSTO-211H cells were
characterized for developing biphasic mesothelioma and it is considered a very aggressive cell line
compared to others used for developing this kind of tumor, with high migratory and invasive
features [23, 24]. Animals were anesthetized for the entire procedure (induction with 6mg/kg
Telazol and 2mg/kg Xylazine, maintenance with 2% isoflurane). Cells were injected in the pleural
space in the right lower hemithorax, between the ribs, under fluoroscopy guidance (Siemens,
Cytoreductive Surgical Treatment of Pleural Mesothelioma
24
Figure 15 – Setup environment for cell inoculation. Fluoroscopy allows to clearly distinguishing the liver, the heart
and the ribs, therefore guiding the procedure. Inoculations were performed in the right side in the intercostal spaces.
Arcadis, PA) (figure 15). Cells were also introduced in the liver in an attempt to reproduce
metastatic disease. The procedure was performed, using a 22-gauge needle (22Gx6TW Chiba
Needle, Becton Dickinson Medical Systems), inserted between the ribs. The number of cells
injected in each pig and dose of cyclosporine are represented in table 1.
Animal # Cell solution injected in the
pleural space (mL)
Cell solution injected in
the liver (mL) Cyclosporine Dose (mg/Kg/day)
1 6 Not inoculated 10 (until euthanasia)
2 13 Not inoculated 10 (until euthanasia)
3 11 2 20 (until 12 weeks post-inoculation)
4 5 2 20 (until 12 weeks post-inoculation)
5 5.5 1.5 20 (died after inoculation)
6 9 2 20 (until 12 weeks post-inoculation)
7 7 2 20 (until 8 weeks post-inoculation)
8 7 2 20 (until 8 weeks post-inoculation)
9 10 2 20 (until 8 weeks post-inoculation)
10 5 2 20 (until 4 weeks post-inoculation)
11 6 2 20 (died after inoculation)
12 8 2 20 (until 4 weeks post-inoculation)
13 8 2 20 (until 4 weeks post-inoculation)
Table 2 – Quantity of cell solution (106 cells/mL) injected in the liver and right pleural space, as well as the
dose and ending time-point for cyclosporine administration.
Cytoreductive Surgical Treatment of Pleural Mesothelioma
25
Animals were imaged at baseline and followed-up every 4 weeks until 8, 12 or 16 weeks
post-inoculation (figure 16). MRI was performed in a 1.5T scanner (Avanto, Siemens Healthcare,
PA). Two coils were simultaneously used, a body array coil and a spine array coil (Siemens, PA).
Contrast agent (Gadolinium: Omniscan, Novaplus, PA and Magnevist, Bayer, NJ) was given in a
1mL/lb dose. To avoid motion artifacts, pigs were artificially ventilated and most of MR images
(excepting T2-Blade sequence) were acquired in a breath-hold regimen. The ventilator was set to an
inhalation period of 60% of the breathing cycle and an exhalation period of 40%. Five MR pulse
sequences were used: Haste (fast spin-echo T2-weighted sequence); Blade (T2-weighted sequence);
VIBE (volume interpolated gradient echo sequence); True FISP (fast imaging with steady state
precession); TWIST (Time-resolved angiography sequence). Changes observed in the pigs’ pleura
during follow-ups were measured using ImageJ, a free-software that allows manually selecting
regions of interest and calculating their areas and width. For this purpose, True FISP images were
used.
3.2 Radiofrequency Ablation Procedures
Animals #3, #4, #6, #7 and #9 were treated at the end with percutaneous Radiofrequency
Ablation. For this, we used a RF 3000 Radio Frequency Generator (Boston Scientific, MA) (figure
17), an impedance-based feedback system and 200 Watt of power capacity. This equipment allows
the connection of 4 ground pads for heat dispersion (Electrosurgical Ground Pad with Safety Ring,
Novaplus, CA), that were put in the lower part of the abdomen of the pig in a supine position. A 2.0
Figure 16 – Time line of the procedures. Pigs were treated at different timepoints.
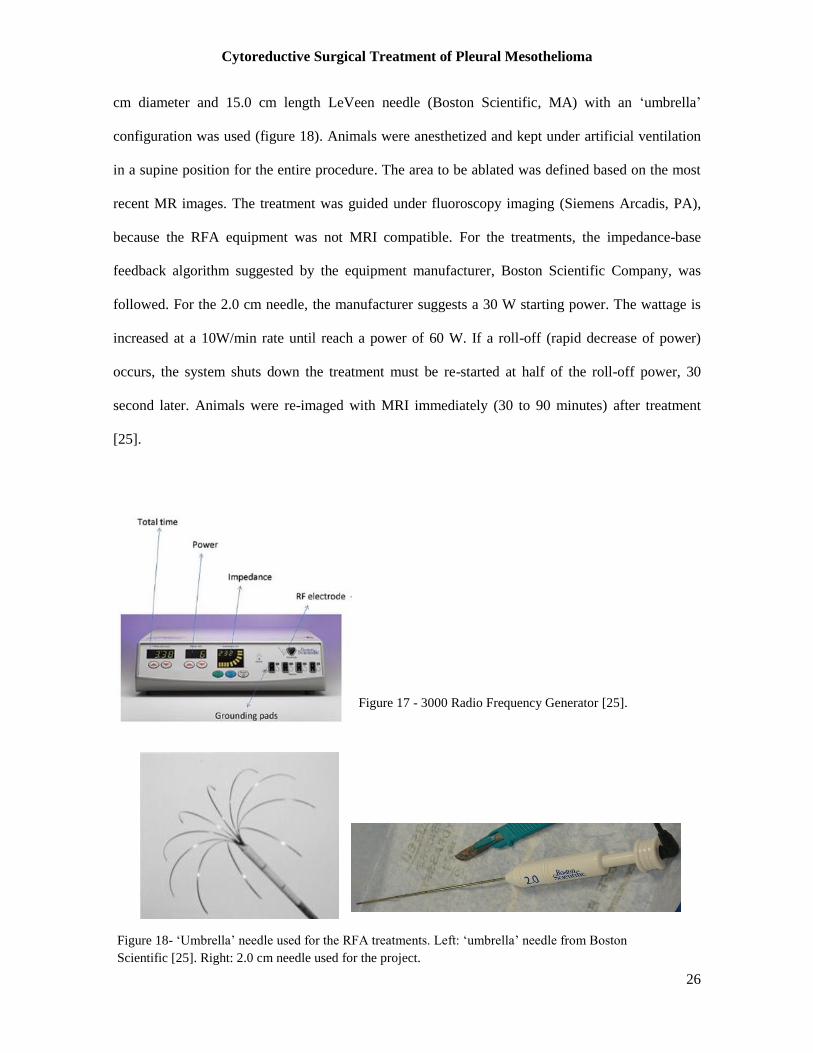
Cytoreductive Surgical Treatment of Pleural Mesothelioma
26
cm diameter and 15.0 cm length LeVeen needle (Boston Scientific, MA) with an ‘umbrella’
configuration was used (figure 18). Animals were anesthetized and kept under artificial ventilation
in a supine position for the entire procedure. The area to be ablated was defined based on the most
recent MR images. The treatment was guided under fluoroscopy imaging (Siemens Arcadis, PA),
because the RFA equipment was not MRI compatible. For the treatments, the impedance-base
feedback algorithm suggested by the equipment manufacturer, Boston Scientific Company, was
followed. For the 2.0 cm needle, the manufacturer suggests a 30 W starting power. The wattage is
increased at a 10W/min rate until reach a power of 60 W. If a roll-off (rapid decrease of power)
occurs, the system shuts down the treatment must be re-started at half of the roll-off power, 30
second later. Animals were re-imaged with MRI immediately (30 to 90 minutes) after treatment
[25].
Figure 17 - 3000 Radio Frequency Generator [25].
Figure 18- ‘Umbrella’ needle used for the RFA treatments. Left: ‘umbrella’ needle from Boston
Scientific [25]. Right: 2.0 cm needle used for the project.
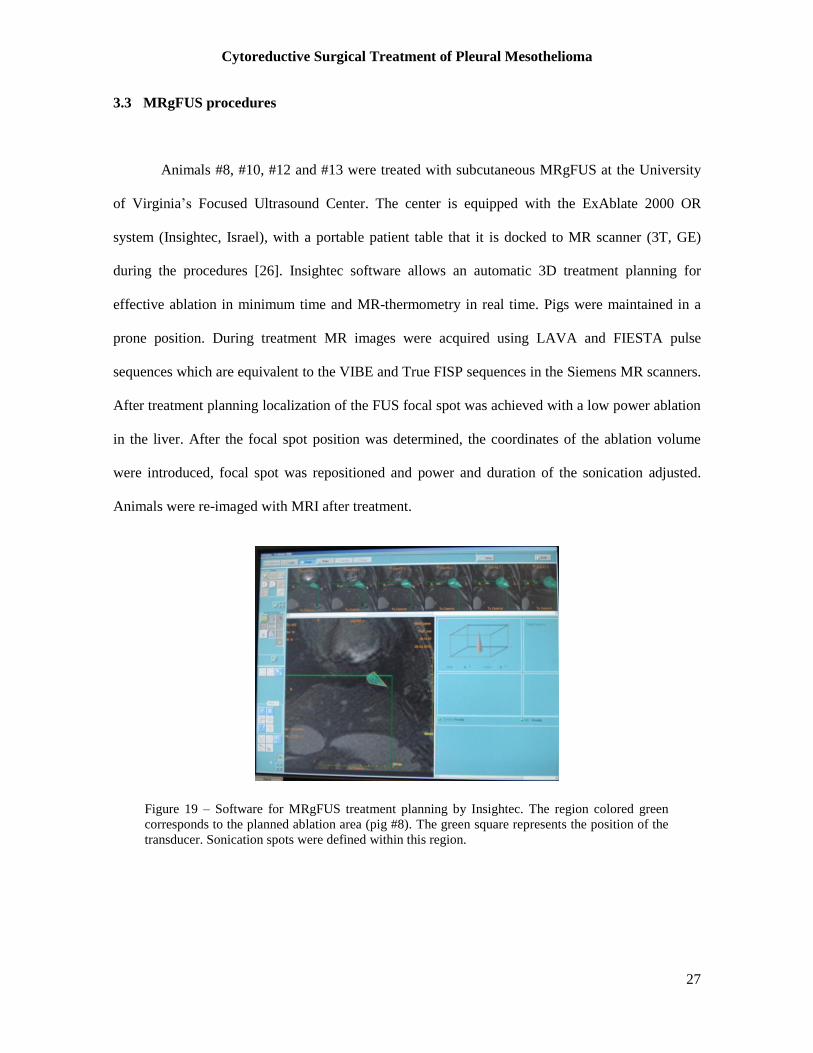
Cytoreductive Surgical Treatment of Pleural Mesothelioma
27
3.3 MRgFUS procedures
Animals #8, #10, #12 and #13 were treated with subcutaneous MRgFUS at the University
of Virginia’s Focused Ultrasound Center. The center is equipped with the ExAblate 2000 OR
system (Insightec, Israel), with a portable patient table that it is docked to MR scanner (3T, GE)
during the procedures [26]. Insightec software allows an automatic 3D treatment planning for
effective ablation in minimum time and MR-thermometry in real time. Pigs were maintained in a
prone position. During treatment MR images were acquired using LAVA and FIESTA pulse
sequences which are equivalent to the VIBE and True FISP sequences in the Siemens MR scanners.
After treatment planning localization of the FUS focal spot was achieved with a low power ablation
in the liver. After the focal spot position was determined, the coordinates of the ablation volume
were introduced, focal spot was repositioned and power and duration of the sonication adjusted.
Animals were re-imaged with MRI after treatment.
Figure 19 – Software for MRgFUS treatment planning by Insightec. The region colored green
corresponds to the planned ablation area (pig #8). The green square represents the position of the
transducer. Sonication spots were defined within this region.
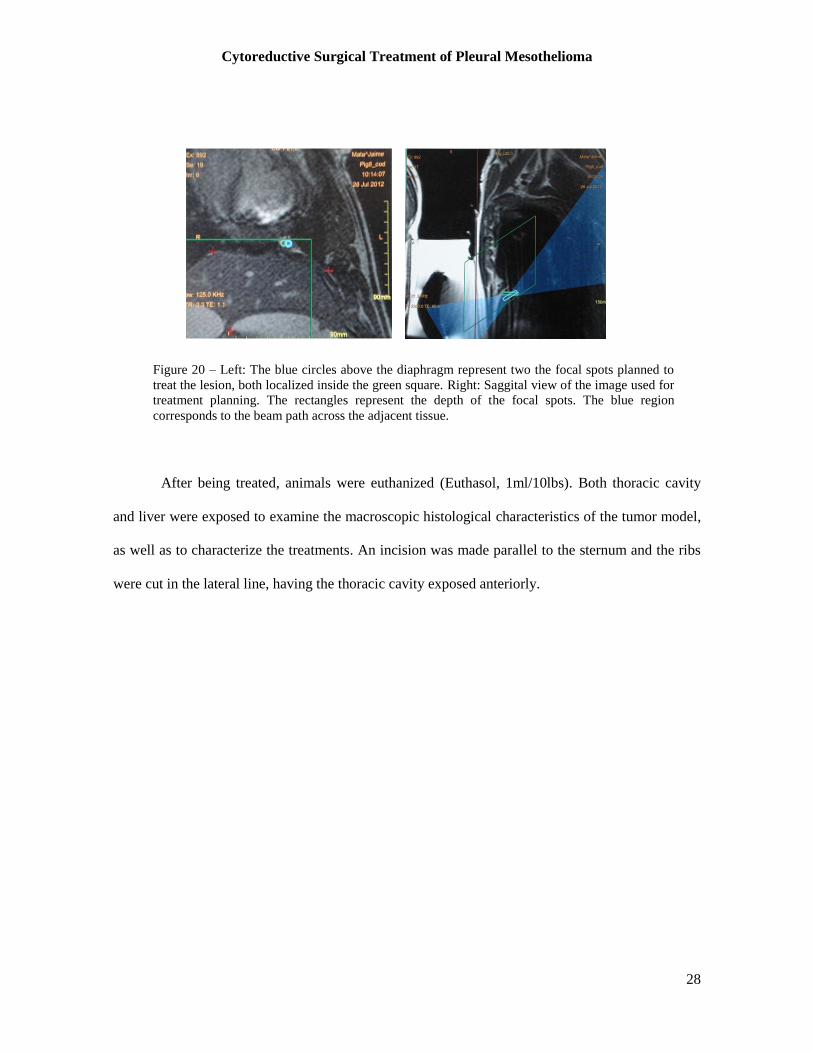
Cytoreductive Surgical Treatment of Pleural Mesothelioma
28
After being treated, animals were euthanized (Euthasol, 1ml/10lbs). Both thoracic cavity
and liver were exposed to examine the macroscopic histological characteristics of the tumor model,
as well as to characterize the treatments. An incision was made parallel to the sternum and the ribs
were cut in the lateral line, having the thoracic cavity exposed anteriorly.
Figure 20 – Left: The blue circles above the diaphragm represent two the focal spots planned to
treat the lesion, both localized inside the green square. Right: Saggital view of the image used for
treatment planning. The rectangles represent the depth of the focal spots. The blue region
corresponds to the beam path across the adjacent tissue.
Cytoreductive Surgical Treatment of Pleural Mesothelioma
29
CHAPTER IV
Results
This chapter will be divided in three sections; each one describing the results obtained in
the tumor model development, radiofrequency ablation and MRgFUS treatments, respectively.
4.1 Tumor model
Pigs were followed every four weeks after their inoculation to evaluate tumor development.
Control animals, pig #1 and #2 received an unequal number of mesothelioma cells and a lower dose
of cyclosporine A to evaluate the effects of both parameters in the tumor development. Analysis of
both MRI and necropsy revealed a faster disease development in pig #2 which received more than
twice the number of cells compared with pig #1.
Since tumor masses were not observed for these two pigs the dose of cyclosporine was
doubled for the remaining pigs. Some mild side effects, such as vomiting (pig #3, #6), loose stools
(pig #6) and diarrhea (pig #6) were experienced during the study. However, dose was not reduced in
order to improve tumor development over time, since the symptoms were not very debilitating for
the animal.
Pigs #5 and #11 died immediately after the inoculation procedure. Pig #5 was injected with
the mesothelioma cells in both pleura and liver without being mechanically ventilated. By the end
of the procedure the animal was moved from supine to prone position and stopped breathing,
although fluoroscopy images revealed that its heart kept beating and lungs were not collapsed.
Anesthesia was reversed and the pig was mechanically ventilated, but after few minutes the heart
stopped beating (confirmed by fluoroscopy) and resuscitation was concluded. MRI analysis
revealed some inflammation in the left lung, but no further signs of previous disease that could lead
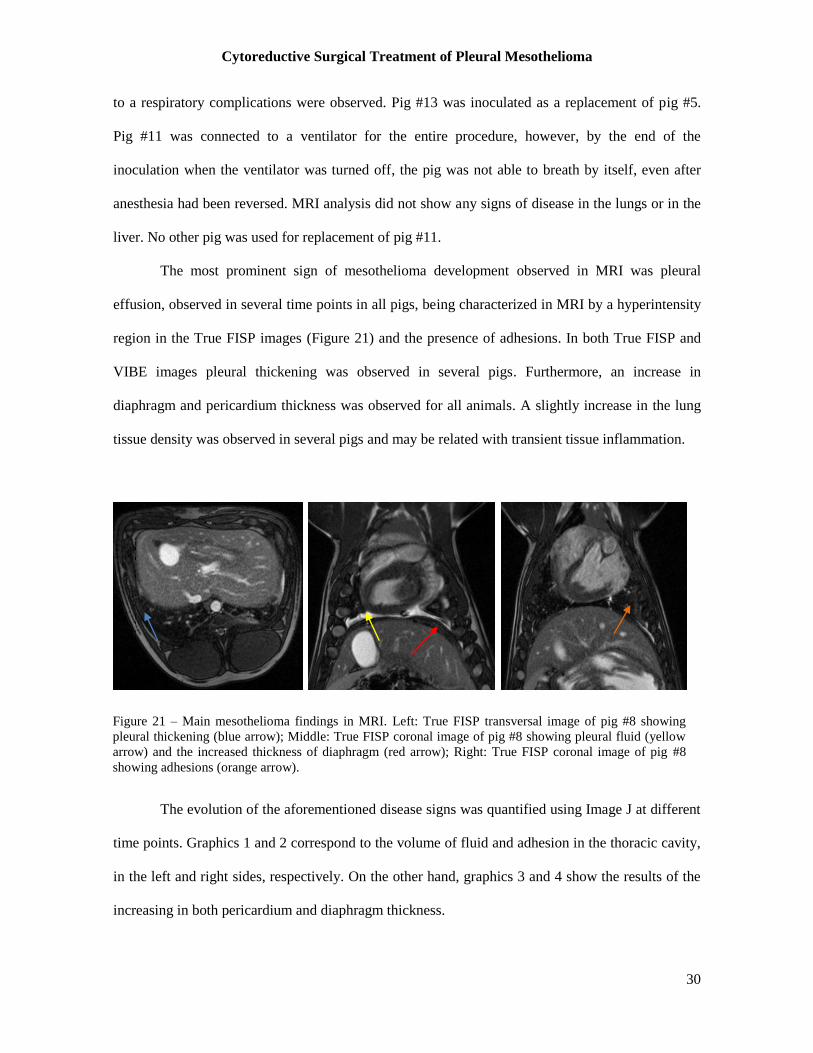
Cytoreductive Surgical Treatment of Pleural Mesothelioma
30
to a respiratory complications were observed. Pig #13 was inoculated as a replacement of pig #5.
Pig #11 was connected to a ventilator for the entire procedure, however, by the end of the
inoculation when the ventilator was turned off, the pig was not able to breath by itself, even after
anesthesia had been reversed. MRI analysis did not show any signs of disease in the lungs or in the
liver. No other pig was used for replacement of pig #11.
The most prominent sign of mesothelioma development observed in MRI was pleural
effusion, observed in several time points in all pigs, being characterized in MRI by a hyperintensity
region in the True FISP images (Figure 21) and the presence of adhesions. In both True FISP and
VIBE images pleural thickening was observed in several pigs. Furthermore, an increase in
diaphragm and pericardium thickness was observed for all animals. A slightly increase in the lung
tissue density was observed in several pigs and may be related with transient tissue inflammation.
The evolution of the aforementioned disease signs was quantified using Image J at different
time points. Graphics 1 and 2 correspond to the volume of fluid and adhesion in the thoracic cavity,
in the left and right sides, respectively. On the other hand, graphics 3 and 4 show the results of the
increasing in both pericardium and diaphragm thickness.
Figure 21 – Main mesothelioma findings in MRI. Left: True FISP transversal image of pig #8 showing
pleural thickening (blue arrow); Middle: True FISP coronal image of pig #8 showing pleural fluid (yellow
arrow) and the increased thickness of diaphragm (red arrow); Right: True FISP coronal image of pig #8
showing adhesions (orange arrow).
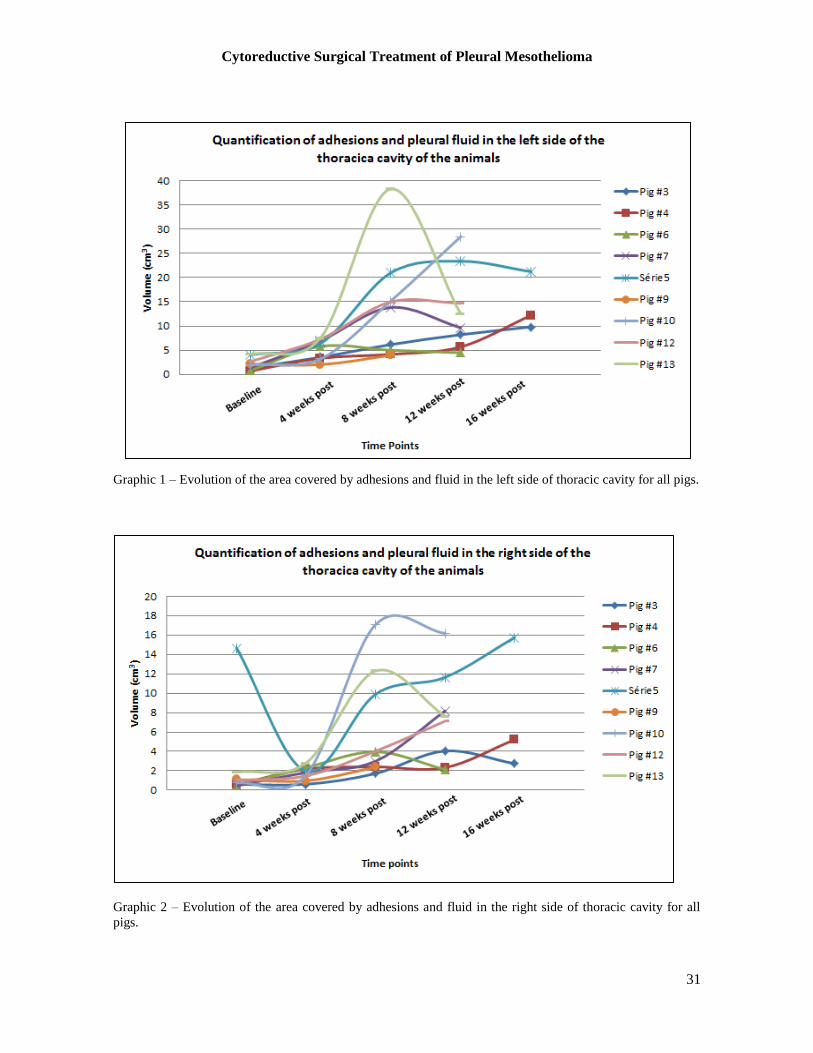
Cytoreductive Surgical Treatment of Pleural Mesothelioma
31
Graphic 1 – Evolution of the area covered by adhesions and fluid in the left side of thoracic cavity for all pigs.
Graphic 2 – Evolution of the area covered by adhesions and fluid in the right side of thoracic cavity for all
pigs.
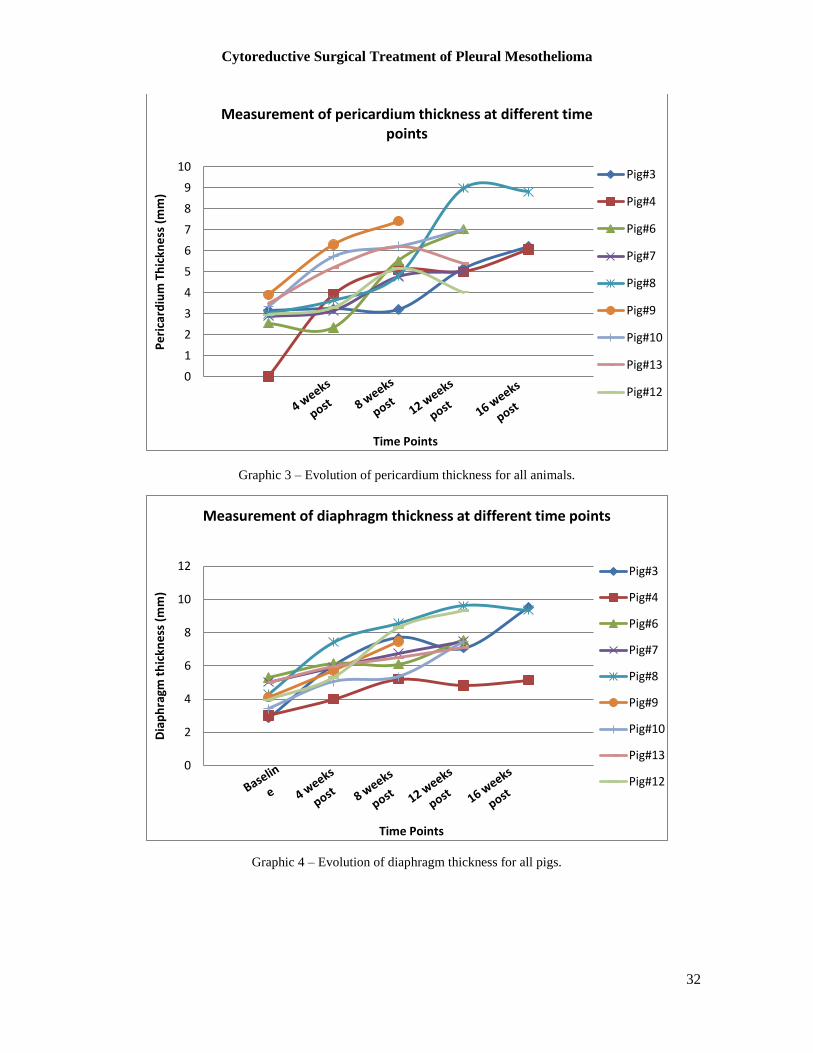
Cytoreductive Surgical Treatment of Pleural Mesothelioma
32
Graphic 3 – Evolution of pericardium thickness for all animals.
Graphic 4 – Evolution of diaphragm thickness for all pigs.
0
1
2
3
4
5
6
7
8
9
10P
eri
card
ium
Th
ickn
ess
(m
m)
Time Points
Measurement of pericardium thickness at different time points
Pig#3
Pig#4
Pig#6
Pig#7
Pig#8
Pig#9
Pig#10
Pig#13
Pig#12
0
2
4
6
8
10
12
Dia
ph
ragm
th
ickn
ess
(m
m)
Time Points
Measurement of diaphragm thickness at different time points
Pig#3
Pig#4
Pig#6
Pig#7
Pig#8
Pig#9
Pig#10
Pig#13
Pig#12
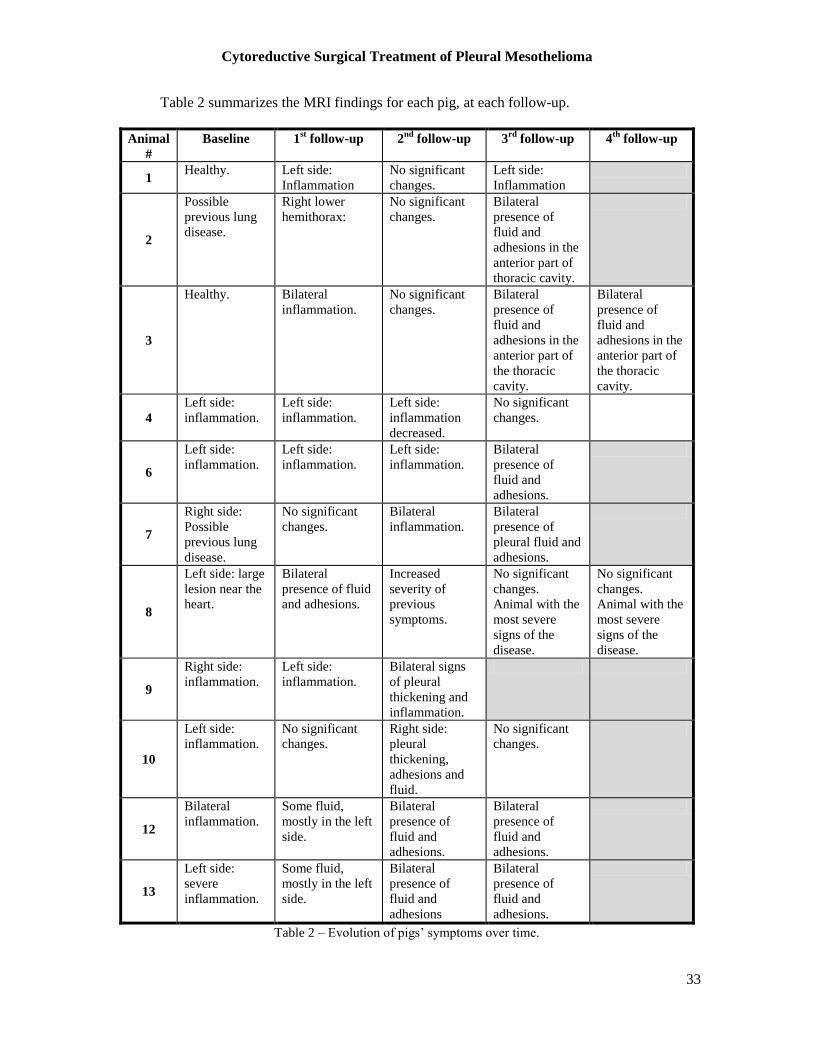
Cytoreductive Surgical Treatment of Pleural Mesothelioma
33
Table 2 summarizes the MRI findings for each pig, at each follow-up.
Animal
#
Baseline 1st follow-up 2
nd follow-up 3
rd follow-up 4
th follow-up
1 Healthy. Left side:
Inflammation
No significant
changes.
Left side:
Inflammation
2
Possible
previous lung
disease.
Right lower
hemithorax:
No significant
changes.
Bilateral
presence of
fluid and
adhesions in the
anterior part of
thoracic cavity.
3
Healthy.
Bilateral
inflammation.
No significant
changes.
Bilateral
presence of
fluid and
adhesions in the
anterior part of
the thoracic
cavity.
Bilateral
presence of
fluid and
adhesions in the
anterior part of
the thoracic
cavity.
4
Left side:
inflammation.
Left side:
inflammation.
Left side:
inflammation
decreased.
No significant
changes.
6
Left side:
inflammation.
Left side:
inflammation.
Left side:
inflammation.
Bilateral
presence of
fluid and
adhesions.
7
Right side:
Possible
previous lung
disease.
No significant
changes.
Bilateral
inflammation.
Bilateral
presence of
pleural fluid and
adhesions.
8
Left side: large
lesion near the
heart.
Bilateral
presence of fluid
and adhesions.
Increased
severity of
previous
symptoms.
No significant
changes.
Animal with the
most severe
signs of the
disease.
No significant
changes.
Animal with the
most severe
signs of the
disease.
9
Right side:
inflammation.
Left side:
inflammation.
Bilateral signs
of pleural
thickening and
inflammation.
10
Left side:
inflammation.
No significant
changes.
Right side:
pleural
thickening,
adhesions and
fluid.
No significant
changes.
12
Bilateral
inflammation.
Some fluid,
mostly in the left
side.
Bilateral
presence of
fluid and
adhesions.
Bilateral
presence of
fluid and
adhesions.
13
Left side:
severe
inflammation.
Some fluid,
mostly in the left
side.
Bilateral
presence of
fluid and
adhesions
Bilateral
presence of
fluid and
adhesions.
Table 2 – Evolution of pigs’ symptoms over time.
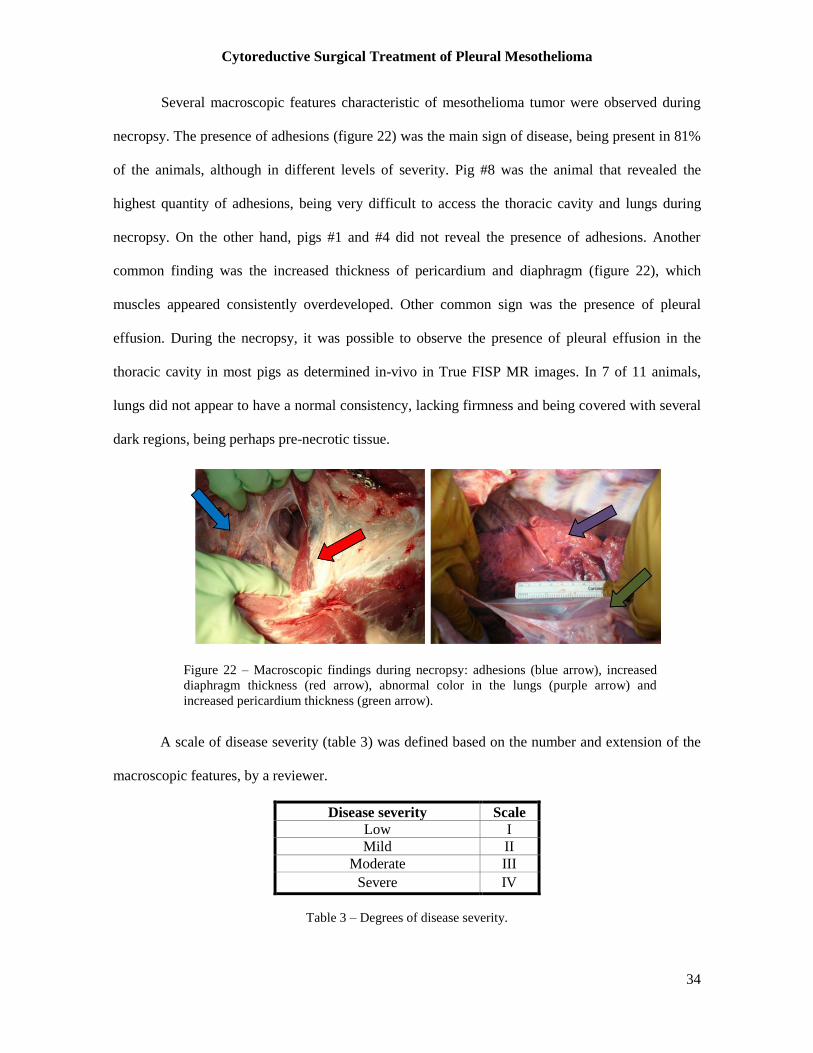
Cytoreductive Surgical Treatment of Pleural Mesothelioma
34
Figure 22 – Macroscopic findings during necropsy: adhesions (blue arrow), increased
diaphragm thickness (red arrow), abnormal color in the lungs (purple arrow) and
increased pericardium thickness (green arrow).
Several macroscopic features characteristic of mesothelioma tumor were observed during
necropsy. The presence of adhesions (figure 22) was the main sign of disease, being present in 81%
of the animals, although in different levels of severity. Pig #8 was the animal that revealed the
highest quantity of adhesions, being very difficult to access the thoracic cavity and lungs during
necropsy. On the other hand, pigs #1 and #4 did not reveal the presence of adhesions. Another
common finding was the increased thickness of pericardium and diaphragm (figure 22), which
muscles appeared consistently overdeveloped. Other common sign was the presence of pleural
effusion. During the necropsy, it was possible to observe the presence of pleural effusion in the
thoracic cavity in most pigs as determined in-vivo in True FISP MR images. In 7 of 11 animals,
lungs did not appear to have a normal consistency, lacking firmness and being covered with several
dark regions, being perhaps pre-necrotic tissue.
A scale of disease severity (table 3) was defined based on the number and extension of the
macroscopic features, by a reviewer.
Disease severity Scale
Low I
Mild II
Moderate III
Severe IV
Table 3 – Degrees of disease severity.
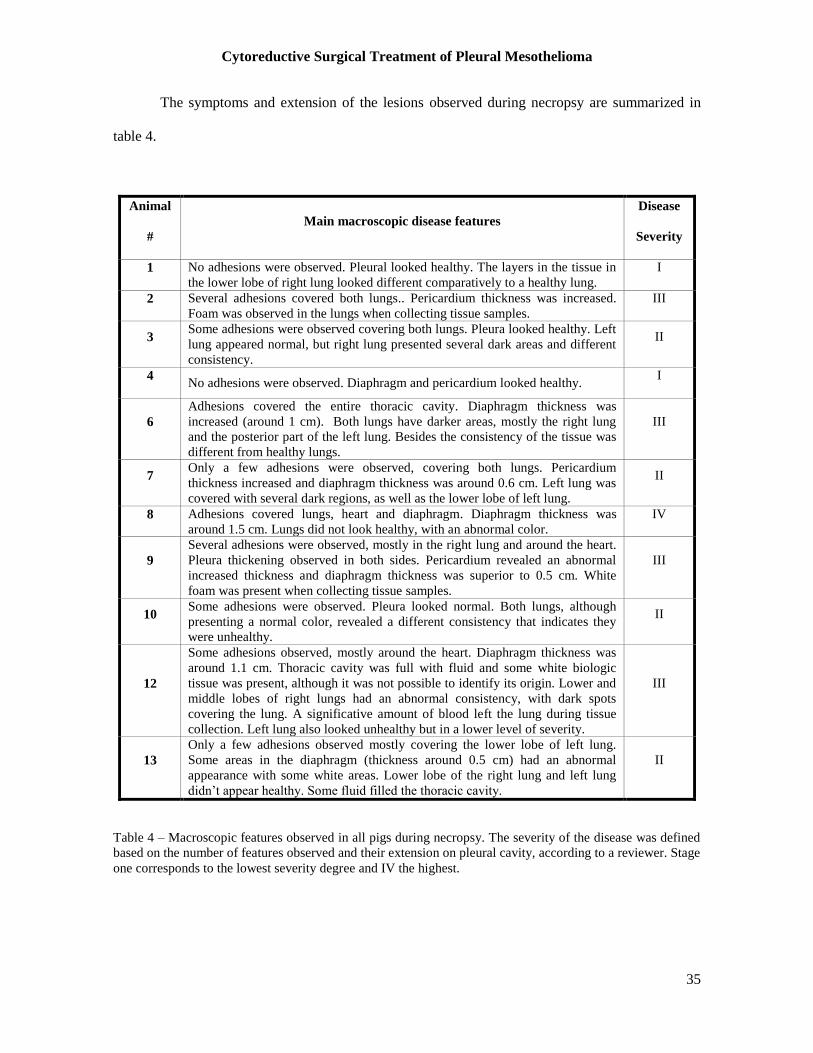
Cytoreductive Surgical Treatment of Pleural Mesothelioma
35
The symptoms and extension of the lesions observed during necropsy are summarized in
table 4.
Animal
#
Main macroscopic disease features
Disease
Severity
1 No adhesions were observed. Pleural looked healthy. The layers in the tissue in
the lower lobe of right lung looked different comparatively to a healthy lung.
I
2 Several adhesions covered both lungs.. Pericardium thickness was increased.
Foam was observed in the lungs when collecting tissue samples.
III
3 Some adhesions were observed covering both lungs. Pleura looked healthy. Left
lung appeared normal, but right lung presented several dark areas and different
consistency.
II
4 No adhesions were observed. Diaphragm and pericardium looked healthy.
I
6
Adhesions covered the entire thoracic cavity. Diaphragm thickness was
increased (around 1 cm). Both lungs have darker areas, mostly the right lung
and the posterior part of the left lung. Besides the consistency of the tissue was
different from healthy lungs.
III
7 Only a few adhesions were observed, covering both lungs. Pericardium
thickness increased and diaphragm thickness was around 0.6 cm. Left lung was
covered with several dark regions, as well as the lower lobe of left lung.
II
8 Adhesions covered lungs, heart and diaphragm. Diaphragm thickness was
around 1.5 cm. Lungs did not look healthy, with an abnormal color.
IV
9
Several adhesions were observed, mostly in the right lung and around the heart.
Pleura thickening observed in both sides. Pericardium revealed an abnormal
increased thickness and diaphragm thickness was superior to 0.5 cm. White
foam was present when collecting tissue samples.
III
10 Some adhesions were observed. Pleura looked normal. Both lungs, although
presenting a normal color, revealed a different consistency that indicates they
were unhealthy.
II
12
Some adhesions observed, mostly around the heart. Diaphragm thickness was
around 1.1 cm. Thoracic cavity was full with fluid and some white biologic
tissue was present, although it was not possible to identify its origin. Lower and
middle lobes of right lungs had an abnormal consistency, with dark spots
covering the lung. A significative amount of blood left the lung during tissue
collection. Left lung also looked unhealthy but in a lower level of severity.
III
13
Only a few adhesions observed mostly covering the lower lobe of left lung.
Some areas in the diaphragm (thickness around 0.5 cm) had an abnormal
appearance with some white areas. Lower lobe of the right lung and left lung
didn’t appear healthy. Some fluid filled the thoracic cavity.
II
Table 4 – Macroscopic features observed in all pigs during necropsy. The severity of the disease was defined
based on the number of features observed and their extension on pleural cavity, according to a reviewer. Stage
one corresponds to the lowest severity degree and IV the highest.
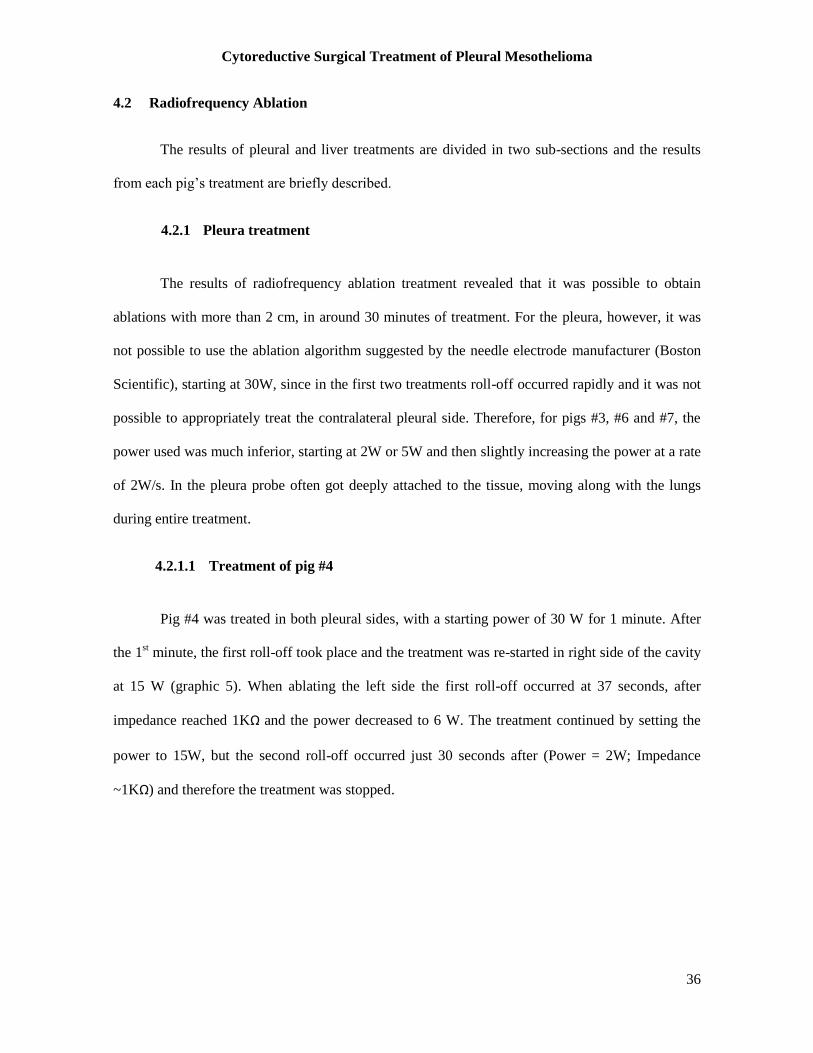
Cytoreductive Surgical Treatment of Pleural Mesothelioma
36
4.2 Radiofrequency Ablation
The results of pleural and liver treatments are divided in two sub-sections and the results
from each pig’s treatment are briefly described.
4.2.1 Pleura treatment
The results of radiofrequency ablation treatment revealed that it was possible to obtain
ablations with more than 2 cm, in around 30 minutes of treatment. For the pleura, however, it was
not possible to use the ablation algorithm suggested by the needle electrode manufacturer (Boston
Scientific), starting at 30W, since in the first two treatments roll-off occurred rapidly and it was not
possible to appropriately treat the contralateral pleural side. Therefore, for pigs #3, #6 and #7, the
power used was much inferior, starting at 2W or 5W and then slightly increasing the power at a rate
of 2W/s. In the pleura probe often got deeply attached to the tissue, moving along with the lungs
during entire treatment.
4.2.1.1 Treatment of pig #4
Pig #4 was treated in both pleural sides, with a starting power of 30 W for 1 minute. After
the 1st minute, the first roll-off took place and the treatment was re-started in right side of the cavity
at 15 W (graphic 5). When ablating the left side the first roll-off occurred at 37 seconds, after
impedance reached 1KΩ and the power decreased to 6 W. The treatment continued by setting the
power to 15W, but the second roll-off occurred just 30 seconds after (Power = 2W; Impedance
~1KΩ) and therefore the treatment was stopped.
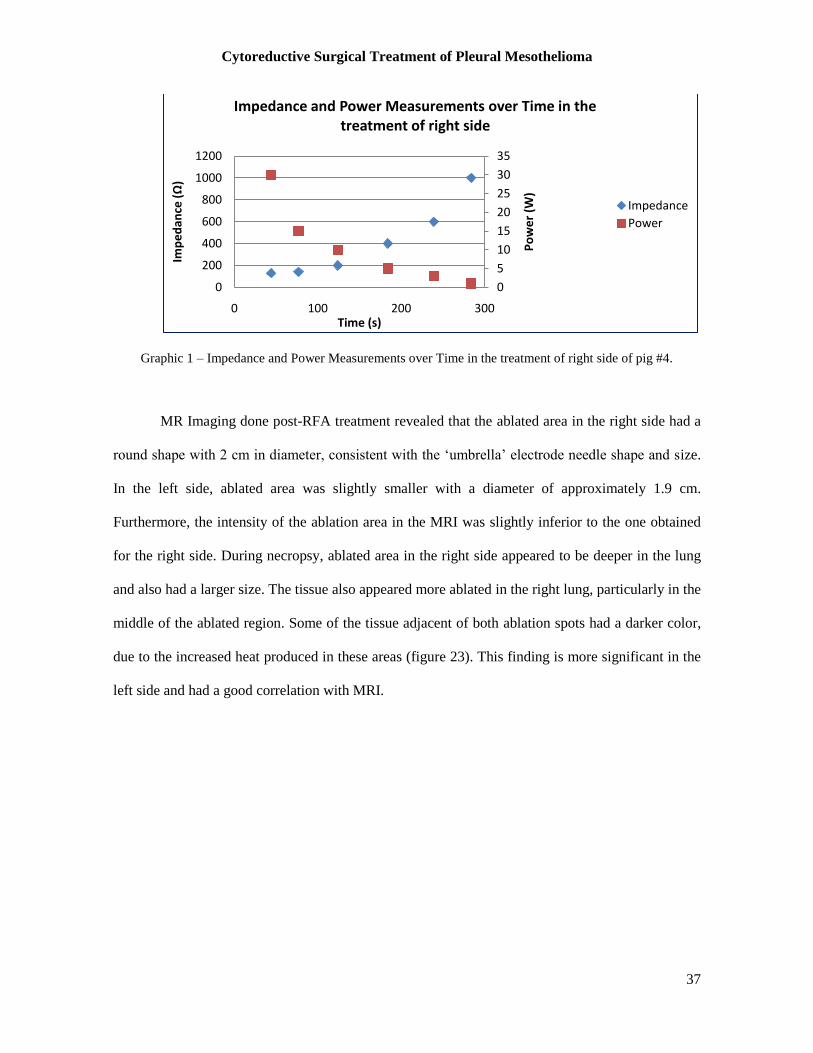
Cytoreductive Surgical Treatment of Pleural Mesothelioma
37
Graphic 1 – Impedance and Power Measurements over Time in the treatment of right side of pig #4.
MR Imaging done post-RFA treatment revealed that the ablated area in the right side had a
round shape with 2 cm in diameter, consistent with the ‘umbrella’ electrode needle shape and size.
In the left side, ablated area was slightly smaller with a diameter of approximately 1.9 cm.
Furthermore, the intensity of the ablation area in the MRI was slightly inferior to the one obtained
for the right side. During necropsy, ablated area in the right side appeared to be deeper in the lung
and also had a larger size. The tissue also appeared more ablated in the right lung, particularly in the
middle of the ablated region. Some of the tissue adjacent of both ablation spots had a darker color,
due to the increased heat produced in these areas (figure 23). This finding is more significant in the
left side and had a good correlation with MRI.
0
5
10
15
20
25
30
35
0
200
400
600
800
1000
1200
0 100 200 300
Po
we
r (W
)
Imp
ed
ance
(Ω
)
Time (s)
Impedance and Power Measurements over Time in the treatment of right side
Impedance
Power
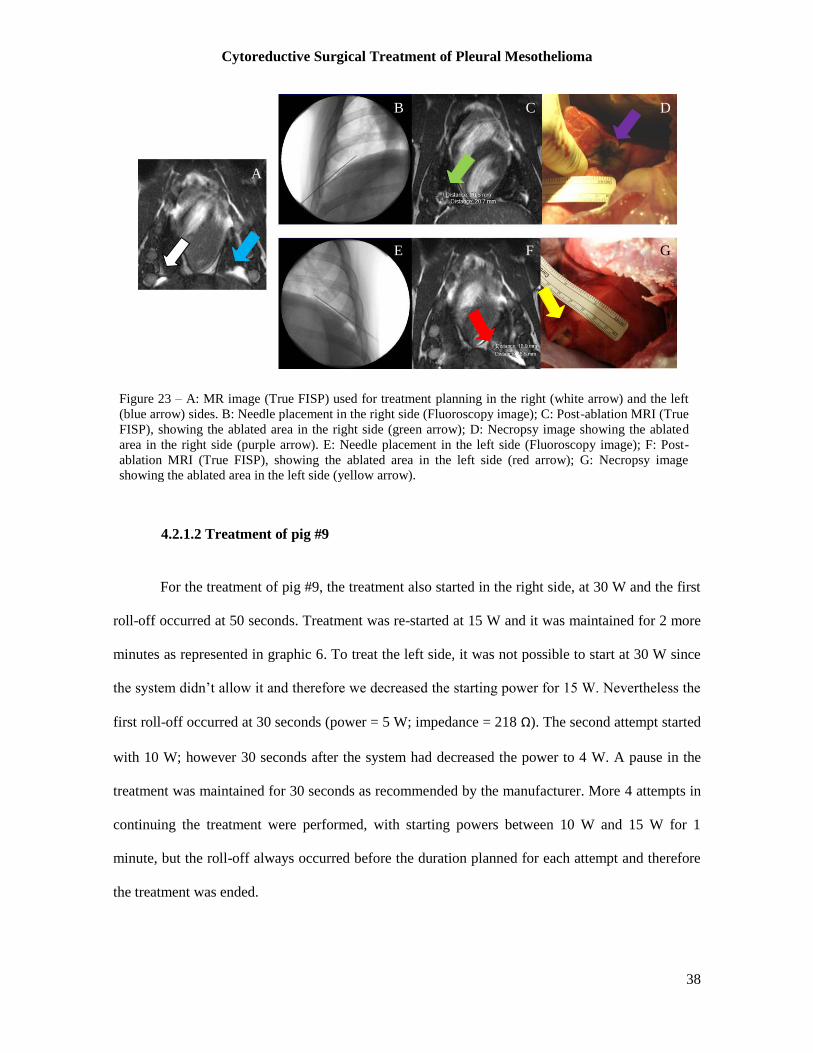
Cytoreductive Surgical Treatment of Pleural Mesothelioma
38
4.2.1.2 Treatment of pig #9
For the treatment of pig #9, the treatment also started in the right side, at 30 W and the first
roll-off occurred at 50 seconds. Treatment was re-started at 15 W and it was maintained for 2 more
minutes as represented in graphic 6. To treat the left side, it was not possible to start at 30 W since
the system didn’t allow it and therefore we decreased the starting power for 15 W. Nevertheless the
first roll-off occurred at 30 seconds (power = 5 W; impedance = 218 Ω). The second attempt started
with 10 W; however 30 seconds after the system had decreased the power to 4 W. A pause in the
treatment was maintained for 30 seconds as recommended by the manufacturer. More 4 attempts in
continuing the treatment were performed, with starting powers between 10 W and 15 W for 1
minute, but the roll-off always occurred before the duration planned for each attempt and therefore
the treatment was ended.
Figure 23 – A: MR image (True FISP) used for treatment planning in the right (white arrow) and the left
(blue arrow) sides. B: Needle placement in the right side (Fluoroscopy image); C: Post-ablation MRI (True
FISP), showing the ablated area in the right side (green arrow); D: Necropsy image showing the ablated
area in the right side (purple arrow). E: Needle placement in the left side (Fluoroscopy image); F: Post-
ablation MRI (True FISP), showing the ablated area in the left side (red arrow); G: Necropsy image
showing the ablated area in the left side (yellow arrow).
A
B C D
E F G
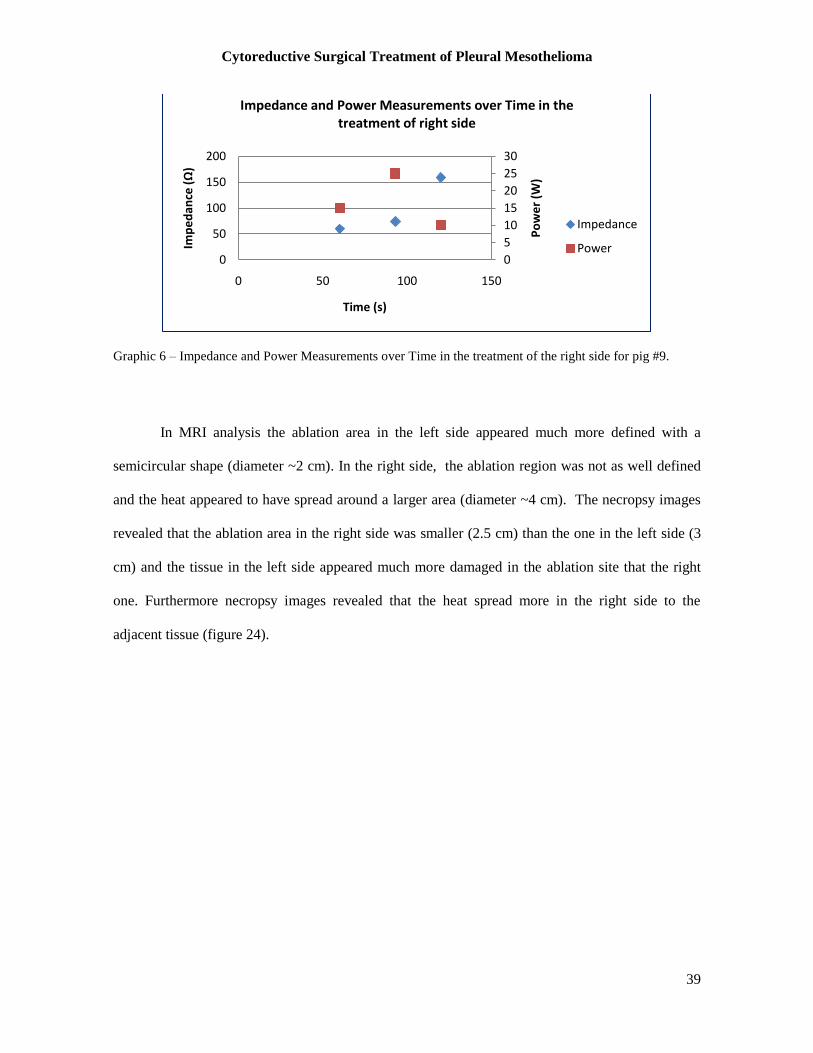
Cytoreductive Surgical Treatment of Pleural Mesothelioma
39
Graphic 6 – Impedance and Power Measurements over Time in the treatment of the right side for pig #9.
In MRI analysis the ablation area in the left side appeared much more defined with a
semicircular shape (diameter ~2 cm). In the right side, the ablation region was not as well defined
and the heat appeared to have spread around a larger area (diameter ~4 cm). The necropsy images
revealed that the ablation area in the right side was smaller (2.5 cm) than the one in the left side (3
cm) and the tissue in the left side appeared much more damaged in the ablation site that the right
one. Furthermore necropsy images revealed that the heat spread more in the right side to the
adjacent tissue (figure 24).
0
5
10
15
20
25
30
0
50
100
150
200
0 50 100 150
Po
we
r (W
)
Imp
ed
ance
(Ω
)
Time (s)
Impedance and Power Measurements over Time in the treatment of right side
Impedance
Power
B C D
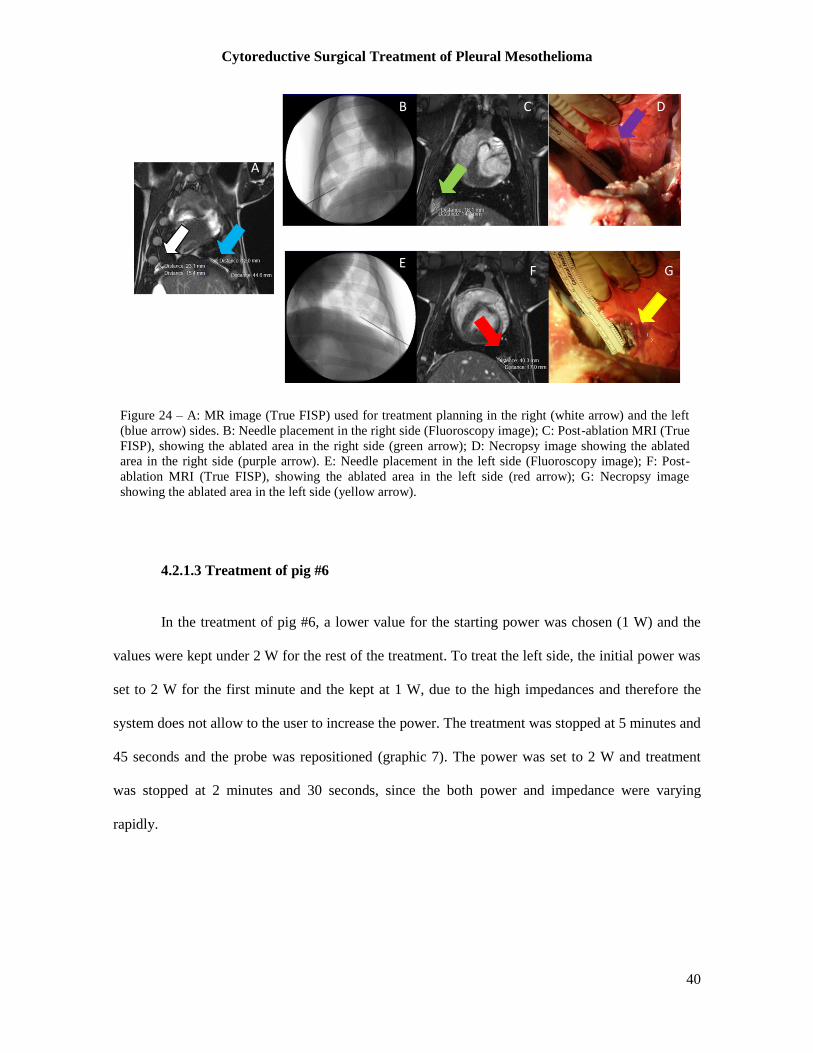
Cytoreductive Surgical Treatment of Pleural Mesothelioma
40
4.2.1.3 Treatment of pig #6
In the treatment of pig #6, a lower value for the starting power was chosen (1 W) and the
values were kept under 2 W for the rest of the treatment. To treat the left side, the initial power was
set to 2 W for the first minute and the kept at 1 W, due to the high impedances and therefore the
system does not allow to the user to increase the power. The treatment was stopped at 5 minutes and
45 seconds and the probe was repositioned (graphic 7). The power was set to 2 W and treatment
was stopped at 2 minutes and 30 seconds, since the both power and impedance were varying
rapidly.
A
E F G
Figure 24 – A: MR image (True FISP) used for treatment planning in the right (white arrow) and the left
(blue arrow) sides. B: Needle placement in the right side (Fluoroscopy image); C: Post-ablation MRI (True
FISP), showing the ablated area in the right side (green arrow); D: Necropsy image showing the ablated
area in the right side (purple arrow). E: Needle placement in the left side (Fluoroscopy image); F: Post-
ablation MRI (True FISP), showing the ablated area in the left side (red arrow); G: Necropsy image
showing the ablated area in the left side (yellow arrow).
B C D
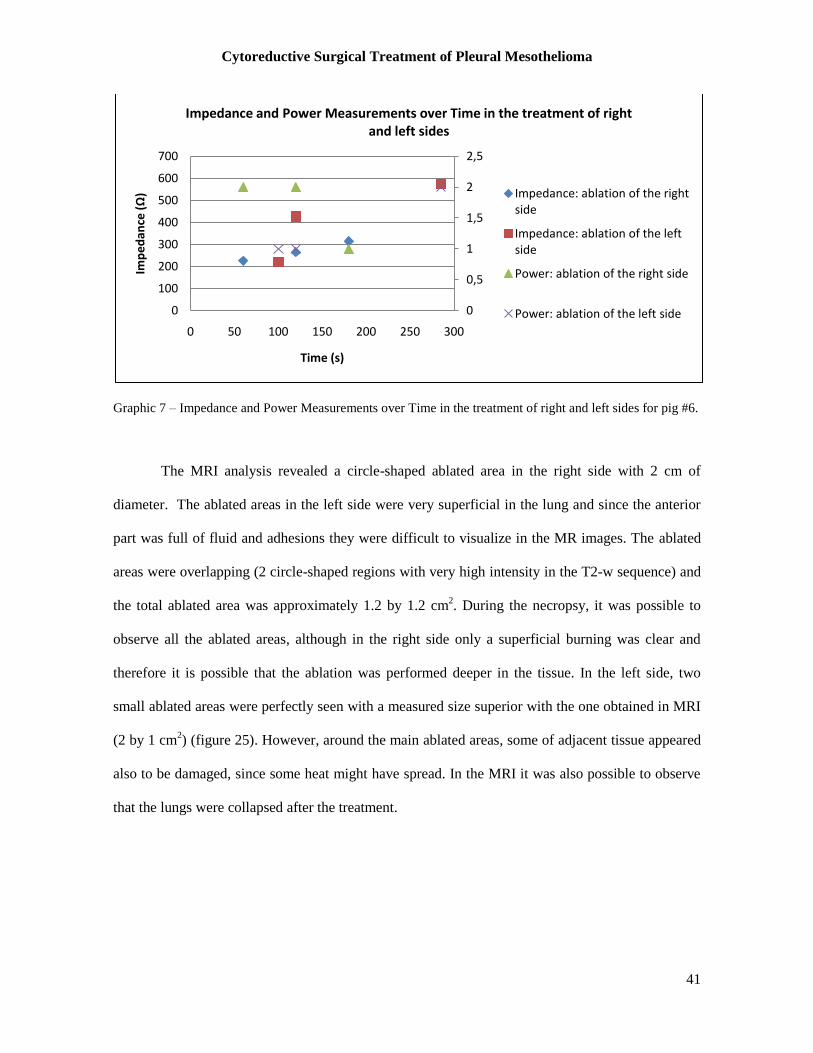
Cytoreductive Surgical Treatment of Pleural Mesothelioma
41
Graphic 7 – Impedance and Power Measurements over Time in the treatment of right and left sides for pig #6.
The MRI analysis revealed a circle-shaped ablated area in the right side with 2 cm of
diameter. The ablated areas in the left side were very superficial in the lung and since the anterior
part was full of fluid and adhesions they were difficult to visualize in the MR images. The ablated
areas were overlapping (2 circle-shaped regions with very high intensity in the T2-w sequence) and
the total ablated area was approximately 1.2 by 1.2 cm2. During the necropsy, it was possible to
observe all the ablated areas, although in the right side only a superficial burning was clear and
therefore it is possible that the ablation was performed deeper in the tissue. In the left side, two
small ablated areas were perfectly seen with a measured size superior with the one obtained in MRI
(2 by 1 cm2) (figure 25). However, around the main ablated areas, some of adjacent tissue appeared
also to be damaged, since some heat might have spread. In the MRI it was also possible to observe
that the lungs were collapsed after the treatment.
0
0,5
1
1,5
2
2,5
0
100
200
300
400
500
600
700
0 50 100 150 200 250 300
Imp
ed
ance
(Ω
)
Time (s)
Impedance and Power Measurements over Time in the treatment of right and left sides
Impedance: ablation of the right side
Impedance: ablation of the left side
Power: ablation of the right side
Power: ablation of the left side
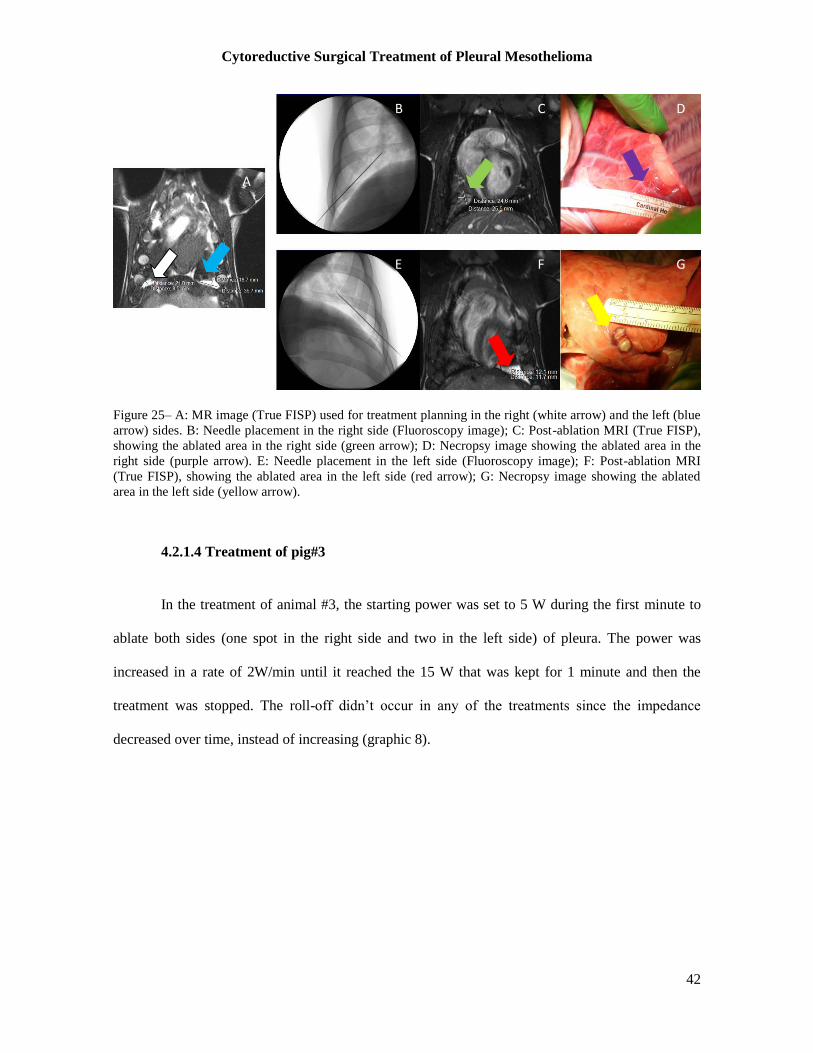
Cytoreductive Surgical Treatment of Pleural Mesothelioma
42
Figure 25– A: MR image (True FISP) used for treatment planning in the right (white arrow) and the left (blue
arrow) sides. B: Needle placement in the right side (Fluoroscopy image); C: Post-ablation MRI (True FISP),
showing the ablated area in the right side (green arrow); D: Necropsy image showing the ablated area in the
right side (purple arrow). E: Needle placement in the left side (Fluoroscopy image); F: Post-ablation MRI
(True FISP), showing the ablated area in the left side (red arrow); G: Necropsy image showing the ablated
area in the left side (yellow arrow).
4.2.1.4 Treatment of pig#3
In the treatment of animal #3, the starting power was set to 5 W during the first minute to
ablate both sides (one spot in the right side and two in the left side) of pleura. The power was
increased in a rate of 2W/min until it reached the 15 W that was kept for 1 minute and then the
treatment was stopped. The roll-off didn’t occur in any of the treatments since the impedance
decreased over time, instead of increasing (graphic 8).
A
B C D
E F G
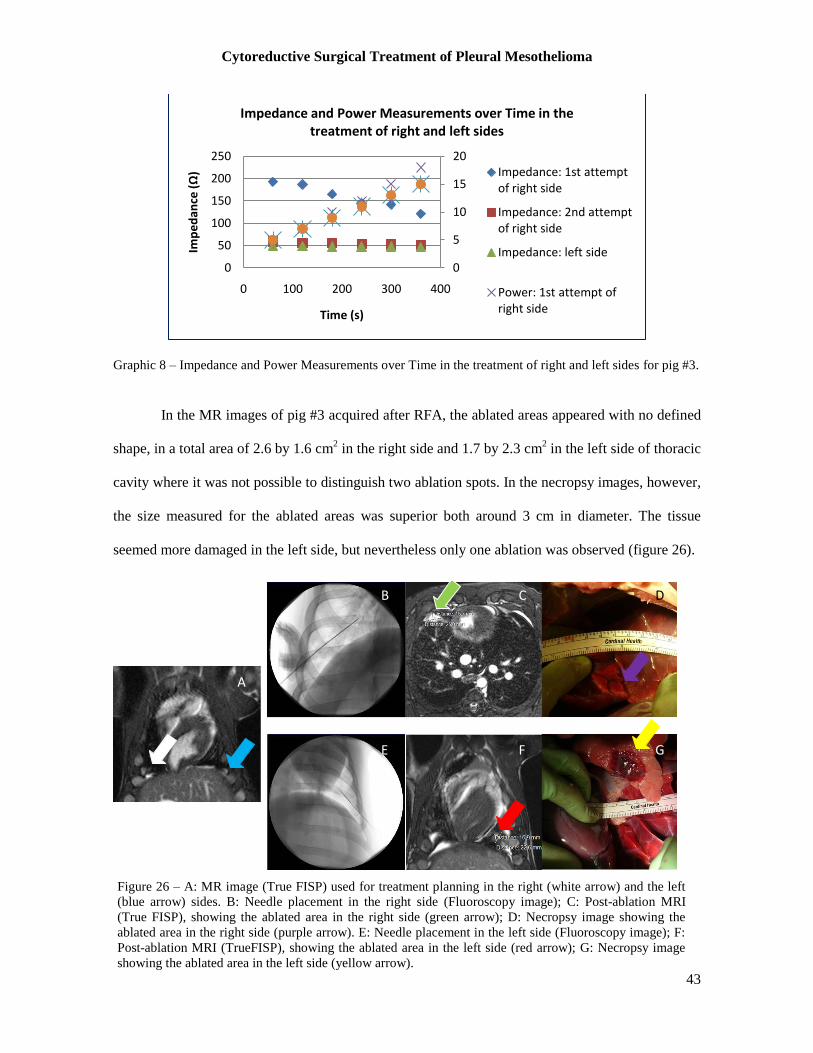
Cytoreductive Surgical Treatment of Pleural Mesothelioma
43
Graphic 8 – Impedance and Power Measurements over Time in the treatment of right and left sides for pig #3.
In the MR images of pig #3 acquired after RFA, the ablated areas appeared with no defined
shape, in a total area of 2.6 by 1.6 cm2 in the right side and 1.7 by 2.3 cm
2 in the left side of thoracic
cavity where it was not possible to distinguish two ablation spots. In the necropsy images, however,
the size measured for the ablated areas was superior both around 3 cm in diameter. The tissue
seemed more damaged in the left side, but nevertheless only one ablation was observed (figure 26).
0
5
10
15
20
0
50
100
150
200
250
0 100 200 300 400
Imp
ed
ance
(Ω
)
Time (s)
Impedance and Power Measurements over Time in the treatment of right and left sides
Impedance: 1st attempt of right side
Impedance: 2nd attempt of right side
Impedance: left side
Power: 1st attempt of right side
Figure 26 – A: MR image (True FISP) used for treatment planning in the right (white arrow) and the left
(blue arrow) sides. B: Needle placement in the right side (Fluoroscopy image); C: Post-ablation MRI
(True FISP), showing the ablated area in the right side (green arrow); D: Necropsy image showing the
ablated area in the right side (purple arrow). E: Needle placement in the left side (Fluoroscopy image); F:
Post-ablation MRI (TrueFISP), showing the ablated area in the left side (red arrow); G: Necropsy image
showing the ablated area in the left side (yellow arrow).
A
B C D
E F G
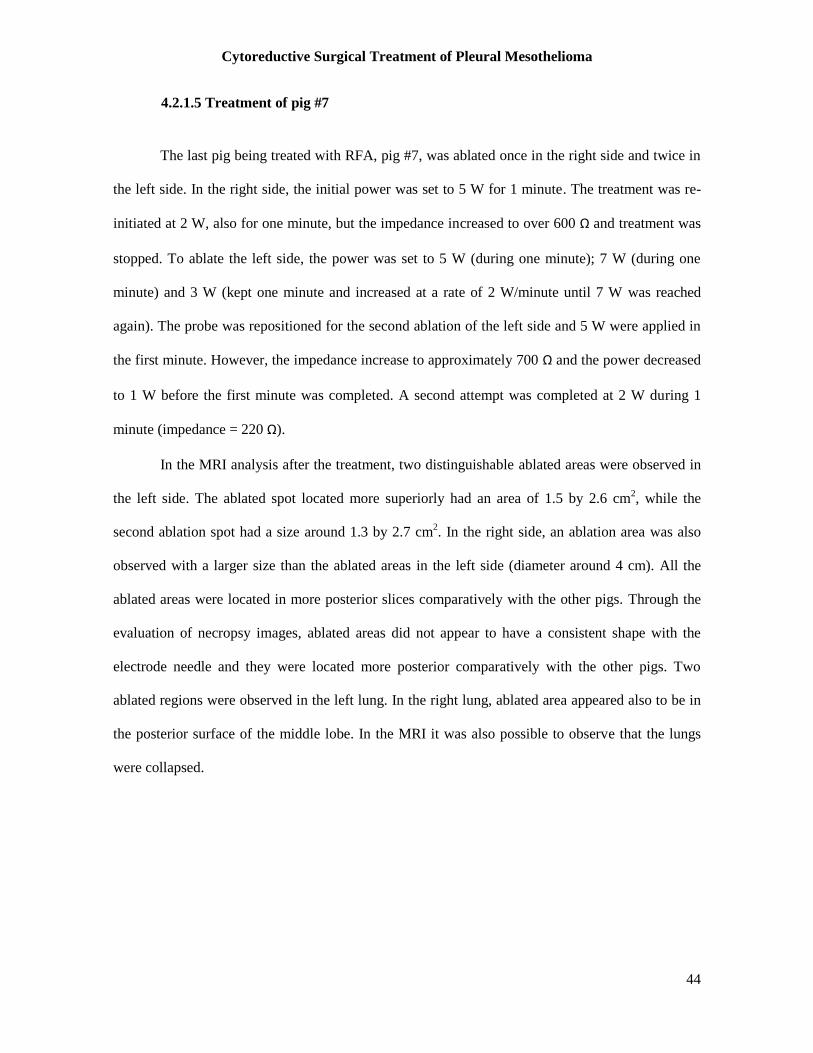
Cytoreductive Surgical Treatment of Pleural Mesothelioma
44
4.2.1.5 Treatment of pig #7
The last pig being treated with RFA, pig #7, was ablated once in the right side and twice in
the left side. In the right side, the initial power was set to 5 W for 1 minute. The treatment was re-
initiated at 2 W, also for one minute, but the impedance increased to over 600 Ω and treatment was
stopped. To ablate the left side, the power was set to 5 W (during one minute); 7 W (during one
minute) and 3 W (kept one minute and increased at a rate of 2 W/minute until 7 W was reached
again). The probe was repositioned for the second ablation of the left side and 5 W were applied in
the first minute. However, the impedance increase to approximately 700 Ω and the power decreased
to 1 W before the first minute was completed. A second attempt was completed at 2 W during 1
minute (impedance = 220 Ω).
In the MRI analysis after the treatment, two distinguishable ablated areas were observed in
the left side. The ablated spot located more superiorly had an area of 1.5 by 2.6 cm2, while the
second ablation spot had a size around 1.3 by 2.7 cm2. In the right side, an ablation area was also
observed with a larger size than the ablated areas in the left side (diameter around 4 cm). All the
ablated areas were located in more posterior slices comparatively with the other pigs. Through the
evaluation of necropsy images, ablated areas did not appear to have a consistent shape with the
electrode needle and they were located more posterior comparatively with the other pigs. Two
ablated regions were observed in the left lung. In the right lung, ablated area appeared also to be in
the posterior surface of the middle lobe. In the MRI it was also possible to observe that the lungs
were collapsed.
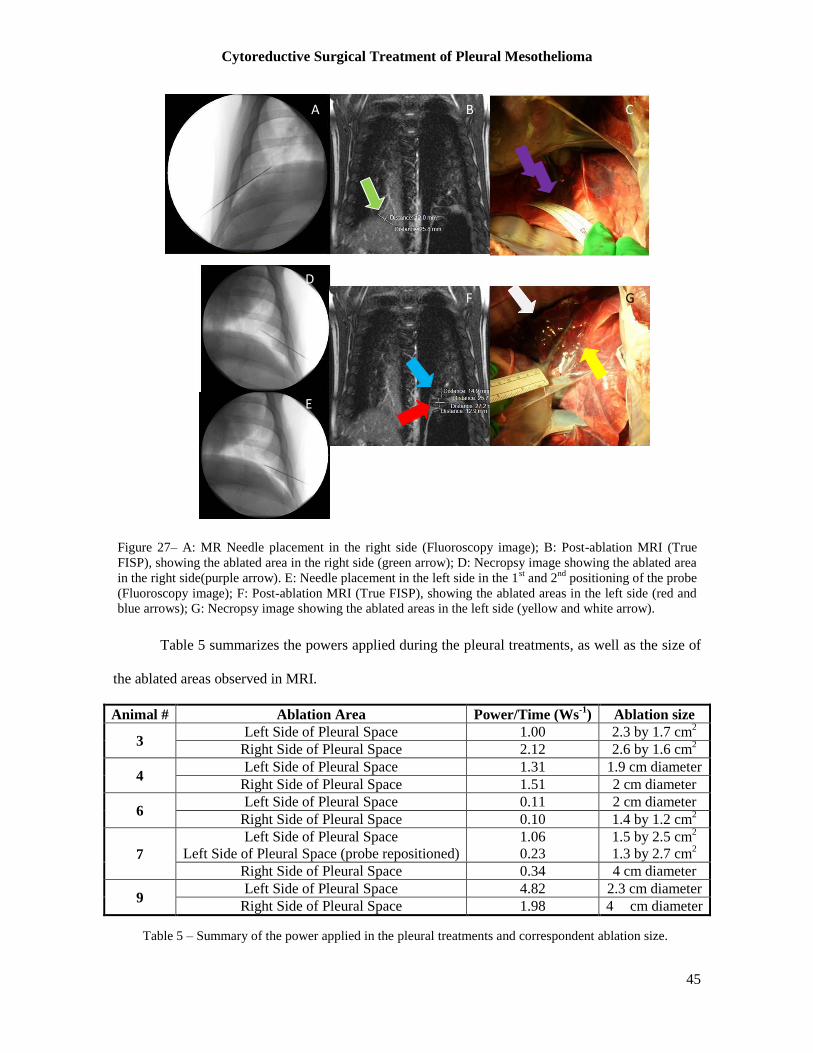
Cytoreductive Surgical Treatment of Pleural Mesothelioma
45
Table 5 summarizes the powers applied during the pleural treatments, as well as the size of
the ablated areas observed in MRI.
Animal # Ablation Area Power/Time (Ws-1
) Ablation size
3 Left Side of Pleural Space 1.00 2.3 by 1.7 cm
2
Right Side of Pleural Space 2.12 2.6 by 1.6 cm2
4 Left Side of Pleural Space 1.31 1.9 cm diameter
Right Side of Pleural Space 1.51 2 cm diameter
6 Left Side of Pleural Space 0.11 2 cm diameter
Right Side of Pleural Space 0.10 1.4 by 1.2 cm2
7
Left Side of Pleural Space
Left Side of Pleural Space (probe repositioned)
1.06
0.23
1.5 by 2.5 cm2
1.3 by 2.7 cm2
Right Side of Pleural Space 0.34 4 cm diameter
9 Left Side of Pleural Space 4.82 2.3 cm diameter
Right Side of Pleural Space 1.98 4 cm diameter
Figure 27– A: MR Needle placement in the right side (Fluoroscopy image); B: Post-ablation MRI (True
FISP), showing the ablated area in the right side (green arrow); D: Necropsy image showing the ablated area
in the right side(purple arrow). E: Needle placement in the left side in the 1st and 2
nd positioning of the probe
(Fluoroscopy image); F: Post-ablation MRI (True FISP), showing the ablated areas in the left side (red and
blue arrows); G: Necropsy image showing the ablated areas in the left side (yellow and white arrow).
A B C
E
F
D
G
Table 5 – Summary of the power applied in the pleural treatments and correspondent ablation size.
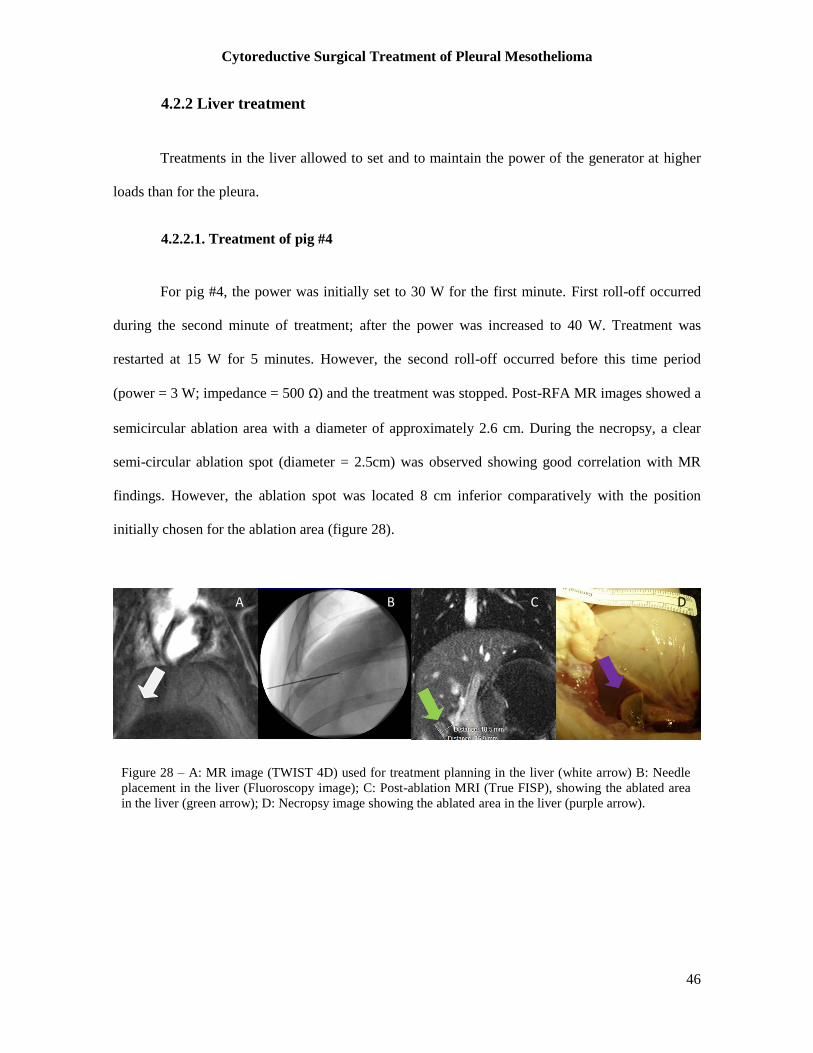
Cytoreductive Surgical Treatment of Pleural Mesothelioma
46
4.2.2 Liver treatment
Treatments in the liver allowed to set and to maintain the power of the generator at higher
loads than for the pleura.
4.2.2.1. Treatment of pig #4
For pig #4, the power was initially set to 30 W for the first minute. First roll-off occurred
during the second minute of treatment; after the power was increased to 40 W. Treatment was
restarted at 15 W for 5 minutes. However, the second roll-off occurred before this time period
(power = 3 W; impedance = 500 Ω) and the treatment was stopped. Post-RFA MR images showed a
semicircular ablation area with a diameter of approximately 2.6 cm. During the necropsy, a clear
semi-circular ablation spot (diameter = 2.5cm) was observed showing good correlation with MR
findings. However, the ablation spot was located 8 cm inferior comparatively with the position
initially chosen for the ablation area (figure 28).
Power/Time (Ws-1
) = 1.51
DP/A (mm) = 18.2
Power/Time (Ws-1
) = 1.51
DP/A (mm) = 18.2
A B C D
Figure 28 – A: MR image (TWIST 4D) used for treatment planning in the liver (white arrow) B: Needle
placement in the liver (Fluoroscopy image); C: Post-ablation MRI (True FISP), showing the ablated area
in the liver (green arrow); D: Necropsy image showing the ablated area in the liver (purple arrow).
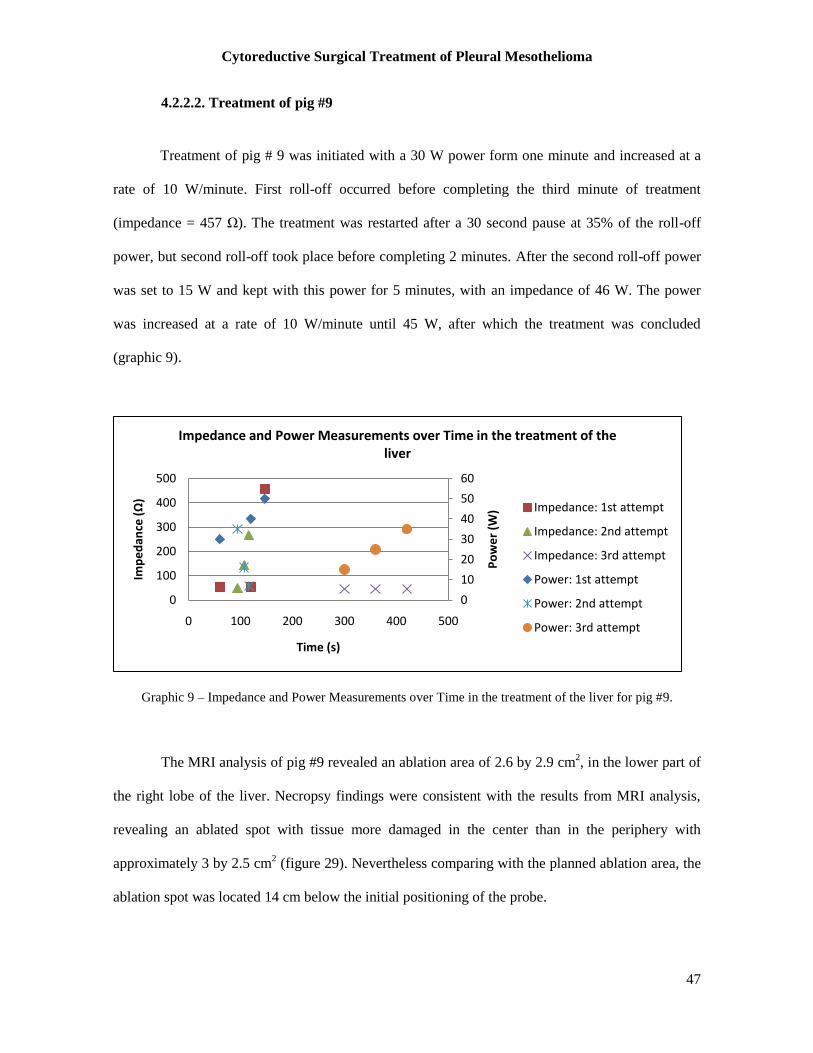
Cytoreductive Surgical Treatment of Pleural Mesothelioma
47
4.2.2.2. Treatment of pig #9
Treatment of pig # 9 was initiated with a 30 W power form one minute and increased at a
rate of 10 W/minute. First roll-off occurred before completing the third minute of treatment
(impedance = 457 Ω). The treatment was restarted after a 30 second pause at 35% of the roll-off
power, but second roll-off took place before completing 2 minutes. After the second roll-off power
was set to 15 W and kept with this power for 5 minutes, with an impedance of 46 W. The power
was increased at a rate of 10 W/minute until 45 W, after which the treatment was concluded
(graphic 9).
Graphic 9 – Impedance and Power Measurements over Time in the treatment of the liver for pig #9.
The MRI analysis of pig #9 revealed an ablation area of 2.6 by 2.9 cm2, in the lower part of
the right lobe of the liver. Necropsy findings were consistent with the results from MRI analysis,
revealing an ablated spot with tissue more damaged in the center than in the periphery with
approximately 3 by 2.5 cm2 (figure 29). Nevertheless comparing with the planned ablation area, the
ablation spot was located 14 cm below the initial positioning of the probe.
0
10
20
30
40
50
60
0
100
200
300
400
500
0 100 200 300 400 500
Po
we
r (W
)
Imp
ed
ance
(Ω
)
Time (s)
Impedance and Power Measurements over Time in the treatment of the liver
Impedance: 1st attempt
Impedance: 2nd attempt
Impedance: 3rd attempt
Power: 1st attempt
Power: 2nd attempt
Power: 3rd attempt
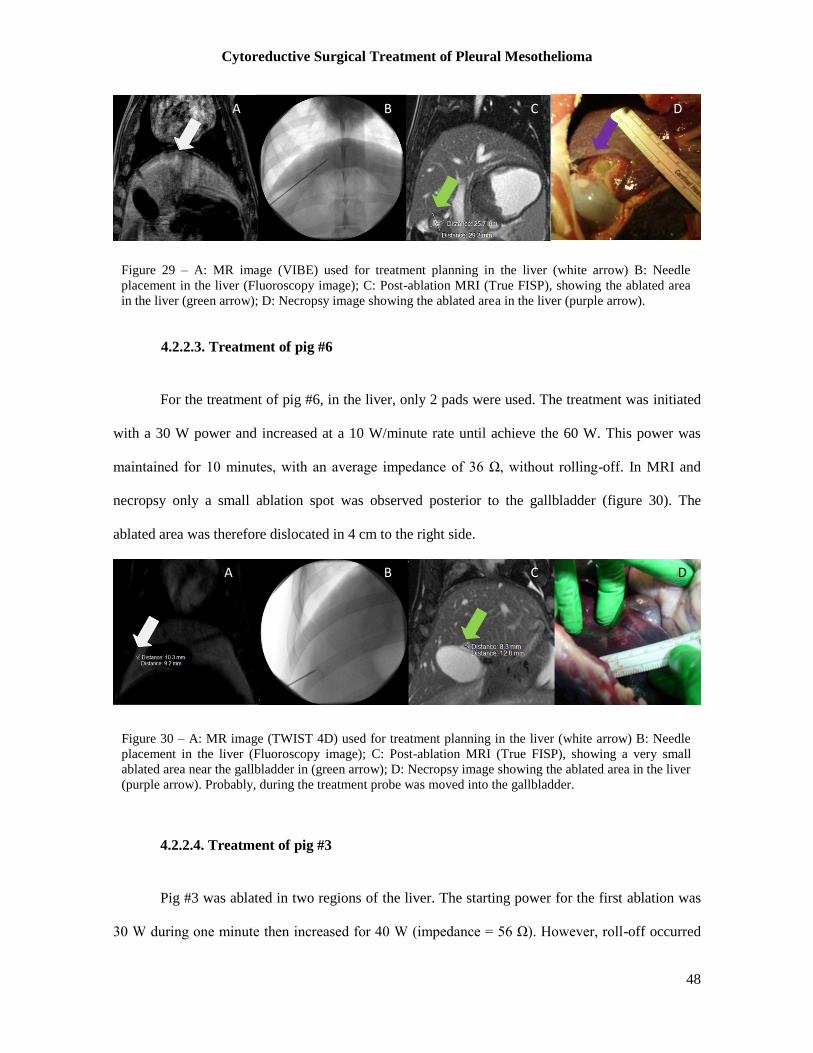
Cytoreductive Surgical Treatment of Pleural Mesothelioma
48
4.2.2.3. Treatment of pig #6
For the treatment of pig #6, in the liver, only 2 pads were used. The treatment was initiated
with a 30 W power and increased at a 10 W/minute rate until achieve the 60 W. This power was
maintained for 10 minutes, with an average impedance of 36 Ω, without rolling-off. In MRI and
necropsy only a small ablation spot was observed posterior to the gallbladder (figure 30). The
ablated area was therefore dislocated in 4 cm to the right side.
4.2.2.4. Treatment of pig #3
4.2.2.4. Treatment of pig #3
Pig #3 was ablated in two regions of the liver. The starting power for the first ablation was
30 W during one minute then increased for 40 W (impedance = 56 Ω). However, roll-off occurred
Figure 29 – A: MR image (VIBE) used for treatment planning in the liver (white arrow) B: Needle
placement in the liver (Fluoroscopy image); C: Post-ablation MRI (True FISP), showing the ablated area
in the liver (green arrow); D: Necropsy image showing the ablated area in the liver (purple arrow).
Figure 30 – A: MR image (TWIST 4D) used for treatment planning in the liver (white arrow) B: Needle
placement in the liver (Fluoroscopy image); C: Post-ablation MRI (True FISP), showing a very small
ablated area near the gallbladder in (green arrow); D: Necropsy image showing the ablated area in the liver
(purple arrow). Probably, during the treatment probe was moved into the gallbladder.
A B C D
A B C D
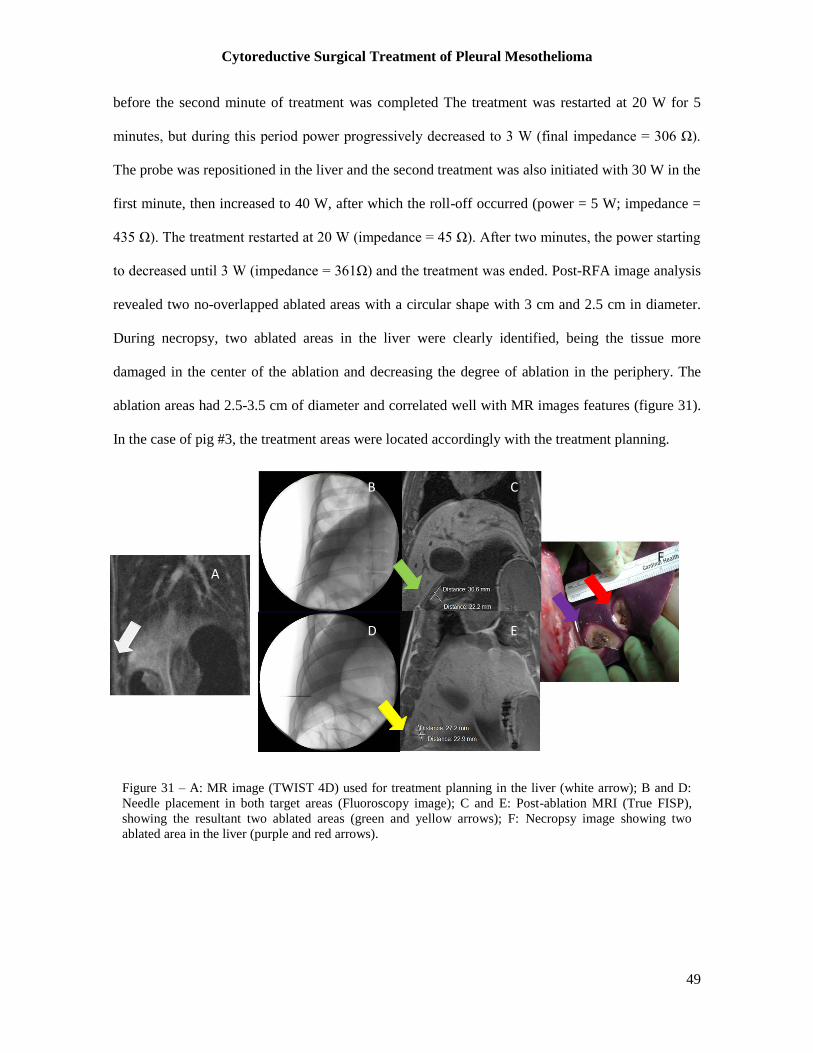
Cytoreductive Surgical Treatment of Pleural Mesothelioma
49
before the second minute of treatment was completed The treatment was restarted at 20 W for 5
minutes, but during this period power progressively decreased to 3 W (final impedance = 306 Ω).
The probe was repositioned in the liver and the second treatment was also initiated with 30 W in the
first minute, then increased to 40 W, after which the roll-off occurred (power = 5 W; impedance =
435 Ω). The treatment restarted at 20 W (impedance = 45 Ω). After two minutes, the power starting
to decreased until 3 W (impedance = 361Ω) and the treatment was ended. Post-RFA image analysis
revealed two no-overlapped ablated areas with a circular shape with 3 cm and 2.5 cm in diameter.
During necropsy, two ablated areas in the liver were clearly identified, being the tissue more
damaged in the center of the ablation and decreasing the degree of ablation in the periphery. The
ablation areas had 2.5-3.5 cm of diameter and correlated well with MR images features (figure 31).
In the case of pig #3, the treatment areas were located accordingly with the treatment planning.
Figure 31 – A: MR image (TWIST 4D) used for treatment planning in the liver (white arrow); B and D:
Needle placement in both target areas (Fluoroscopy image); C and E: Post-ablation MRI (True FISP),
showing the resultant two ablated areas (green and yellow arrows); F: Necropsy image showing two
ablated area in the liver (purple and red arrows).
A
B C
D E
F
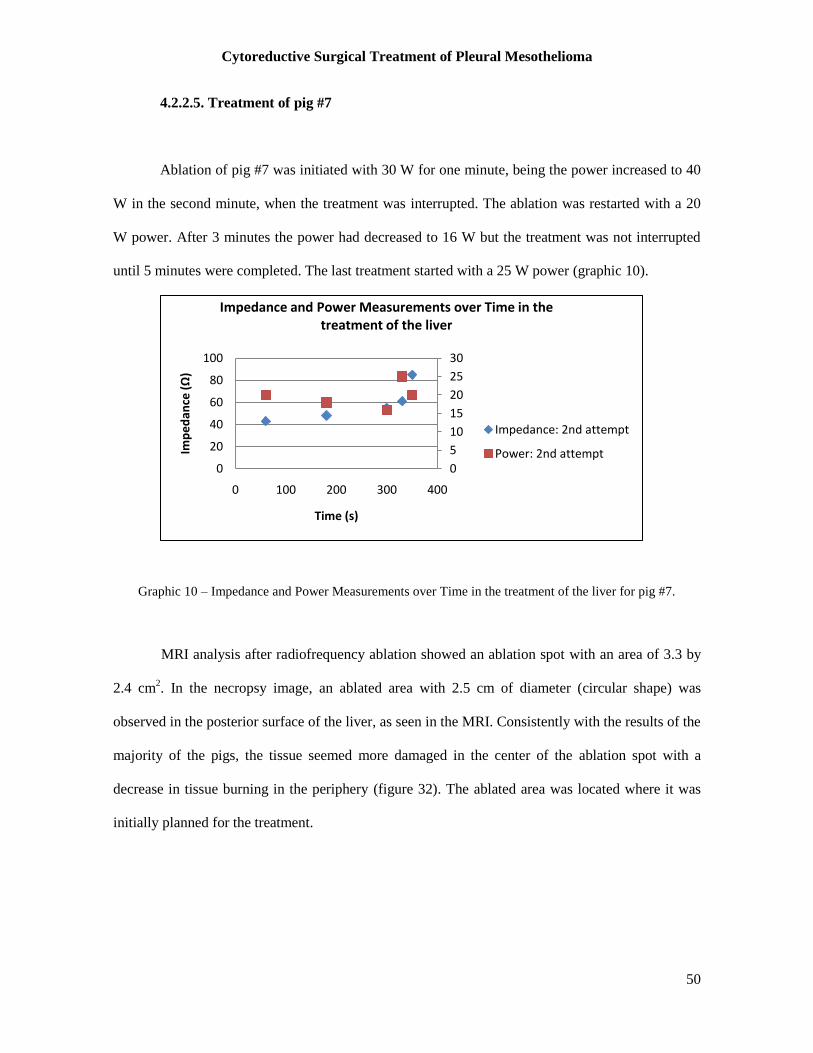
Cytoreductive Surgical Treatment of Pleural Mesothelioma
50
4.2.2.5. Treatment of pig #7
Ablation of pig #7 was initiated with 30 W for one minute, being the power increased to 40
W in the second minute, when the treatment was interrupted. The ablation was restarted with a 20
W power. After 3 minutes the power had decreased to 16 W but the treatment was not interrupted
until 5 minutes were completed. The last treatment started with a 25 W power (graphic 10).
Graphic 10 – Impedance and Power Measurements over Time in the treatment of the liver for pig #7.
MRI analysis after radiofrequency ablation showed an ablation spot with an area of 3.3 by
2.4 cm2. In the necropsy image, an ablated area with 2.5 cm of diameter (circular shape) was
observed in the posterior surface of the liver, as seen in the MRI. Consistently with the results of the
majority of the pigs, the tissue seemed more damaged in the center of the ablation spot with a
decrease in tissue burning in the periphery (figure 32). The ablated area was located where it was
initially planned for the treatment.
0
5
10
15
20
25
30
0
20
40
60
80
100
0 100 200 300 400
Imp
ed
ance
(Ω
)
Time (s)
Impedance and Power Measurements over Time in the treatment of the liver
Impedance: 2nd attempt
Power: 2nd attempt
B C D

Cytoreductive Surgical Treatment of Pleural Mesothelioma
51
Table 6 summarizes the powers applied during the liver treatments, as well as the size of
ablated areas observed in MRI.
Animal # Ablation Area Power/Time (Ws-1
) Ablation size
3 Liver (right upper lobe)
Liver (right bottom lobe)
5.45
1.78
3 cm in diameter
2.5 cm diameter
4 Liver (right lobe) 1.17 2.6 cm diameter
6 Liver (right lobe) 2.033 1 cm diameter
7 Liver (right lobe) 4.28 3.3 by 2.4 cm2
9 Liver (right lobe) 6.45 2.6 by 2.9 cm2
Figure 32 – A: MR image (VIBE, transversal) used for treatment planning in the liver (white arrow) B:
Needle placement in the liver (Fluoroscopy image); C: Post-ablation MRI (True FISP), showing a very
large ablated area in the liver (green arrow); D: Necropsy image showing a large ablated area in the liver
(purple arrow).
Table 6 – Summary of the power applied in the liver treatments and correspondent ablation size.
A B C D
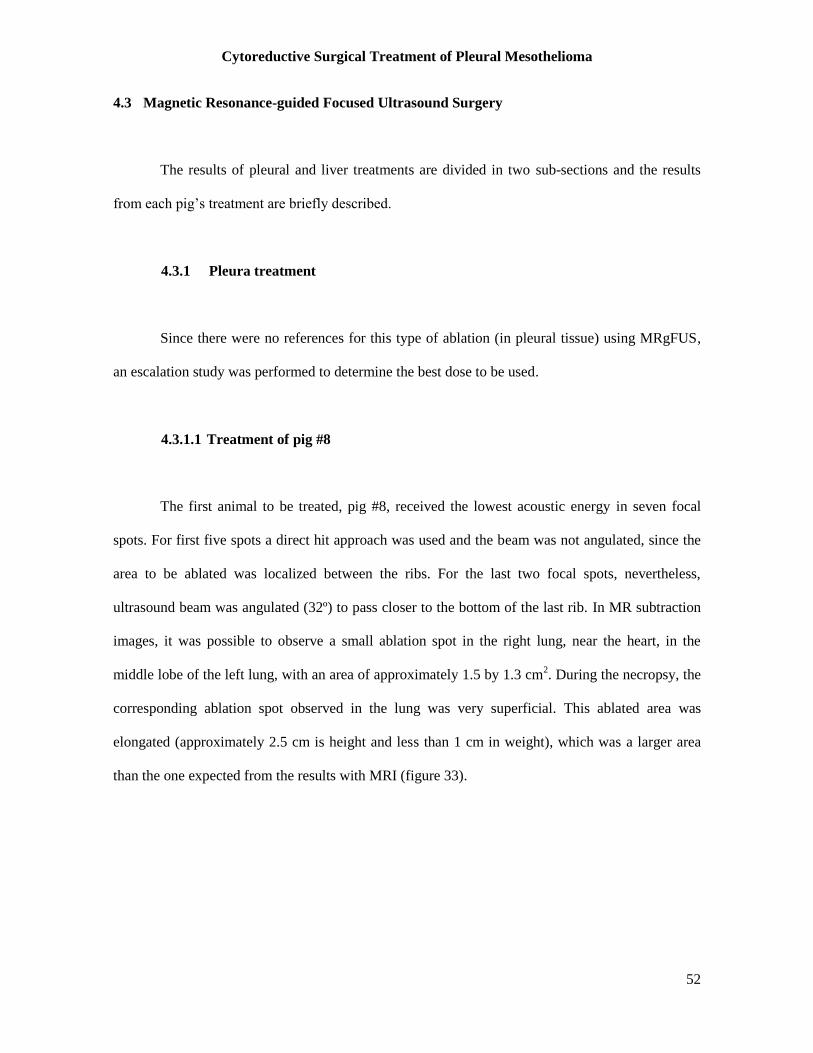
Cytoreductive Surgical Treatment of Pleural Mesothelioma
52
4.3 Magnetic Resonance-guided Focused Ultrasound Surgery
The results of pleural and liver treatments are divided in two sub-sections and the results
from each pig’s treatment are briefly described.
4.3.1 Pleura treatment
Since there were no references for this type of ablation (in pleural tissue) using MRgFUS,
an escalation study was performed to determine the best dose to be used.
4.3.1.1 Treatment of pig #8
The first animal to be treated, pig #8, received the lowest acoustic energy in seven focal
spots. For first five spots a direct hit approach was used and the beam was not angulated, since the
area to be ablated was localized between the ribs. For the last two focal spots, nevertheless,
ultrasound beam was angulated (32º) to pass closer to the bottom of the last rib. In MR subtraction
images, it was possible to observe a small ablation spot in the right lung, near the heart, in the
middle lobe of the left lung, with an area of approximately 1.5 by 1.3 cm2. During the necropsy, the
corresponding ablation spot observed in the lung was very superficial. This ablated area was
elongated (approximately 2.5 cm is height and less than 1 cm in weight), which was a larger area
than the one expected from the results with MRI (figure 33).
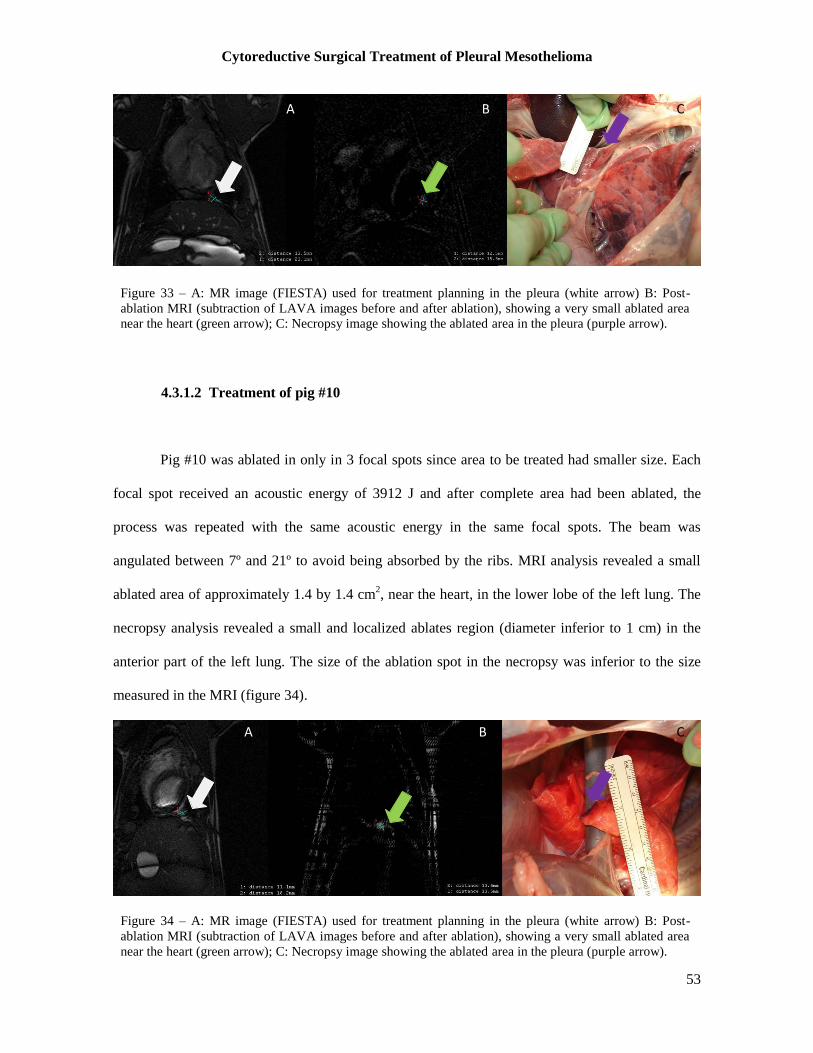
Cytoreductive Surgical Treatment of Pleural Mesothelioma
53
4.3.1.2 Treatment of pig #10
Pig #10 was ablated in only in 3 focal spots since area to be treated had smaller size. Each
focal spot received an acoustic energy of 3912 J and after complete area had been ablated, the
process was repeated with the same acoustic energy in the same focal spots. The beam was
angulated between 7º and 21º to avoid being absorbed by the ribs. MRI analysis revealed a small
ablated area of approximately 1.4 by 1.4 cm2, near the heart, in the lower lobe of the left lung. The
necropsy analysis revealed a small and localized ablates region (diameter inferior to 1 cm) in the
anterior part of the left lung. The size of the ablation spot in the necropsy was inferior to the size
measured in the MRI (figure 34).
Figure 33 – A: MR image (FIESTA) used for treatment planning in the pleura (white arrow) B: Post-
ablation MRI (subtraction of LAVA images before and after ablation), showing a very small ablated area
near the heart (green arrow); C: Necropsy image showing the ablated area in the pleura (purple arrow).
A B C
Figure 34 – A: MR image (FIESTA) used for treatment planning in the pleura (white arrow) B: Post-
ablation MRI (subtraction of LAVA images before and after ablation), showing a very small ablated area
near the heart (green arrow); C: Necropsy image showing the ablated area in the pleura (purple arrow).
A B C

Cytoreductive Surgical Treatment of Pleural Mesothelioma
54
4.3.1.3 Treatment of pig #12
For the treatment of pig #12, time was increased in 42% then rising the acoustic energy in
the 5 focal spots chosen for the ablation. Ultrasound beam was angulated 32º. Through the analysis
of the MR images after the procedure, an ablation spot of 2.4 by 1.6 cm2
was measured in the lower
lobe of the right lung, near the last rib. In the necropsy images an elongated ablation area was
observed with an area of approximately 3 by 1.5 cm2 in the lower lobe of the right lung. Although
the position was consistent with MRI findings, the size of the ablation spot was superior to that
measured in the MR images (figure 35).
4.3.1.4 Treatment of pig #13
Pig #13 received the largest amount of acoustic energy. Every focal spot was also sonicated
twice, but unlike pig #10, the first sonication was immediately followed by the second one for each
spot, in order to avoid cooling before the second sonication. The ablation area was very close to the
diaphragm and therefore some problems with motion were expected. Furthermore, during the
ablation of 4th focal spot, some reflection from the ribs was experienced and power was decreased
to 300 W. The beam was kept angulated between 24º and 30º. In MRI, a 4.2 cm ablation region was
Figure 35 – A: MR image (Localizer) used for treatment planning in the pleura (white arrow) B: Post-
ablation MRI (subtraction of LAVA images before and after ablation), showing a very small ablated area
near the diaphragm (green arrow); C: Necropsy image showing the ablated area in the pleura (purple
arrow).
A B C
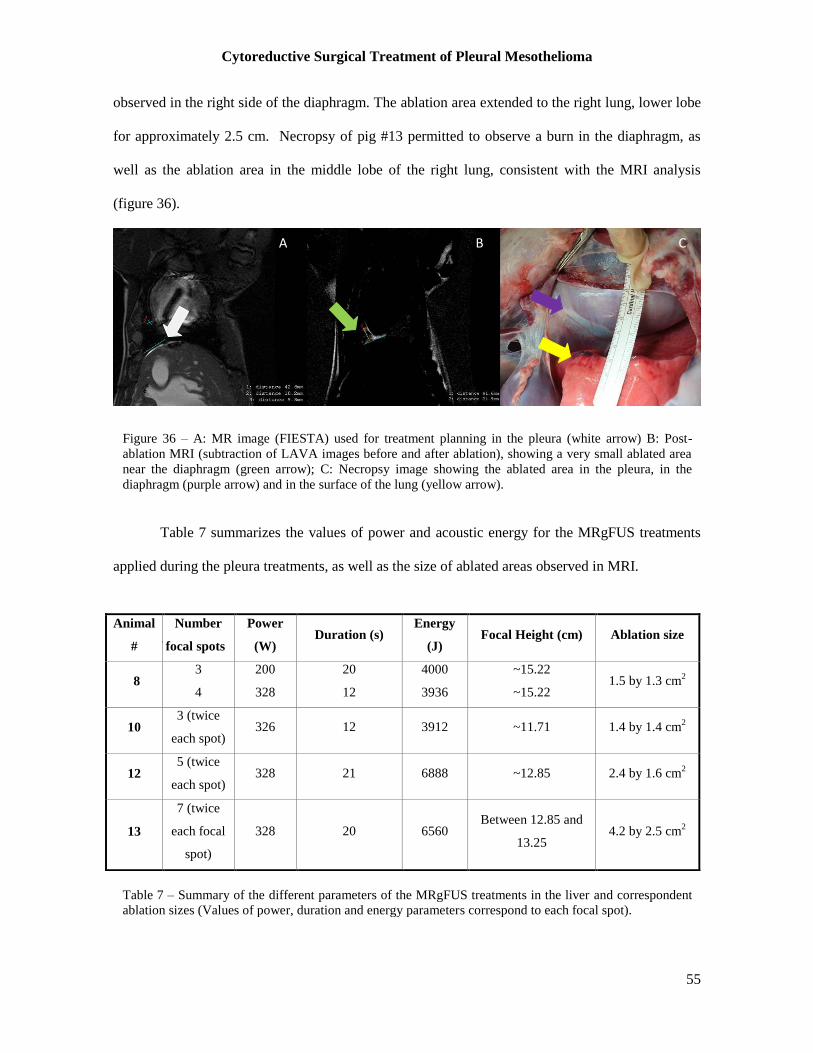
Cytoreductive Surgical Treatment of Pleural Mesothelioma
55
observed in the right side of the diaphragm. The ablation area extended to the right lung, lower lobe
for approximately 2.5 cm. Necropsy of pig #13 permitted to observe a burn in the diaphragm, as
well as the ablation area in the middle lobe of the right lung, consistent with the MRI analysis
(figure 36).
Table 7 summarizes the values of power and acoustic energy for the MRgFUS treatments
applied during the pleura treatments, as well as the size of ablated areas observed in MRI.
Animal
#
Number
of focal spots
Power
(W) Duration (s)
Energy
(J) Focal Height (cm) Ablation size
8 3
4
200
328
20
12
4000
3936
~15.22
~15.22 1.5 by 1.3 cm
2
10 3 (twice
each spot) 326 12 3912 ~11.71 1.4 by 1.4 cm
2
12 5 (twice
each spot) 328 21 6888 ~12.85 2.4 by 1.6 cm
2
13
7 (twice
each focal
spot)
328 20 6560 Between 12.85 and
13.25 4.2 by 2.5 cm
2
Figure 36 – A: MR image (FIESTA) used for treatment planning in the pleura (white arrow) B: Post-
ablation MRI (subtraction of LAVA images before and after ablation), showing a very small ablated area
near the diaphragm (green arrow); C: Necropsy image showing the ablated area in the pleura, in the
diaphragm (purple arrow) and in the surface of the lung (yellow arrow).
Table 7 – Summary of the different parameters of the MRgFUS treatments in the liver and correspondent
ablation sizes (Values of power, duration and energy parameters correspond to each focal spot).
A B C
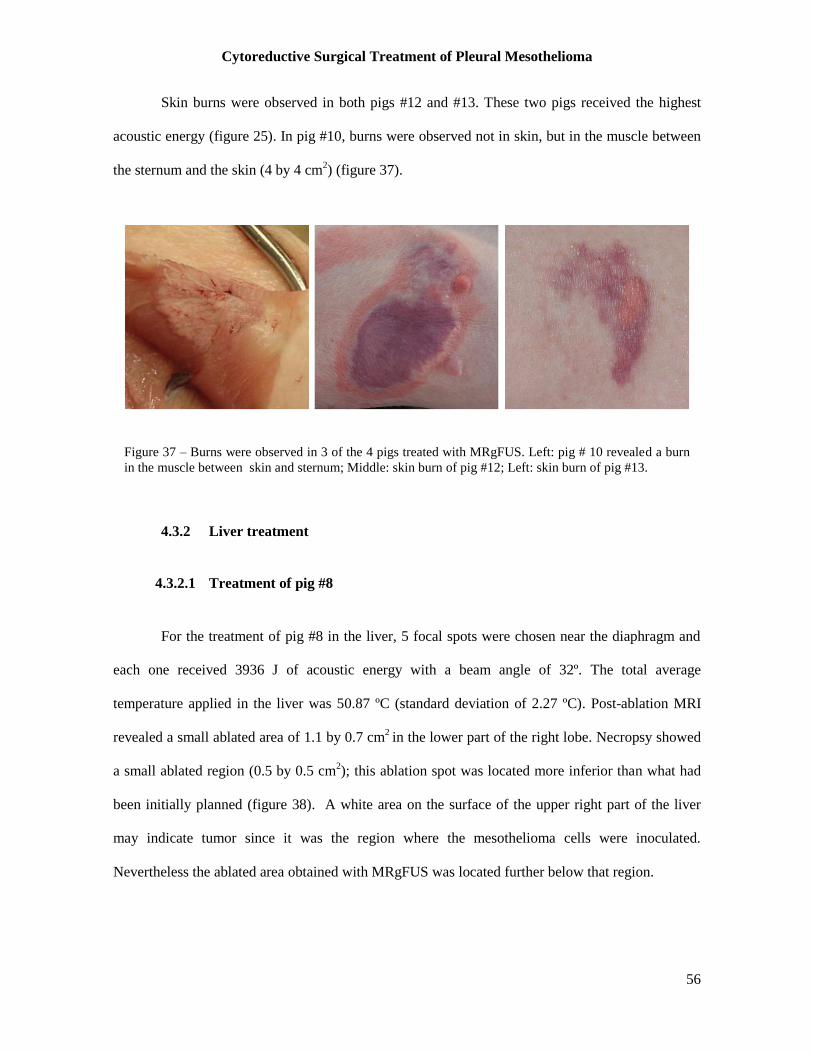
Cytoreductive Surgical Treatment of Pleural Mesothelioma
56
Skin burns were observed in both pigs #12 and #13. These two pigs received the highest
acoustic energy (figure 25). In pig #10, burns were observed not in skin, but in the muscle between
the sternum and the skin (4 by 4 cm2) (figure 37).
4.3.2 Liver treatment
4.3.2.1 Treatment of pig #8
For the treatment of pig #8 in the liver, 5 focal spots were chosen near the diaphragm and
each one received 3936 J of acoustic energy with a beam angle of 32º. The total average
temperature applied in the liver was 50.87 ºC (standard deviation of 2.27 ºC). Post-ablation MRI
revealed a small ablated area of 1.1 by 0.7 cm2
in the lower part of the right lobe. Necropsy showed
a small ablated region (0.5 by 0.5 cm2); this ablation spot was located more inferior than what had
been initially planned (figure 38). A white area on the surface of the upper right part of the liver
may indicate tumor since it was the region where the mesothelioma cells were inoculated.
Nevertheless the ablated area obtained with MRgFUS was located further below that region.
Figure 37 – Burns were observed in 3 of the 4 pigs treated with MRgFUS. Left: pig # 10 revealed a burn
in the muscle between skin and sternum; Middle: skin burn of pig #12; Left: skin burn of pig #13.
A B C
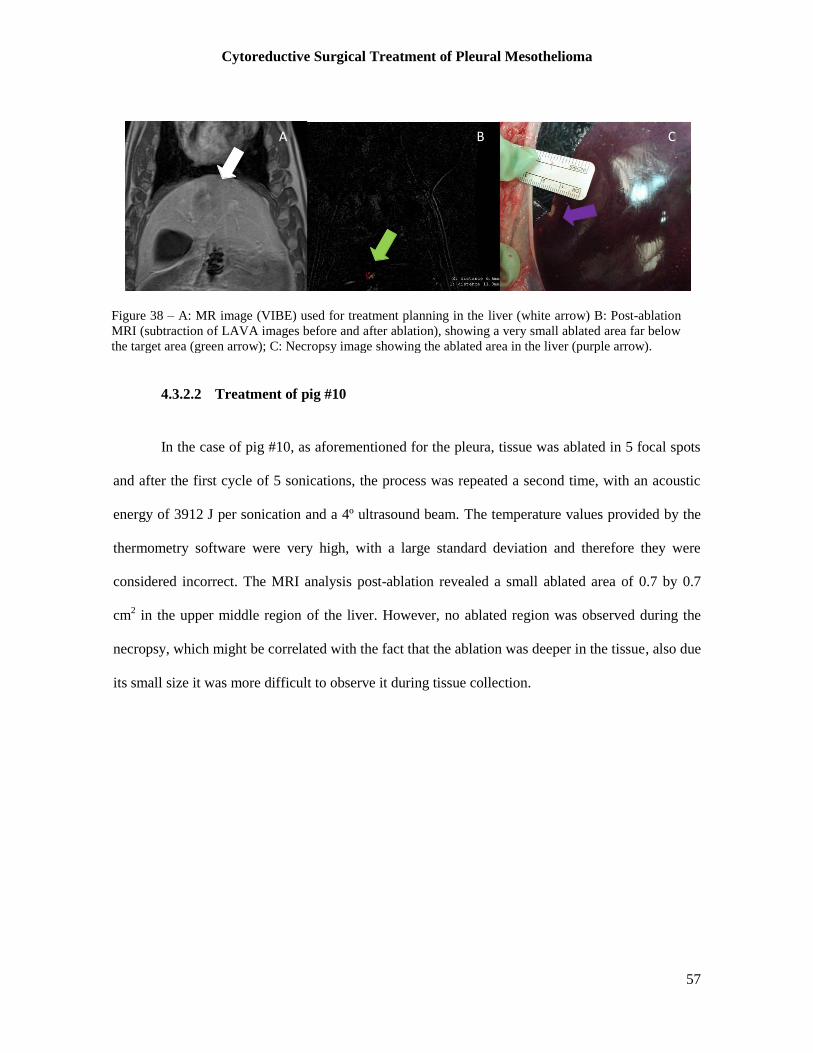
Cytoreductive Surgical Treatment of Pleural Mesothelioma
57
4.3.2.2 Treatment of pig #10
In the case of pig #10, as aforementioned for the pleura, tissue was ablated in 5 focal spots
and after the first cycle of 5 sonications, the process was repeated a second time, with an acoustic
energy of 3912 J per sonication and a 4º ultrasound beam. The temperature values provided by the
thermometry software were very high, with a large standard deviation and therefore they were
considered incorrect. The MRI analysis post-ablation revealed a small ablated area of 0.7 by 0.7
cm2 in the upper middle region of the liver. However, no ablated region was observed during the
necropsy, which might be correlated with the fact that the ablation was deeper in the tissue, also due
its small size it was more difficult to observe it during tissue collection.
Figure 38 – A: MR image (VIBE) used for treatment planning in the liver (white arrow) B: Post-ablation
MRI (subtraction of LAVA images before and after ablation), showing a very small ablated area far below
the target area (green arrow); C: Necropsy image showing the ablated area in the liver (purple arrow).
B A C
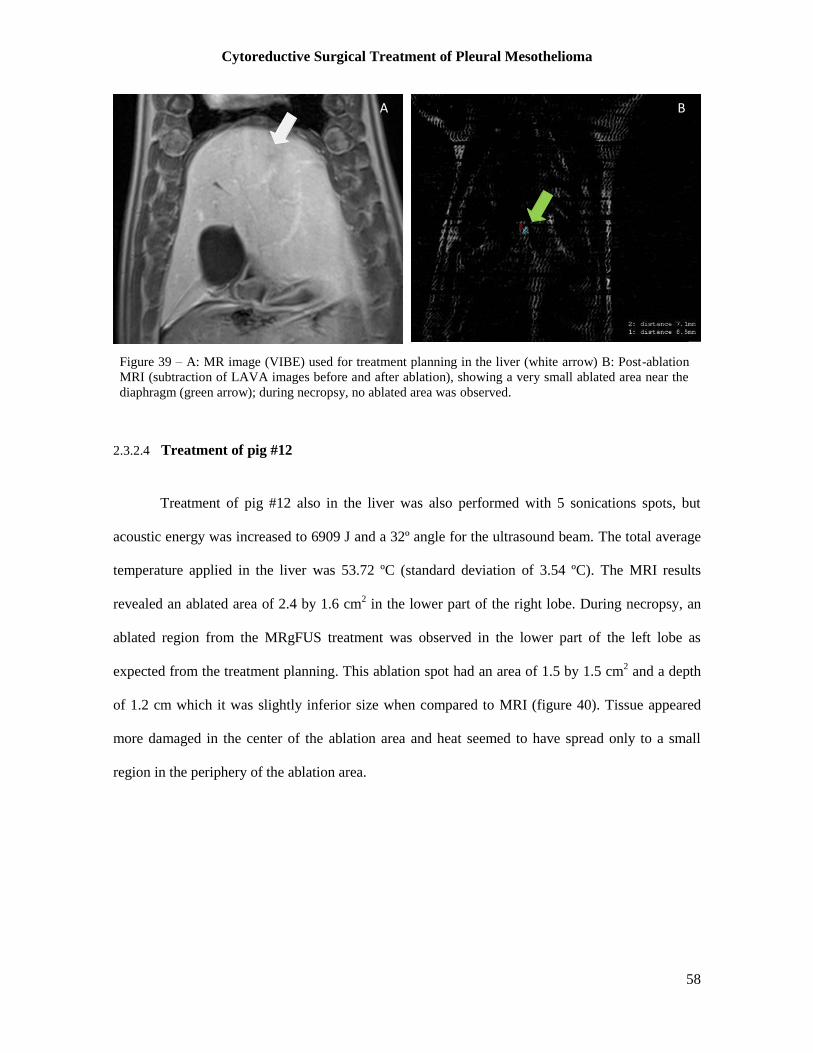
Cytoreductive Surgical Treatment of Pleural Mesothelioma
58
2.3.2.4 Treatment of pig #12
Treatment of pig #12 also in the liver was also performed with 5 sonications spots, but
acoustic energy was increased to 6909 J and a 32º angle for the ultrasound beam. The total average
temperature applied in the liver was 53.72 ºC (standard deviation of 3.54 ºC). The MRI results
revealed an ablated area of 2.4 by 1.6 cm2 in the lower part of the right lobe. During necropsy, an
ablated region from the MRgFUS treatment was observed in the lower part of the left lobe as
expected from the treatment planning. This ablation spot had an area of 1.5 by 1.5 cm2 and a depth
of 1.2 cm which it was slightly inferior size when compared to MRI (figure 40). Tissue appeared
more damaged in the center of the ablation area and heat seemed to have spread only to a small
region in the periphery of the ablation area.
Figure 39 – A: MR image (VIBE) used for treatment planning in the liver (white arrow) B: Post-ablation
MRI (subtraction of LAVA images before and after ablation), showing a very small ablated area near the
diaphragm (green arrow); during necropsy, no ablated area was observed.
A B
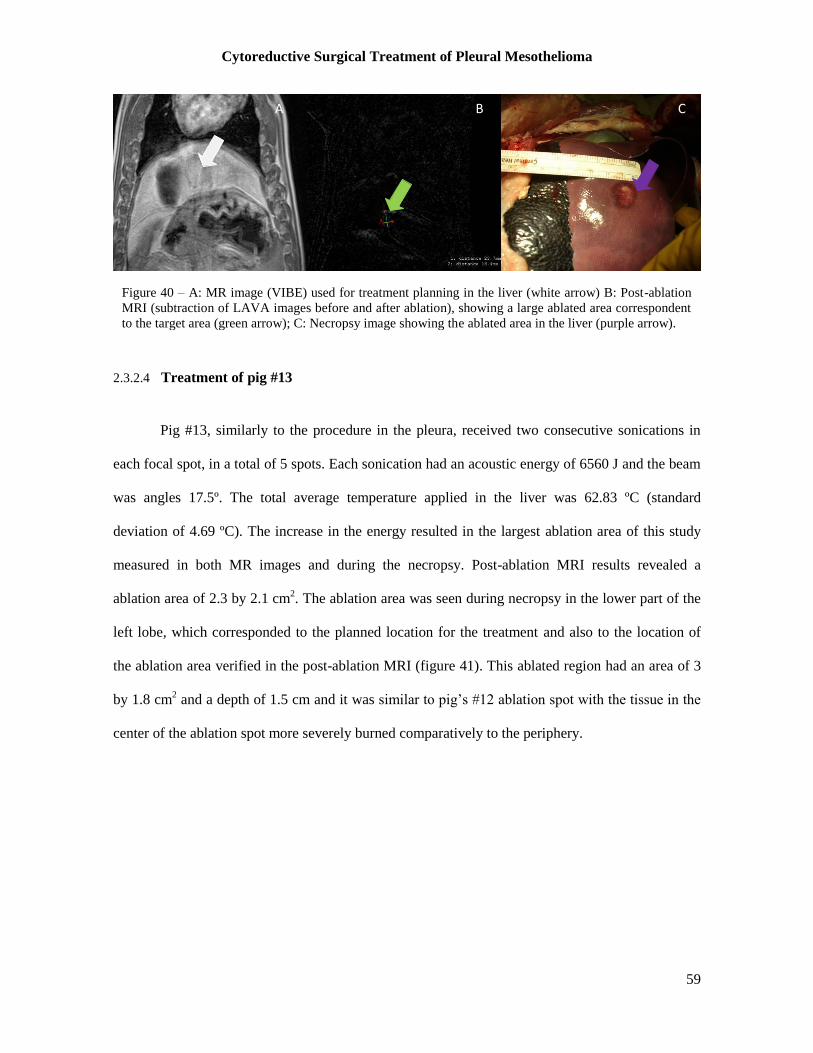
Cytoreductive Surgical Treatment of Pleural Mesothelioma
59
2.3.2.4 Treatment of pig #13
Pig #13, similarly to the procedure in the pleura, received two consecutive sonications in
each focal spot, in a total of 5 spots. Each sonication had an acoustic energy of 6560 J and the beam
was angles 17.5º. The total average temperature applied in the liver was 62.83 ºC (standard
deviation of 4.69 ºC). The increase in the energy resulted in the largest ablation area of this study
measured in both MR images and during the necropsy. Post-ablation MRI results revealed a
ablation area of 2.3 by 2.1 cm2. The ablation area was seen during necropsy in the lower part of the
left lobe, which corresponded to the planned location for the treatment and also to the location of
the ablation area verified in the post-ablation MRI (figure 41). This ablated region had an area of 3
by 1.8 cm2 and a depth of 1.5 cm and it was similar to pig’s #12 ablation spot with the tissue in the
center of the ablation spot more severely burned comparatively to the periphery.
A B C
Figure 40 – A: MR image (VIBE) used for treatment planning in the liver (white arrow) B: Post-ablation
MRI (subtraction of LAVA images before and after ablation), showing a large ablated area correspondent
to the target area (green arrow); C: Necropsy image showing the ablated area in the liver (purple arrow).
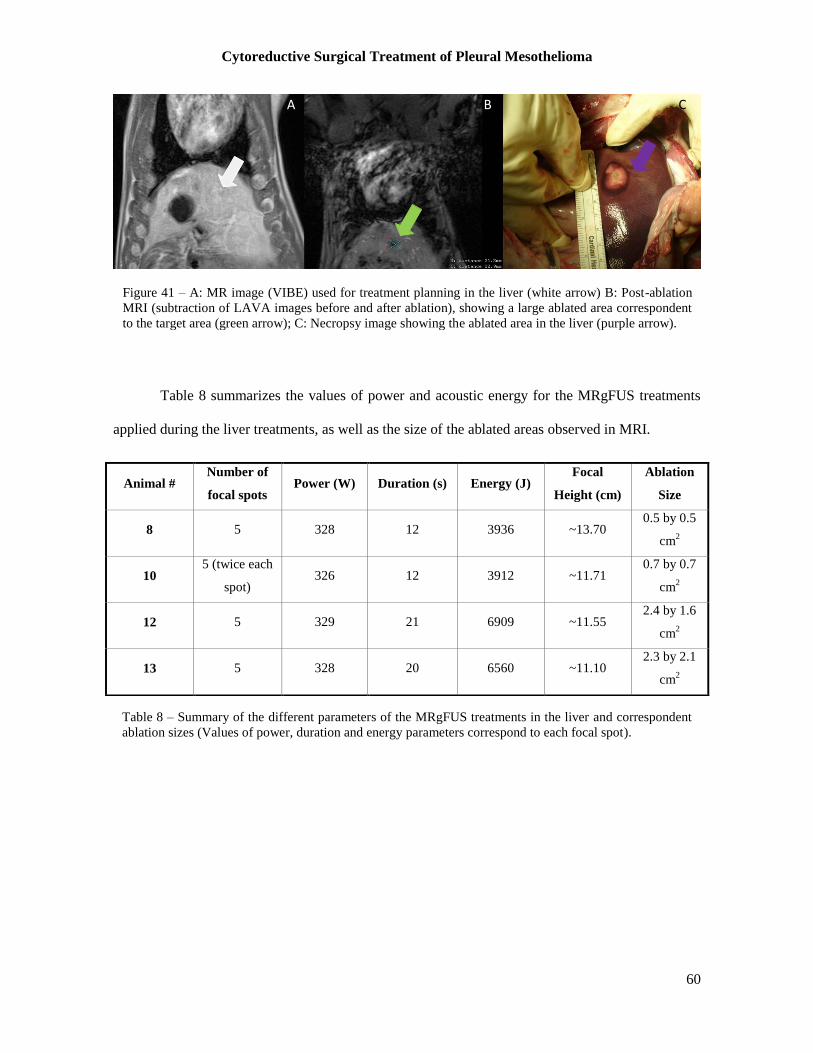
Cytoreductive Surgical Treatment of Pleural Mesothelioma
60
Table 8 summarizes the values of power and acoustic energy for the MRgFUS treatments
applied during the liver treatments, as well as the size of the ablated areas observed in MRI.
Animal # Number of
focal spots Power (W) Duration (s) Energy (J)
Focal
Height (cm)
Ablation
Size
8 5 328 12 3936 ~13.70 0.5 by 0.5
cm2
10 5 (twice each
spot) 326 12 3912 ~11.71
0.7 by 0.7
cm2
12 5 329 21 6909 ~11.55 2.4 by 1.6
cm2
13 5 328 20 6560 ~11.10 2.3 by 2.1
cm2
Table 8 – Summary of the different parameters of the MRgFUS treatments in the liver and correspondent
ablation sizes (Values of power, duration and energy parameters correspond to each focal spot).
Figure 41 – A: MR image (VIBE) used for treatment planning in the liver (white arrow) B: Post-ablation
MRI (subtraction of LAVA images before and after ablation), showing a large ablated area correspondent
to the target area (green arrow); C: Necropsy image showing the ablated area in the liver (purple arrow).
A B C

Cytoreductive Surgical Treatment of Pleural Mesothelioma
61
CHAPTER V
Discussion
Tumor model was successfully developed in the pleura, with predominant presence of
adhesions in all pigs. However, no large tumor masses were detected, probably due to the early
stage of tumor development at the final time point. The number of cells used for this study was
based on a reference cell number used in the induction of mesothelioma in nude mice. Nevertheless,
pigs were not genetically immunosuppressed and their size was much bigger than the mice, so even
with cell number adjustment the tumor development was expected to be slower. Furthermore,
adhesions were not strictly localized in the right lower hemithorax where cells were inoculated, but
as expected spread for the entire thoracic cavity. This feature might be related with the
aggressiveness of the cell line plus fact that cells were suspended in a solution which contributes for
their high mobility. A matrigel-based medium could have increased the probability of maintaining
them more restricted to a specific region of the pleura and therefore, increasing the probability for
the development of more localized masses. MSTO-211H cells, however, are characterized by their
high mobility which is a reinforcement factor for the adhesion extension through the entire thoracic
cavity.
In all pigs diaphragm showed an increase in thickness, as well as in the pericardium. With
the resolution of MR imaging it was difficult to distinguish the membrane from the pericardial fluid.
Studies indicate that pericardium generally increases with heart size and in pigs the average
thickness is around 0.2 mm [27]. The values obtained for these pigs are much superior to this
reference value. It is probable that in our quantification the pericardium fluid was also measured
instead of pericardium itself. When comparing the pericardium and the heart development both
structures increased their sizes at the same rate and therefore the increase in pericardium thickness
was considered as part of the normal growth of the animals that kept gaining weight through the
Cytoreductive Surgical Treatment of Pleural Mesothelioma
62
weeks. The diaphragm thickness however increased in the first 8 weeks after inoculation, then
reaching a plateau. One might assume that this rise in the thickness is due to the disease model since
the increase in the number of adhesions limited the movement of the lungs, which implies that the
diaphragm needed to increase their work to compensate and guarantee the respiratory motion
necessary for the pig to breathe.
Treatments in the liver were based on MR images since some hyperintensity regions
appeared in the T2-weighted images. The fact that MSTO-211 H cell line has high migratory rates
might have compromised the cell agglomeration and as they spread through the liver and do not
form spatially localized masses such as in the case of hepatocellular carcinoma. The hyperintensity
regions in T2-w images may also indicate areas with differences in blood flow, due to the high
quantity of blood supply in the liver. After necropsy no macroscopic tumors were observed, except
on pig #8.
The two animals that died after the inoculation procedure didn’t show any significant signs
of pulmonary or liver disease and therefore their death was not associated with any previous
condition. No necropsy or post-MRI were performed but one hypothesis is that during inoculation
of the liver one of the major blood vessels might have been ruptured causing internal bleeding that
ultimately resulted in animals death.
Two initial control animals (pigs#1 and #2) received only half dose of cyclosporine
comparatively to the other pigs since it was the dose recommended for humans that get organ
transplant. However, pigs do not have the same predisposition to cyclosporine as humans. Frey et
al. [28] proved that the blood concentrations of Cyclosporin were consistently lower in pigs that in
patients when administered both orally and iv, which means that for transplant or other procedures
requiring immunosuppression in pigs it is advisable to increase the dosage. Furthermore, in the first
follow-up of pigs #1 and #2 no signs of disease were observed and therefore cyclosporine dose was
increased for the rest of the pigs. Cyclosporine administration was not maintained until the
treatment of the animals for financial reasons as well as for a drug shortage and was stopped at
Cytoreductive Surgical Treatment of Pleural Mesothelioma
63
different time points. Animals showed no regression in tumor growth after being withdraw from
cyclosporine. Consequently, we conclude that cyclosporine administration is needed to induce the
tumor but its administration is not necessary to continue the entire tumor development. We were
able to induce tumors in pigs receiving cyclosporine only for 4 weeks.
Through the analysis of tables 1 (number of cells injected) and 4 (severity of disease), it is
possible to conclude that animals that received a number superior to 6x10^6
cells showed more
severe signs of the disease. However, between animals that received a number of cells superior to
6x10^6
no significant correlation was found between the number of cells and the severity of the
disease.
Several MR pulse sequences were used in the follow-ups of the animals to investigate
tumor signs, most of them T2-weighted. True FISP sequences revealed to be very sensitive to both
fluid and pleural and diaphragm thickening due to the increase in signal intensity in these regions.
VIBE sequence also showed good results and resolution for the detection of adhesions. Despite
being mechanically ventilated and breath-holds were performed during the image acquisition,
motion artifacts were frequently observed being difficult to use the images for quantification of
tissue thickening. The TWIST and VIBE sequences used in the protocol were very helpful for
detecting blood flow alterations in the liver. HASTE and Blade T2-w did not present very high
resolution being very difficult to distinguish some of the structures important to characterize the
disease, such as the pericardium and the diaphragm, and therefore these sequences were not used in
any quantification or treatment planning.
Through the analysis of the results of the Radiofrequency Ablation treatments, it was
possible to conclude the feasibility of the technique in both pleura and liver. In the pleura, the
values set for the power were decreased for the last treatments due to difficulty in maintaining the
powers recommended by the probe manufacturer. However, the equipment was designed to be a
single use electrode for the treatment of liver tumor. This organ is much more irrigated than the
pleura and the lungs and so the heat generated during the liver treatment was dissipated rapidly. An
Cytoreductive Surgical Treatment of Pleural Mesothelioma
64
advantage of using an ‘umbrella’ type RFA probe is that its configuration improves the contact
between the electrode and the tissue which allowed the probe to move along with the lungs,
avoiding a great misplacement of the ablated area comparatively with the planned treatment. This
feature was very advantageous in the treatment of pleura where most of the ablation areas where
placed in the planned ablation area, particularly with the presence of adhesions. However, for the
liver treatment, probably due to different nature of the tissue, probe didn’t have such a good contact
with the tissue. Therefore the distance between the target and the resultant ablation after the
treatment ranged between 4 cm and 14 cm. One disadvantage with this RFA probe was the MRI-
compatibility. Therefore, despite using MRI to plan the treatment, the guidance was performed
using fluoroscopy imaging. Nevertheless the probe was positioned approximately at the matching
the location in the MRI where adhesions and fluid had been previously observed. For this pilot
study and due to the spread of the disease, this factor did not compromise the research, but in future
studies it would be convenient to use MR-compatible equipment or use CT-guided RFA.
Although the initial objective was treating tumor masses in the pleura, the early stage of
tumor development in all animals was mostly characterized with adhesions, and therefore the
treatment was planned in order to «break» the adhesions so RFA could become an alternative to
P/D and EPP. Nevertheless, the probe was inserted deeper in tissue reaching the surface of the lungs
where all the ablated areas were observed. When comparing the ablated regions between right and
left side, in most cases the ablation area is larger and more defined in the right side of thoracic
cavity where the inoculation took place. This was expected since the roll-off occurred sooner during
the treatment of left side and hence the power delivered was inferior. This might have occurred
since after treating the right side, the heat spread for the thoracic cavity and when ablating the left
side the feedback of the thermocouples in the ‘umbrella’ electrode was based in both the heat being
generated at that time point and the remaining heat in the thoracic cavity from the previous
treatment. When comparing the ablated regions obtained in the right and left side for each animal, it
is possible to conclude that higher values for power/time permitted to obtain more damage in the
Cytoreductive Surgical Treatment of Pleural Mesothelioma
65
tissue. In some cases, such as during the ablation of the right side of pig #6, some tissue was over-
exposed to treatment. Therefore, one of the disadvantages when using this system in the pleura was
to have a precise control for the impedance values.
On the other hand, the algorithm suggested by the probe manufacturer was successfully
followed for the treatment of the liver, which means that higher energy was applied comparatively
with the pleura. The size of the ablation spots was around 2.5 cm in diameter and they were
consistently defined with a circle-shape as expected when using this type of electrode. However the
contact between the electrode and the tissue was more difficult and the location of the ablation areas
were different from those planned. In pig #6 only a small liver ablation spot was observed due to
close proximity with the gallbladder.
MRgFUS has not been used to successfully treat lung cancer due to the high number of air-
tissue interfaces. The new approach used with mesothelioma model reduces the risk of the
reflection of the focused ultrasound beam. Furthermore, in case of some reflection had occurred due
to the deeper penetration of the beam in the tissue, in the specific case of mesothelioma, it would be
benefic since most of the reflected heat would deposit in the pleura. Nevertheless the temperature
values obtained by the software developed for uterine fibroids clinical treatment were not correct
(average value was too high, as well as the standard deviation) and therefore this represents a
challenge for the application of MRgFUS in mesothelioma using the commercially available
equipment.
MRgFUS proved to be an effective treatment tool for both mesothelioma and liver cancer
models. It produced ablation areas with approximately the same size of the ones obtained with
RFA, but it did not require any incisions. It implies, however, the application of a larger amount of
acoustic energy which caused skin burns in the animals. To our knowledge MRgFUS had never
been used for a mesothelioma swine model and therefore, for this first pilot study, the power and
time were progressively increased to evaluate the size, depth and side effects of the high power
sonications. For future studies, these values might be used as a reference and the acoustic energy
Cytoreductive Surgical Treatment of Pleural Mesothelioma
66
may be reduced in order to avoid skin burns. Another option is to increase the cooling timeand the
overall treatment time. A new approach using acoustic reflector materials such as foam or cork
placed in a near field underneath a gel phantom has been used to shield the skin from the ultrasound
beam. The preliminary results showed that it was possible to avoid burns through the insertion of
these materials, by increasing the sonications depth and decreasing the radius of the reflector.
Therefore, it enables the possibility of sparing patients skin tissue while making only a few
adjustments in the setup for the treatment.
Although for each pig the dose applied in the pleura was the same used for the liver,
treatment appeared to have more effectiveness in the liver. Ablation areas were perfectly seen when
using higher energy values and their size also increased with energy, as expected since heat
deposition is also superior. In pig #10, no ablation spot was observed in the liver during the
necropsy, probably because focal spot was located deeper in tissue according to the MR images.
MRgFUS has the advantage of using MRI that enables a more precise treatment planning
since the location of the ablation spots can be verified prior to treatment. Furthermore, since the
sonication time was comparatively lower than the RFA ablation time, it was possible to treat the
animal under a breath-hold regimen then avoiding some of the artifacts related with organ motion.
In the case of this study, the location of the ablated regions observed in the pleura after the
treatment corresponded to the areas previously planned to be ablated. On the other hand, in the liver
the locations of the ablations were systematically inferior to what was initially planned, probably
due to acoustic reflection from the ribs.
Overall, MRgFUS results showed ablated areas with similar sizes to those obtained with
RFA and also permitted to define the shape of the ablation spot for more accurate treatments.
Although the treatment planning requires more time during MRgFUS, the ablation area could
verified prior to the treatment enabling the operator to ensure that the sonications were performed
only in the targeted areas and therefore making MRgFUS a more precise technique.
Cytoreductive Surgical Treatment of Pleural Mesothelioma
67
Conclusion
Malignant Pleural Mesothelioma is a severe condition, which is affecting an increasing
number of people in the recent decades. So far, the conventional therapy is not effective enough
and the majority of the patients cannot tolerate the surgery that enables de reduction of the primary
tumor, and chemotherapy and radiotherapy are not effective enough is these cases to completely
remove the tumor.
This study was an innovative project in both tumor characterization and treatment of MPM.
First, we were able to successfully develop a tumor model in large animals using a human
mesothelioma cell line. To our knowledge, this method was only applied in small animals and they
generally died in the first 40 days. In large animals, more invasive methods were used to induce the
disease and therefore, this study proved the feasibility of cell inoculation in mesothelioma
development in large animals and furthermore it allowed to characterize the early stages of the
disease before animals’ health deteriorate.
This project was also the first one to apply RFA and MRgFUS in this type of disease (to our
knowledge). We were able to prove the feasibility of both techniques and we obtained ablations
areas with approximately the same size. However, MRgFUS has the advantage of not requiring
incisions and there are methods to avoid the skin burns. Furthermore, it is easier to ablate larger
areas with MRgFUS, because with RFA probe needs to be inserted several times to obtain larger
ablation areas, even with larger diameter probes. Since this was just a pilot study to investigate the
feasibility of both techniques in the pleura, no histology was performed to characterize the ablation
areas tissue for all pigs. It would be interesting to further investigate the changes in the tissue with
both therapies and compare the results with the power applied in each ablation area.
Since this is a new area of research, this project allowed to study some of the parameters in
MRgFUS to obtain a successful ablation in the pleura. Nevertheless, this topic requires more

Cytoreductive Surgical Treatment of Pleural Mesothelioma
68
research and, therefore, another study with a larger number of animals will be necessary for
statistical significance.

Cytoreductive Surgical Treatment of Pleural Mesothelioma
69
References
[1] Tsao, N.S., et al., Malignant Plueral Mesothelioma. Journal of Clinical Oncology, 2009. 27(12):
p. 10.
[2] Campbell, N.P. and H.L. Kindler, Update on malignant pleural mesothelioma. Semin Respir
Crit Care Med, 2011. 32(1): p. 102-10.
[3] aboutasbestosis, Asbestos related deaths are on the rise. 2011 (online).
[4] Alliance, M.C., Mesothelioma Causes (online).
[5] Mirarabshahii, P., et al., Diffuse malignant peritoneal mesothelioma--an update on treatment.
Cancer Treat Rev, 2012. 38(6): p. 605-12.
[6] Hiroshima, K., et al., Malignant pleural mesothelioma: clinicopathology of 16 extrapleural
pneumonectomy patients with special reference to early stage features. Pathol Int, 2009. 59(8): p.
537-45.
[7] Zellos, L.S. and D.J. Sugarbaker, Diffuse malignant mesothelioma of the pleural space and its
management. Oncology (Williston Park), 2002. 16(7): p. 907-13; discussion 916-7, 919-20, 925.
[8] Knuuttila, A., et al., The clinical importance of magnetic resonance imaging versus computed
tomography in malignant pleural mesothelioma. Lung Cancer, 1998. 22(3): p. 215-25.
[9] Yamamuro, M., et al., Morphologic and functional imaging of malignant pleural mesothelioma.
Eur J Radiol, 2007. 64(3): p. 356-66.
[10] Hong, K. and C. Georgiades, Radiofrequency ablation: mechanism of action and devices. J Vasc Interv Radiol, 2010. 21(8 Suppl): p. S179-86;
[11] Seiler, J., et al., Steam pops during irrigated radiofrequency ablation: feasibility of impedance monitoring for prevention. Heart Rhythm, 2008. 5(10): p. 1411-6.
[12] McGahan, J.P. and G. Dodd, Radiofrequency Ablation of the Liver: Current Status. American Journal of Roentgenology, 2001. 176(1): p. 14.
[13] Lee, J.M., et al., Hepatic radiofrequency ablation using multiple probes: ex vivo and in vivo comparative studies of monopolar versus multipolar modes. Korean J Radiol, 2006. 7(2): p. 106-17.
[14] Haase, S., et al., Radiofrequency ablation planning: An application of semi-infinite modelling techniques. European Journal of Operational Research, 2012. 218: p. 9.
[15] Simon, C.J., et al., Pulmonary radiofrequency ablation: long-term safety and efficacy in 153 patients. Radiology, 2007. 243(1): p. 268-75.
[16] Morady, F., Radio-frequency ablation as treatment for cardiac arrhythmias. N Engl J Med, 1999. 340(7): p. 534-44.
[17] Kim, Y.S., et al., High-intensity focused ultrasound therapy: an overview for radiologists. Korean J Radiol, 2008. 9(4): p. 291-302.
Cytoreductive Surgical Treatment of Pleural Mesothelioma
70
[18] Tempany, C.M., et al., Focused ultrasound surgery in oncology: overview and principles. Radiology, 2011. 259(1): p. 39-56.
[19] Quesson, B., et al., A method for MRI guidance of intercostal high intensity focused ultrasound ablation in the liver. Med Phys, 2010. 37(6): p. 2533-40.
[20] Streicher, M.N., et al., Effects of air susceptibility on proton resonance frequency MR thermometry. MAGMA, 2012. 25(1): p. 41-7.
[21] Fennessy, F.M. and C.M. Tempany, A review of magnetic resonance imaging-guided focused ultrasound surgery of uterine fibroids. Top Magn Reson Imaging, 2006. 17(3): p. 173-9.
[22] Kopelman, D., et al., Magnetic resonance-guided focused ultrasound surgery (MRgFUS): ablation of liver tissue in a porcine model. Eur J Radiol, 2006. 59(2): p. 157-62.
[23] Tabata, C., et al., Serum Thioredoxin-1 as a Diagnostic Marker for Malignant Peritoneal Mesothelioma. J Clin Gastroenterol, 2012.
[24] Zhang, X., et al., Novel therapy for malignant pleural mesothelioma based on anti-energetic effect: an experimental study using 3-Bromopyruvate on nude mice. Anticancer Res, 2009. 29(4): p. 1443-8.
[25] Hong, K., Georgiades, C., Perutaneous Tumor Ablation: Strategies and Techniques, Thieme,
New York (2010).
[26] Insightec, ExAblate OR: The operating room of the future, 2012 (online).
[27] Laizo, P. (Editor), Handbook of Cardiac Anatomy, Phisiology, and Devices, second edition,
Springer, Minneapolis, 2009.
[28] Frey, B., et al., Marked Interspecies Differences Between Humans and Pigs in Cyclosporine and Prednisolone Disposition. Drug Metabolism and Disposition, 1988. 16(2): p. 5.