Embed Size (px)
Citation preview

UNIVERSITY OF CALIFORNIARIVERSIDE
Extracting Actionable Information From Bug Reports
A Dissertation submitted in partial satisfactionof the requirements for the degree of
Doctor of Philosophy
in
Computer Science
by
Bo Zhou
December 2016
Dissertation Committee:
Dr. Rajiv Gupta, ChairpersonDr. Iulian NeamtiuDr. Zhiyun QianDr. Zhijia Zhao

Copyright byBo Zhou
2016

The Dissertation of Bo Zhou is approved:
Committee Chairperson
University of California, Riverside

Acknowledgments
This dissertation would not have been possible without all people who have helped
me during my Ph.D. study and my life.
Foremost, I would like to express my sincere gratitude to my advisor Dr. Iulian
Neamtiu for the continuous support of my PhD study and research, for his patience, moti-
vation, enthusiasm, and immense knowledge. I will never forget he is the person that went
through my papers tens of times overnight with me for accuracy. His guidance helped me in
all the time of research and writing of this dissertation. I could not have imagined having
a better advisor and mentor for my PhD study. Thanks, Dr. Neamtiu!
I am also deeply indebted to my co-advisor Dr. Rajiv Gupta for the collaboration
over the years, guidance and help for making me not only a good researcher, but also a
good person. His attitude towards research has influenced me immensely in the past and
in the future. Thanks, Dr. Gupta!
Next, I would like to thank the members of my dissertation committee Dr. Zhiyun
Qian and Dr. Zhijia Zhao for being always supportive. Their constructive comments make
this dissertation much better.
On an organizational level, I would like to thank the Department of Computer
Science, and University of California, Riverside for providing an excellent environment for
an international student far away from home. I would also like to sincerely acknowledge the
support of several grants that funded my graduate education: National Science Foundation
grants CNS-1064646, CCF-1149632 and Army Research Laboratory grants Cooperative
Agreement Number W911NF-13-2-0045 (ARL Cyber Security CRA).
iv

I would like to express my gratitude to all my lab-mates: Yan Wang, Changhui
Lin, Min Feng, Sai Charan Koduru, Kishore Kumar Pusukuri, Youngjian Hu, Tanzirul
Azim, Amlan Kusum, Vineet Singh, Zachary Benavides, Keval Vora and Farzad Khorasani
for helping me in many ways during my graduate study. You are priceless friends in my
life.
I also want to thank my dear friends Qu, Lei, Linchao, Jian, Hua, Yingqiao, Lufei,
Boxiao, Luping, Linfeng and Zhipeng for helping and enriching my life in US and in the
future.
Finally, I would like to thank my father, my mother and my girlfriend Ruby. Their
endless love and encouragement help me overcome all kinds of difficulties I encountered
during my study and my life. I love you forever!
v

To my parents and my love for all the support.
vi

ABSTRACT OF THE DISSERTATION
Extracting Actionable Information From Bug Reports
by
Bo Zhou
Doctor of Philosophy, Graduate Program in Computer ScienceUniversity of California, Riverside, December 2016
Dr. Rajiv Gupta, Chairperson
Finding and fixing bugs is a major but time- and effort-consuming task for software
quality assurance in software development process. When a bug is filed, valuable multi-
dimensional information is captured by the bug report and stored in the bug tracking
system. However, developers and researchers have so far used only part of this information
(e.g., a detailed description of a failure and occasionally hint at the location of the fault in
the code), and for limited purposes, e.g., finding and fixing bugs, detecting duplicate bug
reports, or improving bug triagging accuracy. We contend that this information is useful
not only for software testing and debugging but also for product understanding, software
evolution, and software management. This dissertation makes several advances in extracting
actionable information from bug reports using data mining and nature language processing
techniques. Both software developers and researchers can benefit from our approach.
We first focus on differences in bugs and bug-fixing processes between desktop and
smartphone applications. Specifically, our investigation has two main thrusts: a quantita-
tive analysis to discover similarities and differences between desktop and smartphone bug
vii

reports/processes, and a qualitative analysis where we extract topics from bug reports to
understand bugs’ nature, categories, as well as differences between platforms.
Next, we present an approach whose focus is understanding the differences between
concurrency and non-concurrency bugs, the differences among various concurrency bug
classes, and predicting bug quantity, type, and location, from patches, bug reports and
bug-fix metrics.
In addition, we found that bugs of different severities have so far been “lumped
together” even though their characteristics differ significantly. Moreover, we found that
the nature of issues with the same severity, (e.g., high-severity), differs markedly between
desktops and smartphones. To understand these differences, we perform an empirical study
on 72 Android and desktop projects. We study how severity changes, quantify the differences
between classes in terms of bug-fixing attributes and analyze how the topics differ across
classes on each platform over time.
Finally, we aid bug reproduction and fixing: we propose a novel delta debugging
technique to reduce the length of event traces by using a record&replay scheme. When
we capture the event sequence while executing the application, an event dependency graph
(EDG) will be generated. Then we use the EDG to guide the delta debugging algorithm
by eliminating irrelevant events. Therefore, the debugging process can be improved signifi-
cantly if events that are irrelevant to the crash are filtered out.
viii

Contents
List of Figures xiii
List of Tables xv
1 Introduction 11.1 Motivation . . . . . . . . . . . . . . . . . . . . . . . . . . . . . . . . . . . . 11.2 Dissertation Overview . . . . . . . . . . . . . . . . . . . . . . . . . . . . . . 2
1.2.1 Cross-platform Analysis . . . . . . . . . . . . . . . . . . . . . . . . . 31.2.2 Empirical Study on Concurrency Bugs . . . . . . . . . . . . . . . . . 41.2.3 Bug Analysis on Severity Classes . . . . . . . . . . . . . . . . . . . . 51.2.4 Delta Debugging on Android . . . . . . . . . . . . . . . . . . . . . . 7
1.3 Thesis Organization . . . . . . . . . . . . . . . . . . . . . . . . . . . . . . . 8
2 Framework Overview 92.1 Applications . . . . . . . . . . . . . . . . . . . . . . . . . . . . . . . . . . . . 92.2 Collecting Data From Bug Reports . . . . . . . . . . . . . . . . . . . . . . . 132.3 Quantitative Analysis . . . . . . . . . . . . . . . . . . . . . . . . . . . . . . 182.4 Topic Modeling . . . . . . . . . . . . . . . . . . . . . . . . . . . . . . . . . . 18
3 A Cross-platform Analysis of Bugs 203.1 Methodology . . . . . . . . . . . . . . . . . . . . . . . . . . . . . . . . . . . 21
3.1.1 Examined Projects . . . . . . . . . . . . . . . . . . . . . . . . . . . . 213.1.2 Quantitative Analysis . . . . . . . . . . . . . . . . . . . . . . . . . . 243.1.3 Qualitative Analysis . . . . . . . . . . . . . . . . . . . . . . . . . . . 26
3.2 Quantitative Analysis . . . . . . . . . . . . . . . . . . . . . . . . . . . . . . 263.2.1 Bug-fix Process Attributes . . . . . . . . . . . . . . . . . . . . . . . . 263.2.2 Management of Bug-fixing . . . . . . . . . . . . . . . . . . . . . . . . 353.2.3 Bug Fix Rate Comparison . . . . . . . . . . . . . . . . . . . . . . . . 433.2.4 Case Study: Cross-platform Projects . . . . . . . . . . . . . . . . . . 45
3.3 Qualitative Analysis . . . . . . . . . . . . . . . . . . . . . . . . . . . . . . . 483.3.1 Topic Extraction . . . . . . . . . . . . . . . . . . . . . . . . . . . . . 493.3.2 Bug Nature and Evolution . . . . . . . . . . . . . . . . . . . . . . . . 50
ix

3.3.3 Case Study: WordPress . . . . . . . . . . . . . . . . . . . . . . . . . 553.3.4 Smartphone-specific Bugs . . . . . . . . . . . . . . . . . . . . . . . . 56
3.4 Actionable Findings . . . . . . . . . . . . . . . . . . . . . . . . . . . . . . . 573.4.1 Addressing Android’s Concurrency Issues . . . . . . . . . . . . . . . 573.4.2 Improving Android’s Bug Trackers . . . . . . . . . . . . . . . . . . . 573.4.3 Improving the Bug-fixing Process on All Platforms . . . . . . . . . . 583.4.4 Challenges for Projects Migrating to GitHub . . . . . . . . . . . . . 59
3.5 Threats to Validity . . . . . . . . . . . . . . . . . . . . . . . . . . . . . . . . 593.5.1 Selection Bias . . . . . . . . . . . . . . . . . . . . . . . . . . . . . . . 593.5.2 Data Processing . . . . . . . . . . . . . . . . . . . . . . . . . . . . . 603.5.3 IDs vs. Individuals . . . . . . . . . . . . . . . . . . . . . . . . . . . . 60
3.6 Summary . . . . . . . . . . . . . . . . . . . . . . . . . . . . . . . . . . . . . 61
4 Empirical Study of Concurrency Bugs 624.1 Concurrency Bug Types . . . . . . . . . . . . . . . . . . . . . . . . . . . . . 634.2 Methodology . . . . . . . . . . . . . . . . . . . . . . . . . . . . . . . . . . . 64
4.2.1 Projects Examined . . . . . . . . . . . . . . . . . . . . . . . . . . . . 654.2.2 Identifying Concurrency Bugs . . . . . . . . . . . . . . . . . . . . . . 674.2.3 Collecting Bug-fix Process Data . . . . . . . . . . . . . . . . . . . . 70
4.3 Quantitative Analysis of Bug-fixing Features . . . . . . . . . . . . . . . . . 714.3.1 Feature Distributions . . . . . . . . . . . . . . . . . . . . . . . . . . 724.3.2 Differences Among Concurrency Bugs . . . . . . . . . . . . . . . . . 754.3.3 Discussion . . . . . . . . . . . . . . . . . . . . . . . . . . . . . . . . . 77
4.4 Predicting the Number of Concurrency Bugs . . . . . . . . . . . . . . . . . 784.4.1 Generalized Linear Regression . . . . . . . . . . . . . . . . . . . . . . 794.4.2 Times Series-based Prediction . . . . . . . . . . . . . . . . . . . . . . 82
4.5 Predicting the Type of Concurrency Bugs . . . . . . . . . . . . . . . . . . . 854.5.1 Approach . . . . . . . . . . . . . . . . . . . . . . . . . . . . . . . . . 864.5.2 Results . . . . . . . . . . . . . . . . . . . . . . . . . . . . . . . . . . 88
4.6 Predicting Concurrency Bugs’ Location . . . . . . . . . . . . . . . . . . . . 914.6.1 Approach . . . . . . . . . . . . . . . . . . . . . . . . . . . . . . . . . 914.6.2 Results . . . . . . . . . . . . . . . . . . . . . . . . . . . . . . . . . . 92
4.7 Threats to Validity . . . . . . . . . . . . . . . . . . . . . . . . . . . . . . . . 944.7.1 Selection Bias . . . . . . . . . . . . . . . . . . . . . . . . . . . . . . . 944.7.2 Data Processing . . . . . . . . . . . . . . . . . . . . . . . . . . . . . 944.7.3 Unfixed and Unreported Bugs . . . . . . . . . . . . . . . . . . . . . . 954.7.4 Short Histories . . . . . . . . . . . . . . . . . . . . . . . . . . . . . . 954.7.5 Bug Classification . . . . . . . . . . . . . . . . . . . . . . . . . . . . 95
4.8 Summary . . . . . . . . . . . . . . . . . . . . . . . . . . . . . . . . . . . . . 96
5 Bug Analysis Across Severity Classes 975.1 Methodology . . . . . . . . . . . . . . . . . . . . . . . . . . . . . . . . . . . 98
5.1.1 Examined Projects . . . . . . . . . . . . . . . . . . . . . . . . . . . . 995.1.2 Severity Classes . . . . . . . . . . . . . . . . . . . . . . . . . . . . . . 995.1.3 Quantitative Analysis . . . . . . . . . . . . . . . . . . . . . . . . . . 99
x

5.1.4 Topic Analysis . . . . . . . . . . . . . . . . . . . . . . . . . . . . . . 1025.2 Quantitative Analysis . . . . . . . . . . . . . . . . . . . . . . . . . . . . . . 102
5.2.1 Severity Change . . . . . . . . . . . . . . . . . . . . . . . . . . . . . 1035.2.2 Bug-fix Process Attributes . . . . . . . . . . . . . . . . . . . . . . . . 1055.2.3 Management of Bug-fixing . . . . . . . . . . . . . . . . . . . . . . . . 115
5.3 Topic Analysis . . . . . . . . . . . . . . . . . . . . . . . . . . . . . . . . . . 1235.3.1 Topic Extraction . . . . . . . . . . . . . . . . . . . . . . . . . . . . . 1235.3.2 Bug Nature and Evolution . . . . . . . . . . . . . . . . . . . . . . . . 125
5.4 Threats to Validity . . . . . . . . . . . . . . . . . . . . . . . . . . . . . . . . 1305.4.1 Selection Bias . . . . . . . . . . . . . . . . . . . . . . . . . . . . . . . 1305.4.2 Severity Distribution on Android . . . . . . . . . . . . . . . . . . . . 1305.4.3 Priority on Google Code and JIRA . . . . . . . . . . . . . . . . . . . 1305.4.4 Data Processing . . . . . . . . . . . . . . . . . . . . . . . . . . . . . 131
5.5 Summary . . . . . . . . . . . . . . . . . . . . . . . . . . . . . . . . . . . . . 131
6 Minimizing Bug Reproduction Steps on Android 1326.1 Background . . . . . . . . . . . . . . . . . . . . . . . . . . . . . . . . . . . . 1336.2 Problem Overview . . . . . . . . . . . . . . . . . . . . . . . . . . . . . . . . 1346.3 Approach . . . . . . . . . . . . . . . . . . . . . . . . . . . . . . . . . . . . . 135
6.3.1 Creating Event Traces . . . . . . . . . . . . . . . . . . . . . . . . . . 1366.3.2 Generating the Event Dependency Graph . . . . . . . . . . . . . . . 1416.3.3 Our Approach for Delta Debugging . . . . . . . . . . . . . . . . . . . 143
6.4 Summary . . . . . . . . . . . . . . . . . . . . . . . . . . . . . . . . . . . . . 150
7 Related Work 1517.1 Empirical Software Engineering . . . . . . . . . . . . . . . . . . . . . . . . . 151
7.1.1 Bug Characteristic Studies . . . . . . . . . . . . . . . . . . . . . . . 1517.1.2 Bug Severity Studies . . . . . . . . . . . . . . . . . . . . . . . . . . . 1527.1.3 Predicting Bug Location . . . . . . . . . . . . . . . . . . . . . . . . . 1527.1.4 Topic Modeling . . . . . . . . . . . . . . . . . . . . . . . . . . . . . . 154
7.2 Specific Type of Bugs . . . . . . . . . . . . . . . . . . . . . . . . . . . . . . 1547.2.1 Studies on Smartphone Bugs . . . . . . . . . . . . . . . . . . . . . . 1547.2.2 Studies on Concurrent Programs . . . . . . . . . . . . . . . . . . . . 155
7.3 Software Testing & Debugging on Android . . . . . . . . . . . . . . . . . . . 1567.3.1 Mobile App Testing . . . . . . . . . . . . . . . . . . . . . . . . . . . 1567.3.2 Delta Debugging . . . . . . . . . . . . . . . . . . . . . . . . . . . . . 157
8 Conclusions and Future Work 1588.1 Contributions . . . . . . . . . . . . . . . . . . . . . . . . . . . . . . . . . . . 158
8.1.1 A Cross-platform Analysis of Bugs . . . . . . . . . . . . . . . . . . . 1588.1.2 Empirical Study of Concurrency Bugs . . . . . . . . . . . . . . . . . 1598.1.3 Bug Analysis Across Severity Classes . . . . . . . . . . . . . . . . . . 1608.1.4 Minimizing Bug Reproduction Steps on Android . . . . . . . . . . . 160
8.2 Future Directions . . . . . . . . . . . . . . . . . . . . . . . . . . . . . . . . . 1618.2.1 Mixture Use of Data Sources . . . . . . . . . . . . . . . . . . . . . . 161
xi

8.2.2 Study of General Applications . . . . . . . . . . . . . . . . . . . . . 1618.2.3 Minimizing Event Trace on Android . . . . . . . . . . . . . . . . . . 161
Bibliography 163
xii

List of Figures
1.1 Framework overview. . . . . . . . . . . . . . . . . . . . . . . . . . . . . . . . 3
2.1 Bug report header information (sample bug ID 95243 in Mozilla). . . . . . . 142.2 Bug description (sample bug ID 95243 in Mozilla). . . . . . . . . . . . . . . 142.3 Comments for a bug report (sample bug ID 95243 in Mozilla). . . . . . . . 152.4 Bug activity (sample bug ID 142918 in Mozilla). . . . . . . . . . . . . . . . 16
3.1 Beanplot of fix time distributions trends per project. . . . . . . . . . . . . . 283.2 Percentage of bug owners who have reported bugs (a) and their trends (b). 303.3 Beanplot of severity distributions trends per project. . . . . . . . . . . . . . 313.4 Beanplot of description length distributions trends per project. . . . . . . . 323.5 Beanplot of total comments distributions trends per project. . . . . . . . . . 333.6 Beanplot of comments length distributions trends per project. . . . . . . . . 343.7 Bug reporters and trends distribution. . . . . . . . . . . . . . . . . . . . . . 373.8 Bug owners and trends distribution. . . . . . . . . . . . . . . . . . . . . . . 383.9 Bug reporters turnover and trends distribution. . . . . . . . . . . . . . . . . 393.10 Owners, reporters, their turnover and trends. . . . . . . . . . . . . . . . . . 403.11 Beanplot of bug reporter fixed metric and trend. . . . . . . . . . . . . . . . 413.12 Beanplot of bug owner fixed metric and trend. . . . . . . . . . . . . . . . . 413.13 Beanplot of bug reporter/owner metric and trend. . . . . . . . . . . . . . . 423.14 Bug fix rate. . . . . . . . . . . . . . . . . . . . . . . . . . . . . . . . . . . . . 44
4.1 Atomicity violation bug #21287 in Apache (mod mem cache.c). . . . . . . . 644.2 Order violation bug #61369 in Mozilla (nsthread.cpp). . . . . . . . . . . . 644.3 Feature distributions for each class of concurrency bugs (Atomicity, Or-
der, Race, Deadlock), all concurrency bugs combined (Overall) and non-concurrency bugs (NC). . . . . . . . . . . . . . . . . . . . . . . . . . . . . . 73
4.4 Time series of predicted and actual numbers of concurrency bugs each month. 84
5.1 FixTime distribution per year; units are defined in Section 5.1.3. . . . . . . 1075.2 DescriptionLength distribution per year; units are defined in Section 5.1.3. . 1115.3 TotalComments distribution per year; units are defined in Section 5.1.3. . . 1135.4 CommentLength distribution per year; units are defined in Section 5.1.3. . . 114
xiii

5.5 Number of bug reporters and owners for each platform. . . . . . . . . . . . 1175.6 Developer trends on desktop. . . . . . . . . . . . . . . . . . . . . . . . . . . 1185.7 Developer trends on Android. . . . . . . . . . . . . . . . . . . . . . . . . . . 1195.8 DevExperience for each severity class and each platform, in days. . . . . . . 122
6.1 Overview of our approach. . . . . . . . . . . . . . . . . . . . . . . . . . . . . 1356.2 UI elements in app WikiNotes . . . . . . . . . . . . . . . . . . . . . . . . . . 1376.3 Stack trace of the crash of WikiNotes. . . . . . . . . . . . . . . . . . . . . . 1386.4 Crash of WikiNotes in activity WikiNotes. Lines 4–11 are the patch for this
bug. . . . . . . . . . . . . . . . . . . . . . . . . . . . . . . . . . . . . . . . . 1386.5 Event dependency graph of app WikiNotes. . . . . . . . . . . . . . . . . . . 1426.6 Event dependency graph of app AnkiDroid. . . . . . . . . . . . . . . . . . . 1476.7 Stack trace of the crash of AnkiDroid. . . . . . . . . . . . . . . . . . . . . . 1486.8 Fix strategy for the crash of AnkiDroid. . . . . . . . . . . . . . . . . . . . . 149
xiv

List of Tables
2.1 Overview of examined projects for desktop. . . . . . . . . . . . . . . . . . . 112.2 Overview of examined projects for Android. . . . . . . . . . . . . . . . . . . 122.3 Overview of examined projects for iOS. . . . . . . . . . . . . . . . . . . . . 132.4 Bug severity: descriptions and ranks. . . . . . . . . . . . . . . . . . . . . . . 17
3.1 Projects examined, bugs reported, bugs fixed, and time span on desktop. . . 223.2 Projects examined, bugs reported, bugs fixed, and time span on Android. . 233.3 Projects examined, bugs reported, bugs fixed, and time span on iOS. . . . . 243.4 Statistical summary of bug-fix process attributes. . . . . . . . . . . . . . . . 273.5 Bug reporters and bug owners. . . . . . . . . . . . . . . . . . . . . . . . . . 363.6 Top bug reporters in 2012. . . . . . . . . . . . . . . . . . . . . . . . . . . . . 433.7 Mean feature values for cross-platform projects. . . . . . . . . . . . . . . . . 473.8 Top-5 topics in each platform per year for Original data set. . . . . . . . . 523.9 Top-5 topics in each platform per year for Sampled data set. . . . . . . . . . 533.10 Top words associated with major topics. . . . . . . . . . . . . . . . . . . . . 543.11 Top-5 topics for WordPress. . . . . . . . . . . . . . . . . . . . . . . . . . . . 55
4.1 Bug reports and concurrency bug counts. . . . . . . . . . . . . . . . . . . . 664.2 Wilcoxon Rank Sum and Signed Rank Tests results; p-values were adjusted
using the FDR procedure; ∗∗ indicates significance at p = 0.01 while ∗ atp = 0.05. . . . . . . . . . . . . . . . . . . . . . . . . . . . . . . . . . . . . . . 76
4.3 Results of the generalized regression model; ∗∗ indicates significance at p =0.01; ∗ indicates significance at p = 0.05. . . . . . . . . . . . . . . . . . . . . 80
4.4 Summary of stepwise regression model. . . . . . . . . . . . . . . . . . . . . . 814.5 Time series based prediction model result. . . . . . . . . . . . . . . . . . . . 834.6 Accuracy of bug category prediction (%); highest accuracy indicated in bold. 874.7 Detailed result of the Bayesian Net classifier. . . . . . . . . . . . . . . . . . 894.8 Strongest prediction keywords. . . . . . . . . . . . . . . . . . . . . . . . . . 904.9 Source path prediction results. . . . . . . . . . . . . . . . . . . . . . . . . . 93
5.1 Projects examined, number of fixed bugs, severity classes percentage, severitylevel change percentage and time span on desktop. . . . . . . . . . . . . . . 100
xv

5.2 Projects examined, number of fixed bugs, severity classes percentage, severitylevel change percentage and time span on Android. . . . . . . . . . . . . . . 101
5.3 Top 5 severity change patterns. . . . . . . . . . . . . . . . . . . . . . . . . . 1055.4 Results of the generalized regression model. . . . . . . . . . . . . . . . . . . 1085.5 Significance values of whether FixTime differs between classes on Desktop
and Android. . . . . . . . . . . . . . . . . . . . . . . . . . . . . . . . . . . . 1095.6 Numbers of bug reporters and bug owners and the percentage of them who
contribute to each severity class. . . . . . . . . . . . . . . . . . . . . . . . . 1165.7 Top words and topic weights for desktop. . . . . . . . . . . . . . . . . . . . 1265.8 Top words and topic weights for Android. . . . . . . . . . . . . . . . . . . . 1275.9 Top-3 bug topics per year for high-severity class on desktop and Android. . 129
6.1 Event and their call backs we consider. . . . . . . . . . . . . . . . . . . . . . 140
xvi

Chapter 1
Introduction
1.1 Motivation
In less than a century the software market has grown from being non-existent,
into an almost trillion-dollar industry. The total software and software services revenue for
the Top-500 Software companies alone totalled $748.7 billion in 2015, up 4.3 percent from
2014’s $717.7 billion [132]. Today, software powers almost all devices, from pacemakers to
personal computers, smartphones and tablets, that we have come to rely on so heavily in our
daily lives. In the future even more devices and appliances, such as household appliances,
watches, cars, and even glasses, will become “smart” devices powered by software, hence
the software market will only continue to expand and evolve.
Software companies are very keen on maintaining the quality of their software
products since these products are key. Due to the fallibility of developers and the complex-
ity of maintaining software, bugs invariably creep into these products. Software bug is the
common term used to describe an error, flaw, failure or fault in a computer program or sys-
1

tem that causes it to produce an incorrect or unexpected result, or to behave in unintended
ways. Finding and fixing bugs is a major but time- and effort-consuming task for software
quality assurance in software development process.
A key collaborative hub for many software projects is a database of reports de-
scribing both bugs that need to be fixed and new features to be added [35]. This database
is often called a bug tracking system or bug repository. The use of a bug tracking system can
improve the development process by allowing users to inform developers of the problems
encountered while using that software.
Bug reports usually contain valuable information that could be used to improve
the quality of the product (e.g., a detailed description of a failure and occasionally hint
at the location of the fault in the code). One of the challenges is that most of the work
that uses bug reports is focused on improving bug report quality (e.g., finding duplicate
bug reports) and use bug reports to guide maintenance process (e.g., improve bug triaging
accuracy). But there has been only limited use of bug reports in software evolution, software
management and software debugging.
1.2 Dissertation Overview
This dissertation presents a study of several applications of software bug reports in
many new aspects in software engineering which include using bug reports to facilitate bug
understanding, software management, and software debugging process. Figure 1.1 gives the
framework overview of this dissertation – we elaborate on the framework in later chapters.
2

Bug Description
Bug Title
Bug Comments
Bug Database
Bug-fixing featuresSource-code
Repository
Quantitative analysis
(Section 3.2, 4.3, 5.2)
Prediction model
(Section 4.4, 4.5, 4.6)
All data
(Section 3.3, 5.3)
Qualitative analysis
Figure 1.1: Framework overview.
1.2.1 Cross-platform Analysis
Smartphones and the applications (“apps”) running on them continue to grow in
popularity [126] and revenue [81]. This increase is shifting client-side software development
and use, away from traditional desktop programs and towards smartphone apps [65,74].
Smartphone apps are different from desktop programs on a number of levels: nov-
elty of the platform (the leading platforms, Android and iOS, have become available in 2007),
construction (sensor-, gesture-, and event-driven [50]), concerns (security and privacy due
to access to sensitive data), and constraints (low memory and power consumption).
Empirical bugs and bug-fixing studies so far have mostly focused on traditional
software; few efforts [21, 99] have investigated the differences between desktop and smart-
phone software. Therefore, in this dissertation we analyzed the similarities and differences
3

in bug reports and bug-fixing processes between desktop and smartphone platforms. Our
study covers 88 projects (34 on desktop, 38 on Android, 16 on iOS) encompassing 444,129
bug reports. We analyzed bugs in a time span beginning in 1998 for desktop and 2007 for
Android/iOS, and ending at the end of December 2013.
In particular, we studied the bug-fix process features, bug nature and the re-
porter/fixer relationship to understand how bugs, as well as bug-fixing processes, differ
between desktop and smartphone. We shed light on how bug characteristics vary across
platforms and then use this information to help developers to improve product quality.
1.2.2 Empirical Study on Concurrency Bugs
Concurrent programming is challenging, and concurrency bugs are particularly
hard to diagnose and fix for several reasons, e.g., thread interleavings and shared data
complicate reasoning about program state [95], and bugs are difficult to reproduce due to
non-determinism and platform-specific behavior. As a result, we show that fixing concur-
rency bugs takes longer, requires more developers, and involves more patches, compared to
fixing non-concurrency bugs.
Many recent efforts have focused on concurrency bugs, with various goals. On one
side, there are empirical studies about the characteristics and effects of concurrency bugs [46,
93, 138], but they do not offer a way to predict bug quantity, type and location. On the
other side, static [39] or dynamic analyses [94] aim to detect particular types of concurrency
bugs. Such analyses help with precise identification of bugs in the current source code
version, but their focus is different—finding specific types of bugs in the current version,
rather than using evolution data to predict the future number, kind, and location of bugs;
4
in addition, program analysis is subject to scalability constraints which are particularly
acute in large projects. While other prior efforts have introduced models for predicting bug
quantity [78, 116] and bug location [107, 122] without regard to a specific bug category, we
are specifically interested in isolating concurrency bugs and reporting prediction strategies
that work well for them. Hence in this dissertation we study the nature of concurrency
bugs, how they differ from non-concurrency bugs, and how to effectively predict them; we
use statistics and machine learning as our main tools.
Our study analyzes the source code evolution and bug repositories of three large,
popular open-source projects: Mozilla, KDE and Apache. Each project has had a history of
more than 10 years, and their size has varied from 110 KLOC to 14,330 KLOC. Such projects
benefit from our approach for several reasons: (1) large code bases pose scalability, coverage
and reproducibility problems to static and dynamic analyses; (2) large collaborative projects
where bug reporters differ from bug fixers benefit from predictors that help fixers narrow
down the likely cause and location of a bug reported by someone else; (3) a quantitative
predictor for estimating the incidence of concurrency bugs in next releases can help with
release planning and resource allocation.
1.2.3 Bug Analysis on Severity Classes
Bug tracking systems such as Bugzilla, Trac, or Jira are widely popular in large-
scale collaborative software development. Such systems are instrumental as they provide
a structured platform for interaction between bug reporters and bug fixers, and permit
reporting, tracking the progress, collaborating on, and ultimately fixing or addressing the
reported bugs (issues).
5
A key attribute of each bug report on these systems is bug severity—an indicator
of the bug’s potential impact on users. While different bug tracking systems use different
severity scales, we found that bugs can be assigned into one of three severity classes: high
severity bugs represent issues that are genuine show-stoppers, e.g., crashes, data corruption,
privacy leaks; medium severity bugs refer to issues such as application logic issues or occa-
sional crashes; and low severity bugs usually refer to nuisances or requests for improvement.
Severity is important for effort planning and resource allocation during the bug-
fixing process; we illustrate this with several examples. First, while our intuition says that
bugs with different severity levels need to be treated differently, for planning purposes we
need to know how bug severity influences bug characteristics, e.g., fix time or developer
workload. Second, assigning the wrong severity to a bug will lead to resource mis-allocation
and wasting time and effort; a project where bugs are routinely assigned the wrong severity
level might have a flawed bug triaging process. Third, if high-severity bugs tend to have a
common cause, e.g., concurrency, that suggests more time and effort needs to be allocated
to preventing those specific issues (in this case concurrency). Hence understanding bug
severity can make development and maintenance more efficient.
To this end, we have performed a thorough study of severity in a large corpus
of bugs on two platforms, desktop and Android. Most of the prior work on bug severity
has focused on severity prediction [83, 84, 105, 141]; there has been no research on how
severity is assigned and how it changes, on how bugs of different severities differ in terms
of characteristics (e.g., in fix time, developer activity, and developer profiles), and on the
topics associated with different classes of severity. Therefore, to the best of our knowledge,
6

we are the first to investigate differences in bug characteristics based on different severity
classes across multiple platforms.
1.2.4 Delta Debugging on Android
When a new bug report is filed into the bug tracking system, a developer must
debug it in order to fix the problem. Debugging usually consists of two steps. The first
step is reproducing the failure. Reproducing is important because without reproducing the
bug, the developer will have trouble diagnosing and verifying the problem to figure out
the correct fixing strategy. The second step is finding the root cause of the bug. For this
purpose, the developer must track the cause-back chain which leads to the failure location
and identifies the root cause.
To reproduce a particular bug, developers need information about reproduction
steps, i.e., the sequence of program statement, system events or user steps to trigger the
bug, and information about the failure environment, i.e., the setting in which the bug
occurs [156]. Developers can obtain reproduction steps and failure environment information
mainly in two ways: bug report and collection of field data. Bug reports submitted by users
often do not contain reproduction steps or the information provided by users are wrong
or incomplete [85, 167]. Alternatively, developers can execute the application and collect
field data, i.e., data about the runtime behavior and runtime environment of deployed
programs [115]. Such approaches usually generate enormous amounts of tracing data which
not only makes debugging process difficulty but also risky, as the developer cannot predict
when a particular bug will be found. Therefore, simplification of the bug-revealing trace is
an important and essential step towards the debugging.
7

Minimizing Delta Debugging (DD) has been introduced as an effective and efficient
procedure for simplification of the failing test-case by performing at most polynomial (of the
second order) number of tests [157, 159]. DD is an extremely useful algorithm and widely
used in practice. Unfortunately, we cannot directly apply the traditional DD algorithm
on Android platform applications since Android applications are event-based. We cannot
reduce the size of input event sequence without considering the dependency between events.
We present an approach to collect field data automatically and extract reproduc-
tion steps from captured data by using a record & replay scheme. We capture the event
sequence while executing the application and generate an event dependency graph (EDG).
Then we use the EDG to guide the DD algorithm by eliminating irrelevant events.
1.3 Thesis Organization
The remainder of the dissertation is organized as follows. Chapter 2 describes the
framework and general process. In Chapter 3, we present the results of a cross-platform
study between desktop, Android and iOS bugs. In Chapter 4, we analyze concurrency
bugs and introduce three prediction models on bug number, bug type, and bug location,
respectively. In Chapter 5, we compare bug characteristics between different bug severity
classes. Chapter 6 presents the event-based delta debugging algorithm on Android to reduce
the reproduction steps. Chapter 7 describes related work. Finally, Chapter 8 summarizes
the contributions of this dissertation and identifies directions for future work.
8

Chapter 2
Framework Overview
In this chapter we describe the data extraction process and our empirical study
framework. Figure 1.1 shows the process of our study. We first collect a large number of
bug reports from multiple platforms and extract useful features. Then we use these features
to build quantitative analyses, qualitative analyses, and prediction models.
2.1 Applications
We chose 88 open source projects for our study, spread across three platforms: 34
desktop projects, 38 Android projects, and 16 iOS projects. We used several criteria for
choosing these projects and reducing confounding factors. First, the projects we selected
had large user bases, e.g., on desktop we chose1 Firefox, Eclipse, Apache, KDE, Linux kernel,
WordPress, etc.; on Android, we chose Firefox for Android, Chrome for Android, Android platform,
K-9 Mail, WordPress for Android; on iOS we chose Chrome for iOS, VLC for iOS, WordPress for iOS,
1Many of the desktop projects we chose have previously been used in empirical studies [17,48,59,82,153,167].
9

etc. Second, we chose projects that are popular, as indicated by the number of downloads
and ratings on app marketplaces. For the Android projects, the mean number of downloads,
per Google Play, was 1 million, while the mean number of user ratings was 7,807. For the
iOS projects, the mean number of ratings on Apple’s App Store was 3,596; the store does
not provide the number of downloads. Third, we chose projects that have had a relatively
long evolution history (“relatively long” because the Android and iOS platforms emerged in
2007). Fourth, to reduce selection bias, we choose projects from a wide range of categories—
browsers, media players, utilities, infrastructure.
Tables 2.1–2.3 show all the projects we use for our study. For each platform, we
show the project’s name, the number of fixed bugs, the lifespan of the project (counted in
years) and the chapter number of the project used in the dissertation.
All the projects in our study offer public access to their bug tracking systems. The
projects used various bug trackers: desktop projects tend to use Bugzilla, Trac, or JIRA,
while smartphone projects use mostly Google Code, though some use Bugzilla or Trac. We
used Scrapy,2 an open source web scraping tool, to crawl and extract bug report features
from bug reports located in each bug tracking system.
For bug repositories based on Bugzilla, Trac, and JIRA, we only considered bugs
with resolution RESOLVED or FIXED, and status CLOSED, as these are confirmed bugs; we
did not consider bugs with other statuses, e.g., UNCONFIRMED and other resolutions, e.g.,
WONTFIX, INVALID. For Google Code repositories, we selected bug reports with type defect
and status fixed, done, released, or verified.
2http://scrapy.org
10

Desktop
Project Bugs Time span Used ChapterReported Fixed
Mozilla Core 247,376 101,647 2/98-12/13 3, 4, 5
OpenOffice 124,373 48,067 10/00-12/13 3, 5
Gnome Core 160,825 42,867 10/01-12/13 3, 5
Eclipse platform 100,559 42,401 2/99-12/13 3, 5
Eclipse JDT 50,370 22,775 10/01-12/13 3, 5
Firefox 132,917 19,312 4/98-12/13 3, 4, 5
SeaMonkey 91,656 18,831 4/01-12/13 3, 5
Konqueror 38,156 15,990 4/00-12/13 3, 4, 5
Eclipse CDT 17,646 10,168 1/02-12/13 3, 5
WordPress 26,632 9,995 6/04-12/13 3, 5
KMail 21,636 8,324 11/02-12/13 3, 4, 5
Linux Kernel 22,671 7,535 3/99-12/13 3, 5
Thunder-bird 39,323 5,684 4/00-12/13 3, 5
Amarok 18,212 5,400 11/03-12/13 3, 4, 5
Plasma Desktop 22,187 5,294 7/02-12/13 3, 4, 5
Mylyn 8,461 5,050 10/05-12/13 3, 5
Spring 15,300 4,937 8/00-12/13 3, 5
Tomcat 11,332 4,826 11/03-12/13 3, 5
MantisBT 11,484 4,141 2/01-12/13 3, 5
Hadoop 11,444 4,077 10/05-12/13 3, 5
VLC 9,674 3,892 5/05-12/13 3, 5
Kdevelop 7,824 3,572 8/99-12/13 3, 4, 5
Kate 7,058 3,326 1/00-12/13 3, 4, 5
Lucene 5,327 3,035 4/02-12/13 3, 5
Kopete 9,824 2,957 10/01-9/13 3, 4, 5
Hibernate 8,366 2,737 10/00-12/13 3, 5
Ant 5,848 2,612 4/03-12/13 3, 5
Apache Cassandra 3,609 2,463 8/04-12/13 3, 5
digikam 6,107 2,400 3/02-12/13 3, 4, 5
Apache httpd 7,666 2,334 2/03-10/13 3, 4, 5
Dolphin 7,097 2,161 6/02-12/13 3, 4, 5
K3b 4,009 1,380 4/04-11/13 3, 4, 5
Apache Maven 2,586 1,332 10/01-12/13 3, 5
Portable OpenSSH 2,206 1,061 3/09-12/13 3, 5
Total 1,259,758 422,583
Table 2.1: Overview of examined projects for desktop.
11

Android
Project Bugs Time span Used ChapterReported Fixed
Android Platform 64,158 3,497 11/07-12/13 3, 5
Firefox for Android 11,998 4,489 9/08-12/13 3, 5
K-9 Mail 6,079 1,200 6/10-12/13 3, 5
Chrome for Android 3,787 1,601 10/08-12/13 3, 5
OsmAnd Maps 2,253 1,018 1/12-12/13 3, 5
AnkiDroid Flashcards 1,940 746 7/09-12/13 3, 5
CSipSimple 2,584 604 4/10-12/13 3, 5
My Tracks 1,433 525 5/10-12/13 3, 5
Cyanogen-Mod 788 432 9/10-1/13 3, 5
Andro-minion 623 346 9/11-11/13 3, 5
WordPress for Android 532 317 9/09-9/13 3, 5
Sipdroid 1,149 300 4/09-4/13 3, 5
AnySoft-Keyboard 1,144 229 5/09-5/12 3, 5
libphone-number 389 219 11/07-12/13 3, 5
ZXing 1,696 218 5/09-12/12 3, 5
SL4A 701 204 10/09-5/12 3, 5
WebSMS-Droid 815 197 7/10-12/13 3, 5
OpenIntents 553 188 12/07-6/12 3, 5
IMSDroid 502 183 6/10-3/13 3, 5
Wikimedia Mobile 261 166 1/09-9/12 3, 5
OSMdroid 494 166 2/09-12/13 3, 5
WebKit 225 157 11/09-3/13 3, 5
XBMC Remote 729 129 9/09-11/11 3, 5
Mapsforge 466 127 2/09-12/13 3, 5
libgdx 384 126 5/10-12/13 3, 5
WiFi Tether 1,938 125 11/09-7/13 3, 5
Call Meter NG/3G 904 116 2/10-11/13 3, 5
GAOSP 529 114 2/09-5/11 3, 5
Open GPS Tracker 391 114 7/11-9/12 3, 5
CM7 Atrix 337 103 3/11-5/12 3, 5
Transdroid 481 103 4/09-10/13 3, 5
MiniCM 759 101 4/10-5/12 3, 5
Connectbot 676 87 4/08-6/12 3, 5
Synodroid 214 86 4/10-1/13 3, 5
Shuffle 325 77 10/08-7/12 3, 5
Eyes-Free 322 69 6/09-12/13 3, 5
Omnidroid 184 61 10/09-8/10 3, 5
VLC for Android 151 39 5/12-12/13 3, 5
Total 112,894 18,579
Table 2.2: Overview of examined projects for Android.
12

iOS
Project Bugs Time span Used ChapterReported Fixed
WordPress for iPhone 1,647 892 7/08-9/13 3
Cocos2d for iPhone 1,506 628 7/08-5/13 3
Core Plot 614 218 2/09-12/13 3
Siphon 586 162 4/08-11/11 3
Colloquy 542 149 12/08-12/13 3
Chrome for iOS 365 129 6/09-12/13 3
tweetero 142 109 8/09-6/10 3
BTstack 360 106 2/08-12/13 3
Mobile Terminal 311 82 8/07-3/12 3
MyTime 247 101 7/11-11/13 3
VLC for iOS 188 80 8/07-12/13 3
Frotz 214 78 9/10-9/12 3
iDoubs 164 74 9/07-7/13 3
Vnsea 173 58 4/08-10/10 3
Meta-syntactic 145 50 7/08-4/12 3
Tomes 148 51 8/07-5/08 3
Total 7,352 2,967
Table 2.3: Overview of examined projects for iOS.
2.2 Collecting Data From Bug Reports
Bug report repositories archive all bug reports and feature enhancement requests
for a project. Each bug report includes pre-defined fields, free-form text, attachments and
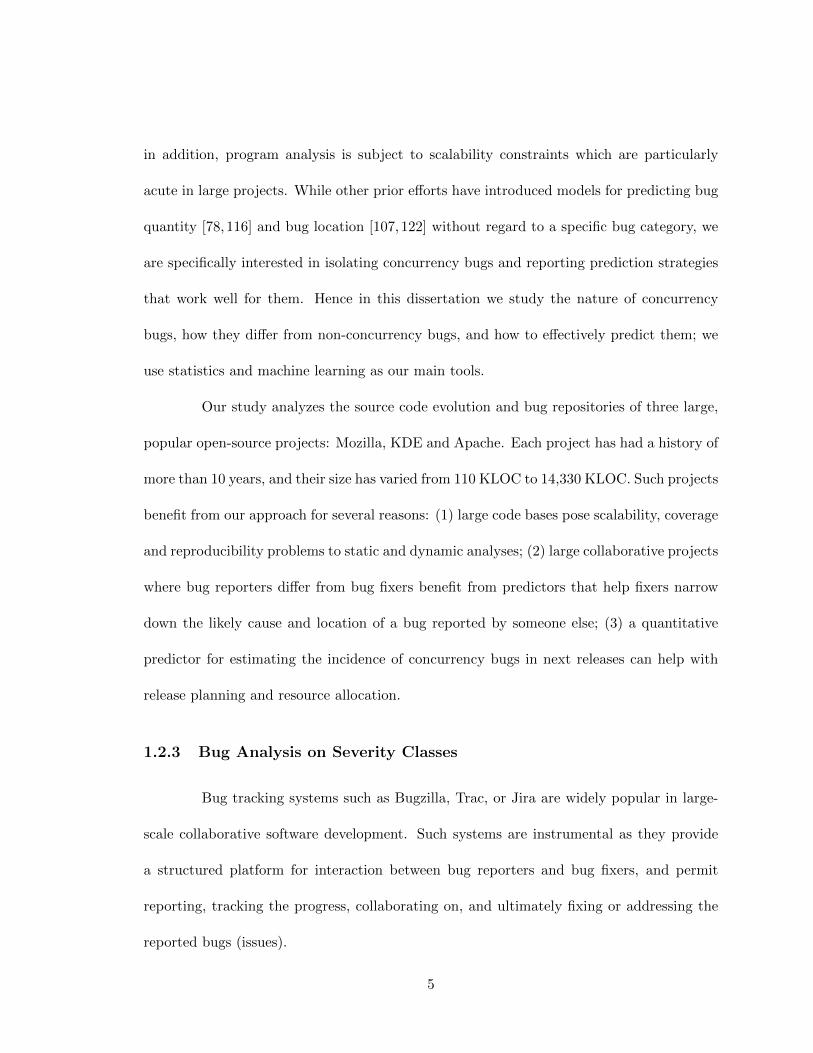
dependencies. In Figures 2.1-2.4 we show parts of a sample bug report from Mozilla and
the activity related to it. We collect the following data from bug reports:
1. BugID: the id of the bug report.
2. FixTime: the time required to fix the bug, in days, computed from the day the bug
was reported to the day the bug was closed.
13
Figure 2.1: Bug report header information (sample bug ID 95243 in Mozilla).
Figure 2.2: Bug description (sample bug ID 95243 in Mozilla).
14

Figure 2.3: Comments for a bug report (sample bug ID 95243 in Mozilla).
3. Severity: an indicator of the bug’s potential impact on customers. When a bug is
reported, the administrators first review it and then assign it a severity rank based
on how severely it affects the program. Since severity levels differ among trackers, we
mapped severity from different trackers to a uniform 10-point scale. Table 2.4 shows
the levels of bug severity and their ranks.
4. Priority: a bug’s priority rates the urgency and importance of fixing the bug, relative
to the stated project goals and priorities. It is set by the maintainers or developers
15

Figure 2.4: Bug activity (sample bug ID 142918 in Mozilla).
who plan to work on the bug; there are 5 levels of priority, with P1 the highest and
P5 the lowest.3
3We use the priority definition from Bugzilla: http://wiki.eclipse.org/WTP/Conventions_of_bug_
priority_and_severity.
16

Bug Severity Description Score
Blocker Blocks development testing work 10
Critical Crashes, loss of data, severe memory leak 9
Major/Crash/High Major loss of function 8
Normal/Medium Regular issue, some loss of functionality 6
Minor/Low/Small Minor loss of function 5
Trivial/Tweak Cosmetic problem 2
Enhancement Request for enhancement 1
Table 2.4: Bug severity: descriptions and ranks.
5. BugReporter: the ID of the contributor who reported the bug.
6. BugOwner: the ID of the contributor who eventually fixed the bug.
7. DevExperience: the experience of developer X in year Y, defined as the difference, in
days, between the date of the X’s last contribution in year Y and X’s first contribution
ever.
8. BugTitle: the text content of the bug report title.
9. BugDescription: the text content of the bug summary/description.
10. DescriptionLength: the number of words in the bug summary/description.
11. BugComment: the text content of the comments in the bug report.
12. TotalComments: the number of comments in the bug report.
13. CommentLength: the number of words in all the comments attached to the bug report.
17

2.3 Quantitative Analysis
To find quantitative differences in bug-fixing processes we performed an analysis
on various features (attributes) of the bug-fixing process, e.g., fix time, severity, comment
length defined in the previous section. We employed three statistical tests in our analysis:
Pairwise comparison test. To check whether feature values differ between different
groups, we conducted pairwise comparisons using the Wilcoxon-Mann-Whitney test (which
is also known as Mann Whitney U test or Wilcoxon rank-sum test).
Trend test. To test whether a feature increases/decreases over time, we build
a linear regression model where the independent variable is the time and the dependent
variable is the feature value for each project. We consider that the trend is increasing
(or decreasing, respectively) if the slope β of the regression model is positive (or negative,
respectively) and p < 0.05.
Non-zero test. To test whether a set of values differs significantly from 0, we
perform a one-sample t-test where the specified value was 0; if p < 0.05, we consider that
the samples differ from 0 significantly.
All statistical tests in our work are implemented by the statistical package R [121].
2.4 Topic Modeling
For the other thrust of our study, we used a qualitative analysis to understand
the nature of the bugs by extracting topics from bug reports. Topic models are a suite of
algorithms that uncover the hidden thematic structure in document collections [24]. Topic
models provide a simple way to analyze large volumes of unlabeled text. A “topic” consists
18

of a cluster of words that frequently occur together. Using contextual clues, topic models can
connect words with similar meanings and distinguish between uses of words with multiple
meanings. These algorithms help us develop new ways to search, browse and summarize
large archives of texts.
We used the bug title, bug description and comments for topic extraction. We
applied several standard text retrieval and processing techniques for making text corpora
amenable to text analyses [140] before applying Latent Dirichlet allocation (LDA) algo-
rithm: stemming, stop-word removal, non-alphabetic word removal, programming language
keyword removal. For example, we removed all the special characters (e.g., “&&”,“->”);
identifier names were split into multiple parts (e.g., “fooBar”,“foo bar”); programming lan-
guage keywords (e.g., “while”,“if”) and English keywords (e.g., “a”, “the”) were removed.
Finally we stemmed each word. We then used MALLET [103] for topic training.
19

Chapter 3
A Cross-platform Analysis of Bugs
As smartphones continue to increase in popularity, understanding how software
processes associated with the smartphone platform differ from the traditional desktop plat-
form is critical for improving user experience and facilitating software development and
maintenance. Empirical bugs and bug-fixing studies so far have mostly focused on tradi-
tional software; few efforts [21, 99] have investigated the differences between desktop and
smartphone software. Therefore, in this chapter we analyzed the similarities and differences
in bug reports and bug-fixing processes between desktop and smartphone platforms. Our
study covers 88 projects (34 on desktop, 38 on Android, 16 on iOS) encompassing 444,129
bug reports. We analyzed bugs in a time span beginning in 1998 for desktop and 2007
for Android/iOS, and ending at the end of December 2013 (Section 3.1.1 shows projects
details).
In particular, we studied the bug-fix process features, bug nature, and the re-
porter/fixer relationship to understand how bugs, as well as bug-fixing processes, differ
20

between desktop and smartphone. The study has two thrusts. First, a quantitative thrust
(Section 3.2) where we compare the three platforms in terms of attributes associated with
bug reports and the bug-fixing process, how developer profiles differ between desktop and
smartphone, etc. Second, a qualitative thrust (Section 3.3) where we apply LDA to extract
topics from bug reports on each platform and gain insights into the nature of bugs, how bug
categories differ from desktop to smartphone, and how these categories change over time.
Our study, findings, and recommendations are potentially useful to smartphone researchers
and practitioners.
3.1 Methodology
We first provide an overview of the examined projects, and then describe how we
extracted bug features and topics.
3.1.1 Examined Projects
We choose all the projects mentioned in Chapter 2.1 for our study. Tables 3.1–3.3
show a summary of the projects we examined. For each platform, we show the project’s
name, the number of reported bugs, the number of closed and fixed bugs, the FixRate (i.e.,
the percentage of fixed bugs in the total number of reported bugs), and finally, the dates of
the first and last bugs we considered.
21

Desktop
Project Bugs Time spanReported Fixed (FixRate)
Mozilla Core 247,376 101,647 (41.09%) 2/98-12/13
OpenOffice 124,373 48,067 (38.65%) 10/00-12/13
Gnome Core 160,825 42,867 (26.65%) 10/01-12/13
Eclipse platform 100,559 42,401 (42.17%) 2/99-12/13
Eclipse JDT 50,370 22,775 (45.22%) 10/01-12/13
Firefox 132,917 19,312 (14.53%) 4/98-12/13
SeaMonkey 91,656 18,831 (20.55%) 4/01-12/13
Konqueror 38,156 15,990 (41.91%) 4/00-12/13
Eclipse CDT 17,646 10,168 (57.62%) 1/02-12/13
WordPress 26,632 9,995 (37.53%) 6/04-12/13
KMail 21,636 8,324 (38.47%) 11/02-12/13
Linux Kernel 22,671 7,535 (33.24%) 3/99-12/13
Thunder-bird 39,323 5,684 (14.45%) 4/00-12/13
Amarok 18,212 5,400 (29.65%) 11/03-12/13
Plasma Desktop 22,187 5,294 (23.86%) 7/02-12/13
Mylyn 8,461 5,050 (59.69%) 10/05-12/13
Spring 15,300 4,937 (32.27%) 8/00-12/13
Tomcat 11,332 4,826 (42.59%) 11/03-12/13
MantisBT 11,484 4,141 (36.06%) 2/01-12/13
Hadoop 11,444 4,077 (35.63%) 10/05-12/13
VLC 9,674 3,892 (40.24%) 5/05-12/13
Kdevelop 7,824 3,572 (45.65%) 8/99-12/13
Kate 7,058 3,326 (47.12%) 1/00-12/13
Lucene 5,327 3,035 (56.97%) 4/02-12/13
Kopete 9,824 2,957 (30.10%) 10/01-9/13
Hibernate 8,366 2,737 (32.72%) 10/00-12/13
Ant 5,848 2,612 (44.66%) 4/03-12/13
Apache Cassandra 3,609 2,463 (68.25%) 8/04-12/13
digikam 6,107 2,400 (39.30%) 3/02-12/13
Apache httpd 7,666 2,334 (30.45%) 2/03-10/13
Dolphin 7,097 2,161 (30.45%) 6/02-12/13
K3b 4,009 1,380 (34.42%) 4/04-11/13
Apache Maven 2,586 1,332 (51.51%) 10/01-12/13
Portable OpenSSH 2,206 1,061 (48.10%) 3/09-12/13
Total 1,259,758 422,583 (33.54%)
Table 3.1: Projects examined, bugs reported, bugs fixed, and time span on desktop.
22

Android
Project Bugs Time spanReported Fixed (FixRate)
Android Platform 64,158 3,497 (5.45%) 11/07-12/13
Firefox for Android 11,998 4,489 (37.41%) 9/08-12/13
K-9 Mail 6,079 1,200 (19.74%) 6/10-12/13
Chrome for Android 3,787 1,601 (42.28%) 10/08-12/13
OsmAnd Maps 2,253 1,018 (45.18%) 1/12-12/13
AnkiDroid Flashcards 1,940 746 (38.45%) 7/09-12/13
CSipSimple 2,584 604 (23.37%) 4/10-12/13
My Tracks 1,433 525 (36.64%) 5/10-12/13
Cyanogen-Mod 788 432 (54.82%) 9/10-1/13
Andro-minion 623 346 (55.54%) 9/11-11/13
WordPress for Android 532 317 (59.59%) 9/09-9/13
Sipdroid 1,149 300 (26.11%) 4/09-4/13
AnySoft-Keyboard 1,144 229 (20.02%) 5/09-5/12
libphone-number 389 219 (56.30%) 11/07-12/13
ZXing 1,696 218 (12.85%) 5/09-12/12
SL4A 701 204 (29.10%) 10/09-5/12
WebSMS-Droid 815 197 (24.17%) 7/10-12/13
OpenIntents 553 188 (34.00%) 12/07-6/12
IMSDroid 502 183 (36.45%) 6/10-3/13
Wikimedia Mobile 261 166 (63.60%) 1/09-9/12
OSMdroid 494 166 (33.60%) 2/09-12/13
WebKit 225 157 (69.78%) 11/09-3/13
XBMC Remote 729 129 (17.70%) 9/09-11/11
Mapsforge 466 127 (27.25%) 2/09-12/13
libgdx 384 126 (32.81%) 5/10-12/13
WiFi Tether 1,938 125 (6.45%) 11/09-7/13
Call Meter NG/3G 904 116 (12.83%) 2/10-11/13
GAOSP 529 114 (21.55%) 2/09-5/11
Open GPS Tracker 391 114 (29.16%) 7/11-9/12
CM7 Atrix 337 103 (30.56%) 3/11-5/12
Transdroid 481 103 (21.41%) 4/09-10/13
MiniCM 759 101 (13.31%) 4/10-5/12
Connectbot 676 87 (12.87%) 4/08-6/12
Synodroid 214 86 (40.19%) 4/10-1/13
Shuffle 325 77 (36.56%) 10/08-7/12
Eyes-Free 322 69 (21.43%) 6/09-12/13
Omnidroid 184 61 (33.15%) 10/09-8/10
VLC for Android 151 39 (25.83%) 5/12-12/13
Total 112,894 18,579 (27.28%)
Table 3.2: Projects examined, bugs reported, bugs fixed, and time span on Android.
23

iOS
Project Bugs Time spanReported Fixed (FixRate)
WordPress for iPhone 1,647 892 (54.16%) 7/08-9/13
Cocos2d for iPhone 1,506 628 (41.70%) 7/08-5/13
Core Plot 614 218 (35.50%) 2/09-12/13
Siphon 586 162 (27.65%) 4/08-11/11
Colloquy 542 149 (27.49%) 12/08-12/13
Chrome for iOS 365 129 (35.34%) 6/09-12/13
tweetero 142 109 (76.76%) 8/09-6/10
BTstack 360 106 (29.44%) 2/08-12/13
Mobile Terminal 311 82 (26.37%) 8/07-3/12
MyTime 247 101 (40.89%) 7/11-11/13
VLC for iOS 188 80 (42.55%) 8/07-12/13
Frotz 214 78 (36.45%) 9/10-9/12
iDoubs 164 74 (45.12%) 9/07-7/13
Vnsea 173 58 (33.53%) 4/08-10/10
Meta-syntactic 145 50 (34.48%) 7/08-4/12
Tomes 148 51 (34.46%) 8/07-5/08
Total 7,352 2,967 (37.40%)
Table 3.3: Projects examined, bugs reported, bugs fixed, and time span on iOS.
3.1.2 Quantitative Analysis
To find quantitative differences in bug-fixing processes we performed an analysis
on various features (attributes) of the bug-fixing process, e.g., fix time, severity, comment
length, which is defined in Chapter 2.2.
Data preprocessing: feature values and trends. We computed per-project values
at monthly granularity, for several reasons: (1) to also study differences between projects
within a platform; (2) to avoid data bias resulting from over-representation, e.g., Mozilla
Core bugs account for 24% of total desktop bugs, hence conflating all the bug reports into a
single “desktop” category would give undue bias to Mozilla; and (3) we found monthly to
be a good granularity for studying trends. For each feature, e.g., FixTime, we compute the
24

geometric mean (since the distributions are skewed, arithmetic mean is not an appropriate
measure [88], and we therefore used the geometric mean in our study) and the trend (slope)
as follows:
Input: Feature value per bug
for each project do
for i = start month to last month do
feature[i] = geometric.mean(input)
end for
FeatureMean = geometric.mean(feature)
FeatureBeta = slope(feature ∼ time)
end for
Output: FeatureMean, FeatureBeta
We employed three statistical tests in our analysis:
Trend test. To test whether a feature increases/decreases over time, we build
a linear regression model where the independent variable is the time and the dependent
variable is the feature value for each project. We consider that the trend is increasing
(or decreasing, respectively) if the slope β of the regression model is positive (or negative,
respectively) and p < 0.05.
Non-zero test. To test whether a set of values differs significantly from 0, we
perform a one-sample t-test where the specified value was 0; if p < 0.05, we consider that
the samples differ from 0 significantly.
Pairwise comparison test. To check whether feature values differ significantly
between platforms, we conducted pairwise comparisons (desktop v. Android; desktop v.
iOS; and Android v. iOS) using the Wilcoxon-Mann-Whitney test.
25

3.1.3 Qualitative Analysis
For the second thrust of our study, we used a qualitative analysis to understand
the nature of the bugs by extracting topics from bug reports. We used the bug title, bug
description and comments for topic extraction. We applied several standard text retrieval
and processing techniques for making text corpora amenable to text analyses [140] before
applying LDA: stemming, stop-word removal, non-alphabetic word removal, programming
language keyword removal. We then used MALLET [103] for topic training. The parameter
settings are presented in Section 3.3.1.
3.2 Quantitative Analysis
The first thrust of our study takes a quantitative approach to investigating the sim-
ilarities and differences between bug-fixing processes on desktop and smartphone platforms.
Specifically, we are interested in how bug-fixing process attributes differ across platforms;
how the contributor sets (bug reporters and bug owners) vary between platforms; how the
bug-fix rate varies and what factors influence it.
3.2.1 Bug-fix Process Attributes
We start with the quantitative analysis of bug characteristics and bug-fixing pro-
cess features. Moreover, to avoid undue influence by outliers, we have excluded the top 5%
and bottom 5% when computing and plotting the statistical values. We show the results,
as beanplots, which is an alternative to the boxplot for visual comparison of univariate
data between groups, in Figures 3.1 through 3.14. The shape of the beanplot is the entire
26

Min 1st Q Median Mean 3rd Q Max Non-zerotest p
Desktop
FixTime 4.361 28.366 77.844 59.990 120.192 500.773Severity 3.148 5.060 5.421 5.500 6.121 7.463Desc.Len 32.09 46.18 57.73 71.674 132.37 159.87TotalComm. 1.780 3.225 4.459 4.268 5.249 9.501Comm.Len 16.44 43.74 65.87 63.323 93.40 260.38
βFixTime -21.314 -9.551 -2.650 -5.122 -0.086 0.960 < 0.01
betaSeverity -0.025 -0.002 0.004 0.004 0.007 0.031 0.027
betaDesc.Len -0.738 -0.152 0.006 0.053 0.166 1.138 0.470
betaTotalComm. -21.314 -9.551 -2.650 -5.122 -0.086 0.959 < 0.01
betaComm.Len -3.699 -0.375 -0.122 -0.251 0.187 1.893 0.159
Android
FixTime 2.556 12.097 20.694 20.080 33.847 150.800Severity 3.737 6.001 6.068 6.094 6.305 7.074Desc.Len 19.24 60.20 69.63 64.136 83.18 105.50TotalComm. 1.861 2.580 3.555 3.779 4.632 14.064Comm.Len 11.18 24.78 43.37 40.179 60.73 129.26
betaFixTime -23.352 -1.164 0.025 -1.165 0.391 7.306 0.124
betaSeverity -0.070 -0.010 -0.001 -0.003 0.002 0.105 0.523
betaDesc.Len -1.874 0.107 0.519 0.703 1.017 5.869 0.003
betaTotalComm. -23.352 -1.164 0.025 -1.165 0.391 7.306 0.124
betaComm.Len -22.148 -0.798 -0.149 0.256 1.417 12.608 0.762
iOS
FixTime 8.423 12.257 19.906 19.793 29.828 53.043Severity 5.985 6.011 6.054 6.236 6.250 7.148Desc.Len 26.73 47.12 69.10 63.269 85.86 159.41TotalComm. 1.492 2.547 3.271 3.298 3.980 6.221Comm.Len 7.844 17.591 37.740 32.730 68.245 143.207
betaFixTime -18.492 -2.461 -0.740 -2.141 0.361 2.055 0.095
betaSeverity -0.093 -0.002 -0.000 -0.001 0.004 0.043 0.908
betaDesc.Len -18.354 -1.758 0.503 -0.250 1.073 12.345 0.870
betaTotalComm. -18.492 -2.461 -0.740 -2.141 0.361 2.055 0.095
betaComm.Len -11.047 -0.627 -0.122 -0.069 0.994 17.249 0.964
Table 3.4: Statistical summary of bug-fix process attributes.
density distribution, which is a better choice for large range of non-normal data, the short
horizontal lines represent each data point, the longer thick lines are the medians, and the
27

0100
200
300
desktop Android iOS
FixTime
(a)
-20
-10
010
desktop Android iOS
bFixTime
(b)
Figure 3.1: Beanplot of fix time distributions trends per project.
white diamond points are the geometric means. Also we show the statistical summary of
each feature on both platforms in Table 3.4. We now discuss each feature.
FixTime. Figure 3.1a shows the time to fix bugs on each platform and Figure 3.1b shows
how the FixTime change for each project on different platforms. Several observations
emerge. First, desktop bugs took longer to fix than smartphone bugs: 60 days on desktop,
20 days on Android, 19 days on iOS (Figure 3.1a). The pairwise comparison test indicates
that FixTime on desktop differs from Android and iOS (p � 0.01 for both); there is no
statistical difference between Android and iOS (p = 0.8). This is due to multiple reasons,
mainly low severity and large number of comments. According to previous research [59,167],
FixTime is correlated with many factors, e.g., positively with number of comments or bug
28

reports with attachments, and negatively with bug severity. As can be seen in Figure 3.5a,
the number of comments for desktop is larger. The severity of desktop bugs is lower, as
shown in Figure 3.3a. We have also observed (as have Lamkanfi and Demeyer [82]) that
on desktop many bugs are reported in the wrong component of the software system, which
prolongs fixing. Also desktop applications are usually more complicate than smartphone
application, it is harder to find root cause and proper fix strategy for desktop applications.
Second, bug-fix time tends to decrease over time on desktop and iOS. In fact, Fix-
Time is the only feature where the non-zero test for β’s turned out significant or suggestive
for all platforms (p < 0.01 for desktop, p = 0.124 for Android, p = 0.095 for iOS based on
Table 3.4). As Figure 3.1b shows, most desktop projects (29 out of 34) and iOS projects
(11 out of 16) have decreasing trends, i.e., negative β’s, on FixTime. For Android, only half
of the projects (19 out of 38) have the same trends. The reasons are again multiple.
The first reason is increasing developer experience: as developers become more
experienced, they take less time to fix bugs. The second reason is increased developer
engagement. High overlap of bug reporters and bug owners results in shorter bug fixing
time, since project developers are more familiar with their own products.
Figure 3.2 shows the percentage of owners who have also reported at least one bug
for each project and their corresponding trend—the graph reveals higher engagement over
time for desktop and iOS, but not for Android (for Android, 23 out of 38 projects show
lower engagement over time).
Other researchers had similar findings: Giger et al. [48] found that older bugs
(e.g., Mozilla bugs opened before 2002 or Gnome bugs opened before 2005) were likely to
29

-20
020
4060
80100
desktop Android iOS
(a)
-60
-40
-20
020
desktop Android iOS
(b)
Figure 3.2: Percentage of bug owners who have reported bugs (a) and their trends (b).
take more time to fix than recently-reported bugs; and more recent bugs were fixed faster
because of the increasing involvement of external developers and the maturation of the
project [106].
Severity. High-severity bug reports indicate those issues that the community considers to
be of utmost priority on each platform.
Figure 3.3a shows that desktop bug severity is lower than smartphone bug severity.
When looking at severity trends, as Figure 3.3b indicates, severity is steady at level 6
(Normal/Medium) for Android and iOS and has a small increasing trend for desktop (22
out of 34 projects on desktop have increasing trend). The pairwise comparison indicates
severity on desktop differs from Android and iOS (p � 0.01 for both), and no statistical
30

45
67
8
desktop Android iOS
Severity
(a)
-0.08
-0.04
0.00
0.04
desktop Android iOS
bSeverity
(b)
Figure 3.3: Beanplot of severity distributions trends per project.
difference between Android and iOS (p = 0.769). Upon investigation, we found that on
desktop, over time, the frequency of high-severity bugs (e.g., crashes or compilation issues)
increases, which raises the mean severity level. We examined projects’ release frequency,
and saw an increasing frequency for desktop [76], meaning for desktop there is less time for
validating new releases and a higher incidence of severe bugs.
DescriptionLength. The number of words in the bug description reflects the level of
detail in which bugs are described. A higher DescriptionLength value indicates a higher bug
report quality [167], i.e., bug fixers can understand and find the correct fix strategy easier.
The pairwise test indicates there is no statistical significant difference in DescriptionLength
among platforms (p > 0.659 for all three cases). DescriptionLength stays constant on
desktop and iOS (Figure 3.4b), but on Android increased significantly (p = 0.003). We
31

050
100
150
200
desktop Android iOS
DescriptionLength
(a)
-4-2
02
46
8
desktop Android iOS
bDescriptionLength
(b)
Figure 3.4: Beanplot of description length distributions trends per project.
found that the increase on Android is due to more stringent reporting requirements (e.g.,
asking reporters to provide steps-to-reproduce [7]).
TotalComments. Bugs that are controversial or difficult to fix have a higher number
of comments. The number of comments can also reflect the amount of communication
between application users and developers—the higher the number of people interested in a
bug report, the more likely it is to be fixed [54]. The means differ (4.6 for desktop, 4.14
for Android, 3.5 for iOS, as shown in Figure 3.5a) but not significantly (all p > 0.07);
TotalComments also tends to stay constant on all three platforms (non-zero test p > 0.46
in each case). For iOS, TotalComments starts lower and stays lower than for desktop and
Android; we found that this is due to a smaller number of reporters and owners (which
32

05
1015
desktop Android iOS
TotalComments
(a)
-0.4
-0.2
0.00.10.20.3
desktop Android iOS
bTotalComments
(b)
Figure 3.5: Beanplot of total comments distributions trends per project.
reduces the amount of communication), as well as overlap between reporters and owners
(Figure 3.2), which reduces the need for commenting; we will provide an example shortly,
from the Colloquy project.
CommentLength. This measure, shown in Figures 3.6a and 3.6b, bears some similarity
with TotalComments, in that it reflects the complexity of the bug and activity of con-
tributor community. Results were similar to TotalComments’. However, iOS has smaller
CommentLength values (33) than desktop (63) and Android (40). The pairwise tests show
that desktop differs with Android and iOS (p = 0.005 and 0.01, respectively), but there is no
statistical difference between Android and iOS (p = 0.48). Upon examining iOS bug reports
we found that fewer users are involved in iOS apps’ bug-fixing—bug fixers frequently locate
33
050
100
200
300
desktop Android iOS
CommentLength
(a)
-4-2
02
46
8
desktop Android iOS
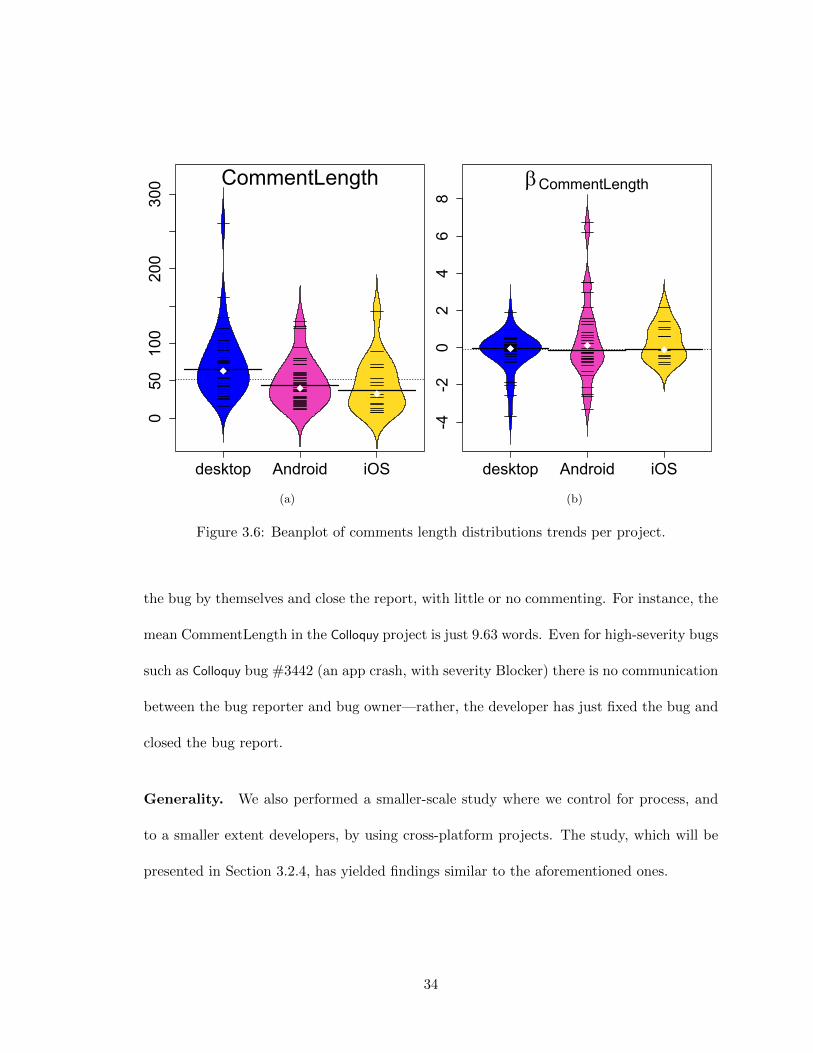
bCommentLength
(b)
Figure 3.6: Beanplot of comments length distributions trends per project.
the bug by themselves and close the report, with little or no commenting. For instance, the
mean CommentLength in the Colloquy project is just 9.63 words. Even for high-severity bugs
such as Colloquy bug #3442 (an app crash, with severity Blocker) there is no communication
between the bug reporter and bug owner—rather, the developer has just fixed the bug and
closed the bug report.
Generality. We also performed a smaller-scale study where we control for process, and
to a smaller extent developers, by using cross-platform projects. The study, which will be
presented in Section 3.2.4, has yielded findings similar to the aforementioned ones.
34

3.2.2 Management of Bug-fixing
Software developers have to collaborate effectively and communicate with their
peers in order to avoid coordination problems. Resource allocation and management of the
bug-fixing process have a significant impact on software development [153]; for example,
traditional software quality is affected by the relation between bug reporters and bug own-
ers [17]; information hiding lead development teams to be unaware of other teams work,
resulting in coordination problems [36]. We defined the two roles in Section 2.2 and now set
out to analyze the relationship between bug reporters and bug owners across the different
platforms.
Developer Change
We examined the distribution and evolution of bug reporters, as well as bug owners,
for the three platforms. Table 3.5 shows the results. The second and third columns show
the number of bug reporters and bug owners, respectively. The fourth and fifth columns
show the top reporters’ IDs (for privacy reasons, where the ID refers to an individual, we
use developer numbers instead of developers’ real names) and the number of bugs they have
reported in that year. The sixth column shows the turnover in top-10 reporters. Columns
7–8 contain the ID and number of bugs of the top bug owner that year, while the last
column is the turnover in top-10 bug owners.
To investigate how reporters (or owners) change overtime, we introduce a new
metric, Turnover, i.e., the percentage of bug reporters (or owners) changed compared to
the previous year. In Figure 3.7 and Figure 3.8 we plot the numbers of bug reporters and
35

Year Reporters Owners Top # of Turn- Top # of Turn-reporter bugs over owner bugs over
(%) (%)
Desktop
1998 164 64 dev 1 116 dev 2 671999 949 214 dev 3 287 30 dev 4 279 402000 3,270 449 dev 5 656 20 Konqueror 3,675 102001 5,471 664 issues@www 299 40 Konqueror 5,333 402002 7,324 995 dev 6 570 20 Konqueror 2,030 602003 7,654 1,084 dev 7 421 50 Konqueror 961 702004 8,678 1,273 dev 7 520 60 Konqueror 775 602005 8,990 1,327 dev 8 471 50 dev 9 636 402006 7,988 1,408 dev 10 448 60 Amarok 872 502007 7,292 1,393 dev 10 593 60 dev 11 357 602008 8,474 1,546 dev 10 444 40 Plasma 1,188 402009 8,451 1,537 dev 12 330 70 Plasma 1,476 402010 7,799 1,475 dev 10 351 50 Plasma 1,014 802011 6,136 1,381 dev 13 295 40 gnome 790 802012 5,132 1,352 dev 13 331 30 gnome 674 502013 4,884 1,432 dev 14 325 60 gnome 661 60
Android
2007 8 2 dev 15 3 dev 15 32008 429 41 dev 16 32 10 dev 16 28 202009 987 104 dev 17 24 10 dev 18 62 302010 1,875 163 dev 19 47 30 dev 20 89 702011 2,045 218 dev 21 70 10 dev 22 72 202012 1,998 340 dev 23 162 40 dev 23 262 602013 1,492 419 dev 24 125 80 dev 25 159 70
iOS
2007 70 8 dev 26 23 dev 27 282008 159 23 dev 28 27 10 dev 28 34 302009 292 36 dev 28 38 20 dev 29 47 302010 209 34 dev 30 53 30 dev 31 52 402011 245 18 dev 30 61 30 dev 30 55 702012 179 28 dev 32 165 40 dev 32 63 602013 182 51 dev 33 31 50 dev 33 58 40
Table 3.5: Bug reporters and bug owners.
36

02000
4000
6000
desktop Android iOS
TotalReporters
(a)-50
050
desktop Android iOS
bTotalReporters
(b)
Figure 3.7: Bug reporters and trends distribution.
owners for each project; we will discuss the evolution of the numbers of reporters and owners
shortly. Figures 3.9 and 3.10 show the turnover per project for each platform. We make
several observations.
First, desktop projects have larger sets of bug reporters and bug owners. Desktop
projects also have a more hierarchical structure with front accounts for filing and fixing
bugs (e.g., “issues@www” in OpenOffice for reporters, “Konqueror Developers”, “Tomcat
Developers Mailing List” for owners).
Second, among individual reporters and owners, the top contributors on desktop
contribute (report or own, respectively) many more bugs than the top contributors on
smartphone, as seen in the “# of bugs” columns.
37

0100200300400500600
desktop Android iOS
TotalOwners
(a)-5
05
10
desktop Android iOS
bTotalOwners
(b)
Figure 3.8: Bug owners and trends distribution.
Third, owner turnover is lower than reporter turnover, echoing one of our findings
on bug reporting ramping up and down faster than bug owning (end of Section 3.2.2). The
turnover of bug reporters differs significantly between desktop and smartphone (p � 0.01
for both), but not between Android and iOS (p = 0.917). Furthermore, the turnover of bug
owners differs between desktop and iOS (p = 0.015) as well as Android and iOS (p = 0.018);
the difference is not significant between desktop and Android (p = 0.644).
The number of fixed bugs differs across platforms, so to be able to compare re-
porter and owner activity between platforms, we use the number of bug reporters and bug
owners in each month divided by the number of fixed bugs in that month (which we name
ReporterFixed, OwnerFixed and Reporter/Owner, respectively). Figures 3.11–3.13 show
the result.
38

0.0
0.2
0.4
0.6
0.8
1.0
1.2
desktop Android iOS
ReporterTurnover
(a)
-0.2
0.0
0.2
0.4
desktop Android iOS
bReporterTurnover
(b)
Figure 3.9: Bug reporters turnover and trends distribution.
The ratio of reporter to fixed bugs can reflect the popularity of the applications.
According to Figures 3.11a and 3.11b, ReporterFixed values for Android and iOS are higher
than for desktop, which we believe is due to two reasons: higher user base and popularity
of smartphone apps, and a lower effort/barrier for reporting bugs (e.g., no need to provide
steps-to-reproduce as required on desktop [7]). Pairwise test results show significant differ-
ences between Android and desktop/iOS (p� 0.01 for both), but not between desktop and
iOS (p = 0.715).
OwnerFixed is lower on desktop (Figure 3.12a); this measures the inverse of work-
load and effort associated with bug-fixing (high ratio = low workload); given the low Own-
erTurnover rates for all platforms, it is unsurprising that OwnerFixed (workload) tends to
39

-0.2
0.0
0.2
0.4
0.6
0.8
1.0
desktop Android iOS
OwnerTurnover
(a)
-0.4
-0.2
0.0
0.2
0.4
0.6
0.8
desktop Android iOS
bOwnerTurnover
(b)
Figure 3.10: Owners, reporters, their turnover and trends.
stay constant for all platforms (Figure 3.12b). The pairwise test shows that desktop differs
from smartphone platforms (p < 0.01) but the difference is not significant between Android
and iOS (p = 0.323).
The ratio of reporters to owners (Figures 3.13 and 3.13b) changes in an interesting
way on all platforms—increase, then decrease—which is due to users adopting applications
(and finding/reporting bugs) at a faster pace than the development team is growing, hence
the initial increase; eventually, as applications mature, their reporter base decreases at a
faster pace than their owner base. There are no significant differences between platforms
(p > 0.19 in all cases).
40

0.0
0.2
0.4
0.6
0.8
1.0
1.2
desktop Android iOS
ReporterFixed
(a)-0.4
-0.2
0.0
0.2
0.4
desktop Android iOS
bReporterFixed
(b)
Figure 3.11: Beanplot of bug reporter fixed metric and trend.
0.0
0.2
0.4
0.6
desktop Android iOS
OwnerFixed
(a)
-0.4
-0.2
0.0
0.2
0.4
desktop Android iOS
bOwnerFixed
(b)
Figure 3.12: Beanplot of bug owner fixed metric and trend.
41

010
2030
4050
desktop Android iOS
Reporter/Owner
(a)-10
-50
5
desktop Android iOS
bReporter/Owner
(b)
Figure 3.13: Beanplot of bug reporter/owner metric and trend.
Case Study: Contributor Activity in 2012
We now elaborate on the overlap between developer and owner sets which was also
visible in Table 3.5—we found that for Android and iOS, many developers both reported
and owned bugs. We chose 2012 for the case study.
Table 3.6 provides the top-7 contributors for each platform in 2012 (we chose 7
for consistency with Table 5.6). The first column is the developer ID, the second and
fourth columns are the number of bugs reported and fixed by that developer, respectively.
The third and fifth columns are the rank of that developer based on the number of bugs
reported/fixed. Note how for desktop, top bug reporters and top bug owners are separate
sets, indicating a strong separation of responsibilities. In contrast, for Android and iOS,
the situation is opposite: top bug reporters also fix bugs as indicated by the large overlap in
42

Name Bugs Rank Bugs Rankreported owned
Desktop
dev 13 331 1 21 276dev 35 309 2 280 5dev 14 273 3 246 7dev 10 239 4 6 508dev 36 202 5 0 N/Adev 37 105 36 325 2dev 38 192 8 223 8
Android
dev 23 162 1 262 1dev 21 148 2 6 76dev 39 126 3 10 57dev 40 101 4 177 3dev 41 95 5 176 4dev 24 80 6 178 2dev 42 62 10 161 5
iOS
dev 32 165 1 63 1dev 30 64 2 48 2dev 43 59 3 44 3dev 44 30 4 6 10dev 34 17 5 20 4dev 33 7 7 9 5dev 45 9 6 9 6
Table 3.6: Top bug reporters in 2012.
membership between top reporters and top owners. Previous work [69] has similar findings:
21.8% of the sampled participants in an Android contributor survey were developers who
have submitted changes.
3.2.3 Bug Fix Rate Comparison
The bug fix rate is an indication of the efficiency of the bug-fixing process: a low
fix rate can be due to many spurious bug reports being filed, or when reports are legitimate,
43

0.0
0.2
0.4
0.6
0.8
desktop Android iOS
FixRate
Figure 3.14: Bug fix rate.
developers are unable to cope with the high workload required for addressing the issues.
Figure 3.14 shows the fix rate.
The mean bug fix rate for Android (27.28%) is lower than for desktop (36.56%)
and iOS (37.40%). Our investigation has revealed that this is due to differences in bug
reporter profiles and developer workloads.
In Android, two projects have much lower fix rates than others: Android plat-
form (5.45%) and Wifi Tether (6.45%). When examining their workload compared to other
projects, we found it to be very high (Android platform has 2,433 bug reporters and 130 bug
owners, while Wifi Tether has 117 reporters but only 3 owners), which results in a low fix
rate. On the other hand, WebKit, the project with the highest fix rate (69.78%), has 29 bug
reporters and 18 bug owners—the high fix rate is unsurprising, given the lighter workload.
44

For desktop, the fix rate for Firefox (14.53%) and Thunderbird (14.45%) are the
lowest. In contrast, Cassandra (68.25%), Mylyn (59.69%), and Eclipse CDT (57.62%) have
much higher fix rates. The high rate of duplicate bug reports (27.18% for Firefox and
32.02% for Thunderbird) certainly plays a role in the low fix rate. Note, however, that Firefox
and Thunderbird, a Web browser and email client respectively, are used by broad categories
of people that have varying levels of expertise. In contrast, Mylyn is a task management
system, Eclipse CDT is an IDE, Cassandra is a distributed database management system; their
users have higher levels of expertise. Hence we believe that users of the latter applications
are more adept at filing and fixing bugs than Firefox and Thunderbird users, leading to a
higher fix rate.
For iOS, no application stands out as having a much lower fix rate than others.
While Chrome for iOS has a low fix rate (35.34%), it is comparable with Chrome for Android
(42.28%); tweetero has the highest fix rate (76.76%), understandably so as the project has
14 bug reporters and 5 bug owners.
Pairwise tests for fix rates show that the rates for desktop and Android projects
differ (p = 0.010), as do Android and iOS projects (p = 0.039); the difference in fix rate
between desktop and iOS projects is not significant (p = 0.673).
3.2.4 Case Study: Cross-platform Projects
We now present a method and case study for comparing process features in a
more controlled setting, using cross-platform projects. We chose four apps, Chrome, Firefox,
WordPress and VLC: the first two are dual-platform, while the last two are present on all three
platforms. This comparison method is somewhat orthogonal to our approach so far: on one
45

hand, it compares desktop, Android and iOS while eliminating some confounding factors,
as within each project, processes and some developers are common across platforms; on the
other hand it uses a small set of projects.
For Chrome, there are 337 bug reporters and 218 bug owners for Android, while
the iOS version has 62 bug reporters and 38 bug owners. We found that 16 bug reporters
and 13 bug owners contribute to both platforms; in fact, 6 of them reported and fixed bugs
on both Android and iOS. For Firefox, we found 3,380 and 423 bug reporters for desktop
and Android, respectively; 216 of them reported bugs on both platforms. We also found
that Firefox has 911 and 203 bug owners on desktop and Android, respectively, with 80
owning bugs on both platforms. Finally, there were 58 developers that have reported and
owned bugs on both platforms. In charge of WordPress bugs, there were 2352, 37, and 99
bug reporters (in desktop, Android and iOS, respectively) and 205, 8, and 31 bug owners
(in desktop, Android and iOS). We found that 3 reporters open bug reports on all three
platforms. For bug owners, we did not find developers who contribute to both desktop and
Android; though 4 developers fixed bugs in both Android and iOS, while 3 developers fixed
bugs for desktop and iOS. For VLC, there were 1451, 28, and 27 bug reporters and 98, 4, and
5 bug owners in desktop, Android and iOS, respectively; only one developer has contributed
to all the platforms as bug reporter and owner.
Table 3.7 shows the geometric mean of features and bug-fixing management met-
rics for each app on different platforms; differences between the means were significant
(p < 0.01), with few exceptions. We again ran a Wilcoxon-Mann-Whitney test between fea-
ture sets on different platforms but within the same project; non-significant features were
46

Pro
ject
Fix
Tim
eS
everi
tyD
esc
rip
tion
Tota
lC
om
ment
Fix
Rep
ort
er
Ow
ner
Rep
ort
er
Ow
ner
Rep
ort
er
Len
gth
Com
ments
Len
gth
Rate
Tu
rnover
Tu
rnover
Fix
ed
Fix
ed
Ow
ner
Ch
rom
eA
ndro
id20
.82
5.82
57.6
97.
9561
.12
42.2
8%0.
610.
220.
400.
261.
50iO
S14
.11
5.94
50.6
16.
0541
.73
35.3
4%0.
300.
100.
790.
581.
44
Fir
efox
Des
kto
p86
.20
5.61
45.1
98.
5986
.30
14.5
3%0.
280.
450.
360.
162.
56A
ndro
id28
.29
6.16
40.5
08.
6468
.41
37.4
1%0.
520.
240.
300.
211.
79
Wor
dP
ress
Des
kto
p9.
545.
7938
.37
3.38
42.0
137
.53%
0.27
0.46
0.34
0.04
8.82
Andro
id9.
707.
2222
.12
1.87
12.2
059
.59%
0.48
0.17
0.16
0.12
2.17
iOS
6.03
6.97
26.3
42.
8427
.12
54.1
6%0.
760.
340.
250.
132.
04
VL
C
Des
kto
p23
.20
6.21
36.7
72.
4815
.76
40.2
4%0.
210.
390.
400.
085.
00A
ndro
id18
.40
6.27
22.0
22.
8211
.52
25.8
3%1.
000.
000.
800.
223.
76iO
S8.
966.
7722
.30
2.24
12.0
242
.55%
0.67
0.00
0.33
0.09
3.73
Tab
le3.
7:M
ean
feat
ure
valu
esfo
rcr
oss-
pla
tfor
mp
roje
cts.
47

Severity and DescriptionLength for Chrome; TotalComment for Firefox; FixTime on desktop v.
Android, Severity (p = 0.873) and DescriptionLength (p = 0.069) on Android v. iOS. for
WordPress; and Android v. iOS on VLC.
We make two observations. First, several findings (e.g., iOS bugs are fixed faster;
Android bugs have larger ReporterTurnover; OwnerTurnover and CommentLength are
higher on desktop) are consistent with the findings in Section 5.2.2, which gives us in-
creased confidence in the generality of those results. Second, researchers and practitioners
can use these findings to start exploring why, within a project, the subproject associated
with a certain platform fares better than the other platforms.
3.3 Qualitative Analysis
We now turn to a qualitative analysis that investigates the nature of the bugs.
Specifically, we are interested in what kinds of bugs affect each platform, what are the most
important issues (high-severity bugs) on each platform, and how the nature of bugs changes
as projects evolve.
We use topic analysis; we first extract topics (sets of related keywords) via LDA
from the terms (keywords) used in bug title, descriptions and comments, as described in
Section 2.2 used each year in each platform, and then compare the topics to figure out how
topics change over time in each platform, how topics differ across platforms, and what were
the prevalent bug topics in smartphone projects.
48

3.3.1 Topic Extraction
The number of bug reports varies across projects, as seen in Tables 3.1–3.3. More-
over, some projects are related in that they depend on a common set of libraries, for instance
SeaMonkey, Firefox and Thunderbird use functionality from libraries in Mozilla Core, e.g., han-
dling Web content. It is possible that a bug in Mozilla Core cascades and actually manifests
as a crash or issue in SeaMonkey, Firefox, or Thunderbird, which leads to three separate bugs
being filed in the latter three projects. For example, Mozilla Core bug #269568 cascaded into
another two bugs in Firefox and Thunderbird.
Hence we extract topics using two strategies: Original and Sampled. In the
Original strategy, we use all bug reports from each project. In the Sampled a sampling
strategy, where we sampled bug reports to reduce possible over representation due to large
projects and shared dependences. More concretely, for Sampled we extracted topics from
1,000 “independent” bug reports for each project group, e.g., Mozilla, KDE. The indepen-
dent bug report sets were constructed as follows: since we have 10 projects from KDE,
we sampled 100 bugs from each KDE-related project. We followed a similar process for
Mozilla, Eclipse and Apache. Android and iOS had smaller number of bug reports, so for
Android we sampled 100 bug reports from each project, and for iOS we sampled 50 bug
reports from each project. For those projects have less bug reports (e.g., VLC for Android)
than the sample number, we choose all the bug reports.
We used LDA (as described in Section 2.4) on both Original and Sampled sets;
For Sampled set, since there were only 2 bug reports on 1998 for desktop and 1 for Android
in 2007, we have omitted those years. For Original set, the preprocessing of desktop bug
49

reports resulted in 35,083,363 words (510,600 of which were distinct). For Android bug
reports, the preprocessing resulted in 1,535,307 words (36,411 of which were distinct). For
iOS bug reports, the preprocessing resulted in 202,263 words (10,314 of which were distinct).
For Sampled set, The preprocessing of desktop, Android, and iOS sets resulted in 824,275
words (37,891 distinct), 238,027 words (12,046 distinct) and 71,869 words (5,852 distinct),
respectively.
In the next step, we used MALLET [103] for LDA computation. We ran for
10,000 sampling iterations, the first 1,000 of which were used for parameter optimization.
For Original set, we modeled bug reports with K = 400 topics for desktop, 90 for Android
and 50 for iOS. For Sampled set, We modeled bug reports with K = 100 topics for desktop,
60 for Android, and 30 for iOS; we choose K based on the number of distinct words for each
platform; Section 3.5 discusses caveats on choosing K. Finally, we labeled topics according
to the most representative words and confirmed topic choices by sampling bug reports for
each topic to ensure the topic’s label and representative words set were appropriate.
3.3.2 Bug Nature and Evolution
How Bug Nature Differs Across Platforms
Table 3.8 shows the top-5 topics in each platform, in each year, for the Original
data set. As expected, some projects, e.g., “Qt”, the shared library used in KDE, was the
strongest topic in 2008; Mozilla or Android platform, dominate and bugs associated with
them have a high preponderance among topics. Nevertheless, differences among platforms
are clear: on desktop, crashes and GUI issues are preponderant; on Android, the Android
50

runtime is a major source of issues; on iOS, crashes are preponderant. Note that the analysis
of Original or Sampled serve different purposes, depending on whether our interest is in
where the bulk of the bugs are in a certain year (Original), or how the nature of the bugs
exhibits similarity across projects Sampled.
Table 3.9 shows the topics extracted from Sampled data set. We found that for
desktop, application crash is the most common bug type, and application logic bugs (failure
to meet requirements) are the second most popular. For Android, bugs associated with the
user interface (GUI) are the most prevalent. For iOS, application logic bugs are the most
prevalent.
There are topics related to specific applications, e.g., Hadoop. The reason is
that with partial assignments, LDA will not try to find mutually exclusive topics, since a
document can be partly about one topic and partly about another [110].
How Bug Nature Evolves
To study macro-trends in how the nature of bugs changes over time, we analyzed
topic evolution in each platform. We discuss our findings on Sampled data set. For desktop,
application logic and crashes are a perennial presence, which is unsurprising. However, while
in the early years (before 2005), compilation bugs were a popular topic, after 2005 new kinds
of bugs, e.g., concurrency (topic “thread”) and multimedia (topics “audio”, “video”) take
center stage.
For Android, it is evident that in the beginning, developers were still learning how
to use the platform correctly: intents are a fundamental structure for intra- and inter-app
51

Year
Top
5to
pic
s(t
op
icw
eig
ht)
Des
ktop
1998
layo
ut
(33%
)sc
rollbar
(22%
)cr
ash
(11%
)to
olbar/
sid
ebar
(11%
)ev
ent
han
dle
r(8
%)
1999
scro
llbar
(29%
)M
ozilla
dog
food
(20%
)to
olb
ar/s
ideb
ar(1
2%
)cr
ash
(10%
)ev
ent
han
dle
r(9
%)
2000
nsb
eta
(19%
)sc
rollbar
(18%
)to
olb
ar/s
ideb
ar(1
3%
)cr
ash
(13%
)ko
nquer
or(1
2%)
2001
konquer
or(1
5%)
com
pile
(14%
)cr
ash
(14%
)to
olbar/
sid
ebar
(11%
)ev
ent
han
dle
r(1
1%)
2002
wid
get
(21%
)cr
ash
(15%
)co
mp
ile
(14%
)ev
ent
han
dle
r(1
1%
)to
olb
ar/s
ideb
ar(9
%)
2003
wid
get
(20%
)M
ozilla
Fir
ebir
d(1
4%
)cr
ash
(14%
)ev
ent
han
dle
r(1
0%
)to
olb
ar/s
ideb
ar(7
%)
2004
crash
(14%
)U
I(1
4%)
wid
get
(13%
)F
iref
oxcl
obb
er(1
2%)
even
th
andle
r(1
0%)
2005
crash
(15%
)O
SG
I(1
3%)
UI
(11%
)w
idge
t(1
0%
)ev
ent
han
dle
r(9
%)
2006
crash
(16%
)A
mar
ok(1
2%)
UI
(10%
)plu
gin
(10%
)ev
ent
han
dle
r(1
0%)
2007
crash
(18%
)plu
gin
(12%
)E
quin
ox(1
2%)
Cai
rolib
(10%
)ev
ent
han
dle
r(1
0%)
2008
Qt
(21%
)cr
ash
(17%
)p
lugi
n(1
2%)
even
th
andle
r(9
%)
UI
(7%
)20
09
thre
ad(3
2%)
cras
h(1
7%)
plu
gin
(10%
)ev
ent
han
dle
r(9
%)
con
curr
ency
(7%
)20
10
thre
ad(3
2%)
cras
h(2
0%)
plu
gin
(10%
)ev
ent
han
dle
r(9
%)
con
curr
ency
(9%
)20
11
crash
(20%
)w
idge
tcr
ash
(13%
)co
ncu
rren
cy(1
0%)
plu
gin
(10%
)ev
ent
han
dle
r(9
%)
2012
crash
(20%
)H
adoop
(18%
)G
nom
e(1
2%)
dll
(11%
)p
lugi
n(9
%)
2013
Had
oop
(26%
)cr
ash
(20%
)aud
io(1
5%
)ev
ent
han
dle
r(8
%)
plu
gin
(7%
)
An
dro
id
2007
sdk
(24%
)la
yout
(17%
)A
nd
roid
runti
me
(16%
)cr
ash
(9%
)m
ail
(6%
)20
08
sdk
(25%
)A
ndro
idru
nti
me
(17%
)m
ail
(11%
)la
yout
(11%
)cr
ash
(9%
)20
09
mai
l(1
5%
)A
ndro
idru
nti
me
(15%
)cr
ash
(11%
)la
yout
(10%
)E
mai
lcl
ient
(9%
)20
10
Andro
idru
nti
me
(15%
)cr
ash
(12%
)th
read
(10%
)A
nkiD
roid
(9%
)m
ail
(7%
)20
11
Andro
idru
nti
me
(18%
)cr
ash
(12%
)th
read
(9%
)batt
ery
(9%
)la
yout
(8%
)20
12
Andro
idru
nti
me
(15%
)F
iref
ox(1
3%
)cr
ash
(13%
)la
yout
(8%
)b
ook
mark
(7%
)20
13
Fir
efox
(17%
)A
ndro
idru
nti
me
(13%
)cr
ash
(10%
)C
hro
me
(10%
)la
yout
(9%
)
iOS
2007
connec
tion
(22%
)b
ook
(21%
)sc
reen
dis
pla
y(1
3%)
UI
(10%
)cr
ash
(10%
)20
08
grap
hic
s(1
6%)
mult
imed
ia(1
3%)
cras
h(1
1%)
scre
end
ispla
y(1
1%
)M
obileT
erm
inal
(10%
)20
09
Sip
hon
e(1
3%)
mem
ory
(12%
)co
nnec
tion
(11%
)gr
aphic
s(1
1%)
cras
h(1
0%)
2010
crash
(14%
)gr
aph
ics
(11%
)co
nnec
tion
(11%
)sc
reen
dis
pla
y(1
0%
)B
Tst
ack
(8%
)20
11
book
(22%
)cr
ash
(17%
)plo
t(9
%)
mem
ory
(8%
)gr
aphic
s(8
%)
2012
plo
t(2
0%
)cr
ash
(17%
)sc
reen
dis
pla
y(1
5%)
UI
(14%
)m
emor
y(8
%)
2013
sync
(37%
)cr
ash
(16%
)co
nnec
tion
(10%
)m
emor
y(8
%)
scre
endis
pla
y(7
%)
Tab
le3.8
:T
op-5
top
ics
inea
chp
latf
orm
per
year
forOriginal
dat
ase
t.
52

Year
Top
5to
pic
s(t
op
icw
eig
ht)
Des
ktop
1999
layo
ut
(30%
)re
assi
gn(2
0%)
applica
tion
logi
c(1
5%)
cras
h(1
4%)
php
(8%
)20
00dat
abas
e(2
2%
)re
assi
gn(2
0%)
cras
h(1
5%
)la
you
t(1
5%
)ap
plica
tion
logi
c(9
%)
2001
cras
h(1
6%)
com
pilat
ion
(16%
)re
ass
ign
(16%
)ap
plica
tion
logi
c(1
4%)
ph
p(1
3%)
2002
applica
tion
logi
c(1
4%)
com
pilat
ion
(14%
)cr
ash
(12%
)SC
SI
(12%
)ss
h(1
2%)
2003
com
pilat
ion
(21%
)ap
plica
tion
logi
c(1
5%)
cras
h(1
1%
)co
nfi
g(9
%)
connec
tion
(9%
)20
04U
I(3
3%)
applica
tion
logi
c(1
3%)
cras
h(1
2%
)co
nfi
g(9
%)
com
pilati
on
(7%
)20
05sq
l(2
8%)
applica
tion
logi
c(1
5%)
cras
h(1
2%
)co
mpilat
ion
(8%
)php
(7%
)20
06ap
plica
tion
logi
c(1
7%)
Spri
ng
(16%
)cr
ash
(15%
)sq
l(9
%)
php
(7%
)20
07cr
ash
(14%
)ap
plica
tion
logi
c(1
3%)
graph
ic(1
3%)
ph
p(1
0%)
connec
tion
(9%
)20
08ap
plica
tion
logi
c(1
6%)
cras
h(1
5%)
com
pon
ent
mgm
t.(1
2%)
UI
(10%
)php
(9%
)20
09cr
ash
(17%
)ap
plica
tion
logi
c(1
4%)
thre
ad
(13%
)U
I(1
1%)
connec
tion
(7%
)20
10cr
ash
(17%
)ap
plica
tion
logi
c(1
6%)
audio
(11%
)ph
p(1
0%)
vid
eo(8
%)
2011
deb
ug
sym
bol
(20%
)cr
ash
(19%
)ap
plica
tion
logi
c(1
4%)
vid
eo(7
%)
php
(7%
)20
12cr
ash
(21%
)ap
plica
tion
logi
c(1
4%)
Hadoop
(12%
)vid
eo(1
1%)
connec
tion
(9%
)20
13cr
ash
(21%
)H
adoop
(21%
)ap
plica
tion
logi
c(1
7%)
vid
eo(8
%)
connec
tion
(7%
)
An
dro
id
2008
inte
nt
(26%
)se
nso
r(2
2%)
UI
(21%
)th
read
handle
r(1
4%)
phon
eca
ll(8
%)
2009
UI
(17%
)phon
eca
ll(1
5%
)th
read
han
dle
r(1
2%)
inte
nt
(10%
)w
ifi(1
0%)
2010
phon
eca
ll(1
8%)
UI
(16%
)th
read
han
dle
r(1
3%)
bat
tery
(9%
)w
ifi(8
%)
2011
thre
adhan
dle
r(1
9%)
UI
(14%
)net
wor
k(1
2%)
phon
eca
ll(1
0%
)re
boot
(9%
)20
12th
read
han
dle
r(1
8%)
map
(16%
)U
I(1
4%)
phon
eca
ll(1
0%
)lo
cale
(9%
)20
13U
I(2
1%)
scal
e(1
7%)
AP
I(1
2%
)p
hon
eca
ll(1
1%
)th
read
han
dle
r(1
1%)
iOS
2007
ebook
(29%
)sc
reen
dis
pla
y(2
9%)
gen
eral
(15%
)U
I(1
3%)
com
pilati
on
(4%
)20
08gen
eral
(30%
)m
ult
imed
ia(2
7%)
scre
end
isp
lay
(19%
)co
mpilat
ion
(4%
)M
yT
ime
(3%
)20
09Sip
hon
(28%
)ge
ner
al(2
6%)
mes
sage
(15%
)sc
reen
dis
pla
y(9
%)
com
pilati
on
(5%
)20
10m
ult
imed
ia(2
2%)
gener
al(1
9%)
graph
plo
t(1
5%)
scre
end
isp
lay
(15%
)co
mpilat
ion
(10%
)20
11SD
K(4
4%)
gener
al(1
9%)
com
pilati
on
(8%
)sc
reen
dis
pla
y(8
%)
gra
ph
plo
t(8
%)
2012
BT
stac
k(3
0%)
gener
al(2
1%)
graph
plo
t(1
6%)
UI
(10%
)sc
reen
dis
pla
y(9
%)
2013
sync
(39%
)co
mpilat
ion
(20%
)gen
eral
(16%
)U
I(7
%)
Wor
dP
ress
(6%
)
Tab
le3.
9:T
op-5
top
ics
inea
chp
latf
orm
per
year
forSampled
dat
ase
t.
53

Label Most representative words
Desktop
crash crash fail call check log process item size expect event statetitl menu point block
application logic messag updat configur link control task access thread direc-tori cach method displai correct command modul
Android
UI android screen applic messag menu button text select optionerror fail wrong mode crash icon
thread handler android app thread log type init intern phone zygot eventhandler window displai looper invok
phone call call phone send account press devic server servic networkmobil stop receiv wait confirm lock
iOS
general phone file call updat crash touch applic support point typemenu post delet upgrad network
screen display screen button displai view click error scroll bar game imagleft load tap keyboard landscap
compilation user run page receiv attach fail error compil mode revisionmap enabl crash devic handl
Table 3.10: Top words associated with major topics.
communication, and “intent” is a predominant topic in 2007 and 2008. The GUI (“UI”),
concurrency (“thread handler”), and telephony (“phone call”) are perennial issues.
For iOS, the GUI (“UI”) and display (“screen display”) are perennial issues, but in
contrast to Android, concurrency and the platform do not appear to pose as much difficulty,
and in later years application bugs take over. However, compilation issues seem to be a
perennial problem as well, whereas for Android they are not. Table 3.10 shows the major
topics and the top keywords within each topic.
54

Platform Rank 1 Rank 2 Rank 3 Rank 4 Rank 5
Desktop site mgmt. style codex error msg. user mgmt.
Android null pointer post error upload fail user mgmt. codex
iOS post error error msg. upload fail landscape codex
Table 3.11: Top-5 topics for WordPress.
3.3.3 Case Study: WordPress
We now focus on studying topic differences in a single app that exists on all three
platforms: WordPress. We chose WordPress as our case study app for two reasons. First, it
is one of the most popular blogging tools, used by 21.5% of all the websites – a content
management system market share of 60.1% [145]. Second, WordPress is a cross-platform
application and mature on all three platforms—desktop, Android and iOS—which reduces
confounding factors (we employed the same strategy in Section 3.2.4).
To study differences across platforms for WordPress, we used the Section 2.4 process
and set the number of topics K to 80. Table 3.11 shows the resulting top-5 topics for each
platform. The power of topic analysis and the contrast between platforms now becomes
apparent. “Post error” and “upload fail” are topics #2/#3 on Android, and #1/#3 on
iOS: these are bugs due to communication errors, since spotty network connectivity is
common on smartphones; “codex” (semantic error) is a hot topic across all platforms,
which is unsurprising and in line with our findings from Section 5.3.2. For desktop, the #1
topic, “site management” is due to desktop-specific plugins and features. Since the Android
version of WordPress is developed in Java, null pointer bugs stand out (“null pointer” is topic
#1 in Android). For iOS, there are many critical bugs when using landscape mode, e.g.
issues #392, #403 and #768.
55

3.3.4 Smartphone-specific Bugs
As mentioned in Chapter 1, smartphone software differs substantially from desktop
software in many regards: app construction, resource constraints, etc. For example, the data
that smartphone software collects from GPS and accelerometer raises significant privacy
concerns that did not exist on the desktop platform. Furthermore, due to device portability,
issues such as performance and energy bugs are significantly more important on smartphone
than on fixed platforms. Understandably, significant research efforts have been dedicated
to smartphone bugs such as location privacy or energy consumption. Hence we aimed to
quantify the prevalence of energy, security, and performance bugs in the topic model.
We found that energy-related bugs (containing keywords such as “power,” “bat-
tery,” “energy,” “drain”) as a topic only ranked high (in top-5) once, in 2010 for Android—
the reason was the release of Android platform version 2.2 (Froyo) in 2010, which contained
a higher number of energy bugs (e.g., Android platform issues #8478, #9307 and #9455).
In all other years, energy did not appear as a topic in top-20.
For security bugs, keywords within the topic included “security,” “vulnerability,”
“permission,” “certificate”, “attack”. We found that, although such bugs are marked with
high severity, their representation among topics was low. We did not find them in top-5
topics; the highest was rank 7 in 2009 and rank 11 in 2010, in Android. For iOS we could
not find security bugs among the top-20 topics.
For performance bugs, associated keywords included “performance,” “slow,” “la-
tency,” “lagging”. We could not find performance-related topics in top-20 on Android or
iOS platform.
56

3.4 Actionable Findings
We now discuss how our findings can help point out potential improvements.
3.4.1 Addressing Android’s Concurrency Issues
Android’s GUI framework is single-threaded and requires the application devel-
oper to manage threads manually, offering no thread-safety guarantees. For example, to
build a responsive UI, long-running operations such as network and disk IO have to be per-
formed in background threads and then the results posted to the UI thread’s event queue;
as a consequence, the happens-before relationship between GUI and other events is not
enforced, leading to concurrency bugs [97]. In contrast, the iOS framework handles con-
currency in a safer manner by using GCD (Grand Central Dispatch) to manage inter-thread
communication; as a result, there are fewer concurrency bugs on iOS.
Hence there is an impetus for (1) improving the Android platform with bet-
ter orchestration of concurrency, (2) improving programing practice, e.g., via the use of
AsyncTask as suggested by Lin et al. [89], and (3) constructing analyses for Android race
detection [97].
3.4.2 Improving Android’s Bug Trackers
Many of the Android projects we have examined (27 out of 38) are hosted on, and
use the bug tracking facilities of, Google Code, in contrast to desktop programs, whose bugs
are hosted on traditional bug trackers such as Bugzilla, JIRA and Trac. On Google Code,
bug tracking is conveniently integrated with the source code repository. However, Google
57

Code’s tracker has no support for: (1) bug component—while easier for new users to file
bugs as there is no need to fill in bug components, the lack of a component makes it harder
for developers to locate the bug; and (2) bug resolution—they use labels instead. These
aspects complicate bug management (triaging, fixing).
Hence there is an impetus for improving bug tracking in Google Code, which will
in turn improve the bug fixing process for the projects it hosts.
3.4.3 Improving the Bug-fixing Process on All Platforms
As Figure 3.2 in Section 3.2 shows, the overlap between bug reporters and bug
owners is higher on desktop projects. This is good for speeding up the bug-fixing process
since usually bug reporters are more familiar with the bugs they report [28]. Smartphone
projects’ development teams should aim to increase this overlap.
According to Sections 3.2.2 and 3.2.3, Android projects have the lowest workload
(highest OwnerFixed rate), and the lowest fix rate as well, which suggests a need for im-
proving developer engagement. The ReporterTurnover rate on Android and iOS is higher
than that of desktop (Figure 3.9a, Section 3.2.2)—this indicates that there are many new
users of smartphone apps, which can potentially increase product quality [22]. Hence desk-
top projects can improve the bug-fixing process by encouraging more users to report issues
in the bug tracking system [164], e.g., via automatic bug reporting [147].
Furthermore, bug reports containing attachments, e.g., stack traces, tend to be
fixed sooner [59,167]. Yet, few Android bug reports have a system trace (logcat) or crash
report attached. Hence the Android bug-fixing process would benefit from automatically
attaching the logcat to the bug report, which is also recommended in previous research [72].
58

3.4.4 Challenges for Projects Migrating to GitHub
For our examined period, we found that many smartphone projects have “mi-
grated” to GitHub: 7 Android projects and 3 iOS projects have fully migrated to GitHub
(source code and bug tracking), while 10 Android projects only moved the source code
repositories to GitHub.1 The rationale was developers’ concern with Google Code’s lack of
features compared to GitHub, e.g., forks and pull requests, source code integration [13,124].
However, the issue tracking system on GitHub lacks several critical features, e.g., severity,
component (instead they only use labels); furthermore, bug reports cannot have attach-
ments; a bug report template is missing as well. Unless GitHub adds those missing bug
management features, the projects will suffer, as it is harder for developers to manage and
ultimately fix the bugs.
3.5 Threats to Validity
We now discuss possible threats to the validity of our study.
3.5.1 Selection Bias
We only chose open source applications for our study, so the findings might not
generalize to closed-source projects. Our chosen projects use one of four trackers (Bugzilla,
Trac, JIRA, Google Code); we did not choose projects hosted on GitHub since several bug
features (e.g., severity) are not available on GitHub, hence our findings might not generalize
to GitHub-hosted projects.
1For details please visit our online supplementary material: http://www.cs.ucr.edu/~bzhou003/cross_platform.html.
59

We studied several cross-platform projects (Chrome, Firefox, WordPress, and VLC) to
control for process. However, we did not control for source code size—differences in source
code size might influence features such as FixTime.
3.5.2 Data Processing
For the topic number parameter K, finding an optimal value is an open research
question. If K is too small, different topics are clustered together, if K is too large, related
topics will appear as disjoint. In our case, we manually read the topics, evaluated whether
the topics are distinct enough, and chose an appropriateK to yield disjoint yet self-contained
topics.
Google Code does not have support for marking bugs as reopened (they show up
as new bugs), whereas the other trackers do have support for it. About 5% of bugs have
been reopened in desktop, and the FixTime for reopened bugs is usually high [130]. This
can result in FixTime values being lower for Google Code-based projects than they would
be if bug reopening tracking was supported.
3.5.3 IDs vs. Individuals
Some projects (especially large ones) have multiple individuals behind a single ID,
as we showed in Section 3.2.2. Conversely, it is possible that a single individual operates
using multiple IDs. This affects the results in cases where we assume one individual per ID.
60

3.6 Summary
We have conducted a study to understand how bugs and bug-fixing processes
differ between desktop and smartphone software projects. A quantitative analysis has re-
vealed that, at a meta level, the smartphone platforms are still maturing, though on certain
bug-fixing measures they fare better than the desktop. By comparing differences due to
platforms, especially within the same project, researchers and practitioners could get in-
sights into improving products and processes. After analyzing bug nature and its evolution,
it appears that most frequent issues differ across platforms.
61

Chapter 4
Empirical Study of Concurrency
Bugs
Our studies (e.g., Section 3.4) have revealed that concurrency is an important
issue on both desktop and mobile platforms. Concurrent programming is challenging, and
concurrency bugs are particularly hard to diagnose and fix for several reasons, e.g., thread
interleaving and shared data complicate reasoning about program state [95], and bugs are
difficult to reproduce due to non-determinism and platform-specific behavior. As a result,
it appears that fixing concurrency bugs takes longer, requires more developers, and involves
more patches, compared to fixing non-concurrency bugs.
To help with finding and fixing concurrency bugs, prior research has mostly focused
on static or dynamic analyses for finding specific classes of bugs. Hence in this chapter, we
present an approach whose focus is understanding the nature of concurrency bugs and the
differences between concurrency and non-concurrency bugs, the differences among various
62

concurrency bug classes, and predicting bug quantity, type, and location, from patches,
bug reports and bug-fix metrics. We use statistics and machine learning as our main tools.
First, we show that bug characteristics and bug-fixing processes vary significantly among
different kinds of concurrency bugs and compared to non-concurrency bugs. Next, we build
a quantitative predictor model to estimate concurrency bugs appearance in future releases.
Then, we build a qualitative predictor that can predict the type of concurrency bug for
a newly-filed bug report. Finally, we build a bug location predictor to indicate the likely
source code location for newly-reported bugs. We validate the effectiveness of our approach
on three popular projects, Mozilla, KDE, and Apache.
4.1 Concurrency Bug Types
We now briefly review the four main types of concurrency bugs, as introduced by
previous research [39,93,95].
Atomicity violations result from a lack of constraints on the interleaving of operations
in a program. Atomicity violation bugs are introduced when programmers assume some
code regions to be atomic, but fail to guarantee the atomicity in their implementation. In
Figure 4.1 we present an example of an atomicity violation, bug #21287 in Apache: accesses
to variable obj in function decrement refcount are not protected by a lock, which causes the obj
to be freed twice.
Order violations involve two or more memory accesses from multiple threads that hap-
pen in an unexpected order, due to absent or incorrect synchronization. An order violation
63

Thread 1 Thread 2
ap r a t om i c d e c (&obj−>r e f c o u n t ) ;
i f ( ! obj−>r e f c o u n t ) {c l e a n u p c a c h e o b j e c t ( ob j ) ;
}
ap r a t om i c d e c (&obj−>r e f c o u n t ) ;i f ( ! obj−>r e f c o u n t ) {
c l e a n u p c a c h e o b j e c t ( ob j ) ;}
Figure 4.1: Atomicity violation bug #21287 in Apache (mod mem cache.c).
Thread 1 Thread 2
nsThread : : I n i t ( . . . ) {. . .
mThread = PR CreateThread (Main, . . . ) ;
. . .
nsThread : : Main ( . . . ) {. . .mState = mThread−>GetSta te ( . . . ) ;. . .
Figure 4.2: Order violation bug #61369 in Mozilla (nsthread.cpp).
example, bug #61369 in Mozilla, is shown in Figure 4.2: nsThread::Main() in Thread 2 can
access mThread’s state before it is initialized (before PR CreateThread in Thread 1 returns).
Data races occur when two different threads access the same memory location, at least
one access is a write, and the accesses are not ordered properly by synchronization.
Deadlocks occur when two or more operations circularly wait for each other to release
acquired resources (e.g., locks).
4.2 Methodology
We now present an overview of the three projects we examined, as well as the
methodology we used for identifying and analyzing concurrency bugs and their bug-fix
process.
64

4.2.1 Projects Examined
We selected three large, popular, open source projects for our study: Mozilla,
KDE and Apache. The Mozilla suite is an open-source web client system implementing a
web browser, an email client, an HTML editor, newsreader, etc. Mozilla contains many
different sub-projects, e.g., the Firefox web browser, and the Thunderbird mail client. In
this chapter, we mainly focus on the core libraries, and the products related to the Firefox
web browser. KDE is a development platform, a graphical desktop, and a set of applications
in diverse categories. Apache is the most widely-used web server; we analyzed the HTTP
server and its supporting library, APR, which provides a set of APIs that map to the
underlying operating system. The evolution time span and source code size are presented
in Table 4.1.
We focus on these three projects for several reasons. First, their long evolution
(more than 10 years), allow us to observe the effect of longer or shorter histories on prediction
accuracy. Second, they are highly concurrent applications with rich semantics, and have
large code bases, hence predicting bug type and location is particularly helpful for finding
and fixing bugs. Finally, given the popularity of their core components that constitute the
object of our study, finding and fixing concurrency bugs is a key priority for these projects.
We believe that these characteristics make our chosen projects representative of some of the
biggest challenges that the software development community faces as complex applications
become more and more concurrent.
65

Pro
ject
Tim
eS
LO
CB
ug
rep
ort
sC
on
cu
rren
cy
Bu
gs
span
Fir
stL
ast
Fix
ed&
Matc
hin
gco
ncu
rren
cyA
tom
icit
yO
rder
Dat
aD
eadlo
ckT
ota
lre
leas
ere
leas
ecl
osed
keyw
ord
svio
lati
onvio
lati
onra
ce
Moz
illa
1998
-201
21,4
59k
4,55
7k11
4,36
71,
149
60
34
10
30134
KD
E19
99-2
012
956k
14,3
30k
118,
868
887
14
13
29
1975
Apac
he
2000
-201
211
0k22
3k22,
370
423
18
810
541
Tota
l2,
459
92
55
49
54
250
Tab
le4.
1:B
ug
rep
orts
and
con
curr
ency
bu
gco
unts
.
66

4.2.2 Identifying Concurrency Bugs
We now describe the process for collecting concurrency bugs and computing the
attributes of their bug-fixing process. All three projects offer public access to their bug
trackers [12, 75, 108]. We first selected the fixed bugs; then we split the fixed bugs into
concurrency and non-concurrency bugs using a set of keywords and cross-information from
the commit logs; finally we categorized the concurrency bugs into the four types. Our
process is similar to previous research [46, 93]. Potential threats to the validity of our
process will be discussed in Section 4.7. The results, explained next, are given in Table 4.1.
Identifying “true” bugs. To identify the viable bug report candidates, we only
considered bugs that have been confirmed and fixed; that is, we only selected bug reports
marked with resolution FIXED and status CLOSED. We did not consider bugs with other
statuses, e.g., UNCONFIRMED and other resolutions (e.g., INVALID, or WONTFIX)—the reason
is that for bugs other than FIXED and CLOSED, the bug reports did not have detailed in-
formation and discussions also in general, they will not contain correct patches. Without
reasonably complete bug reports it would be impossible for us to completely understand
the root cause of the bugs.
We limited the searching process to those parts of the project with a long history
and large source code base. For Mozilla, we only selected 8 products which are directly
related to the core and browser parts: Core, Firefox, Directory, JSS, NSPR, NSS, Plugins,
and Rhino [19]. For Apache, we only chose C/C++ products: the Apache HTTP Server
and the Apache Portable Runtime. For KDE, we considered all products in the KDE
Bugtracking System.
67

Candidate concurrency bug reports. As the 5th column of Table 4.1 shows, there
were more than 250,000 bugs left after the previous step. To make our study feasible, we
automatically filtered bugs that were not likely to be relevant to concurrency by performing
a search process on the bug report database. We retained reports that contained a keyword
from our list of relevant concurrency terms; the list included terms such as “thread”, “syn-
chronization”, “concurrency”, “mutex”, “atomic”, “race”, “deadlock”. Note that similar
keywords were used in the previous research [46,93]. In Table 4.1 (6th column), we show the
number of bug reports that matched these keywords. Many bugs, however, are mislabeled,
as explained shortly. Our keyword-based search for bug reports could have false negatives,
i.e., missing some of the real concurrency bugs (which we identify as a threat to validity in
Section 4.7). However, we believe that a concurrency bug report that did not contain any
of the aforementioned keywords is more likely to be incomplete and much more difficult to
analyze its root cause.
Determining the concurrency bug type. We then manually analyzed the 2,459 bug
reports obtained in the previous step to determine (1) whether they describe an actual
concurrency bug and if yes, (2) what is the concurrency bug type. In addition to the
bug description, some reports also contain execution traces, steps to reproduce, discussion
between the developers about how the bug was triggered, fix strategies, and links to patches.
We used all these pieces of information to determine whether the bug was a concurrency
bug and its type.
For all bugs we identified as concurrency bugs, we analyzed their root cause and fix
strategy, and binned the bug into one of the four types described in Section 4.1. In the end,
68

we found 250 concurrency bugs: 134 in Mozilla, 75 in KDE, and 41 in Apache; the numbers
for each category are presented in the last set of grouped columns of Table 4.1; the Mozilla
and Apache numbers are in line with prior findings by other researchers, though their study
has analyzed bugs up to 2008 [93]. We found that, in Mozilla and Apache, atomicity
violations were the most common, while in KDE, data races were the most frequent.
Note that searching bug reports alone is prone to false positives (incorrectly iden-
tifying a non-concurrency bug as a concurrency bug) and false negatives (missing actual
concurrency bugs) [46]. To reduce the incidence of such errors, we also keyword-searched
the commit logs (e.g., CVS and Mercurial for Mozilla) and then cross-referenced the infor-
mation obtained from the bug tracker with the information obtained from the commit logs.
For instance, Mozilla bug report #47021, did not contain any of the keywords but we found
the keyword race in the commit log associated with the bug, so based on this information
we added it to our set of concurrency bugs to be categorized.
Concurrency bug types and keywords. We found many bug reports that contained
keywords pertaining to other types of bugs. The following table shows the percentage of
bug reports in each category (computed after our manual categorization) containing each
of the four keywords that one would naturally associate with the corresponding bug type.
Percentage of bug reports containing the keywordAtomicity Order Race Deadlock
Keyword bug reports bug reports bug reports bug reports
“atomic” 29.35 14.54 8.16 1.85
“order” 21.74 40.00 16.33 14.81
“race” 70.65 63.64 51.02 7.41
“deadlock” 16.30 16.36 12.24 94.44
Note how 70.65% of the atomicity violation reports contain the keyword “race”,
while only 29.35% contain the keyword “atomic”. In fact, a higher percentage of atomicity
69

violation and order violation bug reports contain the term “race” (70.65% and 63.64%,
respectively) compared to the race bug reports (51.02%). These findings suggest that: (1)
while searching for concurrency bug reports using an exhaustive keyword list followed by
manual analysis has increased our effort, it was essential for accurate characterization, as
many bugs contain misleading keywords, and (2) using approaches that can assign weights
to, and learn associations between, keywords, are likely to be promising in automatically
classifying bug types—we do exactly that in Section 4.5.
4.2.3 Collecting Bug-fix Process Data
To understand the nature of, and differences in, bug-fixing processes associated
with each concurrency bug type, we gathered data on bug features—the time, patches,
developers, files changed, etc., that are involved in fixing the bugs. We now provide details
and definitions of these features.
Patches represents the number of patches required to fix the bug; we extract it
from the bug report. Days represents the time required to fix the bug, computed as the
difference between the date the bug was opened and the date the bug was closed. Files
is the number of files changed in the last successful patch. We extracted the number of
files changed by analyzing the bug report and the commit information from the version
control system. Total patch size indicates the combined size of all patches associated with
a bug fix, in KB. Developers represents the number of people who have submitted patches.
Comments is the number of comments in the bug report. Severity: to capture the impact
that the bug has on the successful execution of the applications, our examined projects use
70

a numerical scale for bug severity. Mozilla uses a 7-point scale1, while KDE and Apache
use 8-point scales. To have a uniform scale, we mapped KDE2 and Apache3 severity levels
onto Mozilla’s.
4.3 Quantitative Analysis of Bug-fixing Features
Prior work has found that fixing strategies (that is, code changes) differ widely
among different classes of concurrency bugs [93]; however, their findings were qualitative,
rather than quantitative. In particular, we would like to be able to answer questions such
as: Which concurrency fixes require changes across multiple files? Do atomicity violation
fixes require more patches to “get it right” compared to deadlock fixes? Which concurrency
bug types take the longest to fix? Are concurrency bugs more severe than non-concurrency
bugs? Do concurrency bugs take longer to fix than non-concurrency bugs?
Therefore, in this section we perform a quantitative assessment of the bug-fix
process for each concurrency bug type, as well as compare concurrency and non-concurrency
bugs, along several dimensions (features). While bug-fixing effort is difficult to measure,
the features we have chosen provide a substantive indication of the developer involvement
associated with each type of bug. Moreover, this assessment is essential for making inroads
into predicting the number of concurrency bugs in the code that are yet to be discovered.
To compare concurrency bugs and non-concurrency bugs, we randomly selected
250 non-concurrency bugs found and fixed in the same product, component, software version
and milestone with the 250 concurrency bugs we found. The reason why we used the same
10=Enhancement, 1=Trivial, 2=Minor, 3=Normal, 4=Major, 5=Critical, 6=Blocker.20=Task, 1=Wishlist, 2=Minor, 3=Normal, 4=Crash, 4=Major, 5=Grave, 6=Critical.30=Enhancement, 1=Trivial, 2=Minor, 3=Normal, 4=Major, 4=Regression, 5=Critical, 6=Blocker.
71

product/component/version/milestone for concurrency and non-concurrency bugs was to
reduce potential confounding factors. We manually validated each non-concurrency bug
and bug report for validity, as we did with concurrency bugs.
4.3.1 Feature Distributions
We now present our findings. For each feature, in Figure 4.3 we show a boxplot
indicating the distribution of its values for each concurrency bug type. Each boxplot repre-
sents the minimum, first quartile, third quartile and maximum values. The black horizontal
bar is the median and the red diamond point is the mean. The second-from-right boxplot
shows the distribution across all concurrency bugs. The rightmost boxplot shows the distri-
bution for non-concurrency bugs. For legibility and to eliminate outliers, we have excluded
the top 5% and bottom 5% when computing and plotting the statistical values. We now
discuss each feature.
Patches are one of the most important characteristics of bug fixing. Intuitively, the
number of patches could be used to evaluate how difficult the bugs are—the more patches
required to “get it right,” the more difficult it was to fix that bug. We found (Figure 4.3)
that atomicity violations take the highest number of patches (usually 2–5, on average 3.5),
while order violations take on average 2.4 patches, followed by races at 1.7 patches and
deadlocks at 1.6 patches. Non-concurrency bugs require on average 1.4 patches.
Days. Predicting the bug-fix time is useful for both concurrency bugs and non-
concurrency bugs, as it helps managers plan the next releases. We found (Figure 4.3) that
the average bug-fix time is longer than 33 days for all 4 types of concurrency bugs, which
72
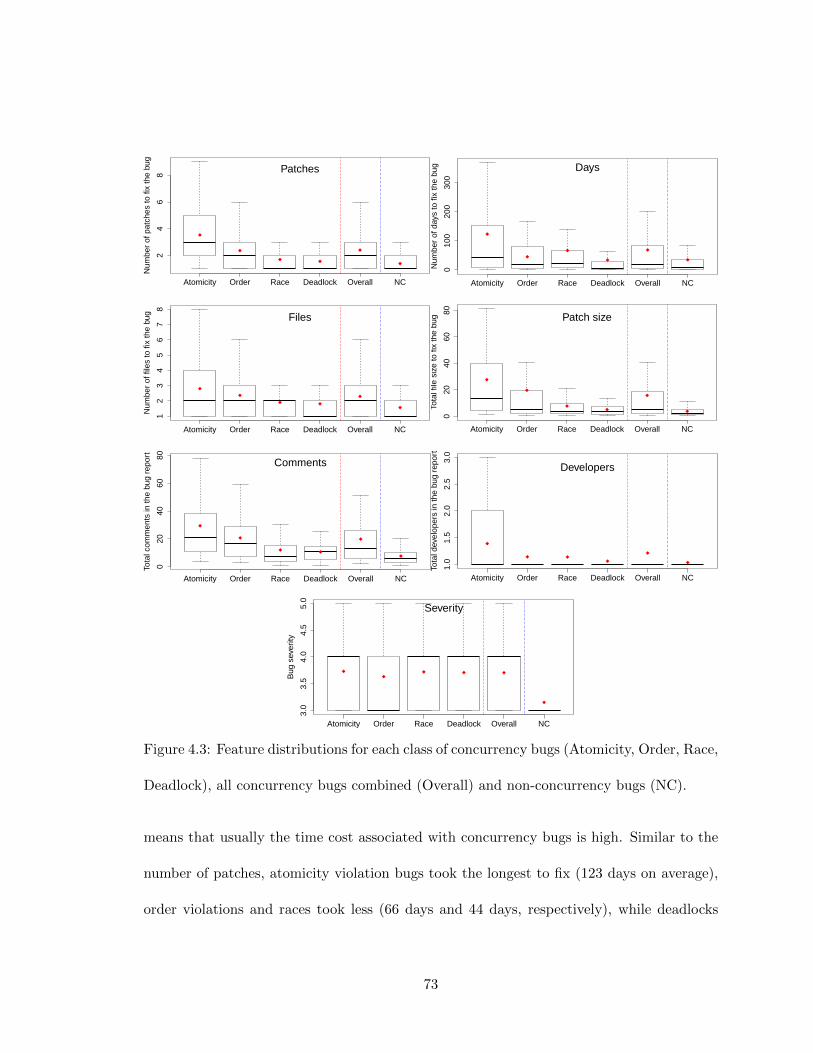
Atomicity Order Race Deadlock Overall NC
24
68
Num
ber
of p
atch
es to
fix
the
bug
Patches
Atomicity Order Race Deadlock Overall NC
010
020
030
0
Num
ber
of d
ays
to fi
x th
e bu
g Days
Atomicity Order Race Deadlock Overall NC
12
34
56
78
Num
ber
of fi
les
to fi
x th
e bu
g Files
Atomicity Order Race Deadlock Overall NC
020
4060
80
Tota
l file
siz
e to
fix
the
bug Patch size
Atomicity Order Race Deadlock Overall NC
020
4060
80
Tota
l com
men
ts in
the
bug
repo
rt
Comments
Atomicity Order Race Deadlock Overall NC
1.0
1.5
2.0
2.5
3.0
Tota
l dev
elop
ers
in th
e bu
g re
port
Developers
Atomicity Order Race Deadlock Overall NC
3.0
3.5
4.0
4.5
5.0
Bug
sev
erity
Severity
Figure 4.3: Feature distributions for each class of concurrency bugs (Atomicity, Order, Race,
Deadlock), all concurrency bugs combined (Overall) and non-concurrency bugs (NC).
means that usually the time cost associated with concurrency bugs is high. Similar to the
number of patches, atomicity violation bugs took the longest to fix (123 days on average),
order violations and races took less (66 days and 44 days, respectively), while deadlocks
73

were fixed the fastest (33.5 days on average). Non-concurrency bugs take on average 34
days to be fixed.
One example of why atomicity bugs take long to resolve is Mozilla bug #225525.
This bug, reported on 2003/11/12, was first identified as a data race and the same day the
developer added a condition check to fix it. However the issue resurfaced on 2006/03/30,
the bug was deemed to actually be an atomicity violation, and after a lengthy fixing process,
was finally marked as FIXED on 2006/08/22. On the other hand, the root cause of Mozilla
#165639 is deadlock, it was got fixed the next day.
Files. This characteristic can be used to estimate the extent of changes and also
the risk associated with making changes in order to fix a bug—the higher the number
of affected files, the more developers and inter-module communications are affected. We
found (Figure 4.3) that bug fixes affect on average 2.8 files for atomicity, 2.4 files for order
violations, 1.9 files for races and 1.8 files for deadlocks. Non-concurrency bugs affect on
average 1.6 files.
Total patch size. The total size of all patches, just like the number of files, can be
used to indicate the risk associated with introducing the bug-fixing changes: if the size of
the patches is large, many modifications have been made to the source code (e.g., pervasive
changes, large-scale restructuring). We found that average concurrency patch sizes tend to
be large, with atomicity (27.6KB) and order violations (19.7KB) far ahead of races (7.7KB)
and deadlocks (5.1KB). Non-concurrency patches are smaller, 3.8KB on average.
Comments. The number of comments in the report can indicate hard-to-find/hard-
to-fix bugs that developers solicit a lot of help with. Examples of such bugs that are hard
74

to reproduce and fix include Mozilla bugs #549767, #153815, #556194, where even after
removing the “mark as duplicate” comments, there are more than 100 comments dedicated
to reproducing and fixing the bug. We found that the average number of comments is again
highest for atomicity violations (29.4) followed by order violations (20.7), races (12.0) and
deadlocks (10.6). The number is much smaller for non-concurrency bugs (7.6).
Developers. The more developers are involved into submitting patches for a bug,
the more difficult it was to find and fix that bug. We found that atomicity fixes involve
on average 1.39 developers while the other bugs involve fewer developers (1.21). Non-
concurrency bugs involve, on average, 1.03 developers.
Severity. Bug severity is important as developers are more concerned with higher
severity bugs which inhibit functionality and use. We found that all types of concurrency
bugs have average severity between 3.6 and 3.7. Since severity level 3 is Normal and level
4 is Major, we can infer that concurrency bugs are higher-priority bugs. Non-concurrency
bugs tend to be lower severity (mean 3.1), which underlines the importance of focusing on
concurrency bugs.
4.3.2 Differences Among Concurrency Bugs
We now set out to answer another one of our initial questions: Are there significant
differences in the bug-fix process among different categories of concurrency bugs?
To answer this question we performed a pairwise comparison across all pairs of
concurrency bug types. For generality and to avoid normality assumptions, we performed
the comparison via a non-parametric test, the Wilcoxon signed-rank test. To avoid type I
errors, we performed a Wilcoxon signed-rank test by applying false discovery rate (FDR)
75

Features Category Order Race Deadlock
Atomicity 0.0116∗ <0.0001∗∗ <0.0001∗∗
Patches Order 0.0168∗ 0.0084∗∗
Race 0.8427
Atomicity 0.0790 0.1728 0.0002∗∗
Days Order 0.6302 0.0790Race 0.0270∗
Atomicity 0.4654 0.1215 0.0868Files Order 0.6378 0.5034
Race 0.7363
Atomicity 0.0079∗∗ <0.0001∗∗ <0.0001∗∗
Patch Order 0.2666 0.0412∗
size Race 0.2814
Atomicity 0.0367∗ <0.0001∗∗ <0.0001∗∗
Comments Order 0.0034∗∗ 0.0063∗∗
Race 0.5370
Atomicity 0.0110∗ 0.0110∗ 0.0005∗∗
Developers Order 0.9690 0.2695Race 0.2695
Atomicity 0.7933 0.7933 0.9228Severity Order 0.7933 0.7933
Race 0.7933
Table 4.2: Wilcoxon Rank Sum and Signed Rank Tests results; p-values were adjusted using
the FDR procedure; ∗∗ indicates significance at p = 0.01 while ∗ at p = 0.05.
procedures [18]. We present the results, obtained after the correction, in Table 4.2. The
starred values indicate significance at p = 0.01 (∗∗) and p = 0.05 (∗), respectively. We found
that atomicity and deadlock tend to be significantly different from the other categories,
while for order and race, it depends on the feature. We also found that bug severity does
not differ significantly among concurrency bug types.
76

4.3.3 Discussion
Concurrency bugs v. non-concurrency bugs. We found significant differences for
all these features between concurrency and non-concurrency bugs. In Figure 4.3, the last
two boxplots in each graph show the distribution of values for that feature for all con-
currency bugs (Overall) and non-concurrency bugs (NC). We found that, compared to
non-concurrency bugs, concurrency bugs involve 72% more patches for a successful fix, take
twice as long to fix, bug-fixes affect 46% more files, require patches that are four times
larger, generate 2.5 times as many comments, involve 17% more developers, and have a
17% higher severity.
For each feature, the differences between concurrency and non-concurrency bugs
are significant (p < 2e−16)); we used Cliff’s delta to compute the effect size measure; the
results indicated significance (effect size Large for all features except severity, where they
were Medium). For brevity, we omit presenting the individual results.
Differences among types. Based on our findings, we infer that (1) concurrency bugs
are usually difficult to find the root cause of and get the correct fix for, and (2) there are
significant differences between different types of concurrency bugs hence these types should
be considered separately. These two points provide the impetus for the work presented in
the remainder of the chapter.
77

4.4 Predicting the Number of Concurrency Bugs
Costs associated with software evolution are high, an estimated 50%–90% of total
software production costs [80,131]. Predicting the number of extant bugs, that will have to
be fixed in upcoming releases, helps managers with release planning and resource allocation,
and in turn can reduce software evolution costs. Therefore, in this section we focus on
predicting the future number of concurrency bugs.
In Section 4.3, we observed relationships between the number of concurrency bugs
and the features we analyzed. Hence, to estimate the likelihood of concurrency bugs in
the project, we naturally turn to using the features as inputs. In this section we focus on
(1) understanding the effect of each feature on each type of concurrency bug, as well as
its prediction power for the number of those concurrency bugs, (2) using the features to
build predictor models and evaluating the accuracy of the models, and (3) understanding
the effect of time and autocorrelation on prediction accuracy. In particular, we explore two
predictors models—one based on multiple linear regression and one based on time series.
Time granularity. There is an accuracy–timeliness trade-off in how long a window we use
for bug prediction. A time frame too short can be susceptible to wild short-term variations
or lack of observations, while too long a time frame will base predictions on stale data.
Therefore, we built several models, with varying time spans, for computing past values of
independent variables and bug numbers. In the first model, named Monthly, we counted
the dependent variable (number of bugs) and independent variables (patches, days, files,
patch size, etc.) at a monthly granularity based on the open date of the bugs, e.g., one
78

observation corresponds to May 2010, the next observation corresponds to June 2010, and
so on. We also tried coarser granularities, 3-months, 6-months, and 12-months, but the
predictions were less accurate (albeit slightly). Therefore, in the remainder of this section,
monthly granularity is assumed.
4.4.1 Generalized Linear Regression
To analyze the relationship between the number of concurrency bugs and each
feature, we built a generalized linear regression model to avoid the normality assumption.
We choose the number of bugs as dependent variable and the features, i.e., patches, days,
files, patch size, comments, developers, and severity, as independent variables.
In Table 4.3 we present the regression results for each type of concurrency bug and
across all concurrency bugs (again, this is using the monthly granularity). For each inde-
pendent variable, we show the regression coefficient and the p-value, that is, the significance
of that variable. We found that not all independent variables contribute meaningfully to the
model. For example, for data race bugs, files, patch size, developers and severity are good
predictors (low p-value), but the other features are not; moreover, the regression coefficients
for files, developers and severity are positive. Intuitively, these results indicate that past
changes to files, high number of developers and high bug severity are correlated with a high
incidence of data race bugs later on; since the coefficient for patch size is negative, it means
that past patches will actually reduce the incidence of data races in upcoming releases. For
atomicity violations and order violations we have similar results. When predicting the num-
ber of all concurrency bugs (last two columns in Table 4.3), we found that three variables
contribute to the model: files, developers and severity.
79

Featu
res
Ato
mic
ity
vio
lati
on
Ord
er
vio
lati
on
Data
race
Dead
lock
All
con
c.
coeffi
cien
tp-v
alu
eco
effici
ent
p-v
alu
eco
effici
ent
p-v
alu
eco
effici
ent
p-v
alu
eco
effici
ent
p-v
alu
e
Pat
ches
0.01
960.
014∗
0.01
970.
094
0.01
710.
173
-0.0
090
0.60
70.
0032
0.70
9
Day
s-0
.000
10.
004∗∗
<0.
0001
0.91
2<
0.00
010.
360
<0.
0001
0.95
0-0
.000
10.
084
Fil
es0.
0147
0.001∗∗
0.03
21<
0.00
1∗∗
0.01
610.
002∗∗
0.03
13<
0.00
1∗∗
0.01
360.
003∗∗
Pat
chsi
ze-0
.001
1<
0.00
1∗∗
-0.0
011
<0.
001∗∗
-0.0
038
<0.
001∗∗
0.00
170.
141
-0.0
004
0.12
2
Com
men
ts-0
.000
60.
176
-0.0
017
0.00
3∗∗
0.00
080.
126
0.00
170.
049∗
-0.0
004
0.35
4
Dev
elop
ers
0.15
17<
0.00
1∗∗
0.20
35¡0
.001∗∗
0.18
47<
0.00
1∗∗
0.20
86<
0.00
1∗∗
0.17
57<
0.00
1∗∗
Sev
erit
y0.
1257
<0.
001∗∗
0.10
55<
0.00
1∗∗
0.11
73<
0.00
1∗∗
0.10
35<
0.00
1∗∗
0.13
31<
0.00
1∗∗
Pse
ud
oR
20.9
388
0.9
572
0.9
701
0.9
653
0.9
165
Tab
le4.
3:R
esu
lts
of
the
gen
erali
zed
regr
essi
onm
od
el;∗∗
ind
icat
essi
gnifi
can
ceatp
=0.
01;∗
ind
icat
essi
gnifi
can
ceatp
=0.
05.
80

HHHHHHBug
Independent variables
category Patches Days Files Patch size Comments Developers Severity
Atomicity X X X X X X XOrder X X X X X XRace X X X X X XDeadlock X X X X X XAll concur. X X X X X X
Table 4.4: Summary of stepwise regression model.
Finally, we used the Cox & Snell pseudo R2 to measure how well the model fits the
actual data—the bigger the R2, the larger the portion of the total variance in the dependent
variable that is explained by the regression model and the better the dependent variable is
explained by the independent variables. We show the results in the last row of Table 4.3;
the results indicate high goodness of fit, 0.91–0.97, which confirms the suitability of using
the model to predict the number of concurrency bugs based on feature values.
Finding parsimonious yet effective predictors. To balance prediction accuracy with
the cost of the approximation and avoid overfitting, we looked for more parsimonious mod-
els that use fewer independent variables. We applied backward stepwise regression, a semi-
automated process of building a model by successively adding or removing independent
variables based on their statistical significance, then computing the Akaike Information
Criterion (AIC) for finding the important variables. Table 4.4 shows the result of stepwise
regression; we use ‘X’ to mark the independent variables that should be used when con-
structing predictor models. For example, for races, we can still get a good prediction when
eliminating the days feature.
81

4.4.2 Times Series-based Prediction
Since our data set is based on time series, and prior work has found bug au-
tocorrelation (temporal bug locality [78]), we decided to investigate the applicability of
time series forecasting techniques for predicting concurrency bugs. In particular, we used
ARIMA (Autoregressive integrated moving average), a widely-used technique in predict-
ing future points in time series data, to build a concurrency bug prediction model. In a
nutshell, given a time series with t observations X1, . . . , Xt and error terms ε1, . . . , εt, an
ARIMA model predicts the value of an output variable Xt+1 at time step t + 1; that is,
Xt+1 = f(X1, . . . , Xt, ε1, . . . , εt). Note that prior values for X, i.e., X1, . . . , Xt are part
of the model, hence the term “autocorrelation”. The quality of the model is measured in
terms of goodness of fit (adjusted R2) and other metrics such as RMSE—the root mean
squared error between the predicted (Xt) and actual (Xt) values.
Concretely, we constructed ARIMA predictor models for each bug class. In each
case X1, . . . , Xt were the number of bugs; ε1, . . . , εt were the values of independent variables
(patches, days, files, etc.); and X1 . . . , Xt were the predicted values; the differences between
Xi and Xi were used when computing the prediction accuracy. For example, if XMay 2010
was the actual number of atomicity bugs in May 2010, then the time series model used
XApril 2010, XMarch 2010, . . ., as lagged (true) values; PatchesApril 2010, PatchesMarch 2010,
. . ., DaysApril 2010, DaysMarch 2010, . . ., FilesApril 2010, F ilesMarch 2010, . . ., etc. as error
terms; and XMay 2010, XApril 2010, . . . as predicted values.
Table 4.5 shows the ARIMA results for each concurrency bug type and each time
granularity; we performed this analysis using the R toolkit. The first column shows the
82

Bug RMSE Adjusted ARIMAcategory R2 parameter
Atomicity 0.3485 0.8626 ARIMA(1,1,1)
Order 0.1947 0.9149 ARIMA(0,0,0)s
Race 0.1832 0.9285 ARIMA(1,0,0)
Deadlock 0.1728 0.9244 ARIMA(2,0,0)s
All conc. 0.5400 0.8965 ARIMA(0,0,0)
Table 4.5: Time series based prediction model result.
concurrency bug type, the second column shows the root mean square error (the lower, the
better); the third column shows the goodness of fit R2; the last column shows the ARIMA
parameter that was automatically chosen by R as best-performing model. ARIMA has
three parameters: (p, d, q) where p is the autoregressive (AR) parameter, d is the number
of differencing passes and q is the moving average (MA) parameter; put simply, p and q
indicate the number of past samples involved in the prediction. For example, for Atomicity,
the best model was ARIMA(1,1,1) meaning it got best results when Xt was computed using
just the prior observation Xt−1 and the prior error term εt−1, and differencing once. The
time series analysis has also found seasonal patterns in the bug time series. Such entries
are marked with a trailing ‘s’, e.g., for Order and Deadlock bugs. In all cases, the season
length was determined to be 12 months—this is not surprising, given that certain projects
follow a fixed release cycle; we leave further investigation of seasonal patterns to future
work. We observed that the RMSE is low for our data sets—the typical difference between
the predicted and actual bug numbers was 0.17–0.54, depending on the bug type. To
illustrate the accuracy of time series-based prediction, in Figure 4.4 we show the predicted
(blue, triangle marks) and actual (red, round marks) time series for the total number of
concurrency bugs each month.
83
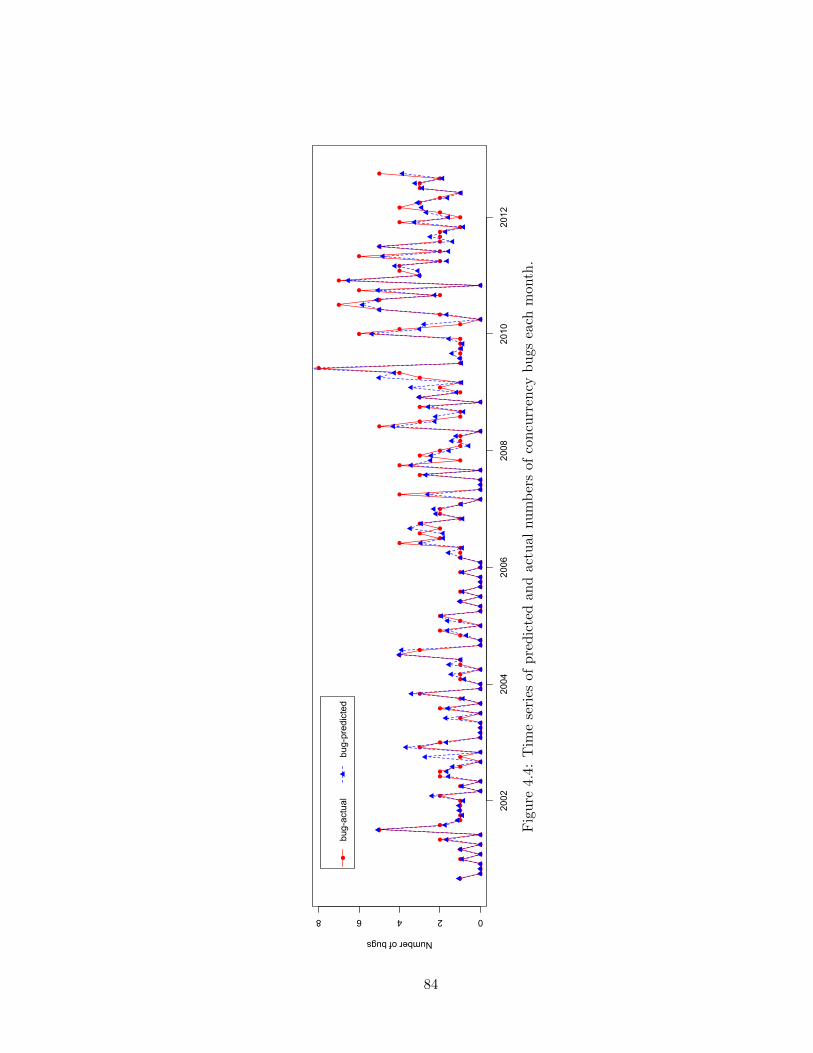
Number of bugs
2002
2004
2006
2008
2010
2012
02468
bug-
actu
albu
g-pr
edic
ted
Fig
ure
4.4
:T
ime
seri
esof
pre
dic
ted
and
actu
alnu
mb
ers
ofco
ncu
rren
cyb
ugs
each
mon
th.
84

Discussion. We now discuss why multiple models are needed. ARIMA is based on au-
tocorrelation, that is, it works well when the current value Xt and the lagged value Xt−l
are not independent. While accurate in helping managers forecast the number of bugs, the
autoregressive nature of ARIMA models in a sense espouses the time locality of concurrency
bugs: if the prior release was buggy, the next release is likely to be buggy, too—in that
case the managers can delay the next release to allow time for finding and fixing the bugs.
However, at the risk of stating the obvious, the managers cannot control the past number of
bugs, but by examining the model and the non-autoregressive features (number of patches,
files, developers, etc.) they can adjust the software process so that future values of the
non-autoregressive features will permit the number of bugs to decrease. It is also up to the
project managers to decide whether a one-month horizon is enough for release planning, or
longer horizons (e.g., 3- or 6-months) would be more suitable.
4.5 Predicting the Type of Concurrency Bugs
When a new bug report has been filed and is examined, determining the nature
of the bug is essential for a wide range of software engineering tasks, from bug triaging to
knowing whom to toss a bug to [68], to finding the root cause and eventually fixing the bug.
In particular for concurrency bugs, the root causes and fixing strategies can vary
widely among bug categories (Section 4.1). Therefore, when a concurrency bug report is
filed, it is essential that the developers determine its category in order to speed up the fixing
process. To support this task, using the categorized bugs reports described in Section 4.3,
we built a predictor model that, given a newly-filed bug report, predicts which type it is:
85

atomicity violation, order violation, deadlock or race. We next describe the approach and
then the results.
4.5.1 Approach
The approach is based on machine learning, i.e., classifiers that use relevant key-
words extracted from bug reports as input features and learn the association between key-
words and specific concurrency bug types based on a Training Data Set (TDS). Next, we
verify the prediction accuracy by presenting the classifier with validation inputs and com-
paring the classifier output with the true output; the set of bug reports used for validation
is called a Validation Data Set (VDS). We now describe the predictor construction process.
Textual data preparation. We applied standard information retrieval techniques to
extract relevant keywords from bug reports: we used Weka to transform bug reports from
the textual description available in the bug tracker into a set of keywords usable by the
classifier4 and build our TDS.
Classifier choice. After preparing the TDS, the next step was to train the classifier and
validate the learned model. We use Weka’s built-in Naıve Bayes, Bayesian Network, C4.5
and Decision Table classifiers in our approach.
Training and validation. As shown in our prior work [20], using a larger dataset for
training bug classifiers does not necessarily yield better results; in fact, training a classifier
4To extract keywords from bug reports, we employed TF-IDF, stemming, stop-word and non-alphabeticword removal [101], using Weka’s StringtoWordVector class.
86

Training Validation Classifierset set Naıve Bayesian C4.5 Decision
Bayes Net Table
Mozilla 39.39 63.64 45.45 60.61All KDE 37.50 56.25 56.25 31.25
All projects 38.00 60.00 48.00 50.00
Mozilla 50.00 60.00 40.00 63.332004+ KDE 63.64 72.73 36.36 72.73
All projects 52.38 61.90 38.10 66.67
Mozilla Mozilla 60.00 65.00 55.00 50.00
KDE KDE 46.67 60.00 60.00 53.33
Apache Apache 57.14 71.43 71.43 71.43
Table 4.6: Accuracy of bug category prediction (%); highest accuracy indicated in bold.
with old samples can decrease prediction accuracy as the classifier is trained with stale
input-output pairs that do not match the current project state.
To quantify the effect of recent vs. old training samples, we constructed two
bug training/validation sets: one set, referred to as All, contained all the concurrency bug
reports since project inception (that is 1998–2012 for Mozilla, 1999–2012 for KDE, and
2000–2012 for Apache); the other set, referred to as 2004+, contained only more recent
samples, i.e., bug reports from 2004–2012 for each project. We chose threshold 2004 as a
trade-off between still having a significant history yet eliminate the initial evolution period.
In both cases, the TDS/VDS split was 80%/20%, as follows. To construct the VDS,
we sorted the bug reports in the 2004+ dataset chronologically. For the 2004+ scenario,
we set aside the most recent 20% as the VDS. For the All scenario, to preserve the 80/20
proportion, we kept the same VDS but from the TDS we discarded a random set so that
the TDS size for All was the same as for 2004+.
87
4.5.2 Results
Table 4.6 shows each classifier’s accuracy. The first column indicates the training
set we used, while the second column indicates the validation set. The rest of the columns
show the prediction accuracy, in percents, using different classifiers. We highlight the best
results in bold; in a nutshell, Bayesian Net performs best (as it is usable across the board).
The first set of rows shows the results when the All training set was used, that is
bug reports selected from all projects across the entire time span. In the second column
we show the VDS used: bugs from Mozilla, KDE, or from all three projects (we did not
perform this validation for Apache due to its low representation in the VDS). We found that
the best classifier was Bayesian Net, which attained 56.25%–63.64% prediction accuracy in
identifying the concurrency bug type.
The second set of rows shows the results when the 2004+ (recent history) training
set was used. We found that the best classifier was Decision Table, which attained 63.33%–
72.73% prediction accuracy in identifying the concurrency bug type. We consider a predictor
with this level of accuracy to be potentially very useful to developers. Also, the deleterious
effect of “stale” training samples is readily apparent, as all classifiers except C4.5 perform
better on this more recent data set, 2004+, than on the All data set.
In the last three rows we show the results obtained by using project-specific TD-
S/VDS sets. We used the complete-history data set for Mozilla and Apache; in KDE we
could not find any concurrency bugs prior to 2004. We found that Bayesian Net performs
best for Mozilla (65%), Bayesian Net and C4.5 perform best for KDE (60%), while for
Apache, Bayesian Net, C4.5 and Decision Table are tied, with 71.43%.
88

Training Bug Evaluation measure/Validation set category precision recall F-measure
Atomicity 0.647 0.524 0.579All Order 0.600 0.429 0.500/All projects Race 0.429 0.750 0.545
Deadlock 0.778 1.000 0.875
Atomicity 0.625 0.625 0.6252004+ Order 0.571 0.333 0.421/All projects Race 0.545 0.750 0.632
Deadlock 0.750 1.000 0.857
Table 4.7: Detailed result of the Bayesian Net classifier.
Overall the Bayesian Net classifier had the best performance in most cases (7 out
of 9). Hence in Table 4.7 we show the precision, recall and F-measure attained with this
classifier. We found that deadlock bugs have the highest precision, recall and F-measure
value since they are quite different from the other three classes. Order violation has the
lowest precision, recall and F-measure value. Upon manual inspection, we found that in
several cases order bugs were classified as data races (the nature of order and race bugs
makes them difficult to distinguish in certain cases). For instance, KDE bug #301166 was
classified as data race due to the keywords “thread” and “asynchronously”, but it could be
considered both an order violation and data race bug.
Observations. These results reveal several aspects. First, for a new project we recom-
mend that project managers choose Bayesian Net as classifier, since it has performed best
in most cases. Second, recent training sets achieve the highest accuracy (compare 2004+
with All) when using the right classifier—Decision Table in our case. Third, a large, cross-
project training dataset can yield better results than per-project training sets—compare
KDE trained on 2004+ with KDE trained on its own data sets; this might be due to lower
89

Mozilla KDE Apache All projects
deadlock deadlock between deadlock
moztrap cef mac warhammer
structure synchron crash concur
race concur import first
network hang got atom
spin order id network
xpcom callback call race
semaphore backport determine spin
gclevel manage intern lock
runtime cur subsequ backgroundparser
Table 4.8: Strongest prediction keywords.
bug report quality in KDE. This might be promising for predicting bugs in a new project
for which we have no large concurrency bug sets; we leave this to future work.
What do classifiers learn? To gain insight into how classifiers learn to distinguish
among bug types, we extracted the 10 “strongest” nodes, i.e., with the highest conditional
probability in the trained Bayesian Nets, on the data sets used in the last four rows of
Table 4.6 (that is, each project trained on its own bug reports and an all-projects VDS
trained on the 2004+ TDS). Table 4.8 lists the keywords in these nodes, in the order of
strength. We found that, in addition to textual keywords (e.g., “deadlock”, “race”, “spin”,
“hang”), the network has learned to use names of program classes, variables and functions
(e.g., “gclevel”, “cef”, “cur”, “backgroundparser”). We believe that the high prediction
power of these program identifiers could be a useful starting points for static analysis, an
investigation we leave to future work. Interestingly, another high-probability node was the
developer ID of a frequent Mozilla contributor (“warhammer” in the last column).
Note that we have built our classifier assuming the input is a concurrency bug
report. However, as future bug reports will not be subject to our manual analysis to decide
90

whether they are concurrency or non-concurrency (our goal is to avoid manual intervention)
we will not have ground truth on whether they represent a concurrency or a non-concurrency
bug. To solve this, we have built a high-accuracy (90%) “pre-classifier” that triages bug
reports into concurrency and non-concurrency. For brevity, we leave out details of this
classifier. Since the proportion of concurrency bugs is small compared to other bugs, we
would still have some false positives to manually eliminate among the classified bug reports,
but the workload is reduced greatly thanks to the pre-classifier.
4.6 Predicting Concurrency Bugs’ Location
The previous section showed one useful step for finding and fixing a bug: predicting
its type. It is also useful to figure out where, in the source code, the new bug is likely to be
located; hence in this section we present our approach for predicting the likely location of
a concurrency bug.
4.6.1 Approach
We used a classifier that takes a bug report as input and produces a set of source
code paths as output. More specifically, the classifier’s output is a vector of binary values,
and each position in this vector corresponds to a source code path. For example, consider
three bugs #1, #2, and #3, such that #1’s location was code path /foo/, #2’s location was
path /bar/, and #3 has affected both code paths /bar/ and /baz/. Suppose the order in the
output vector is (/foo/, /bar/, /baz/). Then the correct classifier output for bug #1 would be
(1,0,0); for bug #2 it would be (0,1,0); and for bug #3 it would be (0,1,1).
91

4.6.2 Results
The training process is similar to the one used in the prior section, that is, we used
80% of the bug set for training and 20% for validation. Measuring prediction accuracy is
slightly more convoluted, because a bug can affect multiple files, and we are interested in
predicting a Top-k of most likely locations, rather than a single location.
We now explain how we compute Top-k accuracy when a single bug spans multiple
code paths. For each bug i in the VDS, assuming the bug has affected j paths, we have a
list of true source code paths {tpathi1, . . . , tpathij} (each unique path is called a “class”;
we employed Mulan [142] for this part). We present the bug report i to our classifier,
which returns a list of m likely output paths {opathi1, . . . , opathim}. More specifically,
for each validation input, Mulan returns as output a vector of real numbers indicating
the probability of the sample belonging to each class; probabilities under a threshold are
replaced with 0. Next, from the set {opathi1, . . . , opathim} we select the highest-ranked k
output paths, in order of probability, i.e., a subset {opathi1, . . . , opathik}. Then, we check
if the set {tpathi1, . . . , tpathij} is a subset of {opathi1, . . . , opathik}. Finally, we compute
Top-k accuracy: for Top-1 accuracy, we count a hit if the probability value assigned to the
true path class is the highest-ranked in output vector; for bugs affecting multiple files, say
2, if the 2 highest probabilities correspond to the true path classes, and so on. To compute
Top-10% accuracy, we check whether the bug location(s) is(are) in the Top-10% highest
output class probabilities; similarly for Top-20%.
In Table 4.9 we present the results. In the first column we show the project, and
in the columns 2–4 we present the attained accuracy for each of the three metrics. The last
92

Project Accuracy (%) ClassifierTop-1 Top-10% Top-20%
Mozilla 31.82 50.00 59.09 Decision Table
KDE 25.00 50.00 56.25 Naıve Bayes
Apache 22.22 44.44 55.56 Bayesian Net
All projects 26.09 47.83 52.17 Naıve Bayes
Table 4.9: Source path prediction results.
column shows the classifier used to achieve that accuracy (we only present the best results
across the four classifiers).
We achieve 22.22%–31.82% Top-1 accuracy, depending on the project (column
2). We consider this to be potentially very useful for locating bugs, because it means the
developer is presented with the exact bug location in 22.22%–31.82% of the cases, depending
on the project (we had 45 path locations for Mozilla, 47 for KDE and 19 for Apache). When
measuring Top-10% accuracy, the accuracy increases to 44.44%–50%. When measuring
Top-20% accuracy, we obtained higher values, 55.26%–59.09%, which is expected. That is,
in more than half the cases, the bug location is in the Top-20% results returned by the
classifier. Since all our projects have large code bases, narrowing down the possible bug
location can considerably reduce bug-fixing time and effort.
On a qualitative note, we found that certain locations are more prone to concur-
rency bugs: Mozilla had 6 bugs in files under /mozilla/netwerk/cache/src and 4 bugs files under
/mozilla/xpcom/base, whereas KDE had 6 bugs in /KDE/extragear/graphics/digikam/libs. Our method
can guide developers to these likely bug-prone locations after receiving a bug report to help
speed up bug finding and fixing.
93

4.7 Threats to Validity
4.7.1 Selection Bias
We have chosen three projects for our study. These projects are mostly written
in C/C++ and are, we believe, representative for browsers, desktop GUI, and server pro-
grams that use concurrency. However, other projects, e.g., operating systems, database
applications or applications developed in other programming language (Java), might have
different concurrency bug characteristics. For example, prior efforts [46, 93] have found
that deadlocks in MySQL represent 40% of the total number of concurrency bugs, whereas
for our projects, deadlocks account for 22% (Mozilla), 25% (KDE), and 12% (Apache) of
concurrency bugs. Nevertheless, for atomicity violation and order violation, our results are
similar to prior findings [93].
4.7.2 Data Processing
Our keyword-based search for bug reports could have missed some concurrency
bugs—a weakness we share with other prior studies [46, 93]. However, a concurrency bug
report that did not contain any keywords on our list is more likely to be incomplete and
more difficult to analyze its root cause. To reduce this threat, we used an extensive list
of concurrency-related keywords, and searched both the bug tracker and the commit logs.
Completely eliminating this threat is impractical, as it would involve manual analysis (which
itself is prone to errors) for more than 250,000 bug reports.
94

4.7.3 Unfixed and Unreported Bugs
Some concurrency bugs might go unfixed or unreported because they strike infre-
quently, on certain platforms/software configurations only, and are hard to reproduce. It
would be interesting to consider these kinds of bugs, but they are not likely to have detailed
discussions and they will not have patches. As a result, these bugs are not considered as
important as the reported and fixed concurrency bugs that are used in our study.
4.7.4 Short Histories
When relying solely on machine learning and statistics for training, our approach
works better for projects with larger training data sets—this could be problematic for
projects with short histories or low incidence of concurrency bugs, though cross-project
prediction could be useful in that case, as we have shown.
4.7.5 Bug Classification
We used four categories and manual categorization for concurrency bugs. We
excluded bugs which did not have enough information to be categorized. This can lead
to missing some concurrency bugs, as discussed previously. As a matter of fact, some
concurrency bugs may belong to multiple categories, e.g., an order violation could also be
considered a data race.
95

4.8 Summary
We have performed a study of concurrency bugs in three large, long-lived, open
source projects. We have found that concurrency bugs are significantly more complicated,
taking more time and resources to fix, than non-concurrency bugs. We have also found
that concurrency bugs fall into four main categories (atomicity violations, order violations,
races, and deadlocks) and that among these categories, deadlocks are easiest, while atom-
icity violations are hardest to fix. We have shown that effective forecast methods can be
constructed to help managers and developers predict the number of concurrency bugs in
upcoming releases, as well as the bug type and location for new concurrency bug reports.
96

Chapter 5
Bug Analysis Across Severity
Classes
Severity is important for effort planning and resource allocation during the bug-
fixing process; we illustrate this with several examples. First, while our intuition says that
bugs with different severity levels need to be treated differently, for planning purposes we
need to know how bug severity influences bug characteristics, e.g., fix time or developer
workload. Second, assigning the wrong severity to a bug will lead to resource mis-allocation
and wasting time and effort; a project where bugs are routinely assigned the wrong severity
level might have a flawed bug triaging process. Third, if high-severity bugs tend to have a
common cause, e.g., concurrency, that suggests more time and effort needs to be allocated
to preventing those specific issues (in this case concurrency). Hence understanding bug
severity can make development and maintenance more efficient. Most of the prior work on
bug severity has focused on severity prediction [83,84,105,141]; there has been no research
97

on how severity is assigned and how it changes, on how bugs of different severities differ
in terms of characteristics (e.g., in fix time, developer activity, and developer profiles), and
on the topics associated with different classes of severity. To this end, in this chapter we
perform a thorough study of severity in a large corpus of bugs on two platforms, desktop
and Android. To the best of our knowledge, we are the first to investigate differences in
bug characteristics based on different severity classes.
Our study is based upon 72 open source projects (34 on desktop and 38 on Android)
comprising of 441,162 fixed bug reports. The study has two thrusts, centered around nine
research questions, RQ1–RQ9. First, a quantitative thrust (Section 5.2) where we study
how severity assigned to a bug might change; next, we compare the three severity classes in
terms of attributes associated with bug reports and the bug-fixing process, how developer
profiles differ between high, medium and low severity bugs, etc. Second, a topic thrust
(Section 5.3) where we apply LDA (Latent Dirichlet Allocation [25]) to extract topics from
bug reports and gain insights into the nature of bugs, how bug categories differ among bug
severity classes, and how these categories change over time.
Since our study reveals that bug-fixing process attributes and developer traits differ
across severity levels, our work confirms the importance of prior work that has focused on
accurately predicting bug severity [84,105,141].
5.1 Methodology
We now present an overview of the projects we examined, as well as the method-
ology we used to extract the bug features and topics.
98

5.1.1 Examined Projects
We choose the projects mentioned in Chapter 2.1 for our study. Tables 5.1 and 5.2
show a summary of the projects we examined. For each platform, we show the project name,
the number of fixed bugs, the percentage of bugs in each severity class (High, Medium, and
Low), the percentage of bugs that had severity changes, and finally, the time span, i.e., the
dates of the first and last bugs we considered.
5.1.2 Severity Classes
Since severity levels differ among bug tracking systems, we mapped severity from
different trackers to a uniform 10-point scale, as follows: 1=Enhancement, 2=Trivial/Tweak,
5=Minor/Low/Small, 6=Normal/Medium, 8=Major/High, 9=Critical/Crash, 10=Blocker.
Then we classified all bug reports into three classes, High, with severity level ≥ 8, Medium,
with severity level=6, and Low, with severity level ≤ 5. This classification is based on
previous research [83,84]; we now describe each category.
– High severity bugs represent issues that are genuine show-stoppers, e.g., crashes, data
corruption, privacy leaks.
– Medium severity bugs refer to issues such as application logic issues or occasional crashes.
– Low severity bugs usually refer to either nuisances or requests for improvement.
5.1.3 Quantitative Analysis
To find quantitative differences in bug-fixing processes we performed an analysis on
various features (attributes) of the bug-fixing process, e.g., fix time, as defined in Chapter 2.
99

Desktop
Project Fixed Severity(%) Time spanbugs Hi Med Low Change
Mozilla Core 101,647 20 73 7 8 2/98-12/13
OpenOffice 48,067 14 73 13 1 10/00-12/13
Gnome Core 42,867 13 71 17 8 10/01-12/13
Eclipse platform 42,401 15 71 14 10 2/99-12/13
Eclipse JDT 22,775 11 71 18 10 10/01-12/13
Firefox 19,312 9 79 12 6 4/98-12/13
SeaMonkey 18,831 21 64 14 13 4/01-12/13
Konqueror 15,990 18 72 10 3 4/00-12/13
Eclipse CDT 10,168 12 74 14 10 1/02-12/13
WordPress 9,995 14 67 19 8 6/04-12/13
KMail 8,324 15 57 27 4 11/02-12/13
Linux Kernel 7,535 18 76 5 3 3/99-12/13
Thunder-bird 5,684 14 69 17 7 4/00-12/13
Amarok 5,400 20 58 22 6 11/03-12/13
Plasma Desktop 5,294 24 62 14 6 7/02-12/13
Mylyn 5,050 8 50 41 11 10/05-12/13
Spring 4,937 63 0 37 NA 8/00-12/13
Tomcat 4,826 21 55 24 9 11/03-12/13
MantisBT 4,141 26 0 74 2 2/01-12/13
Hadoop 4,077 82 0 18 NA 10/05-12/13
VLC 3,892 19 72 9 8 5/05-12/13
Kdevelop 3,572 24 57 19 5 8/99-12/13
Kate 3,326 15 61 24 5 1/00-12/13
Lucene 3,035 65 0 35 NA 4/02-12/13
Kopete 2,957 18 60 22 8 10/01-9/13
Hibernate 2,737 80 0 20 NA 10/00-12/13
Ant 2,612 14 47 39 9 4/03-12/13
Apache Cassandra 2,463 54 0 46 NA 8/04-12/13
digikam 2,400 20 56 25 5 3/02-12/13
Apache httpd 2,334 21 52 27 9 2/03-10/13
Dolphin 2,161 32 51 17 5 6/02-12/13
K3b 1,380 18 70 13 8 4/04-11/13
Apache Maven 1,332 85 0 15 NA 10/01-12/13
Portable OpenSSH 1,061 11 57 31 5 3/09-12/13
Total 422,583 20 69 11 7
Table 5.1: Projects examined, number of fixed bugs, severity classes percentage, severity
level change percentage and time span on desktop.
100

Android
Project Fixed Severity(%) Time spanbugs Hi Med Low Change
Android Platform 3,497 1 97 2 1 11/07-12/13
Firefox for Android 4,489 12 86 2 4 9/08-12/13
K-9 Mail 1,200 4 94 2 4 6/10-12/13
Chrome for Android 1,601 2 79 19 14 10/08-12/13
OsmAnd Maps 1,018 2 97 1 8 1/12-12/13
AnkiDroid Flashcards 746 41 48 10 50 7/09-12/13
CSipSimple 604 5 92 3 7 4/10-12/13
My Tracks 525 11 87 2 5 5/10-12/13
Cyanogen-Mod 432 1 99 0 1 9/10-1/13
Andro-minion 346 2 92 5 3 9/11-11/13
WordPress for Android 317 78 0 22 0 9/09-9/13
Sipdroid 300 0 100 0 0 4/09-4/13
AnySoft-Keyboard 229 41 59 0 32 5/09-5/12
libphone-number 219 4 95 1 4 10/10-12/13
ZXing 218 6 62 32 13 11/07-12/13
SL4A 204 0 100 0 0 5/09-5/12
WebSMS-Droid 197 44 52 4 46 10/09-12/13
OpenIntents 188 28 61 10 5 12/07-6/12
IMSDroid 183 1 99 0 1 6/10-3/13
Wikimedia Mobile 166 15 37 48 8 1/09-9/12
OSMdroid 166 1 96 3 4 2/09-12/13
WebKit 157 1 98 1 0 11/09-3/13
XBMC Remote 129 37 58 5 33 9/09-11/11
Mapsforge 127 23 73 4 NA 2/09-12/13
libgdx 126 0 100 0 0 5/10-12/13
WiFi Tether 125 2 96 2 3 11/09-7/13
Call Meter NG&3G 116 47 52 1 46 2/10-11/13
GAOSP 114 6 89 5 11 2/09-5/11
Open GPS Tracker 114 30 68 2 12 7/11-9/12
CM7 Atrix 103 0 95 5 5 3/11-5/12
Transdroid 103 23 73 4 22 4/09-10/13
MiniCM 101 0 100 0 4 4/10-5/12
Connectbot 87 3 94 2 6 4/08-6/12
Synodroid 86 29 63 8 20 4/10-1/13
Shuffle 77 9 87 4 9 10/08-7/12
Eyes-Free 69 7 91 1 9 6/09-12/13
Omnidroid 61 22 68 10 20 10/09-8/10
VLC for Android 39 17 81 3 8 5/12-12/13
Total 18,579 10 85 5 8
Table 5.2: Projects examined, number of fixed bugs, severity classes percentage, severity
level change percentage and time span on Android.
101

5.1.4 Topic Analysis
For the second thrust of our study, we used a topic analysis to understand the
nature of the bugs by extracting topics from bug reports. We follow the process mentioned
in Section 2.4. The parameter settings are presented in Section 5.3.1.
5.2 Quantitative Analysis
The first thrust of our study takes a quantitative approach to investigating the
similarities and differences between bug-fixing processes on severity classes. Specifically,
we are interested in how bug-fixing process attributes differ across severity classes on each
platform; how the contributor sets (bug reporters and bug owners) differ across classes; and
how the contributor profiles vary over time.
The quantitative thrust is centered around several specific research questions:
RQ1 Does the severity level change and if so, how does it change?
RQ2 Are bugs in one severity class fixed faster than in other classes?
RQ3 Do bug reports in one severity class have longer descriptions than in other classes?
RQ4 Are bugs in one severity class more commented upon than in other classes?
RQ5 Do bugs in one severity class have larger comment sizes than other classes?
RQ6 How do severity classes differ in terms of bug owners, bug reporters, and owner or
reporter workload?
102

RQ7 Are developers involved in handling one severity class more experienced than devel-
opers handling other classes?
5.2.1 Severity Change
As mentioned in the beginning of this chapter, bug severity is not always fixed for
the lifetime of a bug—after the initial assignment by the bug reporter, the severity can be
changed, e.g., by the developers: it can be changed upwards, to a higher value, when it
is discovered that the issue was more serious than initially thought, or it can be changed
downwards, when the issue is deemed less important that thought initially. In either case,
the result is that not enough resources (or too many resources, respectively) are allocated to
a bug, which not only makes the process inefficient, but it affects users negatively, especially
in the former case, as it prolongs bug-fixing. Hence severity changes should be avoided, or
at least minimized. We now quantify the frequency and nature of severity changes.
We show the percentage of bugs that have at least one change in severity in the
6th columns of Table 5.1 and Table 5.2, respectively. The overall change rates are less
than 10% for both desktop and Android. For desktop, severity change is not available for
projects hosted on JIRA; we marked these as ‘NA’ in the table. The low change rates in
both platforms indicate that bug reporters are accurate in assessing severity when a bug
is reported. Still, for Android, the change rate is higher in some projects, e.g., AnkiDroid
and WebSMS. We investigated the reasons for high change rates in AnkiDroid (50%) and
WebSMS (46%) and found that it was apparently due to a project-specific configuration—
large numbers of bugs being filed with severity initially set to ‘undecided’. In the next step,
we will shed light on the nature of severity changes.
103

We found that, for those bug reports that did change severity, 89.40% of desktop
bugs and 98.63% of Android bugs have changed severity once; 8.6% of desktop bugs and
1.11% of Android bugs changed severity twice; finally, only 2% of desktop bugs and 0.26%
of Android bugs have more than 3 severity changes. Repeated severity changes naturally
lead to higher bug-fixing effort and longer fix times. For example, Firefox bug #250818
changed severity level 13 times, the highest number of severity changes of all the bugs. It
took developers 329 days to finally fix this bug. Next, we are going to show how severity
changes.
We show the top-5 most common severity change patterns in Table 5.3.1 We
found that ‘Normal→Major’ and ‘Medium→High’ are the most common severity changes for
desktop and Android, respectively. We also found the common pattern ‘Undecided→High’
on Android platform. These patterns indicate that bug reporters tend to underestimate
bug severity more than they overestimate it. For instance, Mozilla Core bug #777005 was
assigned Normal severity initially, but the severity level increased from Normal to Critical,
and eventually further increased to Blocker, which indicates the bug had to be fixed as soon
as possible. The pattern ‘Undecided →High’ only exists on Android since issue tracking
systems on desktop have Normal as default severity level.
RQ1: Less than 10% of bugs change severity on both desktop and Android; in
those cases where severity does change, it tends to only change once. Normal→Medium and
Major→High are the most common change patterns on desktop and Android, respectively.
1We only used the 10-point scale in Table 5.3 since the 3-category scale would be too coarse-grained. Therest of the study uses only the 3-category scale.
104

Rank Desktop Android
1 Normal→Major (18.2%) Medium→high (33.5%)
2 Normal→Critical (16.3%) Medium→Low (13.2%)
3 Normal→Enhancement (13.1%) Medium→Critical (12.7%)
4 Normal→Minor (8.3%) Undecided→High (8.9%)
5 Normal→Blocker (3.9%) Undecided→Normal (5.5%)
Table 5.3: Top 5 severity change patterns.
5.2.2 Bug-fix Process Attributes
We now proceed with the quantitative analysis of bug characteristics and bug-
fixing process features. Rather than presenting aggregate values across the entire time
span, we analyze the evolution of values on each platform, at yearly granularity, for two
main reasons: (1) as feature values change over time, changes would not be visible when
looked at in aggregate, and (2) we want to study the trends of severity classes. The evolution
graphs, presented in Figures 5.1 through 5.8, will be discussed at length.
Data preprocessing. For each feature, e.g., FixTime, we compute the geometric
mean for feature values in each year. Since the distributions are skewed, arithmetic mean
is not an appropriate measure [88], and we therefore used the geometric mean in our study.
Moreover, to avoid undue influence by outliers, we have excluded the top 5% and bottom
5% when computing and plotting the statistical values.
Pairwise tests between classes. To test whether the differences in bug characteris-
tics between classes are significant, we performed a non-parametric Mann-Whitney U test
(aka Wilcoxon rank sum test) for each year, for each platform comparing the distributions
of each attribute, e.g., FixTime for high vs medium severity, high vs. low severity, and
medium vs. low severity. For brevity, when we discuss the results of the pairwise tests, we
105

only provide summaries, e.g., the year, platform, and class pair for which differences are
significant.
FixTime. Figures 5.1a–5.1c show how the bug fixing time has changed over the years
for each severity class on desktop and Android. Since the values after 2007 on desktop are
much smaller than those pre-2007, we provide a zoom-in of FixTime for years 2007 to 2013
in Figure 5.1b. We make several observations regarding FixTime.
We found that in addition to severity, priority also affects FixTime. However,
not all bug reports have an associated priority, as not all bug trackers support it: for our
datasets, 67.68% of desktop bugs have an associated priority while only 6.44 of Android
bugs do (Google Code does not support priority). We first provide several examples of how
priority and severity can influence FixTime; later we will show the results of a statistical
analysis indicating that severity influences FixTime more than priority does:
• High Severity & High Priority: major functionality failure or crash in the basic work-
flow of software. These bugs usually took less time to fix since they have huge and
deleterious effects on software usage. For instance, Mozilla Core bug #474866, which
caused plugins to fail upon the second visit to a website, is a P1 blocker bug; it took
developers just two days to fix it.
• High Severity & Low Priority: the application crashes or generates an error message,
but the cause is a very specific situation, or a hard-to-reproduce circumstance. Usually
developers need more time to fix these kind of bugs. For example, Mozilla Core bug
106

020
040
060
080
010
0012
00
1998 1999 2000 2001 2002 2003 2004 2005 2006 2007 2008 2009 2010 2011 2012 2013
highmediumlow
FixTime for Desktop
(a)
1020
3040
50
2007 2008 2009 2010 2011 2012 2013
highmediumlow
FixTime for Desktop after 2007
(b)
050
100
150
2008 2009 2010 2011 2012 2013
highmediumlow
FixTime for Android
(c)
Figure 5.1: FixTime distribution per year; units are defined in Section 5.1.3.
107

Features Desktop Androidcoefficient p-value coefficient p-value
Severity -95.850 < 2e-16 -20.892 6.44e-13
Priority 4.162 0.108 -14.891 0.00109
Table 5.4: Results of the generalized regression model.
92322 had severity Blocker (highest) but priority P5 (lowest). The bug took 2 months
to fix because it required adding functionality for an obscure platform (at the time).
• Low Severity & High Priority: this characterizes bugs such as a typo in the UI, that
do not impact functionality, but can upset or confuse users, so developers try to fix
these bugs quickly. For instance, Eclipse JDT bug #13141, whose severity is trivial,
had priority P1 since it was a typo in the UI; it was fixed in one day.
• Low Severity & Low Priority: bugs in this class comprise nuisances such as mis-
spellings or cosmetic problems in documents or configuration files. Developers would
fix these bugs when the workload is low. For example, Apache httpd bug #43269, a
typo in the server error message with trivial severity and P5 priority, took more than
3 years to be fixed.
To check the influence of severity and priority on FixTime, we built a linear re-
gression model in which FixTime was the dependent variable, while severity and priority
were independent variables. Table 5.4 shows the results. We found that severity is a better
FixTime predictor than priority, with p-values much smaller than those of priority, but nev-
ertheless the priority’s p-values, 0.1 for desktop and 0.001 for Android suggest a relationship
between priority and FixTime.
108

Year Severity PriorityHi. vs. Med. Hi. vs. Low Med. vs. Low Hi. vs. Med. Hi. vs. Low Med. vs. Low
Desktop
1998 0.0189 0.2183 0.5654 < 0.01 < 0.01 0.73251999 < 0.01 < 0.01 < 0.01 < 0.01 0.0102 < 0.012000 < 0.01 < 0.01 < 0.01 0.3180 < 0.01 0.03462001 < 0.01 < 0.01 < 0.01 < 0.01 0.6562 < 0.012002 < 0.01 < 0.01 < 0.01 < 0.01 < 0.01 < 0.012003 < 0.01 < 0.01 < 0.01 < 0.01 < 0.01 < 0.012004 0.4082 < 0.01 < 0.01 < 0.01 < 0.01 < 0.012005 < 0.01 < 0.01 < 0.01 0.9191 < 0.01 < 0.012006 0.2646 < 0.01 < 0.01 < 0.01 < 0.01 < 0.012007 < 0.01 0.9771 0.0102 < 0.01 < 0.01 < 0.012008 0.9800 < 0.01 < 0.01 < 0.01 < 0.01 < 0.012009 < 0.01 < 0.01 < 0.01 < 0.01 0.7295 < 0.012010 < 0.01 < 0.01 < 0.01 < 0.01 < 0.01 < 0.012011 0.2227 < 0.01 < 0.01 < 0.01 < 0.01 < 0.012012 < 0.01 < 0.01 < 0.01 < 0.01 0.0267 < 0.012013 < 0.01 < 0.01 < 0.01 < 0.01 0.2575 0.2535
Android
2008 < 0.01 0.0831 < 0.01 NA NA NA2009 < 0.01 0.2286 < 0.01 < 0.01 NA NA2010 < 0.01 < 0.01 0.9944 < 0.01 NA NA2011 < 0.01 < 0.01 0.0105 0.0429 0.2958 0.03042012 < 0.01 0.0604 0.3382 0.0347 0.0711 0.90722013 < 0.01 0.1118 0.4905 0.4140 0.5035 0.8857
Table 5.5: Significance values of whether FixTime differs between classes on Desktop and
Android.
We now present the results of a per-year statistical analysis that shows FixTimes
tend to differ significantly among severity classes and among priority classes. The “Severity”
columns of Table 5.5 provide the p-values of pairwise two-means tests of FixTimes between
different severity classes. The results indicate that on desktop, with few exceptions (1998,
2007), FixTimes do differ significantly between classes. On Android, though, FixTimes
differ less among severity classes.
109

The “Priority” columns of Table 5.5 show the results of a similar analysis—how
does FixTime differ between priority classes. To make comparisons with severity easier, we
used a 3-point scale for priority. High means priority level ≤ 2; Medium means priority
level=3; and Low means priority level ≥ 4.
The table values indicate that differences in FixTime across priority classes again
tend to be significant on desktop, but not on Android; the “NA” entries indicate that most
of the Android bugs in that class were hosted on Google Code, which does not support
priority.
For Android, FixTime differs significantly between high and medium severity bugs
in all years, but does not differ significantly between high and low severity or between
medium and low severity: this is explained by the fact that the Wilcoxon test is not transi-
tive [49]. For high severity vs. low severity, only 2010 and 2011 have significant differences;
for medium severity vs. low severity, the differences are only significant in 2008 and 2009.
Figures 5.1a–5.1c indicate how the population means vary for each class, year, and
platform. We can now answer RQ2:
RQ2: Fix time for desktop bugs is affected by severity and to a lesser extent by
priority. FixTime does vary significantly across severity classes for desktop, but for Android
the only significant difference is between high and medium severity.
DescriptionLength. The number of words in the bug description reflects the level of
detail in which bugs are described. A higher DescriptionLength value indicates a higher
bug report quality [59], i.e., bug fixers can understand and find the correct fix strategy easier.
As shown in Figure 5.2a, high-severity bugs on desktop have significantly higher description
110

4060
8010
0
1998 1999 2000 2001 2002 2003 2004 2005 2006 2007 2008 2009 2010 2011 2012 2013
high medium low
DescriptionLength for Desktop
(a)
3040
5060
7080
2008 2009 2010 2011 2012 2013
highmediumlow
DescriptionLength for Android
(b)
Figure 5.2: DescriptionLength distribution per year; units are defined in Section 5.1.3.
length values while medium and low-severity bugs have lower values (the DescriptionLength
differences between medium and low-severity bugs is significant in only 10 out of 16 years).
We found that the reason for high DescriptionLength for high-severity bugs is that reporters
usually provide stack traces or error logs for the bugs.
However, as shown in Figure 5.2b, we found different trends on Android: medium
severity bugs have the highest values of DescriptionLength, followed by high-severity bugs,
111

while low-severity bugs usually have the smallest DescriptionLength. The difference between
classes is small. The pairwise tests show that only during half of the studied time frame
(2009–2011), the differences between severity classes are significant, for other years they are
not. The reason for high-severity bugs not having the highest DescriptionLength is that
unlike on desktop, for projects hosted on Google Code, reporters do not adhere to providing
a stack trace or error log as strictly as they do on desktop.
RQ3: On desktop, DescriptionLength is significantly higher for high-severity bugs
compared to medium and low-severity bugs. DescriptionLength differences are not always
significant between medium and low-severity on desktop, or between classes on Android.
TotalComments. Bugs that are controversial or difficult to fix have a higher number
of comments. The number of comments can also reflect the amount of communication
between application users and developers—the higher the number of people interested in a
bug report, the more likely it is to be fixed [54]. According to Figure 5.3a, there are more
comments in high-severity bug reports on desktop, while low-severity bug reports have the
least number of comments. This indicates that high-severity bugs are more complicated,
and harder to fix, while low-severity bugs are in the opposite situation.
The pairwise tests show that all classes are different from each other except for
a few years (medium vs. low in 1999 and 2001). TotalComments evolution is similar on
Android (Figure 5.3b), i.e., high-severity bugs have the highest value while low-severity bugs
have the lowest value. The pairwise tests indicate that differences are significant between
all class pairs, except for 2008 and 2009.
112
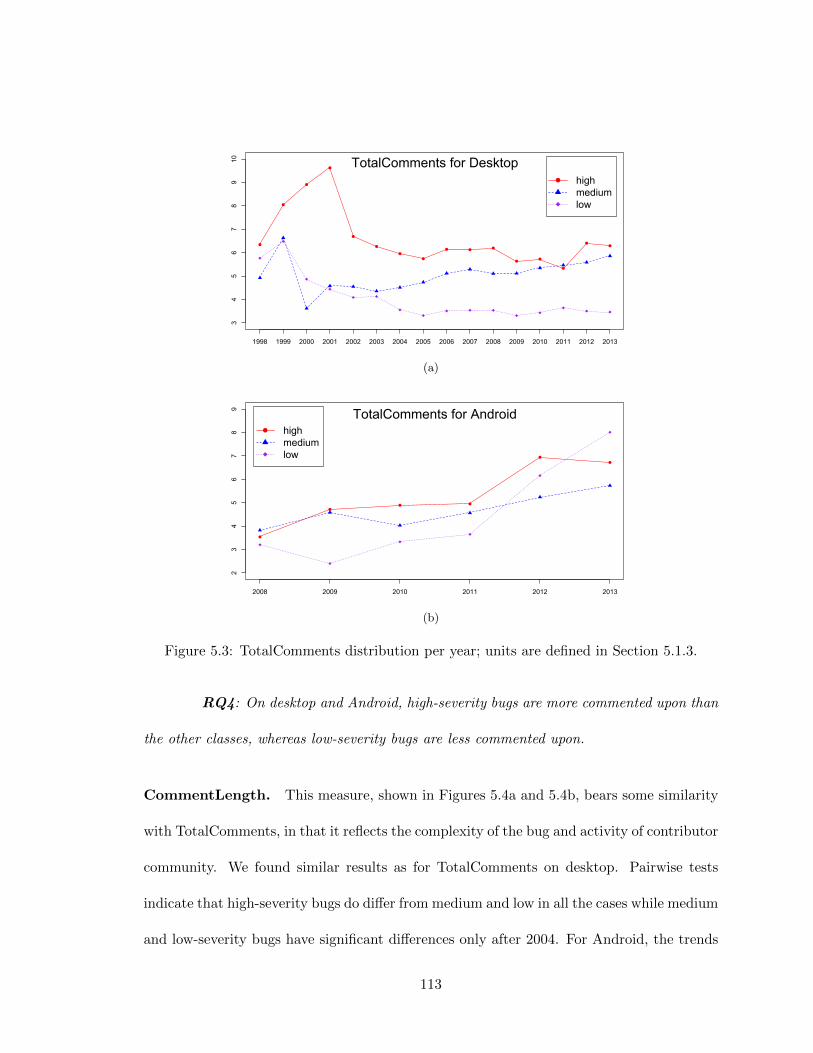
34
56
78
910
1998 1999 2000 2001 2002 2003 2004 2005 2006 2007 2008 2009 2010 2011 2012 2013
highmediumlow
TotalComments for Desktop
(a)
23
45
67
89
2008 2009 2010 2011 2012 2013
highmediumlow
TotalComments for Android
(b)
Figure 5.3: TotalComments distribution per year; units are defined in Section 5.1.3.
RQ4: On desktop and Android, high-severity bugs are more commented upon than
the other classes, whereas low-severity bugs are less commented upon.
CommentLength. This measure, shown in Figures 5.4a and 5.4b, bears some similarity
with TotalComments, in that it reflects the complexity of the bug and activity of contributor
community. We found similar results as for TotalComments on desktop. Pairwise tests
indicate that high-severity bugs do differ from medium and low in all the cases while medium
and low-severity bugs have significant differences only after 2004. For Android, the trends
113

4060
8010
012
014
016
0
1998 1999 2000 2001 2002 2003 2004 2005 2006 2007 2008 2009 2010 2011 2012 2013
highmediumlow
CommentLength for Desktop
(a)
2030
4050
6070
8090
2008 2009 2010 2011 2012 2013
highmediumlow
CommentLength for Android
(b)
Figure 5.4: CommentLength distribution per year; units are defined in Section 5.1.3.
are not so clear: the pairwise tests show that the difference between high and medium are
not significant in 2009 to 2011. But differences between high and low, and medium and
low, are significant in all years.
RQ5: High severity bugs on desktop have higher CommentLength than other
classes. On Android, the differences between high and medium severity classes are not
significant, but they both are significantly higher than for the low-severity class.
114

5.2.3 Management of Bug-fixing
Resource allocation and management of the bug-fixing process have a significant
impact on software development [153]; for example, software quality was found to be im-
pacted by the relation between bug reporters and bug owners [17]. We defined the Bu-
gOwner and BugReporter roles in Section 5.1.3 and now set out to analyze the relationship
between bug reporters and bug owners across the different severity classes.
Developer Changes
We examined the distributions and evolutions of bug reporters, as well as bug
owners, for the three severity classes on the two platforms. Table 5.6 summarizes the
results. Column 2 shows the total number of bug reporters in each year; columns 3–5 show
the percentages of bug reporters who have reported high, medium, and low-severity bugs.
Columns 6 through 9 show the numbers and percentages of bug owners.
We make several observations. First, the sums of percentages for high, medium,
and low severity are larger than 100%, which indicates that there are reporters or owners
who contribute to more than one severity class. Second, high-severity bug owners have
larger contribution (percentage) values than those of corresponding bug reporters, because
fixing high-severity bugs requires more resources.
Figure 5.5 shows the trend of bug reporters and owners of each severity class. For
desktop, according to Figures 5.5a and 5.5b, we found similar evolutions for the numbers
of high, medium and low severity classes for both bug reporters and owners. For Android,
Figures 5.5c and 5.5d indicate that there are many more medium severity reporters and
115

Year Reporters Owners# (%) # (%)
High Med. Low High Med. Low
Desktop
1998 164 33.5 76.2 17.1 64 43.8 78.1 29.71999 949 45.6 75.3 17.8 214 58.9 86.4 38.32000 3,270 35.0 76.1 15.7 449 42.5 80.0 35.02001 5,471 29.4 71.7 17.7 664 44.4 69.0 39.22002 7,324 35.5 55.6 18.5 995 41.2 60.5 33.92003 7,654 29.5 52.2 18.0 1,084 34.3 55.2 31.92004 8,678 28.5 52.5 21.0 1,273 36.4 56.2 32.82005 8,990 28.2 47.8 21.0 1,327 37.8 56.7 33.52006 7,988 30.7 51.2 21.8 1,408 39.9 58.9 33.72007 7,292 30.0 52.5 19.7 1,393 39.1 64.0 32.72008 8,474 30.9 55.5 20.4 1,546 39.7 65.3 32.52009 8,451 32.6 56.2 20.1 1,537 41.9 64.7 34.22010 7,799 34.0 56.6 18.0 1,475 45.5 65.5 32.42011 6,136 33.2 64.2 17.9 1,381 43.7 75.7 31.12012 5,132 32.1 67.9 17.1 1,352 47.4 76.0 29.62013 4,884 31.2 66.6 18.1 1,432 47.3 72.8 27.7
Android
2008 429 4.4 97.7 2.6 41 36.6 95.1 17.12009 987 8.1 95.1 2.9 104 29.8 92.3 12.52010 1,875 12.6 87.0 7.3 163 33.1 88.3 21.52011 2,045 10.6 91.5 4.1 218 33.0 93.6 16.12012 1,998 11.6 89.6 6.4 340 26.8 87.9 20.32013 1,492 7.8 84.2 11.3 419 16.2 89.5 29.4
Table 5.6: Numbers of bug reporters and bug owners and the percentage of them who
contribute to each severity class.
owners than other severity classes. The differences in these trends between desktop and
Android are due to the percentage of medium severity bugs on Android (Table 5.1 and
Table 5.2) being larger than the percentage of medium-severity bugs on desktop.
The number of fixed bugs differs across platforms, so to be able to compare reporter
and owner activity between platforms, we use the number of bug reporters and bug owners
116
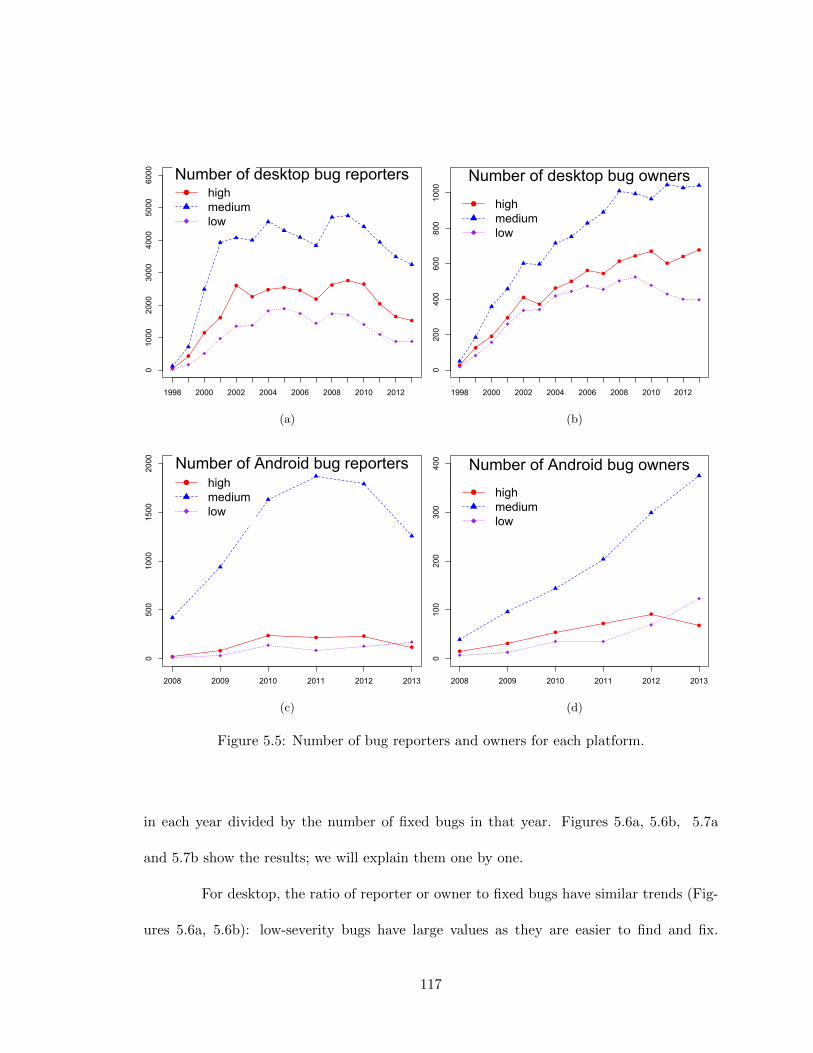
010
0020
0030
0040
0050
0060
00
1998 2000 2002 2004 2006 2008 2010 2012
highmediumlow
Number of desktop bug reporters
(a)
020
040
060
080
010
00
1998 2000 2002 2004 2006 2008 2010 2012
highmediumlow
Number of desktop bug owners
(b)
050
010
0015
0020
00
2008 2009 2010 2011 2012 2013
highmediumlow
Number of Android bug reporters
(c)
010
020
030
040
0
2008 2009 2010 2011 2012 2013
highmediumlow
Number of Android bug owners
(d)
Figure 5.5: Number of bug reporters and owners for each platform.
in each year divided by the number of fixed bugs in that year. Figures 5.6a, 5.6b, 5.7a
and 5.7b show the results; we will explain them one by one.
For desktop, the ratio of reporter or owner to fixed bugs have similar trends (Fig-
ures 5.6a, 5.6b): low-severity bugs have large values as they are easier to find and fix.
117
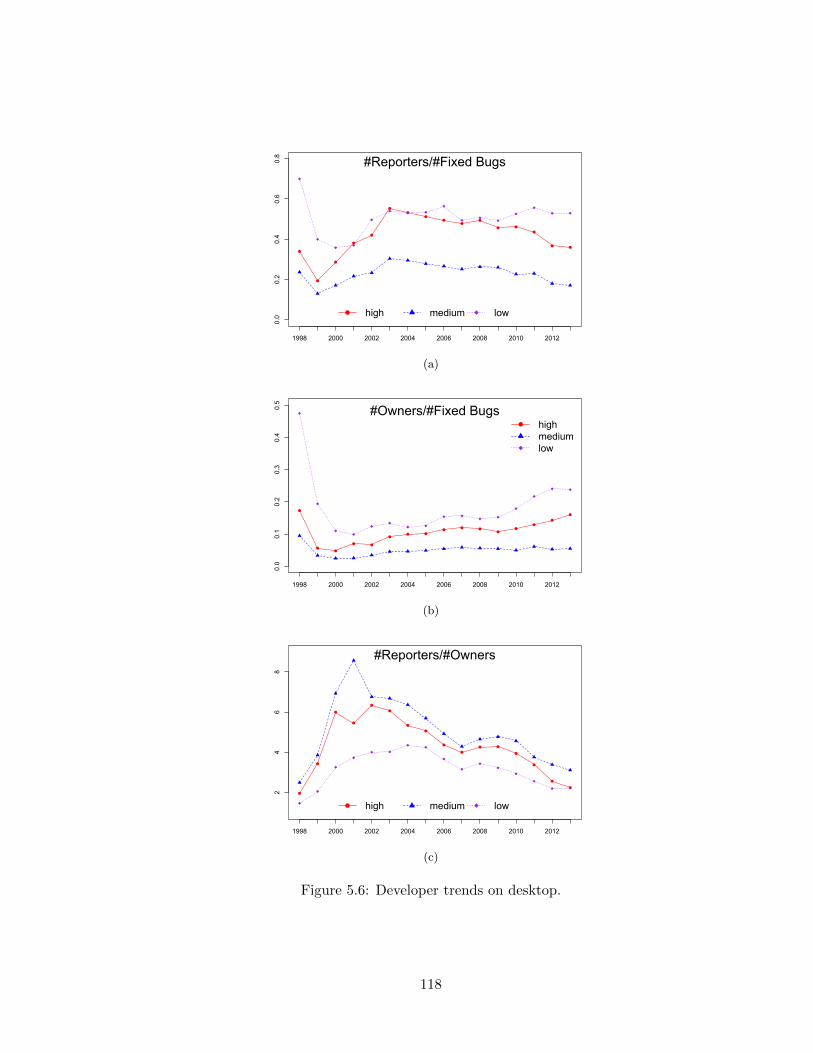
0.0
0.2
0.4
0.6
0.8
1998 2000 2002 2004 2006 2008 2010 2012
high medium low
#Reporters/#Fixed Bugs
(a)
0.0
0.1
0.2
0.3
0.4
0.5
1998 2000 2002 2004 2006 2008 2010 2012
highmediumlow
#Owners/#Fixed Bugs
(b)
24
68
1998 2000 2002 2004 2006 2008 2010 2012
high medium low
#Reporters/#Owners
(c)
Figure 5.6: Developer trends on desktop.
118

0.3
0.4
0.5
0.6
0.7
0.8
2008 2009 2010 2011 2012 2013
high medium low
#Reporters/#Fixed Bugs
(a)
0.0
0.1
0.2
0.3
0.4
0.5
0.6
2008 2009 2010 2011 2012 2013
highmediumlow
#Owners/#Fixed Bugs
(b)
24
68
1012
2008 2009 2010 2011 2012 2013
highmediumlow
#Reporters/#Owners
(c)
Figure 5.7: Developer trends on Android.
119

They are followed by high-severity bugs since, although hard to fix, the importance of high-
severity bugs plays a significant role and instills urgency. For Android, the ratios of bug
owners to fixed bugs (Figure 5.7b) have similar trends as on desktop, since the bug-fixing
process is similar on both platforms. On the contrary, the ratio of bug reporters to fixed
bugs (Figure 5.7a) on Android and desktop are different. On Android, high severity has the
lowest value for this ratio while the medium severity class has the lowest value on desktop.
The reason is that the percentage of high-severity bugs on Android is less than that of desk-
top. Also the severity classification on Android is not as strict as on desktop (most projects
hosted on Google Code only have 3 severity levels); and finally, the difference between high
and medium is smaller on Android.
Furthermore, the ratio of owners to fixed bugs can reflect the inverse of workload
and effort associated with bug-fixing (high ratio value = low workload). We find that
for both desktop and Android (Figures 5.6b and 5.7b), low-severity bugs have the lowest
workload (the highest curve) since they are easiest to fix. Medium-severity bugs require
most resources due to their large quantity.
The ratio of reporters to owners (Figures 5.6c and 5.7c) reveals that medium-
severity bugs have the highest ratio— this is unsurprising since most reports are at this
severity level. Low severity has the smallest ratio as these bugs are the easiest to report
and fix.
RQ6: Medium-severity bugs have the most reporters, most owners, and highest
workload. Low-severity bugs are at the opposite end of the spectrum; high-severity bugs are
in-between.
120

Developer Experience
To analyze differences in contributors’ level of experience, we use the DevExperi-
ence metric defined in Section 2.2.2 Figure 5.8 shows the evolution of DevExperience, in
days, for bug reporters and bug owners of each severity class on desktop and Android. For
bug reporters and owners, the experience on all severity classes increases with time. The
dip in DevExperience for bug reporters on desktop in 2009 is caused by a large turnover
that year; the fast rise afterwards is due to a surge in popularity of several projects (mainly
Gnome Core, Amarok and Plasma).
For desktop, as Figures 5.8a and 5.8b show, bug reporters and bug owners of
medium-severity bugs are more experienced than the other two severity classes due to there
being more medium-severity bugs, hence contributors can gain more experience. Low-
severity bug reporters and owners have the lowest levels of experience since the number of
low-severity bugs is small and these bugs are easiest to find and fix.
For Android, bug owners have similar trends as on desktop, medium-severity bug
owners have more experience than high and low-severity owners. On the other hand, high-
severity bug reporters on Android are more experienced than medium severity than low
severity, but the difference in experience levels between severity classes is smaller than on
desktop. Upon further investigation, we found that the portion of new bug reporters on
Android is much larger than that of desktop, which we attribute to the lower “barrier to
entry”: it is easier to report a bug in an Android project than in a desktop project since
2 A handful of developers have made a lot of contributions over a short period while some made fewcontributions over a long period. Since these situations are extremely rare, they will not affect the overallresult.
121

05
1015
2025
3035
1998 2000 2002 2004 2006 2008 2010 2012
highmediumlow
Experience of Desktop Reporters
(a)
010
020
030
0
1998 2000 2002 2004 2006 2008 2010 2012
highmediumlow
Experience of Desktop Owners
(b)
01
23
45
67
2008 2009 2010 2011 2012 2013
highmediumlow
Experience of Android Reporters
(c)
010
2030
4050
60
2008 2009 2010 2011 2012 2013
highmediumlow
Experience of Android Owners
(d)
Figure 5.8: DevExperience for each severity class and each platform, in days.
most apps include a streamlined bug reporting functionality (send the crash report and/or
Android logcat to developers by just pressing a button).
Also as Figure 5.7a shows, the high-severity class has the lowest ratio of reporters-
to-fixed bugs, which indicates there are fewer new bug reporters for high severity. As a
result, high-severity bug reporters are more experienced than others on Android.
122

RQ7: Medium-severity class developers are more experienced (have been active
for longer) than high-severity class developers than low-severity class developers.
5.3 Topic Analysis
So far we have focused on a quantitative analysis of bugs and bug fixing. We now
turn to a topic analysis that investigates the nature of the bugs in each severity class. More
concretely, we are interested in what kinds of bugs comprise each severity class on different
platforms and how the nature of bugs changes as projects evolve.
We use topic analysis for this purpose: we extract topics (sets of related keywords)
via LDA from the terms (keywords) used in bug title, descriptions and comments, as de-
scribed in Section 2.4. We extract the topics used each year in each severity class of each
platform, and then compare the topics to figure out how topics change over time in each
class and how topics differ across severity classes.
For the topic analysis, to investigate the difference between severity classes on bug
nature, we designed the following research questions:
RQ8 Do bug topics differ between severity classes?
RQ9 How do topics evolve over time?
5.3.1 Topic Extraction
The number of bug reports varies across projects, as seen in Table 5.1 and Ta-
ble 5.2. Moreover, some projects are related in that they depend on a common set of
libraries, for instance SeaMonkey, Firefox and Thunderbird use functionality from libraries in
123

Mozilla Core for handling Web content. It is possible that a bug in Mozilla Core cascades and
actually manifests as a crash or issue in SeaMonkey, Firefox, or Thunderbird, which leads to
three separate bugs being filed in the latter three projects. For example, Mozilla Core bug
#269568 cascaded into another two bugs in Firefox and Thunderbird. A similar issue may
appear in projects from the KDE suite, e.g., Konqueror, Kdevelop, or Kate might crash (and
have a bug filed) due to a bug in shared KDE libraries.
Hence we extract topics using a proportional strategy where we sample bug reports
to reduce possible over-representation due to large projects and shared dependences. 3
More concretely, for high/medium/low severity classes on desktop, we extracted
topics from 500/1,000/400 “independent” bug reports for each severity class, respectively.
The independent bug report sets were constructed as follows: since we have 10 projects from
KDE, we sampled 100 medium severity bugs from each KDE-related project. We followed
a similar process for Mozilla, Eclipse and Apache. Android projects had smaller number
of bug reports, so for Android we sampled 50/100/50 bug reports from high/medium/low
severity classes, respectively.
With the proportional sets at hand, we followed the LDA preprocessing steps
described in Section 5.1.4; since there are only two bug reports in 1998 for desktop and
one for Android in 2007, we have omitted those years. For desktop, the preprocessing of
high, medium, and low severity sets resulted in 755,642 words (31,463 distinct), 758,303
words (36,445 distinct) and 352,802 words (19,684 distinct), respectively. For Android,
the preprocessing of high, medium, and low severity sets resulted in 116,010 words (7,230
3We performed a similar analysis using the original data sets in their entirety, with no sampling. Asexpected, the topic analysis results were influenced by the large projects, e.g., “Qt”, the shared library usedin KDE, was the strongest topic in 2008. We omit presenting the results on the original sets for brevity.
124

distinct), 289,422 words (13,905 distinct) and 31,123 words (3,825 distinct), respectively.
Next, we used MALLET [103] for LDA computation. We ran for 10,000 sampling iterations,
the first 1,000 of which were used for parameter optimization. We modeled bug reports with
K = 100 topics for high and medium severity classes on desktop, 60 for low severity class on
desktop, 50 for high and medium classes on Android and 40 for low severity bugs on Android;
we choose K based on the number of distinct words for each platform; in Section 5.4 we
discuss caveats on choosing K.
5.3.2 Bug Nature and Evolution
We now set out to answer RQ8 and RQ9.
How Do Bug Topics Differ Across Severity Classes?
Tables 5.7 and 5.8 show the highest-weight topics extracted from the proportional
data set. We found that for both desktop and Android, bug topics with highest weight
differ across severity classes.
On desktop, build- and compilation-related bugs are the most common bug type in
the high-severity class; for medium severity, application logic bugs (failure to meet require-
ments) are the most popular, followed by installation errors; for low severity, configuration
bugs and feature requests are most prevalent. It was interesting to see that bug severity is
somewhat more developer-centric than user-centric: note how build/compile errors which
mostly affect developers or highly-advanced users appear in the high-severity class, whereas
install errors, which mostly affect end-users, are in the medium-severity class.
125

Label Most representative words Weight
High
build build gener log option link config select resolv du-plic depend level
12%
compile server sourc compil output local project info pathsearch util tag expect tool
11%
crash crash load relat size caus broken good current in-stanc paramet trace stop properli valid trigger af-fect unabl assum condition
9%
GUI swt widget ui editor dialog jface gnome contentenabl handler mod send kei
6%
concurrency thread lwp pthread event wait process mutex condthread oper qeventdispatch qeventloop
5%
Medium
application logic window call page displai log connect start add dataoutput check support current appli enabl apach
17%
install instal select item control option move linux direc-tori core debug icon start correct server thing infosave statu place edit account
15%
crash warn good crash layout limit buffer affect lock con-firm miss screenshot trigger quick
8%
widget widget descript action select plugin workbench di-alog swt progress jdt wizard max
6%
communication ssh debug local kei ssl protocol sshd authent mes-sag password cgi login client channel launch exec
3%
Low
config configur support sourc instal size exist url informutil cach document info load custom src path move
22%
feature request add option suggest gener find updat good local ap-plic miss content address point data correct bitsave duplic
20%
I/O output space mous index block invalid separ netoper workaround stop foo wait timeout delet key-board
9%
install instal makefil icon dialog home build edit helperselect normal page leav progress site bugzilla verifi
8%
database db queri method menu php filter map sql jdbc ex-ecut databas count gecko init
8%
Table 5.7: Top words and topic weights for desktop.
126

Label Most representative words Weight
High
concurrency handler init handl dispatch looper event htc sam-sung galaxi loop sm mobil enabl post optionlaunch miss
22%
runtime error runtim error fail code press screen happen doesnexit queri finish notic process edit didn wait lockdelet trace
16%
runtime crash crash thread patch doesn repli state code updatstack good resourc beta hit verifi unknown win-dow
13%
Medium
runtime crash runtim doesn result fail item remov wrong happeninput action file app system data
27%
runtime error output error messag correct forc due requir com-plet specif debug occur count
19%
phone call call devic task sip galaxi samsung servic hardwarmotorola
12%
Low
feature request suggest client find guess support messag phoneoutput account system log option applic checkformat displai send screen result user market lat-est
23%
application logic android app file error correct wrong bit page li-brari nofollow map correctli didn fail full datalaunch logcat screenshot
21%
GUI report menu screen button gener ad user linkbrowser load press item url mode action contextkeyboard previou widget
12%
Table 5.8: Top words and topic weights for Android.
For Android, in the high-severity class, bugs associated with the Android concur-
rency model (event/handler) are the most prevalent, followed by runtime errors (the app
displays an error) and then runtime crashes (the app silently crashes without an error or
restarts); in the medium-severity class, runtime crashes and runtime errors are also popular,
followed by problems due to phone calls. In the low-severity class, feature requests are the
most popular, followed by problems due to application logic and GUI.
127

While some commonalities exist between desktop and Android (runtime errors,
crashes, and feature requests are well-represented in the high-weight topics on both plat-
forms), there are also some notable differences: build/compile/install errors do not pose a
problem on Android, which might suggest that the Android build process is less error-prone.
Second, owing to the smartphone platform, phone call issues appear more frequently among
high-weight topics on Android. Third, concurrency is still posing problems: it appears as a
high-weight topic on both desktop on Android.
RQ8: Topics differ across severity classes and across platforms, e.g., for high-
severity bugs, build/install/compile-related issues are the most prevalent on desktop, while
concurrency and runtime error/crash-related bugs are the most prevalent on Android.
How Do Bug Topics Evolve?
To study macro-trends in how the nature of bugs changes over time, we analyzed
topic evolution in each severity class on each platform. We found that high-severity bugs
on desktop are the only class where topics change substantially over time; in other classes,
high-frequency topics tend to be stable across years. We limit our discussion to high-severity
topics; Table 5.9 shows the top-3 topics and their corresponding weight for each year.
We make several observations. On desktop, concurrency started to be a big issue
in 2009, and has remained so. This is unsurprising, since multi-core computers have started
to become the norm around that time, and multi-threading programming has been seeing
increased adoption. Furthermore, we found that cloud computing-related bugs have started
to appear in 2012, again understandably as cloud computing has been getting more traction.
128

Year Top 3 topics (topic weight)
Desktop
1999 make (58%) install (12%) layout (10%)2000 widget (27%) layout (24%) install (16%)2001 layout (38%) install (10%) compile (7%)2002 GUI (17%) compile (14%) build (10%)2003 compile (20%) GUI (13%) build (10%)2004 crash (19%) build (12%) compile (9%)2005 plugin (17%) build (10%) compile (10%)2006 GUI (14%) build (10%) compile (8%)2007 build (14%) GUI (11%) compile (9%)2008 debug (16%) compile (11%) widget (9%)2009 concurrency (33%) GUI (11%) compile (11%)2010 concurrency (15%) compile (11%) debug (7%)2011 concurrency (16%) compile (12%) plugin (11%)2012 cloud (14%) compile (12%) build (11%)2013 concurrency (22%) build (11%) cloud (11%)
Android
2008 email (39%) runtime error (24%) concurrency (11%)2009 connection (23%) runtime error (22%) concurrency (14%)2010 concurrency (18%) database (17%) call (13%)2011 map (27%) concurrency (26%) database (12%)2012 concurrency (21%) runtime crash (17%) runtime error (17%)2013 browser (18%) runtime crash (16%) concurrency (15%)
Table 5.9: Top-3 bug topics per year for high-severity class on desktop and Android.
For Android, concurrency bugs rank high every year, suggesting that developers
are still grappling to use the Android’s event-based concurrency model correctly.
RQ9: Bug topics tend to be stable in low- and medium-severity classes. In the
high-severity class, on desktop, there have been more concurrency and cloud-related bugs
since 2009 and 2012, respectively; on Android, concurrency bugs have been and continue to
be prevalent.
129

5.4 Threats to Validity
5.4.1 Selection Bias
We only chose open source applications for our study, so the findings might not
generalize to closed-source projects. Our chosen projects use one of five trackers (Bugzilla,
Trac, JIRA, MantisBT and Google Code); we did not choose projects hosted on GitHub
since severity levels are not available on GitHub, hence our findings might not generalize to
GitHub-hosted projects.
Furthermore, we did not control for source code size—differences in source code
size might influence features such as FixTime.
5.4.2 Severity Distribution on Android
According to Table 5.1 and Table 5.2, many Android projects have skewed severity
distributions (for 17 out of 38 Android projects, more than 90% of the bugs have medium
severity). We believe this to be due to medium being the default value for the severity field
on Google Code and most Android reporters or developers on Android not considering the
severity level as important as on desktop.
5.4.3 Priority on Google Code and JIRA
We could not quantify the effect of priority on those projects hosted on Google
Code and JIRA, as Google Code and JIRA do not have a priority field.
130

5.4.4 Data Processing
For the topic number parameter K, finding an optimal value is an open research
question. If K is too small, different topics are clustered together, if K is too large, related
topics will appear as disjoint. In our case, we manually read the topics, evaluated whether
the topics are distinct enough, and chose an appropriateK to yield disjoint yet self-contained
topics.
Google Code does not have support for marking bugs as reopened (they show up
as new bugs), whereas the other trackers do have support for it. About 5% of bugs have
been reopened on desktop, and the FixTime for reopened bugs is usually high [130]. This
can result in FixTime values being lower for Google Code-based projects than they would
be if bug reopening tracking was supported.
5.5 Summary
We presented the results of a study on desktop and Android projects that shows
bugs of different severity have to be treated differently, as they differ in terms of charac-
teristics and topics. We defined three severity classes, high, medium and low. We showed
that across classes, bugs differ quantitatively e.g., in terms of bug fixing time, bug descrip-
tion length, bug reporters/owners. A topic analysis of bug topics and bug topic evolution
has revealed that the topics of high-severity bugs on desktop have shifted over time from
GUI and compilation toward concurrency and cloud, whereas on Android concurrency is
a perennial topic. Our approach can guide severity assignment, e.g., compile/make bugs
should have higher severity, and configuration errors should have lower severity.
131

Chapter 6
Minimizing Bug Reproduction
Steps on Android
We have shown that Android apps have become rich featured and are increasing in
popularity. Mobile apps enable user interaction via a touchscreen and a diverse set of sensors
(e.g., accelerometer, ambient temperature, gyroscope, and light) which also present new
challenges for software development, testing, debugging, and maintenance. Unfortunately,
existing trace size minimization techniques are not adequate on Android due to the difference
between Android apps and traditional desktop applications.
In this chapter, we present an approach to collect execution data automatically and
extract minimized reproduction steps from captured data by using a record/replay scheme.
We capture the event sequence while running the app and generate an event dependency
graph (EDG). Then we use the EDG with event sequence to guide the delta debugging
algorithm by eliminating irrelevant events.
132

6.1 Background
As mentioned in Chapter 1, bug reproducing is the first and crucial step in debug-
ging process since without reproducing the bug, the developer will have trouble diagnosing
and verifying the problem and figure out the correct fixing strategy. To reproduce a par-
ticular bug, developers need information about reproduction steps, i.e., the sequence of
program statement, system events or user steps to trigger the bug, and information about
the failure environment, i.e., the setting in which the bug occurs [156].
Developers can obtain reproduction steps and failure environment information
mainly in two ways: bug report and collection of field data. Bug reports submitted by
users often do not contain reproduction steps or the information provided by users is wrong
or incomplete [85, 167]. Alternatively, developers can execute the application and collect
field data, i.e., data about the runtime behavior and runtime environment of deployed pro-
grams [115]. Such approaches usually generate enormous amounts of tracing data which
not only makes the debugging process difficulty but also risky, as the developer cannot
predict when a particular bug will be found. Although execution traces are usually very
long, very few of them are critical to exposing the behavior that causes the bug. There-
fore, simplification of the bug-revealing trace is an important and essential step towards
debugging.
Delta Debugging [157,159] has been introduced as an effective and efficient proce-
dure for simplification of the failing test-case. Given a program input on which the execution
of a program fails, delta debugging automatically simplifies the input such that the resulting
simplified input causes the same failure. In particular, it finds a 1-minimal input, i.e., an
133

input from which removal of any entity causes the failure to disappear. This is achieved by
carrying out a search in which: new simpler inputs are generated; the program is executed
to determine if same failure is caused by the simpler input; and the above steps are repeat-
edly applied until the input cannot be simplified any further. Overall, Delta Debugging
behaves very much like a binary search. Delta Debugging is an extremely useful algorithm
and widely used in practice [123, 135, 136] to automatically simplify or isolate a failure in-
ducing input [157, 159], produce cause effect chains [158] and to link cause transitions to
the faulty code [34].
6.2 Problem Overview
Android apps differ from traditional desktop application since they have the rich
capabilities for user interaction via touchscreens, as well as the diverse set of sensors (e.g.,
accelerometer, compass, GPS) that can be leveraged to drive app behavior. Users interact
with apps through their Graphical User Interface (GUI). The app developers evolve the
GUI overtime to improve the user experience. The GUI of Android apps consist of a set of
separate screens names as activities. An activity defines a set of tasks that can be grouped
together in terms of their behavior and corresponds to a window in a conventional GUI [16].
Each activity corresponds to a top-level view of the user interface (UI). Furthermore, each
app has only one main activity, which is the initial state when the app is executed. When
interacting with GUI of an application, the user commonly transitions between different
activities, as actions in one activity trigger another activity, by triggering the corresponding
event.
134
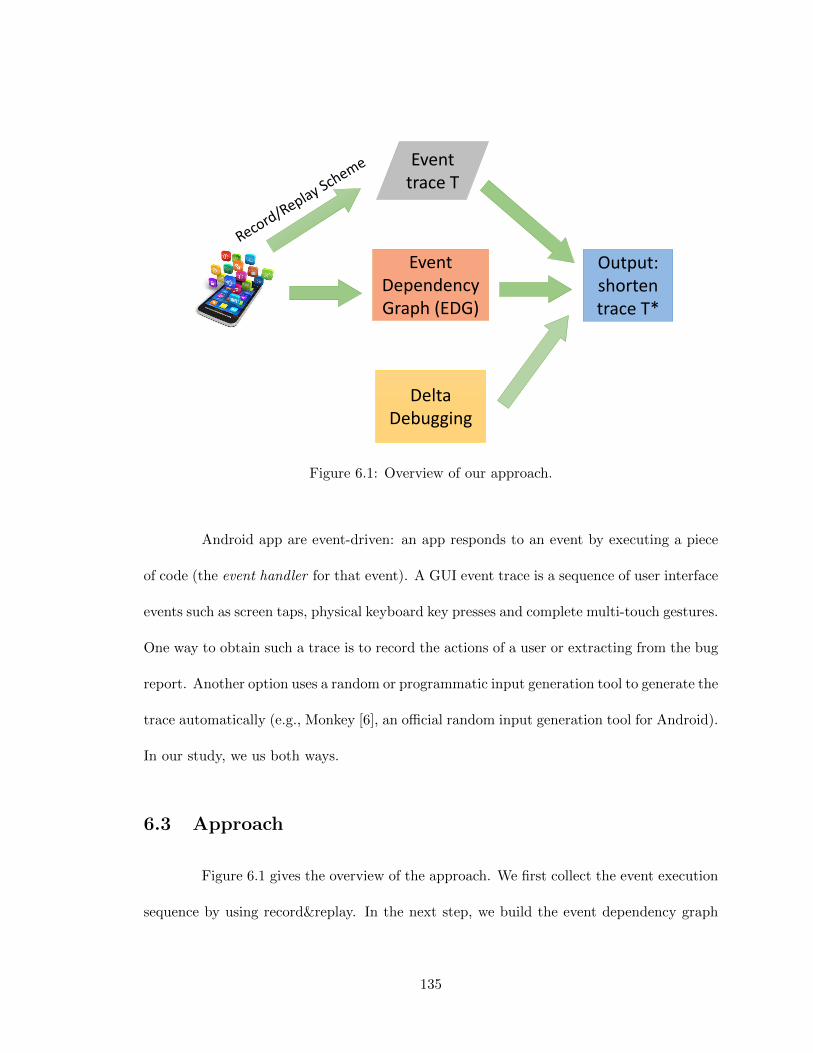
Output:shorten trace T*
Event trace T
Event Dependency Graph (EDG)
Delta Debugging
Figure 6.1: Overview of our approach.
Android app are event-driven: an app responds to an event by executing a piece
of code (the event handler for that event). A GUI event trace is a sequence of user interface
events such as screen taps, physical keyboard key presses and complete multi-touch gestures.
One way to obtain such a trace is to record the actions of a user or extracting from the bug
report. Another option uses a random or programmatic input generation tool to generate the
trace automatically (e.g., Monkey [6], an official random input generation tool for Android).
In our study, we us both ways.
6.3 Approach
Figure 6.1 gives the overview of the approach. We first collect the event execution
sequence by using record&replay. In the next step, we build the event dependency graph
135

(EDG) of the app. Then we use the information extracted from EDG to guide the delta
debugging process. We repeat the delta debugging process until we trigger the crash again
with the simplified trace.
Next, we use a simple Android app, WikiNotes, to illustrate how our approach
works. There are 3 activities in WikiNotes: WikiNotes, WikiNoteEditor and WikiNotesList and one
dialog DeleteNote. Figure 6.2 shows the screenshot. As a matter of fact, it use the class
WikiActivityHelper to jump between activities.
According to the bug report, there is a crash bug in WikiNotes. Based on the
stack trace in the bug report (Figure 6.3), the crash happens when the method onResume()
in activity WikiNotes is called. However, after analyzing the source code, we found that
the real cause of crash is the deletion of a note that was created in activity WikiNotesList.
More specifically, in WikiNotesList when the user clicks the “Delete Note” button, the event
handler onMenuItemSelected is invoked. Next we call the function deleteNote in class WikiActivityHelper.
Following note deletion, we update the cursor; however, since we have deleted the note, the
number of elements in the cursor is 0, and a CursorIndexOutOfBoundsException is raised. Figure 6.4
shows the patch for this bug. We can fix the crash by checking the number of notes that
exist.
6.3.1 Creating Event Traces
The ability to record and replay the execution of a smartphone app is useful to bug
reproduction step in debugging process. Reproducing bugs in the development environment
136

(a) Main Activity: WikiNoteEditor (b) Activity WikiNotesList
(c) Activity WikiNoteEditor (d) Dialog DeleteNote
Figure 6.2: UI elements in app WikiNotes
137

1 Caused by:
2 android.database.CursorIndexOutOfBoundsException:
3 Index 0 requested, with a size of 0
4 at android.database.AbstractCursor.checkPosition (AbstractCursor.java:426)
5 at android.database.AbstractWindowedCursor.checkPosition
6 (AbstractWindowedCursor.java:136)
7 at android.database.AbstractWindowedCursor.getString(AbstractWindowedCursor.java:50)
8 at android.database.CursorWrapper.getString (CursorWrapper.java:114)
9 at com.google.android.wikinotes.WikiNotes.getString_aroundBody76(WikiNotes.java:159)
10 at com.google.android.wikinotes.WikiNotes.getString_aroundBody77
11 $advice(WikiNotes.java:122)
12 at com.google.android.wikinotes.WikiNotes.onResume_aroundBody78(WikiNotes.java:159)
13 at com.google.android.wikinotes.WikiNotes.onResume_aroundBody79
14 $advice(WikiNotes.java:68)
15 at com.google.android.wikinotes.WikiNotes.onResume(WikiNotes.java:1)
16 at android.app.Instrumentation.callActivityOnResume(Instrumentation.java:1184)
17 at android.app.Activity.performResume(Activity.java:5132)
18 at android.app.ActivityThread.performResumeActivity(ActivityThread.java:2669)
19 ... 10 more
Figure 6.3: Stack trace of the crash of WikiNotes.
1 protected void onResume() {
2 super.onResume();
3 Cursor c = mCursor;
4 // Patch start
5 if (c.getCount() < 1) {
6 // if the note can’t be found, don’t try to load it -- bail out
7 // (probably means it got deleted while we were frozen;
8 finish();
9 return;
10 }
11 //Patch end
12 c.requery();
13 c.moveToFirst();
14 showWikiNote(c.getString(
15 c.getColumnIndexOrThrow(
16 WikiNote.Notes.BODY)));
17 }
Figure 6.4: Crash of WikiNotes in activity WikiNotes. Lines 4–11 are the patch for this
bug.
138

can be difficult, especially in the case of software that behaves non-deterministically, relies
on remote resources, or has complex reproduction steps (the users may not even know what
led up to triggering the flaw, particularly in the case of software interacting with external
devices, databases, etc. in addition to human users). We use a record&replay approach
to capture the state of the system just before a bug is encountered, so the steps leading
up to this state can be replayed later. In our study, we use VALERA [61], a lightweight
record-and-replay tool for Android.
As discussed in Section 6.1, we have three possible ways to get the crash event
traces by using the record/replay scheme:
1. Directly extract reproduction steps from the bug report. When the crash reproduction
steps are available, we can record the event trace following these steps and run our
step minimization algorithm. However, the quality of bug reports (and user reviews)
for Android apps in the wild varies considerably as they are often incomplete or
noninformative [31].
2. Use the Monkey tool to randomly generate events to trigger the crash. The downside
is for many apps, we need to login with account and password (e.g., WordPress and
K-9 Mail). But Monkey cannot automatically login and record the following events.
3. Recruit volunteer testers. We can invite our lab colleagues to manually run the app
as normal users and try to trigger the crash. We ask them to write their each action
and record the event traces they used to find the crash.
As mentioned in the bug report description, we can reproduce the crash in WikiNotes
in 6 steps:
139

Type Listener Callback
View
OnClickListener onClickOnLongClickListener onLongClickOnFocusChangeListener onFocusChangeOnTouchListener onTouchOnDragListener onDrag
OnItemClickListener onItemClickAdapter OnItemLongClickListener onItemLongClick
ViewOnItemSelectedListener
onItemSelectedClickonNothingSelected
ListView onListItemClick onItemClick
MenuItem OnMenuItemClickListener onMenuItemClick
AbsListView OnScrollListeneronScrollonScrollStateChanged
Table 6.1: Event and their call backs we consider.
1. Open the app and create one note (either empty or not);
2. Click the “List All Notes” button; the app will go to activity WikiNotesList;
3. Select the note and will go back to WikiNotes;
4. Delete the note by clicking the “Delete Note” button;
5. When the confirmation dialog appears, click “Yes”;
6. Click the “Back” button; then the crash happens.
In our study, we only focus on user events the app evolved with, which represent a
human users interaction with the app. Other events like internet, database connections are
not our concerns. Also we do not consider the inputs, i.e. exact strings we type. Table 6.1
shows the event listeners and their corresponding call back methods we consider in our
study.
140

6.3.2 Generating the Event Dependency Graph
Android apps use event-driven model. There are dependence relations between
events in the program. To use the dependency information to guide our approach, we need
to build the event dependency graph (EDG) first. There are many works that focus on this
process [162,165].
In our study, we first apply static analysis on the app. There are two steps to
generating an EDG for the app:
1. The EDG could be specified manually or generated automatically through one of the
model generation techniques. We use GATOR [154] to generate sub-EDGs for each
activity in the app;
2. Based on the event traces we collect in the previous step, we link the activities and
events executed together and get the whole EDG for the app.
There are 12 events in WikiNotes in total. Figure 6.5 gives the EDG of WikiNotes.
Based on the reproduction steps mentioned in Section 6.3.1 and the EDG we have, there
are two ways to trigger the crash in WikiNotes. The event sequence to trigger the crash is
{e4, e7 or e8, e1, e2, e9} or {e4, e7 or e8, e3, e11 or e5, e2, e9, e12}. Here e4 can be committed
if we install the app and run it for the first time. When we enter the main activity WikiNotes,
it first checks the database; if there is no note in the database, it will automatically jump
to the activity WikiNoteEditor.
141

��������
�������������
����������
���
��������������
�����������������
����������������
���������
���������
������������
����������
�������
�������
���
�������������������
��������������������
����������������
������
�������������������������
�����������������
�������
�������
Fig
ure
6.5:
Eve
nt
dep
end
ency
grap
hof
app
Wik
iNot
es.
142

6.3.3 Our Approach for Delta Debugging
Traditional Delta Debugging (DD) performs a binary search on the inputs. It
splits the inputs into two sub groups and test each of them individually. If any of the two
sub groups trigger the fault, DD marks it as minimal group and recursively searching in it
until no single input can be removed from the group [159].
In our case, since on Android events are not independent, we cannot apply the
traditional DD, and need to find another way to reduce the event trace size. We propose
two approaches for adapting the idea of delta debugging to the problem of reducing the size
of an event trace.
EDG based Delta Debugging Approach
Algorithm 1 shows the EDG-based DD approach. For each trace, we first intialize
trace list T ′ to the shortest path from starting point to crash point. Then we expand the
T ′ by adding possible events into it based on the EDG.
In the first step, we exclude irrelevent events based on the EDG generated in
Section 6.3.2. Since we know the crash causing event and activities, we can mark those
events that cannot be reached in the EDG as irrelevant.
In the next step, we use the replay tool to rerun the app to check whether it crashes
or not until all the events in the traces are marked as “relevant”. During this step, we might
mark some trace as “important” and others as “unimportant” based on their relation with
the crash point.
We use the crash bug of WikiNotes as example. We get the event trace T =
143

Algorithm 1 EDG based Delta Debugging algorithm
Input: Event trace T ← {E0, E1, ..., En}
Output: Candidate traces T ′ ⊆ T of minimum events trigger the crash
1: procedure deltaDebuggingAlgorithm(T )
2: T ′ ← null
3: for each trace T do
4: T ′ ← {E0, En}
5: T ′ ← shortestPath(E0, En, EDG)
6: Replay T ′
7: if No crash triggered then
8: T ′ ← expansion(level, T ′)
9: level← level + 1
10: end if
11: end for
12: end procedure
13: procedure shortestPath(Ei, Ej , EDG)
14: Find parent activity Ai of Ei
15: Find child activity Aj of Ej
16: Find shortest path from Ai to Aj
17: end procedure
18: procedure expansion(level, T ′)
19: level ← 1
20: for activities Ai,j,...,k at the same level of An which is the parent of En do
21: Find all event combinations from parent of Ai,j,...,k to each of them with Breadth First
Search (BFS)
22: Add event into T ′
23: end for
24: end procedure
144

{e7, e1, e3, e11, e4, e8, e4, e7, e3, e5, e2, e10, e1, e4, e7, e2, e9}. In the first step, we put the start
and end event into the candidate set T ′ = {e7, e9}, since e7 pointed to a1 and e9 came
from d1; next we use the generateShortestFirst function to get the shortest path from a1
to d1, we will get T ′ = {e7, e2, e9}. When we replay with this trace, we do not trigger the
crash; thus, we take one step back, and consider all the event combinations that came from
a1. There are 3 possible events, e1, e3, and e4. Also we need to consider all possible ways
coming back from one activity to another, for example, from a3 to a1, we can have e7, e8 or
e12. Finally, from one step back, combined with trace T , we can get reduced candidate T ′ =
{e7, e1, e2, e9}, {e7, e3, e5, e2, e9}, {e7, e3, e11, e2, e9}, {e7, e4, e7, e2, e9}, {e7, e4, e8, e2, e9}. Then,
by replaying with these 5 candidate traces, we can trigger the crash by using {e7, e1, e2, e9}.
After the analysis, it appears that we only need 4 steps to trigger the crash:
1. Open the app and create one note (either empty or not);
2. Click “Go To Start Note”; the app will go to activity WikiNotes;
3. Delete the note by clicking “Delete Note”;
4. When the confirmation dialog appears, click “Yes”; the crash happens.
Improved Delta Debugging Approach
During our study, we found that in the EDGs of many apps, there are many
activities at the same level, hence we have to execute the app too many times to validate
all the possible candidate traces. To reduce the replay times and improve efficiency, we
propose an improved delta debugging approach. We use static information that may be
145

Algorithm 2 Improved Delta Debugging algorithm
1: procedure expansion(level, T ′)
2: level ← 1
3: for activities Ai,j,...,k at the same level of An which is the parent of En do
4: Find all event combinations from parent of Ai,j,...,k to them with Breadth First Search
5: Sort Ai,j,...,k ← relevance(Ai,j,...,k,An)
6: Add sorted events into T ′
7: end for
8: end procedure
9: procedure relevance(Ai,j,...,k,An)
10: for each method (m)/variable (v) used in An do
11: if m/v defined in Ai then
12: Put Ai in the top
13: end if
14: end for
15: end procedure
readily available because the developers, who are familiar with their own code, are often
the ones who debug and fix their apps [163].
In this approach, we consider the dependencies of the activities, for example, if
the crash happened in activity A, and in A the method defined in activity B was called,
then we first consider adding events involved in activity B. The only difference of updated
algorithm comparing with the previous one is Expansion function, the updated algorithm is
given by Algorithm 2.
We use AnkiDroid app to illustrate this approach. The EDG of AnkiDroid is shown
in Figure 6.6. The crash happens when we enter activity Reviewer (a6) after enabling the
146

Launch
er
StudyO
ptions(a
1)
Back(
e23)
DeckPi
cker(a2
)
AllDec
ks(e1)
CardBr
owser(a
3)
CardBr
owser(e
2)
Review
er(a6)
Review
ing(e7
)
MyAcc
ount(a7
)
Sync(e5
)
Prefere
nces(a8
)
Prefere
nces(e1
1)
FactAd
der(a1
2)
CardAd
der(e3
)Cha
rtBuild
er(a16)
Statisti
cs(e6)
Back(e
23)
Person
alDeck
Picker
(a4)
Person
alDeck
(e19)
Shared
DeckPi
cker(a5
)
Shared
Deck(e
20)My
Accoun
t(e14)
Prefere
nces(e1
5)
About(a
10)
About(e
13)
DeckCr
eator(a1
3
CreatD
eck(e1
6)
Feedba
ck(a14
)
Feedba
ck(e12
)
Back(e
23)
Add(e2
1)Bac
k(e23)
Back(e
23)
Back(e
23)
CardEd
itor(a11
)
EditCa
rd(e8)
Back(e
23)
Back(e
23)
Back(e
23)
Back(e
23)Bac
k(e23)
Save(e9
)/Canc
el(e10)
/Back(
e23)
Close(e
4)/Back
(e23)
Close(e
22)/Ba
ck(e23
)OK
(e17)/C
ancel(e
18)/Ba
ck(e23
)Bac
k(e23)
Back(e
23)
Fig
ure
6.6:
Eve
nt
dep
end
ency
grap
hof
app
An
kiD
roid
.
147

1 Caused by:
2 android.database.CursorIndexOutOfBoundsException:
3 Index 0 requested, with a size of 0
4 at android.database.AbstractCursor.checkPosition(AbstractCursor.java:424)
5 at android.database.AbstractWindowedCursor.checkPosition
6 (AbstractWindowedCursor.java:136)
7 at android.database.AbstractWindowedCursor.getString(AbstractWindowedCursor.java:50)
8 at com.ichi2.anki.Field.fieldValuefromDb(Field.java:24)
9 at com.ichi2.anki.Card.getComparedFieldAnswer(Card.java:1037)
10 at com.ichi2.anki.Reviewer$8.onProgressUpdate(Reviewer.java:549)
11 ...
12 at dalvik.system.NativeStart.main(Native Method)
Figure 6.7: Stack trace of the crash of AnkiDroid.
setting “Write answers” in Preference (a8). By applying the algorithm in Section 6.3.3, we
first get the shortest path from a1 to a6, that is T ′ = {e7}. Then we replay T ′ but this does
not trigger the crash. In the next step, we find all the activities at the same level as a6.
We have 6 activities at the same level as a6 which include a2, a3, a7, a8, a12, and a16. For
each of these 6 activities, we find all possible events that go out from them. This gives us
11 candidate events. We find that, since there are too many possibilities to validate from
activity StudyOptions (a1), we would spend too much time and effort to validate all possible
combinations. Therefore we need a better solution to speed up the candidate selection
process.
Based upon the stack trace given in Figure 6.7, and the source code of AnkiDroid in
Figure 6.8, we find that the crash actually happened in method getComparedFieldAnswer which is
called by function onProgressUpdate of activity Reviewer (a6) (line 39 in Figure 6.8). The method
call uses the variable mPrefWriteAnswers (line 30 in Figure 6.8), which is defined in the activity
Preference (a8). Therefore we first add events in a8 and validate them first.
148

1 Card.java
2 public String[] getComparedFieldAnswer() {
3 String[] returnArray = new String[2];
4 CardModel myCardModel = this.getCardModel();
5 String typeAnswer = myCardModel.getTypeAnswer();
6 // fix: Check if we have a valid field to use as the answer to type.
7 if (null == typeAnswer || 0 == typeAnswer.trim().length()) {
8 returnArray[0] = null;
9 // fix:
10 // return returnArray;
11 }
12 Model myModel = Model.getModel(mDeck, myCardModel.getModelId(), true);
13 ...
14 /* fix:
15 // Just in case we do not find the matching field model.
16 if (myFieldModelId == 0) {
17 Log.e(AnkiDroidApp.TAG, "could not find field model for type answer: " +
typeAnswer);
18 returnArray[0] = null;
19 return null;
20 }
21 */
22 returnArray[0] = com.ichi2.anki.Field.fieldValuefromDb(this.mDeck, this.mFactId,
myFieldModelId);
23 returnArray[1] = "fm" + Long.toHexString(myFieldModelId);
24 return returnArray;
25 }
26
27 Reviewer.java
28 private SharedPreferences restorePreferences() {
29 ...
30 mPrefWriteAnswers = preferences.getBoolean("writeAnswers", false);
31 ...
32 }
33 ...
34 public void onProgressUpdate(DeckTask.TaskData... values) {
35 ...
36 // Start reviewing next card
37 mCurrentCard = newCard;
38 if (mPrefWriteAnswers) { //only bother query deck if needed
39 String[] answer = mCurrentCard.getComparedFieldAnswer();
40 comparedFieldAnswer = answer[0];
41 comparedFieldClass = answer[1];
42 } else {
43 comparedFieldAnswer = null;
44 }
45 ...
46 }
Figure 6.8: Fix strategy for the crash of AnkiDroid.
149

6.4 Summary
We prototyped the approach described in Section 6.3. Our approach is useful for
bug reproduction and bug localization. However, currently it can only handle clickable GUI
events. We plan to evaluate our algorithm using more real world apps.
150

Chapter 7
Related Work
This chapter summarizes various research in software engineering community and
problems addressed by this thesis. We first summarize previous research on empirical soft-
ware engineering including bug characteristic studies, using bug reports, e.g., bug location
prediction, bug triaging, duplicate bug report detection. Next we review various studies on
specific types of bugs, e.g., smartphone related bugs, concurrency bugs. Finally, we sum-
marize work on existing software testing and debugging techniques on Android platform.
7.1 Empirical Software Engineering
7.1.1 Bug Characteristic Studies
Bug characteristic studies have been performed on other large software systems [138],
though the objectives of those studies were different, e.g., understanding OS [32] errors. In
contrast, our study focuses specifically on understanding and predicting concurrency bugs.
Many other efforts [15,78,83,90,117] have mined bug and source code repositories to study
151

and analyze the behavior and contributions of developers and their effects on software qual-
ity. Some of the efforts used machine learning for analysis and prediction. In contrast, we
do in-depth analysis and prediction for bugs on different platforms.
7.1.2 Bug Severity Studies
All the existing bug severity studies are focused on predicting severity levels from
a newly-filed bug report. Menzies et al. [105] proposed a classification algorithm named
RIPPER and applied it to bug reports in NASA to output fine-grained severity levels.
Lamkanfi et al. [84] apply various classification algorithms to compare their performance
on severity predicting. They grouped bug reports into two classes, severe and non-severe.
Tian et al. [141] have applied the Nearest Neighbor algorithm to predict the severity of bug
reports in a fine-grained way.
All these works are using information retrieval techniques to predict severity level
of bug reports, but they did not consider the question whether there are differences in bug
characteristics across severity classes. Our findings validate the importance and necessity
of these previous works, and show that severity is an important factor not only for bug
reporters but also for project managers.
7.1.3 Predicting Bug Location
Ostrand et al. [116] used multivariate negative binomial regression model and re-
vealed that variables such as file size, the number of prior faults, newly-introduced and
changed files can be used to predict faults in upcoming releases. Based on the model they
predict the number of faults in each file, and fault density. They found that their Top-20%
152

files predicted to be buggy contained 71%–92% of the detected bugs. Their study, like
ours, has revealed that bug numbers are autocorrelated. However, we use different vari-
ables to construct the predictor model, and instead of predicting the number of bugs per
file and bug density per file, we predict the number of concurrency bugs in the system, and
type/location for newly-filed concurrency bug reports. Kim et al. [78] proposed bug cache
algorithms to predict future bugs at the function/method and file level by observing that
bugs exhibit locality (temporal, spatial) and the fact the entities that have been introduced
or changed recently tend to introduce bugs. Their study was performed on 7 large open
source projects (including Apache). Their accuracy was 73%–95% for files and 46%–72%
for functions/methods. Their study, like ours, has revealed that bug numbers are autocorre-
lated. We do not investigate localities beyond temporal; however, they might help improve
our prediction accuracy.
Wu et al. [151] used time series for bug prediction but did not consider the impact
of independent variables on the time series, as we do. Rao et al. [122] compared five
information retrieval models for the purpose of locating bugs. Their work mainly focused on
comparing models (concluding that Unigram and Vector Space work best) and calculating
the likelihood that one file would be buggy based on its similarity with known buggy files.
We use a different model; we focused on finding the exact location one concurrency bug
would affect; and we had to solve the multi-label classification problem. Moin et al. [107]
used commit logs and bug reports to locate bugs in the source file hierarchy. However, their
method is coarser-grained than ours, e.g., if two bugs are in mozilla/security/nss/lib/certdb
and mozilla/security/nss/lib/pki respectively, they considered the bugs to be in the same
153

location, mozilla/security/nss/lib/, but our prediction model can distinguish the difference
between these two locations.
7.1.4 Topic Modeling
Topic models have been used widely in software engineering research. Prior efforts
have used topic model for bug localization [113], source code evolution [140], duplicate
bug detection [114, 127] and bug triaging [152]. Han et al. [57] studied how fragmentation
manifests across the Android platform and found that labeled-LDA performed better than
LDA for finding feature-relevant topics. Their work focused on two vendors, HTC and
Motorola; we compare bug topics between desktop, Android and iOS. Martie et al. [102]
studied topic trends on Android Platform bugs. They revealed that features of Android are
more problematic in a certain period. They only analyzed bug trends in the Android Platform
project; in our study, we examined 87 additional projects on Android, desktop and iOS.
Our work applies a similar process with previous work [140], but we use topic modeling
technique for a different purpose: finding differences in bug topics across severity classes,
and how bug topics evolve over time.
7.2 Specific Type of Bugs
7.2.1 Studies on Smartphone Bugs
Maji et al. [99] compared defects and their effect on Android and Symbian OS.
They found that development tools, web browsers and multimedia apps are the most defect-
prone; and most bugs require only minor code changes. Their study was focused on the
154

relation between source code and defects, e.g., bug density, types of code changes required
for fixes. We also analyze bugs in Android Platform, but we mainly focus on bug-fixing process
features. Besides Android Platform, we also consider 87 other projects on Android, desktop
and iOS.
Syer et al. [137] compared 15 Android apps with 2 large desktop/server applica-
tions and 3 small Unix utilities on source code metrics and bug fixing time. We examined
38 Android projects, 34 desktop projects and 16 iOS projects. Besides fixing time, we
also consider other features, e.g., severity, description length; we also analyze topics and
reporter/owner trends for each platform.
Zhang et al. [160] tested three of Lehman’s laws on VLC and ownCloud for desktop
and Android. Their work was based on source code metrics, e.g., code churn, total commits.
Our work focuses on bug reports/nature/fixing process.
Our own prior work [21] studied bug reports on Android platform and apps. The
study found that for Android app bugs (especially security bugs), bug report quality is high
while bug triaging is still a problem on Google Code. While there we compared bug report
features across Android apps, in this work we compare bug-fixing process features across
three platforms, study topics, and study feature evolution.
7.2.2 Studies on Concurrent Programs
Lu et al. [93] analyzed 105 concurrency bugs collected from four open source
projects (Mozilla, Apache, OpenOffice, MySQL). Their study focused on understanding
concurrency bug causes and fixing strategies. Fonseca et al. [46] studied internal and exter-
nal effects of concurrency bugs in MySQL. They provide a complementary angle by studying
155

the effects of concurrency bugs (e.g., whether concurrency bugs are latent or not, or what
type of failures they cause). We use a similar methodology for deciding which bugs to ana-
lyze, but with different objectives and methods: characterizing bug features, a quantitative
analysis of the bug-fixing process and constructing prediction models for bug number, type
and location.
7.3 Software Testing & Debugging on Android
7.3.1 Mobile App Testing
Yang et al. [155] implement Orbit tool based on grey-box approach for automatic
exploration. Their approach uses static analysis on the apps source code to detect actions
associated with GUI states and then use a dynamic crawler (built on top of Robotium)
to fire the actions. Anand et al. [11] developed an approach named ACTEVE based on
concolic testing. It can generate sequences of events automatically and systematically.
Their focus is on covering branches while avoiding the path explosion problem. Similarly,
Jensen et al. [67] apply symbolic execution technique to derive event sequences that can
lead to a specific target state in an Android app. Their approach can reach states that
could not be reached using Monkey tool. Mahmood et al. [96] presented EvoDroid, an
evolutionary approach for system testing of Android apps. It extracts interface and call
graph models automatically, and then generates test cases using search-based techniques.
White et al. [149] presents CRASHDROID, an approach for automating the process of
reproducing a bug by translating the call stack from a crash report into expressive steps to
reproduce the bug and a kernel event trace that can be replayed on-demand.
156
7.3.2 Delta Debugging
Delta debugging is a family of algorithms for sequence minimization and fault iso-
lation, described originally by Zeller et al. [159] . Burger el al. [29] presented JINSI which
used delta debugging to record and minimize the interaction between objects to the set of
calls relevant for the failure. Roehm et al. [125] presented an approach to automatically
extract failure reproduction steps from user interaction traces by applying both delta de-
bugging and sequential pattern mining. It is used for desktop applications. Elyasov et
al. [37, 38] proposed a two stage approach for reduction of the failing event sequence, that
consists of 1) mining rewriting rules from the set of collected logs, and 2) applying these
rules to the failing sequence with the purpose of sequence length reduction. Hammoudi
et al. [56] presented an approach for recording reduction based on delta debugging that
operates on recordings of web applications. Clapp et al. [33] propose a variant of delta
debugging algorithm to handle non-determinism which is a pervasive issue in app behavior
and solve the problem of trace minimization.
157

Chapter 8
Conclusions and Future Work
8.1 Contributions
The main contribution of this dissertation was to extract actionable information
from bug reports, e.g., for evaluating product quality, reducing the time and human effort
for bug fixing process and speeding up the debugging process. To this end, this dissertation
makes the following fundamental contributions to the field of software engineering.
8.1.1 A Cross-platform Analysis of Bugs
Bug-fixing process features (e.g., fix time, number of comments) differ between
desktop and the two smartphone platforms, but are similar for Android and iOS. We also
found that the most frequent issues differ across platforms. Furthermore, concurrency bugs
are much more prevalent on Android than on iOS. Despite the attention they have received
in the research community, we found that issues commonly associated with smartphone
apps such as energy, security and performance, are not very prevalent.
158

8.1.2 Empirical Study of Concurrency Bugs
For each bug type, we analyzed multiple facets (e.g., patches, files, comments, and
developers involved) to characterize the process involved in, and differences between, fixing
concurrency and non-concurrency bugs. We found that compared to non-concurrency bugs,
concurrency bugs take twice as long to fix, require patches that are 4 times larger. Within
concurrency bugs, we found that atomicity violations are the most complicated bugs, taking
highest amounts of time, developers and patches to fix, while deadlocks are the easiest and
fastest to fix.
Using the historic values of these bug characteristics, we construct two models to
predict the number of extant concurrency bugs that will have to be fixed in future releases:
a model based on generalized linear regression and one based on time series forecasting.
Our predicted number of concurrency bugs differed very little from the actual number:
depending on the bug type, our prediction was off by just 0.17–0.54 bugs.
While these quantitative predictors provide managers an estimate of the number
of upcoming concurrency bugs, to help developers we constructed two additional, qualitative
predictors. First, a bug type predictor that can predict the likely type of a newly-filed bug
concurrency bug, e.g., atomicity violation or deadlock with at least 63% accuracy. Second,
a bug location predictor that predicts the likely bug location from a new bug report with
at least 22% Top-1 accuracy and 55% Top-20% accuracy.
159
8.1.3 Bug Analysis Across Severity Classes
Severity changes are more frequent on Android, where some projects have change
rates in excess of 20%, than on desktop. Bug-fix time is affected by not only severity
but also priority. Interestingly, there are marked quantitative difference between the three
severity classes on desktop, but the differences are more muted on Android. Fixing medium-
severity bugs imposes a greater workload than fixing high-severity bugs. Medium-severity
bug reporters/owners are more experienced than high-severity bug reporters/owners. There
have been more concurrency and cloud-related high-severity bugs on desktop since 2009,
while on Android concurrency bugs have been and continue to be prevalent. Since our study
reveals that bug-fixing process attributes and developer traits differ across severity levels,
our work confirms the importance of prior work that has focused on accurately predicting
bug severity [84,105,141].
8.1.4 Minimizing Bug Reproduction Steps on Android
We proposed an approach to collect execution data automatically and extract
minimized reproduction steps from captured data by using a record/replay scheme. We
generate an event dependency graph (EDG) based on app execution. Then we use the
EDG with event sequences to guide the delta debugging algorithm by eliminating irrelevant
events.
160

8.2 Future Directions
8.2.1 Mixture Use of Data Sources
In our quantitative studies in Sections 3.2, 4.3, and 5.2, we only extract bug fixing
features from the bug tracking system, without looking at source code. Therefore, future
work can extract metrics from source code repository, e.g., McCabe cyclomatic complexity,
lines of code, number of classes, number of methods, number of parameters [166,168], etc.,
and build quantitative studies using these metrics. Furthermore, we can build combined
prediction models by applying both features extracted from source code repository and bug
tracking system.
8.2.2 Study of General Applications
Our study focused on open source applications; thus the findings might not general-
ize to closed source applications. Therefore, future work can analyze the bug characteristics
and topics on the specific domains.
Additionally, in Section 3.4 we introduced our finding on projects migrating to
GitHub. We can investigate how we can extract actionable information from bug reports
hosted on GitHub.
8.2.3 Minimizing Event Trace on Android
Our study in the dissertation only focused on click events on Android. There
are other event types (e.g., input numbers/characters, system related) that we have not
handled. To support these additional types of events, we can apply symbolic execution
161

techniques. However, the existing symbolic execution tools [23] supporting Android cannot
be used in our study since they can only cover part of the system calls. We can develop a
new symbolic execution tool and continue our study in the future.
162
Bibliography
[1] Android asynctask. http://developer.android.com/reference/android/os/
AsyncTask.html.
[2] Android processes and threads. http://developer.android.com/guide/
components/processes-and-threads.html.
[3] Android version history. https://en.wikipedia.org/wiki/Android_version_
history.
[4] Grand central dispatch reference. https://developer.apple.com/library/
mac/documentation/performance/reference/gcd_libdispatch_ref/Reference/
reference.html.
[5] ios threading programming guide. https://developer.apple.com/library/
ios/documentation/Cocoa/Conceptual/Multithreading/Introduction/
Introduction.html.
[6] Ui/application exerciser monkey. https://developer.android.com/studio/test/
monkey.html.
[7] Investigating konqueror bugs, 2014. http://www.konqueror.org/investigatebug/.
[8] Mozilla bug writing guidelines, 2014. https://developer.mozilla.org/en-US/
docs/Mozilla/QA/Bug_writing_guidelines.
[9] H. Akaike. A new look at the statistical model identification. IEEE Transactions onAutomatic Control, 19(6):716–723, Dec 1974.
[10] Domenico Amalfitano, Anna Rita Fasolino, Porfirio Tramontana, SalvatoreDe Carmine, and Atif M. Memon. Using gui ripping for automated testing of an-droid applications. In Proceedings of the 27th IEEE/ACM International Conferenceon Automated Software Engineering, ASE 2012, pages 258–261, 2012.
[11] Saswat Anand, Mayur Naik, Mary Jean Harrold, and Hongseok Yang. Automatedconcolic testing of smartphone apps. In Proceedings of the ACM SIGSOFT 20thInternational Symposium on the Foundations of Software Engineering, FSE ’12, pages59:1–59:11, 2012.
163

[12] Apache Software Foundation Bugzilla. Apachebugs. https://issues.apache.org/
bugzilla/.
[13] Griatch Art. Moving from google code to github. http://evennia.blogspot.com/
2014/02/moving-from-google-code-to-github.html.
[14] Steven Arzt, Siegfried Rasthofer, Christian Fritz, Eric Bodden, Alexandre Bartel,Jacques Klein, Yves Le Traon, Damien Octeau, and Patrick McDaniel. Flowdroid:Precise context, flow, field, object-sensitive and lifecycle-aware taint analysis for an-droid apps. In Proceedings of the 35th ACM SIGPLAN Conference on ProgrammingLanguage Design and Implementation, PLDI ’14, pages 259–269, 2014.
[15] K. Ayari, P. Meshkinfam, G. Antoniol, and M. Di Penta. Threats on building modelsfrom cvs and bugzilla repositories: The mozilla case study. In Proceedings of the 2007Conference of the Center for Advanced Studies on Collaborative Research, CASCON’07, pages 215–228, 2007.
[16] Tanzirul Azim and Iulian Neamtiu. Targeted and depth-first exploration for system-atic testing of android apps. In Proceedings of the 2013 ACM SIGPLAN InternationalConference on Object Oriented Programming Systems Languages & Applications,OOPSLA ’13, pages 641–660, 2013.
[17] A. Bachmann and A. Bernstein. When process data quality affects the number of bugs:Correlations in software engineering datasets. In 2010 7th IEEE Working Conferenceon Mining Software Repositories (MSR 2010), pages 62–71, May 2010.
[18] Yoav Benjamini and Yosef Hochberg. Controlling the False Discovery Rate: A Prac-tical and Powerful Approach to Multiple Testing. Journal of the Royal StatisticalSociety. Series B (Methodological), 57(1):289–300, 1995.
[19] Mario Luca Bernardi, Carmine Sementa, Quirino Zagarese, Damiano Distante, andMassimiliano Di Penta. What topics do firefox and chrome contributors discuss? InProceedings of the 8th Working Conference on Mining Software Repositories, MSR’11, pages 234–237, 2011.
[20] Pamela Bhattacharya, Iulian Neamtiu, and Christian R. Shelton. Automated, highly-accurate, bug assignment using machine learning and tossing graphs. J. Syst. Softw.,85(10):2275–2292, October 2012.
[21] Pamela Bhattacharya, Liudmila Ulanova, Iulian Neamtiu, and Sai Charan Koduru.An empirical analysis of bug reports and bug fixing in open source android apps.In Proceedings of the 2013 17th European Conference on Software Maintenance andReengineering, CSMR ’13, pages 133–143, 2013.
[22] T. F. Bissyand, D. Lo, L. Jiang, L. Rveillre, J. Klein, and Y. L. Traon. Got issues?who cares about it? a large scale investigation of issue trackers from github. In 2013IEEE 24th International Symposium on Software Reliability Engineering (ISSRE),pages 188–197, Nov 2013.
164

[23] Sam Blackshear, Bor-Yuh Evan Chang, and Manu Sridharan. Thresher: Precise refu-tations for heap reachability. In Proceedings of the 34th ACM SIGPLAN Conferenceon Programming Language Design and Implementation, PLDI ’13, pages 275–286,New York, NY, USA, 2013. ACM.
[24] David M. Blei. Probabilistic topic models. Commun. ACM, 55(4):77–84, April 2012.
[25] David M. Blei, Andrew Y. Ng, and Michael I. Jordan. Latent dirichlet allocation. J.Mach. Learn. Res., 3:993–1022, March 2003.
[26] George Edward Pelham Box and Gwilym Jenkins. Time Series Analysis, Forecastingand Control, 5th Edition. Holden-Day, Incorporated, 2015.
[27] Chandrasekhar Boyapati, Robert Lee, and Martin Rinard. Ownership types for safeprogramming: Preventing data races and deadlocks. In Proceedings of the 17th ACMSIGPLAN Conference on Object-oriented Programming, Systems, Languages, and Ap-plications, OOPSLA ’02, pages 211–230, 2002.
[28] Silvia Breu, Rahul Premraj, Jonathan Sillito, and Thomas Zimmermann. Informa-tion needs in bug reports: Improving cooperation between developers and users. InProceedings of the 2010 ACM Conference on Computer Supported Cooperative Work,CSCW ’10, pages 301–310, 2010.
[29] Martin Burger and Andreas Zeller. Minimizing reproduction of software failures. InProceedings of the 2011 International Symposium on Software Testing and Analysis,ISSTA ’11, pages 221–231, 2011.
[30] Subhachandra Chandra and Peter M. Chen. Whither generic recovery from appli-cation faults? a fault study using open-source software. In Proceedings of the 2000International Conference on Dependable Systems and Networks (Formerly FTCS-30and DCCA-8), DSN ’00, pages 97–106, 2000.
[31] Ning Chen, Jialiu Lin, Steven C. H. Hoi, Xiaokui Xiao, and Boshen Zhang. Ar-miner: Mining informative reviews for developers from mobile app marketplace. InProceedings of the 36th International Conference on Software Engineering, ICSE 2014,pages 767–778, 2014.
[32] Andy Chou, Junfeng Yang, Benjamin Chelf, Seth Hallem, and Dawson Engler. Anempirical study of operating systems errors. In Proceedings of the Eighteenth ACMSymposium on Operating Systems Principles, SOSP ’01, pages 73–88, 2001.
[33] Lazaro Clapp, Osbert Bastani, Saswat Anand, and Alex Aiken. Minimizing gui eventtraces. In Proceedings of the ACM SIGSOFT 24th International Symposium on theFoundations of Software Engineering, FSE ’16, page to appear, 2016.
[34] Holger Cleve and Andreas Zeller. Locating causes of program failures. In Proceedingsof the 27th International Conference on Software Engineering, ICSE ’05, pages 342–351, 2005.
165

[35] Kevin Crowston and Barbara Scozzi. Bug fixing practices within free/libre opensource software development teams. Journal of Database Management, 19(2):1–30,2008.
[36] Cleidson R. B. de Souza, David Redmiles, Li-Te Cheng, David Millen, and John Pat-terson. How a good software practice thwarts collaboration: The multiple roles of apisin software development. In Proceedings of the 12th ACM SIGSOFT Twelfth Inter-national Symposium on Foundations of Software Engineering, SIGSOFT ’04/FSE-12,pages 221–230, 2004.
[37] Alexander Elyasov, I. S. Wishnu B. Prasetya, and Jurriaan Hage. Guided AlgebraicSpecification Mining for Failure Simplification, pages 223–238. Springer Berlin Hei-delberg, Berlin, Heidelberg, 2013.
[38] Alexander Elyasov, Wishnu Prasetya, Jurriaan Hage, and Andreas Nikas. Reducefirst, debug later. In Proceedings of the 9th International Workshop on Automationof Software Test, AST 2014, pages 57–63, 2014.
[39] Dawson Engler and Ken Ashcraft. Racerx: Effective, static detection of race condi-tions and deadlocks. In Proceedings of the Nineteenth ACM Symposium on OperatingSystems Principles, SOSP ’03, pages 237–252, 2003.
[40] Eitan Farchi, Yarden Nir, and Shmuel Ur. Concurrent bug patterns and how to testthem. In Proceedings of the 17th International Symposium on Parallel and DistributedProcessing, IPDPS ’03, pages 286.2–, 2003.
[41] Donald Eugene Farrar and Robert R Glauber. Multicollinearity in regression analysis:The problem revisited. The Review of Economics and Statistics, 49(1):92–107, 1967.
[42] Cormac Flanagan and Martın Abadi. Types for safe locking. In S. Doaitse Swier-stra, editor, Programming Languages and Systems: 8th European Symposium on Pro-gramming, ESOP’99 Held as Part of the Joint European Conferences on Theory andPractice of Software, ETAPS’99 Amsterdam, The Netherlands, March 22–28, 1999Proceedings, pages 91–108, 1999.
[43] Cormac Flanagan and Stephen N Freund. Atomizer: A dynamic atomicity checkerfor multithreaded programs. volume 39, pages 256–267, January 2004.
[44] Cormac Flanagan, Stephen N. Freund, and Marina Lifshin. Type inference for atom-icity. In Proceedings of the 2005 ACM SIGPLAN International Workshop on Typesin Languages Design and Implementation, TLDI ’05, pages 47–58, 2005.
[45] Cormac Flanagan and Shaz Qadeer. A type and effect system for atomicity. In Pro-ceedings of the ACM SIGPLAN 2003 Conference on Programming Language Designand Implementation, PLDI ’03, pages 338–349, 2003.
[46] P. Fonseca, Cheng Li, V. Singhal, and R. Rodrigues. A study of the internal andexternal effects of concurrency bugs. In 2010 IEEE/IFIP International Conferenceon Dependable Systems Networks (DSN), pages 221–230, June 2010.
166
[47] Carlo Ghezzi, Mehdi Jazayeri, and Dino Mandrioli. Fundamentals of Software Engi-neering. Prentice Hall PTR, Upper Saddle River, NJ, USA, 2nd edition, 2002.
[48] Emanuel Giger, Martin Pinzger, and Harald Gall. Predicting the fix time of bugs.In Proceedings of the 2Nd International Workshop on Recommendation Systems forSoftware Engineering, RSSE ’10, pages 52–56, 2010.
[49] Daniel L. Gillen and Scott S. Emerson. Nontransitivity in a class of weighted logrankstatistics under nonproportional hazards. Statistics & Probability Letters, 77(2):123 –130, 2007.
[50] Lorenzo Gomez, Iulian Neamtiu, Tanzirul Azim, and Todd Millstein. Reran: Timing-and touch-sensitive record and replay for android. In Proceedings of the 2013 Inter-national Conference on Software Engineering, ICSE ’13, pages 72–81, 2013.
[51] Marıa Gomez, Romain Rouvoy, Bram Adams, and Lionel Seinturier. Reproducingcontext-sensitive crashes of mobile apps using crowdsourced monitoring. In Proceed-ings of the International Conference on Mobile Software Engineering and Systems,MOBILESoft ’16, pages 88–99, 2016.
[52] Kirill Grouchnikov. Shifting gears: from desktop to mobile, 2010. http://www.
pushing-pixels.org/2010/08/02/shifting-gears-from-desktop-to-mobile.
html.
[53] Weining Gu, Z. Kalbarczyk, Ravishankar, K. Iyer, and Zhenyu Yang. Characterizationof linux kernel behavior under errors. In Dependable Systems and Networks, 2003.Proceedings. 2003 International Conference on, pages 459–468, June 2003.
[54] Philip J. Guo, Thomas Zimmermann, Nachiappan Nagappan, and Brendan Murphy.Characterizing and predicting which bugs get fixed: An empirical study of microsoftwindows. In Proceedings of the 32Nd ACM/IEEE International Conference on Soft-ware Engineering - Volume 1, ICSE ’10, pages 495–504, 2010.
[55] Mark Hall, Eibe Frank, Geoffrey Holmes, Bernhard Pfahringer, Peter Reutemann,and Ian H. Witten. The weka data mining software: An update. SIGKDD Explor.Newsl., 11(1):10–18, November 2009.
[56] Mouna Hammoudi, Brian Burg, Gigon Bae, and Gregg Rothermel. On the use ofdelta debugging to reduce recordings and facilitate debugging of web applications. InProceedings of the 2015 10th Joint Meeting on Foundations of Software Engineering,ESEC/FSE 2015, pages 333–344, 2015.
[57] Dan Han, Chenlei Zhang, Xiaochao Fan, Abram Hindle, Kenny Wong, and EleniStroulia. Understanding android fragmentation with topic analysis of vendor-specificbugs. In Proceedings of the 2012 19th Working Conference on Reverse Engineering,WCRE ’12, pages 83–92, 2012.
[58] Ariya Hidayat. Issue tracker: Github vs google code. http://ariya.ofilabs.com/
2012/11/issue-tracker-github-vs-google-code.html.
167

[59] Pieter Hooimeijer and Westley Weimer. Modeling bug report quality. In Proceedingsof the Twenty-second IEEE/ACM International Conference on Automated SoftwareEngineering, ASE ’07, pages 34–43, 2007.
[60] David Hovemeyer and William Pugh. Finding bugs is easy. SIGPLAN Not., 39(12):92–106, December 2004.
[61] Yongjian Hu, Tanzirul Azim, and Iulian Neamtiu. Versatile yet lightweight record-and-replay for android. In Proceedings of the 2015 ACM SIGPLAN InternationalConference on Object-Oriented Programming, Systems, Languages, and Applications,OOPSLA 2015, pages 349–366, 2015.
[62] LiGuo Huang, V. Ng, I. Persing, Ruili Geng, Xu Bai, and Jeff Tian. Autoodc: Au-tomated generation of orthogonal defect classifications. In Automated Software Engi-neering (ASE), 2011 26th IEEE/ACM International Conference on, pages 412–415,Nov 2011.
[63] IDC. Android rises, symbian 3 and windows phone 7 launch as worldwide smart-phone shipments increase 87.2% year over year, 2011. http://www.idc.com/about/
viewpressrelease.jsp?containerId=prUS22689111.
[64] IDC. Tablet shipments forecast to top total pc shipments in the fourth quarter of2013 and annually by 2015, according to idc, 2013. http://www.idc.com/getdoc.
jsp?containerId=prUS24314413.
[65] Curtis S. Ikehara, Jiecai He, and Martha E. Crosby. Issues in Implementing Aug-mented Cognition and Gamification on a Mobile Platform, pages 685–694. SpringerBerlin Heidelberg, Berlin, Heidelberg, 2013.
[66] Stuart Jarvis. Kde voted free software project of the year, 2013. http://dot.kde.
org/2009/01/20/kde-voted-free-software-project-year.
[67] Casper S. Jensen, Mukul R. Prasad, and Anders Møller. Automated testing with tar-geted event sequence generation. In Proceedings of the 2013 International Symposiumon Software Testing and Analysis, ISSTA 2013, pages 67–77, 2013.
[68] Gaeul Jeong, Sunghun Kim, and Thomas Zimmermann. Improving bug triage withbug tossing graphs. In Proceedings of the the 7th Joint Meeting of the EuropeanSoftware Engineering Conference and the ACM SIGSOFT Symposium on The Foun-dations of Software Engineering, ESEC/FSE ’09, pages 111–120, 2009.
[69] Feng Jiang, Jiemin Wang, Abram Hindle, and Mario A. Nascimento. Mining thetemporal evolution of the android bug reporting community via sliding windows.CoRR, abs/1310.7469, 2013.
[70] Guoliang Jin, Linhai Song, Xiaoming Shi, Joel Scherpelz, and Shan Lu. Understand-ing and detecting real-world performance bugs. In Proceedings of the 33rd ACMSIGPLAN Conference on Programming Language Design and Implementation, PLDI’12, pages 77–88, 2012.
168

[71] Jerald B. Johnson and Kristian S. Omland. Model selection in ecology and evolution.Trends in Ecology and Evolution, 19(2):101–108, 2004.
[72] Sascha Just, Rahul Premraj, and Thomas Zimmermann. Towards the next generationof bug tracking systems. In Proceedings of the 2008 IEEE Symposium on VisualLanguages and Human-Centric Computing, VLHCC ’08, pages 82–85, 2008.
[73] Peter Kampstra. Beanplot: A boxplot alternative for visual comparison of distribu-tions. Journal of Statistical Software, Code Snippets, 28(1):1–9, 11 2008.
[74] Amy K. Karlson, Shamsi T. Iqbal, Brian Meyers, Gonzalo Ramos, Kathy Lee, andJohn C. Tang. Mobile taskflow in context: A screenshot study of smartphone usage.In Proceedings of the SIGCHI Conference on Human Factors in Computing Systems,CHI ’10, pages 2009–2018, 2010.
[75] KDE Bugtracking System. Kdebugs. https://bugs.kde.org/.
[76] Gregg Keizer. Mozilla ships Firefox 5, holds to new rapid-release plan, Computer-world, June 2011. http://www.computerworld.com/s/article/9217813/Mozilla_
ships_Firefox_5_holds_to_new_rapid_release_plan.
[77] Martin Kenney and Bryan Pon. Structuring the smartphone industry: Is the mobileinternet os platform the key? Journal of Industry, Competition and Trade, 11(3):239–261, 2011.
[78] Sunghun Kim, Thomas Zimmermann, E. James Whitehead Jr., and Andreas Zeller.Predicting faults from cached history. In Proceedings of the 29th International Con-ference on Software Engineering, ICSE ’07, pages 489–498, 2007.
[79] Andrew J. Ko and Parmit K. Chilana. How power users help and hinder open bugreporting. In Proceedings of the SIGCHI Conference on Human Factors in ComputingSystems, CHI ’10, pages 1665–1674, 2010.
[80] Jussi Koskinen. Software maintenance costs, Sept 2003. http://users.jyu.fi/
~koskinen/smcosts.htm.
[81] KPMG. 2013 technology industry outlook survey, 2013. http://www.
kpmg.com/US/en/IssuesAndInsights/ArticlesPublications/Documents/
technology-outlook-survey-2013.pdf.
[82] A. Lamkanfi and S. Demeyer. Filtering bug reports for fix-time analysis. In SoftwareMaintenance and Reengineering (CSMR), 2012 16th European Conference on, pages379–384, March 2012.
[83] A. Lamkanfi, S. Demeyer, E. Giger, and B. Goethals. Predicting the severity of areported bug. In 2010 7th IEEE Working Conference on Mining Software Repositories(MSR 2010), pages 1–10, May 2010.
169

[84] A. Lamkanfi, S. Demeyer, Q. D. Soetens, and T. Verdonck. Comparing mining al-gorithms for predicting the severity of a reported bug. In Software Maintenance andReengineering (CSMR), 2011 15th European Conference on, pages 249–258, March2011.
[85] E. I. Laukkanen and M. V. Mantyla. Survey reproduction of defect reporting in indus-trial software development. In 2011 International Symposium on Empirical SoftwareEngineering and Measurement, pages 197–206, Sept 2011.
[86] Zhenmin Li, Lin Tan, Xuanhui Wang, Shan Lu, Yuanyuan Zhou, and ChengxiangZhai. Have things changed now?: An empirical study of bug characteristics in modernopen source software. In Proceedings of the 1st Workshop on Architectural and SystemSupport for Improving Software Dependability, ASID ’06, pages 25–33, 2006.
[87] Zhenmin Li and Yuanyuan Zhou. Pr-miner: Automatically extracting implicitprogramming rules and detecting violations in large software code. In Proceed-ings of the 10th European Software Engineering Conference Held Jointly with 13thACM SIGSOFT International Symposium on Foundations of Software Engineering,ESEC/FSE-13, pages 306–315, 2005.
[88] Eckhard Limpert, Werner A. Stahel, and Markus Abbt. Log-normal distributionsacross the sciences: Keys and clues. BioScience, 51(5):341–352, 2009.
[89] Yu Lin, Cosmin Radoi, and Danny Dig. Retrofitting concurrency for android applica-tions through refactoring. In Proceedings of the 22Nd ACM SIGSOFT InternationalSymposium on Foundations of Software Engineering, FSE 2014, pages 341–352, 2014.
[90] M. Linares-Vsquez, K. Hossen, H. Dang, H. Kagdi, M. Gethers, and D. Poshyvanyk.Triaging incoming change requests: Bug or commit history, or code authorship? InSoftware Maintenance (ICSM), 2012 28th IEEE International Conference on, pages451–460, Sept 2012.
[91] J.S. Long. Regression Models for Categorical and Limited Dependent Variables. SAGEPublications, 1997.
[92] Francesca Longo, Roberto Tiella, Paolo Tonella, and Adolfo Villafiorita. Measuringthe impact of different categories of software evolution. In Proceedings of the Interna-tional Conferences on Software Process and Product Measurement, IWSM/Metrikon/-Mensura ’08, pages 344–351, 2008.
[93] Shan Lu, Soyeon Park, Eunsoo Seo, and Yuanyuan Zhou. Learning from mistakes:A comprehensive study on real world concurrency bug characteristics. In Proceed-ings of the 13th International Conference on Architectural Support for ProgrammingLanguages and Operating Systems, ASPLOS XIII, pages 329–339, 2008.
[94] Shan Lu, Joseph Tucek, Feng Qin, and Yuanyuan Zhou. Avio: Detecting atomicityviolations via access interleaving invariants. In Proceedings of the 12th InternationalConference on Architectural Support for Programming Languages and Operating Sys-tems, ASPLOS XII, pages 37–48, 2006.
170

[95] Brandon Lucia, Benjamin P. Wood, and Luis Ceze. Isolating and understanding con-currency errors using reconstructed execution fragments. In Proceedings of the 32NdACM SIGPLAN Conference on Programming Language Design and Implementation,PLDI ’11, pages 378–388, 2011.
[96] Riyadh Mahmood, Nariman Mirzaei, and Sam Malek. Evodroid: Segmented evolu-tionary testing of android apps. In Proceedings of the 22Nd ACM SIGSOFT Interna-tional Symposium on Foundations of Software Engineering, FSE 2014, pages 599–609,2014.
[97] Pallavi Maiya, Aditya Kanade, and Rupak Majumdar. Race detection for androidapplications. In PLDI’14, pages 316–325, 2014.
[98] Pallavi Maiya, Aditya Kanade, and Rupak Majumdar. Race detection for androidapplications. In Proceedings of the 35th ACM SIGPLAN Conference on ProgrammingLanguage Design and Implementation, PLDI ’14, pages 316–325, 2014.
[99] Amiya Kumar Maji, Kangli Hao, Salmin Sultana, and Saurabh Bagchi. Characterizingfailures in mobile oses: A case study with android and symbian. In Proceedings of the2010 IEEE 21st International Symposium on Software Reliability Engineering, ISSRE’10, pages 249–258, 2010.
[100] Josh Manchester. Software revolution, part iv: Computing in a mo-bile world, 2013. http://www.forbes.com/sites/truebridge/2013/10/22/
software-revolution-part-iv-computing-in-a-mobile-world/.
[101] Christopher D. Manning, Prabhakar Raghavan, and Hinrich Schutze. Introduction toInformation Retrieval. Cambridge University Press, New York, NY, USA, 2008.
[102] L. Martie, V. K. Palepu, H. Sajnani, and C. Lopes. Trendy bugs: Topic trends inthe android bug reports. In Mining Software Repositories (MSR), 2012 9th IEEEWorking Conference on, pages 120–123, June 2012.
[103] Andrew Kachites McCallum. MALLET: A Machine Learning for Language Toolkit.http://mallet.cs.umass.edu, 2002.
[104] Tyler McDonnell, Baishakhi Ray, and Miryung Kim. An empirical study of api sta-bility and adoption in the android ecosystem. In Proceedings of the 2013 IEEE Inter-national Conference on Software Maintenance, ICSM ’13, pages 70–79, 2013.
[105] T. Menzies and A. Marcus. Automated severity assessment of software defect reports.In Software Maintenance, 2008. ICSM 2008. IEEE International Conference on, pages346–355, Sept 2008.
[106] Audris Mockus, Roy T. Fielding, and James D. Herbsleb. Two case studies of opensource software development: Apache and mozilla. TOSEM, 11(3):309–346, July 2002.
171

[107] Amir H. Moin and Mohammad Khansari. Bug localization using revision log analysisand open bug repository text categorization. In Par Agerfalk, Cornelia Boldyreff,Jesus M. Gonzalez-Barahona, Gregory R. Madey, and John Noll, editors, Open SourceSoftware: New Horizons: 6th International IFIP WG 2.13 Conference on Open SourceSystems, OSS 2010, Notre Dame, IN, USA, May 30 – June 2, 2010. Proceedings,pages 188–199. Springer Berlin Heidelberg, Berlin, Heidelberg, 2010.
[108] Mozilla Bugzilla. Bugzilla. https://bugzilla.mozilla.org/.
[109] R.H. Myers. Classical and modern regression with applications. Duxbury advancedseries in statistics and decision sciences. PWS-KENT, Boston, MA, USA, 1990.
[110] S. Neuhaus and T. Zimmermann. Security trend analysis with cve topic models. In2010 IEEE 21st International Symposium on Software Reliability Engineering, pages111–120, Nov 2010.
[111] Stephan Neuhaus, Thomas Zimmermann, Christian Holler, and Andreas Zeller. Pre-dicting vulnerable software components. In Proceedings of the 14th ACM Conferenceon Computer and Communications Security, CCS ’07, pages 529–540, 2007.
[112] Jared Newman. How mobile apps are changing desktop software, 2012. http://www.pcworld.com/article/259110/app_invasion_coming_soon_to_your_pc.html.
[113] A. T. Nguyen, T. T. Nguyen, J. Al-Kofahi, H. V. Nguyen, and T. N. Nguyen. A topic-based approach for narrowing the search space of buggy files from a bug report. InAutomated Software Engineering (ASE), 2011 26th IEEE/ACM International Con-ference on, pages 263–272, Nov 2011.
[114] Anh Tuan Nguyen, Tung Thanh Nguyen, Tien N. Nguyen, David Lo, and ChengnianSun. Duplicate bug report detection with a combination of information retrieval andtopic modeling. In Proceedings of the 27th IEEE/ACM International Conference onAutomated Software Engineering, ASE 2012, pages 70–79, 2012.
[115] Alessandro Orso. Monitoring, analysis, and testing of deployed software. In Proceed-ings of the FSE/SDP Workshop on Future of Software Engineering Research, FoSER’10, pages 263–268, 2010.
[116] T. J. Ostrand, E. J. Weyuker, and R. M. Bell. Predicting the location and numberof faults in large software systems. IEEE Transactions on Software Engineering,31(4):340–355, April 2005.
[117] Jihun Park, Miryung Kim, Baishakhi Ray, and Doo-Hwan Bae. An empirical studyof supplementary bug fixes. In Proceedings of the 9th IEEE Working Conference onMining Software Repositories, MSR ’12, pages 40–49, 2012.
[118] Sangmin Park, Richard W. Vuduc, and Mary Jean Harrold. Falcon: Fault localiza-tion in concurrent programs. In Proceedings of the 32Nd ACM/IEEE InternationalConference on Software Engineering - Volume 1, ICSE ’10, pages 245–254, 2010.
172

[119] Christy Pettey. Gartner says worldwide software market grew 4.8 percent in 2013,2014. http://www.gartner.com/newsroom/id/2696317.
[120] Polyvios Pratikakis, Jeffrey S. Foster, and Michael Hicks. Locksmith: Practical staticrace detection for c. ACM Trans. Program. Lang. Syst., 33(1):3:1–3:55, January 2011.
[121] R Core Team. R: A Language and Environment for Statistical Computing. R Foun-dation for Statistical Computing, 2012.
[122] Shivani Rao and Avinash Kak. Retrieval from software libraries for bug localization:A comparative study of generic and composite text models. In Proceedings of the 8thWorking Conference on Mining Software Repositories, MSR ’11, pages 43–52, 2011.
[123] Jeremias Roβler, Gordon Fraser, Andreas Zeller, and Alessandro Orso. Isolatingfailure causes through test case generation. In Proceedings of the 2012 InternationalSymposium on Software Testing and Analysis, ISSTA 2012, pages 309–319, 2012.
[124] Giampaolo Rodola. Goodbye google code, i’m moving to github. http://grodola.
blogspot.com/2014/05/goodbye-google-code-im-moving-to-github.html.
[125] T. Roehm, S. Nosovic, and B. Bruegge. Automated extraction of failure reproductionsteps from user interaction traces. In 2015 IEEE 22nd International Conference onSoftware Analysis, Evolution, and Reengineering (SANER), pages 121–130, March2015.
[126] Mikko Ronkko and Juhana Peltonen. Software industry survey 2013, 2013. http:
//www.softwareindustrysurvey.org/.
[127] Per Runeson, Magnus Alexandersson, and Oskar Nyholm. Detection of duplicate de-fect reports using natural language processing. In Proceedings of the 29th InternationalConference on Software Engineering, ICSE ’07, pages 499–510, 2007.
[128] Robert C. seacord, Daniel Plakosh, and Grace A. Lewis. Modernizing Legacy Systems:Software Technologies, Engineering Process and Business Practices. Addison-WesleyLongman Publishing Co., Inc., Boston, MA, USA, 2003.
[129] J. Shalf, K. Asanovic, D. Patterson, K. Keutzer, T. Mattson, and K. Yelick. Themanycore revolution: Will the hpc community lead or follow? SciDAC Review, 2009.
[130] Emad Shihab, Akinori Ihara, Yasutaka Kamei, Walid M. Ibrahim, Masao Ohira,Bram Adams, Ahmed E. Hassan, and Ken-ichi Matsumoto. Studying re-opened bugsin open source software. Empirical Software Engineering, 18(5):1005–1042, 2013.
[131] Ian Sommerville. Software Engineering (7th Edition). Pearson Addison Wesley, 2004.
[132] SWM Staff. 2015 software 500, 2015. http://www.softwaremag.com/
2015-software-500/.
173

[133] Jiang Su, Harry Zhang, Charles X. Ling, and Stan Matwin. Discriminative parameterlearning for bayesian networks. In Proceedings of the 25th International Conferenceon Machine Learning, ICML ’08, pages 1016–1023, 2008.
[134] M. Sullivan and R. Chillarege. A comparison of software defects in database manage-ment systems and operating systems. In Fault-Tolerant Computing, 1992. FTCS-22.Digest of Papers., Twenty-Second International Symposium on, pages 475–484, July1992.
[135] William N. Sumner and Xiangyu Zhang. Memory indexing: Canonicalizing addressesacross executions. In Proceedings of the Eighteenth ACM SIGSOFT InternationalSymposium on Foundations of Software Engineering, FSE ’10, pages 217–226, 2010.
[136] William N. Sumner and Xiangyu Zhang. Comparative causality: Explaining thedifferences between executions. In Proceedings of the 2013 International Conferenceon Software Engineering, ICSE ’13, pages 272–281, 2013.
[137] Mark D. Syer, Meiyappan Nagappan, Ahmed E. Hassan, and Bram Adams. Revisitingprior empirical findings for mobile apps: An empirical case study on the 15 mostpopular open-source android apps. In Proceedings of the 2013 Conference of theCenter for Advanced Studies on Collaborative Research, CASCON ’13, pages 283–297, 2013.
[138] Lin Tan, Chen Liu, Zhenmin Li, Xuanhui Wang, Yuanyuan Zhou, and ChengxiangZhai. Bug characteristics in open source software. Empirical Softw. Engg., 19(6):1665–1705, December 2014.
[139] Stephen W. Thomas, Bram Adams, Ahmed E. Hassan, and Dorothea Blostein. Vali-dating the use of topic models for software evolution. In Proceedings of the 2010 10thIEEE Working Conference on Source Code Analysis and Manipulation, SCAM ’10,pages 55–64, 2010.
[140] Stephen W. Thomas, Bram Adams, Ahmed E. Hassan, and Dorothea Blostein. Mod-eling the evolution of topics in source code histories. In Proceedings of the 8th WorkingConference on Mining Software Repositories, MSR ’11, pages 173–182, 2011.
[141] Yuan Tian, David Lo, and Chengnian Sun. Information retrieval based nearest neigh-bor classification for fine-grained bug severity prediction. In Proceedings of the 201219th Working Conference on Reverse Engineering, WCRE ’12, pages 215–224, 2012.
[142] Grigorios Tsoumakas, Eleftherios Spyromitros-Xioufis, Jozef Vilcek, and Ioannis Vla-havas. Mulan: A java library for multi-label learning. J. Mach. Learn. Res., 12:2411–2414, July 2011.
[143] PRWEB UK. Mobile internet usage to overtake desktop as early as 2014 says new mar-keting report, 2012. http://www.prweb.com/releases/2012/11/prweb10143010.
htm.
174

[144] Jan Wen Voung, Ranjit Jhala, and Sorin Lerner. Relay: Static race detection onmillions of lines of code. In Proceedings of the the 6th Joint Meeting of the Euro-pean Software Engineering Conference and the ACM SIGSOFT Symposium on TheFoundations of Software Engineering, ESEC-FSE ’07, pages 205–214, 2007.
[145] W3Techs. Usage of content management systems for websites, 2013. http://
w3techs.com/technologies/overview/content_management/all/.
[146] Tim Walters. Understanding the “mobile shift”: Obsession with the mo-bile channel obscures the shift to ubiquitous computing, 2012. http:
//digitalclaritygroup.com/wordpress/wp-content/uploads/2012/12/
DCG-Insight-Understanding-the-Mobile-Shift-Nov-2012.pdf.
[147] Joanne Webb. 6 third party tools for automatic bug creation andmore. http://www.pivotaltracker.com/community/tracker-blog/
6-third-party-tools-for-automatic-bug-creation-and-more.
[148] Dasarath Weeratunge, Xiangyu Zhang, William N. Sumner, and Suresh Jagannathan.Analyzing concurrency bugs using dual slicing. In Proceedings of the 19th Interna-tional Symposium on Software Testing and Analysis, ISSTA ’10, pages 253–264, 2010.
[149] Martin White, Mario Linares-Vasquez, Peter Johnson, Carlos Bernal-Cardenas, andDenys Poshyvanyk. Generating reproducible and replayable bug reports from androidapplication crashes. In Proceedings of the 2015 IEEE 23rd International Conferenceon Program Comprehension, ICPC ’15, pages 48–59, 2015.
[150] Chadd C. Williams and Jeffrey K. Hollingsworth. Automatic mining of source coderepositories to improve bug finding techniques. IEEE Trans. Softw. Eng., 31(6):466–480, June 2005.
[151] W. Wu, W. Zhang, Y. Yang, and Q. Wang. Time series analysis for bug number pre-diction. In Software Engineering and Data Mining (SEDM), 2010 2nd InternationalConference on, pages 589–596, June 2010.
[152] Xihao Xie, Wen Zhang, Ye Yang, and Qing Wang. Dretom: Developer recommenda-tion based on topic models for bug resolution. In Proceedings of the 8th InternationalConference on Predictive Models in Software Engineering, PROMISE ’12, pages 19–28, 2012.
[153] Jifeng Xuan, He Jiang, Zhilei Ren, and Weiqin Zou. Developer prioritization inbug repositories. In Proceedings of the 34th International Conference on SoftwareEngineering, ICSE ’12, pages 25–35, 2012.
[154] Shengqian Yang, Dacong Yan, Haowei Wu, Yan Wang, and Atanas Rountev. Staticcontrol-flow analysis of user-driven callbacks in android applications. In Proceedingsof the 37th International Conference on Software Engineering - Volume 1, ICSE ’15,pages 89–99, 2015.
175

[155] Wei Yang, Mukul R. Prasad, and Tao Xie. A grey-box approach for automated gui-model generation of mobile applications. In Proceedings of the 16th InternationalConference on Fundamental Approaches to Software Engineering, FASE’13, pages250–265, 2013.
[156] A. Zeller. Why Programs Fail: A Guide to Systematic Debugging. Morgan KaufmannPublishers Inc., San Francisco, CA, USA, 2009.
[157] Andreas Zeller. Yesterday, my program worked. today, it does not. why? In Proceed-ings of the 7th European Software Engineering Conference Held Jointly with the 7thACM SIGSOFT International Symposium on Foundations of Software Engineering,ESEC/FSE-7, pages 253–267, 1999.
[158] Andreas Zeller. Isolating cause-effect chains from computer programs. In Proceedingsof the 10th ACM SIGSOFT Symposium on Foundations of Software Engineering,SIGSOFT ’02/FSE-10, pages 1–10, 2002.
[159] Andreas Zeller and Ralf Hildebrandt. Simplifying and isolating failure-inducing input.IEEE Trans. Softw. Eng., 28(2):183–200, February 2002.
[160] Jack Zhang, Shikhar Sagar, and Emad Shihab. The evolution of mobile apps: Anexploratory study. In Proceedings of the 2013 International Workshop on SoftwareDevelopment Lifecycle for Mobile, DeMobile 2013, pages 1–8, 2013.
[161] Wei Zhang, Chong Sun, and Shan Lu. Conmem: Detecting severe concurrency bugsthrough an effect-oriented approach. In Proceedings of the Fifteenth Edition of AS-PLOS on Architectural Support for Programming Languages and Operating Systems,ASPLOS XV, pages 179–192, 2010.
[162] Cong Zheng, Shixiong Zhu, Shuaifu Dai, Guofei Gu, Xiaorui Gong, Xinhui Han, andWei Zou. Smartdroid: An automatic system for revealing ui-based trigger conditionsin android applications. In Proceedings of the Second ACM Workshop on Security andPrivacy in Smartphones and Mobile Devices, SPSM ’12, pages 93–104, 2012.
[163] Bo Zhou, Iulian Neamtiu, and Rajiv Gupta. A cross-platform analysis of bugs andbug-fixing in open source projects: Desktop vs. android vs. ios. In Proceedings of the19th International Conference on Evaluation and Assessment in Software Engineer-ing, EASE ’15, pages 7:1–7:10, 2015.
[164] Minghui Zhou and Audris Mockus. What make long term contributors: Willingnessand opportunity in oss community. In Proceedings of the 34th International Confer-ence on Software Engineering, ICSE ’12, pages 518–528, 2012.
[165] Wu Zhou, Xinwen Zhang, and Xuxian Jiang. Appink: Watermarking android appsfor repackaging deterrence. In Proceedings of the 8th ACM SIGSAC Symposium onInformation, Computer and Communications Security, ASIA CCS ’13, pages 1–12,2013.
176

[166] Yuming Zhou and Hareton Leung. Empirical analysis of object-oriented design metricsfor predicting high and low severity faults. IEEE Trans. Softw. Eng., 32(10):771–789,October 2006.
[167] T. Zimmermann, R. Premraj, N. Bettenburg, S. Just, A. Schroter, and C. Weiss. Whatmakes a good bug report? IEEE Transactions on Software Engineering, 36(5):618–643, Sept 2010.
[168] T. Zimmermann, R. Premraj, and A. Zeller. Predicting defects for eclipse. In Pre-dictor Models in Software Engineering, 2007. PROMISE’07: ICSE Workshops 2007.International Workshop on, pages 9–9, May 2007.
177