Embed Size (px)
Citation preview
“Upstream constraint” and “Downstream refreshment”to help price rally—— 2H09 Investment strategy for Chinese metal sector
Peggy Ye
May.25th, 2008
www.sw108.com
申万研究 2
1. “Upstream constraint” and “downstream refreshment” to help price rally like copper, lead and zinc
1.1 Our“ULIC ”model indicates four factors affect metal profit significantly
1.2 Leading indicator: Economy struggles to recover
1.3 USD depreciation and Inflation expectation: promote price rally
1.4 Inv. days to usage:“deficit” caused by up-constraint and down-refreshment
1.5 Long-term view: China’s industrial relocation help offload capacity
2. Important events may impact the sector in 2009
3. Investment strategy and portfolios
Contents
www.sw108.com
申万研究 3
-0.8
Leading indicator
USD Index
CPI
Inventory daysto usage
CopperLeadZincAluminumSteelGold
0.3
0.5
-0.7
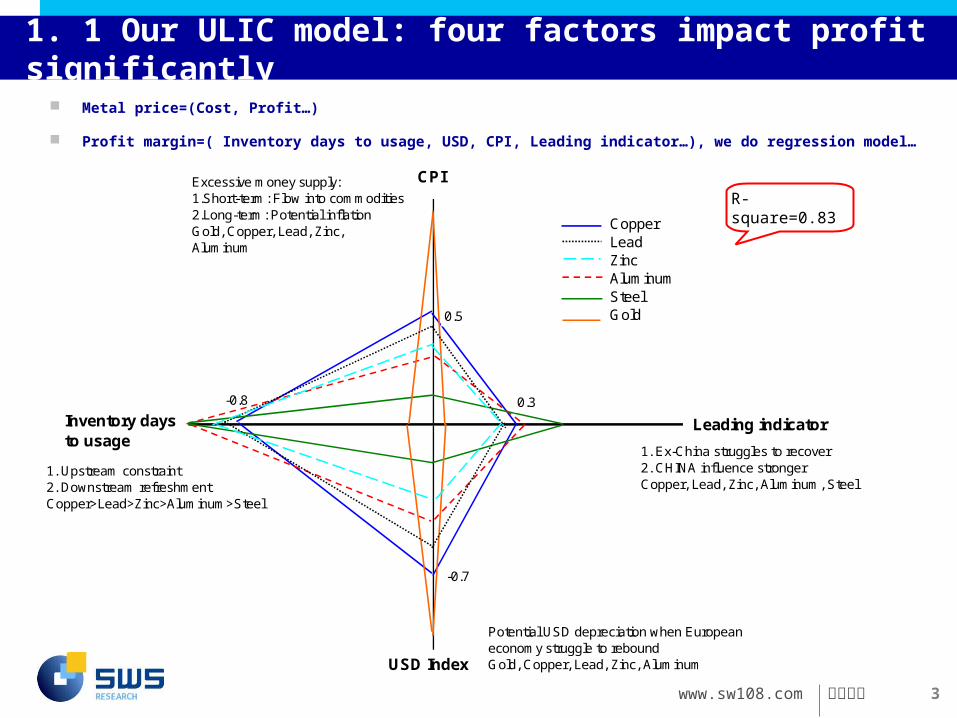
1. Ex-China struggles to recover2. CHINA influence strongerCopper, Lead, Zinc, Aluminum, Steel
Potential USD depreciation when Europeaneconomy struggle to reboundGold, Copper, Lead, Zinc, Aluminum
Excessive money supply:1.Short-term: Flow into commodities2.Long-term: Potential inflationGold, Copper, Lead, Zinc,Aluminum
1. Upstream constraint2. Downstream refreshmentCopper>Lead>Zinc>Aluminum>Steel
1. 1 Our”ULIC”model: four factors impact profit significantly
Metal price=(Cost, Profit…)
Profit margin=( Inventory days to usage, USD, CPI, Leading indicator…), we do regression model…
R-square=0.83
www.sw108.com
申万研究 4
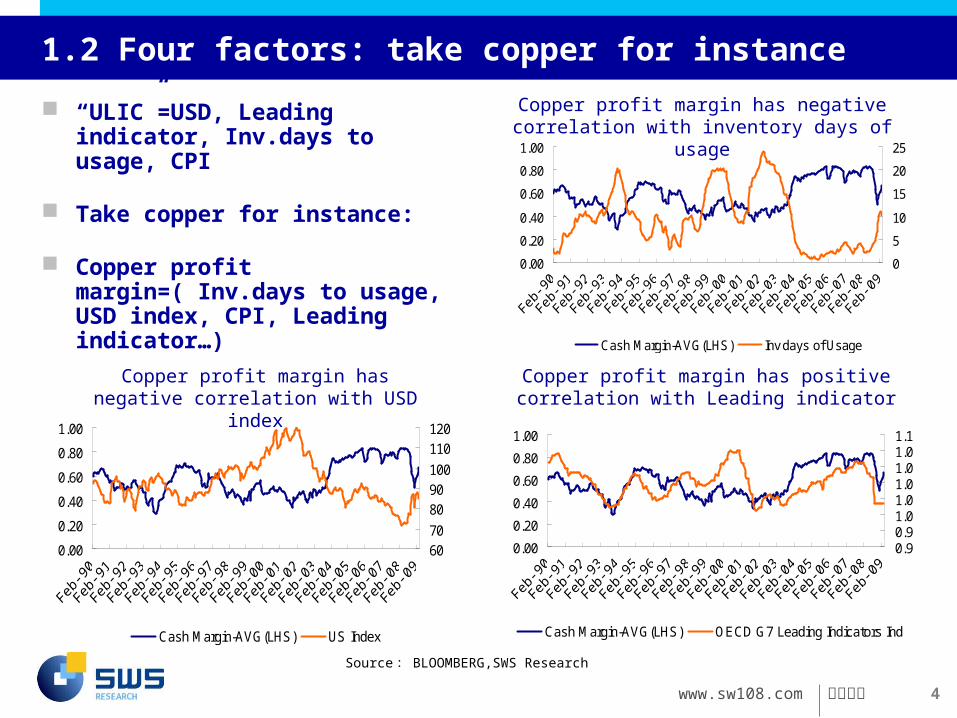
1.2 Four factors: take copper for instance
0.00
0.20
0.40
0.60
0.80
1.00
0
5
10
15
20
25
Cash Margin-AVG(LHS) Inv days of Usage
0.00
0.20
0.40
0.60
0.80
1.00
6070
8090100
110120
Cash Margin-AVG(LHS) US Index
0.00
0.20
0.40
0.60
0.80
1.00
0.90.91.01.01.01.01.01.1
Cash Margin-AVG(LHS) OECD G7 Leading Indicators Ind
Copper profit margin has negative correlation with USD index
Copper profit margin has positive correlation with Leading indicator
Copper profit margin has negative correlation with inventory days of usage
“ULIC”=USD, Leading indicator, Inv.days to usage, CPI
Take copper for instance:
Copper profit margin=( Inv.days to usage, USD index, CPI, Leading indicator…)
Source : BLOOMBERG,SWS Research
www.sw108.com
申万研究 5
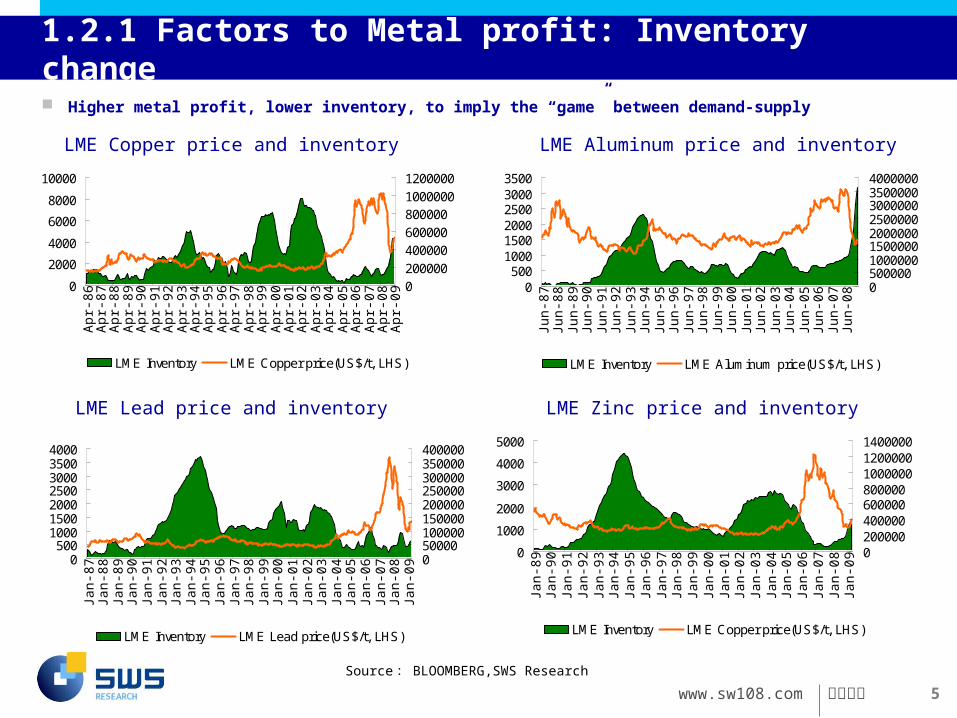
1.2.1 Factors to Metal profit: Inventory change
Higher metal profit, lower inventory, to imply the “game” between demand-supply
0
2000
4000
6000
8000
10000
Apr
-86
Apr
-87
Apr
-88
Apr
-89
Apr
-90
Apr
-91
Apr
-92
Apr
-93
Apr
-94
Apr
-95
Apr
-96
Apr
-97
Apr
-98
Apr
-99
Apr
-00
Apr
-01
Apr
-02
Apr
-03
Apr
-04
Apr
-05
Apr
-06
Apr
-07
Apr
-08
Apr
-09
020000040000060000080000010000001200000
LME Inventory LME Copper price(US$/t, LHS)
0500
100015002000250030003500
Jun-
87Ju
n-88
Jun-
89Ju
n-90
Jun-
91Ju
n-92
Jun-
93Ju
n-94
Jun-
95Ju
n-96
Jun-
97Ju
n-98
Jun-
99Ju
n-00
Jun-
01Ju
n-02
Jun-
03Ju
n-04
Jun-
05Ju
n-06
Jun-
07Ju
n-08
05000001000000150000020000002500000300000035000004000000
LME Inventory LME Aluminum price(US$/t, LHS)
0500
1000150020002500300035004000
Jan-
87Ja
n-88
Jan-
89Ja
n-90
Jan-
91Ja
n-92
Jan-
93Ja
n-94
Jan-
95Ja
n-96
Jan-
97Ja
n-98
Jan-
99Ja
n-00
Jan-
01Ja
n-02
Jan-
03Ja
n-04
Jan-
05Ja
n-06
Jan-
07Ja
n-08
Jan-
09
050000100000150000200000250000300000350000400000
LME Inventory LME Lead price(US$/t, LHS)
0
1000
2000
3000
4000
5000
Jan-
89Ja
n-90
Jan-
91Ja
n-92
Jan-
93Ja
n-94
Jan-
95Ja
n-96
Jan-
97Ja
n-98
Jan-
99Ja
n-00
Jan-
01Ja
n-02
Jan-
03Ja
n-04
Jan-
05Ja
n-06
Jan-
07Ja
n-08
Jan-
09
0200000400000600000800000100000012000001400000
LME Inventory LME Copper price(US$/t, LHS)
LME Copper price and inventory LME Aluminum price and inventory
LME Lead price and inventory LME Zinc price and inventory
Source : BLOOMBERG,SWS Research
www.sw108.com
申万研究 6
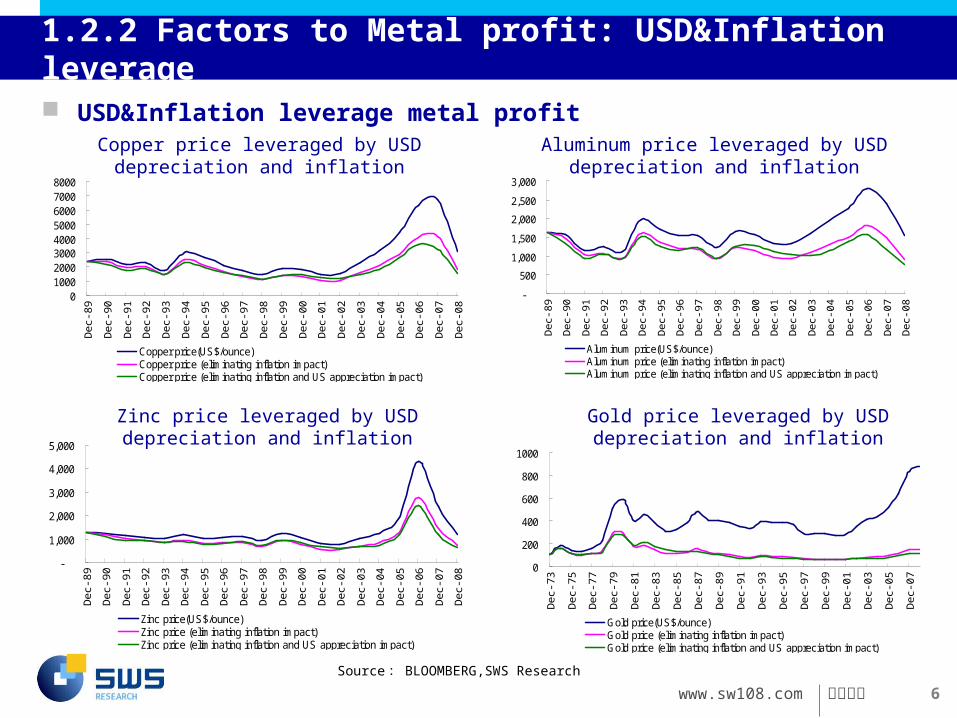
1.2.2 Factors to Metal profit: USD&Inflation leverage
USD&Inflation leverage metal profit
010002000300040005000600070008000
Dec
-89
Dec
-90
Dec
-91
Dec
-92
Dec
-93
Dec
-94
Dec
-95
Dec
-96
Dec
-97
Dec
-98
Dec
-99
Dec
-00
Dec
-01
Dec
-02
Dec
-03
Dec
-04
Dec
-05
Dec
-06
Dec
-07
Dec
-08
Copper price(US$/ounce)Copper price (eliminating inflation impact)Copper price (eliminating inflation and US appreciation impact)
-
500
1,000
1,500
2,000
2,500
3,000
Dec
-89
Dec
-90
Dec
-91
Dec
-92
Dec
-93
Dec
-94
Dec
-95
Dec
-96
Dec
-97
Dec
-98
Dec
-99
Dec
-00
Dec
-01
Dec
-02
Dec
-03
Dec
-04
Dec
-05
Dec
-06
Dec
-07
Dec
-08
Aluminum price(US$/ounce)Aluminum price (eliminating inflation impact)Aluminum price (eliminating inflation and US appreciation impact)
-
1,000
2,000
3,000
4,000
5,000
Dec
-89
Dec
-90
Dec
-91
Dec
-92
Dec
-93
Dec
-94
Dec
-95
Dec
-96
Dec
-97
Dec
-98
Dec
-99
Dec
-00
Dec
-01
Dec
-02
Dec
-03
Dec
-04
Dec
-05
Dec
-06
Dec
-07
Dec
-08
Zinc price(US$/ounce)Zinc price (eliminating inflation impact)Zinc price (eliminating inflation and US appreciation impact)
0
200
400
600
800
1000
Dec
-73
Dec
-75
Dec
-77
Dec
-79
Dec
-81
Dec
-83
Dec
-85
Dec
-87
Dec
-89
Dec
-91
Dec
-93
Dec
-95
Dec
-97
Dec
-99
Dec
-01
Dec
-03
Dec
-05
Dec
-07
Gold price(US$/ounce)Gold price (eliminating inflation impact)Gold price (eliminating inflation and US appreciation impact)
Zinc price leveraged by USD depreciation and inflation
Gold price leveraged by USD depreciation and inflation
Copper price leveraged by USD depreciation and inflation
Aluminum price leveraged by USD depreciation and inflation
Source : BLOOMBERG,SWS Research
www.sw108.com
申万研究 7
-6.00
-4.00-2.00
-2.00
4.006.00
8.0010.00
12.0014.00
16.00
20
07
Q1
20
07
Q2
20
07
Q3
20
07
Q4
20
08
Q1
20
08
Q2
20
08
Q3
20
08
Q4
20
09
Q1
20
09
Q2
20
09
Q3
20
09
Q4
0.92
0.94
0.96
0.98
1.00
1.02
1.04
OECD G7 Leading Indicators US(RHS)China(RHS) Japan(RHS)Europe(RHS)
25.030.035.040.045.050.055.060.065.0
America Europe China Japan
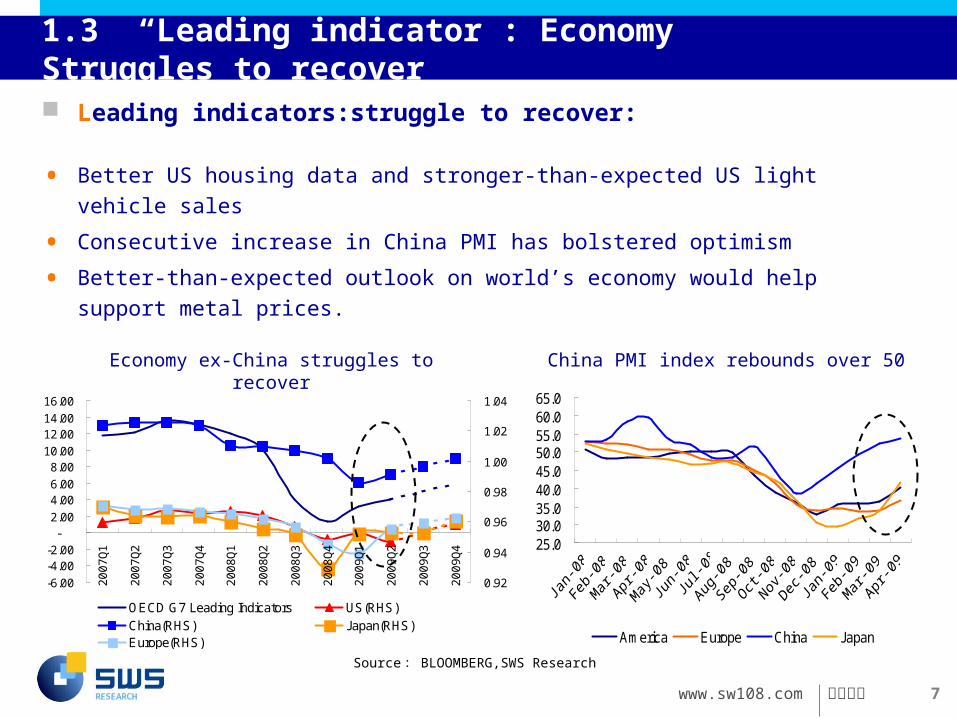
1.3 “Leading indicator”: Economy Struggles to recover
Leading indicators:struggle to recover:
Economy ex-China struggles to recover China PMI index rebounds over 50
• Better US housing data and stronger-than-expected US light vehicle sales
• Consecutive increase in China PMI has bolstered optimism
• Better-than-expected outlook on world’s economy would help support metal prices.
Source : BLOOMBERG,SWS Research
www.sw108.com
申万研究 8
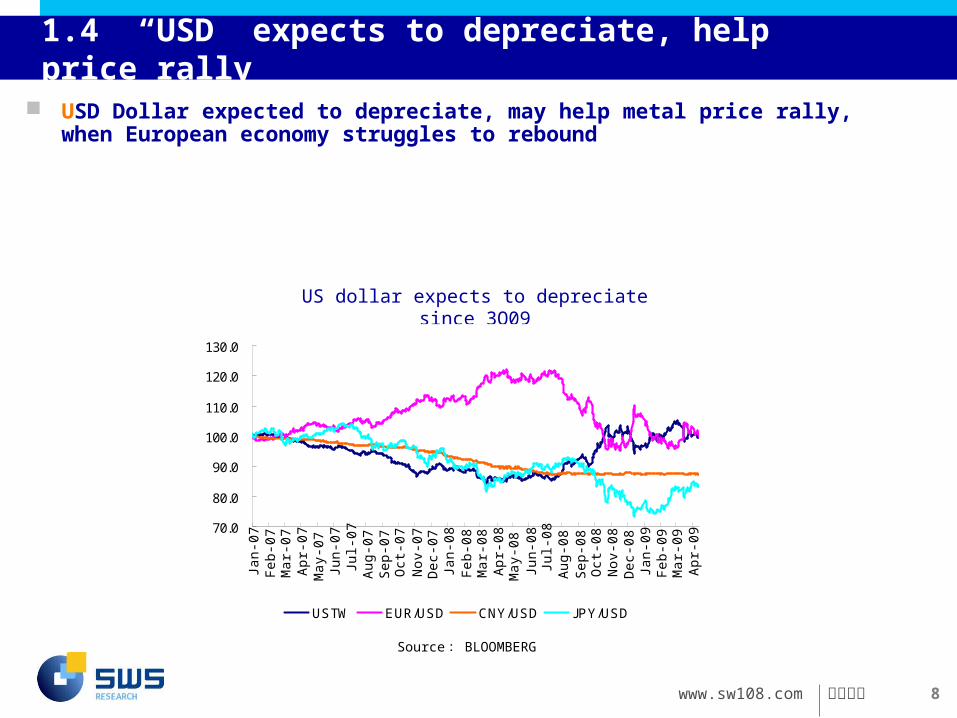
1.4 “USD” expects to depreciate, help price rally
USD Dollar expected to depreciate, may help metal price rally, when European economy struggles to rebound
US dollar expects to depreciate since 3Q09
Source : BLOOMBERG
70.0
80.0
90.0
100.0
110.0
120.0
130.0
Jan-
07F
eb-0
7M
ar-0
7A
pr-0
7M
ay-0
7Ju
n-07
Jul-0
7A
ug-0
7S
ep-0
7O
ct-0
7N
ov-0
7D
ec-0
7Ja
n-08
Feb
-08
Mar
-08
Apr
-08
May
-08
Jun-
08Ju
l-08
Aug
-08
Sep
-08
Oct
-08
Nov
-08
Dec
-08
Jan-
09F
eb-0
9M
ar-0
9A
pr-0
9
USTW EUR/USD CNY/USD JPY/USD
www.sw108.com
申万研究 9
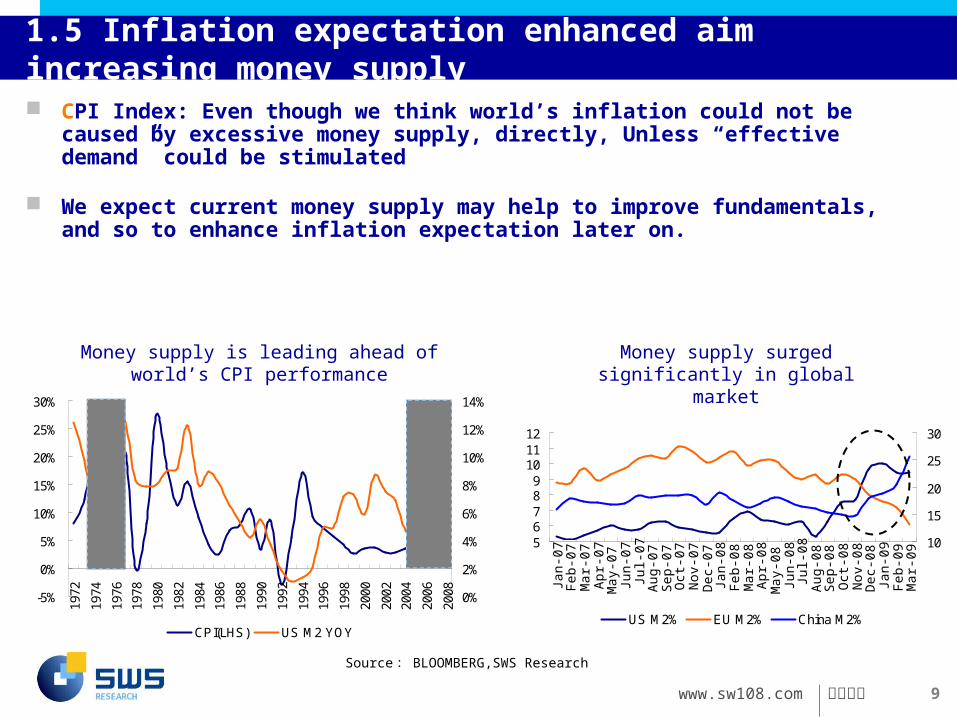
1.5 Inflation expectation enhanced aim increasing money supply
CPI Index: Even though we think world’s inflation could not be caused by excessive money supply, directly, Unless “effective demand” could be stimulated
We expect current money supply may help to improve fundamentals, and so to enhance inflation expectation later on.
56789
101112
Jan-
07F
eb-0
7M
ar-0
7A
pr-0
7M
ay-0
7Ju
n-07
Jul-0
7A
ug-0
7S
ep-0
7O
ct-0
7N
ov-0
7D
ec-0
7Ja
n-08
Feb
-08
Mar
-08
Apr
-08
May
-08
Jun-
08Ju
l-08
Aug
-08
Sep
-08
Oct
-08
Nov
-08
Dec
-08
Jan-
09F
eb-0
9M
ar-0
9
10
15
20
25
30
US M2% EU M2% China M2%
-5%
0%
5%
10%
15%
20%
25%
30%
1972
1974
1976
1978
1980
1982
1984
1986
1988
1990
1992
1994
1996
1998
2000
2002
2004
2006
2008 0%
2%
4%
6%
8%
10%
12%
14%
CPI(LHS) US M2 YOY
Money supply is leading ahead of world’s CPI performance
Money supply surged significantly in global market
Source : BLOOMBERG,SWS Research
www.sw108.com
申万研究 10
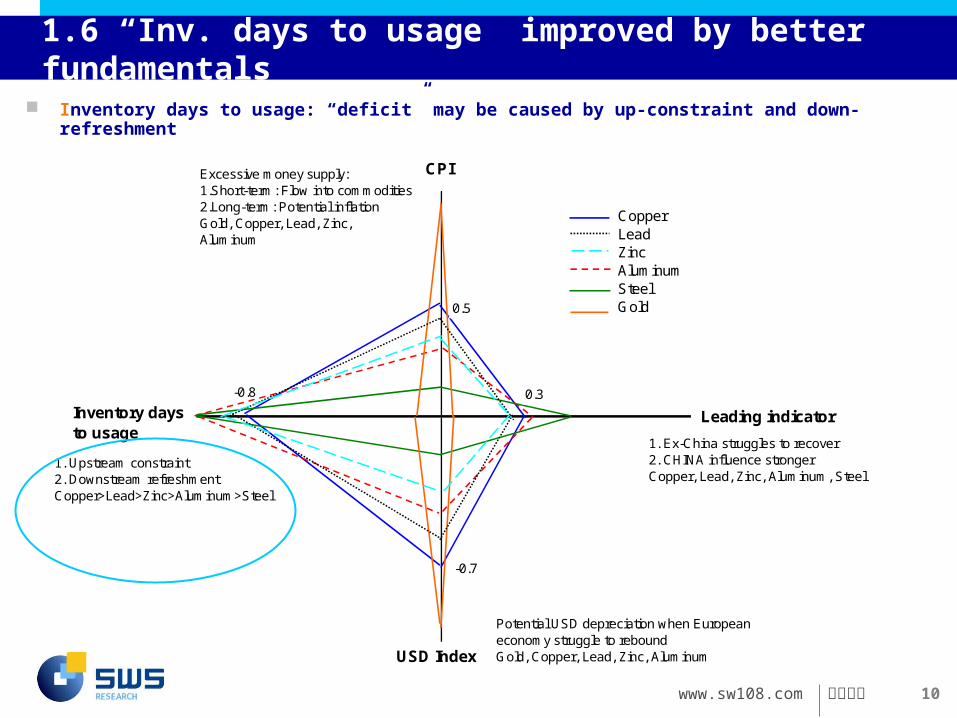
-0.8
Leading indicator
USD Index
CPI
Inventory daysto usage
CopperLeadZincAluminumSteelGold
0.3
0.5
-0.7
1. Ex-China struggles to recover2. CHINA influence strongerCopper, Lead, Zinc, Aluminum, Steel
Potential USD depreciation when Europeaneconomy struggle to reboundGold, Copper, Lead, Zinc, Aluminum
Excessive money supply:1.Short-term: Flow into commodities2.Long-term: Potential inflationGold, Copper, Lead, Zinc,Aluminum
1. Upstream constraint2. Downstream refreshmentCopper>Lead>Zinc>Aluminum>Steel
1.6 “Inv. days to usage” improved by better fundamentals
Inventory days to usage: “deficit” may be caused by up-constraint and down-refreshment
www.sw108.com
申万研究 11
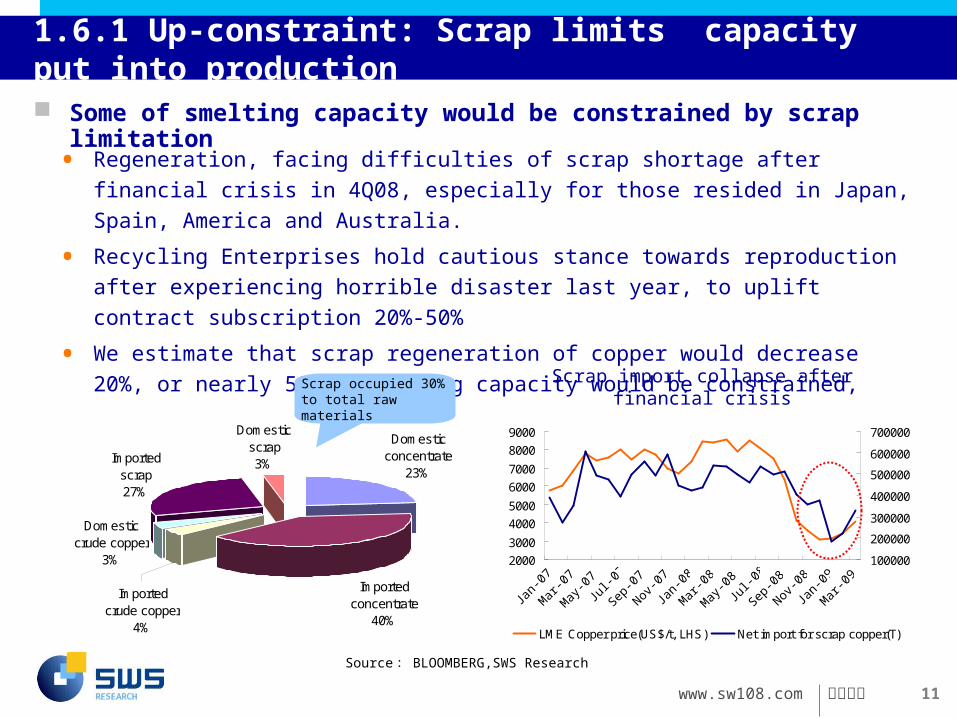
1.6.1 Up-constraint: Scrap limits capacity put into production
Some of smelting capacity would be constrained by scrap limitation
• Regeneration, facing difficulties of scrap shortage after financial crisis in 4Q08,
especially for those resided in Japan, Spain, America and Australia.
• Recycling Enterprises hold cautious stance towards reproduction after experiencing
horrible disaster last year, to uplift contract subscription 20%-50%
• We estimate that scrap regeneration of copper would decrease 20%, or nearly 500kt
smelting capacity would be constrained, most of them resided in China
2000
3000
4000
5000
6000
7000
8000
9000
Jan-
07
Mar
-07
May
-07
Jul-0
7
Sep-0
7
Nov-0
7
Jan-
08
Mar
-08
May
-08
Jul-0
8
Sep-0
8
Nov-0
8
Jan-
09
Mar
-09
100000
200000
300000
400000
500000
600000
700000
LME Copper price(US$/t, LHS) Net import for scrap copper(T)
Domesticconcentrate
23%
Importedconcentrate
40%
Importedscrap27%
Domesticscrap3%
Importedcrude copper
4%
Domesticcrude copper
3%
Scrap occupied 30% to total raw materials
Scrap import collapse after financial crisis
Source : BLOOMBERG,SWS Research
www.sw108.com
申万研究 12
0%
5%
10%
15%
20%
2005 2006 2007 2008 2009E
Copper concentrate Zinc concentrate Bauxite
Lead concentrate Iron ore
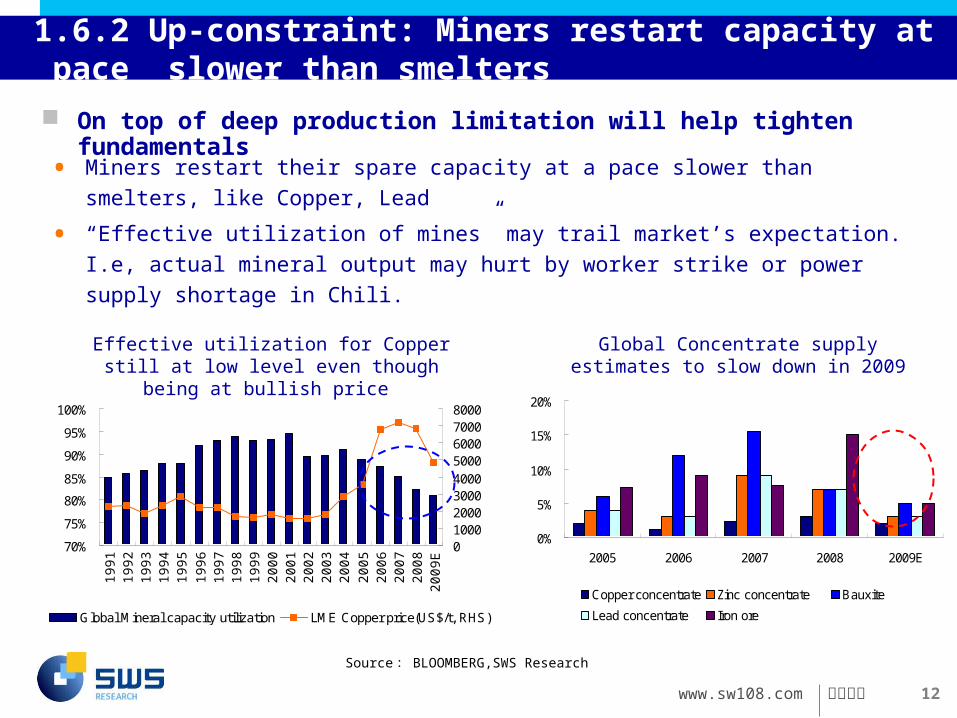
1.6.2 Up-constraint: Miners restart capacity at pace slower than smelters
On top of deep production limitation will help tighten fundamentals
• Miners restart their spare capacity at a pace slower than smelters, like Copper, Lead
• “Effective utilization of mines” may trail market’s expectation. I.e, actual mineral output
may hurt by worker strike or power supply shortage in Chili.
Global Concentrate supply estimates to slow down in 2009
70%
75%
80%
85%
90%
95%
100%
1991
1992
1993
1994
1995
1996
1997
1998
1999
2000
2001
2002
2003
2004
2005
2006
2007
2008
2009
E
010002000300040005000600070008000
Global Mineral capacity utilization LME Copper price(US$/t, RHS)
Effective utilization for Copper still at low level even though being at bullish price
Source : BLOOMBERG,SWS Research
www.sw108.com
申万研究 13
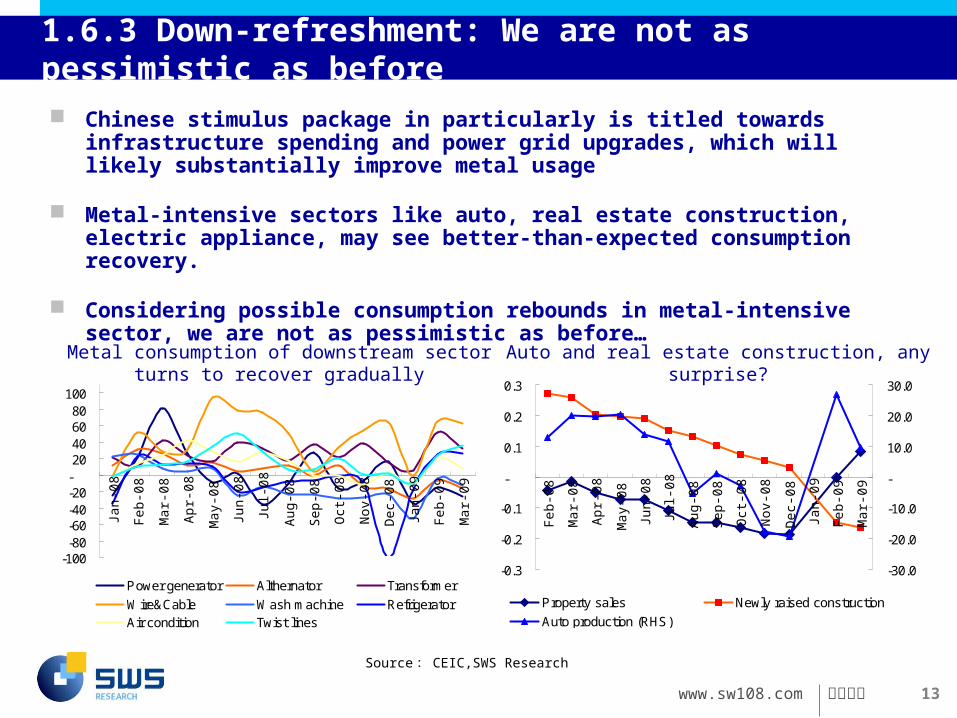
1.6.3 Down-refreshment: We are not as pessimistic as before
Chinese stimulus package in particularly is titled towards infrastructure spending and power grid upgrades, which will likely substantially improve metal usage
Metal-intensive sectors like auto, real estate construction, electric appliance, may see better-than-expected consumption recovery.
Considering possible consumption rebounds in metal-intensive sector, we are not as pessimistic as before…
-100-80-60-40-20-20406080
100
Jan-
08
Feb
-08
Mar
-08
Apr
-08
May
-08
Jun-
08
Jul-0
8
Aug
-08
Sep
-08
Oct
-08
Nov
-08
Dec
-08
Jan-
09
Feb
-09
Mar
-09
Power generator Althernator Transformer
Wire&Cable Wash machine RefrigeratorAir condition Twist lines
-0.3
-0.2
-0.1
-
0.1
0.2
0.3
Feb
-08
Mar
-08
Apr
-08
May
-08
Jun-
08
Jul-0
8
Aug
-08
Sep
-08
Oct
-08
Nov
-08
Dec
-08
Jan-
09
Feb
-09
Mar
-09
-30.0
-20.0
-10.0
-
10.0
20.0
30.0
Property sales Newly raised construction
Auto production (RHS)
Metal consumption of downstream sector turns to recover gradually
Auto and real estate construction, any surprise?
Source : CEIC,SWS Research
www.sw108.com
申万研究 14
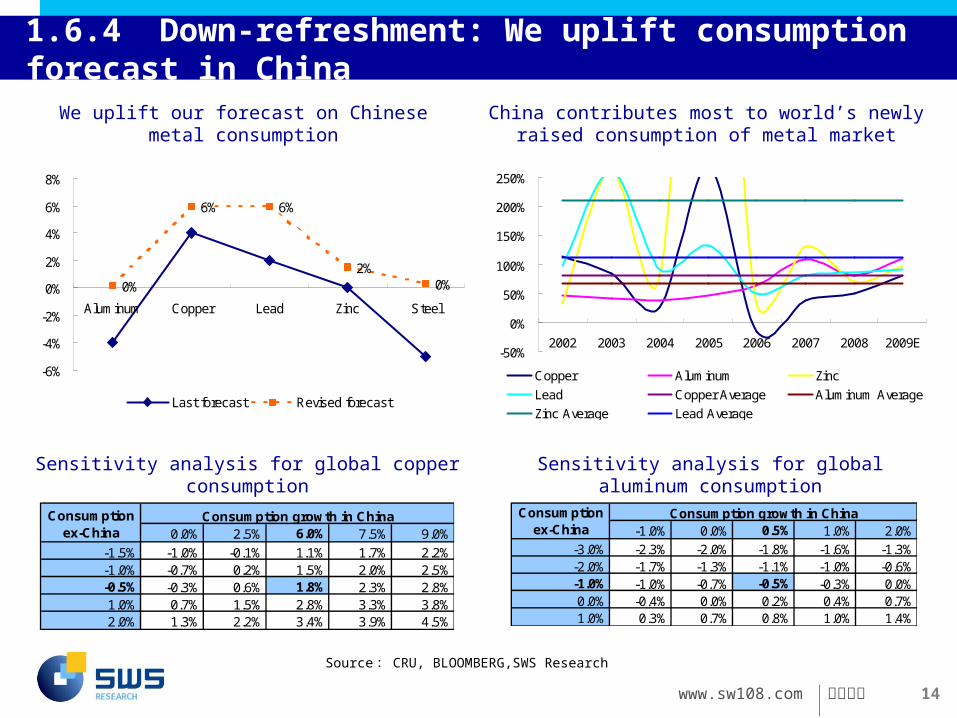
1.6.4 Down-refreshment: We uplift consumption forecast in China
Sensitivity analysis for global copper consumption Sensitivity analysis for global aluminum consumption
We uplift our forecast on Chinese metal consumption
China contributes most to world’s newly raised consumption of metal market
-50%
0%
50%
100%
150%
200%
250%
2002 2003 2004 2005 2006 2007 2008 2009E
Copper Aluminum Zinc
Lead Copper Average Aluminum Average
Zinc Average Lead Average
0%
6% 6%
2%0%
-6%
-4%
-2%
0%
2%
4%
6%
8%
Aluminum Copper Lead Zinc Steel
Last forecast Revised forecast
Source : CRU, BLOOMBERG,SWS Research
0.0% 2.5% 6.0% 7.5% 9.0%
-1.5% -1.0% -0.1% 1.1% 1.7% 2.2%-1.0% -0.7% 0.2% 1.5% 2.0% 2.5%-0.5% -0.3% 0.6% 1.8% 2.3% 2.8%1.0% 0.7% 1.5% 2.8% 3.3% 3.8%2.0% 1.3% 2.2% 3.4% 3.9% 4.5%
Consumption growth in ChinaConsumptionex-China -1.0% 0.0% 0.5% 1.0% 2.0%
-3.0% -2.3% -2.0% -1.8% -1.6% -1.3%-2.0% -1.7% -1.3% -1.1% -1.0% -0.6%-1.0% -1.0% -0.7% -0.5% -0.3% 0.0%0.0% -0.4% 0.0% 0.2% 0.4% 0.7%1.0% 0.3% 0.7% 0.8% 1.0% 1.4%
Consumptionex-China
Consumption growth in China
www.sw108.com
申万研究 15
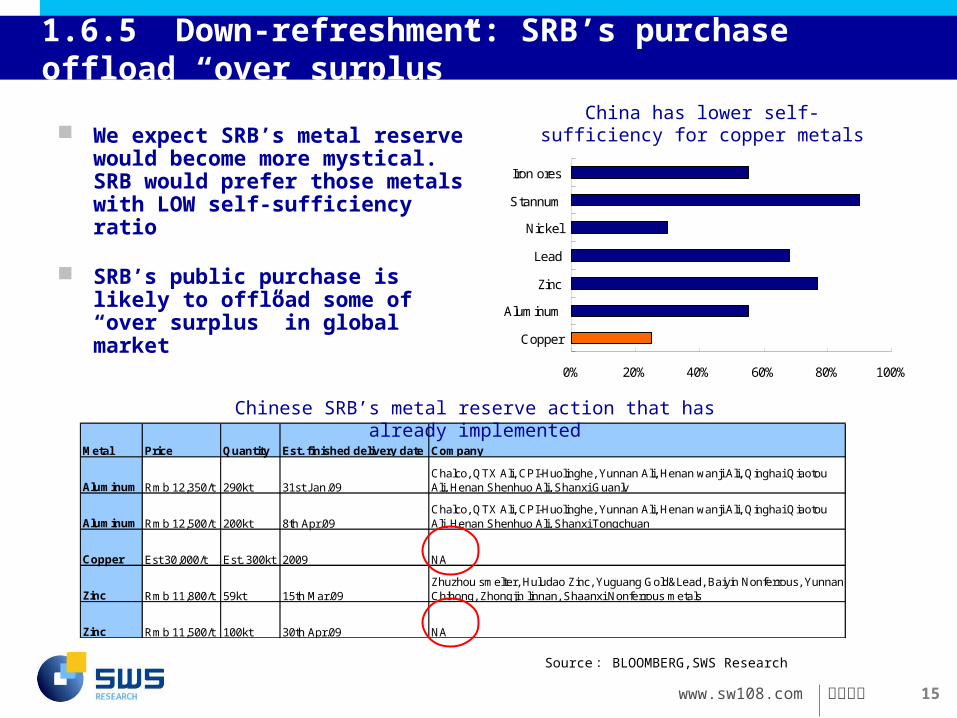
1.6.5 Down-refreshment: SRB’s purchase offload “over surplus”
We expect SRB’s metal reserve would become more mystical. SRB would prefer those metals with LOW self-sufficiency ratio
SRB’s public purchase is likely to offload some of “over surplus” in global market
Metal Price Quantity Est. finished delivery date Company
Aluminum Rmb 12,350/t 290kt 31st Jan.09Chalco, QTX Ali, CPI-Huolinghe, Yunnan Ali, Henan wanji Ali, Qinghai QiaotouAli, Henan Shenhuo Ali, Shanxi Guanlv
Aluminum Rmb 12,500/t 200kt 8th Apr.09Chalco, QTX Ali, CPI-Huolinghe, Yunnan Ali, Henan wanji Ali, Qinghai QiaotouAli, Henan Shenhuo Ali, Shanxi Tongchuan
Copper Est 30,000/t Est. 300kt 2009 NA
Zinc Rmb 11,800/t 59kt 15th Mar.09Zhuzhou smelter, Huludao Zinc, Yuguang Gold&Lead, Baiyin Nonferrous, YunnanChihong, Zhongjin linnan, Shaanxi Nonferrous metals
Zinc Rmb 11,500/t 100kt 30th Apr.09 NA
China has lower self-sufficiency for copper metals
Chinese SRB’s metal reserve action that has already implemented
0% 20% 40% 60% 80% 100%
Copper
Aluminum
Zinc
Lead
Nickel
Stannum
Iron ores
Source : BLOOMBERG,SWS Research
www.sw108.com
申万研究 16
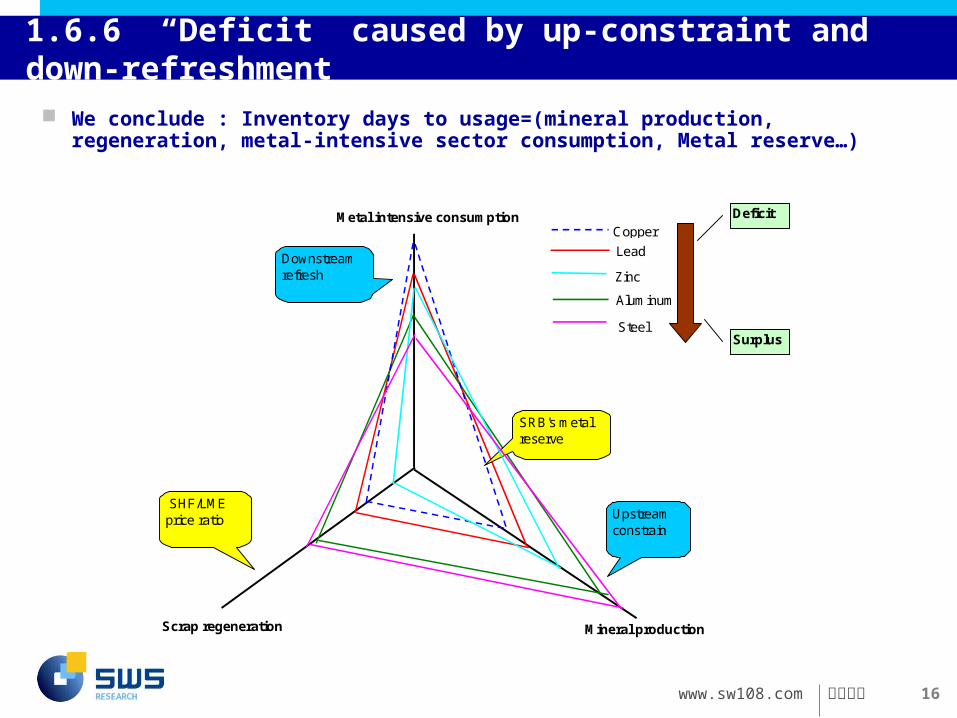
1.6.6 “Deficit” caused by up-constraint and down-refreshment
We conclude : Inventory days to usage=(mineral production, regeneration, metal-intensive sector consumption, Metal reserve…)
Lead
Copper
Aluminum
Metal intensive consumption
Scrap regeneration Mineral production
Upstreamconstrain
Downstreamrefresh
SRB's metalreserve
SHF/LMEprice ratio
Zinc
Steel
Deficit
Surplus
www.sw108.com
申万研究 17
0.0%1.0%
2.0%3.0%4.0%
5.0%6.0%
Aluminum Copper Zinc Lead
0
500
1000
1500
2000
Global surplus(kt,LHS)Global surplus(considering SRB' purchase,kt,LHS)Surplus to consumptionSurplus to consumption(considering SRB's purchase)
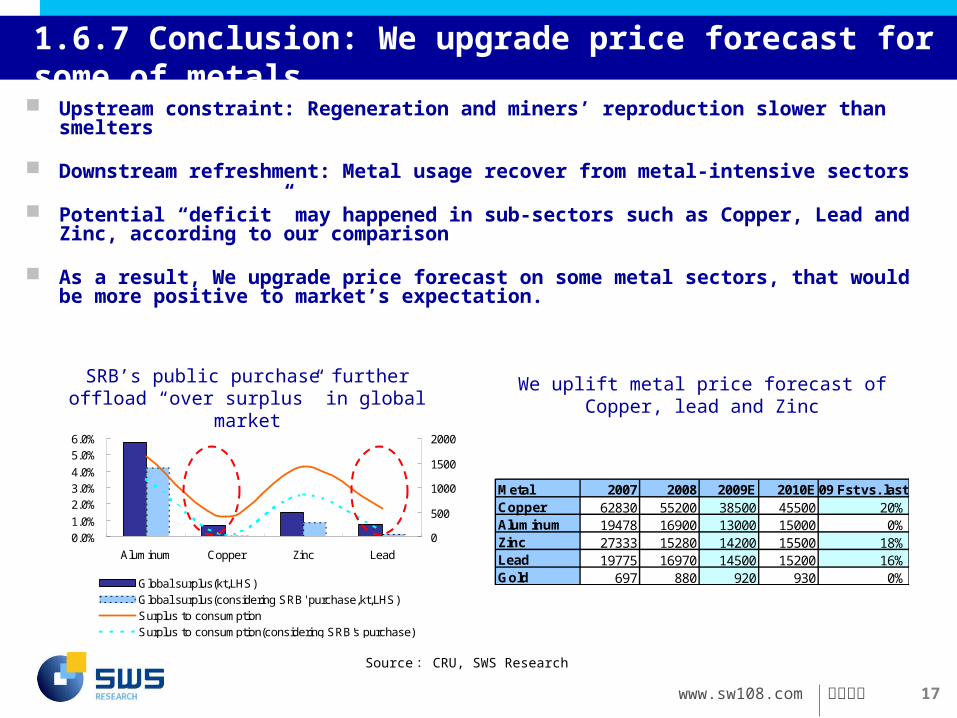
1.6.7 Conclusion: We upgrade price forecast for some of metals
Upstream constraint: Regeneration and miners’ reproduction slower than smelters
Downstream refreshment: Metal usage recover from metal-intensive sectors
Potential “deficit” may happened in sub-sectors such as Copper, Lead and Zinc, according to our comparison
As a result, We upgrade price forecast on some metal sectors, that would be more positive to market’s expectation.
SRB’s public purchase further offload “over surplus” in global market
We uplift metal price forecast of Copper, lead and Zinc
Metal 2007 2008 2009E 2010E 09 Fst vs. lastCopper 62830 55200 38500 45500 20%Aluminum 19478 16900 13000 15000 0%Zinc 27333 15280 14200 15500 18%Lead 19775 16970 14500 15200 16%Gold 697 880 920 930 0%
Source : CRU, SWS Research
www.sw108.com
申万研究 18
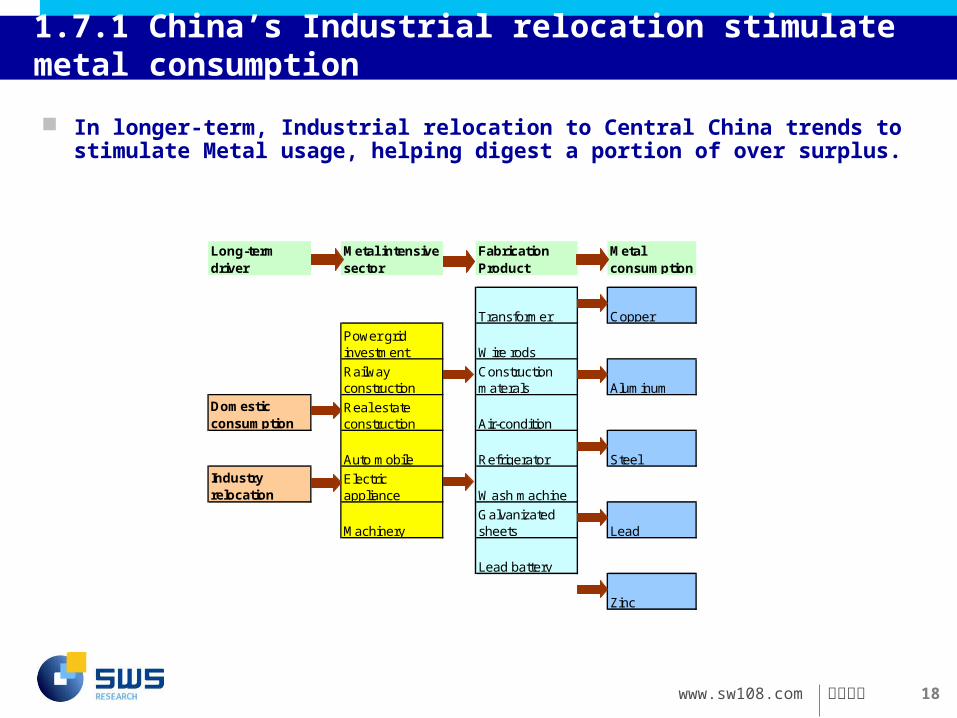
1.7.1 China’s Industrial relocation stimulate metal consumption
In longer-term, Industrial relocation to Central China trends to stimulate Metal usage, helping digest a portion of over surplus.
Long-termdriver
Metal intensivesector
FabricationProduct
Metalconsumption
Transformer Copper
Power gridinvestment Wire rods
Railwayconstruction
Constructionmaterals Aluminum
Domesticconsumption
Real estateconstruction Air-condition
Auto mobile Refrigerator SteelIndustryrelocation
Electricappliance Wash machine
MachineryGalvanizatedsheets Lead
Lead battery
Zinc
www.sw108.com
申万研究 19
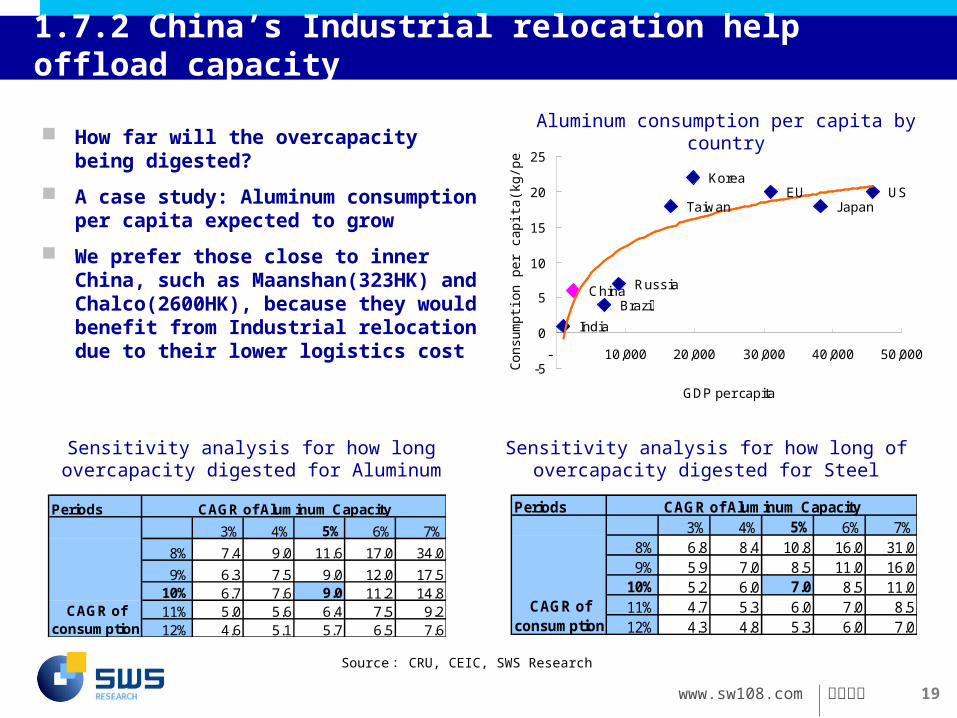
1.7.2 China’s Industrial relocation help offload capacity
How far will the overcapacity being digested?
A case study: Aluminum consumption per capita expected to grow
We prefer those close to inner China, such as Maanshan(323HK) and Chalco(2600HK), because they would benefit from Industrial relocation due to their lower logistics cost
Periods
3% 4% 5% 6% 7%
8% 7.4 9.0 11.6 17.0 34.0
9% 6.3 7.5 9.0 12.0 17.510% 6.7 7.6 9.0 11.2 14.811% 5.0 5.6 6.4 7.5 9.212% 4.6 5.1 5.7 6.5 7.6
CAGR of Aluminum Capacity
CAGR ofconsumption
Periods3% 4% 5% 6% 7%
8% 6.8 8.4 10.8 16.0 31.09% 5.9 7.0 8.5 11.0 16.0
10% 5.2 6.0 7.0 8.5 11.011% 4.7 5.3 6.0 7.0 8.512% 4.3 4.8 5.3 6.0 7.0
CAGR of Aluminum Capacity
CAGR ofconsumption
Sensitivity analysis for how long overcapacity digested for Aluminum
Sensitivity analysis for how long of overcapacity digested for Steel
Brazil
India
China Russia
Taiwan
Korea EU
Japan US
-5
0
5
10
15
20
25
- 10,000 20,000 30,000 40,000 50,000
GDP per capita
Co
nsu
mp
tion
pe
r ca
pita
(kg
/pe
rso
n)
Aluminum consumption per capita by country
Source : CRU, CEIC, SWS Research
www.sw108.com
申万研究 20
Contents
1. “Upstream constraint” or “downstream refreshment” may help price rally like copper, lead and zinc
2. Important event may impact the sector in 2009
2.1 Copper: the one may see temporary “deficit”
2.2 Lead: Spot treatment charge representing upstream-tightened
2.3 Aluminum: Chronic pain, being weak
2.4 Gold: await US dollar depreciation and inflation
3. Investment strategy and portfolios
www.sw108.com
申万研究 21
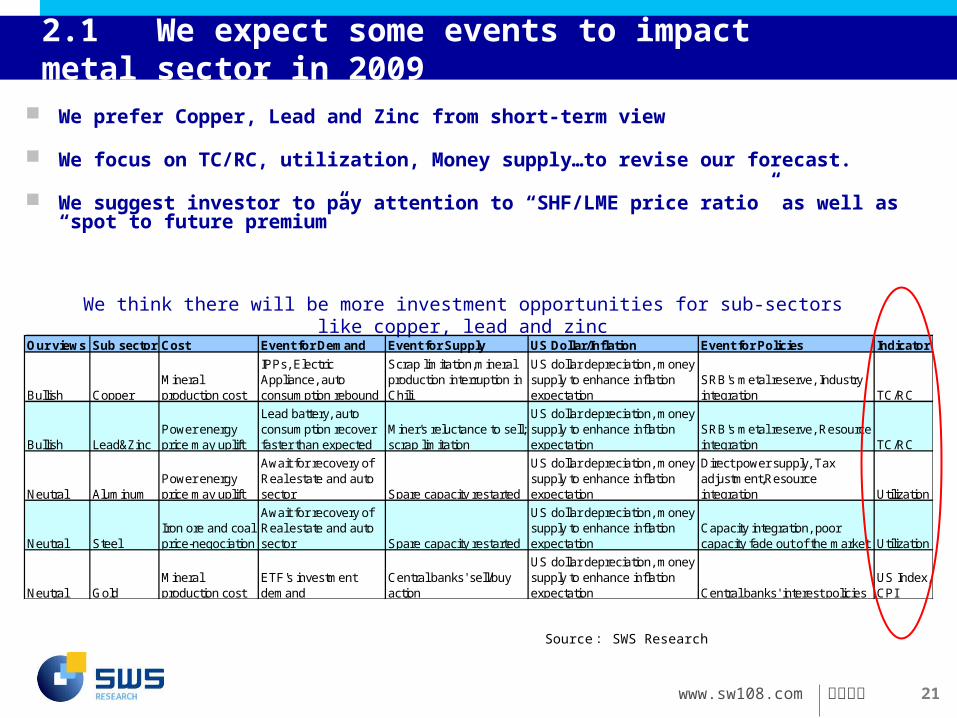
Our views Sub sector Cost Event for Demand Event for Supply US Dollar/Inflation Event for Policies Indicator
Bullish CopperMineralproduction cost
IPPs, ElectricAppliance, autoconsumption rebound
Scrap limitation,mineralproduction interruption inChili
US dollar depreciation, moneysupply to enhance inflationexpectation
SRB's metal reserve, Industryintegration TC/RC
Bullish Lead&ZincPower energyprice may uplift
Lead battery, autoconsumption recoverfaster than expected
Miner's reluctance to sell;scrap limitation
US dollar depreciation, moneysupply to enhance inflationexpectation
SRB's metal reserve, Resourceintegration TC/RC
Neutral AluminumPower energyprice may uplift
Await for recovery ofReal estate and autosector Spare capacity restarted
US dollar depreciation, moneysupply to enhance inflationexpectation
Direct power supply, Taxadjustment,Resourceintegration Utilization
Neutral SteelIron ore and coalprice-negociation
Await for recovery ofReal estate and autosector Spare capacity restarted
US dollar depreciation, moneysupply to enhance inflationexpectation
Capacity integration, poorcapacity fade out of the market Utilization
Neutral GoldMineralproduction cost
ETF's investmentdemand
Central banks' sell/buyaction
US dollar depreciation, moneysupply to enhance inflationexpectation Central banks' interest policies
US Index,CPI
2.1 We expect some events to impact metal sector in 2009
We prefer Copper, Lead and Zinc from short-term view
We focus on TC/RC, utilization, Money supply…to revise our forecast.
We suggest investor to pay attention to “SHF/LME price ratio” as well as “spot to future premium”
We think there will be more investment opportunities for sub-sectors like copper, lead and zinc
Source : SWS Research
www.sw108.com
申万研究 22
-10,000.0
-8,000.0
-6,000.0
-4,000.0
-2,000.0
-
2,000.0
4,000.0
6,000.0
Jan-
08
Feb
-08
Mar
-08
Apr
-08
May
-08
Jun-
08
Jul-0
8
Aug
-08
Sep
-08
Oct
-08
Nov
-08
Dec
-08
Jan-
09
Feb
-09
Mar
-09
Apr
-09
May
-09
Loss or Profit incurred by SHF/LME price ratio
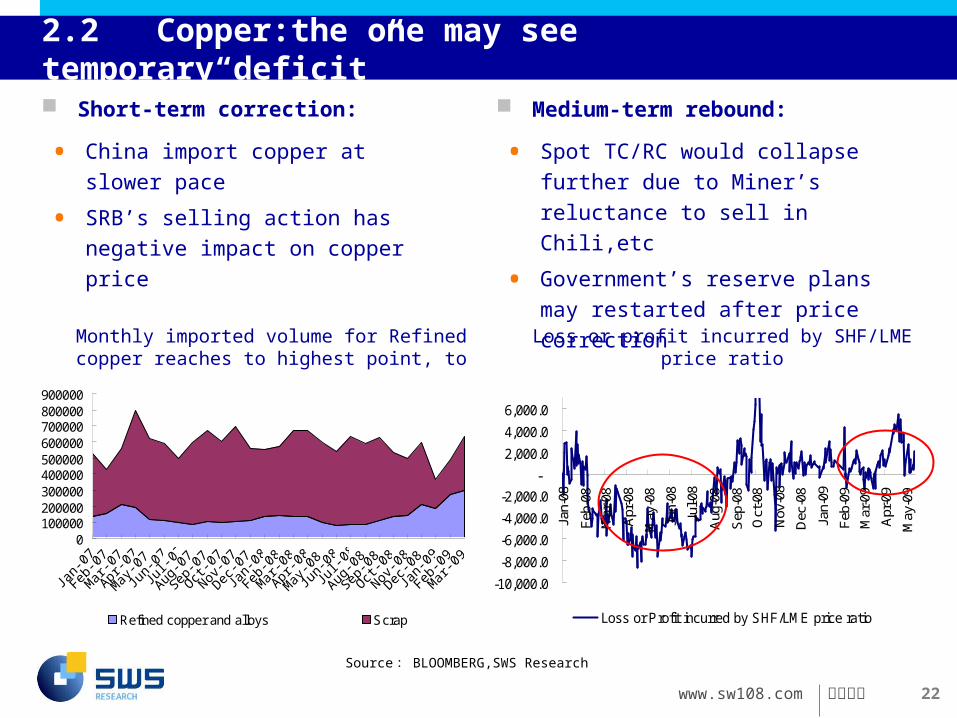
2.2 Copper:the one may see temporary“deficit”
Short-term correction:
Monthly imported volume for Refined copper reaches to highest point, to substitute scrap metal
Loss or profit incurred by SHF/LME price ratio
Medium-term rebound:
• China import copper at slower pace
• SRB’s selling action has negative
impact on copper price
• Spot TC/RC would collapse further due
to Miner’s reluctance to sell in Chili,etc
• Government’s reserve plans may
restarted after price correction
0100000200000300000400000500000600000700000800000900000
Refined copper and alloys Scrap
Source : BLOOMBERG,SWS Research
www.sw108.com
申万研究 23
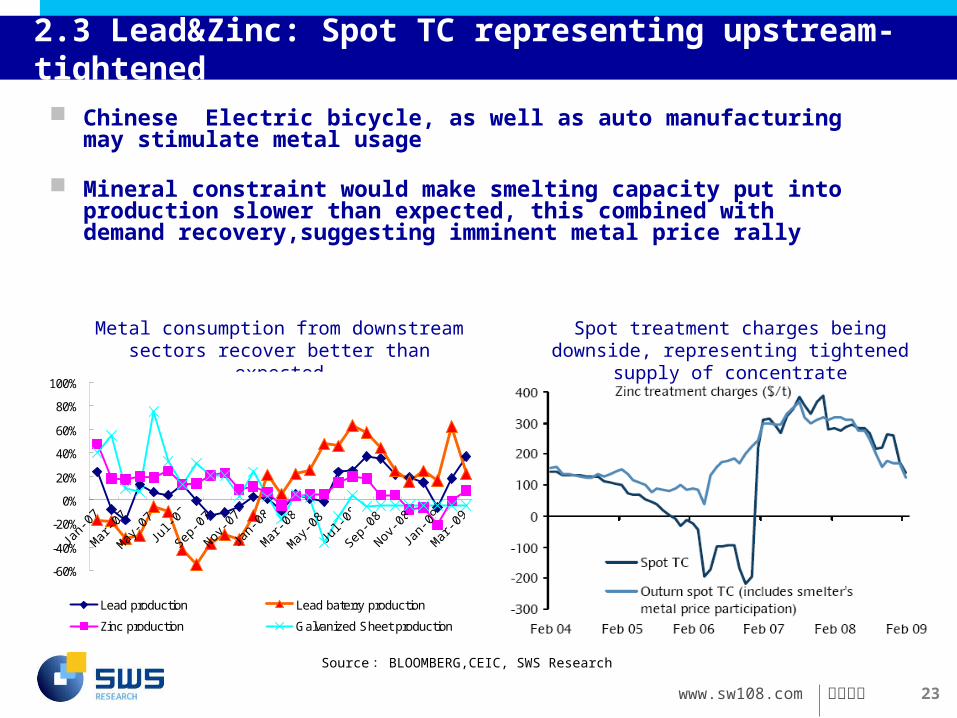
2.3 Lead&Zinc: Spot TC representing upstream-tightened
Metal consumption from downstream sectors recover better than expected
Spot treatment charges being downside, representing tightened supply of concentrate
Chinese Electric bicycle, as well as auto manufacturing may stimulate metal usage
Mineral constraint would make smelting capacity put into production slower than expected, this combined with demand recovery,suggesting imminent metal price rally
Source : BLOOMBERG,CEIC, SWS Research
-60%
-40%
-20%
0%
20%
40%
60%
80%
100%
Lead production Lead baterry production
Zinc production Galvanized Sheet production
www.sw108.com
申万研究 24
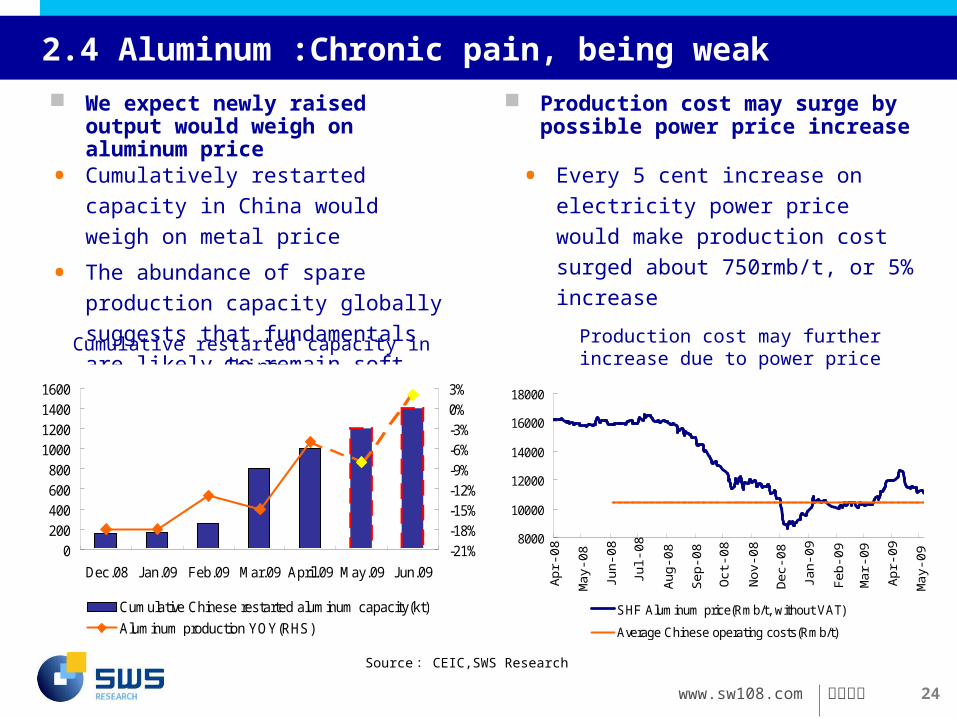
2.4 Aluminum :Chronic pain, being weak
We expect newly raised output would weigh on aluminum price
Production cost may further increase due to power price adjustment
Cumulative restarted capacity in China
• Cumulatively restarted capacity in
China would weigh on metal price
• The abundance of spare production
capacity globally suggests that
fundamentals are likely to remain soft
Production cost may surge by possible power price increase
8000
10000
12000
14000
16000
18000
Apr
-08
May
-08
Jun-
08
Jul-0
8
Aug
-08
Sep
-08
Oct
-08
Nov
-08
Dec
-08
Jan-
09
Feb
-09
Mar
-09
Apr
-09
May
-09
SHF Aluminum price(Rmb/t, without VAT)
Average Chinese operating costs(Rmb/t)
• Every 5 cent increase on electricity
power price would make production
cost surged about 750rmb/t, or 5%
increase
0200400600800
1000120014001600
Dec.08 Jan.09 Feb.09 Mar.09 April.09 May.09 Jun.09
-21%-18%-15%-12%-9%-6%-3%0%3%
Cumulative Chinese restarted aluminum capacity(kt)
Aluminum production YOY(RHS)
Source : CEIC,SWS Research
www.sw108.com
申万研究 25
2.5 Gold : Await US Dollar depreciation and inflation
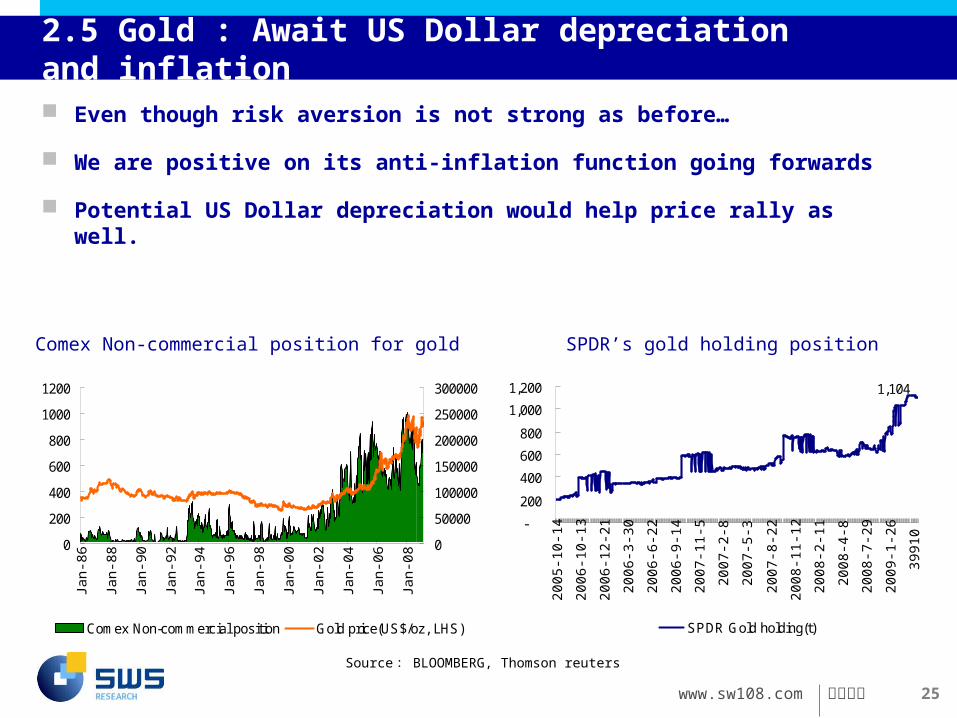
Even though risk aversion is not strong as before…
We are positive on its anti-inflation function going forwards
Potential US Dollar depreciation would help price rally as well.
Comex Non-commercial position for gold SPDR’s gold holding position
0
200
400
600
800
1000
1200
Jan-
86
Jan-
88
Jan-
90
Jan-
92
Jan-
94
Jan-
96
Jan-
98
Jan-
00
Jan-
02
Jan-
04
Jan-
06
Jan-
08
0
50000
100000
150000
200000
250000
300000
Comex Non-commercial position Gold price(US$/oz, LHS)
1,104
-
200
400
600
800
1,000
1,200
2005
-10-
14
2006
-10-
13
2006
-12-
21
2006
-3-3
0
2006
-6-2
2
2006
-9-1
4
2007
-11-
5
2007
-2-8
2007
-5-3
2007
-8-2
2
2008
-11-
12
2008
-2-1
1
2008
-4-8
2008
-7-2
9
2009
-1-2
6
3991
0
SPDR Gold holding(t)
Source : BLOOMBERG, Thomson reuters
www.sw108.com
申万研究 26
Contents
1. “Upstream constraint” or “downstream refreshment” may help price rally like copper, lead and zinc
2. Important event may impact the sector in 2009
3. Investment strategy and portfolios
3.1 Valuations still have “margin of safety”
3.2 Jiangxi Copper(358HK)&Chalco(2600HK)
3.3 Zijin mining(2899HK)&Maanshan(323HK)
www.sw108.com
申万研究 27
3.1 Our top pick for short-term investment
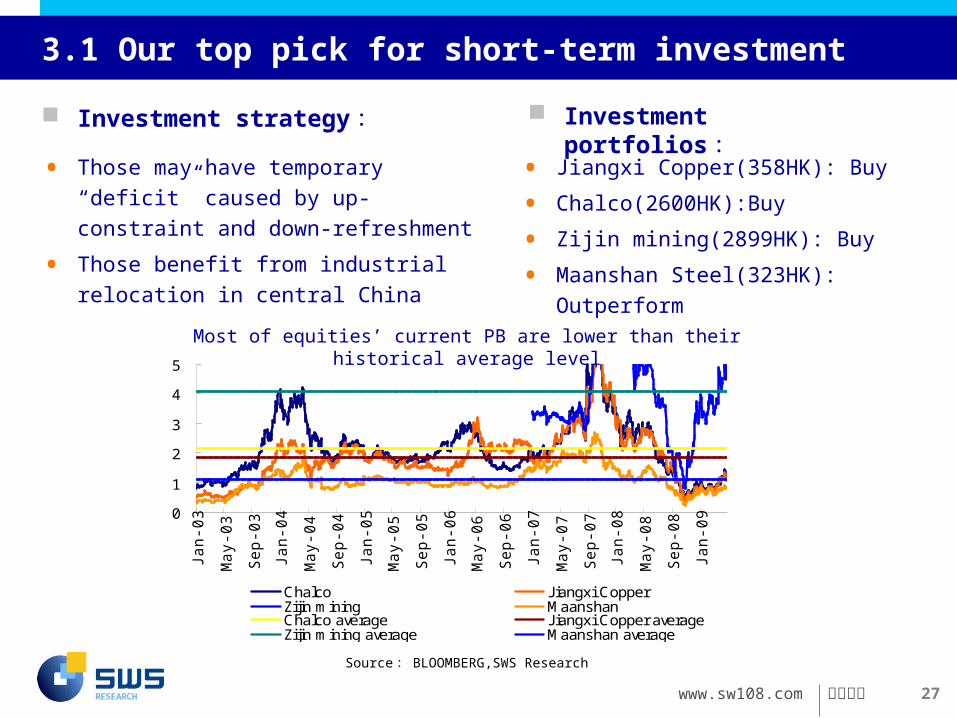
Investment strategy :
• Those may have temporary “deficit” caused
by up-constraint and down-refreshment
• Those benefit from industrial relocation in
central China
Investment portfolios :
• Jiangxi Copper(358HK): Buy
• Chalco(2600HK):Buy
• Zijin mining(2899HK): Buy
• Maanshan Steel(323HK): Outperform
0
1
2
3
4
5
Jan-0
3
May-0
3
Sep-0
3
Jan-0
4
May-0
4
Sep-0
4
Jan-0
5
May-0
5
Sep-0
5
Jan-0
6
May-0
6
Sep-0
6
Jan-0
7
May-0
7
Sep-0
7
Jan-0
8
May-0
8
Sep-0
8
Jan-0
9
Chalco Jiangxi CopperZijin mining MaanshanChalco average Jiangxi Copper averageZijin mining average Maanshan average
Source : BLOOMBERG,SWS Research
Most of equities’ current PB are lower than their historical average level
www.sw108.com
申万研究 28
3.2 Jiangxi Copper(358HK) and Chalco(2600HK)
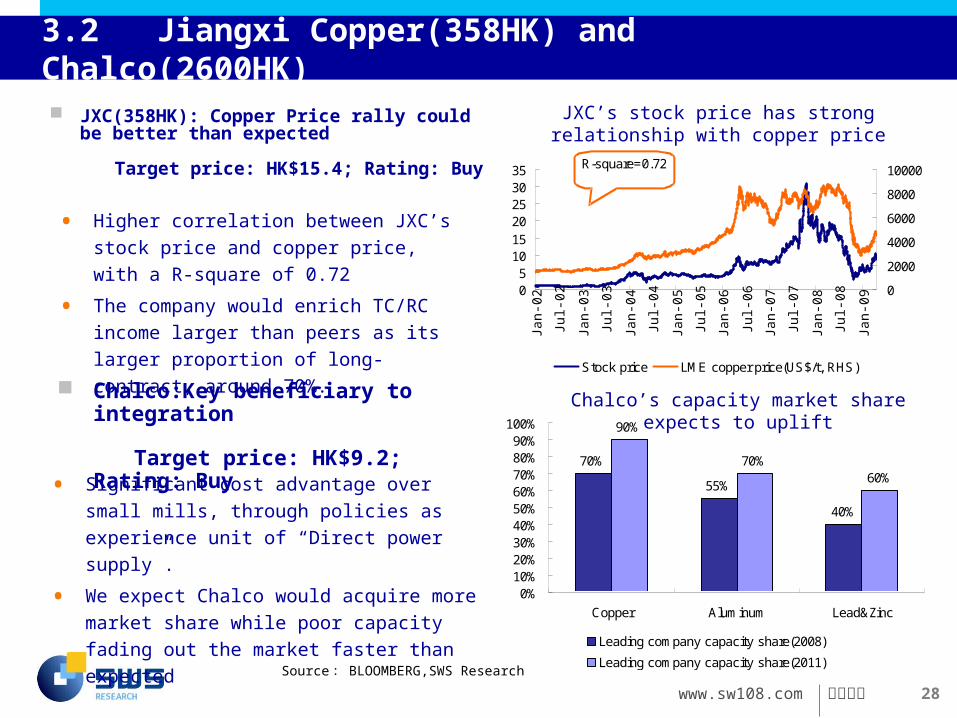
JXC(358HK): Copper Price rally could be better than expected
Target price: HK$15.4; Rating: Buy
JXC’s stock price has strong relationship with copper price
05
101520253035
Jan-
02
Jul-0
2
Jan-
03
Jul-0
3
Jan-
04
Jul-0
4
Jan-
05
Jul-0
5
Jan-
06
Jul-0
6
Jan-
07
Jul-0
7
Jan-
08
Jul-0
8
Jan-
09
0
2000
4000
6000
8000
10000
Stock price LME copper price(US$/t, RHS)
R-square=0.72
70%
55%
40%
90%
70%60%
0%10%20%30%40%50%60%70%80%90%
100%
Copper Aluminum Lead&Zinc
Leading company capacity share(2008)
Leading company capacity share(2011)
Chalco’s capacity market share expects to uplift Chalco:Key beneficiary to integration
Target price: HK$9.2; Rating: Buy
• Higher correlation between JXC’s stock price
and copper price, with a R-square of 0.72
• The company would enrich TC/RC income
larger than peers as its larger proportion of
long-contract, around 70%.
• Significant cost advantage over small mills,
through policies as experience unit of “Direct
power supply”.
• We expect Chalco would acquire more market
share while poor capacity fading out the market
faster than expected
Source : BLOOMBERG,SWS Research
www.sw108.com
申万研究 29
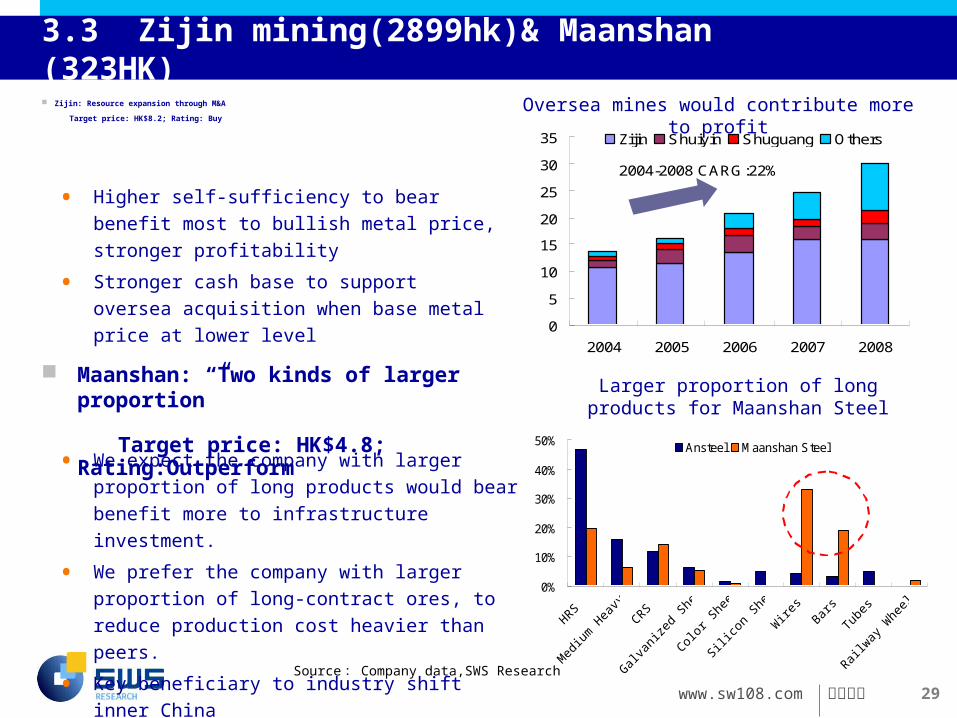
3.3 Zijin mining(2899hk)& Maanshan (323HK)
Zijin: Resource expansion through M&A
Target price: HK$8.2; Rating: Buy
• Higher self-sufficiency to bear benefit most to
bullish metal price, stronger profitability
• Stronger cash base to support oversea
acquisition when base metal price at lower level
0
5
10
15
20
25
30
35
2004 2005 2006 2007 2008
Zijin Shuiyin Shuguang Others
2004-2008 CARG:22%
Oversea mines would contribute more to profit
0%
10%
20%
30%
40%
50% Ansteel Maanshan Steel
Larger proportion of long products for Maanshan Steel
Maanshan: “Two kinds of larger proportion”
Target price: HK$4.8; Rating:Outperform
• We expect the company with larger proportion of
long products would bear benefit more to
infrastructure investment.
• We prefer the company with larger proportion of
long-contract ores, to reduce production cost
heavier than peers.
• Key beneficiary to industry shift inner China
Source : Company data,SWS Research
www.sw108.com
申万研究 30
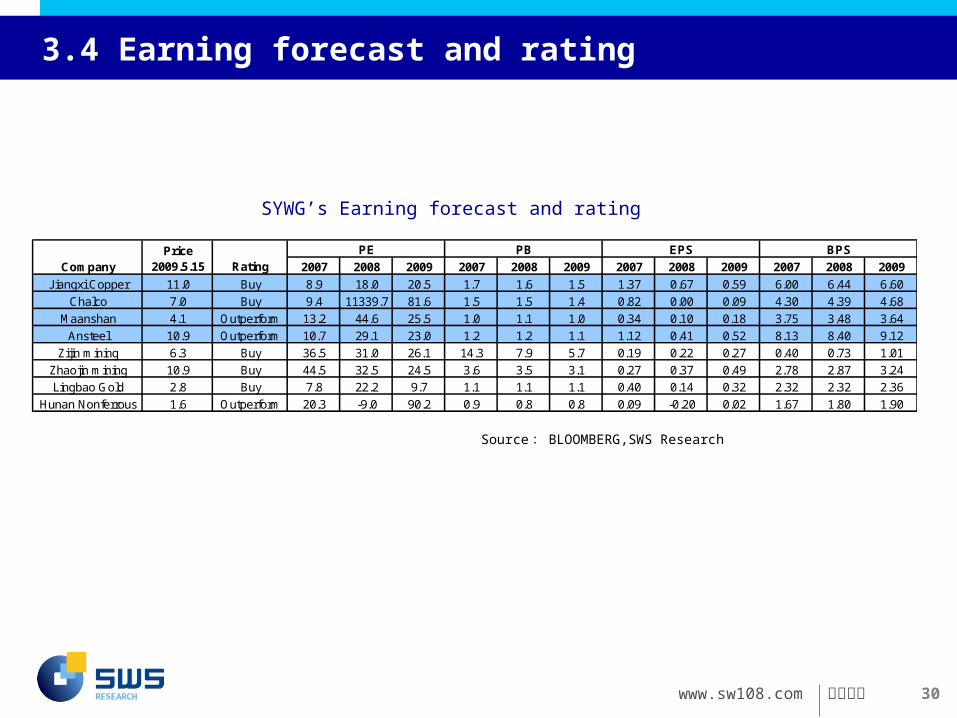
3.4 Earning forecast and rating
SYWG’s Earning forecast and rating
2007 2008 2009 2007 2008 2009 2007 2008 2009 2007 2008 2009
Jiangxi Copper 11.0 Buy 8.9 18.0 20.5 1.7 1.6 1.5 1.37 0.67 0.59 6.00 6.44 6.60
Chalco 7.0 Buy 9.4 11339.7 81.6 1.5 1.5 1.4 0.82 0.00 0.09 4.30 4.39 4.68
Maanshan 4.1 Outperform 13.2 44.6 25.5 1.0 1.1 1.0 0.34 0.10 0.18 3.75 3.48 3.64
Ansteel 10.9 Outperform 10.7 29.1 23.0 1.2 1.2 1.1 1.12 0.41 0.52 8.13 8.40 9.12
Zijin mining 6.3 Buy 36.5 31.0 26.1 14.3 7.9 5.7 0.19 0.22 0.27 0.40 0.73 1.01
Zhaojin mining 10.9 Buy 44.5 32.5 24.5 3.6 3.5 3.1 0.27 0.37 0.49 2.78 2.87 3.24
Lingbao Gold 2.8 Buy 7.8 22.2 9.7 1.1 1.1 1.1 0.40 0.14 0.32 2.32 2.32 2.36
Hunan Nonferrous 1.6 Outperform 20.3 -9.0 90.2 0.9 0.8 0.8 0.09 -0.20 0.02 1.67 1.80 1.90
PE PB EPS BPS
CompanyPrice
2009.5.15 Rating
Source : BLOOMBERG,SWS Research
www.sw108.com
申万研究 31
The views expressed in this report accurately reflect the personal views of the analyst. The analyst declares that neither he/she nor his/her associate serves as an officer of nor has any financial interests in relation to the listed corporation reviewed by the analyst. None of the listed corporations reviewed or any third party has provided or agreed to provide any compensation or other benefits in connection with this report to any of the analyst, the Company or the group company(ies). A group company(ies) of the Company confirm that they, whether individually or as a group (i) are not involved in any market making activities for any of the listed corporation reviewed; or (ii) do not have any individual employed by or associated with any group company(ies) of the Company serving as an officer of any of the listed corporation reviewed; or (iii) do not have any financial interest in relation to the listed corporation reviewed or (iv) do not, presently or within the last 12 months, have any investment banking relationship with the listed corporation reviewed.
Undertakings of the AnalystYe PeipeiI am conferred the Professional Quality of Securities Investment Consulting Industry by the Securities Association of China or have equivalent professional competence. I issue this report independently and objectively with due diligence. This report distinctly and accurately reflects my research opinions. I have never been, am not, and will not be compensated directly or indirectly in any form for the specific recommendations or opinions herein. Information Disclosure with respect to the CompanyThe Company fulfills its duty of disclosure within its sphere of knowledge. The clients may contact [email protected] for the relevant disclosure materials.
Introduction of Share Investment RatingSecurity Investment Rating :When measuring the difference between the markup of the security and that of the market’s benchmark within six months after the release of this report, we define the terms as follows: Buy : with a markup more than 20% better than that of the market ;Outperform : With a markup 5% to 20% better than that of the market ;Neutral : with a markup less than 5% better or worse than that of the market ;Underperform : with a markup more than 5% worse than that of the market.Industry Investment Rating:When measuring the difference between the markup of the industry index and that of the market’s benchmark within six months after the release of the report, we define the terms as follows: Overweight : Industry performs better than that of the whole market ;Neutral : Industry performs about the same as that of the whole market ;Underweight : Industry performs worse than that of the whole market.
We would like to remind you that different security research institutions adopt different rating terminologies and rating standards. We adopt the relative rating method to recommend the relative weightings of investment. The clients’ decisions to buy or sell securities shall be based on their actual situation, such as their portfolio structures and other necessary factors. The clients shall read through the whole report so as to obtain the complete opinions and information and shall not rely solely on the investment ratings to reach a conclusion. The Company employs its own industry classification system. The industry classification are available at our sales personnel if you are interested.CSI300 is the benchmark employed in this report for A-share listed firms and FXI/SYWG Triple-C Index is the benchmark employed in this report for HK-listed firms.
Disclaimer
www.sw108.com
申万研究 32
This report is to be used solely by the clients of Shenyin & Wanguo Securities Research Institute Co, Ltd. (hereinafter referred to as the “Company”). The Company will not deem any other person as its client notwithstanding his receipt of this report.This report is based on published information which the Company believes to be reliable, however, the authenticity, accuracy or completeness of such information is not warranted by the Company. The materials, tools, opinions and speculations contained herein are for the clients’ reference only, and are not to be regarded or deemed as an invitation for the sale or purchase of any security or other investment instruments. The clients understand that the text message reminder and telephone recommendation are no more than a brief communication of the research opinions, which are subject to the complete report released on the Company’s website (http://www.sw108.com). The clients may ask for follow-up explanations if they so wish.The materials, opinions and estimates contained herein only reflect the judgment of the Company on the day this report is released. The prices, values and investment returns of the securities or investment instruments referred to herein may fluctuate. At different periods, the Company may release reports which are inconsistent with the materials, opinions and estimates contained herein. The clients shall consider the Company’s possible conflict of interests which may affect the objectivity of this report, and shall not base their investment decisions solely on this report. The investment and services referred to herein may not be suitable for certain clients and shall not constitute personal advice for individual clients. The Company does not ensure that this report fully takes into consideration of the particular investment objectives, financial situations or needs of individual clients. The Company strongly suggests the clients to consider themselves whether the opinions or suggestions herein are suitable for the clients’ particular situations; and to consult an independent investment consultant if necessary.Under no circumstances shall the information contained herein or the opinions expressed herein forms an investment recommendation to anyone. Under no circumstances shall the Company be held responsible for any loss caused by the use of any contents herein by anyone.Independent investment consultant should be consulted before any investment decision is rendered based on this report or at any request of explanation for this report where the receiver of this report is not a client of the Company.
The Company possesses all copyrights of this report. The Company reserves all rights related to this report. Unless otherwise indicated in writing, all the copyrights of all the materials herein belong to the Company. In the absence of any prior authorization by the Company in writing, no part of this report shall be copied, photocopied, replicated or redistributed to any other person in any form by any means, or be used in any other ways which will infringe upon the copyrights of the Company. All the trademarks, service marks and marks used herein are trademarks, service marks or marks of the Company, and no one shall have the right to use them at any circumstances without the prior consent of the Company.This report may be translated into different languages. The Company does not warrant that the translations are free from errors or discrepancies.This report is for distribution in Hong Kong only to persons who fall within the definition of professional investors whether under the Securities and Futures Ordinance (Chapter 571 of the laws of Hong Kong) (the “SFO”) or the Securities and Futures (Professional Investor) Rules (Chapter 571D of the laws of the Hong Kong under the SFO).This report is for distribution in the United Kingdom only to persons who (i) have professional experience in matters relating to investments falling within Article 19(5) of the Financial Services and Markets Act 2000 (Financial Promotion) order 2001 (as amended) (the “Order”) or (ii) are persons falling within Article 49(2)(a) to (d) (“High Net Worth Companies, Unincorporated Associations, etc”) of the Order (All such persons together being referred to as “Relevant Persons”). This document is directed only at Relevant Persons. Other Persons who are not Relevant Persons must not act or rely upon this document or any of its contents.Neither this report nor any copy of it may be taken or transmitted into the United States of America, its territories or possessions or distributed, directly or indirectly, in the United States of America, its territories or possessions or to any U.S. person (Within the meaning of Regulation S under the U.S. Securities Act of 1933, as amended). Any failure to comply with this restriction may constitute a violation of U.S. securities laws. Neither this report nor any copy of it may be taken or transmitted into Canada. The distribution of this report in other jurisdictions may be restricted by law and persons into whose possession this report comes should inform themselves about, and observe, any such restrictions. By accepting this report the clients agree to be bound by the foregoing limitations.
Disclaimer
www.sw108.com
申万研究 33
Shanghai SWS Research & Consulting Co., Ltd.
Ye Peipei
申万研究 • 拓展您的价值SYWG Research • CHINA Value Revealed


![Capítulo 5. comercialización en el downstream[1] (2)](https://img.pdfslide.tips/doc/110x75/55a481dd1a28abf6458b473d/capitulo-5-comercializacion-en-el-downstream1-2.jpg)