Embed Size (px)
Citation preview
Urinary IgG4 and Smad1 Are Specific Biomarkers forRenal Structural and Functional Changes in Early Stagesof Diabetic NephropathyToshio Doi,1 Tatsumi Moriya,2 Yui Fujita,1 Naoto Minagawa,3 Masaru Usami,4 Tomoko Sasaki,3
Hideharu Abe,1 Seiji Kishi,1 Taichi Murakami,1 Motoshi Ouchi,5 Go Ichien,3 Keiichi Yamamoto,6 Hiroki Ikeda,4
Yasuhiko Koezuka,3 Norimichi Takamatsu,7 Kenji Shima,7 Michael Mauer,8 Kojiro Nagai,1 andTatsuya Tominaga1
Diabetes 2018;67:986–993 | https://doi.org/10.2337/db17-1043
Diabetic nephropathy (DN) is themajor cause of end-stagekidney disease, but early biomarkers of DN risk are limited.Herein we examine urinary IgG4 and Smad1 as additionalearly DN biomarkers. We recruited 815 patients withtype 2 diabetes; 554 patients fulfilled the criteria of anestimated glomerular filtration rate (eGFR) >60 mL/minand no macroalbuminuria at baseline, with follow-up for5 years. Patients without macroalbuminuria were alsorecruited for renal biopsies. Urinary IgG4 and Smad1 weredetermined by enzyme-linked immunoassays using spe-cific antibodies. The specificity, sensitivity, and reproduc-ibility were confirmed for each assay. Increased urinaryIgG4 was significantly associated with lower eGFR. Thelevel of urinary IgG4 also significantly correlated withsurface density of peripheral glomerular basementmembrane (Sv PGBM/Glom), whereas Smad1 was as-sociated with the degree of mesangial expansion—bothclassic pathological findings in DN. Baseline eGFR didnot differ between any groups; however, increases in bothurinary IgG4 and Smad1 levels at baseline significantlypredicted later development of eGFR decline in patientswithoutmacroalbuminuria. These data suggest that urinaryIgG4 and Smad1 at relatively early stages of DN reflectunderlying DN lesions and are relevant to later clinicaloutcomes.
Diabetic nephropathy (DN) is the major global cause ofchronic kidney disease (CKD) and end-stage renal disease(ESRD). The natural history of DN is characterized by lesiondevelopment and progression during a long period of clinicalsilence, and lesions may be far advanced before increasedalbumin excretion rate (AER) and/or reduced glomerularfiltration rate (GFR) are detectable (1). Once overt nephrop-athy manifests, it may be difficult to prevent progression toESRD. Glomerular structural changes including glomerularbasement membrane (GBM) thickening, expansion of themesangium, and a consequent reduction in the filtrationsurface correlate with increasing AER and decreasing GFR(1). Of these, the fraction of the volume of the glomerulusoccupied by the mesangium is the single strongest correlateof functional changes (2). In normoalbuminuric patientswith type 1 diabetes (T1D), however, increased GBM widthwas the best early structural predictor of progression of overtnephropathy and ESRD (3). Although a persistent increase inlevels of AER in the range representing microalbuminuria(MA) is currently the best early biomarker of DN risk, his-tological lesions in T1D and type 2 diabetes (T2D) may bequite advanced before MA develops (4,5), and GFR de-cline may antedate albuminuria. Moreover, only ;35–45%of patients with MA and T1D or T2D will progress to overt
1Department of Nephrology, Graduate School of Medical Science, TokushimaUniversity, Tokushima, Japan2Health Care Center, Kitasato University, Sagamihara, Kanagawa, Japan3Hubit Genomix Inc., Tokyo, Japan4Ikeda Hospital, Amagasaki, Hyogo, Japan5Department of Pharmacology and Toxicology, Dokkyo Medical University Schoolof Medicine, Tochigi, Japan6Fuso Pharmaceutical Industries, Ltd, Osaka, Japan7Kawashima Hospital, Tokushima, Japan8Department of Pediatrics, University of Minnesota, Minneapolis, MN
Corresponding author: Toshio Doi, [email protected].
Received 1 September 2017 and accepted 16 February 2018.
This article contains Supplementary Data online at http://diabetes.diabetesjournals.org/lookup/suppl/doi:10.2337/db17-1043/-/DC1.
© 2018 by the American Diabetes Association. Readers may use this article aslong as the work is properly cited, the use is educational and not for profit, and thework is not altered. More information is available at http://www.diabetesjournals.org/content/license.
986 Diabetes Volume 67, May 2018
COMPLIC
ATIO
NS
nephropathy over the subsequent 6–10 years, whereas ap-proximately one-third will spontaneously revert to normoal-buminuria (6). It is clear that measures of AER need to besupplemented with additional biomarkers in order to pro-vide an earlier and more precise reflection of underlyingDN lesions during the clinically silent period and to betterpredict the risk of DN progression.
We established that Suppressor of Mothers againstDecapentaplegic Transcription Factor (Smad) 1, one of theSmad proteins functioning downstream of the transforminggrowth factor-b superfamily receptor kinases, is an impor-tant transcription factor for the a1 and 2 chains of type IVcollagen, which are major components of mesangial matrixexpansion observed during DN (7). Smad1 also stronglycorrelated with the development of mesangial expansion butnot with albuminuria in streptozotocin-induced diabeticrats (8). Moreover, early increases in urinary Smad1 levelpredicted the later development of mesangial expansion inboth streptozotocin-induced DN rats and db/db mice (9).In vivo evidence of Smad1 signaling was also linked to thedevelopment of DN in animal models (9–13).
The loss of charge selectivity in the glomerulus precededand accompanied the increase in large pore area seen in pa-tientswith T1Dwithurinary albumin excretion.100mg/24 h(14). IgG4 has a negative charge and, along with other an-ionic plasma proteins, was observed to selectively bind in alinear pattern to the GBM and to tubular basement mem-branes in patients with early and late-stage DN (15). Wespeculated that the increased urinary excretion of IgG4 inpatients with diabetes may be related to biochemical, func-tional, and morphological GBM changes. We hypothesizedthat urinary IgG4 is a useful biomarker for predicting un-derlying GBM lesions, and thus we developed a highly sensi-tive and specific method for detecting urinary IgG4 for thisstudy.
Here we report that in patients with T2D both uri-nary IgG4 and urinary Smad1 are novel reliable biomarkersfor each of the classic pathological findings in the early stagesof DN and are predictors of progressive GFR decline.
RESEARCH DESIGN AND METHODS
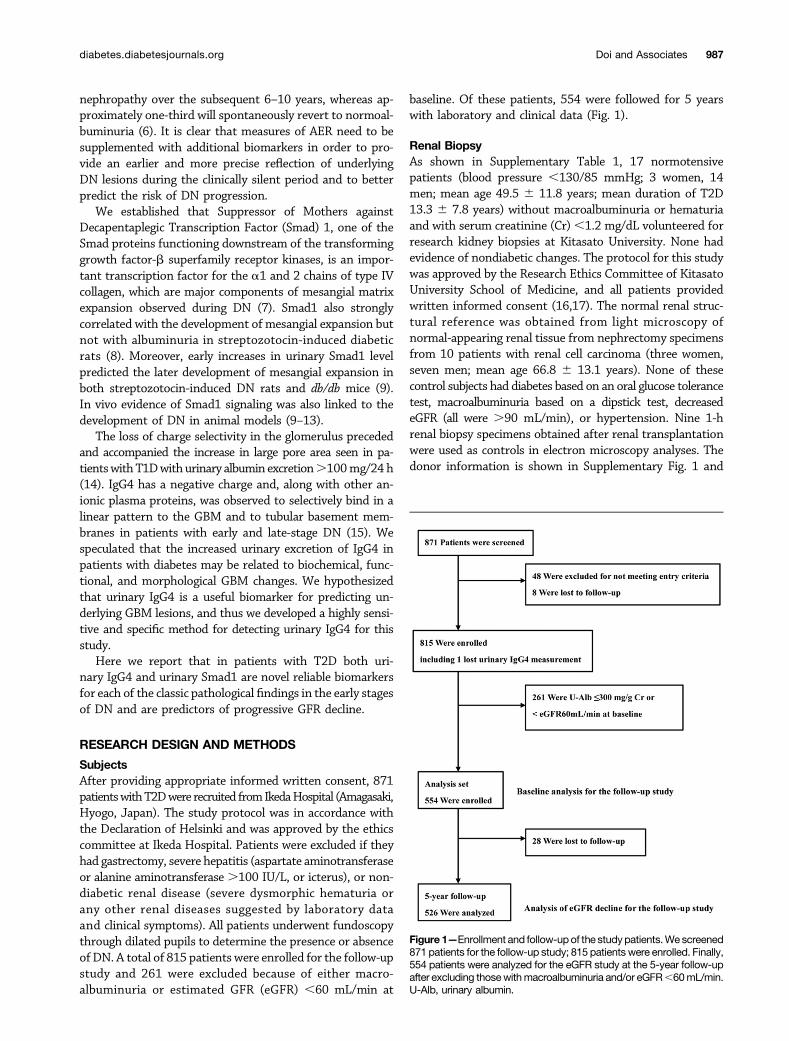
SubjectsAfter providing appropriate informed written consent, 871patientswithT2Dwere recruited from IkedaHospital (Amagasaki,Hyogo, Japan). The study protocol was in accordance withthe Declaration of Helsinki and was approved by the ethicscommittee at Ikeda Hospital. Patients were excluded if theyhad gastrectomy, severe hepatitis (aspartate aminotransferaseor alanine aminotransferase .100 IU/L, or icterus), or non-diabetic renal disease (severe dysmorphic hematuria orany other renal diseases suggested by laboratory dataand clinical symptoms). All patients underwent fundoscopythrough dilated pupils to determine the presence or absenceofDN. A total of 815 patients were enrolled for the follow-upstudy and 261 were excluded because of either macro-albuminuria or estimated GFR (eGFR) ,60 mL/min at
baseline. Of these patients, 554 were followed for 5 yearswith laboratory and clinical data (Fig. 1).
Renal BiopsyAs shown in Supplementary Table 1, 17 normotensivepatients (blood pressure ,130/85 mmHg; 3 women, 14men; mean age 49.5 6 11.8 years; mean duration of T2D13.3 6 7.8 years) without macroalbuminuria or hematuriaand with serum creatinine (Cr),1.2 mg/dL volunteered forresearch kidney biopsies at Kitasato University. None hadevidence of nondiabetic changes. The protocol for this studywas approved by the Research Ethics Committee of KitasatoUniversity School of Medicine, and all patients providedwritten informed consent (16,17). The normal renal struc-tural reference was obtained from light microscopy ofnormal-appearing renal tissue from nephrectomy specimensfrom 10 patients with renal cell carcinoma (three women,seven men; mean age 66.8 6 13.1 years). None of thesecontrol subjects had diabetes based on an oral glucose tolerancetest, macroalbuminuria based on a dipstick test, decreasedeGFR (all were .90 mL/min), or hypertension. Nine 1-hrenal biopsy specimens obtained after renal transplantationwere used as controls in electron microscopy analyses. Thedonor information is shown in Supplementary Fig. 1 and
Figure 1—Enrollment and follow-upof the studypatients.We screened871 patients for the follow-up study; 815 patients were enrolled. Finally,554 patients were analyzed for the eGFR study at the 5-year follow-upafter excluding thosewithmacroalbuminuria and/or eGFR,60mL/min.U-Alb, urinary albumin.
diabetes.diabetesjournals.org Doi and Associates 987
Supplementary Table 2. The protocol for this component ofthe study was approved by the Research Ethnics Com-mittee of Tokushima University.
Laboratory and Clinical MeasurementsUrine samples were centrifuged for 15 min. Supernatantsstored at 280°C were rapidly thawed and centrifuged toremove any urates or phosphates before use in the assays.An enzymatic method was performed to determine Cr inserum and urine (Shino-Test, Kanagawa, Japan).
eGFR/1.73m2 was estimated using the following equationapplied for Japanese population (18), and the value wasadjusted by body surface area at each point in order to estimateactual individual change:
eGFR ¼ 194 3 SerumCr21:094 3 Age20:287
3 Body surface area O 1:73�30:739 if female
�
Urinary albumin was measured through the use of aturbidimetric immunoassay. Macroalbuminuria was de-fined as an albumin-to-Cr ratio (ACR).300mg/g urine Cr,and MA was defined as 30–300 mg/g Cr in two consecutivemeasurements.
Morphometric Analysis of Renal BiopsiesRenal biopsy tissues obtained by Kitasato University andTokushima University were fixed in 10% buffered formalinand stained with periodic acid Schiff, periodic acid silvermethenamine, and Masson trichrome. Mesangial area wasestimated by measuring the mesangial periodic acid silvermethenamine–positive area using an image analyzer witha light microscope (Image Processor of Analytical Pathology;Sumitomo Chemical Co., Tokyo, Japan) (11,12). Themesangial area fraction was expressed as the percentageof total glomerular area occupied by mesangial area. Inaddition, the percentage of global glomerular sclerosiswas measured as described previously (19). Interstitial vol-ume fraction (Vv [interstitium/cortex]) was determinedon the light microscopy sections (approximate magnifica-tion3300) by point-counting images projected onto a whitesurface by a projection microscope (20). The glomerularsurface was outlined by tracing the outer margins of thetufts. The mean glomerular surface area was calculated(11,12).
Tissues for electron microscopy were fixed in 2.5%glutaraldehyde, postfixed in osmium tetroxide, dehydrated,and embedded. Ultrathin sections were examined usinga JEOL CX 100 transmission electron microscope (JEOL,Tokyo, Japan) in the Kitasato Bio-Imaging Center. Atleast two, but usually three, glomeruli were examined perpatient. GBM width and surface density of peripheralGBM (Sv [peripheral GBM(PGBM)/glomerulus(Glom)])were measured using an orthogonal intercept methodand a line intercept method, respectively, as previously
detailed (2,17,21–23). One patient lacked sufficient biopsymaterial for analysis.
Generation of a Monoclonal Antibody AgainstHuman Smad1Recombinant human Smad1 (rhSmad1) was purified usinga glutathione S-transferase system: 6-week-old mice wereimmunized with rhSmad1, and monoclonal antibodies weregenerated using established procedures. Approximately3,000 hybridoma clones were screened, then characterizedby Western blotting and ELISA. SDS-PAGE analysis revealedthat the purified protein corresponds with the calculatedmolecular weight of Smad1. A specific hybridoma clone(Sp125) was then selected.
Detection of Urinary Smad1 via ELISAThe F(ab9)2 fraction of the Sp125 was coated onto micro-titer plates (Nunc). The urine samples or standard (rhSmad1;0.2–5 ng/mL) were applied, followed by goat anti-Smad1polyclonal antibody (AF2039; R&D Systems), and thenreacted with horseradish peroxidase–conjugated antigoatIgG antibody (605–4302; Rockland Immunochemicals Inc.).A 3,39,5,59 tetramethyl benzidine (TMB) peroxidase sub-strate solution system was introduced and absorbance wasmeasured at 450 nm. Urinary Smad1 ELISA was done induplicate, and the mean of three measurements was applied.
Adding twodifferent concentrationsof rhSmad1 to theurinesamples (estimated values of 0.5 and2ng/mL) revealed recoveryrates of 111% and 112%, respectively, indicating specificityfor the assay system. The minimum detectable sensitivity,estimated using the three SDs method, was 0.2 ng/mL. Thecoefficient of variation of theELISA systemranged from3.3%to6.0% in 10 independent assays, thus indicating simultaneousreproducibility. In addition, aftermixing rhSmad1 into the urinesampleswith different pHvalues (5.0–8.0), recovery rateswereobtained from 102.2% to 108.2%. The final urinary Smad1concentration was normalized to the urine Cr concentration.Five positive urine samples were confirmed by Westernblotting with a specific antibody for Smad1 (Sp125), whichshowed the corresponding single band of Smad1. The banddisappeared when the blot was preincubated with excessrhSmad1. In addition, the presence of Smad1 in urinesamples was confirmed with mass spectrometry.
Detection of Urinary IgG4 via ELISAThemousemonoclonal antihuman IgG heavy chain (Ab9243;Abcam) was coated on microtiter plates (Nunc). The urinesamples or standard (full-length human IgG4 protein[ab158747; Abcam]; 1.0–2,000 ng/mL)was applied, followedby horseradish peroxidase–labeled mouse monoclonal anti-human IgG4 (Fc) (ab99823; Abcam). A TMB peroxidase sub-strate solution system was introduced and absorbance wasmeasured at 450 nm. Urinary IgG4 ELISA was done induplicate and the mean of three measurements was applied.
The urinary IgG4 detection system did not cross-react withhuman IgG1 (ab15874; Abcam), IgG2 (ab90284; Abcam) orIgG3 (ab158746; Abcam). Adding two different concentrations
988 Urinary IgG4 and Smad1 in Diabetic Nephropathy Diabetes Volume 67, May 2018
of human IgG4 (1,000 and 20 ng/mL) to the urine samplesprovided recovery rates of 104% and 118%. The minimumdetectable sensitivity was 1.0 ng/mL and the coefficient ofvariation of the ELISA system ranged from 1.0% to 2.1%.The final urinary IgG4 concentration was normalized to theurine Cr concentration.
Statistical AnalysisThe data were expressed as mean 6 SD. Trends wereanalyzed by the Jonckheere-Terpstra test based on a prioriordering of quantile analysis. The values were analyzed byt test, Mann-Whitney U test, one-way ANOVA, Kruskal-Wallis test, or x2 test in intergroups. The correlation of twovariables including pathological parameters and biomarkerswere compared using the Pearson product-moment cor-relation coefficient or Spearman rank correlation coef-ficient as appropriate on the basis of data distribution. Therates of eGFR decline compared with each baseline valuebased on four groups (reference, urinary Smad1,0.15mg/g Crand urinary IgG4 ,39.2 mg/g Cr; only high urinary Smad1group, .15 mg/g Cr [U-Smad1]; only high urinary IgG4group, .39.2 mg/g Cr [U-IgG4]; both high U-Smad1 andU-IgG4 group) were analyzed with the Wilcoxon signed ranktest in intragroups and the Steel multiple comparison test inintergroups in the follow-up study. The odds ratio (OR) fora 10% decline of eGFR at the 5-year follow-up was calculatedby multivariate logistic regression for patients fulfilling thebaseline criteria (both eGFR .60 mL/min and no macro-albuminuria). The following covariates were used as putativerisk factors: diabetes duration (,5 vs.$5 and,10years,,5vs. $10 years), retinopathy status, mean blood pressure,HbA1c, U-Smad1/Cr, U-IgG4/Cr, and ACR (normoalbumi-nuria vs.MA). In the regressionmodel, U-Smad1/Cr, U-IgG4/Cr, and ACR were forcibly included. For other factors,variables were selected through the use of a stepwisemethod,with selection criteria (P , 0.05). Two-sided P , 0.05 wasconsidered to be statistically significant. GraphPad Prism5 software (for Mac OS X) and SAS version 9.4 (SASInstitute) were used for analyses.
RESULTS
Urinary Albumin Trends for Groups With Different Levelsof Urinary IgG4 and Urinary Smad1Higher baseline ACR was observed in subjects with higherbaseline U-IgG4 using quantile analysis of U-IgG4 in thepatients with T2D (P , 0.0001) (Supplementary Fig. 2A).A statistically significant association existed between increasedbaseline urinary albumin and higher baseline U-Smad1 (P ,0.0001) (Supplementary Fig. 2B).
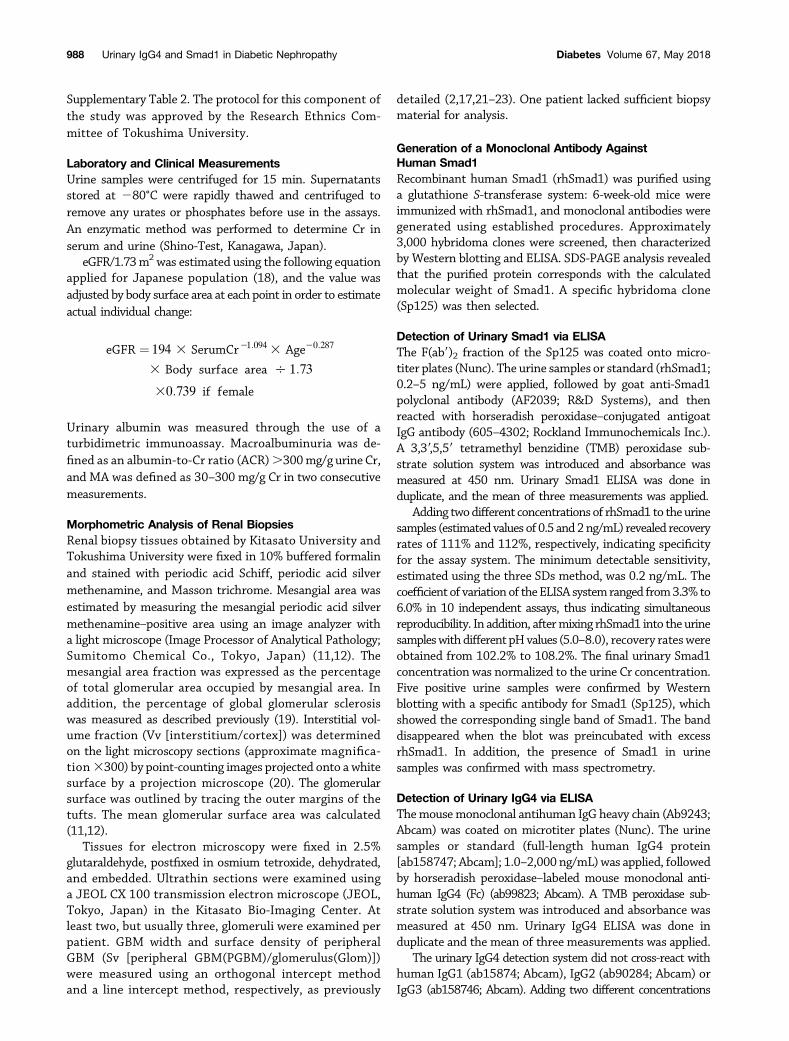
Urinary IgG4 values were not uniformly distributed in thestudy population. By analyzing the correlation between al-buminuria and log urinary IgG4, we were able to use a hockeystick regression test to establish the cutoff value for urinaryIgG4 in order to separate the twodistributions observed. Thethreshold value was 1.6 and the cutoff value for urinary IgG4was 39.2mg/g Cr (Fig. 2A). To confirm the clinical significanceof this cutoff value, we analyzed the parameters of DN. The
group with urinary IgG4 .39.2 mg/g Cr showed markedlylower eGFR than the group with urinary IgG4,39.2mg/g Cr(Fig. 2B). HbA1c values did not differ between the two groups(Fig. 2C). The higher group of urinary IgG4 showed statis-tically significant differences in diabetes duration, presence ofretinopathy, and U-Smad1 compared with the lower group,but no difference was found in BMI and mean blood pressurebetween the two groups (Supplementary Table 3).
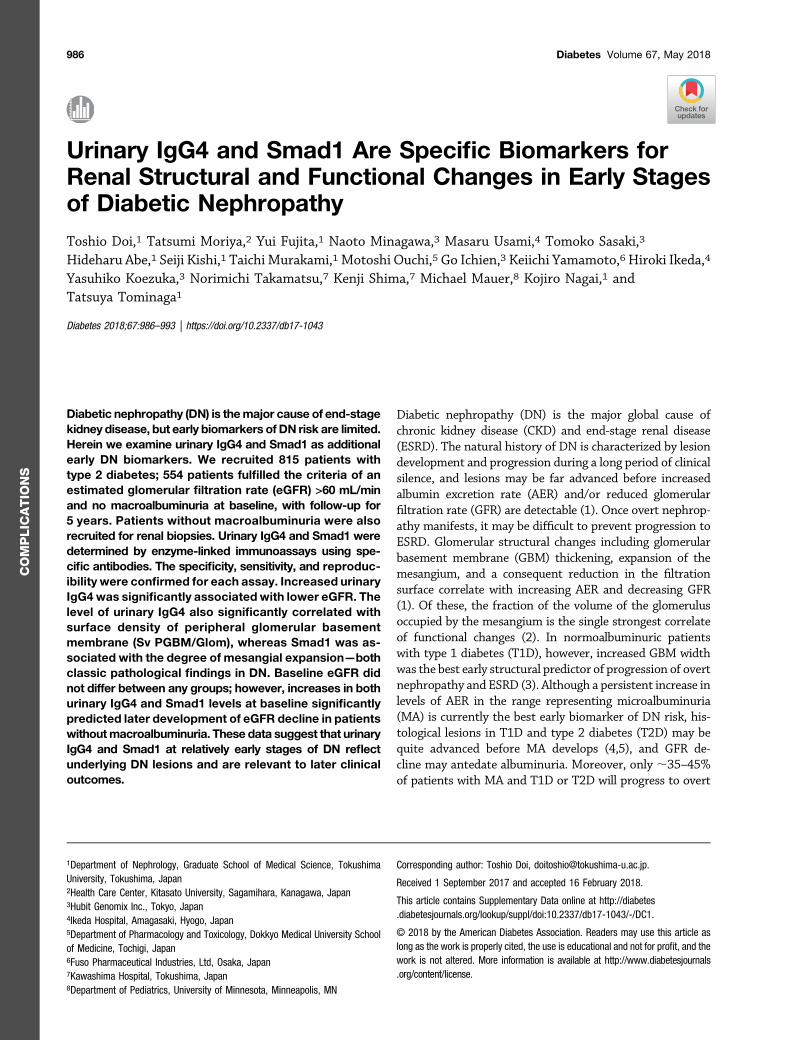
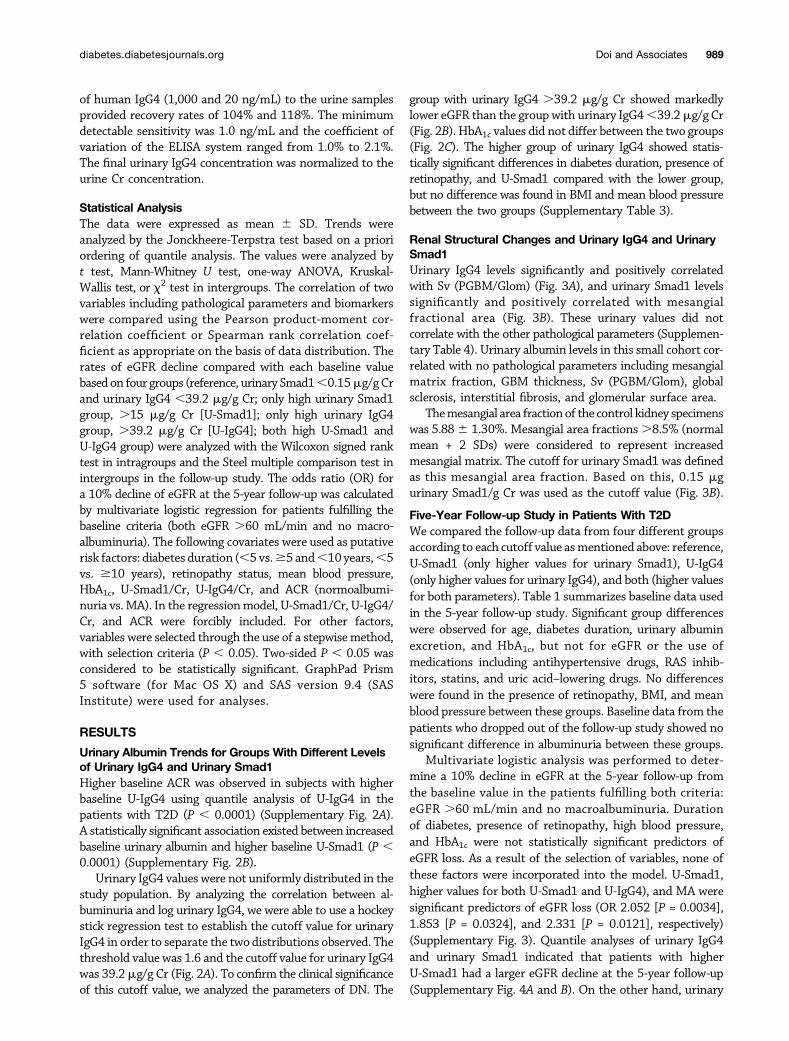
Renal Structural Changes and Urinary IgG4 and UrinarySmad1Urinary IgG4 levels significantly and positively correlatedwith Sv (PGBM/Glom) (Fig. 3A), and urinary Smad1 levelssignificantly and positively correlated with mesangialfractional area (Fig. 3B). These urinary values did notcorrelate with the other pathological parameters (Supplemen-tary Table 4). Urinary albumin levels in this small cohort cor-related with no pathological parameters including mesangialmatrix fraction, GBM thickness, Sv (PGBM/Glom), globalsclerosis, interstitial fibrosis, and glomerular surface area.
Themesangial area fraction of the control kidney specimenswas 5.886 1.30%. Mesangial area fractions.8.5% (normalmean + 2 SDs) were considered to represent increasedmesangial matrix. The cutoff for urinary Smad1 was definedas this mesangial area fraction. Based on this, 0.15 mgurinary Smad1/g Cr was used as the cutoff value (Fig. 3B).
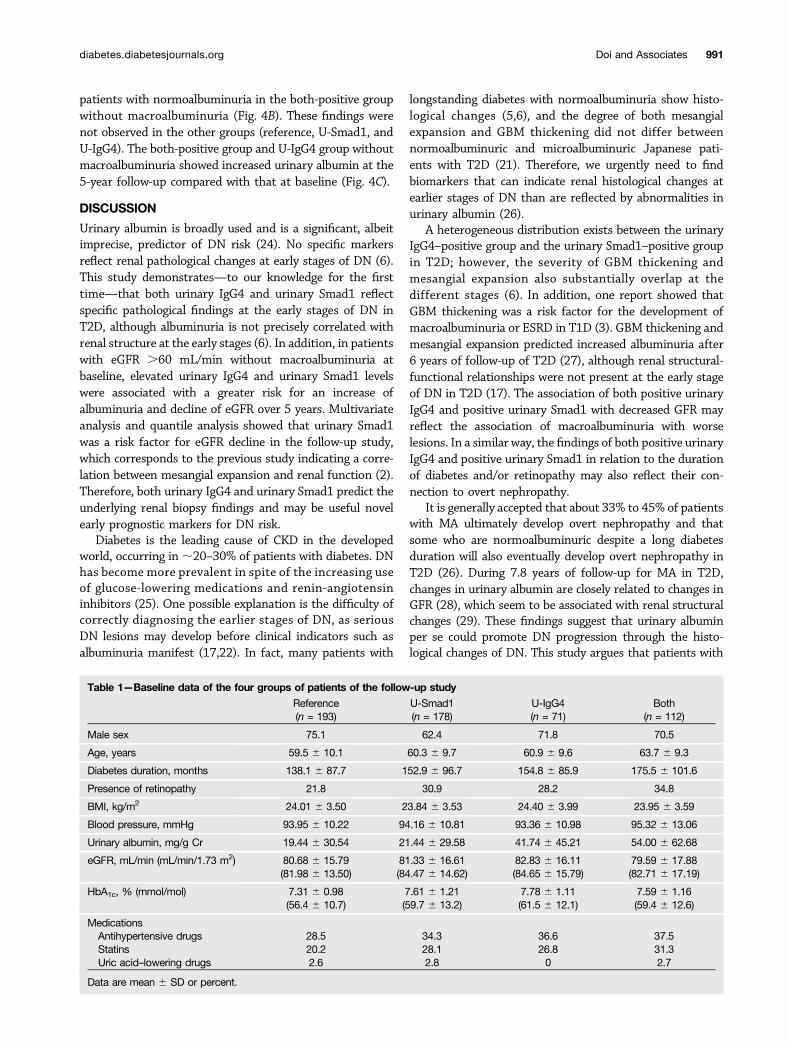
Five-Year Follow-up Study in Patients With T2DWe compared the follow-up data from four different groupsaccording to each cutoff value asmentioned above: reference,U-Smad1 (only higher values for urinary Smad1), U-IgG4(only higher values for urinary IgG4), and both (higher valuesfor both parameters). Table 1 summarizes baseline data usedin the 5-year follow-up study. Significant group differenceswere observed for age, diabetes duration, urinary albuminexcretion, and HbA1c, but not for eGFR or the use ofmedications including antihypertensive drugs, RAS inhib-itors, statins, and uric acid–lowering drugs. No differenceswere found in the presence of retinopathy, BMI, and meanblood pressure between these groups. Baseline data from thepatients who dropped out of the follow-up study showed nosignificant difference in albuminuria between these groups.
Multivariate logistic analysis was performed to deter-mine a 10% decline in eGFR at the 5-year follow-up fromthe baseline value in the patients fulfilling both criteria:eGFR .60 mL/min and no macroalbuminuria. Durationof diabetes, presence of retinopathy, high blood pressure,and HbA1c were not statistically significant predictors ofeGFR loss. As a result of the selection of variables, none ofthese factors were incorporated into the model. U-Smad1,higher values for both U-Smad1 and U-IgG4), and MA weresignificant predictors of eGFR loss (OR 2.052 [P = 0.0034],1.853 [P = 0.0324], and 2.331 [P = 0.0121], respectively)(Supplementary Fig. 3). Quantile analyses of urinary IgG4and urinary Smad1 indicated that patients with higherU-Smad1 had a larger eGFR decline at the 5-year follow-up(Supplementary Fig. 4A and B). On the other hand, urinary
diabetes.diabetesjournals.org Doi and Associates 989
IgG4 and urinary Smad1 were not related to albuminuriaprogression (Supplementary Fig. 4C and D).
Because urinary IgG4 and Smad1 correlate with specificrenal structural parameters in the early stages of T2D,as mentioned above, we analyzed the patients withoutmacroalbuminuria at baseline. The U-Smad1 group with
eGFR .60 mL/min and no macroalbuminuria showed sta-tistically significantly decreased eGFR at the 5-year follow-up. Moreover, the subset with elevations in both theseanalytes also showed significantly greater eGFR decline(Fig. 4A). Patients with MA showed a significantly higher de-cline in eGFR at the 5-year follow-up when compared with
Figure 2—Cutoff value for urinary IgG4 and relation of urinary IgG4 with urinary albumin, eGFR, and HbA1c. A: Hockey stick regression betweenurinary albumin and log urinary IgG4. Two different distributions occurred among all patients. In the groupwith higher urinary IgG4, urinary albuminwas significantly correlatedwith log urinary IgG4 (r=0.435;P, 0.0001). The threshold valuewas1.59341 and the cutoff valuewas 39.2mg/gCr.B:The cutoff value for urinary IgG4 and eGFR. The group with U-IgG4 .39.2 mg/g Cr represents significantly low eGFR. Data are expressed asmean 6 SD. C and D: The cutoff values of U-IgG4 and HbA1c using the NGSP (%) (C) and International Federation of Clinical Chemistry andLaboratory Medicine (mmol/mol) (D) methods. No difference was found in HbA1c between both groups. Data are expressed as mean6 SD. n.s.,not significant.
Figure 3—The relations of urinary IgG4 and urinary Smad1 with renal histological parameters. A: Correlation between urinary IgG4 and surfacedensity of peripheral GBM. The urinary IgG4 levels significantly and positively correlated with Sv (PGBM/Glom) (r = 0.847; P , 0.0001). B:Correlation between urinary Smad1 and mesangial area fraction. The urinary Smad1 levels were significantly associated with mesangial areafraction (r = 0.564; P , 0.02).
990 Urinary IgG4 and Smad1 in Diabetic Nephropathy Diabetes Volume 67, May 2018
patients with normoalbuminuria in the both-positive groupwithout macroalbuminuria (Fig. 4B). These findings werenot observed in the other groups (reference, U-Smad1, andU-IgG4). The both-positive group and U-IgG4 group withoutmacroalbuminuria showed increased urinary albumin at the5-year follow-up compared with that at baseline (Fig. 4C).
DISCUSSION
Urinary albumin is broadly used and is a significant, albeitimprecise, predictor of DN risk (24). No specific markersreflect renal pathological changes at early stages of DN (6).This study demonstrates—to our knowledge for the firsttime—that both urinary IgG4 and urinary Smad1 reflectspecific pathological findings at the early stages of DN inT2D, although albuminuria is not precisely correlated withrenal structure at the early stages (6). In addition, in patientswith eGFR .60 mL/min without macroalbuminuria atbaseline, elevated urinary IgG4 and urinary Smad1 levelswere associated with a greater risk for an increase ofalbuminuria and decline of eGFR over 5 years. Multivariateanalysis and quantile analysis showed that urinary Smad1was a risk factor for eGFR decline in the follow-up study,which corresponds to the previous study indicating a corre-lation between mesangial expansion and renal function (2).Therefore, both urinary IgG4 and urinary Smad1 predict theunderlying renal biopsy findings and may be useful novelearly prognostic markers for DN risk.
Diabetes is the leading cause of CKD in the developedworld, occurring in;20–30% of patients with diabetes. DNhas become more prevalent in spite of the increasing useof glucose-lowering medications and renin-angiotensininhibitors (25). One possible explanation is the difficulty ofcorrectly diagnosing the earlier stages of DN, as seriousDN lesions may develop before clinical indicators such asalbuminuria manifest (17,22). In fact, many patients with
longstanding diabetes with normoalbuminuria show histo-logical changes (5,6), and the degree of both mesangialexpansion and GBM thickening did not differ betweennormoalbuminuric and microalbuminuric Japanese pati-ents with T2D (21). Therefore, we urgently need to findbiomarkers that can indicate renal histological changes atearlier stages of DN than are reflected by abnormalities inurinary albumin (26).
A heterogeneous distribution exists between the urinaryIgG4–positive group and the urinary Smad1–positive groupin T2D; however, the severity of GBM thickening andmesangial expansion also substantially overlap at thedifferent stages (6). In addition, one report showed thatGBM thickening was a risk factor for the development ofmacroalbuminuria or ESRD in T1D (3). GBM thickening andmesangial expansion predicted increased albuminuria after6 years of follow-up of T2D (27), although renal structural-functional relationships were not present at the early stageof DN in T2D (17). The association of both positive urinaryIgG4 and positive urinary Smad1 with decreased GFR mayreflect the association of macroalbuminuria with worselesions. In a similar way, the findings of both positive urinaryIgG4 and positive urinary Smad1 in relation to the durationof diabetes and/or retinopathy may also reflect their con-nection to overt nephropathy.
It is generally accepted that about 33% to 45% of patientswith MA ultimately develop overt nephropathy and thatsome who are normoalbuminuric despite a long diabetesduration will also eventually develop overt nephropathy inT2D (26). During 7.8 years of follow-up for MA in T2D,changes in urinary albumin are closely related to changes inGFR (28), which seem to be associated with renal structuralchanges (29). These findings suggest that urinary albuminper se could promote DN progression through the histo-logical changes of DN. This study argues that patients with
Table 1—Baseline data of the four groups of patients of the follow-up study
Reference(n = 193)
U-Smad1(n = 178)
U-IgG4(n = 71)
Both(n = 112)
Male sex 75.1 62.4 71.8 70.5
Age, years 59.5 6 10.1 60.3 6 9.7 60.9 6 9.6 63.7 6 9.3
Diabetes duration, months 138.1 6 87.7 152.9 6 96.7 154.8 6 85.9 175.5 6 101.6
Presence of retinopathy 21.8 30.9 28.2 34.8
BMI, kg/m2 24.01 6 3.50 23.84 6 3.53 24.40 6 3.99 23.95 6 3.59
Blood pressure, mmHg 93.95 6 10.22 94.16 6 10.81 93.36 6 10.98 95.32 6 13.06
Urinary albumin, mg/g Cr 19.44 6 30.54 21.44 6 29.58 41.74 6 45.21 54.00 6 62.68
eGFR, mL/min (mL/min/1.73 m2) 80.68 6 15.79(81.98 6 13.50)
81.33 6 16.61(84.47 6 14.62)
82.83 6 16.11(84.65 6 15.79)
79.59 6 17.88(82.71 6 17.19)
HbA1c, % (mmol/mol) 7.31 6 0.98(56.4 6 10.7)
7.61 6 1.21(59.7 6 13.2)
7.78 6 1.11(61.5 6 12.1)
7.59 6 1.16(59.4 6 12.6)
MedicationsAntihypertensive drugs 28.5 34.3 36.6 37.5Statins 20.2 28.1 26.8 31.3Uric acid–lowering drugs 2.6 2.8 0 2.7
Data are mean 6 SD or percent.
diabetes.diabetesjournals.org Doi and Associates 991

high urinary IgG4 and urinary Smad1 without macroalbumi-nuria may have progressive GFR loss, which is associated withincreased urinary IgG4 and urinary Smad1 and renal structuralchanges, especially in patients with MA in whom both wereincreased. The results are also supported by a previous studyshowing that structural change is an indicator for laterdevelopment of overt nephropathy in normo- and micro-albuminuric patients with T2D (27). On the other hand, thereference group (negative for both urinary Smad1 andurinary IgG4) had an eGFR decline comparable to that of thegeneral population and showed no renal structural changes.In this group, MA was not a predictor of eGFR decline.
The strengths of this study are that these biomarkers,including urinary IgG4 and urinary Smad1, reflect diabeticrenal structural changes and predict later progression of GFRloss. In addition, Smad1 is a critical molecule implicatedin mesangial matrix expansion, and phosphorylated Smad1expression is associated with renal structural changes withangiotensin receptor blockade therapy or antibone mor-phogenetic protein 4 antibody treatment in diabetic rats(9–11,13).
One of the limitations of our study is that insufficientdata exist to precisely determine the cutoff values of thesebiomarkers. From the analysis of a small number of controlspecimens from 1-h biopsy, Sv (PGBM/Glom) showed twodifferent peaks of distribution (shown in Supplementary Fig.1). The value of 39.2 mg/g Cr after analysis with hockey stickregression corresponded to Sv of 0.1243, indicating theapproximately median value of Sv. However, both the cutoffvalue of urinary IgG4 after analysis with hockey stickregression and that of urinary Smad1 determined by theirassociation with mesangial matrix expansion indicate theirsignificance in DN. The exact mechanism of urinary Smad1excretion is not completely clear, but preliminary studyshows that the exosome fractions from urine samples frompatients with DN contain significant amounts of Smad1.Another limitation is that we analyzed renal biopsies fromonly a small number of patients. In Japan, renal biopsies canalmost never be performed at the early stage of DN. In thisstudy, however, we provide evidence of early renal structural-functional relationships, which were not shown previ-ously in patients with T2D. Further follow-up studies that
Figure 4—Five-year follow-up study in patients with eGFR.60 mL/min and no macroalbuminuria. A: Percentage decline of eGFR in the 5-yearfollow-up study. All groups at the 5-year follow-up time point showed a significant decline in eGFR compared with that at baseline (P , 0.001,Wilcoxon signed rank test). The both-positive group and theU-Smad1group showed significant eGFRdecline comparedwith that of the referencegroup at the 5-year follow-up time point (P, 0.01, Steel test). Data are expressed asmean6SD.B: Percentage decline of eGFRbetween patientswith normoalbuminuria (NA) andMA in the groupwith both positive U-IgG4 and positive U-Smad1. Both groups at the 5-year follow-up time pointshowed a significant decline in eGFR compared with that at baseline (P, 0.001). Patients with MA showed significantly lower eGFR at the 5-yearfollow-up than did patients with NA (P , 0.05). Data are expressed as mean 6 SD. C: Urinary albumin excretion in four groups over the 5-yearfollow-up. Urinary albumin is significantly increased 5 years later compared with that at baseline in the reference, U-Smad1, and both-positivegroups (P, 0.001). The both-positive group and the U-IgG4 group showed statistically higher urinary albumin excretion than the reference groupat baseline and at the 5-year follow-up. Data are expressed as mean 6 SD.
992 Urinary IgG4 and Smad1 in Diabetic Nephropathy Diabetes Volume 67, May 2018
examine a larger cohort over a longer period of time arewarranted.
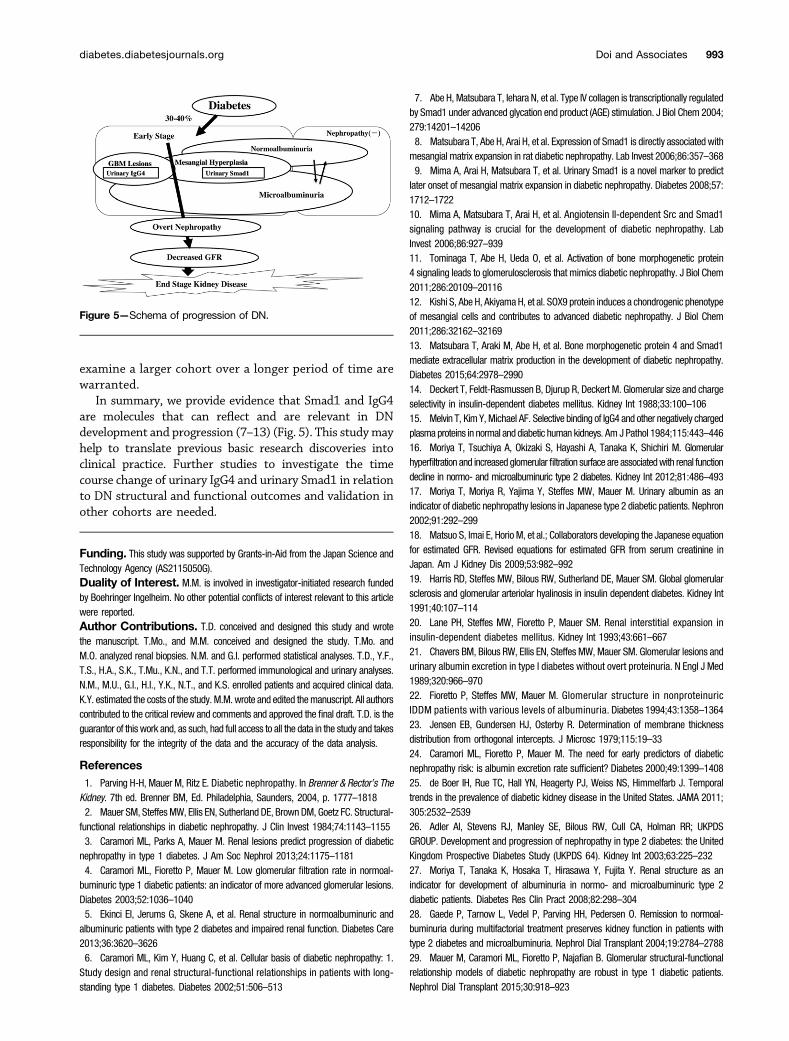
In summary, we provide evidence that Smad1 and IgG4are molecules that can reflect and are relevant in DNdevelopment and progression (7–13) (Fig. 5). This studymayhelp to translate previous basic research discoveries intoclinical practice. Further studies to investigate the timecourse change of urinary IgG4 and urinary Smad1 in relationto DN structural and functional outcomes and validation inother cohorts are needed.
Funding. This study was supported by Grants-in-Aid from the Japan Science andTechnology Agency (AS2115050G).Duality of Interest. M.M. is involved in investigator-initiated research fundedby Boehringer Ingelheim. No other potential conflicts of interest relevant to this articlewere reported.Author Contributions. T.D. conceived and designed this study and wrotethe manuscript. T.Mo., and M.M. conceived and designed the study. T.Mo. andM.O. analyzed renal biopsies. N.M. and G.I. performed statistical analyses. T.D., Y.F.,T.S., H.A., S.K., T.Mu., K.N., and T.T. performed immunological and urinary analyses.N.M., M.U., G.I., H.I., Y.K., N.T., and K.S. enrolled patients and acquired clinical data.K.Y. estimated the costs of the study. M.M. wrote and edited themanuscript. All authorscontributed to the critical review and comments and approved the final draft. T.D. is theguarantor of this work and, as such, had full access to all the data in the study and takesresponsibility for the integrity of the data and the accuracy of the data analysis.
References1. Parving H-H, Mauer M, Ritz E. Diabetic nephropathy. In Brenner & Rector’s TheKidney. 7th ed. Brenner BM, Ed. Philadelphia, Saunders, 2004, p. 1777–18182. Mauer SM, Steffes MW, Ellis EN, Sutherland DE, Brown DM, Goetz FC. Structural-functional relationships in diabetic nephropathy. J Clin Invest 1984;74:1143–11553. Caramori ML, Parks A, Mauer M. Renal lesions predict progression of diabeticnephropathy in type 1 diabetes. J Am Soc Nephrol 2013;24:1175–11814. Caramori ML, Fioretto P, Mauer M. Low glomerular filtration rate in normoal-buminuric type 1 diabetic patients: an indicator of more advanced glomerular lesions.Diabetes 2003;52:1036–10405. Ekinci EI, Jerums G, Skene A, et al. Renal structure in normoalbuminuric andalbuminuric patients with type 2 diabetes and impaired renal function. Diabetes Care2013;36:3620–36266. Caramori ML, Kim Y, Huang C, et al. Cellular basis of diabetic nephropathy: 1.Study design and renal structural-functional relationships in patients with long-standing type 1 diabetes. Diabetes 2002;51:506–513
7. Abe H, Matsubara T, Iehara N, et al. Type IV collagen is transcriptionally regulatedby Smad1 under advanced glycation end product (AGE) stimulation. J Biol Chem 2004;279:14201–142068. Matsubara T, Abe H, Arai H, et al. Expression of Smad1 is directly associated withmesangial matrix expansion in rat diabetic nephropathy. Lab Invest 2006;86:357–3689. Mima A, Arai H, Matsubara T, et al. Urinary Smad1 is a novel marker to predictlater onset of mesangial matrix expansion in diabetic nephropathy. Diabetes 2008;57:1712–172210. Mima A, Matsubara T, Arai H, et al. Angiotensin II-dependent Src and Smad1signaling pathway is crucial for the development of diabetic nephropathy. LabInvest 2006;86:927–93911. Tominaga T, Abe H, Ueda O, et al. Activation of bone morphogenetic protein4 signaling leads to glomerulosclerosis that mimics diabetic nephropathy. J Biol Chem2011;286:20109–2011612. Kishi S, Abe H, Akiyama H, et al. SOX9 protein induces a chondrogenic phenotypeof mesangial cells and contributes to advanced diabetic nephropathy. J Biol Chem2011;286:32162–3216913. Matsubara T, Araki M, Abe H, et al. Bone morphogenetic protein 4 and Smad1mediate extracellular matrix production in the development of diabetic nephropathy.Diabetes 2015;64:2978–299014. Deckert T, Feldt-Rasmussen B, Djurup R, Deckert M. Glomerular size and chargeselectivity in insulin-dependent diabetes mellitus. Kidney Int 1988;33:100–10615. Melvin T, Kim Y, Michael AF. Selective binding of IgG4 and other negatively chargedplasma proteins in normal and diabetic human kidneys. Am J Pathol 1984;115:443–44616. Moriya T, Tsuchiya A, Okizaki S, Hayashi A, Tanaka K, Shichiri M. Glomerularhyperfiltration and increased glomerular filtration surface are associatedwith renal functiondecline in normo- and microalbuminuric type 2 diabetes. Kidney Int 2012;81:486–49317. Moriya T, Moriya R, Yajima Y, Steffes MW, Mauer M. Urinary albumin as anindicator of diabetic nephropathy lesions in Japanese type 2 diabetic patients. Nephron2002;91:292–29918. Matsuo S, Imai E, Horio M, et al.; Collaborators developing the Japanese equationfor estimated GFR. Revised equations for estimated GFR from serum creatinine inJapan. Am J Kidney Dis 2009;53:982–99219. Harris RD, Steffes MW, Bilous RW, Sutherland DE, Mauer SM. Global glomerularsclerosis and glomerular arteriolar hyalinosis in insulin dependent diabetes. Kidney Int1991;40:107–11420. Lane PH, Steffes MW, Fioretto P, Mauer SM. Renal interstitial expansion ininsulin-dependent diabetes mellitus. Kidney Int 1993;43:661–66721. Chavers BM, Bilous RW, Ellis EN, Steffes MW, Mauer SM. Glomerular lesions andurinary albumin excretion in type I diabetes without overt proteinuria. N Engl J Med1989;320:966–97022. Fioretto P, Steffes MW, Mauer M. Glomerular structure in nonproteinuricIDDM patients with various levels of albuminuria. Diabetes 1994;43:1358–136423. Jensen EB, Gundersen HJ, Osterby R. Determination of membrane thicknessdistribution from orthogonal intercepts. J Microsc 1979;115:19–3324. Caramori ML, Fioretto P, Mauer M. The need for early predictors of diabeticnephropathy risk: is albumin excretion rate sufficient? Diabetes 2000;49:1399–140825. de Boer IH, Rue TC, Hall YN, Heagerty PJ, Weiss NS, Himmelfarb J. Temporaltrends in the prevalence of diabetic kidney disease in the United States. JAMA 2011;305:2532–253926. Adler AI, Stevens RJ, Manley SE, Bilous RW, Cull CA, Holman RR; UKPDSGROUP. Development and progression of nephropathy in type 2 diabetes: the UnitedKingdom Prospective Diabetes Study (UKPDS 64). Kidney Int 2003;63:225–23227. Moriya T, Tanaka K, Hosaka T, Hirasawa Y, Fujita Y. Renal structure as anindicator for development of albuminuria in normo- and microalbuminuric type 2diabetic patients. Diabetes Res Clin Pract 2008;82:298–30428. Gaede P, Tarnow L, Vedel P, Parving HH, Pedersen O. Remission to normoal-buminuria during multifactorial treatment preserves kidney function in patients withtype 2 diabetes and microalbuminuria. Nephrol Dial Transplant 2004;19:2784–278829. Mauer M, Caramori ML, Fioretto P, Najafian B. Glomerular structural-functionalrelationship models of diabetic nephropathy are robust in type 1 diabetic patients.Nephrol Dial Transplant 2015;30:918–923
Figure 5—Schema of progression of DN.
diabetes.diabetesjournals.org Doi and Associates 993