Embed Size (px)
Citation preview
Urokinase-Type Plasminogen Activator Receptor as aPotential PET Biomarker in Glioblastoma
Morten Persson1, Mette K. Nedergaard1,2, Malene Brandt-Larsen1, Dorthe Skovgaard1, Jesper T. Jørgensen1,Signe R. Michaelsen2, Jacob Madsen1, Ulrik Lassen3, Hans S. Poulsen2, and Andreas Kjaer1
1Department of Clinical Physiology, Nuclear Medicine, and PET and Cluster for Molecular Imaging, Rigshospitalet and University ofCopenhagen, Copenhagen, Denmark; 2Department of Radiation Biology, Finsen Center, Rigshospitalet, Copenhagen, Denmark; and3Department of Oncology, Finsen Center, Rigshospitalet, Copenhagen, Denmark
Glioblastoma is one of the most malignant types of human cancer,
and the prognosis is poor. The development and validation of novelmolecular imaging biomarkers has the potential to improve tumor
detection, grading, risk stratification, and treatment monitoring of
gliomas. The aim of this study was to explore the potential of PETimaging of the urokinase-type plasminogen activator receptor (uPAR)
in glioblastoma. Methods: The uPAR messenger RNA expression of
tumors from 19 glioblastoma patients was analyzed, and a cell culture
derived from one of these patients was used to establish an ortho-topic xenograft model of glioblastoma. Tumor growth was monitored
using bioluminescence imaging. Five to six weeks after inoculation, all
mice were scanned with small-animal PET/CT using two new uPAR
PET ligands (64Cu-NOTA-AE105 and 68Ga-NOTA-AE105) and, forcomparison, O-(2-18F-fluoroethyl)-L-tyrosine (18F-FET). One MRI scan
was obtained for each mouse to confirm tumor location. The uPAR
specificity of 64Cu-NOTA-AE105 was confirmed by alignment ofhematoxylin- and eosin-stained and uPAR immunohistochemistry–
stained slides of the brain with the activity distribution as deter-
mined using autoradiography. Results: uPAR expression was found
in all 19 glioblastoma patient tumors, and high expression of uPARcorrelated with decreased overall survival (P 5 0.04). Radiolabeling
of NOTA-AE105 with 64Cu and 68Ga was straightforward, resulting
in a specific activity of approximately 20 GBq/μmol and a radio-
chemical purity of more than 98% for 64Cu-NOTA-AE105 and morethan 97% for 68Ga-NOTA-AE105. High image contrast resulting in
clear tumor delineation was found for both 68Ga-NOTA-AE105 and64Cu-NOTA-AE105. Absolute uptake in tumor was higher for18F-FET (3.5 ± 0.8 percentage injected dose [%ID]/g) than for64Cu-NOTA-AE105 (1.2 ± 0.4 %ID/g) or 68Ga-NOTA-AE105
(0.4 ± 0.1 %ID/g). A similar pattern was observed in background brain
tissue, where uptake was 1.9 ± 0.1 %ID/g for 18F-fluorothymidine,compared with 0.05 ± 0.01 %ID/g for 68Ga-NOTA-AE105 and 0.11
± 0.02 %ID/g for 64Cu-NOTA-AE105. The result was a significantly
higher tumor-to-background ratio for both 68Ga-NOTA-AE105 (7.6 ±2.1, P , 0.05) and 64Cu-NOTA-AE105 (10.6 ± 2.3, P , 0.01) than for18F-FET PET (1.8 ± 0.3). Autoradiography of brain slides confirmed
that the accumulation of 64Cu-NOTA-AE105 corresponded well with
uPAR-positive cancer cells. Conclusion: On the basis of our trans-
lational study, uPAR PET may be a highly promising imaging bio-marker for glioblastoma. Further clinical exploration of uPAR PET in
glioblastoma is therefore justified.
Key Words: PET/CT; glioblastoma; PET; survival; translational;
urokinase-type
J Nucl Med 2016; 57:272–278DOI: 10.2967/jnumed.115.161703
Glioblastoma is the most common primary malignancy of thecentral nervous system in adults, with more than 10,000 new casesdiagnosed annually in the United States (1,2). It is a locally ag-gressive brain tumor with poor prognosis, and the median survivalis limited to about 15 mo from the time of diagnosis (3). Onearea of focus for improving this poor prognosis is developmentof noninvasive molecular imaging techniques for accuratetumor detection, grading, risk stratification, treatment monitoring,and recurrence detection (4). 18F-FDG still remains the mostused PET ligand for brain tumor imaging worldwide, comprisingmore than 90% of all PET imaging studies despite havingseveral limitations (5). To increase specificity, sensitivity, and di-agnostic accuracy, several imaging ligands for brain tumors havebeen developed during the last decade. Of these, PET ligands basedon nucleosides, amino acid analogs, and ligands interacting withoxidative metabolism, fatty acid metabolism, and hypoxia seem to bethe most promising (5,6). In a clinical setting, 18F-fluorothymidine(7,8), O-(2-18F-fluoroethyl)-L-tyrosine (18F-FET) (4,9,10), and 18F-fluoromisonidazole (11,12) have been investigated with mixed re-sults. Therefore, a method for optimal noninvasive imaging of braintumors and risk stratification is still lacking.Urokinase-type plasminogen activator receptor (uPAR) has been
reported as a promising imaging target in several cancer types(13,14). uPAR is an extracellular receptor, and expression of uPARhas been found to be elevated in several types of cancer and tocorrelate with poor prognosis (15–17). In glioblastoma, uPAR ex-pression has been reported to be elevated and to correlate withparenchymal invasion, that is, aggressiveness (18–20). Further, a re-cent study has shown evidence of a direct link between upregulationof the urokinase-type plasminogen activator–uPAR–extracellularsignal-regulated kinase 1/2 pathway and sensitivity toward small-molecule tyrosine kinase inhibitors for the epidermal growth factorreceptor (21). Together, these make uPAR a highly promising im-aging target for gliomas, with the potential for diagnosis and riskstratification and for use as a tool to identify patients sensitive to-ward epidermal growth factor receptor inhibitors.In our laboratory, we have developed and characterized several
uPAR PET ligands (22–25), all based on a small uPAR-antagonist
Received Jun. 1, 2015; revision accepted Aug. 26, 2015.For correspondence contact: Andreas Kjaer, Department of Clinical
Physiology, Nuclear Medicine, and PET, Rigshospitalet–4012, Blegdamsvej9, 2100 Copenhagen Ø, Denmark.E-mail: [email protected] online Oct. 1, 2015.COPYRIGHT © 2016 by the Society of Nuclear Medicine and Molecular
Imaging, Inc.
272 THE JOURNAL OF NUCLEAR MEDICINE • Vol. 57 • No. 2 • February 2016
by on April 3, 2020. For personal use only. jnm.snmjournals.org Downloaded from
linear peptide denoted AE105 (26). Previous in vivo characteriza-tion studies of these uPAR PET ligands have been conducted onmurine xenograft models of human cancer in which tumor cellshave been inoculated subcutaneously. The advantages of thesemodels are high throughput and easy application. However, sev-eral studies have documented limitations using these models, es-pecially with regard to clinical relevance, because of the limitedsimilarity between in situ tumor cell physiology and immortalcancer cell lines (27). There is consensus that when human cancercells are inoculated in the mouse organ of human origin (ortho-topic), the clinical situation is modeled more closely.To investigate the potential of uPAR PET imaging in brain tumors,
we generated two new uPAR PET ligands (64Cu-NOTA-AE105 and68Ga-NOTA-AE105) and examined their in vivo performance ina nude mouse orthotopic brain tumor model using an in-house–developed patient-derived neurosphere glioblastoma culture. BesidesuPAR PET, 18F-FET PET and MRI were also performed for com-parison because 18F-FET PET has been implemented in the evalua-tion of brain tumors at several European institutions, includingRigshospitalet. Quantitative real-time polymerase chain reac-tion analysis of uPAR expression from biopsy samples of 19 pa-tients diagnosed with glioblastoma was also included to investigatethe association between uPAR expression and prognosis.
MATERIALS AND METHODS
Ethics Statement
This study was performed according to the Declaration of Helsinkiand Danish legislation. Permission to collect and use patient data and
material was granted by the Danish Data Protection Agency (2006-41-6979) and the ethical committee for the Capital Region of Denmark
(H-C-2008-095 and KF-01-327718). Animal care and experimentalprocedures were performed under the approval of the Danish Animal
Welfare Council.
Patient Material
The patient material consisted of tumor specimens obtained duringprimary surgery at Rigshospitalet from 19 randomly chosen patients
diagnosed with primary glioblastoma. The 19 patients included 10men and 9 women, with a mean age of 54.7 y (range, 34–67 y) and
an Eastern Cooperative Oncology Group performance status of
0 (n 5 13), 1 (n 5 2), or 2 (n 5 3) (data were missing for 1 patient).After primary surgery, 18 of the 19 patients received concomitant
radiation and temozolomide therapy followed by up to 6 courses ofadjuvant temozolomide therapy. Of these patients, 13 received corti-
costeroid therapy at treatment initiation. Further, at tumor progression,10 of the patients underwent secondary operation, whereas 11 re-
ceived relapse therapy with combined bevacizumab and irinotecan.Detailed descriptions of the treatments have previously been published
elsewhere (1), and patient demographics are shown in Table 1.
Quantitative Real-Time Polymerase Chain Reaction
Quantitative real-time polymerase chain reaction analysis of relative
uPAR expression was performed on RNA from all 19 glioblastomatumor samples and from U937 and HEK 293 cells, which served as
assay controls because they previously were found to have relativelyhigh and low uPAR expression, respectively (28). RNA from the glio-
blastoma patient tumors was isolated using TRIzol reagent (Life Tech-nologies) and Tissue Lyser (Qiagen) before RNA purification with the
RNeasy Mini KIT (Qiagen) according to manufacturer instructions.RNA from U937 and HEK 293 cells was extracted from cell pellets
using QIA shredder columns and the RNeasy Mini Kit (both fromQiagen). All RNA samples were DNase-treated using the RNase-
Free DNase Set (Qiagen). cDNAwas synthesized and then treated with
RNase H according to the manufacturer’s protocol using the Super-
Script III Platinum 2-step quantitative real-time polymerase chain re-action kit with SYBR Green (Life Technologies), which was also used
for the subsequent quantitative real-time polymerase chain reaction.The DDCt method was used to calculate relative gene expression.
The specific primers and cycling conditions for uPAR were the sameas previously described (20). Data were normalized to the expression of
3 housekeeping genes (TOP1, CYC1, and EIF4A2) (PrimerDesign), forwhich the cycling conditions were 95�C for 15 s and 60�C for 60 s for
50 cycles, with initial melting at 95�C for 2 min.
Radiochemistry
NOTA-AE105 was purchased from ABX GmBH (Advanced Bio-chemical Compounds). 64Cu and 68Ga were produced as previously de-
scribed in detail (24,25). NOTA-AE105 was radiolabeled with 64Cu byadding 64CuCl2 (;150 MBq) to a vial containing 500 mL of 0.1 M
ammonium acetate buffer (pH 5.5) and NOTA-AE105 (2–20 nmol). Thereaction mixture was left at room temperature for 10 min; after purification
(Sep-Pak C18 Light; Waters), the product was more than 97% pure. Theamount of unlabeled 64Cu in the product was less than 1%, as demon-
strated by radio–high-performance liquid chromatography. 68Ga labelingwas performed using the fractionated method. The 68Ge/68Ga generator
was eluted with 6 mL of 0.1 M HCl. Approximately 80% of theentire activity (1 mL, 450–500 MBq) was transferred to a vial containing
2–20 nmol of NOTA-AE105 and 1 mL of 0.7 M NaOAc buffer (pH 5.2).The reaction mixture was left at 60�C for 10 min, and the mixture was
purified by C18 Light Sep-Pak, resulting in purity above 95%. 18F-FETwas synthesized using (2S)-O-(2-tosyloxyethyl)-N-trityl-L-tyrosine-tert-
butyl ester as precursor on a TracerLab MX (GE Healthcare). All reagentsand FET cassettes were purchased from ABXGmBH. For analysis, a high-
performance liquid chromatograph (Ultimate 3000; Dionex) was usedwith a 2.6-mm, 100-A, 50 · 4.6 mm C18 column (Kinetex). The mobile
phases for 64Cu-NOTA-AE105 and 68Ga-NOTA-AE105 were as follows:eluent A: 10% MeCN in H2O with 0.1% trifluoroacetic acid; eluent B:
10% H2O in MeCN with 0.1% trifluoroacetic acid. The mobile phase for18F-FET was 98% 20 mM acetate buffer, pH 4.75, with 2% MeCN.
Orthotopic Brain Tumor Model
A glioblastoma CPH048p6 neurosphere cell culture having a stable
expression of luciferase was used to establish an orthotopic glioblas-toma model. This culture had previously been established from patient
19 (CPH48) (Table 1). Establishment, culturing, and luciferase trans-duction of this cell culture have previously been described (2). The
orthotopic glioblastoma xenograft model was generated as recentlydescribed in detail (28,29). In brief, a longitudinal incision was made
in the scalp, exposing the calvarium. Using a microdrill, a burr holewas created in the skull 1.5 mm to the right of the sutura sagittalis and
0.5 mm posterior to the bregma. A 10-mL cell suspension (100,000cells) was injected at a depth of 2–2.5 mm at a rate of 60 nL/s using a
100-mL syringe with a 25-gauge needle (SGE100RN; World Precision
Instruments) placed in a microinfusion pump (Micro4 controller andMicroSyringe pump controller [World Precision Instruments] and
KOPF model 1770-C [Better Hospital Equipment Corp.]). The ani-mals were housed in a climate-controlled room with a 12-h light:12-h
dark cycle. They had free access to food and water during housing.
Bioluminescence Imaging
For bioluminescence imaging, the mice were injected intraperito-
neally with D-luciferin (150 mg/kg of body weight) according to thescheme in Figure 2. Images were acquired using a Xenogen IVIS 100
(Caliper Life Sciences) 10 min after injection of D-luciferin.
Small-Animal PET/CT Imaging
Each mouse received a tail-vein injection of 18F-FET (10 MBq, n5 3),64Cu-NOTA-AE105 (6 MBq, n 5 3), or 68Ga-NOTA-AE105 (6 MBq,
UPAR PET IN GLIOBLASTOMA • Persson et al. 273
by on April 3, 2020. For personal use only. jnm.snmjournals.org Downloaded from
n 5 3) according to the scheme in Figure 2. PET scans were acquired
with a microPET Focus 120 scanner (Siemens Medical Solutions). Theenergy window of the emission scans was set to 350–605 keV with a
time resolution of 6 ns. The acquired emission dataset was automati-cally stored in list mode. Each mouse was scanned 1 h after injection
(64Cu-NOTA-AE105 and 68Ga-NOTA-AE105) or 0.5 h after injection(18F-FET), with a 10-min static PET scan being followed by a CT scan.
CT data were acquired with a microCAT II tomograph (Siemens Med-ical Solutions). The x-ray tube with a 0.5-mm aluminum filter was set at
80 kVp, a tube current of 500 mA, and an exposure time of 700 ms perprojection. The voxel size was 0.095 · 0.095 · 0.095 mm. During the
scan, the animals were anesthetized using 2% isoflurane. All list-modedata were postprocessed into 128 · 128 · 32 sinograms using a
3-dimensional maximum a priori algorithm and into 256 · 256 · 95matrices with a isometric voxel size of 0.43 mm3. The resolution of the
PET scanner was 1.5 mm at the center of the field of view and 1.8 mm
at 38 mm off-center using a 3-dimensional maximum a priori algorithm.All results were analyzed using Inveon software (Siemens Medical
Solutions), and tracer uptake was expressed as percentage injected dose(%ID) per gram of tissue.
MRI
MRI experiments were performed on a Biospec 7.0 (BrukerBioSpin). A TurboRare T2-weighted protocol was used to generate
transverse and coronal images. Eight transverse slices and 12 coronalslices 0.5 mm thick were acquired using a repetition time of 2,500 ms
and an echo time of 33 ms. A 20 · 20 mm field of view was sampledinto a 256 · 256 mm matrix, resulting in a spatial resolution of 0.078.
The MR images were then transferred in DICOM format into the
Inveon software for analysis.
Autoradiography
The distribution pattern of 64Cu-NOTA-AE105 in resected tumorswas determined by exposing tumor sections to phosphor imaging
screens for 24 h. The sections were interpreted using a phosphor im-
aging system (Cyclone Plus; Perkin Elmer) to form photostimulatedluminescence images of 64Cu-NOTA-AE105 microregional distribu-
tion. Tumor slides were subsequently frozen and stored at 280�C de-grees until immunohistochemical analysis.
Immunohistochemistry
Standard hematoxylin and eosin staining was performed together with
uPAR staining on freshly frozen slides. For uPAR staining, recombinanthuman uPAR antibody R2 was used as previously described (30,31).
uPAR immunostaining was performed as previously described (32),with minor modifications. Endogenous peroxidase activity was blocked
by incubation in a 1% (v/v) hydrogen peroxide–water solution for15 min. The primary rabbit polyclonal antibody against human uPAR
(33) was diluted in antibody diluent (S3022; Dako) and incubated over-night in Shandon racks (Thermo Fisher Scientific) at a concentration of
1.8 mg/mL. Subsequently, the primary antibodies were detected withEnVision reagent (Dako), with antirabbit IgG horseradish peroxidase–
conjugated polymers (K4003; Dako). The reactions were visualizedby incubating the sections with NovaRED (Vector Laboratories)
according to the manufacturer’s instructions and counterstaining withMayer hematoxylin.
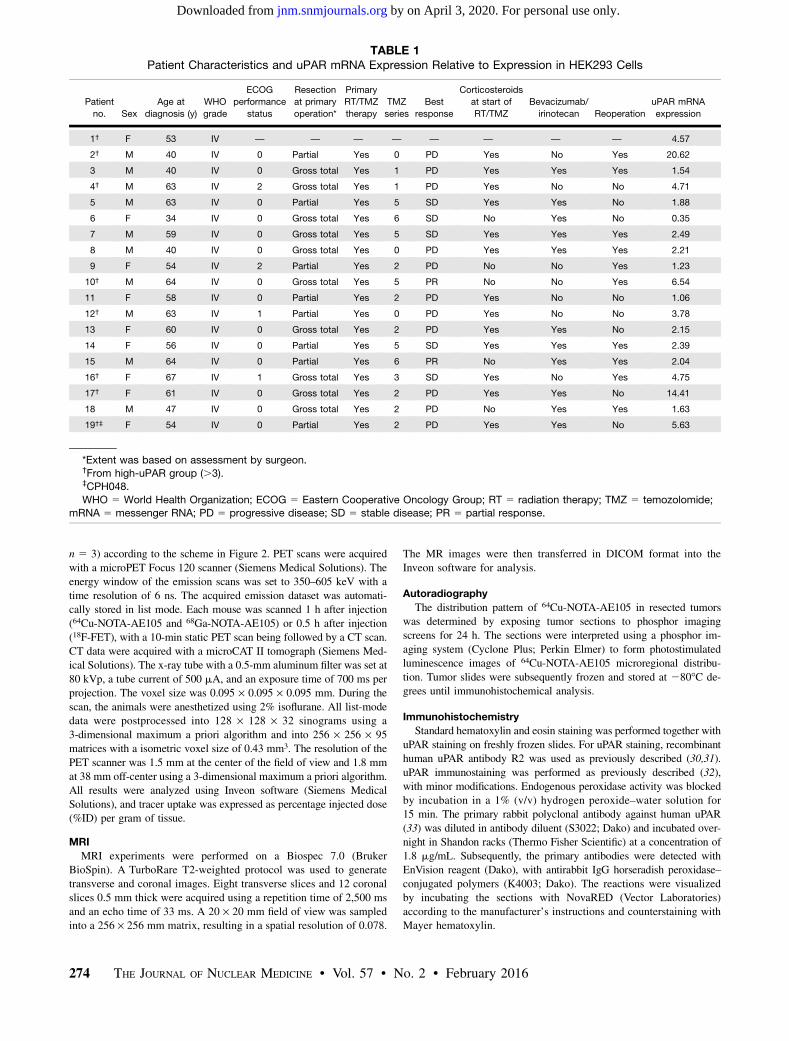
TABLE 1Patient Characteristics and uPAR mRNA Expression Relative to Expression in HEK293 Cells
Patient
no. Sex
Age at
diagnosis (y)
WHO
grade
ECOG
performance
status
Resection
at primary
operation*
Primary
RT/TMZ
therapy
TMZ
series
Best
response
Corticosteroids
at start of
RT/TMZ
Bevacizumab/
irinotecan Reoperation
uPAR mRNA
expression
1† F 53 IV — — — — — — — — 4.57
2† M 40 IV 0 Partial Yes 0 PD Yes No Yes 20.62
3 M 40 IV 0 Gross total Yes 1 PD Yes Yes Yes 1.54
4† M 63 IV 2 Gross total Yes 1 PD Yes No No 4.71
5 M 63 IV 0 Partial Yes 5 SD Yes Yes No 1.88
6 F 34 IV 0 Gross total Yes 6 SD No Yes No 0.35
7 M 59 IV 0 Gross total Yes 5 SD Yes Yes Yes 2.49
8 M 40 IV 0 Gross total Yes 0 PD Yes Yes Yes 2.21
9 F 54 IV 2 Partial Yes 2 PD No No Yes 1.23
10† M 64 IV 0 Gross total Yes 5 PR No No Yes 6.54
11 F 58 IV 0 Partial Yes 2 PD Yes No No 1.06
12† M 63 IV 1 Partial Yes 0 PD Yes No No 3.78
13 F 60 IV 0 Gross total Yes 2 PD Yes Yes No 2.15
14 F 56 IV 0 Partial Yes 5 SD Yes Yes Yes 2.39
15 M 64 IV 0 Partial Yes 6 PR No Yes Yes 2.04
16† F 67 IV 1 Gross total Yes 3 SD Yes No Yes 4.75
17† F 61 IV 0 Gross total Yes 2 PD Yes Yes No 14.41
18 M 47 IV 0 Gross total Yes 2 PD No Yes Yes 1.63
19†‡ F 54 IV 0 Partial Yes 2 PD Yes Yes No 5.63
*Extent was based on assessment by surgeon.†From high-uPAR group (.3).‡CPH048.
WHO 5 World Health Organization; ECOG 5 Eastern Cooperative Oncology Group; RT 5 radiation therapy; TMZ 5 temozolomide;mRNA 5 messenger RNA; PD 5 progressive disease; SD 5 stable disease; PR 5 partial response.
274 THE JOURNAL OF NUCLEAR MEDICINE • Vol. 57 • No. 2 • February 2016
by on April 3, 2020. For personal use only. jnm.snmjournals.org Downloaded from
Statistical Analysis
Statistical analyses were performed using Prism, version 6.0
(GraphPad Software, Inc.) for Mac OS X (Apple). Treatment groupswere compared using 1-way ANOVA. Data are presented as mean 6SEM if not stated otherwise. A P level of less than 0.05 was consid-ered statistically significant. Survival analysis was performed using
the Kaplan–Meier method and the log-rank test.
RESULTS
uPAR Gene Expression in Glioblastoma Patients
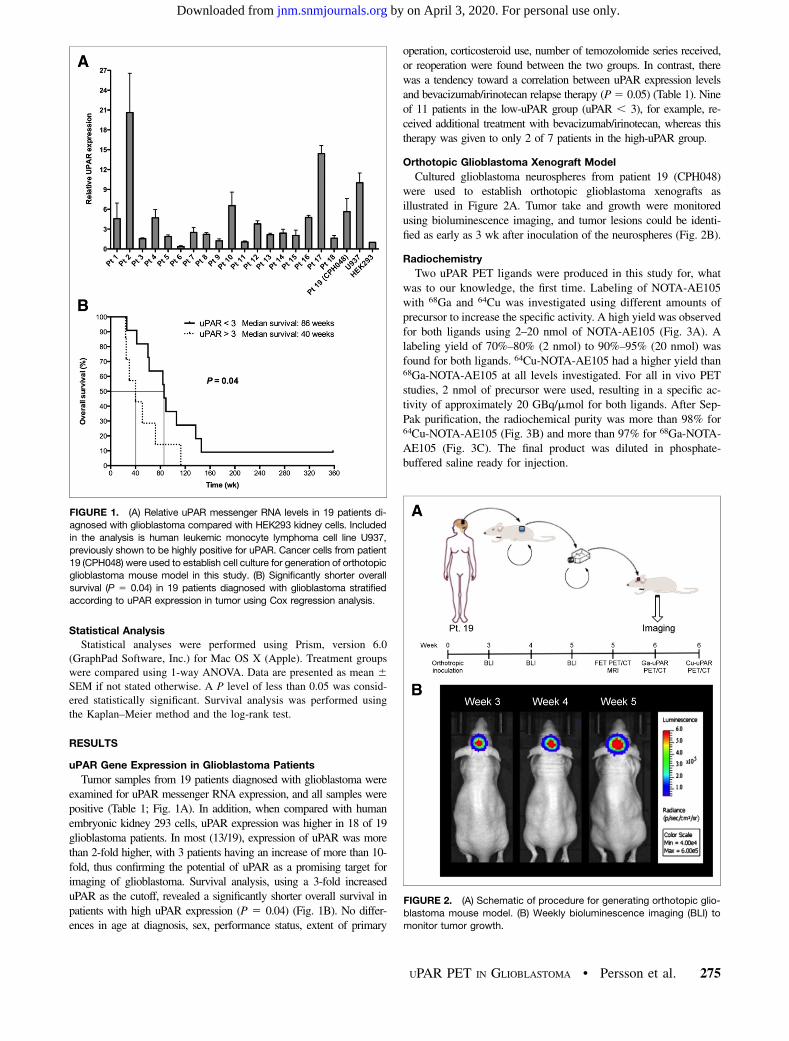
Tumor samples from 19 patients diagnosed with glioblastoma wereexamined for uPAR messenger RNA expression, and all samples werepositive (Table 1; Fig. 1A). In addition, when compared with humanembryonic kidney 293 cells, uPAR expression was higher in 18 of 19glioblastoma patients. In most (13/19), expression of uPAR was morethan 2-fold higher, with 3 patients having an increase of more than 10-fold, thus confirming the potential of uPAR as a promising target forimaging of glioblastoma. Survival analysis, using a 3-fold increaseduPAR as the cutoff, revealed a significantly shorter overall survival inpatients with high uPAR expression (P 5 0.04) (Fig. 1B). No differ-ences in age at diagnosis, sex, performance status, extent of primary
operation, corticosteroid use, number of temozolomide series received,or reoperation were found between the two groups. In contrast, therewas a tendency toward a correlation between uPAR expression levelsand bevacizumab/irinotecan relapse therapy (P5 0.05) (Table 1). Nineof 11 patients in the low-uPAR group (uPAR , 3), for example, re-ceived additional treatment with bevacizumab/irinotecan, whereas thistherapy was given to only 2 of 7 patients in the high-uPAR group.
Orthotopic Glioblastoma Xenograft Model
Cultured glioblastoma neurospheres from patient 19 (CPH048)were used to establish orthotopic glioblastoma xenografts asillustrated in Figure 2A. Tumor take and growth were monitoredusing bioluminescence imaging, and tumor lesions could be identi-fied as early as 3 wk after inoculation of the neurospheres (Fig. 2B).
Radiochemistry
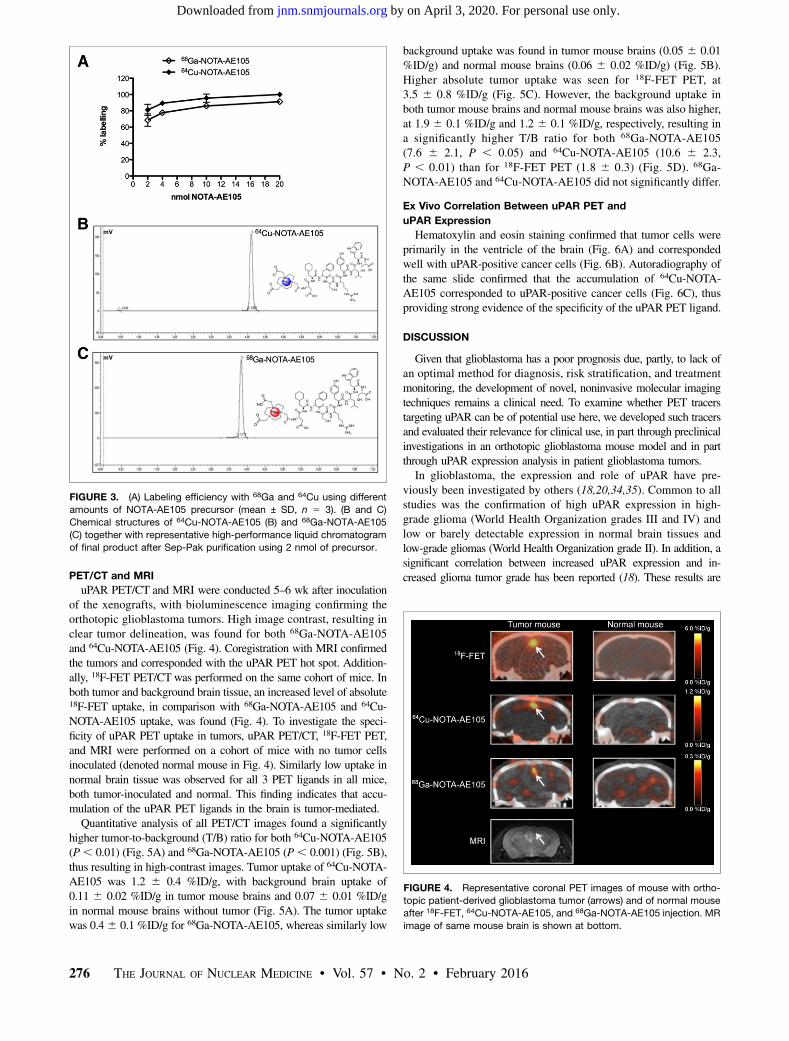
Two uPAR PET ligands were produced in this study for, whatwas to our knowledge, the first time. Labeling of NOTA-AE105with 68Ga and 64Cu was investigated using different amounts ofprecursor to increase the specific activity. A high yield was observedfor both ligands using 2–20 nmol of NOTA-AE105 (Fig. 3A). Alabeling yield of 70%–80% (2 nmol) to 90%–95% (20 nmol) wasfound for both ligands. 64Cu-NOTA-AE105 had a higher yield than68Ga-NOTA-AE105 at all levels investigated. For all in vivo PETstudies, 2 nmol of precursor were used, resulting in a specific ac-tivity of approximately 20 GBq/mmol for both ligands. After Sep-Pak purification, the radiochemical purity was more than 98% for64Cu-NOTA-AE105 (Fig. 3B) and more than 97% for 68Ga-NOTA-AE105 (Fig. 3C). The final product was diluted in phosphate-buffered saline ready for injection.
FIGURE 1. (A) Relative uPAR messenger RNA levels in 19 patients di-
agnosed with glioblastoma compared with HEK293 kidney cells. Included
in the analysis is human leukemic monocyte lymphoma cell line U937,
previously shown to be highly positive for uPAR. Cancer cells from patient
19 (CPH048) were used to establish cell culture for generation of orthotopic
glioblastoma mouse model in this study. (B) Significantly shorter overall
survival (P 5 0.04) in 19 patients diagnosed with glioblastoma stratified
according to uPAR expression in tumor using Cox regression analysis.
FIGURE 2. (A) Schematic of procedure for generating orthotopic glio-
blastoma mouse model. (B) Weekly bioluminescence imaging (BLI) to
monitor tumor growth.
UPAR PET IN GLIOBLASTOMA • Persson et al. 275
by on April 3, 2020. For personal use only. jnm.snmjournals.org Downloaded from
PET/CT and MRI
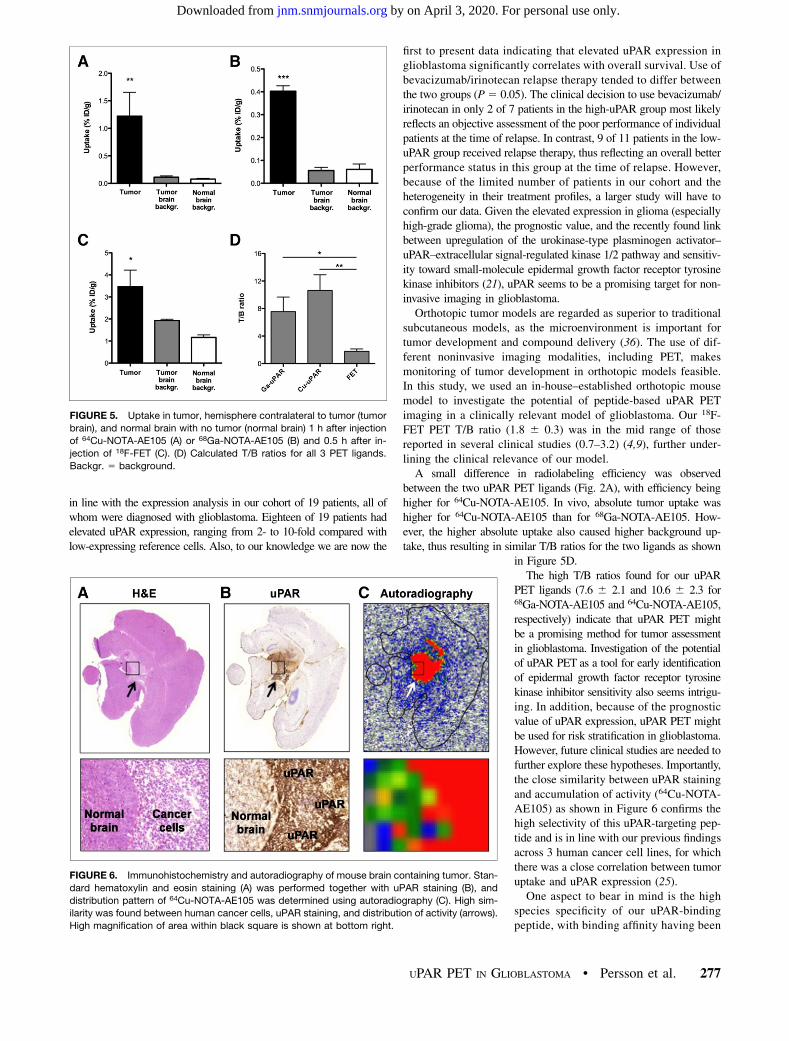
uPAR PET/CT and MRI were conducted 5–6 wk after inoculationof the xenografts, with bioluminescence imaging confirming theorthotopic glioblastoma tumors. High image contrast, resulting inclear tumor delineation, was found for both 68Ga-NOTA-AE105and 64Cu-NOTA-AE105 (Fig. 4). Coregistration with MRI confirmedthe tumors and corresponded with the uPAR PET hot spot. Addition-ally, 18F-FET PET/CTwas performed on the same cohort of mice. Inboth tumor and background brain tissue, an increased level of absolute18F-FET uptake, in comparison with 68Ga-NOTA-AE105 and 64Cu-NOTA-AE105 uptake, was found (Fig. 4). To investigate the speci-ficity of uPAR PET uptake in tumors, uPAR PET/CT, 18F-FET PET,and MRI were performed on a cohort of mice with no tumor cellsinoculated (denoted normal mouse in Fig. 4). Similarly low uptake innormal brain tissue was observed for all 3 PET ligands in all mice,both tumor-inoculated and normal. This finding indicates that accu-mulation of the uPAR PET ligands in the brain is tumor-mediated.Quantitative analysis of all PET/CT images found a significantly
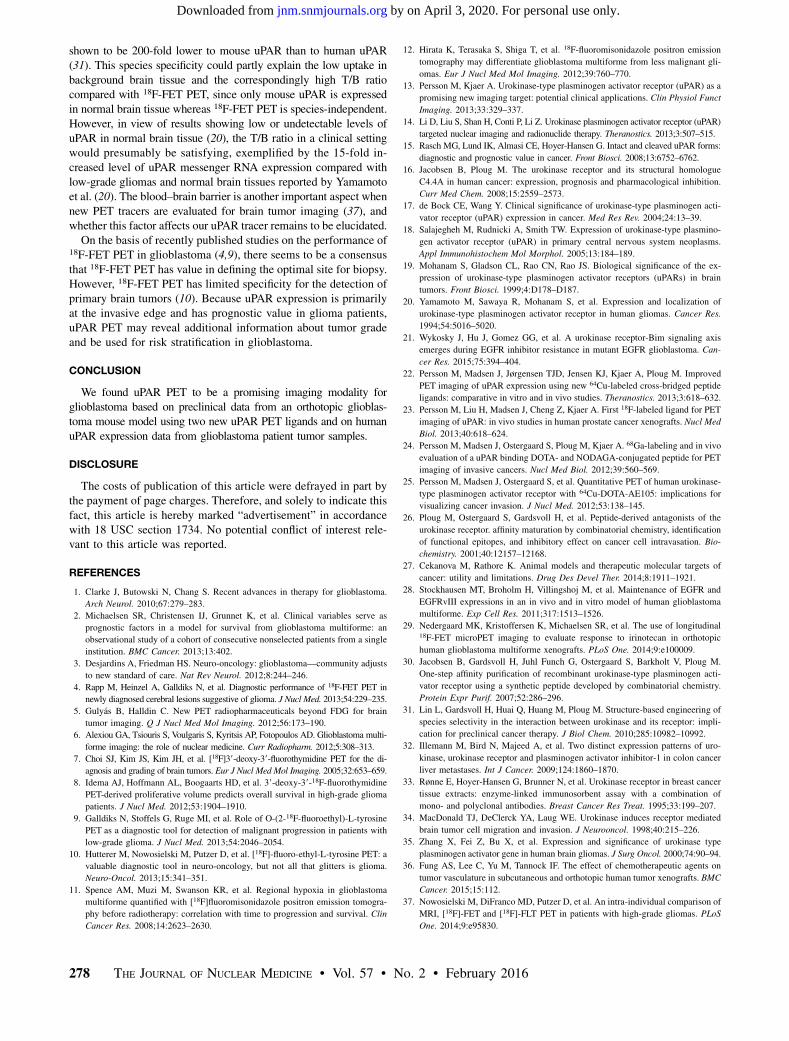
higher tumor-to-background (T/B) ratio for both 64Cu-NOTA-AE105(P, 0.01) (Fig. 5A) and 68Ga-NOTA-AE105 (P, 0.001) (Fig. 5B),thus resulting in high-contrast images. Tumor uptake of 64Cu-NOTA-AE105 was 1.2 6 0.4 %ID/g, with background brain uptake of0.11 6 0.02 %ID/g in tumor mouse brains and 0.07 6 0.01 %ID/gin normal mouse brains without tumor (Fig. 5A). The tumor uptakewas 0.46 0.1 %ID/g for 68Ga-NOTA-AE105, whereas similarly low
background uptake was found in tumor mouse brains (0.05 6 0.01%ID/g) and normal mouse brains (0.06 6 0.02 %ID/g) (Fig. 5B).Higher absolute tumor uptake was seen for 18F-FET PET, at3.5 6 0.8 %ID/g (Fig. 5C). However, the background uptake inboth tumor mouse brains and normal mouse brains was also higher,at 1.9 6 0.1 %ID/g and 1.2 6 0.1 %ID/g, respectively, resulting ina significantly higher T/B ratio for both 68Ga-NOTA-AE105(7.6 6 2.1, P , 0.05) and 64Cu-NOTA-AE105 (10.6 6 2.3,P , 0.01) than for 18F-FET PET (1.8 6 0.3) (Fig. 5D). 68Ga-NOTA-AE105 and 64Cu-NOTA-AE105 did not significantly differ.
Ex Vivo Correlation Between uPAR PET and
uPAR Expression
Hematoxylin and eosin staining confirmed that tumor cells wereprimarily in the ventricle of the brain (Fig. 6A) and correspondedwell with uPAR-positive cancer cells (Fig. 6B). Autoradiography ofthe same slide confirmed that the accumulation of 64Cu-NOTA-AE105 corresponded to uPAR-positive cancer cells (Fig. 6C), thusproviding strong evidence of the specificity of the uPAR PET ligand.
DISCUSSION
Given that glioblastoma has a poor prognosis due, partly, to lack ofan optimal method for diagnosis, risk stratification, and treatmentmonitoring, the development of novel, noninvasive molecular imagingtechniques remains a clinical need. To examine whether PET tracerstargeting uPAR can be of potential use here, we developed such tracersand evaluated their relevance for clinical use, in part through preclinicalinvestigations in an orthotopic glioblastoma mouse model and in partthrough uPAR expression analysis in patient glioblastoma tumors.In glioblastoma, the expression and role of uPAR have pre-
viously been investigated by others (18,20,34,35). Common to allstudies was the confirmation of high uPAR expression in high-grade glioma (World Health Organization grades III and IV) andlow or barely detectable expression in normal brain tissues andlow-grade gliomas (World Health Organization grade II). In addition, asignificant correlation between increased uPAR expression and in-creased glioma tumor grade has been reported (18). These results are
FIGURE 3. (A) Labeling efficiency with 68Ga and 64Cu using different
amounts of NOTA-AE105 precursor (mean ± SD, n 5 3). (B and C)
Chemical structures of 64Cu-NOTA-AE105 (B) and 68Ga-NOTA-AE105
(C) together with representative high-performance liquid chromatogram
of final product after Sep-Pak purification using 2 nmol of precursor.
FIGURE 4. Representative coronal PET images of mouse with ortho-
topic patient-derived glioblastoma tumor (arrows) and of normal mouse
after 18F-FET, 64Cu-NOTA-AE105, and 68Ga-NOTA-AE105 injection. MR
image of same mouse brain is shown at bottom.
276 THE JOURNAL OF NUCLEAR MEDICINE • Vol. 57 • No. 2 • February 2016
by on April 3, 2020. For personal use only. jnm.snmjournals.org Downloaded from
in line with the expression analysis in our cohort of 19 patients, all ofwhom were diagnosed with glioblastoma. Eighteen of 19 patients hadelevated uPAR expression, ranging from 2- to 10-fold compared withlow-expressing reference cells. Also, to our knowledge we are now the
first to present data indicating that elevated uPAR expression inglioblastoma significantly correlates with overall survival. Use ofbevacizumab/irinotecan relapse therapy tended to differ betweenthe two groups (P5 0.05). The clinical decision to use bevacizumab/irinotecan in only 2 of 7 patients in the high-uPAR group most likelyreflects an objective assessment of the poor performance of individualpatients at the time of relapse. In contrast, 9 of 11 patients in the low-uPAR group received relapse therapy, thus reflecting an overall betterperformance status in this group at the time of relapse. However,because of the limited number of patients in our cohort and theheterogeneity in their treatment profiles, a larger study will have toconfirm our data. Given the elevated expression in glioma (especiallyhigh-grade glioma), the prognostic value, and the recently found linkbetween upregulation of the urokinase-type plasminogen activator–uPAR–extracellular signal-regulated kinase 1/2 pathway and sensitiv-ity toward small-molecule epidermal growth factor receptor tyrosinekinase inhibitors (21), uPAR seems to be a promising target for non-invasive imaging in glioblastoma.Orthotopic tumor models are regarded as superior to traditional
subcutaneous models, as the microenvironment is important fortumor development and compound delivery (36). The use of dif-ferent noninvasive imaging modalities, including PET, makesmonitoring of tumor development in orthotopic models feasible.In this study, we used an in-house–established orthotopic mousemodel to investigate the potential of peptide-based uPAR PETimaging in a clinically relevant model of glioblastoma. Our 18F-FET PET T/B ratio (1.8 6 0.3) was in the mid range of thosereported in several clinical studies (0.7–3.2) (4,9), further under-lining the clinical relevance of our model.A small difference in radiolabeling efficiency was observed
between the two uPAR PET ligands (Fig. 2A), with efficiency beinghigher for 64Cu-NOTA-AE105. In vivo, absolute tumor uptake washigher for 64Cu-NOTA-AE105 than for 68Ga-NOTA-AE105. How-ever, the higher absolute uptake also caused higher background up-take, thus resulting in similar T/B ratios for the two ligands as shown
in Figure 5D.The high T/B ratios found for our uPAR
PET ligands (7.6 6 2.1 and 10.6 6 2.3 for68Ga-NOTA-AE105 and 64Cu-NOTA-AE105,respectively) indicate that uPAR PET mightbe a promising method for tumor assessmentin glioblastoma. Investigation of the potentialof uPAR PET as a tool for early identificationof epidermal growth factor receptor tyrosinekinase inhibitor sensitivity also seems intrigu-ing. In addition, because of the prognosticvalue of uPAR expression, uPAR PET mightbe used for risk stratification in glioblastoma.However, future clinical studies are needed tofurther explore these hypotheses. Importantly,the close similarity between uPAR stainingand accumulation of activity (64Cu-NOTA-AE105) as shown in Figure 6 confirms thehigh selectivity of this uPAR-targeting pep-tide and is in line with our previous findingsacross 3 human cancer cell lines, for whichthere was a close correlation between tumoruptake and uPAR expression (25).One aspect to bear in mind is the high
species specificity of our uPAR-bindingpeptide, with binding affinity having been
FIGURE 5. Uptake in tumor, hemisphere contralateral to tumor (tumor
brain), and normal brain with no tumor (normal brain) 1 h after injection
of 64Cu-NOTA-AE105 (A) or 68Ga-NOTA-AE105 (B) and 0.5 h after in-
jection of 18F-FET (C). (D) Calculated T/B ratios for all 3 PET ligands.
Backgr. 5 background.
FIGURE 6. Immunohistochemistry and autoradiography of mouse brain containing tumor. Stan-
dard hematoxylin and eosin staining (A) was performed together with uPAR staining (B), and
distribution pattern of 64Cu-NOTA-AE105 was determined using autoradiography (C). High sim-
ilarity was found between human cancer cells, uPAR staining, and distribution of activity (arrows).
High magnification of area within black square is shown at bottom right.
UPAR PET IN GLIOBLASTOMA • Persson et al. 277
by on April 3, 2020. For personal use only. jnm.snmjournals.org Downloaded from
shown to be 200-fold lower to mouse uPAR than to human uPAR(31). This species specificity could partly explain the low uptake inbackground brain tissue and the correspondingly high T/B ratiocompared with 18F-FET PET, since only mouse uPAR is expressedin normal brain tissue whereas 18F-FET PET is species-independent.However, in view of results showing low or undetectable levels ofuPAR in normal brain tissue (20), the T/B ratio in a clinical settingwould presumably be satisfying, exemplified by the 15-fold in-creased level of uPAR messenger RNA expression compared withlow-grade gliomas and normal brain tissues reported by Yamamotoet al. (20). The blood–brain barrier is another important aspect whennew PET tracers are evaluated for brain tumor imaging (37), andwhether this factor affects our uPAR tracer remains to be elucidated.On the basis of recently published studies on the performance of
18F-FET PET in glioblastoma (4,9), there seems to be a consensusthat 18F-FET PET has value in defining the optimal site for biopsy.However, 18F-FET PET has limited specificity for the detection ofprimary brain tumors (10). Because uPAR expression is primarilyat the invasive edge and has prognostic value in glioma patients,uPAR PET may reveal additional information about tumor gradeand be used for risk stratification in glioblastoma.
CONCLUSION
We found uPAR PET to be a promising imaging modality forglioblastoma based on preclinical data from an orthotopic glioblas-toma mouse model using two new uPAR PET ligands and on humanuPAR expression data from glioblastoma patient tumor samples.
DISCLOSURE
The costs of publication of this article were defrayed in part bythe payment of page charges. Therefore, and solely to indicate thisfact, this article is hereby marked “advertisement” in accordancewith 18 USC section 1734. No potential conflict of interest rele-vant to this article was reported.
REFERENCES
1. Clarke J, Butowski N, Chang S. Recent advances in therapy for glioblastoma.
Arch Neurol. 2010;67:279–283.
2. Michaelsen SR, Christensen IJ, Grunnet K, et al. Clinical variables serve as
prognostic factors in a model for survival from glioblastoma multiforme: an
observational study of a cohort of consecutive nonselected patients from a single
institution. BMC Cancer. 2013;13:402.
3. Desjardins A, Friedman HS. Neuro-oncology: glioblastoma—community adjusts
to new standard of care. Nat Rev Neurol. 2012;8:244–246.
4. Rapp M, Heinzel A, Galldiks N, et al. Diagnostic performance of 18F-FET PET in
newly diagnosed cerebral lesions suggestive of glioma. J Nucl Med. 2013;54:229–235.
5. Gulyás B, Halldin C. New PET radiopharmaceuticals beyond FDG for brain
tumor imaging. Q J Nucl Med Mol Imaging. 2012;56:173–190.
6. Alexiou GA, Tsiouris S, Voulgaris S, Kyritsis AP, Fotopoulos AD. Glioblastoma multi-
forme imaging: the role of nuclear medicine. Curr Radiopharm. 2012;5:308–313.
7. Choi SJ, Kim JS, Kim JH, et al. [18F]39-deoxy-39-fluorothymidine PET for the di-
agnosis and grading of brain tumors. Eur J Nucl Med Mol Imaging. 2005;32:653–659.
8. Idema AJ, Hoffmann AL, Boogaarts HD, et al. 39-deoxy-39-18F-fluorothymidine
PET-derived proliferative volume predicts overall survival in high-grade glioma
patients. J Nucl Med. 2012;53:1904–1910.
9. Galldiks N, Stoffels G, Ruge MI, et al. Role of O-(2-18F-fluoroethyl)-L-tyrosine
PET as a diagnostic tool for detection of malignant progression in patients with
low-grade glioma. J Nucl Med. 2013;54:2046–2054.
10. Hutterer M, Nowosielski M, Putzer D, et al. [18F]-fluoro-ethyl-L-tyrosine PET: a
valuable diagnostic tool in neuro-oncology, but not all that glitters is glioma.
Neuro-Oncol. 2013;15:341–351.
11. Spence AM, Muzi M, Swanson KR, et al. Regional hypoxia in glioblastoma
multiforme quantified with [18F]fluoromisonidazole positron emission tomogra-
phy before radiotherapy: correlation with time to progression and survival. Clin
Cancer Res. 2008;14:2623–2630.
12. Hirata K, Terasaka S, Shiga T, et al. 18F-fluoromisonidazole positron emission
tomography may differentiate glioblastoma multiforme from less malignant gli-
omas. Eur J Nucl Med Mol Imaging. 2012;39:760–770.
13. Persson M, Kjaer A. Urokinase-type plasminogen activator receptor (uPAR) as a
promising new imaging target: potential clinical applications. Clin Physiol Funct
Imaging. 2013;33:329–337.
14. Li D, Liu S, Shan H, Conti P, Li Z. Urokinase plasminogen activator receptor (uPAR)
targeted nuclear imaging and radionuclide therapy. Theranostics. 2013;3:507–515.
15. Rasch MG, Lund IK, Almasi CE, Hoyer-Hansen G. Intact and cleaved uPAR forms:
diagnostic and prognostic value in cancer. Front Biosci. 2008;13:6752–6762.
16. Jacobsen B, Ploug M. The urokinase receptor and its structural homologue
C4.4A in human cancer: expression, prognosis and pharmacological inhibition.
Curr Med Chem. 2008;15:2559–2573.
17. de Bock CE, Wang Y. Clinical significance of urokinase-type plasminogen acti-
vator receptor (uPAR) expression in cancer. Med Res Rev. 2004;24:13–39.
18. Salajegheh M, Rudnicki A, Smith TW. Expression of urokinase-type plasmino-
gen activator receptor (uPAR) in primary central nervous system neoplasms.
Appl Immunohistochem Mol Morphol. 2005;13:184–189.
19. Mohanam S, Gladson CL, Rao CN, Rao JS. Biological significance of the ex-
pression of urokinase-type plasminogen activator receptors (uPARs) in brain
tumors. Front Biosci. 1999;4:D178–D187.
20. Yamamoto M, Sawaya R, Mohanam S, et al. Expression and localization of
urokinase-type plasminogen activator receptor in human gliomas. Cancer Res.
1994;54:5016–5020.
21. Wykosky J, Hu J, Gomez GG, et al. A urokinase receptor-Bim signaling axis
emerges during EGFR inhibitor resistance in mutant EGFR glioblastoma. Can-
cer Res. 2015;75:394–404.
22. Persson M, Madsen J, Jørgensen TJD, Jensen KJ, Kjaer A, Ploug M. Improved
PET imaging of uPAR expression using new 64Cu-labeled cross-bridged peptide
ligands: comparative in vitro and in vivo studies. Theranostics. 2013;3:618–632.
23. Persson M, Liu H, Madsen J, Cheng Z, Kjaer A. First 18F-labeled ligand for PET
imaging of uPAR: in vivo studies in human prostate cancer xenografts. Nucl Med
Biol. 2013;40:618–624.
24. Persson M, Madsen J, Ostergaard S, Ploug M, Kjaer A. 68Ga-labeling and in vivo
evaluation of a uPAR binding DOTA- and NODAGA-conjugated peptide for PET
imaging of invasive cancers. Nucl Med Biol. 2012;39:560–569.
25. Persson M, Madsen J, Ostergaard S, et al. Quantitative PET of human urokinase-
type plasminogen activator receptor with 64Cu-DOTA-AE105: implications for
visualizing cancer invasion. J Nucl Med. 2012;53:138–145.
26. Ploug M, Ostergaard S, Gardsvoll H, et al. Peptide-derived antagonists of the
urokinase receptor. affinity maturation by combinatorial chemistry, identification
of functional epitopes, and inhibitory effect on cancer cell intravasation. Bio-
chemistry. 2001;40:12157–12168.
27. Cekanova M, Rathore K. Animal models and therapeutic molecular targets of
cancer: utility and limitations. Drug Des Devel Ther. 2014;8:1911–1921.
28. Stockhausen MT, Broholm H, Villingshoj M, et al. Maintenance of EGFR and
EGFRvIII expressions in an in vivo and in vitro model of human glioblastoma
multiforme. Exp Cell Res. 2011;317:1513–1526.
29. Nedergaard MK, Kristoffersen K, Michaelsen SR, et al. The use of longitudinal18F-FET microPET imaging to evaluate response to irinotecan in orthotopic
human glioblastoma multiforme xenografts. PLoS One. 2014;9:e100009.
30. Jacobsen B, Gardsvoll H, Juhl Funch G, Ostergaard S, Barkholt V, Ploug M.
One-step affinity purification of recombinant urokinase-type plasminogen acti-
vator receptor using a synthetic peptide developed by combinatorial chemistry.
Protein Expr Purif. 2007;52:286–296.
31. Lin L, Gardsvoll H, Huai Q, Huang M, Ploug M. Structure-based engineering of
species selectivity in the interaction between urokinase and its receptor: impli-
cation for preclinical cancer therapy. J Biol Chem. 2010;285:10982–10992.
32. Illemann M, Bird N, Majeed A, et al. Two distinct expression patterns of uro-
kinase, urokinase receptor and plasminogen activator inhibitor-1 in colon cancer
liver metastases. Int J Cancer. 2009;124:1860–1870.
33. Rønne E, Hoyer-Hansen G, Brunner N, et al. Urokinase receptor in breast cancer
tissue extracts: enzyme-linked immunosorbent assay with a combination of
mono- and polyclonal antibodies. Breast Cancer Res Treat. 1995;33:199–207.
34. MacDonald TJ, DeClerck YA, Laug WE. Urokinase induces receptor mediated
brain tumor cell migration and invasion. J Neurooncol. 1998;40:215–226.
35. Zhang X, Fei Z, Bu X, et al. Expression and significance of urokinase type
plasminogen activator gene in human brain gliomas. J Surg Oncol. 2000;74:90–94.
36. Fung AS, Lee C, Yu M, Tannock IF. The effect of chemotherapeutic agents on
tumor vasculature in subcutaneous and orthotopic human tumor xenografts. BMC
Cancer. 2015;15:112.
37. Nowosielski M, DiFranco MD, Putzer D, et al. An intra-individual comparison of
MRI, [18F]-FET and [18F]-FLT PET in patients with high-grade gliomas. PLoS
One. 2014;9:e95830.
278 THE JOURNAL OF NUCLEAR MEDICINE • Vol. 57 • No. 2 • February 2016
by on April 3, 2020. For personal use only. jnm.snmjournals.org Downloaded from
Doi: 10.2967/jnumed.115.161703Published online: October 1, 2015.
2016;57:272-278.J Nucl Med. Michaelsen, Jacob Madsen, Ulrik Lassen, Hans S. Poulsen and Andreas KjaerMorten Persson, Mette K. Nedergaard, Malene Brandt-Larsen, Dorthe Skovgaard, Jesper T. Jørgensen, Signe R. GlioblastomaUrokinase-Type Plasminogen Activator Receptor as a Potential PET Biomarker in
http://jnm.snmjournals.org/content/57/2/272This article and updated information are available at:
http://jnm.snmjournals.org/site/subscriptions/online.xhtml
Information about subscriptions to JNM can be found at:
http://jnm.snmjournals.org/site/misc/permission.xhtmlInformation about reproducing figures, tables, or other portions of this article can be found online at:
(Print ISSN: 0161-5505, Online ISSN: 2159-662X)1850 Samuel Morse Drive, Reston, VA 20190.SNMMI | Society of Nuclear Medicine and Molecular Imaging
is published monthly.The Journal of Nuclear Medicine
© Copyright 2016 SNMMI; all rights reserved.
by on April 3, 2020. For personal use only. jnm.snmjournals.org Downloaded from