Embed Size (px)
Citation preview

U.S. Geological SurveyU.S. Department of Interior
GFSAD30mGlobal Cropland Extent Products of Australia
@ Nominal 250 m (GCE V2.0) Updates
Pardhasaradhi Teluguntla and Prasad Thenkabail 23rd April, 2015

GFSAD 250m Cropland Products of Australia Automated Cropland Classification Algorithm (ACCA)
U.S. Geological SurveyU.S. Department of Interior
Based on Ideal spectral signatures, developed
Automated Cropland Classification Algorithm (ACCA) for
each of 3 cropland masks of Australia.
Validated ACCA-2014 results with SMT-2014 results
Applied ACCA year to year (2000-2014) to study
cropland change dynamics over 15 years

U.S. Geological SurveyU.S. Department of Interior
Spatial distribution of ACCA derived cropland classes (2000-2014)
2000 2001 2002 2003
2004 2005 2006 2007
2008 2009 2010 2011
2012 2013 2014

U.S. Geological SurveyU.S. Department of Interior
Class Descroption ACCA 2000 ACCA 2001 ACCA 2002 ACCA 2003 ACCA 2004 ACCA 2005 ACCA 2006 ACCA 2007
51. Croplands, rainfed, SC (season 1 &2), all crops 5299438 7317760 6224697 6875429 8443973 7839962 6930667 8148737
52.Croplands, rainfed,SC, pastures 7506118 4779177 4369448 5337641 3636094 4359678 4496031 4279454
53.Croplands, irrigated, SC, DC (Season1 &2), all crops 102997 132529 122402 141951 172180 158241 103017 143174
54.Croplands, irrigated, SC, pastures 141009 97542 66245 134108 74412 50195 112555 114428
55.Croplands, irrigated, continuous, orchards 284725 286687 321873 241321 259942 284158 281726 254016
56.Croplands, fal low 316671 1037263 2546293 920508 1064357 958724 1726962 711149
Total : 13650958 13650958 13650958 13650958 13650958 13650958 13650958 13650958
Class Descroption ACCA 2008 ACCA 2009 ACCA 2010 ACCA 2011 ACCA 2012 ACCA 2013 ACCA 2014 SMST-2014
51. Croplands, rainfed, SC (season 1 &2), all crops 7691496 8620308 6423614 5281920 6019305 7815729 6170793 6205071
52.Croplands, rainfed,SC, pastures 3896413 3834230 6209384 7161684 6530920 4760708 6400516 6363457
53.Croplands, irrigated, SC, DC (Season1 &2), all crops 145324 179642 164834 123428 121319 186810 95748 105109
54.Croplands, irrigated, SC, pastures 61599 76400 115619 78337 127858 90220 191920 189325
55.Croplands, irrigated, continuous, orchards 274553 242662 244869 328013 282795 242953 243680 237235
56.Croplands, fal low 1581573 697716 492638 677576 568761 554538 548301 550761
Total : 13650958 13650958 13650958 13650958 13650958 13650958 13650958 13650958
Class distribution of ACCA derived classes (2000-2014)
U.S. Geological SurveyU.S. Department of Interior
Comparison of areas of ACCA derived classes with Rainfall and FAO statistics (2000-2014) Changes in cropland fallow areas during drought and good years

U.S. Geological SurveyU.S. Department of Interior
Comparison of areas of ACCA derived classes with Rainfall and FAO statistics (2000-2014) Trend of (croplands + pastures)
U.S. Geological SurveyU.S. Department of Interior
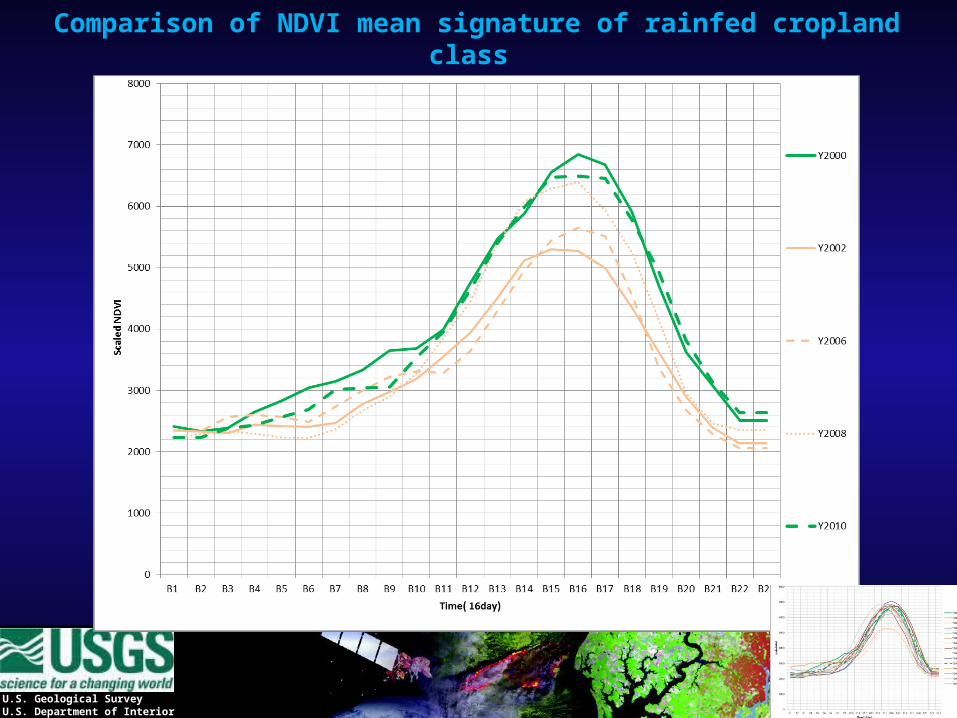
Comparison of NDVI mean signature of rainfed cropland class during drought and good years

U.S. Geological SurveyU.S. Department of Interior
Work in Progress:
Cropland change dynamics (2000-2014)
Sub pixel area calculations
Accuracy assessment with Other available sources

U.S. Geological SurveyU.S. Department of Interior
Thank you