Embed Size (px)
Citation preview

Using RCM and Scorecards to Drive Enrollment Management
Ron Nowaczyk Paul Bylaska
AACRAO – Fall 2012

Overview
1. Context 2. Outline of the Process 3. Example Scorecard 4. The Outcomes 5. Some Concluding ObservaPons

Clarion University
• Public InsPtuPon in Rural Western PA – Part of the PA State System of Higher EducaPon – Student PopulaPon of 7000 students – Four Colleges – Historic Mission was Teacher Ed.
• New President in 2010 & New Provost in 2011 • Declining State Support – Upcoming Year = 24%

Clarion University
• Adopted Responsibility-‐Centered Management in 2011-‐12
• Budget Cuts could no longer be across the board.
• Heavily unionized campus

Outline of the Process – Fall 2011
• Future budget cuts from state likely • RCM in its first semester of implementaPon • President states need to evaluate all programs – Academic
• Degree programs (not minors or cerPficates)
– Infrastructure • Dickeson (2010) model used to guide process • Data support team formed
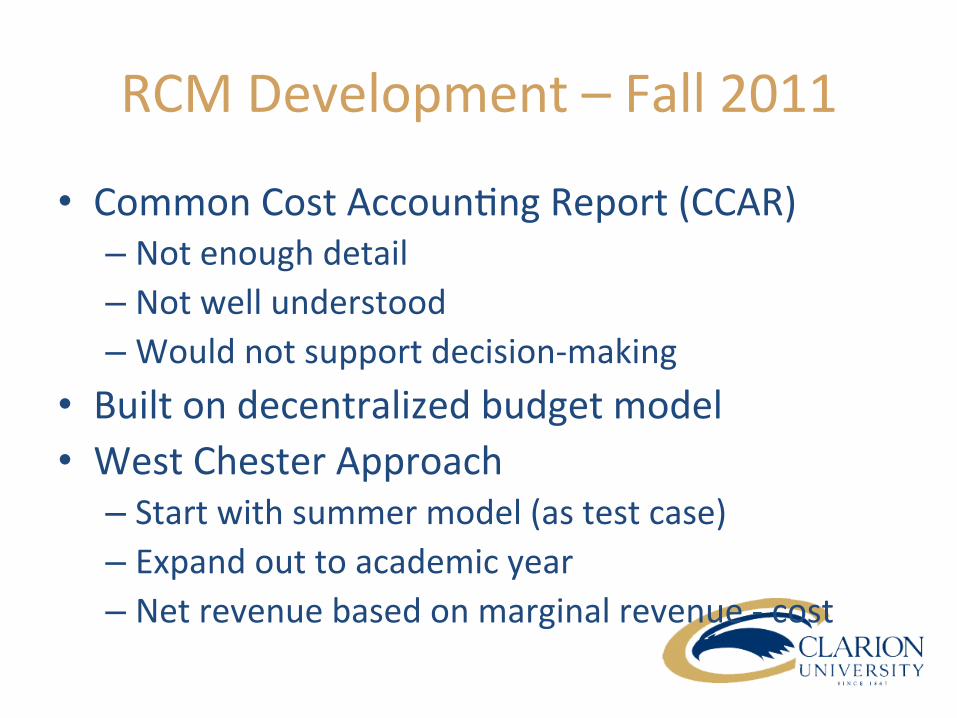
RCM Development – Fall 2011
• Common Cost AccounPng Report (CCAR) – Not enough detail – Not well understood – Would not support decision-‐making
• Built on decentralized budget model • West Chester Approach – Start with summer model (as test case) – Expand out to academic year – Net revenue based on marginal revenue -‐ cost

RCM Development – Fall 2011
• Kutztown Approach – Calculated Average cost / student-‐credit-‐hour – PosiPve or negaPve variance from average – Credits and cost at individual faculty level – Very data intensive – Could we support this? (Not with our staff)

Kutztown Course Analysis

Kutztown Faculty Assessment

Clarion RCM – Fall 2011
• BRIC (Budget Review & ImplementaPon) – RepresenPng cross-‐secPon of university – Advisory to RC Managers Group – Produced RC Manual for iniPal guidance
• In pracPce some recommendaPons were too complex/Pme consuming to implement
• Infrastructure assessment – average cost

IniPal Clarion RC Model

Outline of the Scorecard Process Spring 2012
• Academic Program Scorecards Evolve – Possible Academic Variables Shared with Faculty
• Admissions Data • # of Majors • RetenPon and GraduaPon Data
– Financial Data by Academic Department – “Employment” Data Collected

The Scorecard Process – Spring 2012
• Several versions of data scorecard are circulated in mid-‐semester.
• Based on feedback, the final scorecard evolves.
• By end of April, academic scorecards are distributed to faculty and posted on university intranet.
• Scorecard Review Taskforces are formed.

Example Scorecard -‐ Academic Program
Recruitment Enrollment Strength
Student Demand-‐Internal Preparedness
Persistence (10F to 11F
Rate) Majors Program ComplePon
HS GPA
SAT Comb.
Within Major At Univ.
F11 Enroll
F05 Enroll
Within Major At University
Academic Plan DescripPon Applied
Accpt
Matric w/in Major
Matric at
University
Yield RaPo
First Enrolled Sum11/F11
Bachelor 4 yrs/
Master&Associate 2 years
Bachelor 6 yrs/
Master&Associate 4 years
Completed by Dec 2011
Bachelor 4 yrs/Master&Associate 2 years
Bachelor 6 yrs/Master&Associate 4 years
Completed by Dec 2011
BA XXXX XXXX BA 42 32 10 1 31% 7 3.23 1021 82% 82% 67 57 56% 63% 68% 60% 72% 79%
BS LS Liberal Studies BS 49 41 16 2 39% 7 2.62 850 50% 60% 137 127 54% 61% 62% 59% 71% 72%
BS LS EDU Liberal Studies: EducaPon BS 7 6 0 1 0% 4 7 86% 86% 86% 100% 100% 100%
BS LS ELS Liberal Studies: Ed/Lib Sci BS 31 23 3 10 13% 9
MN ANC MED
Minor Ancient Mediterranean 2 4 25% 25% 25% 50% 50% 50%
MN HBS Minor XXXX: Black Studies 2 0 3 33% 33% 33% 33% 67% 67%
MN XXXX Minor XXXX 1 1 100% 100% 33 45 60% 62% 62% 73% 76% 76%

Example Scorecard -‐ Financial
Financial FY12 Total Fall 2011 & Spring
2012 Winter 2011 Summer 2011 Calcula9on or Source
(A) Total Dept Direct Costs: $ 827,538 $ 772,963 $ 22,920 $ 31,655
Dept SAP Fund Center figures (personnel and operaPng) actuals as of 4-‐9-‐12, plus projecPon through end of fiscal year. Summer & winter marginal costs only
(B) Other InstrucPonal Costs: $ 42,581 $ 42,581 $ -‐ $ -‐ College costs not part of dept budgets (distributed by credit producPon)
(C)Total Undergraduate Crs 6,255 5,904 162 189 Revenue CalculaPon Spreadsheets
(D) Total Graduate Crs 6 -‐ 3 3 Revenue CalculaPon Spreadsheets
(E) Course Rev-‐-‐including tuiPon, ISF and approp $ 2,234,529 $ 2,093,461 $ 65,447 $ 75,621 Revenue CalculaPon Spreadsheets
(F) Indirect Costs-‐-‐50.5% of Course Rev $ 1,128,437 $ 1,057,198 $ 33,051 $ 38,189 F = E * 50.5%
(G) Net Profit or Loss $ 235,973 $ 220,719 $ 9,477 $ 5,778 G = E -‐ A -‐ B -‐ F
(H) Student FTE -‐ Undergrad 197 H = C/30
(I) Student FTE -‐ Grad -‐ I = D/24
(J) Total Dept Direct Cost/FTE $ 3,928 J = A/(H+I)

Example Scorecard – OccupaPonal
PA CIP-‐SOC Crosswalk (added from Na$onal Crosswalk in italics) HPO
PA Regional Wage & Employm
ent PA Wage & Employment
Na9onal Employment
CIP Code CIP Title SOC Code SOC Title
Educ Level
PA 2011
Pirsburgh MSA Median Wage 2011
Pirsburgh MSA Total Annual Openings
Pirsburgh MSA
% Change Employme
nt 2008-‐2018
Far Western Nonmetro Area Median Wage 2011
PA Median Annual Wage 2011
Avg Annual Opening
s
% Change Employment
2008-‐2018
NaPonal Median Wage 2011
% Change Employment
2010-‐2020
XX.0101 XXXX BA (BA HIST)
XX.0101 XXXX, General. 11-‐9199 Managers, All Other 96,820 62 1.37
71,160 99,060 368 3.8 99,540 7.9
XX.0101 XXXX, General 19-‐3093 XXXians MD 0 0 46,110 7 5.26 52,370 17.9
XX.0101 XXXX, General. 25-‐1125 XXXX Teachers, Postsecondary 82,450 6 10
87,860 75,150 45 15.56 65,860
XX.0101 XXXX, General. 25-‐2031
Secondary School Teachers, Except Special and Career/Technical EducaIon
56,090 192 -‐2.01
55,320 56,660 1443 -‐4.54 54,270 6.9
XX.0101 XXXX, General 25-‐4011 Archivists MD 32,130 2 0 37,450 17 5.71 46,750 11.7
24.0101 Liberal Studies BS (BS LS), Liberal Studies: EducaPon BS (BS LS EDU), Liberal Studies: Ed/Lib Sci BS (BS LS ELS)
24.0101
Liberal Arts & Sciences/Liberal Studies 25-‐1199 Postsecondary Teachers, All Other PhD
103,790 9 12.9 65,220 108 15.71 64,310

Program Review Taskforce
• ComposiPon – Collegiate Deans – Faculty RepresentaPon – Staff RepresentaPon – Dean of Libraries
• Charge – Act like University “Trustees” – IdenPfy CriPcal Criteria – Sort Programs into QuinPles

Outcomes • Taskforce DeliberaPons – Reduced set of Academic Criteria
• QuinPle Rankings Released in early June • Summer Progress – Mandatory Review of 4th and 5th QuinPle Programs
– Voluntary Review of 1st to 3rd QuinPle Programs • Performance Targets & Plans required by fall 2012
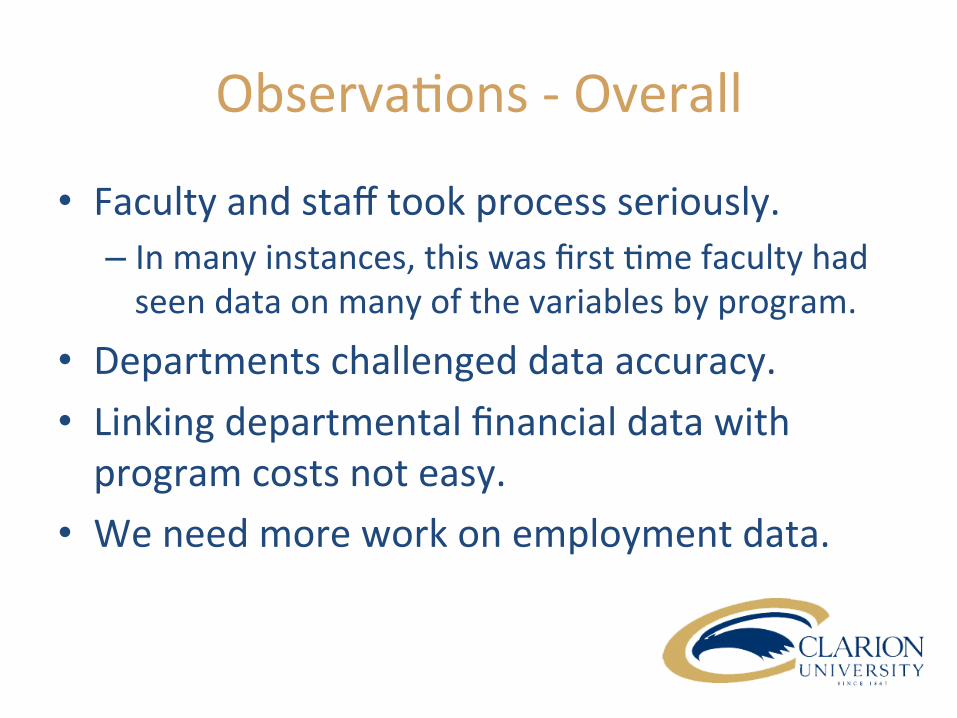
ObservaPons -‐ Overall
• Faculty and staff took process seriously. – In many instances, this was first Pme faculty had seen data on many of the variables by program.
• Departments challenged data accuracy. • Linking departmental financial data with program costs not easy.
• We need more work on employment data.

ObservaPons Enrollment Management
• Recruitment: – Faculty understanding of “accepted, deposited, yield and matriculated.”
– Request to get data earlier from admissions and be more acPvely involved in recruitment
• Persistence: – Immediate arenPon on first-‐year factors:
• Student preparedness • Financial concerns

ObservaPons Enrollment Management
• GraduaPon – Change in major fata – Progress toward degree and years to graduate – RC (budgetary) implicaPons

Moving Forward • The process will be refined and repeated. – ConsideraPon of data variables.
• We need to move the summer acPviPes into the spring semester for greater faculty involvement and acceptance.
• Faculty need to see changes and trends. • Process to be used for – program improvement – resource reallocaPon.