Embed Size (px)
Citation preview

E n g i n E E r i n gVol. 02 / Issue. 01 / 2013
EdgE
How To Guide... Your complete guide to XML functionality in FloTHERM® & FloVENT® Page 22
Microgravity Cow Bones: The 'FreqBone' bioreactor project Page 16
A Tablet for Everything:FloTHERM XT� FloTHERM® & T3Ster® Cure Thermal Headaches Page 10
mentor.com/mechanical
Accelerate Innovation with CFD & Thermal Characterization
DENSO Corporation: The art of automotive thermal design Page 19

mentor.com/mechanical 3
PerspectiveVol. 02, Issue. 01
Milestones matter in life: whether it is family related, work related, societal or personal. Milestones are, I believe, markers of achievement and also targets for the future. I was reminded of this recently when I celebrated a friend's 50th birthday. Indeed, the older I get the more I am concurring with the received wisdom of our day that "50 is the new 40, and 60 is the new 50"!
In this edition of Engineering Edge, the Mechanical Analysis Division of Mentor Graphics has hit a very significant milestone in our history with the release of FloTHERM XT�. We have devoted several pages to this product which I believe is a seminal advance in electronics cooling simulation. Our Product Manager, Ian Clark, goes into more detail as to what it is and what it does on page 7. In addition, one of our Beta Testers during our comprehensive beta test phase, Electronics Cooling Solutions Inc., in California (page 10) show how they have been using FloTHERM XT (and our T3Ster® thermal characterization hardware) to analyze off-the-shelf tablet computers which are becoming more and more powerful and in turn producing more heat.
FloTHERM XT is the culmination of the coupling of two of our world leading technologies; FloTHERM®, our market leading electronics cooling software, and FloEFD®, the market leading product for CAD-embedded CFD. XT extends the capabilities of our FloTHERM product line yet retains its DNA – ease of use, design focused, and SmartPart driven – while being EDA (Electronic Design Automation) and CAD-centric in its focus. FloTHERM XT has been several years in development and is, I think, a game-changer in thermal analysis of electronics for both mechanical and electronics engineers as it fits into their workflows. We have sought to couple our electronics cooling pedigree with Mentor's EDA heritage and the ability to measure exact characteristics of electronics components and systems with our T3Ster hardware product line to produce a unique offering for the market. I commend it to you and encourage you to contact your usual sales channels for a test drive.
This edition of Engineering Edge also has a breadth of customer success stories ranging from micro environment effects on brittle bones in space (page 16), to power station cooling towers (page 38), and aero-thermal deformation analysis in turbines (page 32). I encourage you to read these fascinating stories and see the breadth of applications our customers are covering. Finally, I would like to extend Mentor's congratulations to Shelley Rudman from the UK who became the Women's World Champion for Bob Skeleton for the first time in February of this year and her backing team, Bromley Technologies Ltd., who designed her sled. It was designed in part using our FloEFD aerodynamic flow simulation software. She will be fixing her gaze no doubt on the podium for the Sochi Winter Olympics next year in Russia. (page 36).
Dr. Erich Buergel, General Manager, Mechanical Analysis Division, Mentor Graphics
Mentor Graphics CorporationPury Hill Business Park,
The Maltings,Towcester, NN12 7TB,
United KingdomTel: +44 (0)1327 306000email: [email protected]
Editor:Keith Hanna
Managing Editor:Natasha Antunes
Copy Editor:Jane Wade
Contributors: Robin Bornoff, Ian Clark, Paul Dyer, Keith Hanna,
Alexey Kharitonovich, Andrey Ivanov, Doug Kolak, Andy Manning, Boris Marovic, John Murray, Andras
Poppe, Joe Proulx, John Parry, Svetlana Shtilkind, Jane Wade, Richard Wilton
With special thanks to:Avio Group
Bromley TechnologiesCEDCS
DENSO CorporationGrass Valley Netherlands BV
E-Cooling GmbHElectronic Cooling Solutions Inc.
EnginSoft sPAPIDOTECH Inc.
PUC MinasVoxdale BVBA
©2013 Mentor Graphics Corporation, all rights reserved. This document contains
information that is proprietary to Mentor Graphics Corporation and may be duplicated in whole or in part by the original recipient for internal business
purposes only, provided that this entire notice appears in all copies. In accepting this document,
the recipient agrees to make every reasonable effort to prevent unauthorized use of this
information. All trademarks mentioned in this publication are
the trademarks of their respective owners.

4 mentor.com/mechanical
38
News5 Mentor Graphics
Company News, New Products, Product Updates
7 Introducing FloTHERM®XT From concept through to verification for
electronic cooling simulation
Regular Features41 Interview An interview with the Harvey Rosten Award winner 2013
45 Ask the CSD Expert Our customer support team answer your
questions.
46 Geek Hub The Beer Fridge
50 Brownian Motion The random musings of a Fluid Dynamicist
10
Technology & Knowledge Bank22 How To Guide: Your complete guide to XML functionality in
FloTHERM® & FloVENT®
24 Improving 1D Data with 3D CFD Improving 1D thermo-fluid system
automotive engine data with 3D CFD
34 Experimentation & Simulation: A Winning Combination
Flowmaster allows users to modify and adapt code
16
Contents
38 Understanding Plume Dispersion Predicting the external aerodynamics of
cooling towers using CFD
42 Hot Lumens of Street Lighting LEDs How physical testing and CFD analysis
helped develop new LED-based street lighting luminaries
Engineering Edge10 A Tablet for Everything FloTHERM XT, FloTHERM, TeSter cure
thermal headaches in tablet computers
16 Voxdale BVBA Design an experimental capsule environment to assess the effects of bone density in space
19 DENSO Corporation The art of automotive thermal design
26 How Small Can You Go? PIDOTECH optimize the design of compact heatsinks in radio access stations for mobile communications
28 Megawatt Engines need Mega Cooling How do you cool a 20 megawatt electic
engine? E-Cooling Inc. tell us how
30 Lights, Camera, Action! Grass Valley video camera modeling using
FloEFD�
32 Multi-Physics Takes off with Avio
Avio's multi-physics co-simulation approach for reducing fuel consumption in Aero Engines
36 The Bromley Family Business
What it takes to be a world champion
48 Robust Design for All Eventualities
Stuart Ord of CEDCS shares some of his 30yr experience in chemical plant safety

mentor.com/mechanical 5
News
Dr. Andras Poppe, product marketing manager with Mentor Graphics MicReD® (Microelectronics Research and Development) group and faculty member at the Budapest University of Technology, Department of Electron Devices, has received the 2013 Harvey Rosten Award for Excellence in the Physical Design of Electronics. Dr. Poppe received the award for his paper, "A Step Forward in Multi-domain Modeling of Power LEDs," at the 29th annual IEEE Thermal Measurement, Modeling and Management Symposium (Semi-Therm). "We recognize Andras Poppe for his contributions to our industry since he is a noted expert in thermal simulation and test methodologies, particularly in the LED sector" stated Dr Clemens Lasance, Harvey Rosten Award committee member. Read our interview with Andras on page 41.
Andras Poppe wins prestigious Harvey Rosten Award
"Dr. Poppe's research and active involvement with key industry standards bodies, such as JEDEC and CIE, have had a major impact on our industry so we are proud to honor him today." Dr. Clemens Lasance, former principal scientist with Phillips Research and Harvey Rosten Award committee member
Mentor Graphics closed its Financial Year on January 31st 2013 with its best ever year-end. Reporting $1.15Bn in revenues and a healthy 9% CAGR over the last five years with the Mechanical Analysis Division seeing above industry average growth rates too. Q4 FY 2013 also marked the 16th consecutive quarter of exceeding non-GAAP EPS guidance for Mentor Graphics on the NASDAQ.
Mentor graphics Corporation has its Best Revenue Year Ever
"The fourth quarter was our sixteenth quarter in a row of exceeding non-GAAP earnings guidance. It capped a year in which Mentor Graphics achieved all-time records in revenue, operating margin and non-GAAP earnings per share." Walden C. Rhines, chairman and CEO of Mentor Graphics

6 mentor.com/mechanical
Mentor graphics celebrates its first ever World ChampionThe CAD-embedded 3D CFD software package FloEFD for Creo helped improve the aerodynamics of British Bob Skeleton 2013 Wold Champion, Shelley Rudman's new sled. Bromley Technologies Limited in Sheffield, England, designed and developed the skeleton design with Mentor's software leading to Rudman winning her first ever Skeleton Bobsleigh World Championship in St. Moritz, Switzerland on February 1st 2013. Read more on Bromley Technologies on page 36.
Flowmaster® V7.9.1 New ReleaseFrom concept through design, optimization, and validation, the Flowmaster products are used at every stage of development enabling engineers to minimize the design effort to accurately simulate fluid flow and thermal analysis of their end-products. The latest release contains several significant features for pre-processing, simulation, data management, and design collaboration.
The new Flowmaster 'experiments' capability harnesses the power of robust simulation within an exploratory methodology. It allows users to create response surfaces and export meta-model data as either standard ANSI C code or as S-Functions for use in a real-time environment providing support for hardware-in-the-loop simulations. Using a Latin Square algorithm helps users generate unique combinations of distributed input values between specific bounds. This ability creates an ideal foundation for designing experiments, and the creation of meta-models and response surfaces that characterize a Flowmaster system response.Visit our website for more information:mentor.com/mechanical Response Surface Model for Automotive Cooling Network

mentor.com/mechanical 7
NewsIntroducing FloTHERM XT�From Concept through to Verification for Electronics Cooling Simulation
Traditionally the thermal design of electronic assemblies has been left to a relatively late stage in the design process, when much of the electronics and mechanical design is nearing completion. This has led to a lot of late-design rework and often further iterations due to problems found during physical prototyping. Consequently it can mean design costs skyrocket, products are frequently late to market, and there is not enough time for exploring better design approaches and optimization strategies in the upfront design phase where simulation has the most impact. At Mentor Graphics we felt there was a need to model the complete continuum of the design workflow that supports all phases of electronics cooling design, from concept through to verification and prototyping up to manufacture. In addition, we wanted to interconnect Electronics Design Automation (EDA) and Mechanical Computer Aided Design
(MCAD) flows especially targeted at the design engineer as well as thermal specialist, but focused solely on electronics cooling. To do this we therefore harnessed two of our most powerful DNA's: FloTHERM®, with its world-leading 25 year electronics cooling pedigree, and FloEFD� as the modern CAD-embedded computational fluid dynamics (CFD) enabling technology. The synthesis of these two technologies has yielded FloTHERM XT, a new specialized electronics cooling product supporting design processes from concept through to manufacturing thus extending our FloTHERM product-line capabilities even further. Its primary, and industry-unique attribute, is its ability to support thermal design requirements from concept through detailed implementation and on to final design verification, whilst retaining data model consistency and cleanly supporting data evolution as mechanical or board layout changes are introduced into the process.
Mentor Graphics recently announced the release of FloTHERM XT at the March 2013 SemiTHERM
Conference in California, USA. Product Manager, Ian Clark, conveys its features and describes how this new product will change the way products are developed.
Figure 2. FloEDA Bridge Interface
Figure 1. FloTHERM XT CAD-centric Interface

8 mentor.com/mechanical
A unique software solution has been developed that delivers interconnectivity between the MCAD and EDA design flows and, in particular, it introduces a powerful and industry-first, auto-update capability as the PCB layout evolves. FloTHERM XT is CAD-centric (Figure 1) in design and operation, but has a configurable user interface that supports the needs of both design engineers and thermal specialists who may not require access to all the CAD functionality. The product is focused purely on electronics cooling applications and has been built on the innovative technology within FloTHERM while utilizing the general power and
sophistication of FloEFD as the enabling technology for meshing and solving. Secondly, FloTHERM XT includes a module called FloEDA Bridge (Figure 2) where all of the EDA processing steps are semi-automated for the preparation of the PCB model, including component power definition, enabling a complete PCB model to be directly transferred to FloTHERM XT with ease.
To understand the workflow process improvements that FloTHERM XT can provide its users, we need first to look at how traditional CFD integrates with the MCAD and EDA design flows. Looking at a
traditional electronics cooling design flow (Figure 3), there are a number of complex and error-prone steps associated with geometric data preparation, meshing and solving that mean it can take a long time to go through the cycle, sometimes days or even weeks. When completed, this can result in a simulation model that has become stale as the design has moved on, making implementation of any design recommendations problematic.
If we contrast this to a FloTHERM XT enabled workflow (Figure 4) we see that the 'Create Geometry' step is as before. The geometry employed can be imported
Figure 3. Traditional CFD approach to Electronics Cooling MDA/EDA workflow
Figure 4. FloTHERM XT approach to Electronics Cooling MDA/EDA workflow
FloTHERM XT� Enabled Electronics Cooling Workflow
Traditional Electronics Cooling Workflow

mentor.com/mechanical 9
NewsCAD geometry, created within FloTHERM XT or SmartPart based. The 'Assemble Model' step is greatly compressed within FloTHERM XT. Though because it can directly work with CAD geometry and so CAD can be exported in the CAD system's own native format and used directly inside FloTHERM XT. If required, unnecessary detail can be removed by rewinding features of the model within the CAD system. Similarly, native EDA data can be exported into FloTHERM XT with all of the processing steps incorporated into the new FloEDA Bridge module that simplifies the preparation of complete 3D models of boards and components.
Meshing is also compressed in FloTHERM XT avoiding all the problems associated with a more traditional CFD approach to meshing, This is achieved by using object-based mesh controls and a tried-and-proven Cartesian-based, immersed boundary meshing approach that does not suffer from the mesh quality problems associated with body-fitted meshes. As a result, the solution process is more robust and proceeds very quickly without convergence problems. Report generation in FloTHERM XT is automated, so that recommendations from the simulation can be fed back to the design team in a very short elapsed period.
FloTHERM XT offers significant advantages over traditional CFD simulation approaches. By starting simulation at the conceptual stage and retaining data and history consistency as the design evolves over time, it results in fewer design iterations to correct late in-
process design errors and consequently reduces the time to get new designs to market very significantly. The software has been developed in the recognition that companies vary in terms of the types of personnel required to perform thermal analysis and simulation these days, and is intended to be utilized by both design engineers and thermal specialists. This means that what-if studies and experimental or innovative design changes can be quickly assessed as to their effectiveness, resulting in more competitive products without over-reliance on existing over-burdened thermal experts.
It has also been developed with a unique capability for bridging the gap between EDA and MCAD design flows and it takes advantage of Mentor's leadership in PCB system design tools. In so doing, there is now a direct integration with PCB designs including an auto-update capability which is less error-prone and time consuming when working with board designs generally or with subsequent updates as the board design evolves. This design flow using FloTHERM XT also introduces best-in-class filtering capabilities for thermally irrelevant devices and supports automatic connectivity to thermal model package libraries.
In order to support the broadest possible range of user personas, we have developed intuitive object based meshing capabilities, customizable user interface and model building controls. The outcome being a significant reduction in overall simulation times and the most efficient solution possible for complex, cluttered electronics systems. By incorporating a solid modeling engine into FloTHERM XT, and with native links to EDA software, it can help companies bring the mechanical and electrical design disciplines closer together through the creation of a 3D model of the product that can be very simple or as detailed as necessary and that is synchronized with the design in the MCAD and EDA systems. Ultimately XT can help companies further compress their design times for electronics cooling, thereby reducing cost and project risk, leading to shorter times-to-market, more competitive products and, finally, higher product reliability.
Figure 5. Smart Phone
Figure 6 Network Router
Figure 7. Automotive Pump Controller Figure 8. Graphics Card

10 mentor.com/mechanical
A Tablet for EverythingFloTHERM XT�, FloTHERM®, & T3Ster® Cure Thermal Headaches in Tablet ComputersBy Guy Wagner and William Maltz, Electronic Cooling Solutions Inc.

mentor.com/mechanical 11
t is human nature to follow the path of least resistance. To that end, it has never been easier or quicker to get what you want, when you want it. The
demand for this instant gratification has not only resulted in an explosion of online shopping and drive-thru conveniences such as coffee shops and fast food chains, but has also dramatically changed how we work, play, and learn. No longer do we visit the library to get a book, buy newspaper or wait for the evening news to find out what is happening in the world. We read the news, finish an urgent work report, complete the next level of Angry Birds and find out when the next train is due and all from the same little device: The Tablet
The growth of the tablet market is reflected in the continued decline of the PC market, with consumers generally choosing to replace their laptops with tablets rather than purchasing both.[1] Cheaper prices and a wide range of form factors and sizes has resulted in manufacturers designing devices that are slimmer, sleeker and more compact than ever before.
The thermal design of next generation handheld devices must address both comfortable surface touch temperatures and maximum temperature limitations of internal critical components while also meeting aggressive industrial design requirements. This article discusses the challenges in meeting these requirements in tablet designs.
Thermal models of tablets were created using FloTHERM XT to help understand the maximum allowable power dissipation under various operating conditions. The models were also used to conduct parametric studies to determine the best way to move heat from the internal components out to the case of the tablet where it can be dissipated.
Maximum Power DissipationHandheld devices are increasingly capable of running applications that used to require laptop and desktop computers. The requirement that these devices provide better performance with a smaller form factor presents significant challenges, especially when one considers that passive cooling is also a requirement. Several studies have focused on the cooling challenges of hand-held devices; Brown et al, Lee et al, Mongia et al, Huh et al, and Gurrum et al. [2-6]
The maximum possible power dissipation by natural convection and radiation has been calculated for this study and is shown in Figure 1 (overleaf). With a 25°C ambient condition at sea level, the maximum total power dissipation was calculated with a requirement that the surface temperature not exceed a touch temperature of 41°C. This is the maximum aluminum enclosure comfort touch temperature as presented by Berhe.[7]
It can be seen that the theoretical maximum total power dissipation is 13.9 watts when the device is suspended vertically in midair with conduction and radiation occurring from all surfaces as shown in Figure 2. When the device is horizontal, the maximum dissipation falls to 13.1 watts. When the device is placed on a horizontal adiabatic surface, heat transfer occurs from the sides and front surface only and the maximum power dissipation is reduced to 7.9 watts as shown in Figure 3. This condition occurs when the user places the tablet on a blanket or pillow effectively blocking heat transfer from the back surface. These values establish bounds for the maximum amount of heat that can be dissipated by the tablet for different orientations in still air.
In order to calculate the total power dissipation, the following assumptions were made: a typical tablet size of 180 mm by
I
Electronics

12 mentor.com/mechanical
Figure 2. 41°C Isothermal tablet in vertical position Figure 3. 41°C Isothermal tablet in horizontal position on an adiabatic surface
240 mm and an ideal condition of uniform surface temperature. With a conservative assumption of a surface emissivity of 0.8, the radiant heat transfer accounts for more than half of the total power dissipation at an ambient temperature of 25°C.
In order to achieve a 41°C touch temperature, design parameters need to be considered carefully. It is important to design the tablet to be as isothermal as possible to maximize the amount of heat transfer to the surroundings. The reason for this is so that all surface areas of the tablet are as far above ambient temperature as possible to maximize heat transfer without exceeding the maximum allowable touch temperature. When a surface is no longer available for heat transfer, such as when the tablet is placed on a blanket, the amount of power that can be dissipated while staying under the maximum touch temperature drops significantly since heat transfer is effectively blocked from the back surface.
The Value of Numerical ModelsIn order to analyze the impact of different thermal management techniques, a detailed computational fluid dynamics (CFD) thermal model is constructed using FloTHERM. Since the actual thermal characterization data of the main processor in the tablet may not be known, the thermal characteristics of the processor can be measured with a high degree of accuracy using Mentor Graphics' T3Ster® to determine the thermal resistance from the processor IC to the case and the PCB. This allows accurate capture of heat flow from the top and bottom of the processor. The thermal model of the processor that was generated using T3Ster
Figure 1. Total power dissipation removed by passive cooling of a tablet
can be directly dropped into the tablet thermal model in FloTHERM. The results of a detailed thermal model of the interior of a tablet are shown in Figure 4.Notice how the automatic adaptive meshing in FloTHERM XT follows the small surface details of the components to accurately capture convective and radiant heat transfer from these surfaces.
Hot-Spot Temperature ReductionSince the goal is to keep the touch temperature at or below 41°C, determining
the effect of high conductivity heat spreaders will have a major impact on the design. Some parametric studies were run to determine the effect of making the back side of the case with materials of varying thermal conductivity. The results are shown in Figure 5 and summarized graphically in Figure 6. This study assumes the same power dissipation for each simulation. The only parameter that is being changed is the thermal conductivity of the case. As a reference point, typical thermal conductivity of most plastics is in the range of 0.2 W/mK while aluminum approaches 200 W/mK.

mentor.com/mechanical 13
This makes aluminum about 1000 times as thermally conductive as plastic. Hot-spot temperature reduction can be achieved by either providing a high conductivity heat spreader inside the case of the tablet or by making the case itself out of high conductivity material. One must keep in mind that the maximum touch temperature is also a function of the conductivity of the case. As the conductivity goes down the maximum comfortable touch temperature goes up.
As an example, if the case is made of plastic with a thermal conductivity in the range of 0.2 W/mK, the case temperature that the user senses appears to be cooler than that of an alumunum case since the low thermal conductivity of the plastic results in less heat being conducted between the case and the skin. Since the surface area of the case is large in relation to the thickness of the plastic, heat transfer to the air is not reduced significantly over that of an aluminum case. This of course assumes that the heat is spread on the inside of the plastic case using a high-conductivity aluminum plate or a graphite sheet.
Figure 4. Detailed model of the PCB created in FloTHERM® XT
Figure 5. Back-side hot spot temperature change as a function of case thermal conductivity
Deriving a Thermal Model of a ProcessorWhen building a thermal model of a tablet, the thermal characteristics of the processor are not always known with a high degree of accuracy. It is also true that data sheets from the suppliers of thermal interface materials may not accurately reflect the thermal resistance of the interface material and the wetting properties of the material between the processor chip or lid and the heat spreader.To overcome this limitation and get an accurate thermal model of the processor, T3Ster was used to determine the thermal resistance from the processor IC to the lid or heat spreader and the PCB. T3Ster is able to do a dynamic thermal characterization of the thermal resistance paths of a packaged semiconductor device. The transient temperature response of the die is recorded as a function of a step input in power to the die and a structure function is derived from the transient temperature response that characterizes the thermal resistance of all the materials in the thermal path. Figure 7 shows the structure function that was derived for a processor using T3Ster. Note that the thermal resistance from junction to case is measured at 0.23 K/W using this technique.This thermal model of the processor package is then put back in to the CFD simulation and numerical experiments can be run to
Electronics

14 mentor.com/mechanical
determine the change in processor junction temperature as other elements in the thermal path such as heat spreader materials and dimensions, air gap thickness between the heat spreader and back case and case materials are changed.
SummaryThe maximum power dissipation of the internal components is not only governed by the size of the tablet but is a strong function of how well that heat is spread internally to reduce hot-spot temperatures. Few engineers realize the importance played by radiation in dissipating the heat from the exposed surfaces of a tablet. It is not until precise calculations are made
Figure 7. The cumulative structure function measured for the processor and lid using T3Ster®
Figure 6. Effect of thermal conductivity of the case on temperatures
that the importance of radiation is realized in the thermal design of the tablet. If the emissivities of the various surfaces are high, over half of the heat transfer to the surroundings is due to radiation. Overall heat transfer is maximized by reducing hot spot temperatures and spreading the heat so that all surfaces are effectively providing maximum heat transfer through convection and radiation.
In summary, building an accurate thermal model of the tablet allows the designer to
rapidly test the effect of design and material changes without incurring the high cost and schedule delays of testing prototypes. A thermal model allows the thermal design engineer to investigate far more alternatives than building prototypes. This results in a highly engineered tablet design that better meets the expectations of the user while providing an edge over the competition. High quality thermal models speed time to market and lower development costs. With the accuracy of the latest simulation software, the intermediate step of building
Figure 8. Lab setup with IR camera, power measurement and temperature logging equipment

mentor.com/mechanical 15
and testing thermal prototypes can be reduced or eliminated. The only need is final thermal verification of production prototype samples.
References[1] Preliminary data from the International Data Corporation (IDC) Worldwide Quarterly Tablet Tracker
[2] Brown, L., Seshadri, H., Cool Hand Linux® - Handheld Thermal Extensions, Proceedings of the Linux Symposium, Vol. 1, pp 75 – 80, 2007
[3] Gurrum, S.P., Edwards, D.R., Marchand- Golder, T., Akiyama, J., Yokoya, S., Drouard, J.F., Dahan, F., Generic Thermal Analysis for Phone and Tablet Systems, Proceedings of IEEE Electronic Components and Technology Conference, 2012
[4] Huh, Y., Future Direction of Power Management in Mobile Devices, IEEE Asian Solid-State Circuits Conference, 2011
[5] Lee, J., Gerlach, D.W., Joshi, Y.K., Parametric Thermal Modeling of Heat Transfer in Handheld Electronic Devices, Proceedings of the 11th IEEE Intersociety Conference on Thermal and Thermomechanical Phenomena in Electronic Systems, I-THERM, pp 604- 609, 2008
[6] Mongia, R., Bhattacharya, A., Pokharna, H., Skin Cooling and Other Challenges in Future Mobile Form Factor Computing Devices, Microelectronics Journal, Vol. 39, pp 992 – 1000, 2008
[7] Berhe, M.K., Ergonomic Temperature Limits for Handheld Electronic Devices, Proceedings of ASME InterPACK'07, Paper No. IPACK2007-33873Figure 9. Tablet interior with thermocouples attached
Electronics
16 mentor.com/mechanical
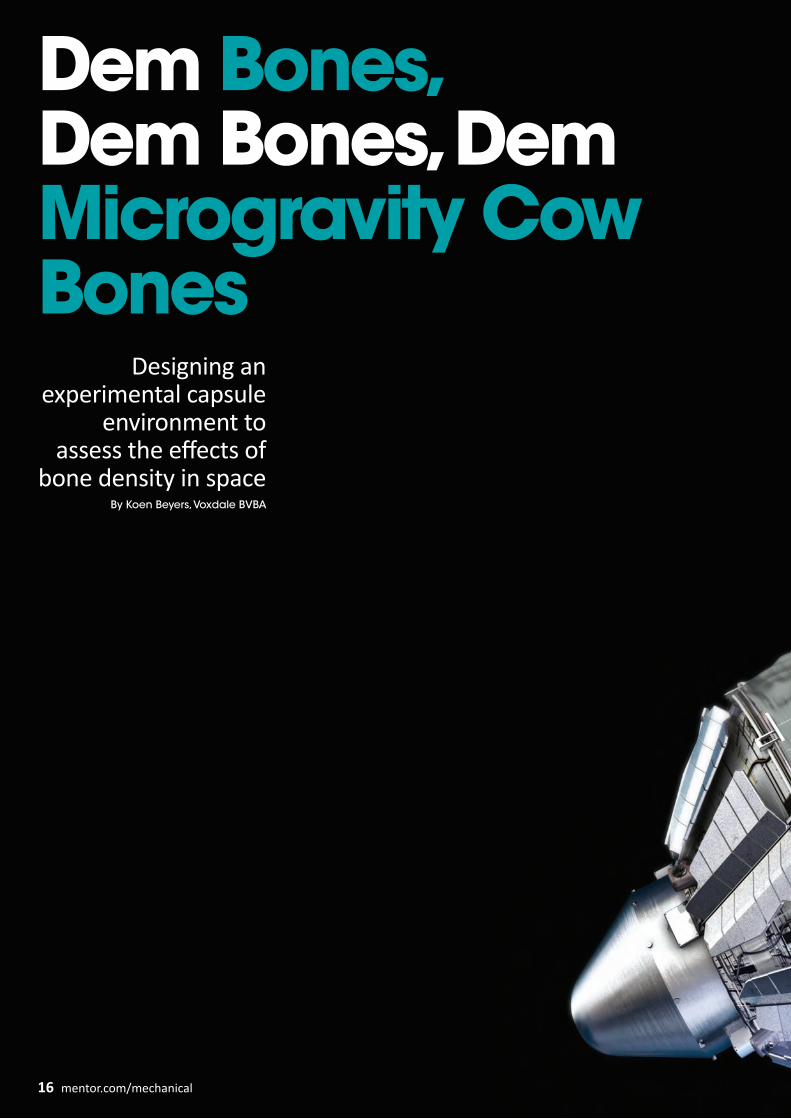
Dem Bones, Dem Bones, Dem Microgravity Cow Bones
Designing an experimental capsule
environment to assess the effects of
bone density in spaceBy Koen Beyers, Voxdale BVBA
16 mentor.com/mechanical

mentor.com/mechanical 17
Aerospace
he Flemish Space Cluster is a $200M, 30 company manufacturing base dedicated to developing and commercializing Belgium's science and technology associated
with space. Voxdale BVBA is a member of the cluster as well as providing other engineering services over a wide range of industries from their offices in Antwerp. One of the more interesting space projects they are working on is the possibility of three year long manned journeys to neighboring planets, such as Mars to address the problem of astronauts' bones becoming brittle and even suffering osteoporosis during long space flights in microgravity.
To gain a deeper understanding of this phenomenon, the 'FreqBone' bioreactor project was conceived by Jos Vander Sloten, Gerrit Van Lenthe and Geert Carmeliet of the Catholic University of Leuven, Division of Biomechanics and Engineering Design,
in Belgium, and deployed in a European Space Agency (ESA) low-earth orbit mission. In essence their FreqBone experiment involved 12 pieces of living cowbone (that were constantly 'fed' during the flight to keep the bones alive) being exposed to a 12 day vibration experiment inside a satellite orbiting the earth under weightless conditions and exposed to cyclical solar loads due to it orbiting the earth 15 times a day at a speed of 28,000 km/h.
The Foton unmanned recoverable spacecraft series was first introduced by the former Soviet Union with an inaugural flight in 1985 after the successful Soviet Soyuz rockets and capsules from the 1960s. It was conceived as a microgravity platform for physicists and materials scientists to complement the very similar Bion capsules that were aimed at life science studies.
In recent years, an increasing number of
biology and non-microgravity experiments were transferred to Foton, while the Bion program was discontinued.
The Foton-M3 Russian spacecraft is designed to perform space experiments during a short mission life (generally up to two weeks). The Russian Space Agency, Roskosmos, is responsible for the spacecraft while ESA is responsible for its payload and experiments. The FreqBone project was completed and the experimental test done on the Russian Foton-M3 Rocket ESA, and indeed it was one of fourteen ESA experiments in the rocket payload bay including ones for fluid physics, biology, protein crystal growth, meteoritics, radiation dosimetry and exobiology.
T
Foton-M3 spacecraft in orbit. Photo cour-tesy of the European Space Agency (ESA)
mentor.com/mechanical 17
18 mentor.com/mechanical
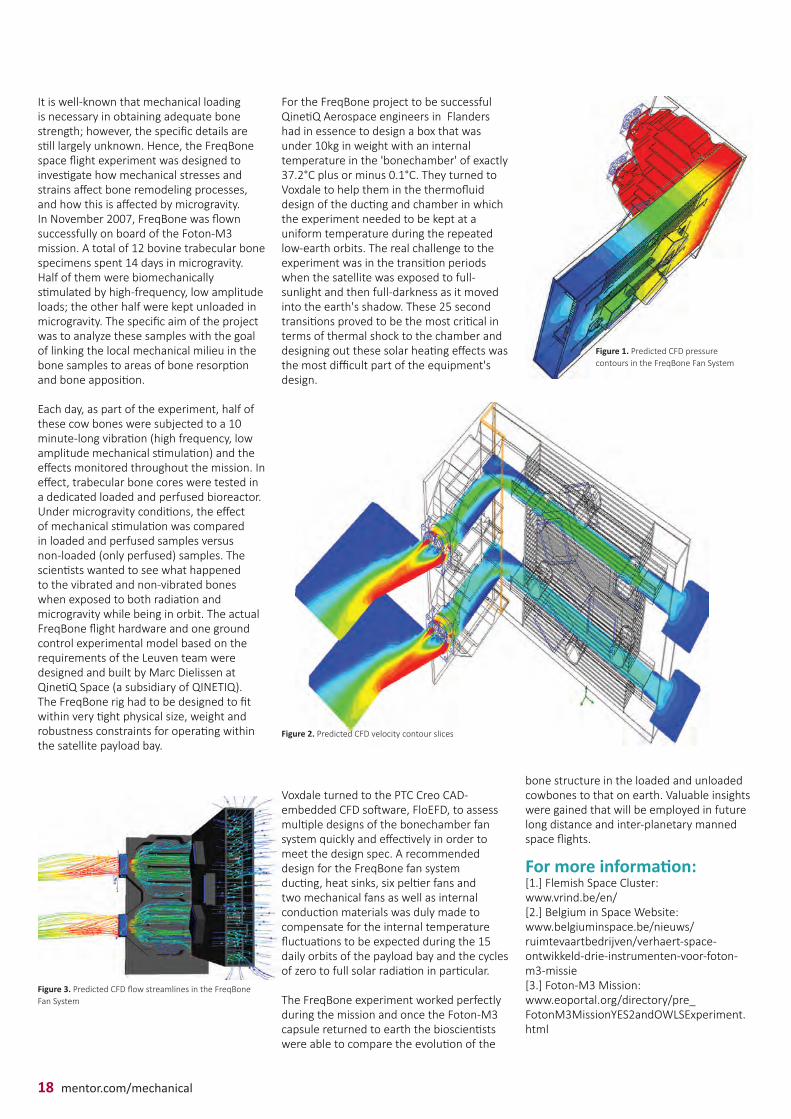
It is well-known that mechanical loading is necessary in obtaining adequate bone strength; however, the specific details are still largely unknown. Hence, the FreqBone space flight experiment was designed to investigate how mechanical stresses and strains affect bone remodeling processes, and how this is affected by microgravity. In November 2007, FreqBone was flown successfully on board of the Foton-M3 mission. A total of 12 bovine trabecular bone specimens spent 14 days in microgravity. Half of them were biomechanically stimulated by high-frequency, low amplitude loads; the other half were kept unloaded in microgravity. The specific aim of the project was to analyze these samples with the goal of linking the local mechanical milieu in the bone samples to areas of bone resorption and bone apposition.
Each day, as part of the experiment, half of these cow bones were subjected to a 10 minute-long vibration (high frequency, low amplitude mechanical stimulation) and the effects monitored throughout the mission. In effect, trabecular bone cores were tested in a dedicated loaded and perfused bioreactor. Under microgravity conditions, the effect of mechanical stimulation was compared in loaded and perfused samples versus non-loaded (only perfused) samples. The scientists wanted to see what happened to the vibrated and non-vibrated bones when exposed to both radiation and microgravity while being in orbit. The actual FreqBone flight hardware and one ground control experimental model based on the requirements of the Leuven team were designed and built by Marc Dielissen at QinetiQ Space (a subsidiary of QINETIQ). The FreqBone rig had to be designed to fit within very tight physical size, weight and robustness constraints for operating within the satellite payload bay.
Voxdale turned to the PTC Creo CAD-embedded CFD software, FloEFD, to assess multiple designs of the bonechamber fan system quickly and effectively in order to meet the design spec. A recommended design for the FreqBone fan system ducting, heat sinks, six peltier fans and two mechanical fans as well as internal conduction materials was duly made to compensate for the internal temperature fluctuations to be expected during the 15 daily orbits of the payload bay and the cycles of zero to full solar radiation in particular.
The FreqBone experiment worked perfectly during the mission and once the Foton-M3 capsule returned to earth the bioscientists were able to compare the evolution of the
For the FreqBone project to be successful QinetiQ Aerospace engineers in Flanders had in essence to design a box that was under 10kg in weight with an internal temperature in the 'bonechamber' of exactly 37.2°C plus or minus 0.1°C. They turned to Voxdale to help them in the thermofluid design of the ducting and chamber in which the experiment needed to be kept at a uniform temperature during the repeated low-earth orbits. The real challenge to the experiment was in the transition periods when the satellite was exposed to full-sunlight and then full-darkness as it moved into the earth's shadow. These 25 second transitions proved to be the most critical in terms of thermal shock to the chamber and designing out these solar heating effects was the most difficult part of the equipment's design.
bone structure in the loaded and unloaded cowbones to that on earth. Valuable insights were gained that will be employed in future long distance and inter-planetary manned space flights.
For more information:[1.] Flemish Space Cluster:www.vrind.be/en/[2.] Belgium in Space Website:www.belgiuminspace.be/nieuws/ruimtevaartbedrijven/verhaert-space-ontwikkeld-drie-instrumenten-voor-foton-m3-missie [3.] Foton-M3 Mission:www.eoportal.org/directory/pre_FotonM3MissionYES2andOWLSExperiment.html
Figure 1. Predicted CFD pressure contours in the FreqBone Fan System
Figure 2. Predicted CFD velocity contour slices
Figure 3. Predicted CFD flow streamlines in the FreqBone Fan System

mentor.com/mechanical 19
AutomotiveState of the Art Automotive Thermal Design by DENSO
ENSO Corporation is a leading automotive supplier that designs and manufactures advanced vehicle control
technology, systems, and components for major automotive manufacturers all over the world. Founded in 1949, DENSO is headquartered in Kariya, Japan, operates in 35 countries, and employs around 120,000 people worldwide. DENSO's Electronic Systems Business Group provides engine, transmission, and power management Electronic Control Units (ECUs) as well as semiconductor sensors, integrated circuits, and power modules.
I met up with Takuya Shinoda, Project Assistant Manager of the Technology Planning Department, Electronics Engineering Division 2, to discuss how DENSO are using thermal simulation to dramatically reduce their design time and
cost. In this role, he is responsible for the thermal design of ECUs. Shinoda has the rare quality of understanding both mechanical and electrical disciplines. As he puts it, "Thermal design bridges both the mechanical and electrical disciplines. Thermal management is mainly a mechanical issue, but heat is generated in silicon, so it is necessary to also understand electronics to do thermal design correctly."
Design ChallengesECUs for vehicles and their components are becoming more complicated and intricate to produce energy-efficient and environmentally friendly cars. Successful thermal design is critical for manufacturers. The junction temperature of the Integrated Circuits (ICs) or Field Effect Transistors (FETs) that drive such a vehicle system must fall within a guaranteed temperature range.
ECUs for vehicles and their components
are becoming more complicated and
intricate to produce energy-efficient and
environmentally friendly cars.
Successful thermal design is critical for
manufacturers
By John Parry, Mentor Graphics
D
Figure 1. Downsizing drives technology for heat dissipation

20 mentor.com/mechanical
As it has been impossible to directly measure the junction temperature, engineers used to predict electronic elements' junction temperature based on the assumption of the measured surface temperature and set a wider design margin.In order to cope with the current aggressive price competition, it is important to secure quality, optimize the design margin, and achieve overall cost-effectiveness.
Simulation Saves Design Time and CostShinoda first started looking for a thermal design tool in 2006, having seen fluid flow visualization of a circuit board for the first time at an exhibition. DENSO selected FloTHERM® and FloTHERM® PCB for their thermal design flow over other tools through a rigorous benchmarking exercise.Before DENSO started using thermal simulation, a physical ECU prototype had to be created for temperature measurement at the early stage. As a result 2-3 weeks of preparation was needed to perform a day's testing, which might have to be repeated several times before the product was finalized.
Since 2006, DENSO have consistently increased the use of simulation to reduce
the time and cost spent on physical prototyping. By 2009 the ratio of simulation to physical prototyping was 20:80, this was increased to 50:50 by 2010. By 2012 the ratio stood at 70:30. This change has resulted in a 50% reduction in both the duration and costs associated with thermal design in less than six years. DENSO plans to go further, aiming to increase the ratio to over 90:10 by 2015.
Benefitting from Centralized Thermal Expertise DENSO has successfully introduced thermal analysis into the manufacturing process by centralizing their thermal technology and then making this expertise available throughout the company. By listening to the needs of the various design departments, Shinoda's thermal group is able to quickly improve the quality of design by improving the efficiency of the heat removal using thermal simulation backed up by experiments. In the thermal design, designers usually focus on changing the case form factors to improve heat dissipation. The best results can be achieved by sharing the case design and electronic design among members of the thermal design team. DENSO
had decided to use existing component models (Figure 4). The mechanical team created a smaller case, the circuit design team redesigned 10 to 20 % of the circuit according to new specifications, and the measurement team took the temperature for thermal analysis. As a result of this collaboration, DENSO were able to create a working thermal model for the product in two days. Engineers from each team contributed to this effort.
Characterization Supporting Simulation AccuracyBesides the aforementioned desire to move away from physical prototyping, measurements have an important role to play in DENSO's thermal design process. To support their thermal simulations, DENSO uses Mentor Graphics' T3Ster® to characterize ECU components and thermal interface resistances in situ. The accuracy of T3Ster data has enabled DENSO to increase the accuracy of their thermal simulations and given them the confidence to place such a heavy reliance on simulation. Measurement of T3ster data is taken back into FloTHERM to improve junction temperature prediction accuracy during design to ensure that junction temperatures never exceed their allowed limits. This is
Figure 2. Technological innovation in thermal management
Figure 3. Technological innovation in thermal management

mentor.com/mechanical 21
quite a tall order, and requires a very high level of confidence in the simulation models. Today, agreement on junction temperatures rise is to within 10% of experiment, and DENSO aim to increase the agreement further, to be within 5% by 2015.
"JEDEC JESD51-14 standard was issued in 2010. It has far exceeded accuracy and repeatability compared to the steady-state measurement that conforms to older standards. T3Ster is the only product available in the market that complies with this new standard, enabling the accurate estimation of thermal resistance and junction temperature. Also, using the
structure function, a unique feature of T3Ster, a simple and accurate element model can be generated from the measured data" explained Shinoda.DENSO has found it indispensable to take accurate measurements from the electronic elements, to improve simulation accuracy, and hence eliminate excess thermal margin from the design.
The FloTHERM suite of products, including FloTHERM PCB and FloTHERM PACK, has become a major toolset and used across the whole of DENSO's thermal design process. Backed up by high accuracy package thermal models, material property data
and interface resistance values obtained through measurements using T3Ster, Mentor Graphics' thermal solutions have helped DENSO to achieve over 90% virtualization in their thermal design, and a reduction of more than 50% in both development time and cost, with further savings expected for the future.
With thanks to Takuya Shinoda, Project Assistant Manager at DENSO Corporationwww.globaldenso.com
"Our PCB designers use FloTHERM PCB, which has a user-friendly user interface and connection with FloTHERM PACK and we get excellent support from IDAJ and KOZO KEIKAKU ENGINEERING who distribute Mentor Graphics thermal analysis tools"Takuya Shinoda, DENSO Corporation
Automotive
Figure 4. Advantages of centralized thermal technology - Simulation & Measurement

22 mentor.com/mechanical
How To...
W
Your complete guide to XML functionality in FloTHERM® & FloVENT®
By Andy Manning, Application Engineering Manager, Mentor Graphics
construction, for example, folded fin heat sinks, and data centers. which would normally be time consuming or tedious to build. Secondly, it allows the engineer to define their own SmartParts beyond those currently available in FloTHERM and FloVENT.
SmartParts are parametrically defined macros which can be used to create common electronic cooling or built environment objects, for example enclosures, fans, Computer Room Air Conditioning (CRAC) units, diffusers, etc. Library objects of these items can then be readily stored for later use. For instance, chimneys are used to isolate the hot air created by data center cabinets. The combination of cabinet and chimney can be readily defined using the XML schema. Thirdly, the use of the XML schema ensures adherence to Best Known Methods Standardization (BKM), where modeling errors can be avoided, and user-
ith the release of FloTHERM® and FloVENT® Computational Fluid Dynamics (CFD) software products, the
implementation of an XML schema for use in those two products was completed. For those unfamiliar with the concept, the XML format is described by a variety of tags and expected inputs, with the collection of these tags and inputs formally known as an XML schema. The XML schema available for FloTHERM and FloVENT specifically defines tags such that the resulting file can be read directly into the software. The resulting file is readable and structured, as shown in Figure 1, thereby lending itself to widespread adoption and readily available software authoring tools.
The availability of the XML schema offers several advantages to the engineer in considering different applications. Firstly, it allows the creation of objects which are geometrically repetitive in their
independent results produced. Finally, it allows the engineer to bypass the use of the Graphical User Interface (GUI) during the pre and post processing modeling phases and instead use simple software utilities, such as Microsoft Excel's macro functionality, to manipulate the creation of the model and interrogation of results.
Through bypassing the GUI of the parent software itself, there are two clear benefits. The first is that the process becomes very streamlined and straightforward. There is no need to open or close application windows, construct models or define plots. The advantages of using FloTHERM or FloVENT are therefore available to field engineers who would not necessarily have the experience to utilize such tools. The second benefit is that it allows the CFD software to be embedded into other third party or company created propriety software packages, and thereby become integral with company design processes.
Figure 1. Data Center Model Generation, Solution and Results Using XML

mentor.com/mechanical 23
Input and output boundary conditions such as pressure or temperature data can be readily transferred between FloTHERM and FloVENT as well as third party software. Alternatively, geometrical information from the third party software could be used via the XML schema to create CFD models. As an example of this latter usage, information on data center racks, and CRAC units that is readily available in Data Center Infrastructure Management (DCIM) software can be parsed to create CFD models. The simulation results could then be fed back into the DCIM software. Let's look at an example of how this could work using the illustrated case.
• Data entry of equipment and data center layout. This could be done via an audit or parsing of information from the DCIM software.• FloVENT model creation via Excel macro, this would be via a simple button click.• The model can then be manipulated in different ways, depending on the requirements. A couple of options could be: o Import into the FloVENT model for further refinement and simulation. The post-processing capabilities inherent in FloVENT, for example, animations, cut plots, Capture Index Values, etc. can then be used
to readily demonstrate the appropriateness of the data center HVAC design. o CFD simulation via Excel interface and subsequent results import into a pre-formatted Excel spreadsheet. In Figure 2, the rack supply temperatures have been color coded according to the operational limits of the rack.• If desired, results can then be fed back into the DCIM software.
All geometric objects and SmartParts included in the two software packages can now be represented and manipulated in the latest release of FloTHERM and FloVENT.
Further, the latest version allows PDML Referencing, so any existing geometry or library item to be used with macro or scripts removing the need to parametrically describe all objects in the XML applications and simplifies the creation of the input file. This is demonstrated in Figure 3, which considers the creation of a compact model of a PCB in a wind tunnel. Here, native XML objects are used to describe the wind tunnel, the Solution Domain, Fixed Flow, and Monitor Point, while PDML Referencing is used to identify the model of the PCB to be tested.
So, how to get started? The standard installation of FloTHERM and FloVENT includes many application examples and common XML schema building blocks, which allows engineers to become familiar with the format and implementation of the functionality. Further technical information and consulting services are available from your local Application Engineering resources.
A full implementation of a FloTHERM and FloVENT XML schema is available in the latest release of the tools. The inclusion of the schema provides clear advantages in the creation, solution and post-processing of CFD models and allows companies to tailor the software environment to better fit their organization's specific needs and work flow.
Figure 3. Example XML Schema File
Figure 2. Compact PCB Generation in Virtual Wind Tunnel Using XML
Computational Wind Tunnel: Parametrically
created in XML
PCB assembly: Existing PDML referenced by the XML

24 mentor.com/mechanical
Improving 1D Data with 3D CFD
W
By Joe Proulx, Mentor Graphics
Improving 1D Thermo-Fluid
System Automotive Engine Data with 3D Computational Fluid
Dynamics
Figure 1. 3D engine CAD model and 1D design of a cooling system
hen working with larger cooling systems that incorporate several components such as heat exchangers, thermostats,
coolant pumps and different cooling cycles like oil and coolant, a 1D CFD simulation tool is the common choice for thermal analysis. However, when considering an automotive engine cooling system, which is rather more complex when you take into account their transient behaviors with corresponding drive cycles and system reactions with all components, it becomes even more complex on any changes in flow rates or temperatures.
Moreover, such systems can only be as accurate as the data that is supplied to them. One way to improve accuracy would be to get 3D component data and characteristics from measurements. If however components are still in the design stage, building a prototype and measuring them can be extremely expensive. To facilitate this, Mentor offers a direct interface by coupling CAD embedded CFD software FloEFD� with system simulation software Flowmaster®, resulting in a CFD characterized model as a component in the Flowmaster system.A recent paper for the SAE World Congress [1] demonstrates the use of coupled 1D-3D CFD simulation for an automotive engine block (see Figure 1).
The ProblemIt is well known that bringing an automotive engine up to normal operating temperature quickly after starting is the best way to improve vehicle efficiency. The engine and complementary components, along with
the coolant and oil, all start out cold. By confining the heat to the engine during the warm up period, efficiencies during the startup cycle of a vehicle can be improved.
A combination of 1D and 3D CFD can be utilized to determine the optimal design of such an engine. Each type of simulation has its virtues, whilst 1D simulation can run long transient simulations quickly it can lack some detail. 3D CFD simulations on the other hand can accurately simulate details of solid components but it tends to be slower in regard to transients.
An engine system has many components and as a consequence when the design develops not all the pieces are ready at once. As well as this, obtaining vital data can take time, so an efficient design process incorporating engine cooling data obtained through testing can be supplied to the 1D simulation tool for analysis. Should the component require modifications through the design cycle, testing will need to be repeated. Conversely, if testing has not yet been performed and all that is available is empirical data to quantify the engine, then accuracy could come into question. The net effect is that these types of approaches can be time consuming or inaccurate. In this instance the engine block and head were available as CAD models and the majority of the details of the 1D model were already in place making a 1D-3D approach ideal.
How CFD was usedA CAD model of the engine block and head was used for the 3D simulation. Figure 2. shows the coolant and oil flow paths in the engine (in blue). When setting up the

mentor.com/mechanical 25
Automotivepower boundary conditions in the model, the portion of heat that is dissipated from the combustion into the cylinder walls was applied as a constant. The value of heat used for this dissipation was developed from earlier experimental data and the imposed drive cycle. Goals were set in the model to automatically capture flow versus heat transfer coefficients for each fluid. Air around the engine and head also contributed to the engine cooling through natural convection. Once the base case was setup, an array of nine models was run using a parametric study in FloEFD. The model was created to vary coolant and oil flow. Heat dissipations in the motor were also varied. Once the array of nine CFD models was run, the data was then compared to empirical data according to Dittus-Boelter correlations.
Solution & ResultsThe 3D CFD simulation was setup in a short time and the results from the parametric study were imported as a new component into Flowmaster for the overall system simulation of the transient drive cycle.The graph in Figure 3 below shows a significant difference in the methods used to quantify the heat transfer from the engine to the coolant. Heat transfer coefficients from the engine to the coolant had differences as high as 20% between hand calculation and 3D CFD simulations.This shows that the overall accuracy when using 3D CFD simulation data is far more accurate than hand calculations. The overall process of characterizing a component for a range of working parameters as shown here enables the system designer to evaluate any changes in the system with the same component over and over much faster than a direct 1D-3D coupling where a 3D transient simulation can be the major bottleneck in the overall calculation time.
Figure 2. Coolant and Oil Passages in Detailed 3D CFD Model
Concluding ThoughtsAs demonstrated here, the detailed simulation approach versus conventional engineering hand calculations can be significantly different. Use of a validated 3D CFD tool such as FloEFD, as opposed to a single empirical formula can greatly improve the accuracy of the data used in any 1D simulation like with Flowmaster. A single empirical formula can fail to capture all of the details and differences within a detailed engineering design. As can be seen in Figure 4, there are many complex details in the engine geometry and in its consequent performance results that a single formula cannot capture.
The perceived advantage of the empirical formula is that it takes less than half an hour to develop. However, in the amount of time it takes to look up the formulas, a model could be setup and a run initiated in FloEFD. From there it is only a matter of a few days of computing time to create the
Figure 3. Comparison Chart of Empirically Derived and 3D Simulation Derived Heat Transfer Coefficient.
Figure 4. Surface Plot of Temperature from 3D Simulation
data from the 3D simulation. A trade off that is well worth it for the vast improvement in accuracy. Since FloEFD is embedded within most CAD tools, any design changes to the engine and block make it easy to capture the performance changes. If there are any changes to the engine or block, the 3D simulation could be re-run with no additional setup, thereby keeping the data current. This allows the engine and block to be developed concurrently with the 1D simulation.
As we follow along this analysis method we will see a difference in the 1D modeling. A follow-on paper is expected to be delivered that highlights the differences in the 1D analysis.
Reference:[1] SAE 2013 World Congress "Characterizing Thermal Interactions Between Engine Coolant, Oil and Ambient for an Internal Combustion Engine" Sudhi Uppuluri, Computational Sciences Experts Group; Joe Proulx, Mentor Graphics; Boris Marovic, Mentor Graphics (Deutschland)GmbH; Ajay Naiknaware, CSEG, LLC

26 mentor.com/mechanical
How small can you go?
A detailed CFD study to optimize the
design of multiple compact heatsinks
in the mobile communication module of radio
access stations
obile cellular phone subscriptions hit the six billion mark worldwide in 2011 [1], resulting in
an increased demand for base stations. This in turn drives the need to build even smaller, more compact stations which are unobtrusive. Under these circumstances more compact heatsinks become critical to keeping component temperatures below threshold levels for optimal electronics performance. A 2010 study [2] conducted by engineers at the Hanyang University in Seoul addressed this issue using the market leading FloTHERM™ electronics cooling simulation tool from Mentor Graphics.
It was used in association with a new process integration and design optimization (PIDO) tool, PIAnO™, from PIDOTECH Inc. in Korea [3]. Their detailed CFD study looked to optimize the design of multiple compact heatsinks in the mobile communication module of these radio access stations (Figure 1) which enable subscribers' wireless internet connections while on the move.
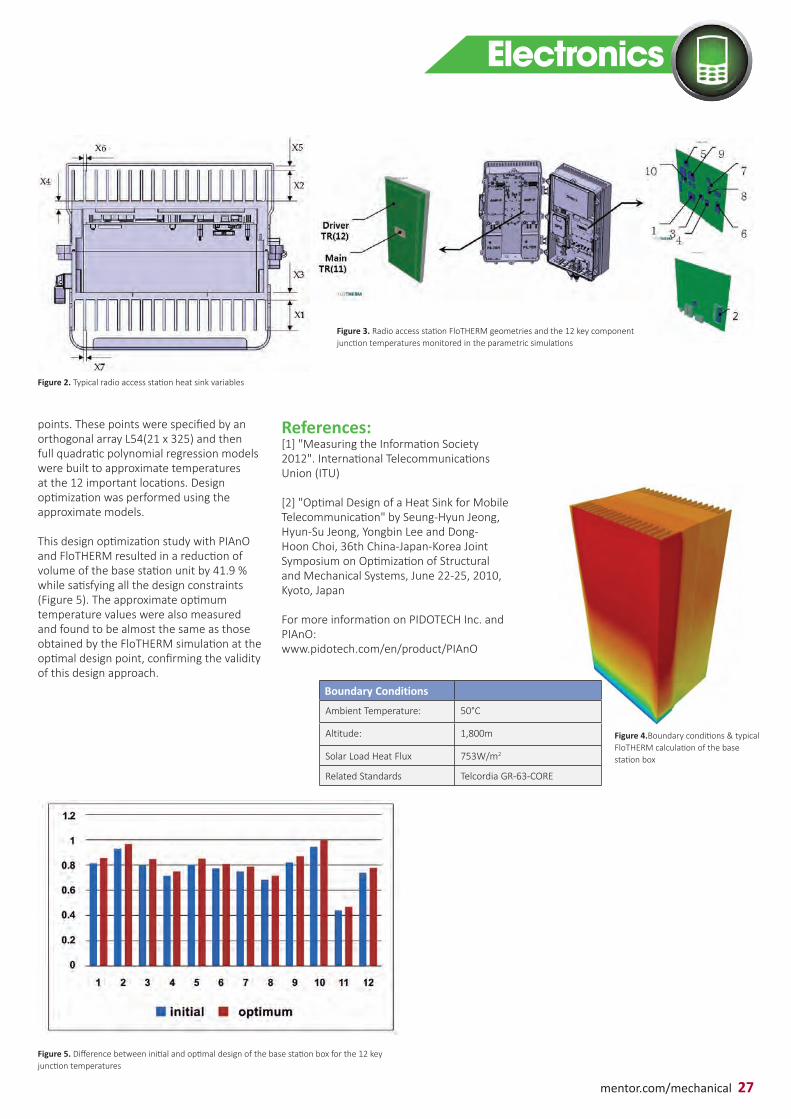
The compact heatsinks integrate into the front and rear housing of the radio access station. This makes them thermally stable over a wide range of ambient temperatures and they operate with only natural air convection currents to cool the electronics. Natural convection is preferable because of its silent operating mode as opposed to the alternative of fan cooling. The challenge posed by the researchers in this multivariable design project was to find the optimal heights, thicknesses and base thicknesses of the heat sinks, as well as the gap between the sun-shield and the heat sink in the front of the station (Figure 2).
The ultimate goal is to minimize the volume of the system while satisfying the constraints on the junction temperatures of 12 key components in the system (Figure 3).
FloTHERM® CFD simulations (Figure 4) obtained the temperature distribution in the unit for extreme operating conditions. PIAnO was employed to execute an array of CFD simulations needed for a Design of Experiment and to automate the procedure for the multivariable design scenario. In order to obtain an approximate optimal design solution, the thermal analysis results were obtained at 54 experimental sampling
M
By Seung-Hyun Jeong, Hangang Universtiy
Figure 1. Typical radio access station with CAD geometry
Sun Shield Front Housing
Rear Housing
Heater DeviceHeat Plate PCB
mentor.com/mechanical 27
Electronics
points. These points were specified by an orthogonal array L54(21 x 325) and then full quadratic polynomial regression models were built to approximate temperatures at the 12 important locations. Design optimization was performed using the approximate models.
This design optimization study with PIAnO and FloTHERM resulted in a reduction of volume of the base station unit by 41.9 % while satisfying all the design constraints (Figure 5). The approximate optimum temperature values were also measured and found to be almost the same as those obtained by the FloTHERM simulation at the optimal design point, confirming the validity of this design approach.
References:[1] "Measuring the Information Society 2012". International Telecommunications Union (ITU)
[2] "Optimal Design of a Heat Sink for Mobile Telecommunication" by Seung-Hyun Jeong, Hyun-Su Jeong, Yongbin Lee and Dong-Hoon Choi, 36th China-Japan-Korea Joint Symposium on Optimization of Structural and Mechanical Systems, June 22-25, 2010, Kyoto, Japan
For more information on PIDOTECH Inc. and PIAnO: www.pidotech.com/en/product/PIAnO
Figure 3. Radio access station FloTHERM geometries and the 12 key component junction temperatures monitored in the parametric simulations
Figure 4.Boundary conditions & typical FloTHERM calculation of the base station box
Figure 2. Typical radio access station heat sink variables
Figure 5. Difference between initial and optimal design of the base station box for the 12 key junction temperatures
Boundary Conditions
Ambient Temperature: 50°C
Altitude: 1,800m
Solar Load Heat Flux 753W/m2
Related Standards Telcordia GR-63-CORE

28 mentor.com/mechanical
Megawatt Engines need Mega Cooling
TBy Boris Marovic, Mentor Graphics
he thought of a 20 megawatt electric engine is mind blowing; especially when you consider most road car engines are a mere 120
kW. A 90 ton, 20 meter long Eurosprinter that is capable of reaching speeds of up to 230km/h only uses 6.4 MW in its four electric motors. So when considering a 20 MW engine, in an oil or gas compressor for instance, one has to marvel at its power. An engineer however must concern himself with how to keep this monster cool.
E-Cooling GmbH in Berlin is an engineering consultancy founded by Karim Segond. Their expertise lie in providing 3D thermal and flow analysis, enhancement and development supporting electronics, electric engines, and power electronics. When E-Cooling began working on 20 MW
motors it was evident that traditional CFD was not up to the job of meshing their complex geometries. Karim undertook the task of finding an approach that could handle complex geometries, wasn't too laborious but still delivered quality results, "The pre-processing with traditional CFD tools is much too slow for the simulation of large complex machines. I decided to look for a better solution that would solve my problems faster. I was specifically looking for software that can mesh such models with a Cartesian mesh and found FloEFD™. "E-Cooling's ethos is to provide detailed, accurate data to their clients at a reasonable cost, therefore the amount of man-hours used to mesh complex geometries is a big factor to consider for Karim. "The biggest benefits I got from FloEFD was that it was embedded, I could work within a CAD
Figure 1. Rotor of a Hydro Generator. Photo courtecy of Hydropower Consult
With thanks to Karim Segond at E-Cooling GmbHwww.e-cooling.de

mentor.com/mechanical 29
system and use parametric CAD models. This made it easier to change any geometry and therefore run several variants very easily. Another point that lifted a heavy burden for me is the automatic meshing, so basically the meshing as I knew it became obsolete and I could spend my time with other things than manually mesh the geometry."Karim is supported by his business partner, Guenter Zwarg, for the thermal management of these mega engines; the expertise of Günter covers almost all types of large electrical motors and hydro generators. According to Karim, his customers were
always very satisfied with his work and the accuracy of the results has not suffered from the comfort of automatic meshing.
Karim is also investigating the thermal management of the power electronics components used to drive such large engines. Karim says "The cooling of power electronics is very important and should be considered as early as the concept stage of the design. Here CFD can be leveraged to optimize the design and ensure the best possible cooling for the components."
"The accuracy of FloEFD was always good. It is not easy to measure electric motors that run at very high speeds but FloEFD provided good results when compared to the measurements we received from our customers. FloEFD helped me to work on contracts that involved very complex geometries, such as a stator coil end turn support system, which I wouldn't have been able to do with other CFD software." Karim Segond, E-Cooling GmbH
Figure 4. Streamlines of the E-Cooling tutorial electrical motor
Figure 3. Streamlines through the heat sink of a power module
Figure 2. Surface temperatures in an IGBT casing
Figure 5. Flow vectors of free convection in the casing of a power module
Power Electronics
Besides simulations of IGBTs E-Cooling has turned their attention to the overall cooling of a system. Such cooling systems are too big and too complex to simulate with 3D CFD software. Therefore it is necessary to analyze them using a 1D thermal and fluid flow circuit that is modeled in a 1D CFD tool such as Flowmaster®. This combined solution then enables Karim to provide the qualities of both tools and provide the ultimate cooling solution to his customers.

30 mentor.com/mechanical
Lights, Camera, Action!Grass Valley Video Camera Modeling using FloEFD�
or more than 50 years Grass Valley has been the premier video technology solutions provider that broadcasters and video
professionals turn to for imaging, video and media solutions. Grass Valley Netherlands BV develops and manufactures professional cameras for the broadcast market.
Their award winning cameras are a result of their commitment to innovation and performance to camera design and engineering excellence. Their range of system cameras have captured the world's highest profile, most prestigious events as well as local news and public affairs programming.
More Power means more HeatWhen it comes to the design of these modular cameras, many factors must be
considered as the units consist of the head, which contains sensors and video processing, and the body that houses the electronics to transmit HD signal back to the studio. As broadcast video cameras consume a lot of power, cooling the camera's electronics is very important, making thermal design critical to any new development.
Grass Valley's latest camera was expected to consume more power, and hence produce more heat, than their existing designs. Grass Valley decided to invest in a Knowledge Transfer Project sponsored by M2i (Material Institute for Innovation), to investigate the use of virtual prototyping to optimize the thermal design. The project was supervised by B.V. Ingenieursbureau H.E.C. (HEC), who recommended using a CFD modeling tool such as FloEFD�. The 3D fluid flow and heat transfer analysis tool would be able to provide the insight necessary to ensure the best possible design.
FAnalysis & ResultsTo gain proficiency and confidence in the simulation technology, HEC advised Ir. E. Schmit, the Mechanical Architect working on the project to first build a model of an existing camera.
With just three days of training from HEC, and under their guidance, Ir. Schmit was able to use FloEFD Embedded within their PTC Creo CAD system to build a model of Grass Valley's LDK 8000 Elite WorldCam Multi-Format HD Production Camera, for which experimental prototype test data was
Figure 1. FloEFD results closely matching experimental data
Figure 2. Baseline model of existing camera

mentor.com/mechanical 31
Electronics"Working with FloEFD I had a very positive experience. It is a user-friendly package that is fully integrated into our development software - ProEngineer Creo. It has a very intuitive in-terface and offers many opportunities to produce insightful results. We have much more insight into the heat flow within the camera and have been able to make a number of changes to the design very early in the project that would have taken much more time to make later on. I think it's well worth the investment and we will certainly use FloEFD in future projects." - Ir. E. Schmit, Mechanical Architect at Grass Valley Netherlands BV
available. The temperatures observed in the simulation (Figure 1) were found to be in close agreement with the measured values for this camera, showing less than 10% variance. The total airflow through the camera was even closer to the measured value, <5%. Ir. Schmit was also able to estimate the noise level produced by the fan with a rule of thumb based on the differential pressure and flow through the fan, this also proved to be closely matched to the results created in FloEFD.
In addition, FloEFD provided numerous amounts of simulation data that would be very difficult to get from a physical prototype. Data such as the distribution of the total air flow through each vent, the pressure differential across the fan, the fan flow rate and of course the direction and temperature of the air flows within the camera. These data results were used to make predictions of how the new design would perform. Based on the simulated model, a number of five design iterations were used to improve the cooling concept, finally resulting in the optimal design.
Having successfully completed the Knowledge Transfer Project, Grass Valley Netherlands BV have now been able to make FloEFD an integral part of their product development process.
Acknowledgements:Grass Valley www.grassvalley.com B.V. Ingenieursbureau H.E.C.: www.hecbv.nl M2i (Material Institute for Innovation): www.m2i.nl
32 mentor.com/mechanical
Multi - Physics takes off with Avio
Avio's Multi-Physics Co-Simulation
Approach for Reducing Fuel Consumption in
Aero Engines.
M
32 mentor.com/mechanical
odern aero-engine development is driven by a number of factors and requirements, but probably none greater than the
requirement to increase overall efficiency. This is largely due to environmental concerns and the ever more stringent emission targets that result, as well as a desire to insulate operators from rises in fuel costs through reduced consumption.
High turbine efficiency is a critical factor in ensuring these demands are met, yet the turbine is a component which must operate reliably at extremely high rotational speeds at a range of ambient temperatures (40°C on the tarmac to -60°C at cruising altitude isn't unusual) and velocities during a complete flight mission-profile. The exhaust gases flowing through the turbine will themselves likely be at several hundred degrees Celsius. An important consideration in the design of an efficient turbine is the clearance between the fixed and rotational sections. Specifically, this clearance should be minimized. What makes this a particular challenge is the fact that, if not actively controlled, the clearance would change during a flight profile with the
expansion of components because of the operating temperatures noted above. An effective cooling strategy is therefore critical in order that efficient operation is possible throughout the entire operating range. To put this in perspective, the diameter of an aerospace turbine is often greater than 1 meter, while the required clearance might be less than 0.5mm.
This extreme design challenge can only be accurately and reliably met when the engineer is in a position to consider the entire system and its physics; fluid dynamics, thermal effects, and structural deformations must be considered together in a multi-physics approach that gives the designer access to the entire picture.
The Multi-Physics ApproachThe numerical multi-physics approach by Avio Group in Italy described here is an automatic procedure developed by Avio with the help of EnginSoft sPA. The approach is capable of managing the operation and data transfer of three different commercial software tools:
• MSC.P-thermal: Thermal solver used
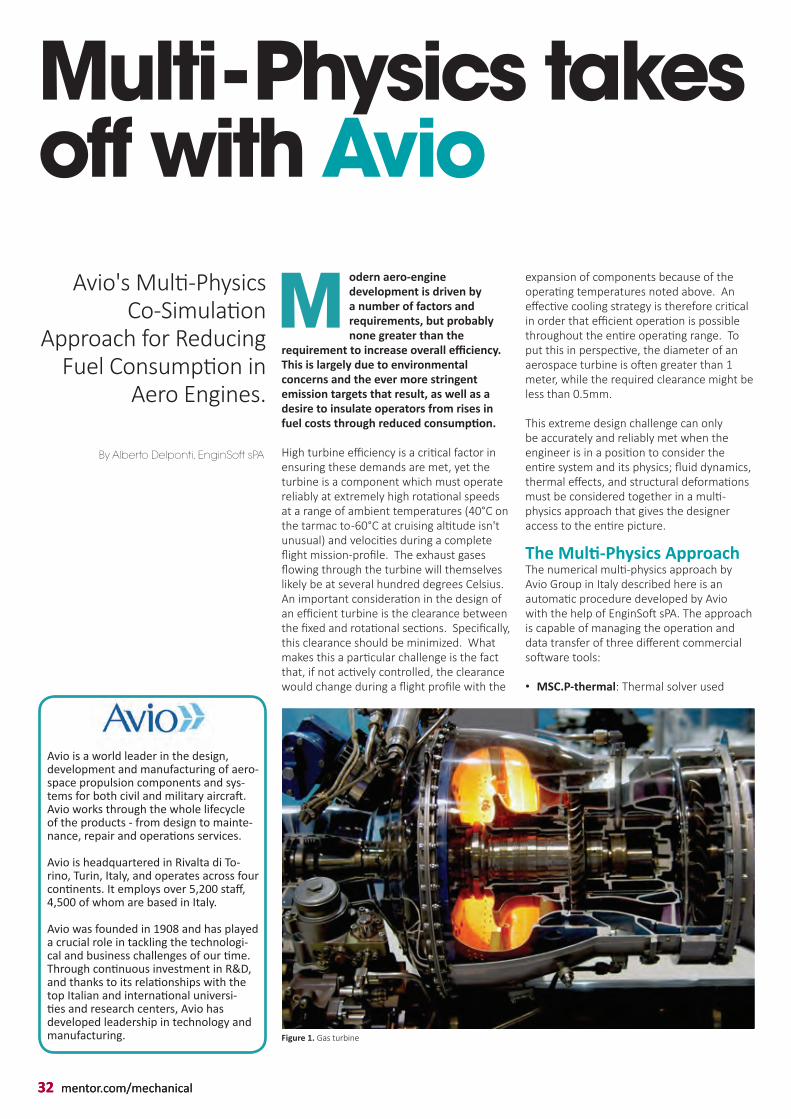
Figure 1. Gas turbine
Avio is a world leader in the design, development and manufacturing of aero-space propulsion components and sys-tems for both civil and military aircraft. Avio works through the whole lifecycle of the products - from design to mainte-nance, repair and operations services.
Avio is headquartered in Rivalta di To-rino, Turin, Italy, and operates across four continents. It employs over 5,200 staff, 4,500 of whom are based in Italy.
Avio was founded in 1908 and has played a crucial role in tackling the technologi-cal and business challenges of our time. Through continuous investment in R&D, and thanks to its relationships with the top Italian and international universi-ties and research centers, Avio has developed leadership in technology and manufacturing.
By Alberto Delponti, EnginSoft sPA

mentor.com/mechanical 33
for the computation of the temperature distribution in the solid structure;• MSC.Marc: Deformation analysis tool used for the computation of solid structure deformation;• Flowmaster® from Mentor Graphics: System level fluid-dynamic solver used for the computation of the flow field through the gas turbine.
The multi-physics simulations carried out are driven by a specific FORTRAN library implemented into MSC.P-thermal. The FORTRAN library manages the co-simulation by invoking the fluid-dynamic solver (Flowmaster) and the deformation analysis software (MSC.Marc) when required. In particular, the call to Flowmaster is managed by a coupling interface procedure implemented ad hoc in Visual Basic. The coupling interface manages the data transfer
Aerospace
Figure 4. Flowmaster network for the system level fluid-dynamic simulations
Figure 3. Results of an integrated multi-physics simulation of the entire engine mission: clearance (%)
between the two codes and manages the fluid-dynamic simulation in all its parts by setting component and simulation data, running it and exporting the results.
System Level Simulations To guarantee the required design accuracy, the entire system needs to be modeled, integrating rotor and static systems of the entire turbine. In particular, all secondary air systems, cooling circuits, active clearance control devices and the main flow path were considered in this system level analysis.The simulation of the entire engine mission had
to consider idle, take off, cruise, approach and landing phases. A complete simulation lasts about one week and requires about 5000 Flowmaster simulations and about 3000 deformation analyses. All simulations and data transfer are automatically controlled and managed by the thermal solver through the automatic interface procedure as described above.
ConclusionsAvio's implemented numerical multi-physics approach has been validated and was able to achieve a better understanding
of the thermal behavior of the turbine during the entire engine mission early in the design phase. This, in turn, allowed them to define the optimal geometries, materials and cooling mass flows for active clearance control. In the final analysis, the implemented multi-physics integrated approach described here, when used early in the design phase, allows the definition of the optimal clearances capable of achieving high efficiency and, as a consequence, a reduction in fuel consumption. A fundamental consideration with respect to meeting future aerospace emission limits.
Figure 2. Integrated multi-physics approach

34 mentor.com/mechanical
Experimentation & Simulation: A Winning Combination
lowmaster has come a long way since its earliest incarnations. A direct descendant of the world's first transient hydraulic pressure
surge simulation tool (HYPSMOP, Flowmaster was actually created by the same development team), Flowmaster was initially focussed on the water industry and addressing the water hammer issues they faced on shipping water over long distances. Since then, it has grown in sophistication and scope to the point where it can now handle transients in compressible systems and heat transfer within the system under consideration as well as to and from the surrounding environment. The result is that Flowmaster has spread across a range of industries from aerospace to automotive and chemical process to shipbuilding.
This pan-industry appeal is in large part due to the emphasis in Flowmaster on allowing users to modify and adapt the code as they require. This philosophy, cemented in V7, allows users to create control scripts, import performance data and even code their own components. Whether or not users choose to take advantage of the full
range of customization options available, this approach leads to a code which is well suited for adoption in new fields and operating regimes not normally considered a traditional Flowmaster area.
When considering what numerical tool they would use to complement an experimental program investigating pulsating flows, these considerations played large in the minds of Professor and Project Co-ordinator, Mara Reis at the Brazilian university, PUC Minas. The practicability of this philosophy is underpinned by the knowledge that Creative Solutions, Brazil and South America's Flowmaster representative, has a strong track record in successfully applying Flowmaster to complex industrial applications.
Pulsatile flow, one which exhibits periodic variations from the mean, is an area of great practical interest but has relatively poor coverage in literature. PUC Minas, which has been voted the top private university in Brazil no less than four times, is currently engaged in a program of work which aims to redress this balance by combining experimental and simulation techniques to
By John Murray, Mentor Graphics
Flowmaster allows users to modify and
adapt code to create control scripts,
import performance data and even
code their own components
F
Figure 1. Flowmaster network of the experimental setup
Learn about the effects of Water Hammer on Page 48

mentor.com/mechanical 35
develop a theoretical model for pulsating flow through a restriction. The research is funded by the Mechanical Engineering Department of the university, underpinning its commitment to investigate real world fluid dynamic concerns: orifice type flow-meters are widely used in industry and the determination of the dynamic behavior of the flow through orifice plates using numerical and experimental methods, will provide information about the possibility of using this meter to accurately determine fluid dynamics in different areas of engineering.
This theoretical methodology, as encoded in a bespoke Flowmaster component, will be validated against experimental readings for global parameters such as pressure gradients at different flow rates and conditions. Research – by its very definition – implies pushing boundaries a little. "The trick," says Professor Mara Reis, "is ensuring the risks are minimized as much as possible."
The Flowmaster network needs to be as close a digital facsimile of the test rig as possible. Through judicious use of Flowmaster's standard components and controllers, it's possible to establish a system that matches what is seen in the laboratory.
At the test section, a reciprocating piston acts as a pulse generator on top of the mean flow. The resulting pressure pulses can be calibrated against the known inputs to help
understand the flow features.The underlying steady state flow is shown as Qo, onto which is superimposed a sinusoidal flow, Qp(t). By measuring the pressure across the orifice plate it will be possible to judge the effect of the sinusoidal pulse on the discharge coefficient of the orifice plate. This understanding can be converted into a numerical correction which can be applied to such devices on encountering pulsatile flows in service.
The research is still at an early stage, but the end result will be an excellent example of how the experimental method can work hand in hand with modern simulation tools to expand our knowledge of interesting flow phenomena and enhance our ability to account for it in practical applications.
Research
Figure 2. Single pulse flow
Figure 3. Flow dynamics deasurement system
"When embarking on a piece of work like this, you need to know and trust the software you'll be using. In that sense, Flowmaster ticks a lot of boxes: its heritage as a transient solver is without peer and its set up to allow us to create our own models and really enhance the code for our own particular application. On top of this, at any stage of the process we know that we'll be supported by engineers with the knowledge and experience to help us get to where we need to be."Professor Mara Reis, PUC Minas
With thanks to PUC Minas and Creative Solutions; Flowmaster's value added reseller for South America. For more information contact:Guilherme Tondello email: [email protected] Tel: (+)55 48 3717-5001

36 mentor.com/mechanical
The Family Business: How to be a World Champion
ost sporting events can be broken down to simple phrases that belie the effort and skill and dedication
required to perform them in any meaningful sense: "defend yourself at all times"; "get the ball in the back of the net"; "get to the bottom faster than everyone else". Expanding the latter even a little and the picture begins to get substantially more complicated. The ability to beat the competition is going to be a function of physical conditioning, technique (lest all your conditioning be wasted) and finally how well fitted your equipment is to you and the task at hand. When fractions of a second can cover the whole field, two out of the above three isn't going to be good enough. Now consider that any one of them is a topic that can – and does – fill volumes of research by itself.
When considered in this light, it doesn't seem accurate for any sport, let alone the Skeleton, to be considered an individual event in any meaningful sense. So it is that Kristan Bromley relies heavily on the help and support of a number of people to keep him at the sharp end of a sport that affords little room for error, somewhere he's been for an impressive 13
years. Gym sessions are monitored closely by a dedicated conditioning coach and followed up by intense physiotherapy to help his body recover in time for the next session. Push track sessions are assisted by sports psychologists and more coaching staff all aiming to ensure that the gains made in the punishing fitness and strength sessions are converted to shedding the fragments of time that make for medals.
But Skeleton is very much a family affair for Kristan: his fiancée is current world champion and fellow Bromley development rider, Shelley Rudman, and Bromley Technologies was co-founded with brother, Richard. Making a family enterprise work is a notoriously delicate process, but get it right and the pay-off is far greater than a bit of mutual understanding over the number of evenings or weekends sacrificed, or gym bags full of laundry generated. The depth of understanding and sometimes brutal honesty that can exist between people who are close can of course lead to explosive disagreements, but when managed correctly there exists a structure that lends itself to quick decision making and the basis of a powerful and committed support network.
Kristan Bromley relies heavily on the help
and support of a number of people to
keep him at the sharp end of a sport that
affords little room for error
M
The Bromley Family (left to right) daughter Ella, Kristan Bromley, fiancée Shelley Rudman, mother Mavis, brother Richard and father Ray.

mentor.com/mechanical 37
Sports Engineering
Richard Bromley has been shouldering the burden of taking feedback from Kristan as a development rider and converting it and test and simulation data in to faster sleds for 14 years now. However, this focus is as much about a dedication to Bromley Technologies as it is about getting his brother on to the top step of the podium, and Kristan wouldn't have it any other way "Shelley and I are development riders for Bromley. It's more accurate to think of us as being sponsored by Bromley Technologies, rather than it working for us." This subtle distinction between having a brother and a shared company working for you and your medal ambitions and you being one of the test pilots for that same company is a very important one. The former set up could quickly become self-absorbed, irrelevant and ultimately insolvent, while the latter can thrive on the competitive spirit and in fact be more competitive precisely because it has broadened its outlook.
That's certainly how Kristan sees it "The success [Shelley and I have had] is down to maintaining a focus on finding a competitive edge through the innovation in our products."Thus the wheel of innovation turns for Bromley: the risk taking on the part of the development riders generates success on the track for Bromley equipped riders, which in turn generates new business for the
company and therefore the ability to invest in further innovation. Bromley Technologies is supported by its development riders who work on behalf of their customers, a job best accomplished by trying to claim the top step of the podium themselves. Considered in these terms, it's difficult to know if it's more accurate to say that the success of Kristan and Shelley on the track is due to their relationship with Bromley Technologies, or that Bromley Technologies is a successful venture due to the ambitions of its development riders. It may even be that this blurring over who is offering the support to who is the greatest success of the Bromley brothers story.
The Road to Sochi 2014Engineering Edge caught up with Richard Bromley to ask how the recent test session in Norway went for the team."Norway was mainly about aerodynamic testing" explains Richard "the last 1/3 of the track is pretty fast and we know it so well that we can then separate out the aero gains from any other factors." This is ahead of St. Moritz World Championships the longest track on the circuit where aero gains are a major consideration. "We know our baseline CFD model matches well with the wind tunnel data, so we can have confidence that the trends we see in simulation as a result of any enhancements are genuine ones."
And so it proved to be in Norway, with each enhancement demonstrating an incremental improvement in performance. Such testing is about more than simply re-enforcing confidence in simulation though (although the author feels obliged to say that the CAE engineer who loses their sceptical side is on a slippery slope; no pun intended). One thing CFD can't do is predict how a given chassis modification will feel to the athlete, "the CFD will only tell us what's aerodynamically more efficient, but we also need to know how the resultant changes affect the athlete: they need to be able to hold their position or control the sled comfortably for it all to be worthwhile."
It's back to HQ now to post-process the results further, ensuring that every last bit of data is extracted from the hard weeks put in on the track, before adding the results to the already considerable library built up on their home track.
The XXII Olympic Winter Games
� 6850 Olympic and Paralympic athletes from 33 nations will compete in the 16 day event� The Winter Olympic Games are made up of 15 sport disciplines of seven sports including Biathlon, Bobsleigh, Curling, Ice Hockey, Luge, Skating, and Skiing� The Paralympic Games are made up of 1350 athletes competing in Alpine Skiing, Biathlon, Cross-Country Skiing, Ice Sledge Hockey, and Wheelchair Curling� Bobsleigh is a winter sport invented by the Swiss in the late 1860s in which teams make timed runs down narrow, twisting, banked, iced tracks in a gravity-powered sled� Skeleton racing involves plummeting head-first down a steep and treacherous ice track at 90mph on a tiny sled. It is considered the world's first sliding sport� Curling is also known as 'The Roaring Game', it's nickname originating from the rumbling sound the 19.96kg granite stones make when they travel across the ice� The ringing of cow bells during downhill skiing stems from the French tradition of scaring off the abominable snowman ( l'homme terrible de froid) rumored to wander snow covered mountain valleys
Bromley Technologies Founders: Kristan Bromley (left), & brother Richard Bromley (right)
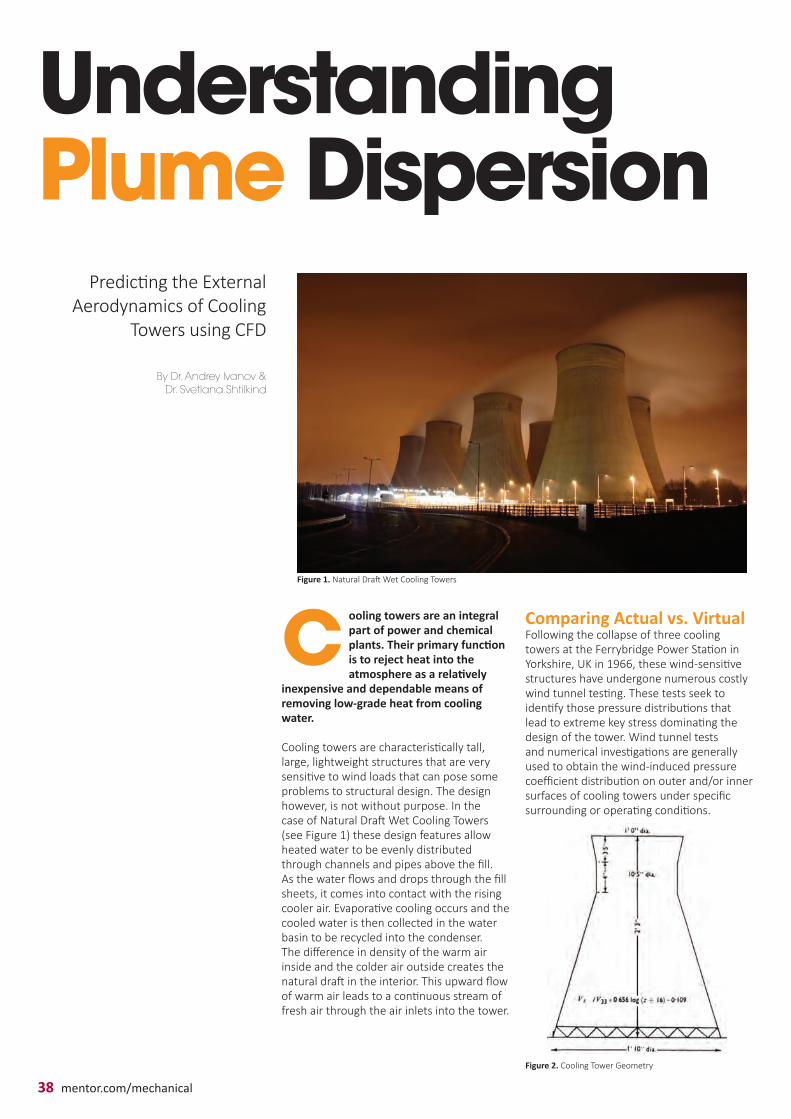
38 mentor.com/mechanical
Understanding Plume Dispersion
Predicting the External Aerodynamics of Cooling
Towers using CFD
ooling towers are an integral part of power and chemical plants. Their primary function is to reject heat into the atmosphere as a relatively
inexpensive and dependable means of removing low-grade heat from cooling water.
Cooling towers are characteristically tall, large, lightweight structures that are very sensitive to wind loads that can pose some problems to structural design. The design however, is not without purpose. In the case of Natural Draft Wet Cooling Towers (see Figure 1) these design features allow heated water to be evenly distributed through channels and pipes above the fill. As the water flows and drops through the fill sheets, it comes into contact with the rising cooler air. Evaporative cooling occurs and the cooled water is then collected in the water basin to be recycled into the condenser. The difference in density of the warm air inside and the colder air outside creates the natural draft in the interior. This upward flow of warm air leads to a continuous stream of fresh air through the air inlets into the tower.
Comparing Actual vs. VirtualFollowing the collapse of three cooling towers at the Ferrybridge Power Station in Yorkshire, UK in 1966, these wind-sensitive structures have undergone numerous costly wind tunnel testing. These tests seek to identify those pressure distributions that lead to extreme key stress dominating the design of the tower. Wind tunnel tests and numerical investigations are generally used to obtain the wind-induced pressure coefficient distribution on outer and/or inner surfaces of cooling towers under specific surrounding or operating conditions.
C
By Dr. Andrey Ivanov & Dr. Svetlana Shtilkind
Figure 1. Natural Draft Wet Cooling Towers
Figure 2. Cooling Tower Geometry
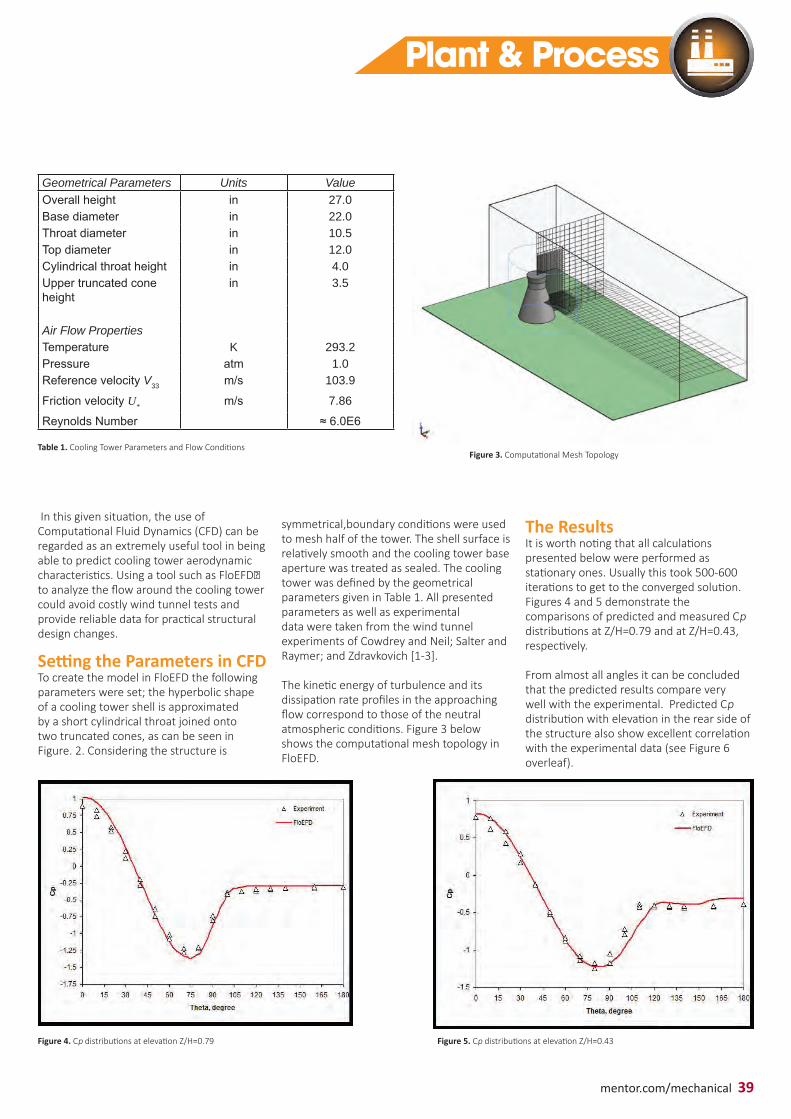
mentor.com/mechanical 39
In this given situation, the use of Computational Fluid Dynamics (CFD) can be regarded as an extremely useful tool in being able to predict cooling tower aerodynamic characteristics. Using a tool such as FloEFD� to analyze the flow around the cooling tower could avoid costly wind tunnel tests and provide reliable data for practical structural design changes. Setting the Parameters in CFDTo create the model in FloEFD the following parameters were set; the hyperbolic shape of a cooling tower shell is approximated by a short cylindrical throat joined onto two truncated cones, as can be seen in Figure. 2. Considering the structure is
Plant & Process
Geometrical Parameters Units ValueOverall height in 27.0Base diameter in 22.0Throat diameter in 10.5Top diameter in 12.0Cylindrical throat height in 4.0Upper truncated cone height
in 3.5
Air Flow PropertiesTemperature K 293.2Pressure atm 1.0Reference velocity V33 m/s 103.9
Friction velocity U* m/s 7.86
Reynolds Number ≈ 6.0E6
Table 1. Cooling Tower Parameters and Flow ConditionsFigure 3. Computational Mesh Topology
symmetrical,boundary conditions were used to mesh half of the tower. The shell surface is relatively smooth and the cooling tower base aperture was treated as sealed. The cooling tower was defined by the geometrical parameters given in Table 1. All presented parameters as well as experimental data were taken from the wind tunnel experiments of Cowdrey and Neil; Salter and Raymer; and Zdravkovich [1-3].
The kinetic energy of turbulence and its dissipation rate profiles in the approaching flow correspond to those of the neutral atmospheric conditions. Figure 3 below shows the computational mesh topology in FloEFD.
The ResultsIt is worth noting that all calculations presented below were performed as stationary ones. Usually this took 500-600 iterations to get to the converged solution. Figures 4 and 5 demonstrate the comparisons of predicted and measured Cp distributions at Z/H=0.79 and at Z/H=0.43, respectively.
From almost all angles it can be concluded that the predicted results compare very well with the experimental. Predicted Cp distribution with elevation in the rear side of the structure also show excellent correlation with the experimental data (see Figure 6 overleaf).
Figure 4. Cp distributions at elevation Z/H=0.79 Figure 5. Cp distributions at elevation Z/H=0.43
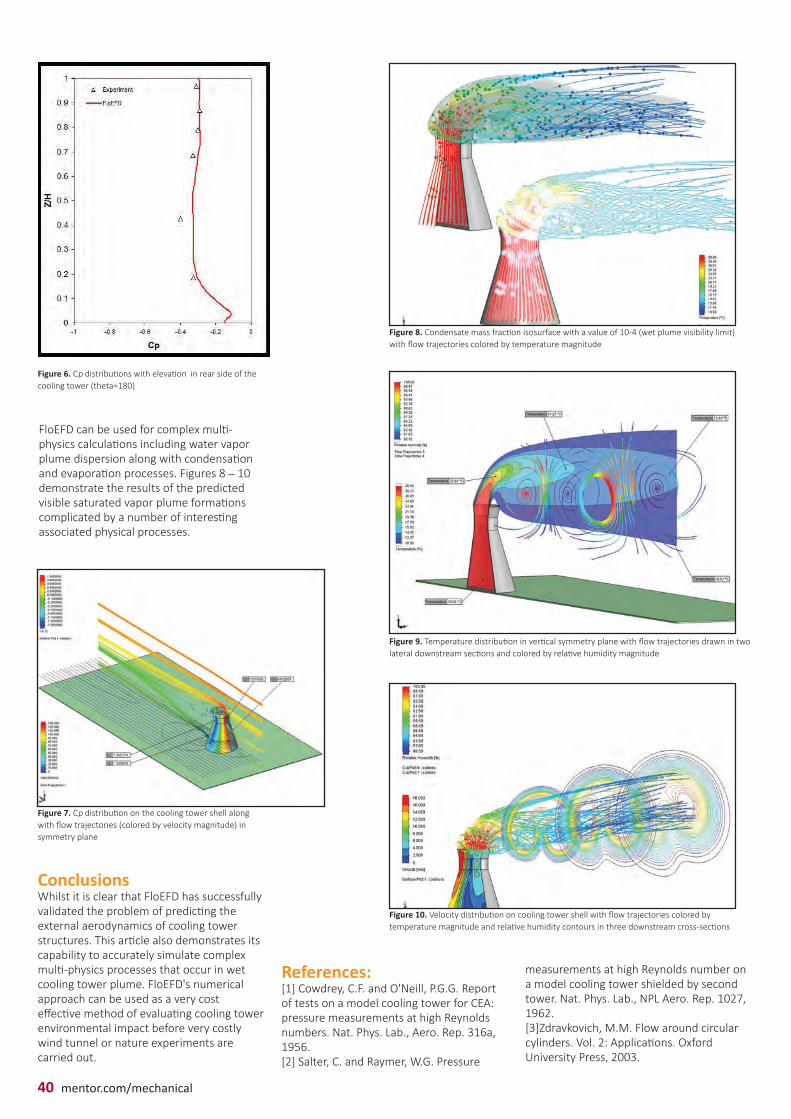
40 mentor.com/mechanical
Figure 6. Cp distributions with elevation in rear side of the cooling tower (theta=180)
Figure 7. Cp distribution on the cooling tower shell along with flow trajectories (colored by velocity magnitude) in symmetry plane
Figure 8. Condensate mass fraction isosurface with a value of 10-4 (wet plume visibility limit) with flow trajectories colored by temperature magnitude
Figure 9. Temperature distribution in vertical symmetry plane with flow trajectories drawn in two lateral downstream sections and colored by relative humidity magnitude
Figure 10. Velocity distribution on cooling tower shell with flow trajectories colored by temperature magnitude and relative humidity contours in three downstream cross-sections
FloEFD can be used for complex multi-physics calculations including water vapor plume dispersion along with condensation and evaporation processes. Figures 8 – 10 demonstrate the results of the predicted visible saturated vapor plume formations complicated by a number of interesting associated physical processes.
ConclusionsWhilst it is clear that FloEFD has successfully validated the problem of predicting the external aerodynamics of cooling tower structures. This article also demonstrates its capability to accurately simulate complex multi-physics processes that occur in wet cooling tower plume. FloEFD's numerical approach can be used as a very cost effective method of evaluating cooling tower environmental impact before very costly wind tunnel or nature experiments are carried out.
References:[1] Cowdrey, C.F. and O'Neill, P.G.G. Report of tests on a model cooling tower for CEA: pressure measurements at high Reynolds numbers. Nat. Phys. Lab., Aero. Rep. 316a, 1956.[2] Salter, C. and Raymer, W.G. Pressure
measurements at high Reynolds number on a model cooling tower shielded by second tower. Nat. Phys. Lab., NPL Aero. Rep. 1027, 1962.[3]Zdravkovich, M.M. Flow around circular cylinders. Vol. 2: Applications. Oxford University Press, 2003.

mentor.com/mechanical 41
Interview
The prestigious Harvey Rosten Award For Excellence was won by Andras Poppe, Mentor Graphics' Product Marketing Manager for MicReD® (Microelectronics Research and Development) group and faculty member at the Budapest University of Technology, Department of Electronic Devices
What does this award mean to you?Obtaining this award is a great honor. Especially as the decision is made by a group of highly acknowledged international thermal experts who have deep knowledge, wide over-view of electronics cooling and thermal man-agement, and they have a good overview of novelties published in the technical literature. Having been considered for this award by these experts is in itself already an honor.
Which of the previous winners do you most admire and why?Marta Rencz and Vladimir Szekely won the award in 2001, they were my professors when I began my career. Since then I have worked closely with Marta and Vladimir and have learnt a lot from both of them. In particular, they have taught me the importance of being precise, diligent, finding and emphasizing the essential parts of problems, and considering issues from different angles. Dirk Schweitzer is another Harvey Rosten Award winner whom I also admire.
How did you become an electrical engineer?Originally I thought I should become a physicist as my mother is a physicist; she was the head of the optical testing laboratory of TUNGSRAM (today: GE Lighting Europe). I spent a lot of time during my summer holidays among the integrating spheres in the dark room of her lab. I always liked physics. As every boy, I loved model railways, even to-day model railways, especially vehicles running on Hungarian rails are my favourite collector's items. Before finishing secondary school, where I was already specializing in physics, engineer-ing became very attractive, especially as pro-grammable calculators had just come out.
ensures that product data sheets are widely recognized and understood. This results in a fair comparison of products.Why has the LED become so important?Today energy conservation has become a major issue – all wasted energy is a contributor to global warming. So saving energy by any means possible is very important, especialy if that sav-ing results in less direct heating of the environ-ment reduced CO2 emission or the reduction of the number of uranium nuclei which need to be subject of fission in nuclear power plants. Lighting represent about 25% of energy consumption; if this energy usage could be reduced, it will be a significant contribution towards a sustainable economy. In the last dec-ade LEDs have evolved a lot and now they are by far the most energy efficient light sources. Compared to the 5% energy conversion ef-ficiency of conventional incandescent bulbs the best white LEDs are approaching an efficiency of 50% - these are figures which speak for themselves.
What are the challenges for the future of Power LEDs?The challenges are: even higher power, even higher power density, even bigger lighting mod-els and better models to be able to simulate them without having to build a LED luminaire prototype. What we do at Mentor Graphics in this domain helps the solid state lighting industry. And I also do hope that the academic research regarding LEDs that I am involved in at the Budapest University of Technology and Economics also will have a positive impact both on the work of MAD, especially the MicReD team and on the global technical community of the SSL industry.
First I started with Sinclair's 4 digit calculator (not yet programmable) using Polish arithmet-ics. Then a TI-57 calculator which could memo-rize 44 numbers or program steps. I remember two of my school friends and I, together with our maths teacher, started a competition to see who could write the short-est code that could determine if an integer was a prime. It became clear that programming was something which excited me a lot and at that time the best way to learn computing was to become an electrical engineer.
How did you become interested in LED lighting?In 2003 colleagues from Lumileds asked us to measure some of their Luceon Emitter samples – one of the first power LEDs. With Gabor Farkas we did thermal transient measurements of these Luexeons at different ambient temperatures and at different forward current levels. We discov-ered something we found odd: the obtained structure functions were all different, though nothing in the measured physical structure had changed. We began looking for explanation. We deduced that one possible reason for the observed change was the current and tempera-ture dependent energy conversion efficiency of LEDs. We decided that the emitted optical power of LEDs had to be measured and had to be considered in the calculation of the thermal impedances. My mother put us in touch with some former colleagues that were active in photometry. That's how we established our relationship with professor Schanda's team of the University of Pannonia and Lighting Metrics both in Hungary, and Kathleen Murray at Inphora in the US. Within a few months with MicReD, Budapest University of Technology and Economics, University of Pannonia, Light-ing Metrics and Inphora, we established the 'TERALED' consortium and obtained a research and development grant from the Hungarian Na-tional Committee for Technology Development. The development was also officially called 'TERALED' which we started using as a trade name in marketing, back in 2004. In two years we developed the test setup which is known today as TeraLED® and in December 2005 we shipped the first unit to a major European LED manufacturer.
You've contributed massively to the JEDEC standards, what importance do you believe they play in the future of electronics?Standards help the industry and end-users of products. They define commonly understood specifications which can be implemented by anybody. With regards to the thermal testing standards that I have been involved with, this is the definition of test procedures, environ-ments and definitions of thermal metrics which correctly define the thermal characterization of an electronic component. Having the test con-ditions, procedures and metrics standardized,
Harvey Rosten Award
The prestigious Harvey Rosten Award For Excel-lence was established by the family and friends of Harvey Rosten.
The Award commemorates Harvey's achieve-ments in the field of thermal analysis of elec-tronics equipment, and the thermal modeling of electronics parts and packages. Its aims are to encourage innovation and excellence in these fields.
For more information visit: www.rostenaward.org

42 mentor.com/mechanical
Hot Lumens of Street Lighting LEDsHow physical testing and CFD analysis helped develop new LED-based street lighting luminairesBy Andras Poppe, Product Manager, Mentor Graphics
owadays in most lighting applications, Light-Emitting Diodes (LEDs) are by far the most efficient light source, since they turn supplied electrical
energy into useful light, producing much less energy loss in the form of heat than any other conventional light source. Compact fluorescent light bulbs were designed to take over the role of incandescent bulbs but in recent days white LEDs, with about 40% energy conversion efficiency, are the favored choice to replace old bulbs.
Having said this, even the small amount of heat generated by LEDs can cause problems if not properly conducted away and dissipated to the environment. A significant temperature elevation of the LED chip occurs, resulting in reduced light output and a shortening of shelf life. Therefore proper cooling of LEDs is key to maintaining the high lumen output and long life of these light sources.
In applications such as the headlights of cars or street lighting, where safety is paramount, lighting standards are very strict. In addition to the prescribed spatial distribution patterns that are required, illumination
levels also need to be provided consistently; for example, even on hot summer nights, luminous flux of LED-based luminaires must meet the strict lighting standards. This necessitates having the appropriate knowledge about the thermal and light-output properties of LEDs.
With this knowledge available, solid-state lighting (SSL) designers who consider thermal properties in their LED based design are more likely to produce luminaires with long-term consistent light output that have a longer operating life.
The Latest Testing StandardsFrom a semiconductor standpoint, LEDs are simple pn-junctions, so it would seem that they should be easier to measure, when in actuality they are not. Light emission must be considered when measuring the LED's thermal resistance, as a significant proportion (30 - 40%) of the supplied energy is converted into light.
Based on these efficiency figures, if the supplied electrical power rather than the correct (heating) power is used to calculate the package's thermal resistance, the thermal resistance value would be
N
Figure 2. Simulated LED junction temperature and hot lumens for a street lighting luminaire as provided by FloEFD [4]

mentor.com/mechanical 43
Figure 1. Component level physical testing and system level simulation flow for LED based designs
Figure 3. Overall CFD simulation results of an LED based street lighting luminaire as provided by FloEFD [4]
significantly lower, suggesting that the package (of a less efficient LED) would be far better at dissipating the heat generated in the LED than it actually is. Therefore JESD51-51, one of a series of the latest LED thermal testing standards, requires that consideration be made to the emitted optical power when measuring LEDs' thermal resistances. The emitted optical power along with other light output characteristics of an LED (like luminous flux, color, color temperature) can be precisely measured in a CIE 127-2007-compliant total-flux measurement environment. Using the optical power figure obtained this way allows for the calculation of the real thermal resistance if thermal testing of the LED in question is performed in a combined thermal and radiometric/photometric test setup such as that of the Mentor Graphics T3Ster® Transient Thermal Characterization and the TeraLED® total flux measurement solution.
In the TeraLED system the temperature of the LED under test can be precisely set to a desired value by a temperature-controlled cold plate. Such a measurement setup is also suggested by one of the recent LED thermal testing standards, JESD51-52, which provides guidelines on methods to measure LED light output in connection with LED thermal
measurements. As for the thermal characteristics of LED components, the junction-to-case resistance is the most appropriate metric for packaged LEDs. This is because it characterizes the heat flow path from the point of heat generation at the pn-junction down to the bottom of the case – exactly how LED packages are designed to be cooled. A relatively new standard, JEDEC JESD51-14, for junction-to-case thermal resistance measurement, is based on the latest thermal-transient measurement techniques.
This method uses a dual-interface approach in which the thermal resistance of the part is measured against a cold plate with and without thermal grease. The junction-to-case resistance is determined by examining where the two measurements differ. Very high measurement repeatability is required because the thermal impedance curves for the two measurements must be identical up to the point where the heat starts to leave the package and enters the thermal interface between the package and the cold plate. This ensures that the point where the curves deviate is clear. This method, combined with the LED thermal testing standards provides the real junction-to-case thermal resistance for LED packages.
Comprehensive Solutions for LED CharacterizationThe Mentor Graphics T3ster Transient Thermal tester uses a smart implementation of the static test version of the JEDEC JESD51-1 electrical test method that allows for continuous measurement junction temperature transients. This also forms the basis of the JESD51-14 test method for the junction-to-case thermal resistance measurements which is also the preferred test method in the LED-specific thermal measurement guidelines provided in the JESD51-51 standard. The combination of T3Ster and TeraLED systems provide a comprehensive solution for LED testing which meets the requirements of all the mentioned standards. See Figure 1.
LED Lighting

44 mentor.com/mechanical
The T3Ster Master Program is post-processing software that fully supports the JESD51-14 standard for junction-to-case thermal resistance measurement, allowing the temperature versus time curve obtained directly from the measurement to be re-cast as 'structure functions' (described in JESD51-14 Annex A [1]), and then automatically determine the junction-to-case thermal resistance value.
Because the JESD51-14 methodology yields the junction-to-case thermal resistance, as a 'side product', the step-wise approximation of the structure function up to this thermal resistance value provides the dynamic compact thermal model of the LED package automatically. The identified junction-to-case thermal resistance values may be published on the product datasheet, and the automatically generated dynamic compact thermal model of the LED package can be applied directly in CFD analysis software such as Mentor Graphics FloTHERM® and FloEFD™ tools as shown in Figure 1.
The combination of the light output measurement (performed with equipment such as TeraLED), and thermal transient testing allows measurement of the light-output characteristics as a function of the temperature. Providing this data as a function of the reference temperature of the cold-plate is useful information for SSL designers to correlate light output to temperatures of test points of the luminaires they develop. But the same data is also available as a function of the LEDs' junction temperature, which is required for the correct physical modeling of the light output of LEDs. In other words, the obtained luminous flux – junction temperature relationship is the basis of hot lumen calculations.
The latest quantum leap in test based modeling of LEDs' characteristics was realized recently by the introduction of the hot lumen modeling feature in the LED Module of the FloEFD simulation tool. In the usual forward current and junction temperature operating ranges of today's high power LEDs, when the LEDs are driven by a constant forward current the temperature dependence of the luminous flux can be well modeled by a linear relationship in the temperature range of interest. The parameters of the required formula are automatically calculated by the TeraLED View program, the results post processing software of the TeraLED system. The thermal model and the light output model together form a multi-domain LED
model. Such models collected in libraries are handled by FloEFD. When a LED luminaire is designed, the LEDs themselves can be referred to from this library. This way, 'placing' such virtual LED components taken from the model library into the MCAD design of a luminaire, FloEFD delivers the first hot lumen estimates along with key thermal data about the effectiveness of cooling. In other words, the hot lumens of the cool LEDs are obtained early in the design phase.
Success in ApplicationThis component level physical characterization and system level simulation flow was successfully applied in the KÖZLED project [2] in Hungary. The project targeted the development of LED based street lighting luminaires. T3Ster and TeraLED measurements were used to verify LED data sheet information. Measurement results were also turned into FloEFD LED models, so FloEFD simulations could be used to prove quality of the design of the largest member of an LED based street lighting luminaire family. None of the applied LEDs exceeded the critical value of junction temperature and the total output lumens of the LEDs
reached the required level even under the hottest foreseen environmental conditions. Figures 2 and 3 show FloEFD simulation results for the largest luminaire designed in the project.
The success of the integrated T3Ster TeraLED FloEFD solution from Mentor Graphics is proved by the success of the KÖZLED project. The developed LED luminaire family can be found in the recently renovated streets of Budapest and the developed LED street lighting luminaire family received the Product of the Year 2012 by Industorg award in Hungary [3].
References:[1] JEDEC Standard JESD51-14, "Transient Dual Interface Test Method for the Measurement of Thermal Resistance Junction-to-Case of Semiconductor Devices with Heat Flow through a Single Path" [2] www.hungarolux.hu/kozled/index.htm [3] www.termeknagydij.hu [4] MCAD model by courtesy of Optimal Optik Ltd, Hungary, physical characterization by Budapest University of Technology and Economics, Hungary.
Figure 4. Flow of natural convection cooling in street lamp
Figure 5. Natural convection cooling flow to the main body

mentor.com/mechanical 45
ith innovations in energy efficient lighting and power management in electronic systems, Mentor
Graphics has witnessed a surge in interest in the MicReD product line. The types of thermal tests that were previously reserved for experimental laboratories are now becoming day-to-day tasks for the developers of LED luminaires, drive-train controllers and others.
Many users of T3Ster® and TeraLED® rely on these systems being always available and cannot afford for the system to be out-of-commission for any extended period.To meet this need, we are introducing support services for the MicReD products. We will ensure that, in the unlikely event of hardware failure, the system will be restored to working condition in the minimum possible time.
As with any measurement equipment, accuracy is a prime concern. The new services include an annual calibration visit to verify that optimum performance is maintained.
MicReD hardware is generally very reliable, but failures can occur with any electronic device. To make sure that repairs can be completed quickly, we are stocking spares at several locations around the world. To avoid lengthy shipping delays, spares sets will be compact enough so that a local engineer can bring them on site.
W
Introducing Support for Hardware
Ask The CSD Expert
Mentor Graphics Customer Support Division has well-tested systems that track when we were contacted, when we responded, and when we were able to effect the repair. Thus the new support services will be constantly monitored for consistency and effectiveness.
We are excited about introducing these support services which we believe will make our MicReD customers more successful. They will be available worldwide on new MicReD systems starting in February, 2013, and will be expanded to existing systems in the near future. Please contact your local Mechanical Analysis sales office for details, or you can contact me at: [email protected]
Richard WiltonCustomer Support Manager – Mechanical Analysis.
I'm an Electrical and Electronics Engineering graduate of the University of Bristol. Since then I've worked as an electronics designer and in technical marketing before joining Mentor Graphics in 1989 as an Applications Engineer. In 1997 I became a Customer Support Manager and have worked with the Mechanical Analysis Division since 2009.

46 mentor.com/mechanical
Geek HubOur team are
passionate about all things CFD and love sharing their
findings. In this issue, Product Marketing
Manager and prolific blogger, Robin
Bornoff introduces FloTHERM® to a beer
fridge
My boss, Roland, relocated from Germany to the UK a few years ago and has taken to life in England with alacrity. As a gift for the Mechanical Analysis product development department in Hampton Court, he bought a little fridge which had been busy ever since cooling the beer in it that everyone was too polite to drink. Not to cast dispersions on the purchasing power of my boss but
the fridge probably wasn't the most expensive and after a while it stopped working. As any engineer would do, I grabbed a screwdriver and took the thing apart (Figure 1).
The fridge works by cooling a small metal plate embedded in the bottom of the inside of the fridge. This is done using a thermoelectric cooler (TEC) that uses the Peltier effect to suck heat down through it, resulting in a cold upper face and hot lower face. The hot face of the TEC is screwed onto a heatsink which in turn is convection cooled by an axial fan. It looked like the TEC itself had failed. Such low price consumer goods aren't designed to last forever. It's cheap because it uses cheap parts. It breaks and you (or your boss) should buy a new one. Welcome to the disposable society.The classic electronics industry is covered by telecommunications, networking and computing. The primary function of products in those industries rely on electronics. Electronics themselves however have now
M
spread to nearly all industries. This beer fridge was packed full of the sort of electronics you'd find in a PC and, considering its raison d'être is thermal, it is a good candidate for further study using FloTHERM.
I measured up the main constituent parts of the fridge and had created a 3D representation in FloTHERM in just over an hour. What took a little longer was obtaining the characteristic information for the TEC and the fan. Such objects are not modeled explicitly per se, a so called 'compact modeling methodology' is applied where their key physical behavior is retained but without modeling the exact physics of their operations. Thanks to the beauty of Google (other search engines are available) such
Figure 1. Beer Fridge Decomposed

mentor.com/mechanical 47
information was only a part number and spec sheet away. A good simulation methodology involves starting with simple models, making sure the results match your intuition. Good to see therefore that FloTHERM predicted the inside of the fridge to be cold (Figure 2)! The cold however was very localized near the TEC cooled embedded plate. Cold air doesn't tend to rise. I wondered what would happen were the fridge to be on its side or upside down. Simply a case of changing the direction of gravity in FloTHERM (and rotating the results images, Figure 3). We shouldn't get too hung up on studying an empty fridge. An empty fridge, like a TV talent show, is completely useless. Let's stack it full of beer (Figure 4).In this case conduction does a much better job of spreading the cold around. Electronics cooling is as much about getting cold to get in as it is about getting the heat out.Out of all the ways that FloTHERM can be
applied, most FloTHERM simulations fall into two categories; for verification (how hot is it?/is it ok?) and design (how can I make it better). From a design perspective the overall thermal design of the fridge should entail sucking the heat out of the inside of the fridge using the TEC, getting the heat to spread through the heatsink, getting the fan to convect away that heat and for the heat to be carried away to the room.One thing you wouldn't want is for the hot air coming out of the heatsink to be reingested back into the fan. Oh dear... (Figure 5)
Coming up with design changes and seeing what effect they have is really simple in FloTHERM. Once the base model is created
one can easily make modifications to it. In this case I tried out putting some baffling on the underside of the unit to break up the re-ingestion (Figure 6). Colin Chapman is probably spinning in his grave right now. The result was that the TEC was cooled more efficiently, requiring less power to achieve the same internal fridge temperature, 35% less power in fact. A neat example, and one of many, of how FloTHERM can be used to create better designs.
Figure 2. A Locally Cold Bottom
Figure 4. FloBEER is Cool
Figure 3. Side Up and Upside Down
Figure 5. Hot Air Re-ingestion is a Bad Thing
Figure 6. Baffled!
Robin BornoffProduct Marketing ManagerMentor Graphics

48 mentor.com/mechanical
Robust design for all eventualitiesStuart Ord of CEDCS shares some of his 30 year experience in chemical plant safety
T he science of probability is famously a counter-intuitive one, the domain of mathematicians and the occasional source of interesting
pub-wisdom. However, in assessing chemical plant safety it's important to realise that history is littered with many examples of the improbable occurring. Stuart Ord of CEDCS, has over 30 years experience in process engineering with companies such as ICI and British Nuclear Fuels Limited (BNFL). Now working as an independent consultant, his focus on hazardous operations and safety integrity gives him a unique perspective on the importance of understanding fluid system transients in the design and operation of a plant.
"Many people make the mistake of assuming that the likelihood of two things going wrong at the same time are so remote as to not being worth bothering with" states Stuart. "Yet a look at the histories of any of the major incidents of the last 30 years indicates that it's usually a combination of two or more individually unlikely events that ultimately leads to the disaster." "A hazard study is a systematic review of what can go wrong with a plant. It relies on the experience and judgement of the people in the room, their ability to visualize the
system under consideration and think about the ways in which it may diverge from its designed operation is vitally important."
A world in which the average cell phone is more powerful than the guidance computer used by the Apollo 11 mission affords the engineer a more convenient way of assessing and understanding the impact of any such planned or unplanned divergence. What it doesn't do is remove the engineer from the loop altogether. "'High flow', 'low flow' and 'high and low pressure' are phrases always used in hazard study checklists," explains Stuart "but I've never seen the word 'surge' explicitly stated as a possible cause for any of these. It's up to the engineer to both understand when water-hammer may be a consideration and also to identify the likely causes of such an event."Water hammer is the pressure surge that can occur when a fluid undergoes a sudden change in momentum. Typical causes of such a change might be a pump trip or start-up, or a valve closure, but other causes are possible as well.
While it is often possible to identify the types of network that are likely to be susceptible to water-hammer (typically, networks with long pipe lengths, high fluid velocities or large changes in elevation are prime suspects), it's not always immediately intuitive that
there could be an issue. Furthermore, assessing the impact of an event isn't always as simple as looking at the peak pressure based on a simple Joukowsky calculation. "Joukowsky is certainly a good place to start, but there are cases where a more detailed understanding is required" explains Stuart, and this is where Flowmaster® can offer a helping hand to the engineer, capturing complex interactions from different branches and network components. But it's clear to Stuart that software can only be a tool deployed to assist the engineer, it doesn't replace the need for insight and experience. "I saw a case where an extremely fast acting shut down valve had been proposed for a natural gas system. This was a high pressure system with a short overall length, and the valve was intended to reduce the amount of gas that could escape in the event of an emergency. While this is a sensible and understandable thought process, I was able to show that such valves would, if used, result in a pressure pulse greater than the rated pressure of the pipes themselves. This might have caused a pipe rupture resulting in an uncontrolled and very large gas leak and possible explosion. This is precisely the opposite of what the designers had intended! Most people don't associate water hammer with a gas – but they are both fluids."

mentor.com/mechanical 49
closed at the delivery end and the pump control system fails to shut down one or more of the booster stations. This isn't a case of 'double jeopardy' – it has a common cause, and so is less unlikely than an initial glance might suggest. Understanding the dynamic system behavior via simulation in Flowmaster should be part of the toolkit that helps quantify the degree of redundancy required.
To Stuart, a conceptual understanding of the system is essential, and it's only via this insight that the engineer will be able to ask the right questions of it. The tools available to the modern engineer can assist in that process, not least by reducing the time and money required to analyze a system, but it remains the role of the engineer to ask the right questions and so contribute to the design of a robust and safe system.
Case StudyManzanillo II Thermal Power Plant The Manzanillo II Thermal Power Plant has two 350MW generating units which were scheduled to begin operating in 1988. The condenser cooling water system comprises an inlet channel through which sea water is fed from Cuyutlan Lake to an intake structure. Located in the intake structure are auxiliary cooling water pumps, travelling screens and the two main cooling water pumps. The conduits from the pumps to the condensers are square in cross-section and made of reinforced concrete. A computer analysis had been undertaken, which predicted that under all operating conditions transient pressures would be satisfactorily controlled. During commissioning tests the system was started up and ran satisfactorily, with several starts and stops. However, at 1500 hours on Friday, 27 November 1987, following a violent thump, the top surface of a section of the concrete duct fractured and jets of water sprayed out of the many holes.Immediately prior to this, the circulating water pumps had been operating in their backwashing mode to clean the screens. The valve which controlled the flow to the washers had closed accidentally, initiating a transient, and then the pump had tripped on overload, causing another transient.Reviewing the design for the cooling water system, and the specification for the transient flow analysis, it was realised that the system for backwashing the screens had entailed an amendment to the original design for the cooling water system. This had been introduced after the transient analyses had been undertaken, and no checks were made to see how the modification might affect the transient response of the pipelines.
Taken from Fluid Transients in Pipeline Systems, ARD Thorley, British Library Cataloguing in Publication Data (1991), ISBN 0-9517830-0-9
Even more benign seeming processes like pipe priming can risk unexpected consequences "I remember an occasion where an orifice plate was installed in a pipeline that was usually kept in a de-primed state. This pipeline – which wasn't particularly long – had an orifice plate installed part way along its length designed to reduce the flow rate of liquid chlorine to the downstream tank. The issue I found was that if this pipeline were allowed to fill at the rate the delivery pump would allow, the combination of the empty system with its reduced back pressure and the orifice plate allowing the upstream vapor to vent downstream quite freely, set up a situation where the fluid was rapidly flowing towards what was effectively a nearly-closed valve. Without the installation of a control valve downstream of the pump, the danger was that the resulting water hammer could
fracture the pipe and/or cause it to jump off its mountings."
Such situations illustrate the importance of being able to accurately understand the transient response of systems. This response, particularly where the system has many branches, may not always be intuitive and simply taking the Joukowsky head might not tell the whole picture. "It's not uncommon for elements of systems to be considered in isolation." continues Stuart. "While this isn't necessarily the wrong thing to do, understanding the upstream and downstream boundary conditions is essential. For example, the impact of multiple booster stations running against a closed valve may be far more significant than the predicted Joukowsky peak pressure." In such cases, it's vital both that the hazard study considers the case where the line is
Plant & Process
With thanks to Stuart Ord at CEDCS.www.cedcs.comFigure 1. Ship to shore unloading network: a typical candidate for water hammer analysis

50 mentor.com/mechanical
Brownian Motion...The random musings of a Fluid Dynamicist
If it ain’t broke, fix it until it is!A tribute to tinkering
sometimes wonder if what really separates us from the fauna of this planet isn't language, opposable thumbs or quilted toilet paper so
much as our desire to push boundaries. In fact, I wonder if the first three aren't simply manifestations of this sense of drive. With the possible exception of thumbs, perhaps; you probably can't just will them in to existence. Obviously, this sense of drive can sometimes be a destructive force, and it's certainly the case that the betterment of the global community isn't always at the top of the list when it comes to motivation for stepping in to the unknown. For instance, I can't honestly say that the human race would be any closer to enlightenment had I landed that jump on my push bike in 1988, and I do accept that the resulting overnight hospital stay didn't advance either modern medicine or my parents regard for my judgement. Nevertheless, it seems to me that stepping into the unknown and risk taking are definitely an essential part of the human experience. Red Bull certainly think so: there's little that's occurred more risky than borrowing a library book since 1998 that they haven't had their logo all over.But, I'd like to suggest that pushing the
I
Brownian motion or pedesis (from Greek: πήδησις Pɛɖeːsɪs 'leaping') is the presumably random moving of particles suspended in a fluid (a liquid or a gas) resulting from their bombardment by the fast-moving atoms or molecules in the gas or liquid. The term 'Brownian motion' can also refer to the mathematical model used to describe such random movements, which is often called a particle theory.
envelope doesn't always have to mean taking out expensive life insurance and traveling with a mascot that may well end up being the only thing they pull from the debris. There's another type of dare-devil who – while they may not bestride the world in a star-spangled white jump suit or attract the attention of over-caffeinated marketing executives – nonetheless epitomizes that sense of derring-do that means we're the ones sending probes beyond the solar system and surveying the darkest depths of the ocean: the humble amateur mechanic. The shed or garage is their cathedral and Chuck Yeager would be the guy whose horse stopped him breaking the sound barrier without one (look it up, if you don't know what I'm talking about). To them, the mysteries of two-stroke
combustion can be understood and optimized with nothing more than a trained ear, a hack saw and a face full of blue smoke. The soldering iron is a magic wand in their hands and there is no mass produced item that can't be made faster, lighter, brighter or otherwise bent to their will. The 1980's celebrated these masters of mechanical improvisation via such shows as the A-Team, which begs the question: what would be the 2013 equivalent? MacGyver as an app developer? I can't see Colonel Decker being put to flight by a virtual home-made turnip cannon.
Turbulent Eddy

mentor.com/mechanical 51
In memory of Ravi Kumar MenonRavi Kumar Menon, Director and joint founder of Flowmater Reseller, Aetos Design & Engineering in Bangalore sadly passed away on the 8th February 2013,
aged 45, after a prolonged period suffering from cardiomyopathy.
Ravi was a gentleman and a thoroughly proficient engineer. His professional track record, spanning over two decades, bears testimony to the respect and recognition
he achieved. He was an alumnus to firms such as PTC, ISI Dentsu, Advanced Synergic Microsystems and Pelorus Consulting. His final position as Director for Aetos Design & Engineering saw him at his very best, continually bringing in and deploying fresh ideas and technologies into India. As a key strategist, he continuously motivated his team to work diligently and strive for improved results.
Ravi was very much a people person. One meeting with him, and you would feel like you had known him for many years. Ever friendly and compassionate, he always brought a smile into the
conversation. A foodie by heart, his interests included music and reading. He was most passionate about cars and was always on the lookout for technological advancements in the field.
Ravi was known and respected by many of us at Flowmaster and Mentor Graphics as a personable and genuinely nice man, and a true supporter of our technology and business. He will remain in our thoughts. We offer our deepest and sincerest condolences to his wife and daughter, and the team at Aetos who have lost a very special colleague and mentor.