Embed Size (px)
Citation preview

Welcome to Macro 220
• Lecturer: Rod Duncan
• Office: C2-G20
• Contact: [email protected]
• Lectures: C2-G2 1pm to 2:50pm
• Tutorials: C2-215 1pm to 1:50pm
• Consult: 10am-12am, 3pm-5pm Tues
2pm-5pm Thurs

Forms of economics
• Microeconomics- the study of individual decision-making– “Should I go to college
or find a job?”– “Should I rob this
bank?”– “Why are there so
many brands of margarine?”
• Macroeconomics- the study of the behaviour of large-scale economic variables– “What determines
output in an economy?”
– “What happens when the interest rate rises?”

Economics as story-telling
• In a story, we have X happens, then Y happens, then Z happens.
• In an economic story or model, we have X happens which causes Y to happen which causes Z to happen.
• There is still a sequence and a flow of events, but the causation is stricter in the economic story-telling.

Kobe, the naughty dog

Modelling Kobe
• Kobe likes to unmake the bed (Z).
• Kobe likes treats (X).
• We assume that more treats will lead to fewer unmade beds.
(Not a very good) Model: X↑ → Z↓
• We can use this model to explain the past or to predict the future.

Components of a model
• Variables- i.e. output of economy, inflation rate, interest rates, or the unemployment rate
• Relationships between the variables- i.e. when interest rates rise, investment falls or more complicated forms
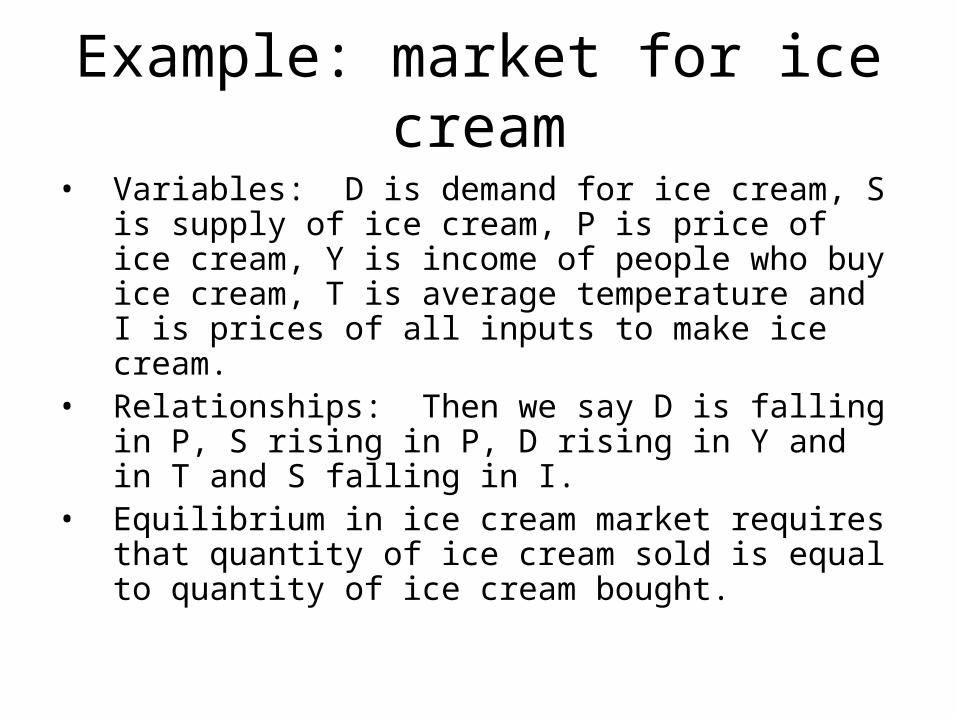
Example: market for ice cream
• Variables: D is demand for ice cream, S is supply of ice cream, P is price of ice cream, Y is income of people who buy ice cream, T is average temperature and I is prices of all inputs to make ice cream.
• Relationships: Then we say D is falling in P, S rising in P, D rising in Y and in T and S falling in I.
• Equilibrium in ice cream market requires that quantity of ice cream sold is equal to quantity of ice cream bought.
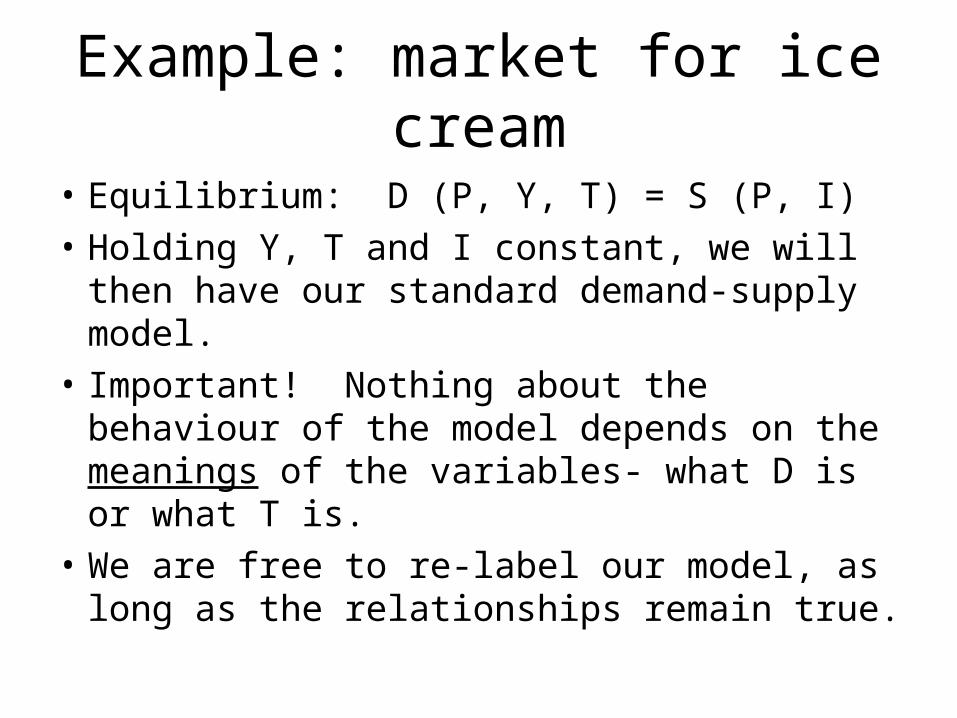
Example: market for ice cream
• Equilibrium: D (P, Y, T) = S (P, I)
• Holding Y, T and I constant, we will then have our standard demand-supply model.
• Important! Nothing about the behaviour of the model depends on the meanings of the variables- what D is or what T is.
• We are free to re-label our model, as long as the relationships remain true.
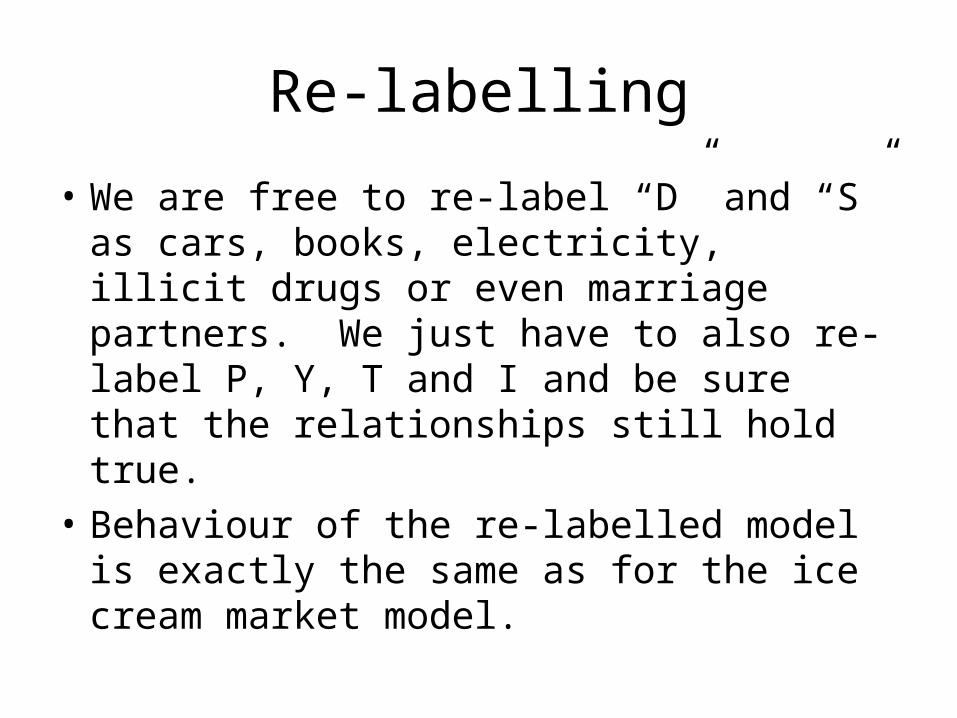
Re-labelling
• We are free to re-label “D” and “S” as cars, books, electricity, illicit drugs or even marriage partners. We just have to also re-label P, Y, T and I and be sure that the relationships still hold true.
• Behaviour of the re-labelled model is exactly the same as for the ice cream market model.
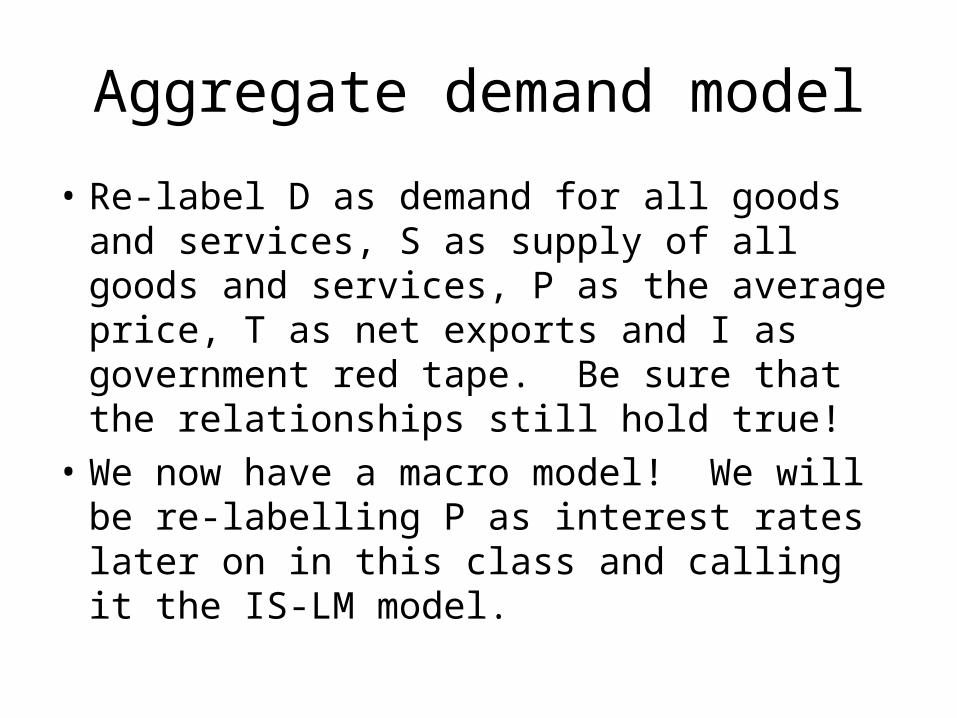
Aggregate demand model
• Re-label D as demand for all goods and services, S as supply of all goods and services, P as the average price, T as net exports and I as government red tape. Be sure that the relationships still hold true!
• We now have a macro model! We will be re-labelling P as interest rates later on in this class and calling it the IS-LM model.
Questions to ask yourself?
• What are the variables in this model?
• What are the relationships between the variables? (Often in the form of an equation or a graph.)
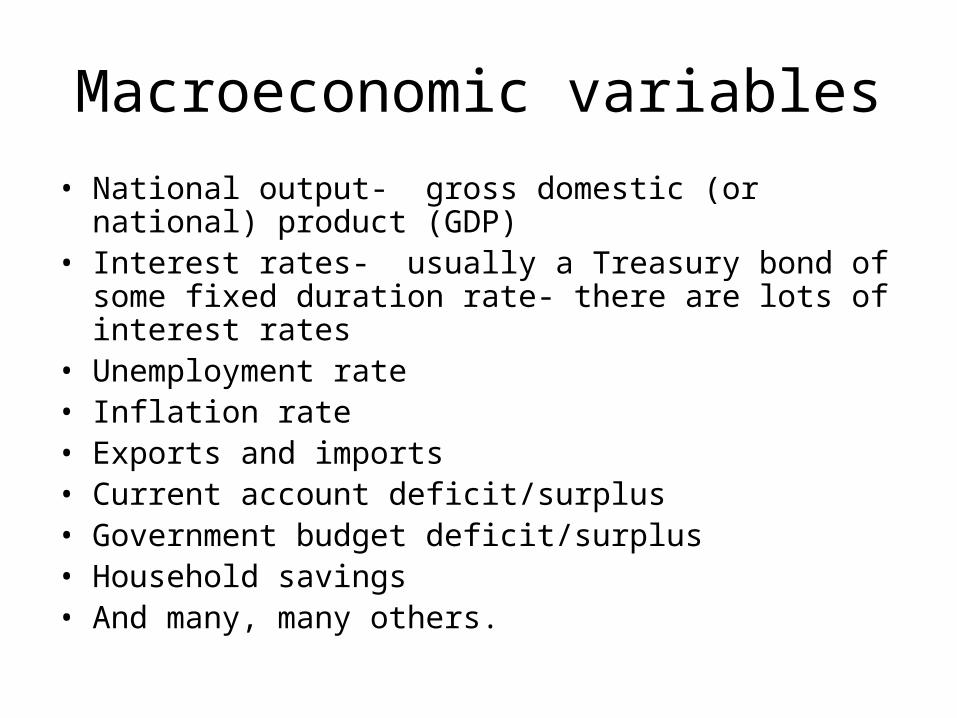
Macroeconomic variables
• National output- gross domestic (or national) product (GDP)
• Interest rates- usually a Treasury bond of some fixed duration rate- there are lots of interest rates
• Unemployment rate• Inflation rate• Exports and imports • Current account deficit/surplus• Government budget deficit/surplus• Household savings• And many, many others.
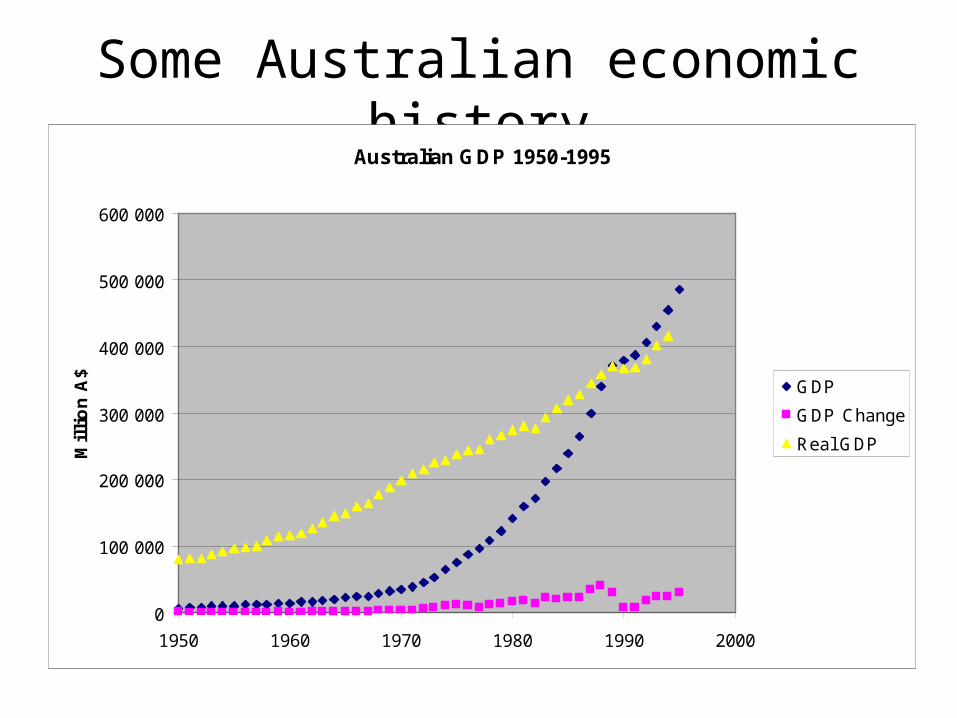
Some Australian economic historyAustralian GDP 1950-1995
0
100 000
200 000
300 000
400 000
500 000
600 000
1950 1960 1970 1980 1990 2000
Mil
lio
n A
$
GDP
GDP Change
Real GDP
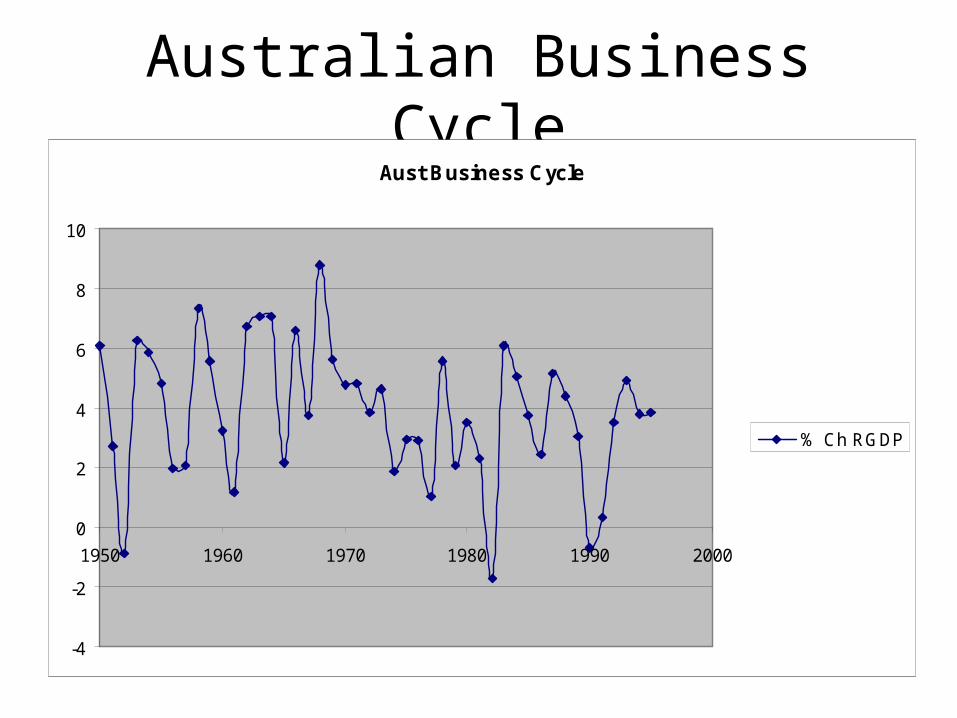
Australian Business CycleAust Business Cycle
-4
-2
0
2
4
6
8
10
1950 1960 1970 1980 1990 2000
% Ch RGDP
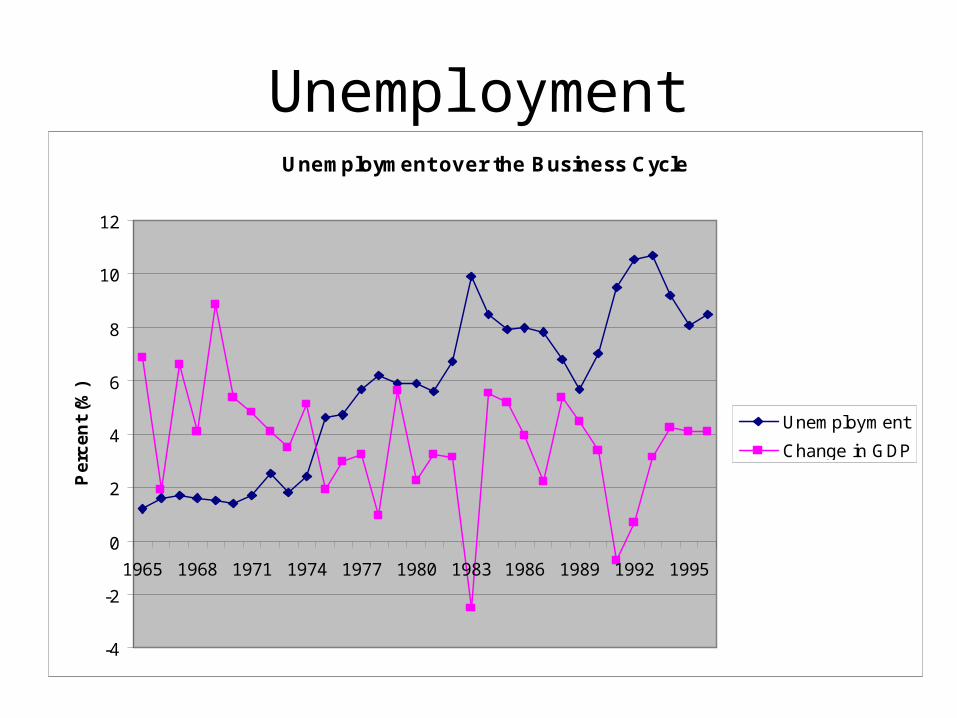
UnemploymentUnemployment over the Business Cycle
-4
-2
0
2
4
6
8
10
12
1965 1968 1971 1974 1977 1980 1983 1986 1989 1992 1995
Pe
rce
nt
(%)
Unemployment
Change in GDP
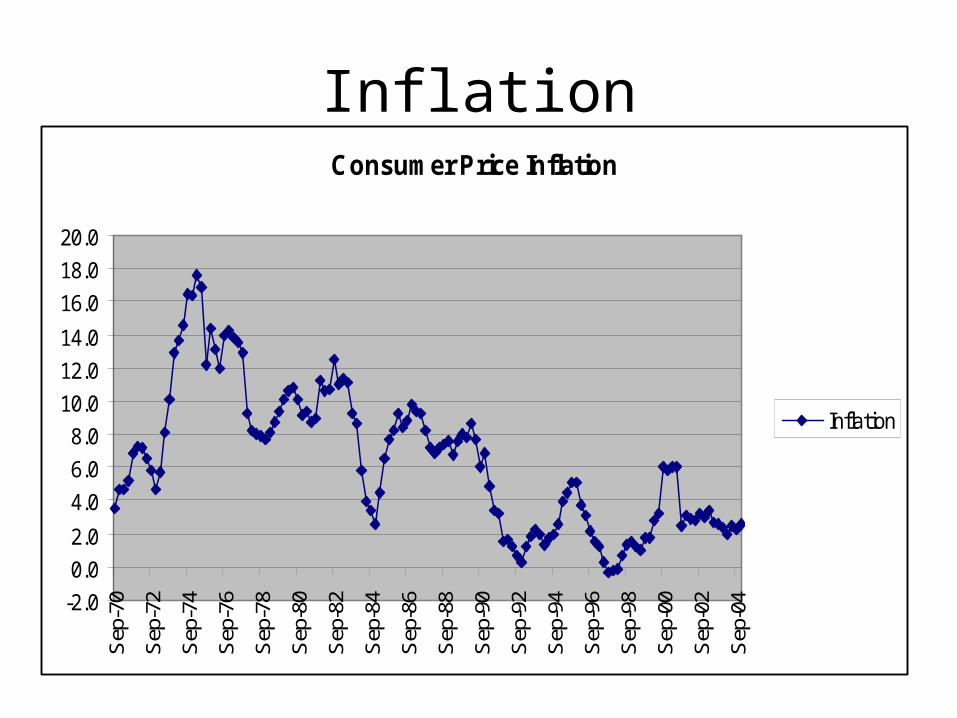
InflationConsumer Price Inflation
-2.0
0.0
2.0
4.0
6.0
8.0
10.0
12.0
14.0
16.0
18.0
20.0
Sep
-70
Sep
-72
Sep
-74
Sep
-76
Sep
-78
Sep
-80
Sep
-82
Sep
-84
Sep
-86
Sep
-88
Sep
-90
Sep
-92
Sep
-94
Sep
-96
Sep
-98
Sep
-00
Sep
-02
Sep
-04
Inflation
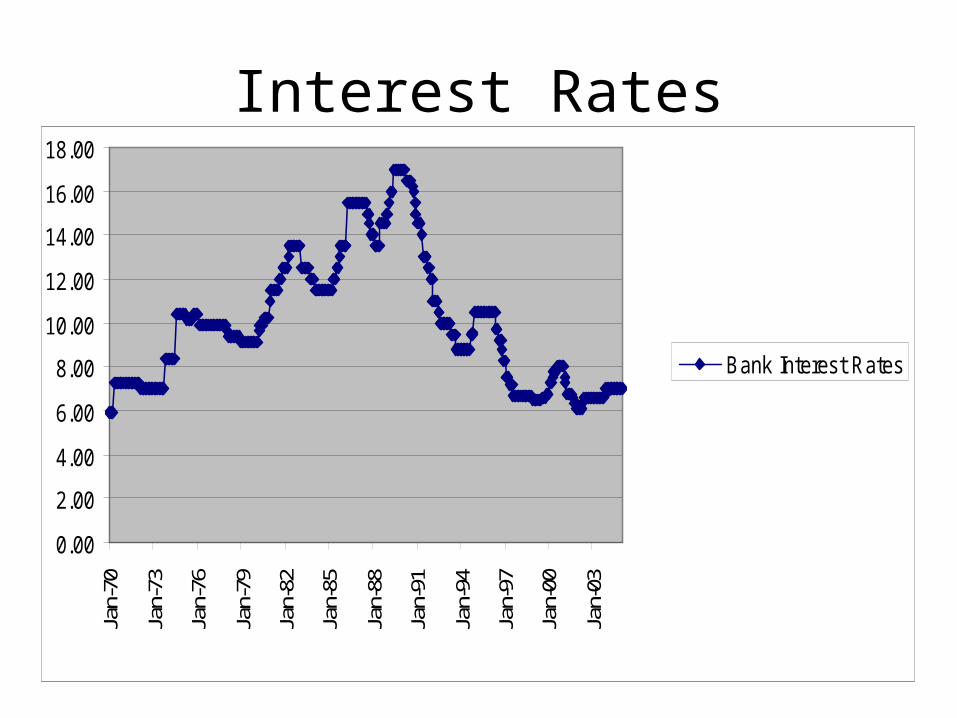
Interest Rates
0.00
2.00
4.00
6.00
8.00
10.00
12.00
14.00
16.00
18.00
Jan-
70
Jan-
73
Jan-
76
Jan-
79
Jan-
82
Jan-
85
Jan-
88
Jan-
91
Jan-
94
Jan-
97
Jan-
00
Jan-
03
Bank Interest Rates
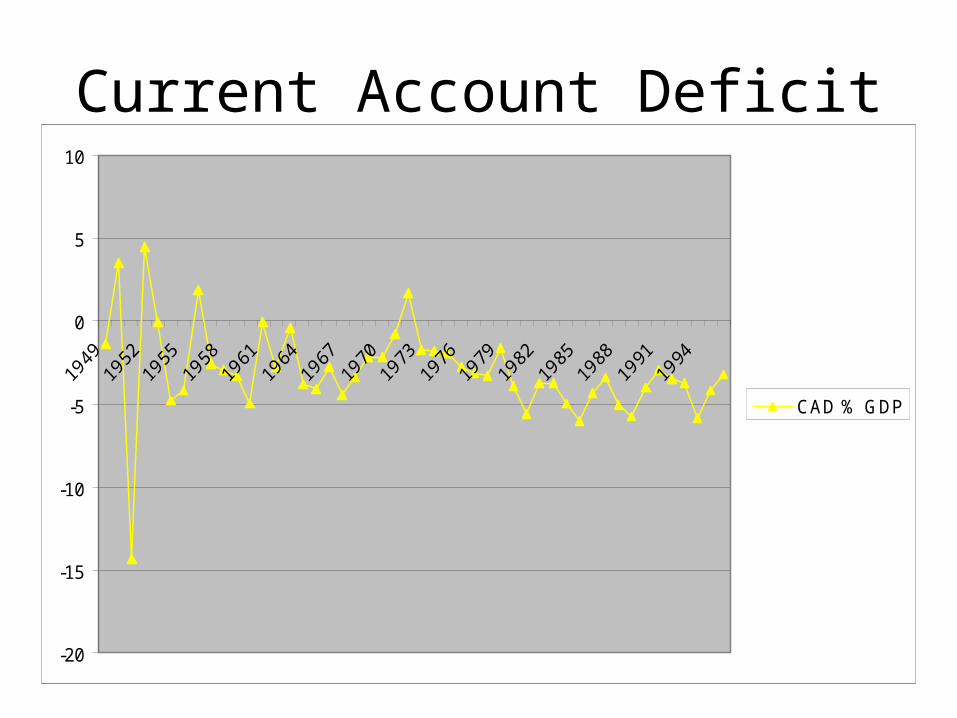
Current Account Deficit
-20
-15
-10
-5
0
5
10
CAD % GDP