Embed Size (px)
Citation preview

What makes the changes in Japanese water resources?
Backgrounds of Changes in Japanese Water resources
YOSHIDA, HiroshiAssociate Professor, Faculty of Agriculture
Tokyo University of Agriculture and Technology
Joint Workshop: 東Asia環境政策研究会

The Characteristics of Japanese RiverIn Japan, mountainous island country, rivers are short and steep.
Therefore rainfall rapidly runs into sea and the flow of rivers largely fluctuate seasonally.
Seine
Rhine
Mekong
http://www.jice.or.jp/knowledge/japan/commentary08
Loire
Colorado
Japanese Rivers
Distance from sea
Altitude

Water Use in Japan
vapor
Unit: 100 million tons/year
Precipitation
Flow into sea
Surface water
Usable
Municipal
IndustryAgriculture
Groundwater
http://www.mlit.go.jp/mizukokudo/mizsei/mizukokudo_mizsei_tk2_000012.html
As a monsoon country, annual precipitation reaches 640 billion tons/year in Japan.But 230 billion tons in rainfall vaporize into air and due to geographical condition, 329.5 billion tons flow into sea in vain. We can use only remaining 80.5 billion tons per year.
Even today, Agriculture uses 53.9 billion tons (approx. 67%) among available 80.5 billion tons. Industry uses 11.5 billion tons (14%) and urban waterworks use 15.1 billion tons (19%).

Governmental institutions related to water resource
• There are many governmental institutions related to water resources.
Ministry of Land, Infrastructure, Transport and Tourism (MLIT)
Establish basic guideline on water resource policyLicense new water intake from riverConstruct and maintain large scale damsConstruct and maintain large scale sewage system
Ministry of Health, Labor and Welfare (MHLW)
Regulate drinking water qualitySubsidize municipal waterworksSubsidize small scale sewage system in urban area
Ministry of Environment (MoE) Regulate ambient water quality
Ministry of Economy, Trade and Industry (METI)
Regulate groundwater pumping to prevent ground subsidenceSubsidize industrial waterworksRegulate hydropower generation
Ministry of Agriculture, Forestry and Fishery (MAFF)
Subsidize agricultural waterworksSubsidize small scale sewage system in rural area
Municipalities Operate waterworks and sewage system
Agricultural Improvement District Operate agricultural waterworks

Water resources Development Public Corporation (水資源開発公団, WARDEC)
• In 1961, Ministry of Construction (now MLIT), MAFF, Ministry of International Trade and Industry (now METI) and Ministry of Health and Welfare (now MHLW) jointly established “Water resources Development Public Corporation (WARDEC)” to decrease the demarcation dispute among Ministries.
• WARDEC was responsible for water resource development in seven major "Full Plan" rivers.
• WARDEC withdrawn from dam construction and was reorganized to Japan Water Agency(水資源機構) in 2000.
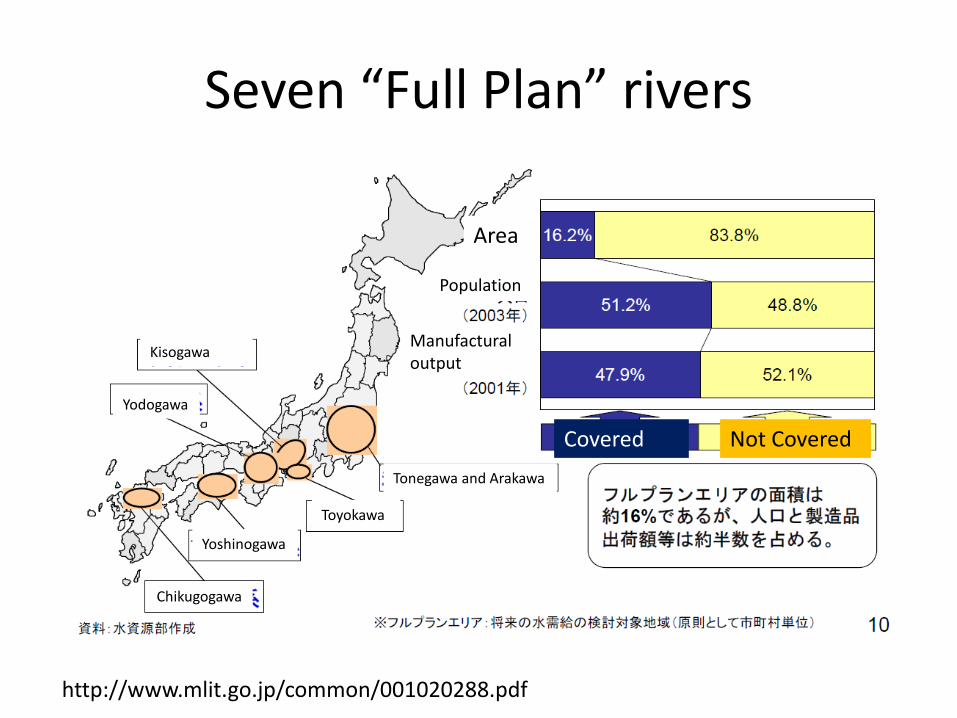
Seven “Full Plan” rivers
Area
Population
Manufactural output
Covered Not Covered
http://www.mlit.go.jp/common/001020288.pdf
Tonegawa and Arakawa
Toyokawa
Yoshinogawa
Chikugogawa
Yodogawa
Kisogawa
Basic Water Act of 2017(水循環基本法)
• July 1 of this year, “Basic Water Act” was promulgated.
• The purpose of this new law is to integrate now fragmented water related policies and authorities, including water resource development, water supply and waste water treatment, into an unitary scheme under the Cabinet.
• For this purpose, this law provides to establish Water Policy Headquarter in the Cabinet. The chief of Water Policy Headquarter is Prime Minister (now Abe Shinzo). The Headquarter determines “Basic Water Plan” and arranges policies of each Ministries.
• Actually until 2000 government reform, there was National Land Agency in Prime Minister’s Office to integrate water related policies. But the Agency has no authority on other Ministries and could not control Ministries (National Land Agency was nicknamed as “Kuge” (公家, “Noble”) because the documents they made were magnificent but they had few real influence).
• Today high-rank bureaucrats in Ministries are appointed by Cabinet therefore Cabinet can control these Ministries. Some bureaucrats are frustrated by this scheme because they think the appointments by Cabinet (Abe Shinzo administration) is unfair. They leaked some secret documents to throw Abe administration into scandal mess.
Basic Water Act of 2017(水循環基本法)

Abe in predicament:
Documents about building plan of new veterinarian school owned by Abe’s close friend were leaked
https://dot.asahi.com/wa/2017081800074.html

Background:Japanese economic growth after world war II
Japanese government disclosed economic growth rate from 1956. The period from 1956 to today can be divided into three or four stages.1. Rapid growth (1954 - 1973 oil crisis)
- other indicators than growth rate shows Rapid growth started in 19542. Stable growth (1974 - 1991)
- 1986-1991 might be separated as “bubble boom period” 3. Stagnant, “lost decades” (1991 - today)
-6
-4
-2
0
2
4
6
8
10
12
14
1956 1961 1966 1971 1976 1981 1986 1991 1996 2001 2006 2011
Economic Growth Rate (real term)
Source: System of National Account of Japan
In rapid growth period, Japanese economy enjoyed about 10% growth rate. Even stable growth period after oil crisis, more or less 5% growth continued. But after 1991 “bubble collapse” nearly zero growth continues so far.
Rapid growth
Stable growth
Lost decades
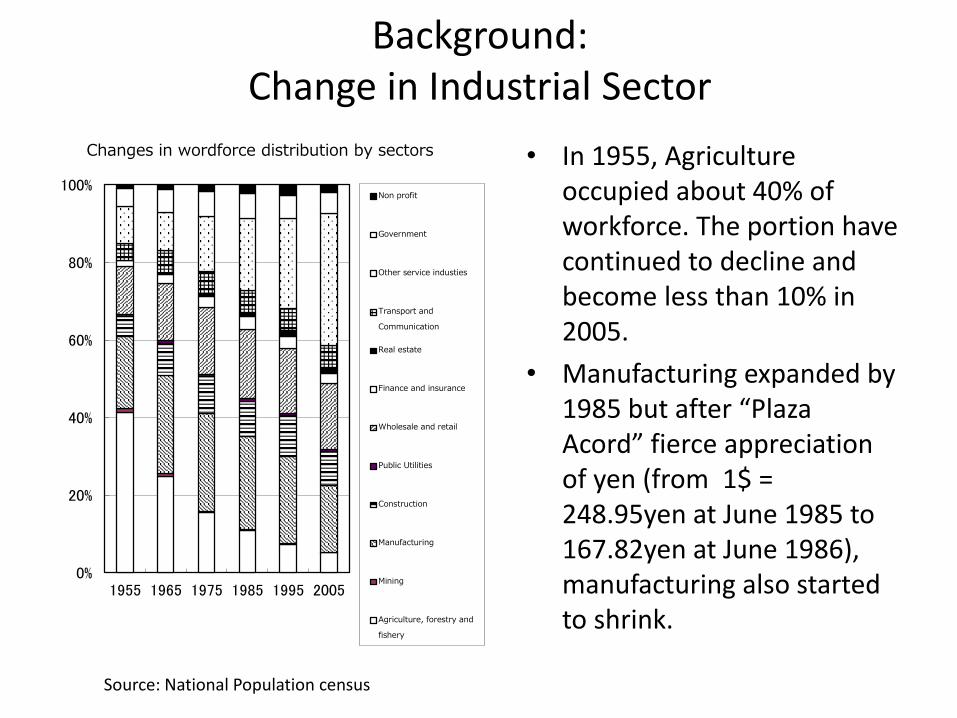
Background:Change in Industrial Sector
• In 1955, Agriculture occupied about 40% of workforce. The portion have continued to decline and become less than 10% in 2005.
• Manufacturing expanded by 1985 but after “Plaza Acord” fierce appreciation of yen (from 1$ = 248.95yen at June 1985 to 167.82yen at June 1986), manufacturing also started to shrink.
0%
20%
40%
60%
80%
100%
1955 1965 1975 1985 1995 2005
Changes in wordforce distribution by sectors
Non profit
Government
Other service industies
Transport and
Communication
Real estate
Finance and insurance
Wholesale and retail
Public Utilities
Construction
Manufacturing
Mining
Agriculture, forestry and
fishery
Source: National Population census

Background:Urban population increase
• In the rapid growth period, urban population also rapidly increased.• More detail, while in 1950s the population in the large city like Tokyo or
Osaka largely increased, but after 1960s the population in large city had reached to a ceiling and the population in satellite areas started to increase.
• Recently, Tokyo’s population began to increase again.
0
2,000
4,000
6,000
8,000
10,000
12,000
14,000
1950 1960 1970 1980 1990 2000 2010
Saitama
Chiba
Tokyo
Kanagawa

Increase of Industrial and Municipal water demand
• v
MunicipalIndustrial
Source: http://www.mlit.go.jp/common/001020288.pdf

Traditional Rules of Water Distribution
• Japanese traditional rules of water distribution were roughly established in Edo Era (Tokugawa Shogunate, 1603 – 1868).
• Then farmers believed that abundant water supply assures rich harvest. Hence they struggled to seize so much water as possible.
• As a result, many water dispute occurred between farmers or villages. Even today, the word “mizukakeron” (水掛け論, “water dispute”) is used as synonym of “endless dispute”.

Traditional Rules of Water Distribution
• Traditional rules of water distribution were:– Closeness to political authority is definitive.
• Tokugawa Shogunate divided land into pieces (which was sometimes very small) and designated different vassal as lord of each land piece (similar system to European feudalism). The closer to Tokugawa the lord of the land was, the more privileged the land was.
• Of course, the lands Tokugawa shogun directly rules (“Tenryo(天領)”, highest territory) were most privileged.
– Existing user is privileged over new comer.
– Upstream is privileged over downstream.
• These rules are remaining influential even today.

Note: Edo Era
• Edo Era Japan (1603 – 1868) shared many coincident features with European feudalism and in this period manufacturing was developed to a considerable level.
• These conditions made the premises of Japanese rapid industrialization and imperialist expansion after Meiji Restoration of 1868.
Archer boy doll in Edo Era. This doll is powered by coil spring, turns face and shoots arrows.
Photo: http://karafro.com/zasiki/zasiki.html

Multi purpose dam
• Under traditional water distribution rules, industrial waterworks and municipal waterworks couldn’t get water resource which they needed because they were new comer.
• Ministry of Construction (MoC) prohibited water resource trading i.e. agricultural sector “selling water” to industrial or municipal waterworks.
• Instead of water resource trading, MoC chose “multi purpose dam” construction to provide water to municipal and industrial waterworks.

Multi purpose dam
• Multi purpose dam was constructed by WARDEC (in seven “Full Plan” revers), MoC or prefectural government (other rivers).
• The owner of Multi purpose dam sold “dam rights” to collect construction cost to the expected water users. (municipalities, industrial waterworks, agricultural improvement district, electric companies and so on)
• The price of “dam rights” was different according to the value of the benefit which each water user would obtain from water use. The “dam rights” for agriculture or municipalities was cheaper than “dam rights” for industrial waterworks.

Multi purpose dam• The river authority (MoC for 1st-tier rivers and prefectural
government for 2nd-tier rivers) shared dam construction cost for flood prevention and environmental benefit (stabilizing flow in river).
• Of course, this cost allocation is ambiguous in reality and there is much room for political bargaining.
Water Authority (MLIT*) 54.5%
Municipalities 43.6%
Industrial waterworks 1.8%
Hydropower generation 0.1%
Cost allocation for Yamba dam project (2008) Total: 460 billion yen
http://www.ktr.mlit.go.jp/yanba/yanba_index003.html
* Yamba dam is constructed in tributary of Tone river. Tone river is one of the “Full Plan” rivers but WARDEC withdraw from new dam construction in 2000.

Dams upstream of Tone river
Sonohara Dam
Naramata Damhttp://www.water.go.jp/kanto/numata/12_photo/photo.html
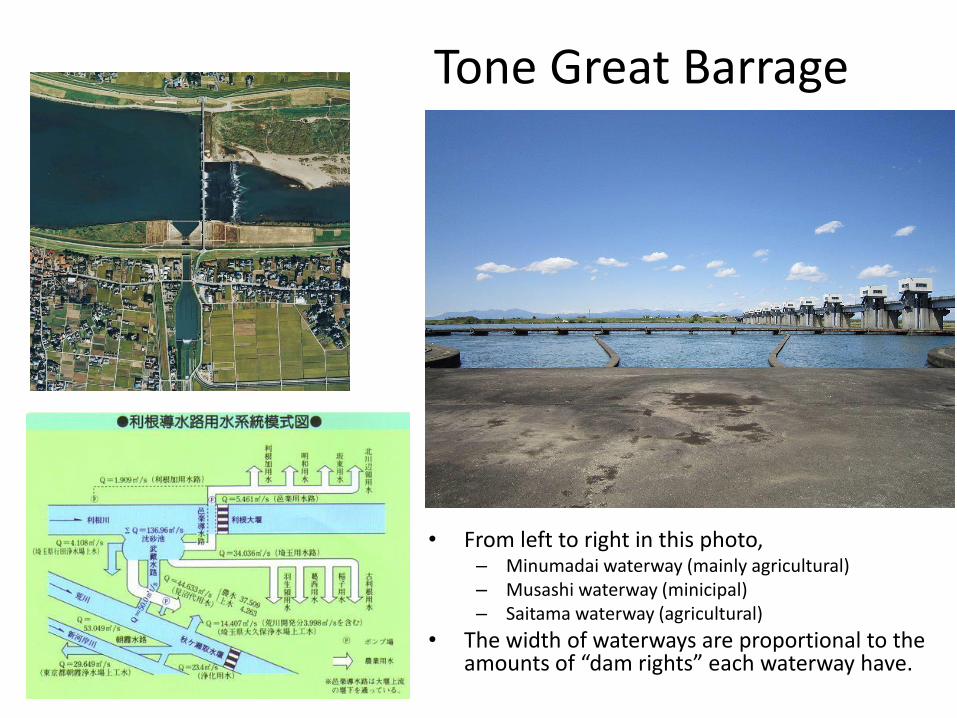
Tone Great Barrage
• From left to right in this photo,– Minumadai waterway (mainly agricultural)– Musashi waterway (minicipal)– Saitama waterway (agricultural)
• The width of waterways are proportional to the amounts of “dam rights” each waterway have.

Source: http://www.mlit.go.jp/common/001020288.pdf
Musashi Waterway
Asaka Purification Plant
Tokyo and other cities

Decrease of industrial water demand
• The industrial water demand rapidly increased until oil crisis of 1973.
• After oil crisis, water price increased and manufacturers made vast effort to economize water use.
• As a result, industrial water demand began to decrease. But Japanese government persisted unrealistic enormous water demand forecast.
Source: Shimazu Teruyuki(嶋津暉之), “Introduction to Water Problem (水問題原論)”, p.16, Hokuto Press, 1991.
Comparison forecast and real result of industrial water demand
real result
Long term forecast of 1978
Long term forecast of 1987

Nagaragawa Estuary Barrage
• Nagaragawa Estuary Barrage was constructed against strong opposition and completed in 1995.
• The dam developed 22.5㎥/S of water resource. But even today the real demand is limited only 3.592 ㎥/S.
Source: http://www.water.go.jp/chubu/nagara/27_english/index.htm

Withdrawal from Construction Projects
• Facing lack of water demand and strong opposition, Japanese government eventually decided to withdraw from more than 100 dams in late 1990s.
• After 1991 “bubble collapse”, tax revenue, especially corporate tax, decreased and governmental debt begin to increase. This is another reason to withdraw inefficient construction projects.
Accumulation of central government debt in Japan
Trillion Yen
Source: Ministry of Finance, “State of the public finance”http://www.mof.go.jp/budget/fiscal_condition/related_data/201704_01.pdf

Waterworks managerial crisis
• Many municipal waterworks suffered a loss by overdevelopment of water resource and increasing unsold water.
• Japanese waterworks law provides waterworks should be run by its own revenue. But actually many municipalities has been forced to subsidize its waterworks.
• This means that complete privatization of waterworks is difficult even if privatization is not impossible. Although there are some exceptions, most of current waterworks is not a profitable business and not attractive for investors.

Water price divergence• Due to natural condition or other factors, water prices of each
municipalities are largely different.
• Especially because of the increase of dam construction cost, the water prices of the municipalities in which water demand recently increased is prone to be higher.
• On the other hand, water prices of the municipalities in which water demand suddenly decreased also is prone to be higher.
Yubari City 6841
Fukaura Town 6588
Rausu Town 6360
Esashi Town 6264
Oyano Town 6264
High water price municipalities Cheap water price municipalities
Fujikawaguchiko Town 835
Ako City 853
Nagaizumi Town 1120
Oyama Town 1130
Shirahama Town 1155
Water price for 20ton/month as of April, 2014Source: Japan Water Works Association

Future of waterworks in Japan• National Institute of Population and Social
Security Research forecasts continuous population decrease in Japan in this century.
Population forecast by National Institute of Population and Social Security Research
HighMiddleLow

Future of waterworks in Japan
• Water demand also is forecasted to decrease. The demand decrease will bring revenue decrease.
• This means that the “water resource development era” has been ended. Hereafter proper maintenance and replace will be more important for waterworks.
• Future waterworks will be required to operate more effectively to adapt these conditions and to supply safe and stable water.

Thank you very much.
YOSHIDA, HiroshiAssociate Professor, Faculty of Agriculture
Tokyo University of Agriculture and [email protected]