Embed Size (px)
Citation preview

“Perhaps more than any other area, the goal of spend analysis is the increased visibility that provides the means for improving spend and supplier performance within a procurement organization.” - Limberakis, C. (2011). Spend Analysis: The Nexus of Spend Management. Aberdeen Group
Welcome to the first part of a 5-‐part “Focus on Fundamentals” series. The purpose of this series of white papers is to present fundamental skills, methodologies and best prac@ces that procurement professionals can put into immediate prac@ce within their organiza@ons.
This first white paper focuses on spend analysis and addresses (3) key ques@ons:
• What is spend analysis?• How do you conduct a spend analysis?• What do you do with the results of a spend analysis?
The mo@va@on for conduc@ng a spend analysis is well documented in terms of delivering significant value by op@mizing costs and improving supply performance. In prac@cal terms, a procurement organiza@on conduc@ng a spend analysis aims to achieve any or all of the following outcomes:
• Reduc@ons in purchase price• Reduc@ons in total cost of ownership• Reduc@ons in supply risks• Increased innova@on from the supply market
In much broader context, spend analysis can be the star@ng point for developing effec@ve procurement strategies to enable sustainable compe@@ve advantage.
What is spend analysis?
Before discussing how to conduct a spend analysis, it is important to define what is meant by the term. For this series of white papers, spend analysis is defined as -‐
“a systema@c process of collec@ng, cleansing and segmen@ng spend on suppliers with the aim of iden@fying the spend areas that have the biggest impact on profitability.”
Focus on Fundamentals - Part 1: Spend Analysis in a 7-Step Methodology!
White Paper
Focus on Fundamentals -‐ Part 1:Spend Analysis in a 7-‐Step Methodology
Dale Smith

This defini@on implies a holis@c, topographic view of the company’s en@re expenditure on suppliers. In some cases, this expenditure can be as much as 60 per cent or more of a company’s sales revenues. Therefore, data collec@on is one of the first challenges in conduc@ng a spend analysis.
The second cri@cal challenge involves defining specific spend categories by segmen@ng the en@re expenditure on suppliers into supply market-‐facing spend areas. Crea@ng these spend categories makes it possible for individual procurement teams to manage expenditures in the related supply markets as if they were managing an individual business unit.
Some large corpora@ons have implemented fully integrated informa@on systems that are capable of providing up-‐to-‐date, categorized, spend informa@on extracted from mul@tudes of databases. However, the vast majority of companies today employ methods that depend heavily upon spreadsheets and other manual methods for collec@ng, categorizing and repor@ng spend informa@on.
Even companies that have Enterprise Resource Planning (ERP) systems and other forms of business informa@on systems may find that a significant amount of manual interven@on is s@ll required when undertaking a spend analysis exercise. This means that it is cri@cally important to have a defined spend analysis methodology that isn’t necessarily dependent upon sophis@cated so^ware systems.
How do you conduct a spend analysis?
Although a number of approaches to conduc@ng a spend analysis are in use, one well-‐established methodology involves the seven basic steps as shown in the figure below.
Now, let’s take a brief look at each of these seven steps.
Focus on Fundamentals - Part 1: Spend Analysis in a 7-Step Methodology! 2
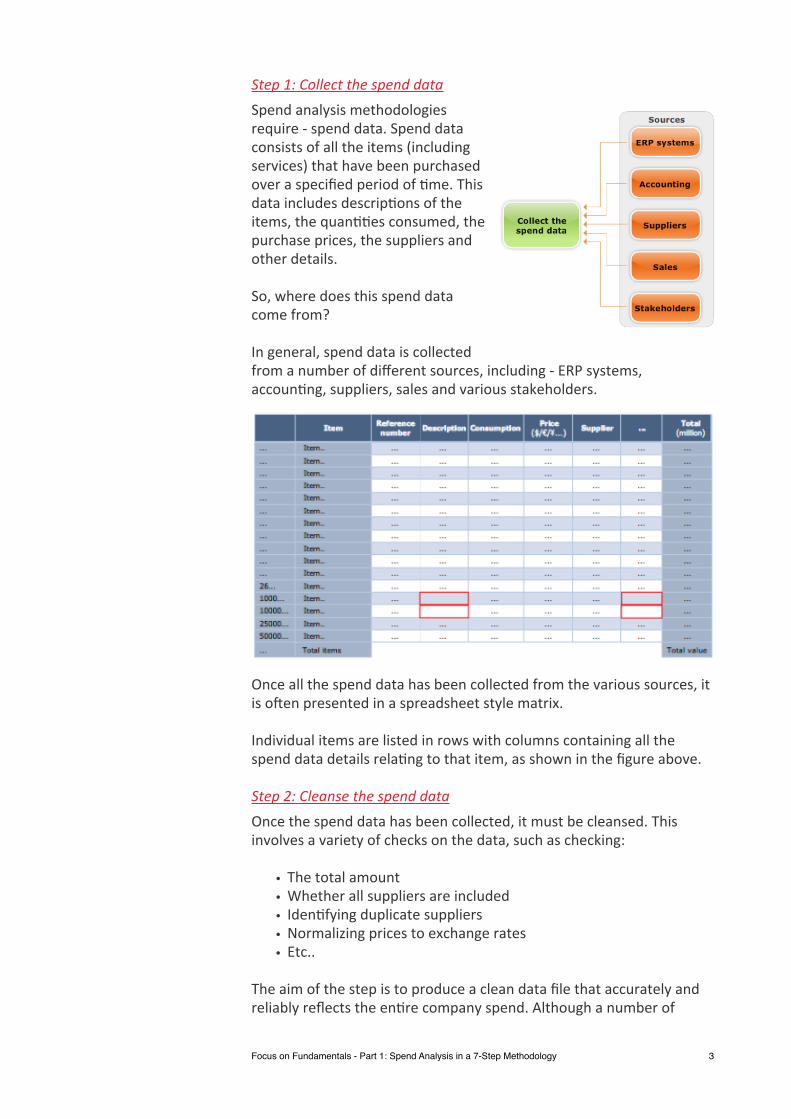
Step 1: Collect the spend dataSpend analysis methodologies require -‐ spend data. Spend data consists of all the items (including services) that have been purchased over a specified period of @me. This data includes descrip@ons of the items, the quan@@es consumed, the purchase prices, the suppliers and other details.
So, where does this spend data come from?
In general, spend data is collected from a number of different sources, including -‐ ERP systems, accoun@ng, suppliers, sales and various stakeholders.
Once all the spend data has been collected from the various sources, it is o^en presented in a spreadsheet style matrix.
Individual items are listed in rows with columns containing all the spend data details rela@ng to that item, as shown in the figure above.
Step 2: Cleanse the spend dataOnce the spend data has been collected, it must be cleansed. This involves a variety of checks on the data, such as checking:
• The total amount• Whether all suppliers are included • Iden@fying duplicate suppliers• Normalizing prices to exchange rates• Etc..
The aim of the step is to produce a clean data file that accurately and reliably reflects the en@re company spend. Although a number of
Focus on Fundamentals - Part 1: Spend Analysis in a 7-Step Methodology! 3

so^ware tools are available to assist with this step it is generally not possible to eliminate human/manual interven@on.
Step 3: Classify the spend dataClassifying the spend data is the step that follows spend data cleansing and involves linking each item in the en@re spend to standard classifica@on codes. Examples of standard classifica@on codes include:
• Company Specific Classifica@ons (i.e. defined by the company)• North American Industry Classifica@on System (NAICS)• eClass Code• United Na@ons Standard Products and Services Code (UNSPSC)
The UNSPSC contains over 50,000 codes and is regularly updated. Using standard classifica@on codes like the UNSPSC is an established best prac@ce. However, many companies chose to use their own system of classifica@on codes.
Regardless of the classifica@on coding scheme, the key aim of this step is to produce a spend data file with each item (i.e. each row) linked to a unique classifica@on code.
Spend analysis so^ware can also be of great help in this step.
Step 4: Detect the addressable spendNot all of the en@re spend will be available for cost op@miza@on. Some of the spend will be impossible or extremely difficult to influence in any meaningful way. Examples of this kind of spend include: taxes, rent, and governmental charges. Once these non-‐addressable spend items have been iden@fied and removed then addressable spend items remain.
Step 5: Define the categoriesNow that the spend data has been collected, cleansed and classified and the addressable por@on of spend has been iden@fied, it is @me to Focus on Fundamentals - Part 1: Spend Analysis in a 7-Step Methodology! 4
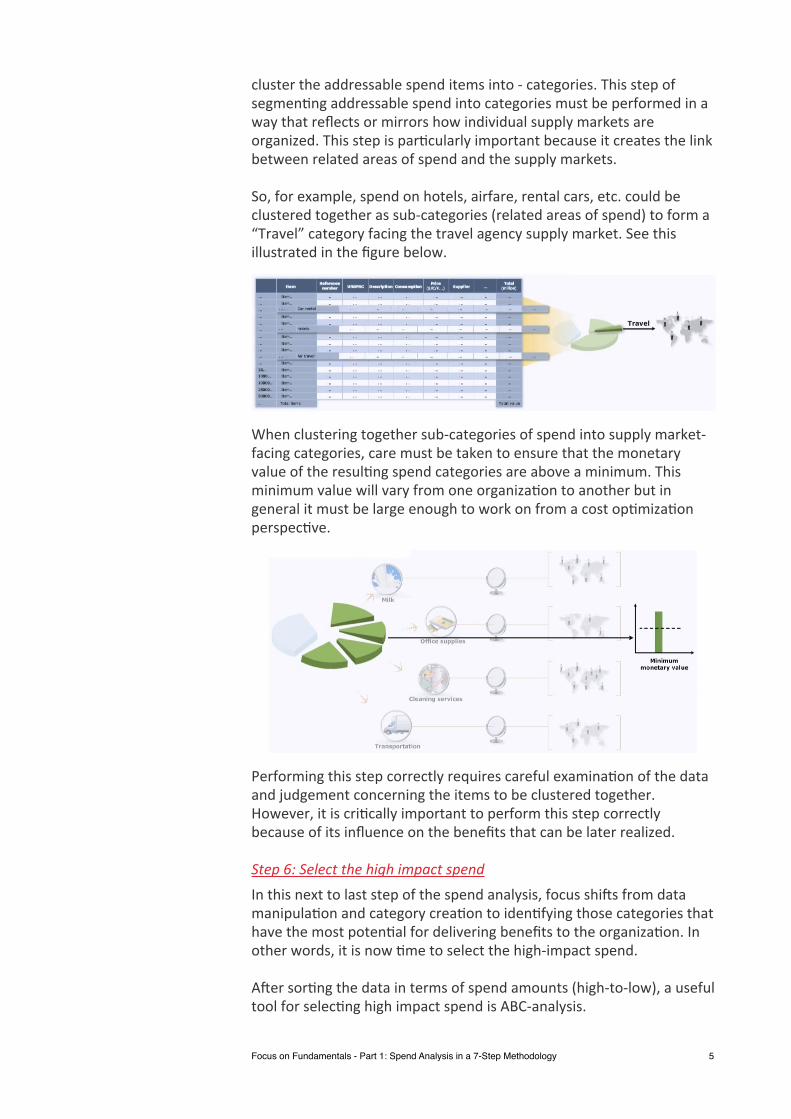
cluster the addressable spend items into -‐ categories. This step of segmen@ng addressable spend into categories must be performed in a way that reflects or mirrors how individual supply markets are organized. This step is par@cularly important because it creates the link between related areas of spend and the supply markets.
So, for example, spend on hotels, airfare, rental cars, etc. could be clustered together as sub-‐categories (related areas of spend) to form a “Travel” category facing the travel agency supply market. See this illustrated in the figure below.
When clustering together sub-‐categories of spend into supply market-‐facing categories, care must be taken to ensure that the monetary value of the resul@ng spend categories are above a minimum. This minimum value will vary from one organiza@on to another but in general it must be large enough to work on from a cost op@miza@on perspec@ve.
Performing this step correctly requires careful examina@on of the data and judgement concerning the items to be clustered together. However, it is cri@cally important to perform this step correctly because of its influence on the benefits that can be later realized.
Step 6: Select the high impact spendIn this next to last step of the spend analysis, focus shi^s from data manipula@on and category crea@on to iden@fying those categories that have the most poten@al for delivering benefits to the organiza@on. In other words, it is now @me to select the high-‐impact spend.
A^er sor@ng the data in terms of spend amounts (high-‐to-‐low), a useful tool for selec@ng high impact spend is ABC-‐analysis.
Focus on Fundamentals - Part 1: Spend Analysis in a 7-Step Methodology! 5
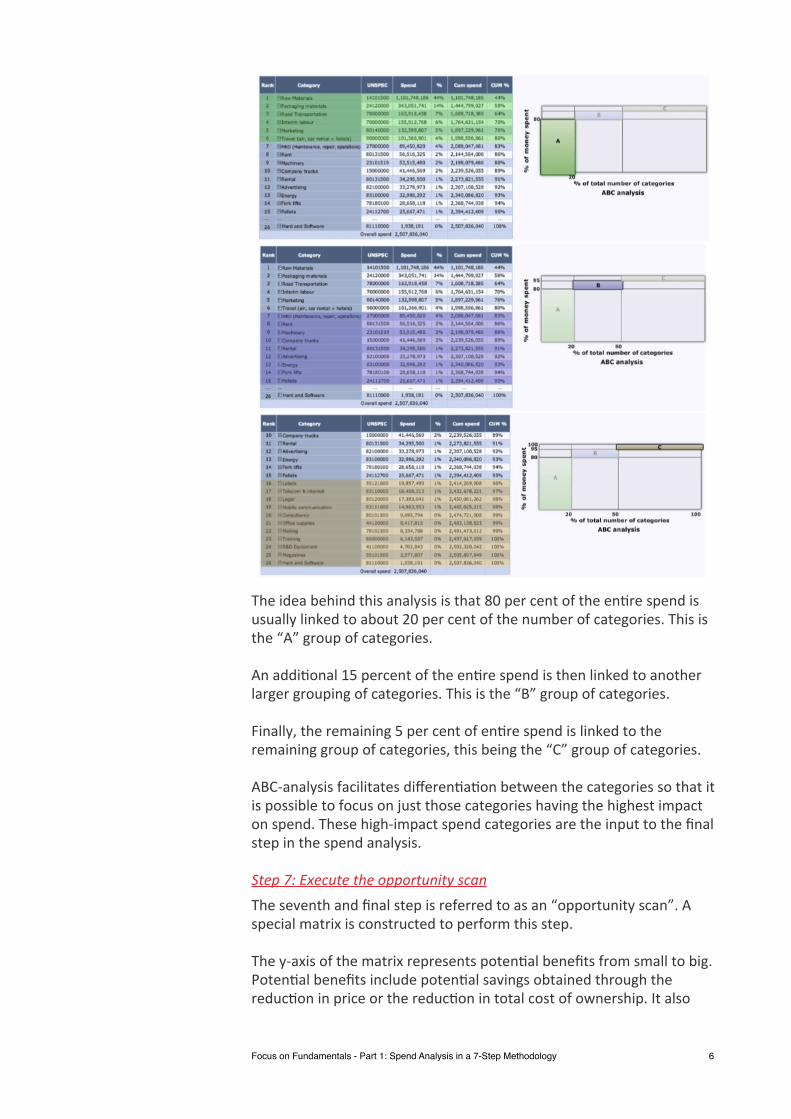
The idea behind this analysis is that 80 per cent of the en@re spend is usually linked to about 20 per cent of the number of categories. This is the “A” group of categories.
An addi@onal 15 percent of the en@re spend is then linked to another larger grouping of categories. This is the “B” group of categories.
Finally, the remaining 5 per cent of en@re spend is linked to the remaining group of categories, this being the “C” group of categories.
ABC-‐analysis facilitates differen@a@on between the categories so that it is possible to focus on just those categories having the highest impact on spend. These high-‐impact spend categories are the input to the final step in the spend analysis.
Step 7: Execute the opportunity scanThe seventh and final step is referred to as an “opportunity scan”. A special matrix is constructed to perform this step.
The y-‐axis of the matrix represents poten@al benefits from small to big. Poten@al benefits include poten@al savings obtained through the reduc@on in price or the reduc@on in total cost of ownership. It also
Focus on Fundamentals - Part 1: Spend Analysis in a 7-Step Methodology! 6

includes poten@al savings from efficiency gains, reduced risk or increased value.
The x-‐axis of the matrix represents the ease of implemen@ng changes in the current supply structure, from hard to easy. Ease of implementa@on includes the ease to bring change to the organiza@on and the ease to realize the es@mated benefits.
The resul@ng matrix consists of four quadrants:
• Priori@es • Worth the effort • Maybe • Avoid
The various categories can now be placed inside the matrix with priority given to Group A categories since these categories have the Focus on Fundamentals - Part 1: Spend Analysis in a 7-Step Methodology! 7

highest impact on en@re spend. See figure to the right showing example categories placed on the opportunity scan matrix.
Associa@ng poten@al benefits and ease of implementa@on with each category typically involves interviews with stakeholders, suppliers and various members of the organiza@on. These interviews enable the spend analysis team to iden@fy those categories that should be priori@zed or avoided as a focus for cost op@miza@on and/or supplier performance improvement.
What do you do with the results of a spend analysis?
Once the opportunity scan has been completed and priority categories have been iden@fied, the spend analysis exercise is effec@vely concluded. The results of the spend analysis provide a star@ng point for developing effec@ve procurement strategies to capture and mone@ze the poten@al value the analysis uncovered. These strategies could range from adop@ng a different category management approach to nego@a@ng stricter terms with suppliers whose markets have experienced increased compe@@on.
In the next part of this series we take a close look at “Procurement Finance” within the aim of providing some fundamentals to help build bridges between procurement, finance and accoun@ng. A pdf copy of this white paper is available for download from our website -‐ here.
Focus on Fundamentals - Part 1: Spend Analysis in a 7-Step Methodology! 8
About the AuthorDale Smith manages business development ini@a@ves aimed at building global brand awareness and accelera@ng demand for Procurement Academy’s innova@ve online e-‐Learning solu@ons designed for teams of procurement and supply opera@ons professionals. He has over 20 years experience in the technology sector in management, marke@ng, sales opera@ons and interna@onal business development. Prior to joining Procurement Academy Dale was an associate professor teaching courses in opera@ons & supply management, strategy, marke@ng, and entrepreneurship.
About Procurement AcademyEstablished in early 2008 by former interna@onal procurement leaders, Procurement Academy is an online E-‐Learning company specializing in competence development for large and/or mul@na@onal procurement staff. Our High-‐Impact E-‐Learning courses are an innova@ve fusion of procurement best prac@ces and advanced learning theory that enables procurement organiza@ons to deliver more value through superior competence.
With headquarters at the Research Campus in Hasselt, Belgium, offices in Bonn, Germany and service & support teams in Mauri@us, Procurement Academy is an interna@onal company serving a global clientele. The company is solely dedicated to crea@ng purposeful, interes@ng and innova@ve procurement training that makes a real difference to the people who use it.
For more informa@on about Procurement Academy, please visit www.procurement-‐academy.com.
Focus on Fundamentals - Part 1: Spend Analysis in a 7-Step Methodology! 9
© 2013 Procurement Academy
Procurement AcademyResearch Campus Hasselt
Kempische Steenweg 305/14Hasselt, Antwerpen B-‐3500
Belgium
www.procurement-‐academy.com


![Visibility+ +White+Paper[1]](https://img.pdfslide.tips/doc/110x75/577d35011a28ab3a6b8f594a/visibility-whitepaper1.jpg)