Embed Size (px)
Citation preview


World Cargo Symposium 2015
WCS 2015开幕式:
� The plenary session will have speeches conducted in English and Mandarin.
� Please pick up your interpretation device in the foyer by dropping off your ID.
� 中英双语,需要同声传译设备
� 请在回廊处凭有效证件领取同声传译设备
The WCS 2015 Opening Session:
Opening Plenary
Sponsored by

World Cargo Symposium 2015
Chairman’s Opening Remarks
� Glyn Hughes
� Global Head of Cargo, IATA

World Cargo Symposium 2015
Welcome Remarks
� Jiang Zhuoqing
� Vice Mayor of Shanghai

World Cargo Symposium 2015
Host Carrier Address
� Liu Shaoyong
� The Board Chairman, China Eastern
Innovation & Revitalization
Mr. Liu ShaoyongPresident
China Eastern Air Holding Company
The Future of Air Cargo in the Global Supply Chain

I. History and Current Situation of Air CargoII. Analysis of Stagnancy of Air Cargo Demand
III. Suggestion for Innovation and Transformation
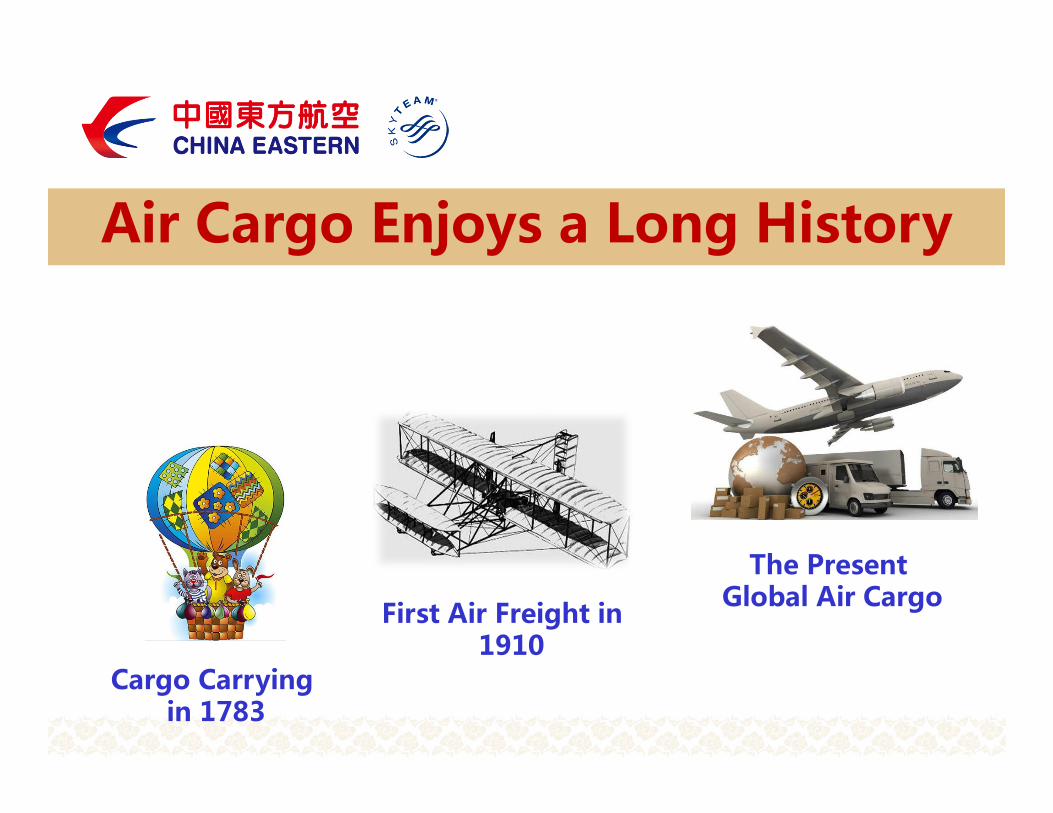
Air Cargo Enjoys a Long History
First Air Freight in 1910
The PresentGlobal Air Cargo
Cargo Carryingin 1783

Air Cargo Faces Huge Challenges
(2007-2014) (2007-2014)

Innovation and Transformation� Innovation in Business Mind
� Transformation in Business Mode
consignor Agencies Airlines
Express
Delivery
Companies
consignee

Value Of Air Cargo
• Creating huge opportunities for employment, innovation and collaboration
• Transporting goods worth $6.4 trillion• Transforming lifestyle and work style
around the world

Potential for Industry Development� Informationization transforms business
ecosystem� Online shopping and cross-border
e-commerce emerges� Express delivery volume in China reaches
14 billions in 2014

I. History and Current Situation of Air Cargo
II. Analysis of Stagnancy of Air Cargo Demand
III. Suggestion for Innovation and Transformation

Bottlenecks for the Industry
Compared to rapid recovery of growth in
air passenger transport, air cargo
development clearly lacks momentum.
After the global financial crisis, global
economy faces slow recovery and the air cargo
industry encounters “engine shut-down”.

Analysis of Stagnancy of Air Cargo Demand
� Impact from macro-economy and policies
� Constraints from traditional business mode
� Impact from other transport modes

I. History and Current Situation of Air CargoII. Analysis of Stagnancy of Air Cargo Demand
III.. Suggestion for Innovation and Transformation

Reconstruction of Business Process
Through IT, outdated Through IT, outdated Through IT, outdated Through IT, outdated air cargo air cargo air cargo air cargo
process process process process can be modernized.can be modernized.can be modernized.can be modernized.

Revitalization of Business Ecosystem
Air cargo Air cargo Air cargo Air cargo industry industry industry industry is not is not is not is not isolated, isolated, isolated, isolated,
but a part of the modern logistics but a part of the modern logistics but a part of the modern logistics but a part of the modern logistics
chain.chain.chain.chain.
Cooperation Cooperation Cooperation Cooperation & win& win& win& win----win future.win future.win future.win future.

Improvement of Policy EnvironmentMuch remaining to be done Much remaining to be done Much remaining to be done Much remaining to be done
concerning the policy environment concerning the policy environment concerning the policy environment concerning the policy environment
of IATAof IATAof IATAof IATA, cargo associations, , cargo associations, , cargo associations, , cargo associations,
logistics associations and other logistics associations and other logistics associations and other logistics associations and other
market market market market competitors.competitors.competitors.competitors.

Thank you

World Cargo Symposium 2015
Shanghai: At the heart of today's air cargo industry
� Jing Yiming� President, Shanghai Airport Authority

World Cargo Symposium 2015
Keynote: Facilitating trade and smart regulations, working with the air cargo industry
� Kunio Mikuriya� Secretary General, World Customs Organization

World Cargo Symposium 2015
The State of the Industry
� Tony Tyler
� Director General and CEO IATA
World Cargo Symposium 2015
Chairman’s Remarks
� Glyn Hughes
� Global Head of Cargo, IATA

World Cargo Symposium 2015
COFFEE BREAKSponsored by
In Exhibition


World Cargo Symposium 2015
Cyclical Gains but challenges & risks remain
� Julie Perovic� Senior Economist, IATA
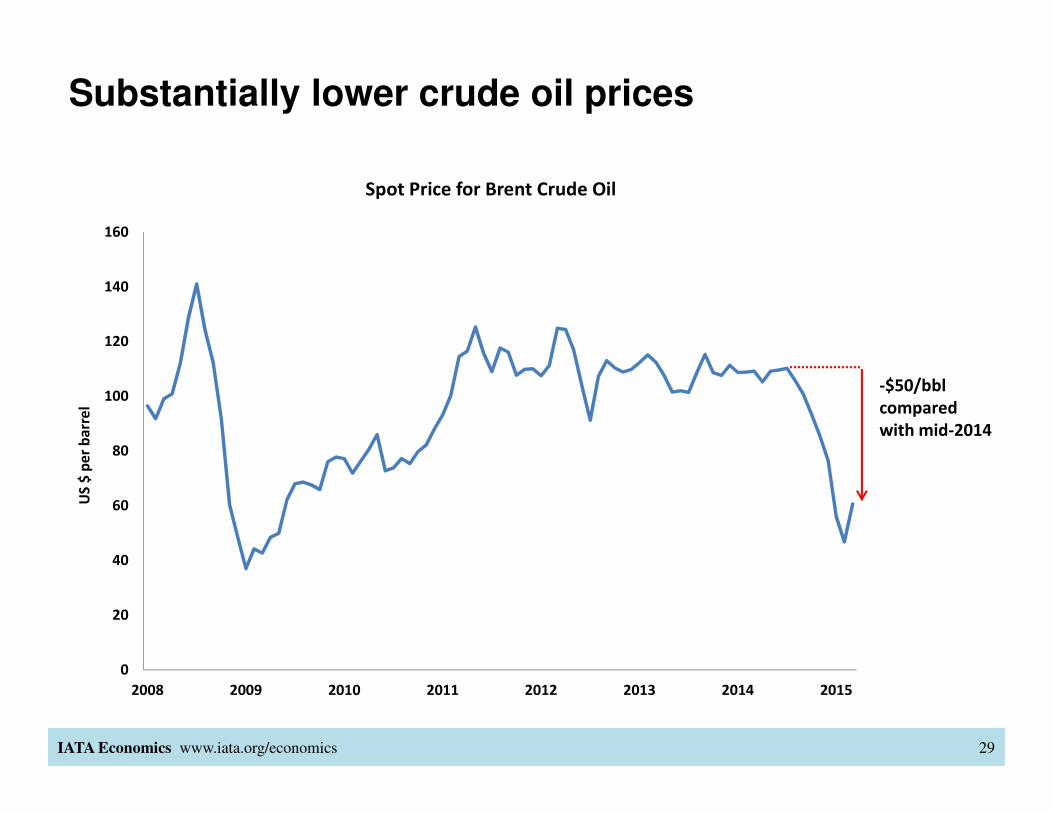
Substantially lower crude oil prices
IATA Economics www.iata.org/economics 29
0
20
40
60
80
100
120
140
160
2008 2009 2010 2011 2012 2013 2014 2015
US
$ p
er
ba
rre
l
Spot Price for Brent Crude Oil
-$50/bbl
compared
with mid-2014

Is that good or bad for the world economy?
IATA Economics www.iata.org/economics 30
Source: Schroders, Oxford Economics

And for the airline industry?
IATA Economics www.iata.org/economics 31
Source: IATA, McKinsey, Platts
0
20
40
60
80
100
120
140
160
0.0
1.0
2.0
3.0
4.0
5.0
6.0
7.0
8.0
1990 1992 1994 1996 1998 2000 2002 2004 2006 2008 2010 2012 2014
Jet
fue
l pri
ce,
US$
/ba
rre
l
RO
IC,
% o
f in
vest
ed
ca
pit
al
Airline industry ROIC and jet fuel prices
ROIC
Jet fuel price

A strong economic upturn would really help
IATA Economics www.iata.org/economics 32
Source: IATA, McKinsey, IHS Global Insight
-6.0
-4.0
-2.0
0.0
2.0
4.0
6.0
8.0
-3.0
-2.0
-1.0
0.0
1.0
2.0
3.0
4.0
5.0
6.0
1990 1992 1994 1996 1998 2000 2002 2004 2006 2008 2010 2012 2014
Air
lin
es
RO
IC,
% in
vest
ed
ca
pit
al
Wo
rld
GD
P g
row
th,
%
Airline industry ROIC and world GDP growth
Airlines ROIC
World GDP
growth
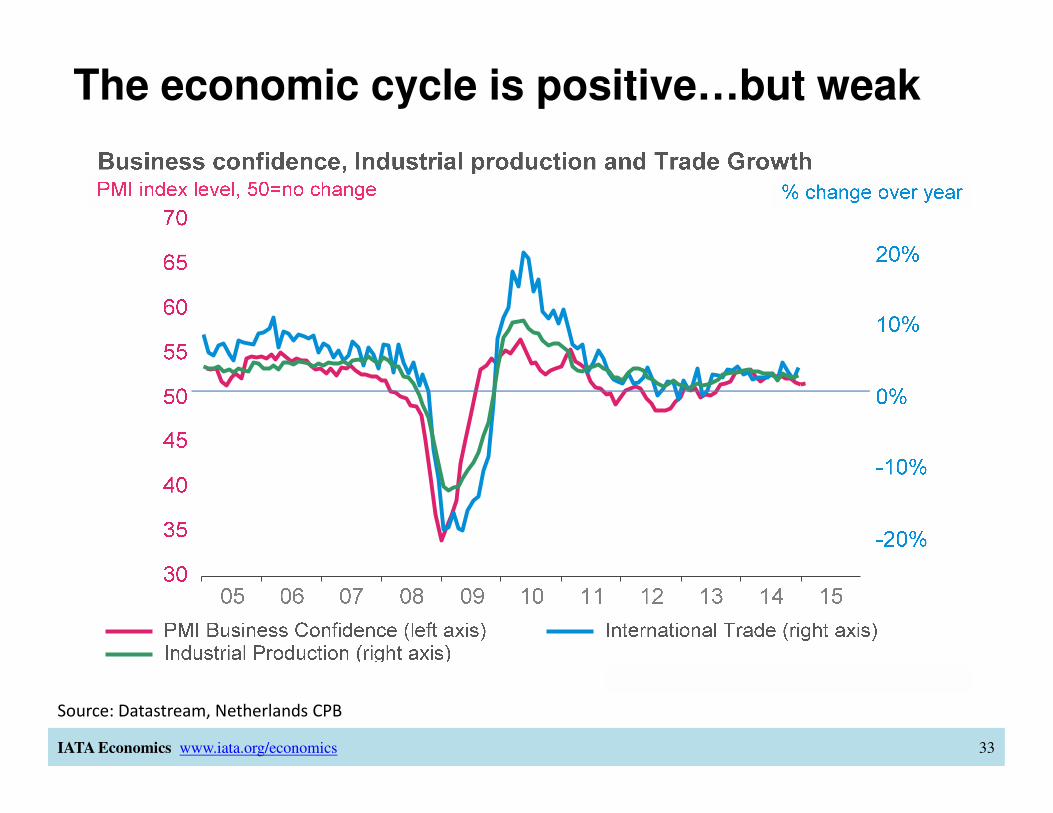
The economic cycle is positive…but weak
IATA Economics www.iata.org/economics 33
Source: Datastream, Netherlands CPB
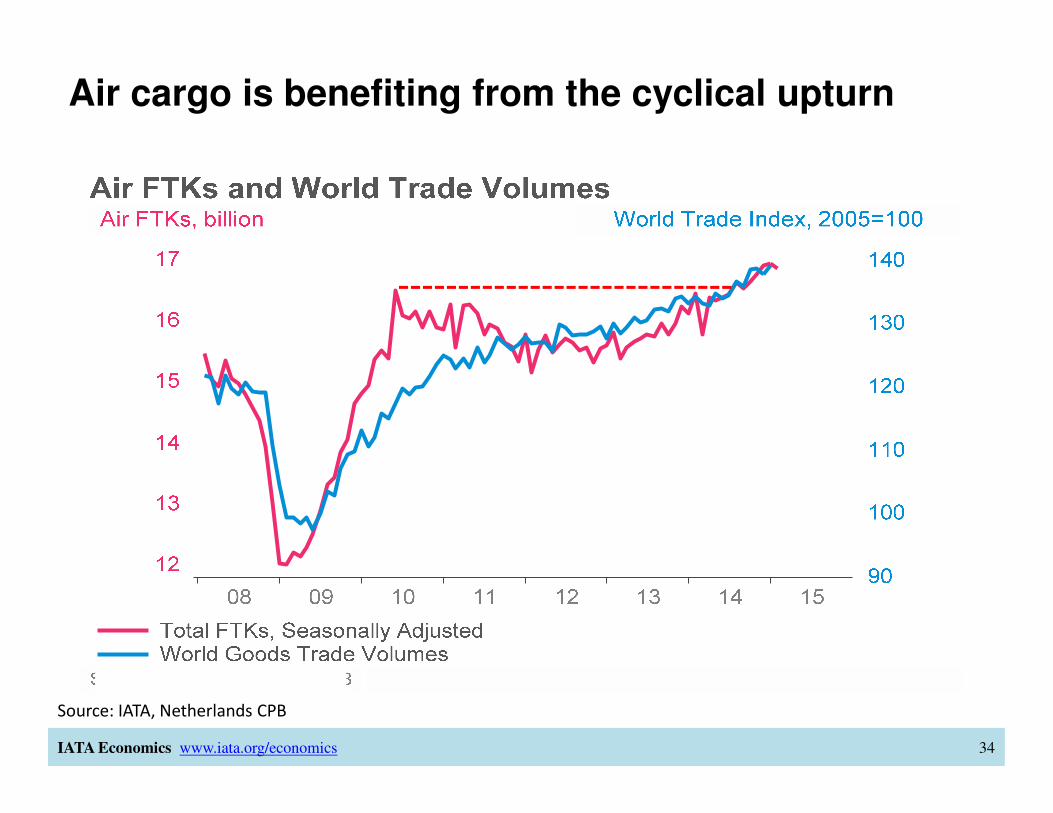
Air cargo is benefiting from the cyclical upturn
IATA Economics www.iata.org/economics 34
Source: IATA, Netherlands CPB

But performance by airline region is uneven
IATA Economics www.iata.org/economics 35
Source: IATA
80
90
100
110
120
130
140
150
160
170
2010 2011 2012 2013 2014 2015
Indexe
d t
o 1
00 in
May
2010
FTKs by region of airline registration
Middle East(+60%)
Africa
EuropeLatin America
Asia-Pacific(-8%)
North America
2010 peak level

And only some trade lanes seeing strong growth
IATA Economics www.iata.org/economics 36
Source: IATA
-40%
-30%
-20%
-10%
0%
10%
20%
30%
40%
50%
60%
2010 2011 2012 2013 2014
% c
ha
nge
ove
r ye
ar
International Freight growth by major routes
Europe - Far East
North Atlantic
North & Mid Pacific

Asset utilization has been improving
IATA Economics www.iata.org/economics 37
Source: IATA, Boeing, all data seasonally adjusted by IATA
37%
39%
41%
43%
45%
47%
49%
51%
53%
8.0
8.5
9.0
9.5
10.0
10.5
11.0
11.5
12.0
12.5
2008 2010 2011 2012 2013 2014
% a
vail
ab
le f
reig
ht
ton
ne c
ap
acit
y
Avera
ge d
ail
y h
ou
rs f
low
n
Freight Load Factor
Freight aircraft utilization
Freight load factor and freighter aircraft utilization

But lots of new capacity is still arriving
IATA Economics www.iata.org/economics 38
Source: IATA, Ascend
0
2000
4000
6000
8000
10000
12000
14000
1980 1985 1990 1995 2000 2005 2010 2015
Ton
nes
Additional cargo capacity from new aircraft
Pax fleet belly capacity
Freighter fleet capacity

Yields continue to decline
IATA Economics www.iata.org/economics 39
Source: IATA CASS
1.8
1.9
2.0
2.1
2.2
2.3
2.4
2.5
2.6
2010 2011 2012 2013 2014
US
$ p
er
kil
o
Global average cargo yield, including surcharges

Air cargo is likely to get cheaper
IATA Economics www.iata.org/economics 40
Source: IATA CASS
1.1
1.3
1.5
1.7
1.9
2.1
2.3
2.5
2.7
20
40
60
80
100
120
140
2010 2011 2012 2013 2014 2015
US
$ p
er
ba
rre
l
Brent crude oil prices and global cargo rates
US$
pe
rki
lo
Global cargo rates
Brent crude oil prices
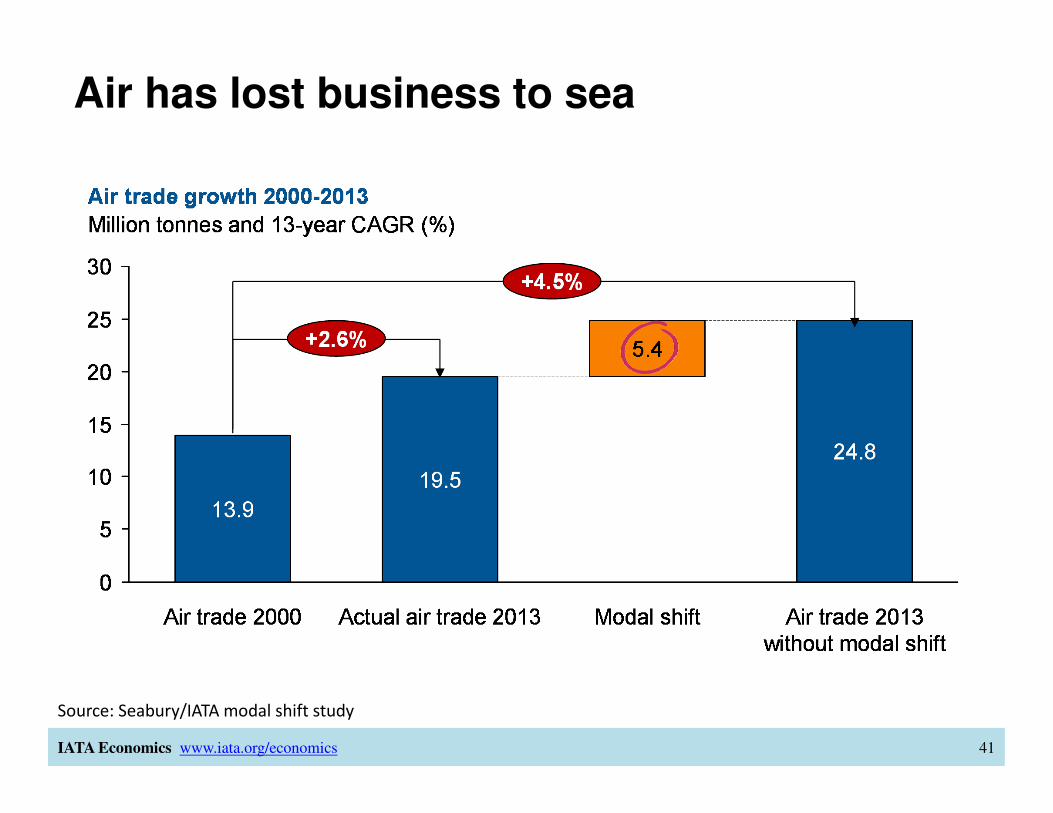
Air has lost business to sea
IATA Economics www.iata.org/economics 41
Source: Seabury/IATA modal shift study

But air cargo’s trade share stable recently
IATA Economics www.iata.org/economics 42
Source: Seabury/IATA modal shift study
0.7
0.8
0.9
1.0
1.1
1995 2000 2005 2010
Ind
ex
rati
o,
eq
ua
l to
1 i
n 2
00
5
FTKs / international trade
-1.5% a year

The recent problem is trade weakness
IATA Economics www.iata.org/economics 43
Source: IATA, Netherlands CPB
-20%
-15%
-10%
-5%
0%
5%
10%
15%
20%
1995 2000 2005 2010
% c
ha
ng
e o
ver
yea
r
Growth of international trade and industrial production
Expected
international
trade growth
International
trade growth
Domestic industrial
production growth

A serious challenge to the future of air cargo
IATA Economics www.iata.org/economics 44
Source: IATA, Netherlands CPB

Growing trade protectionism is a threat
IATA Economics www.iata.org/economics 45
Source: World Trade Organization, Global Trade Alert, B20

The economic backdrop is improving
IATA Economics www.iata.org/economics 46
Source: EIU
0
1
2
3
4
5
6
US Japan Euro Area ASPACexcl Japan
LatinAmerica
MiddleEast North
Africa
Sub-SaharanAfrica
World
% c
han
ge o
ver
yea
r
Forecasts for GDP growth
2014
2015

But risks are still skewed toward the downside
IATA Economics www.iata.org/economics 47
Source: Schroders
Stagflationary
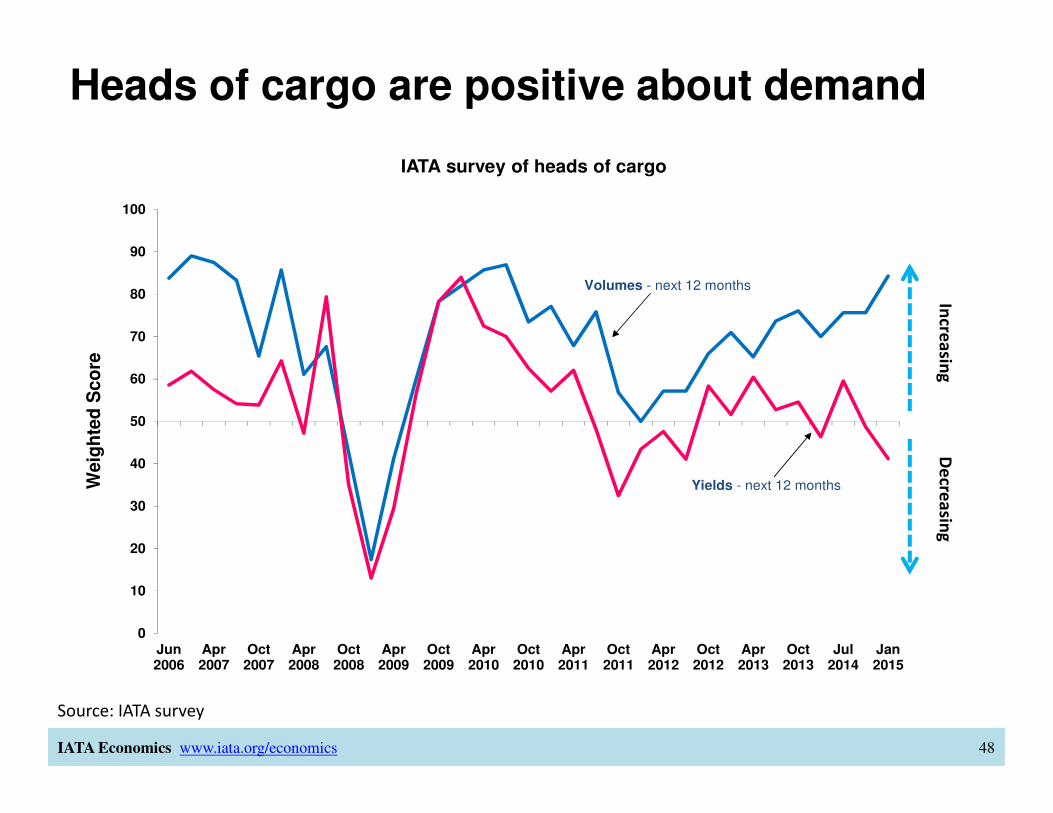
Heads of cargo are positive about demand
IATA Economics www.iata.org/economics 48
Source: IATA survey
0
10
20
30
40
50
60
70
80
90
100
Jun2006
Apr2007
Oct2007
Apr2008
Oct2008
Apr2009
Oct2009
Apr2010
Oct2010
Apr2011
Oct2011
Apr2012
Oct2012
Apr2013
Oct2013
Jul2014
Jan2015
We
igh
ted
Sc
ore
IATA survey of heads of cargo
Volumes - next 12 months
Yields - next 12 months
Incre
asin
gD
ecre
asin
g


World Cargo Symposium 2015
Glyn HughesGlobal Head of Cargo, IATA
The year in review: Did we deliver on promises made?

24.9%e-AWB penetration
World Cargo Symposium 2015
Pharma
Dangerous Goods

SimplifyingCargo Governance
World Cargo Symposium 2015
ModernizingAgency Program

World Cargo Symposium 2015
Enhanced
ULDguidelines
CO2reporting
IATA & UPUMemorandum of Understanding

CSD & e-CSD
Secure freight
ACI
EU ACC3

World Cargo Symposium 2015
Transforming the air cargo industry
MatrixFacility capabilities

World Cargo Symposium 2015


World Cargo Symposium 2015
Executive Round Table: Instruments for global and regional development
� Moderator: � Andrew Herdman, Director General AAPA
� Executives:� Tony Tyler, IATA DG and CEO
� Kunio Mikuriya, Secretary General WCO
� Xiaozhun Yi, Deputy Director General WTO

World Cargo Symposium 2015
NETWORKING LUNCHSponsored by
In Exhibition


World Cargo Symposium 2015
Improving Air Cargo:The Customer’s View
� Moderator: � Tom Windmuller, IATA SVP Airport, Passenger, Cargo and
Security (APCS)
� Shippers� Robert Mellin, Head of Distribution Logistics, Ericsson
� Alex Xu, Associate Supply Chain Director, Lilly Suzhou Pharmaceutical Co., Ltd
� Chris Welsh, Secretary General, Global Shippers Forum

World Cargo Symposium 2015
IATA 2015 global shippers survey
� Short online questionnaire
� 336 answers received in 6 weeks
� Part of IATA’s overall transformation strategy
� Good feedback for airlines
� We know because we asked!

World Cargo Symposium 2015
Do survey respondents ship by air?
Yes 316 94%
No 20 6%
Total 336 100%

World Cargo Symposium 2015
How satisfied are airfreight customers?
Average score for the 316 customers using air
How satisfied are you with the air cargo services that you have used in the last 12 months?
(1 = not satisfied at all -- 10 = extremely satisfied)
7.08very unhappy
customers7%
World Cargo Symposium 2015
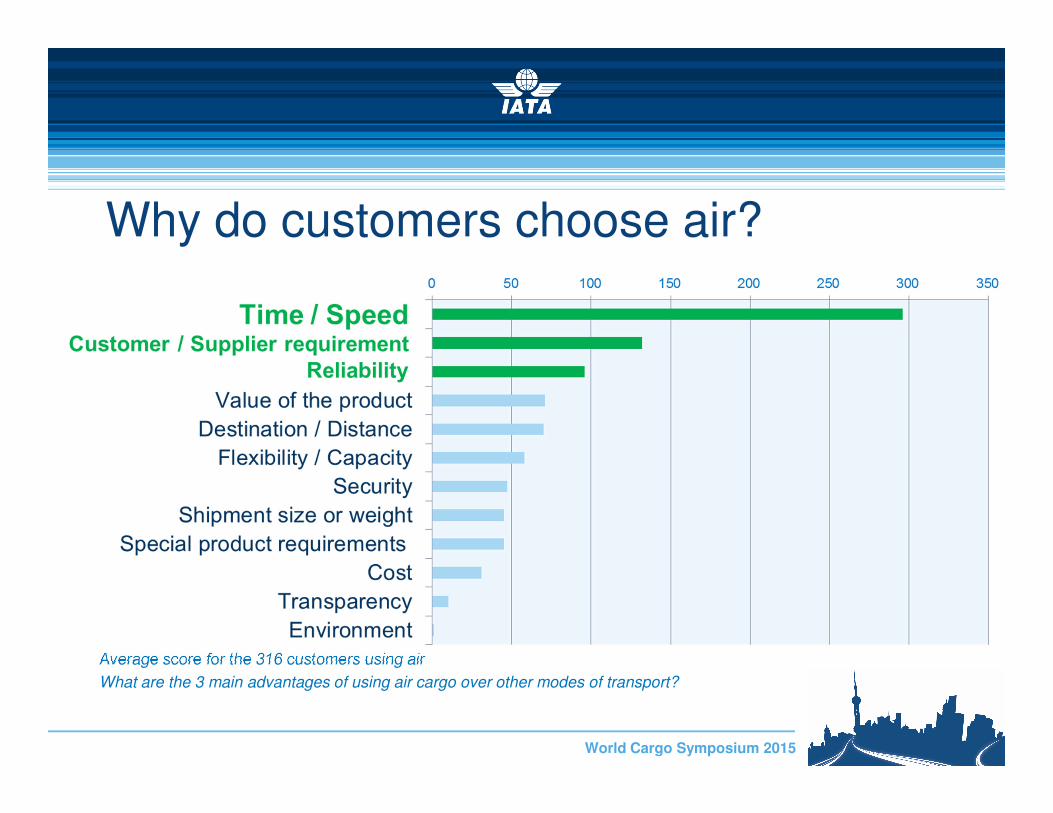
Why do customers choose air?
Average score for the 316 customers using air
What are the 3 main advantages of using air cargo over other modes of transport?

World Cargo Symposium 2015
What’s wrong with air cargo?
Air cargo represents less than
0.5% of our shipments but
around 2% of time and effort
spent – Too complex! Cargo not flying as booked,
offloads common, partial shipments
– Lack of transparency!
Replies to inquiries for simple
things like rates can take days!
& Poor websites to handle
transactions on my own – Poor customer service, very old-fashion!
Long lead times compared to
cost – Value proposition is weak!
It's a pain to pick up and drop off
cargo – Painful experience!
[Time & temperature sensitive]
products not handled very well in
airports – Lack of quality!
To much repetitive data entry for
necessary documentation –Inefficient processes!
When something goes wrong it
takes time to get information – Lack of visibility & real-time information!

World Cargo Symposium 2015
Is air freight competitive w/ other modes?
Equally 130 41%
More 70 22%
Less 125 36%
No response 1 <1%

World Cargo Symposium 2015
Is air cargo innovative?
Equally 148 47%
More 106 33%
Less 61 19%
No response 1 <1%

World Cargo Symposium 2015
Improving Air Cargo:The Customer’s View
� Moderator: � Tom Windmuller, IATA SVP Airport, Passenger, Cargo and
Security (APCS)
� Shippers� Robert Mellin, Head of Distribution Logistics, Ericsson
� Alex Xu, Associate Supply Chain Director, Lilly Suzhou Pharmaceutical Co., Ltd
� Chris Welsh, Secretary General, Global Shippers Forum

World Cargo Symposium 2015
Air Cargo 2015: What is the impact of key recent trends to the air cargo industry?
� Marco Bloemen
� Senior Vice President Seabury Group

Confidential – not for third party distribution © Seabury Group 2015
Air Cargo 2015: Recent trends and impact on air cargo industry
More insights, better decisions...
10.Mar.15
72Confidential – not for third party distribution © Seabury Group 2015
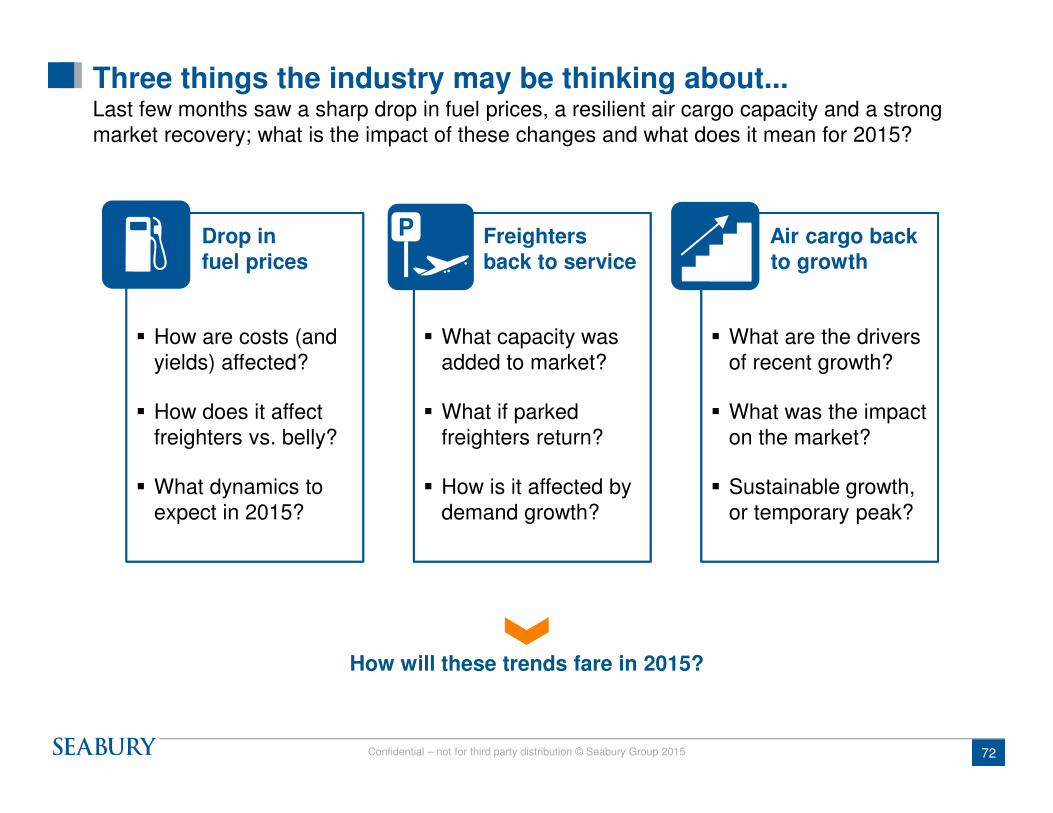
Air cargo backto growth
� What are the drivers of recent growth?
� What was the impact on the market?
� Sustainable growth, or temporary peak?
Freightersback to service
� What capacity was added to market?
� What if parked freighters return?
� How is it affected by demand growth?
Drop in fuel prices
� How are costs (and yields) affected?
� How does it affect freighters vs. belly?
� What dynamics to expect in 2015?
Three things the industry may be thinking about...Last few months saw a sharp drop in fuel prices, a resilient air cargo capacity and a strong market recovery; what is the impact of these changes and what does it mean for 2015?
P
How will these trends fare in 2015?

73Confidential – not for third party distribution © Seabury Group 2015
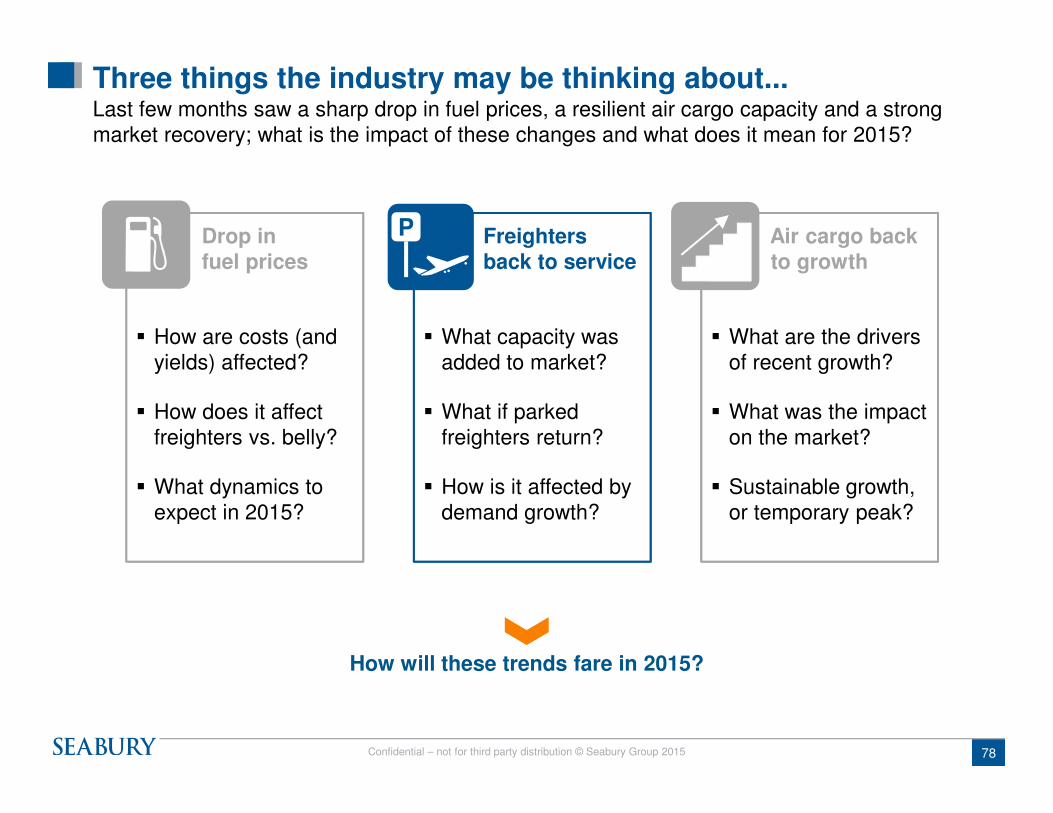
Air cargo backto growth
� What are the drivers of recent growth?
� What was the impact on the market?
� Sustainable growth, or temporary peak?
Freightersback to service
� What capacity was added to market?
� What if parked freighters return?
� How is it affected by demand growth?
Drop in fuel prices
� How are costs (and yields) affected?
� How does it affect freighters vs. belly?
� What dynamics to expect in 2015?
Three things the industry may be thinking about...Last few months saw a sharp drop in fuel prices, a resilient air cargo capacity and a strong market recovery; what is the impact of these changes and what does it mean for 2015?
P
How will these trends fare in 2015?

74Confidential – not for third party distribution © Seabury Group 2015
110
80
70
100
90
60
50
Oct-2014
Jan-2015
Jul-2014
Apr-2014
Jan-2014
Oct-2013
Jul-2013
Apr-2013
Jan-2013
What to predict for 2015?Predictions for fuel price drop for the full year 2015 vary; as usual with fuel, several scenarios are plausible; yields are far less volatile and have historically shown lesser variations
Global yields vs. jet fuel price1
Index (fuel Jan 2014 = 100; yield Q1’ 14= 100)
1) Jet fuel is U.S. Gulf Coast Kerosene-Type Jet Fuel Spot Price FOB (Dollars per Gallon); Source: U.S. Energy Information Administration; IATA (December 2014 forecast); IATA e-Chartbook: IATA’s forecast of jet kerosene prices from December 2014; IEA’s forecast of Brent crude oil prices from its market report 2015; Seabury Analysis
IATA predicts jet fuel price to drop 14%, IEA forecasts a 45% decrease in crude oil prices
Jet fuel
Gross yield (quarterly)

75Confidential – not for third party distribution © Seabury Group 2015
Drop in fuel price will stimulate freighter contributionFreighter contribution may have largely benefited from recent drop in fuel prices; even though yield will have suffered a drop, it is likely to be largely offset by fuel cost saving
Impact of fuel and yield changes on freighter contribution$M, per year, per aircraft
Note: evaluates illustrative Europe – Asia rotation on 747-400F, at average utilization of 10.1BH/day, average load factor of 85%, average gross yield of $2.05/kg in 2014, annual revenue of ~$67M per year; cost include: aircraft leasing cost; crew cost; maintenance cost; fuel burn; navigation; landing; handling. Fuel cost assumes $2.70/gal in 2014. Illustrative contribution, actual contribution will depend on several factorsSource: industry benchmark cost; Seabury analysis
Gross yield downside
-5%
Fuel costsaving -30%
+7.7
Freighter contribution
(2015)
Freighter contribution
(2014)
-3.4
11.1
0.9
8.6
Illustrative example:
operating 1x 747-400F
three times a week on
Europe – Asia rotation
Significant change in contribution of
$ 7.7 Million per year per freighter
Change in fuel price largely offsets drop in yields

76Confidential – not for third party distribution © Seabury Group 2015
Several fuel vs. yield scenarios are positive for freightersEven though fuel price is “difficult” to forecast, expected full year 2015 drop is most likely greater than the anticipated change in yield
Impact of fuel & yield changes, on freighter contributionChange in contribution ($M, per year, per aircraft)
Note: evaluates illustrative Europe – Asia rotation on 747-400F, at average utilization of 10.1BH/day, average load factor of 85%, average gross yield of $2.05/kg in 2014, annual revenue of ~$67M per year; cost include: aircraft leasing cost; crew cost; maintenance cost; fuel burn; navigation; landing; handling. Fuel cost assumes $2.70/gal in 2014. Illustrative contribution, actual contribution will depend on several factorsSource: industry benchmark cost; Seabury analysis
$ 0 M $ -3.4 M $ -6.7 M $ -10.1 M $ -13.5 M
$ 3.7 M $ 0.3 M $ -3 M $ -6.4 M $ -9.8 M
$ 7.4 M $ 4 M $ 0.7 M $ -2.7 M $ -6.1 M
$ 11.1 M $ 7.7 M $ 4.3 M $ 1 M $ -2.4 M
$ 14.8 M $ 11.4 M $ 8 M $ 4.7 M $ 1.3 M
$ 18.5 M $ 15.1 M $ 11.7 M $ 8.4 M $ 5 M
0
-10%
-20%
-30%
-40%
-50%
0 -5% -10% -15% -20%
Change in fuel cost (%)
Change in gross yield (%)
Unless yields drop stronger than -5%, fuel price drop should translate to substantial cost savings

77Confidential – not for third party distribution © Seabury Group 2015
Belly contribution is substantially larger than contribution in freighter operations, in part due to a significantly lower fuel cost component
Change in incremental belly contributionUSD/kg
Change in freighter contributionUSD/kg
Note: evaluates illustrative Europe – Asia rotation on 747-400F, at average utilization of 10.1BH/day, average load factor of 85%, average gross yield of $2.05/kg in 2014, annual revenue of ~$67M per year; Using ACMI cost (aircraft leasing-; crew-; maintenance- and insurance cost), fuel burn and other Direct Operating Cost (navigation-; landing- and handling cost). Fuel cost assumes $2.70/gal in 2014. Illustrative contribution, actual contribution will depend on several factors. Source: industry benchmark cost; Seabury analysis
Other DOC
Fuel (incremental)
Contribution
2015 scenario
1.95
8%
1.30(67%)
2014 average
2.05
12%
1.33(65%)
Average yield 1%
Contribution
1.95
40%
13%
2.05
55%
Fuel cost
Other DOC
ACMI
2015 scenario2014 average
2015 scenario assumes:-5% on yields
-30% on fuel cost
Recent fuel price drops generates much more contribution for freighters, compared to belly operators
Fuel impact is more positive for freighters than for bellies
78Confidential – not for third party distribution © Seabury Group 2015
Air cargo backto growth
� What are the drivers of recent growth?
� What was the impact on the market?
� Sustainable growth, or temporary peak?
Freightersback to service
� What capacity was added to market?
� What if parked freighters return?
� How is it affected by demand growth?
Drop in fuel prices
� How are costs (and yields) affected?
� How does it affect freighters vs. belly?
� What dynamics to expect in 2015?
Three things the industry may be thinking about...Last few months saw a sharp drop in fuel prices, a resilient air cargo capacity and a strong market recovery; what is the impact of these changes and what does it mean for 2015?
How will these trends fare in 2015?
P
79Confidential – not for third party distribution © Seabury Group 2015
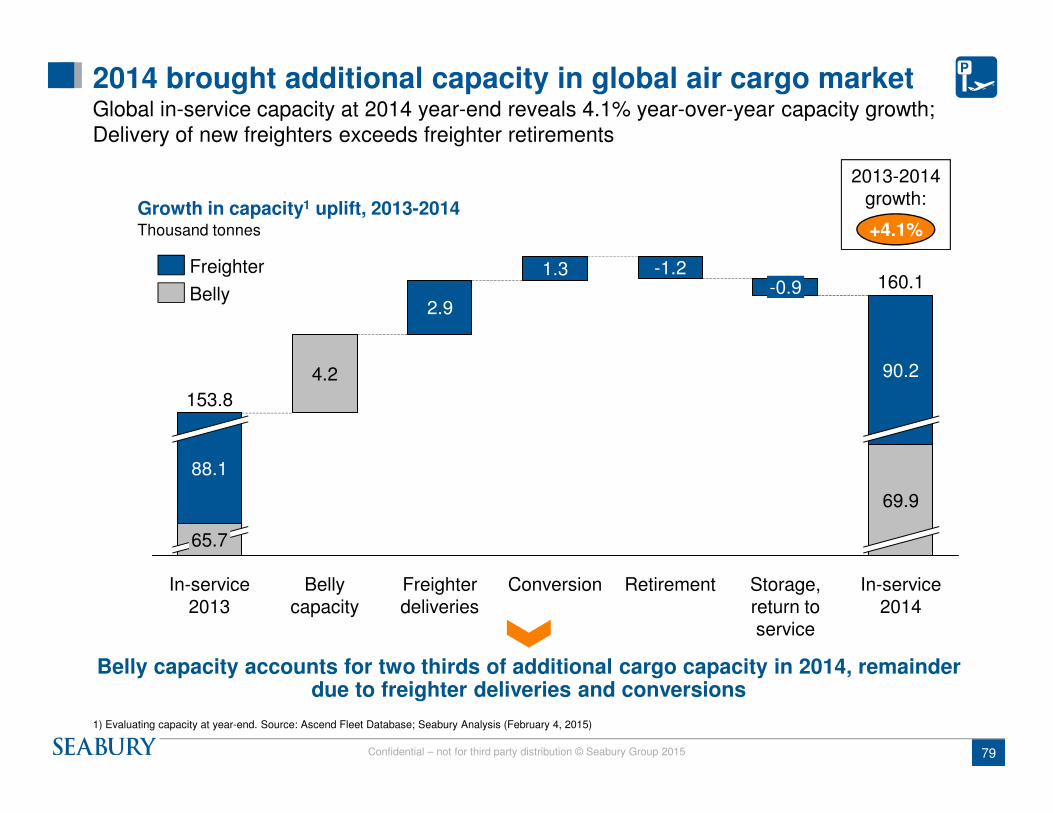
Growth in capacity1 uplift, 2013-2014
2014 brought additional capacity in global air cargo marketGlobal in-service capacity at 2014 year-end reveals 4.1% year-over-year capacity growth; Delivery of new freighters exceeds freighter retirements
Thousand tonnes
1) Evaluating capacity at year-end. Source: Ascend Fleet Database; Seabury Analysis (February 4, 2015)
2013-2014 growth:
+4.1%
P
Belly capacity accounts for two thirds of additional cargo capacity in 2014, remainder due to freighter deliveries and conversions
90.2
69.9
-0.9 160.1
2.9
Bellycapacity
4.2
Freighterdeliveries
1.3
Conversion In-service 2014
Storage, return to service
88.1
65.7
153.8
In-service 2013
-1.2
Retirement
Belly
Freighter

80Confidential – not for third party distribution © Seabury Group 2015
Roughly 110 large wide body freighters are currently parked16x 747-400F are parked and could potentially return to service, if favourable market conditions persist; 92 other older large aircraft are also parked
Size of large freighter fleet, February 2015# aircraft
1) Fleet age of aircraft in serviceSource: Ascend Fleet Database (February 4, 2015); Seabury analysis
3327
32
747-200F747-400P2F
MD11F767F
4
747-400F
16
777FA330F747-8F
2
What will a more favourable fuel and market outlook do to the parked freighter fleet?
In Service
Storage
Firm order
Option/LOI
Fleetage1
3 3 4 13 21 2919 23
P
Younger aircraft types Older aircraft types

81Confidential – not for third party distribution © Seabury Group 2015
What if parked capacity would return?With 16x 747-400F currently parked, capacity may increase by ~1% if these are all brought back to service; the older and less likely to return capacity may add as much as ~6.8% in total
In-service capacity uplift: what if parked capacity would return?Thousand tonnes and % increase
Source: Ascend Fleet Database (February 4, 2015); Seabury analysis
What-if capacity uplift
171.0
Belly
Freighter
33x 747-200F
3.3
32x MD11F27x 747-400P2F
5.4
16x 747-400F4x 767F
1.8
2x 747-8F
0.2
In-servicecapacity 2014
160.1
Belly
Freighter
+1.1%
What freighter capacity would return to service?
+3.4% +2.1%
P
0.2%
Returns to service may have limited impact, even if all parked 747-400F’s are brought back to service
+6.8%
Younger aircraft types Older aircraft types
Total %

82Confidential – not for third party distribution © Seabury Group 2015
Parked capacity fluctuates with market growthPeriods of negative air trade growth have led to increased parked freighter share
Parked freighter capacity, quarterly, 2001-2014% parked capacity vs. in-service capacity (weight)
Source: Ascend fleet database (February 2015); Seabury Global Trade Database
6%
8%
10%
12%
14%
16%
18%
20%
-30%
-20%
-10%
0%
10%
20%
30%
40%
201020092008 2011 20132012 20142001 20062005 200720042002 2003
Share of parked capacity (left axis)
Air trade growth (right axis)
Air trade growth, YoY (%)
Recent parked freighter share hovers around 14%

83Confidential – not for third party distribution © Seabury Group 2015
Drop in fuel prices
� How are costs (and yields) affected?
� How does it affect freighters vs. belly?
� What dynamics to expect in 2015?
Three things the industry may be thinking about...Last few months saw a sharp drop in fuel prices, a resilient air cargo capacity and a strong market recovery; what is the impact of these changes and what does it mean for 2015?
How will these trends fare in 2015?
Air cargo backto growth
� What are the drivers of recent growth?
� What was the impact on the market?
� Sustainable growth, or temporary peak?
Freightersback to service
� What capacity was added to market?
� What if parked freighters return?
� How is it affected by demand growth?
P

84Confidential – not for third party distribution © Seabury Group 2015
Thank you China’s exports...China’s exports were behind nearly four out of every seven tonnes of additional air cargo in 2014; other Asian exports and European exports round up the rest of the growth
Breakdown of 2013-2014 air cargo growthThousand tonnes
Note: Estimating UN comtrade for 2014. Source: Seabury Global Trade Database, World Monthly dataset (March 3rd, 2015)
Middle East & S. Asia
21,631
Europe
158
Air cargo 2013
China Air cargo 2014
398
OtherLatin America
North America
20,868
OtherAsia
Exporting region
High-tech contributes to 40% of China
incremental air tonnes
China provides 52% of global incremental
air tonnes

85Confidential – not for third party distribution © Seabury Group 2015
...and North America’s importsWhile China and the rest of Asia have catalyzed exports, imports from North America have increased, from either China, Europe or Asia Pacific
Incremental air cargo 2013-2014, top changesThousand tonnes
Note: Estimating UN comtrade for 2014. Source: Seabury Global Trade Database (March 3rd, 2015)
Europe to North America
77
China to Middle East & South Asia
77
China to North America
161
North America to Europe
46
China to Europe
49
China to Other Asia
59
Other Asia to North America
70
North American imports
Other
US west coast port strike has triggered strong growth in Asia to North America air trade

86Confidential – not for third party distribution © Seabury Group 2015
Zhengzhou’s Foxconn factory drives China’s mobiles exportsExports of mobile phones gradually shifted to Zhengzhou (Foxconn) now manufacturing ~50% of the new iPhones, while the remainder likely originates from Shanghai (Pegatron)
China’s air exports of mobile phonesThousand tonnes
Source: Seabury Trade Database China Monthly (March 9th, 2015)
JA MMFJDNOSAJJM OA SJJ DNAMFJDNOSAJJMAMFJDNOSAJJMAMFJ
2011 2012 2013 2014
iPhone 5iPhone
5C & 5S
Others
Shanghai
Zhengzhou
Beijing
What will be the impact of next iPhone launch?
iPhone 4SiPhone 5C 8GBLaunch of: iPhone 6
‘15

87Confidential – not for third party distribution © Seabury Group 2015
Fashion
Each dot is a zip code, size represents amount of air weight traded in 2013-2014
High Tech
Consumer goods
Automotive Capital equipment
Industrial consumables
China shipper data provides new insightsData on individual shippers captures trends to/from regions within China
Note: Using trade (import and export) by air. Source: Seabury Global Trade Database, China shipper dataset (February 23, 2015)
High granularity in shipper data helps to understand the heartbeat of China growth

88Confidential – not for third party distribution © Seabury Group 2015
Air cargo backto growth
� What are the drivers of recent growth?
� What was the impact on the market?
� Sustainable growth, or temporary peak?
Freightersback to service
� What capacity was added to market?
� What if parked freighters return?
� How is it affected by demand growth?
Drop in fuel prices
� How are costs (and yields) affected?
� How does it affect freighters vs. belly?
� What dynamics to expect in 2015?
Three things the industry may be thinking about...Last few months saw a sharp drop in fuel prices, a resilient air cargo capacity and a strong market recovery; what is the impact of these changes and what does it mean for 2015?
P


World Cargo Symposium 2015
Matching Supply and DemandMeeting customer expectations – a panel discussion
� Moderator: � Enno Osinga, Senior Vice President, Cargo Amsterdam Schiphol
Airport & Vice Chair TIACA
� Panelists� Oliver Evans, Chief Cargo Officer Swiss World Cargo
� James Woodrow, Director Cargo Cathay Pacific Airways
� Michael Steen, CCO and EVP Atlas Air

World Cargo Symposium 2015
Chairman’s Closing Remarks
� Glyn Hughes
� Global Head of Cargo, IATA

World Cargo Symposium 2015
COFFEE BREAKIn Exhibition


World Cargo Symposium 2015
Thank you
For more information
� Visit our websitewww.iata.org/cargo
� Subscribe to Cargo Trackerwww.iata.org/optin
� Follow us on Twitter http://twitter.com/iata