Embed Size (px)
Citation preview
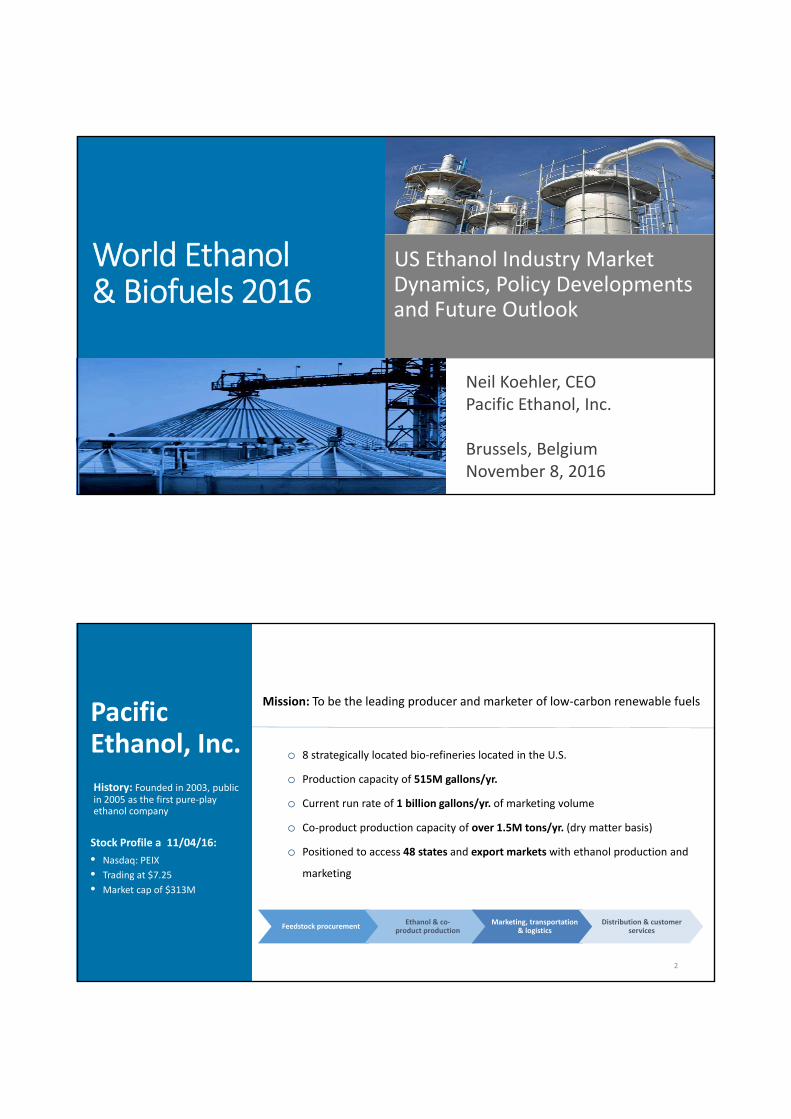
World Ethanol & Biofuels 2016
US Ethanol Industry Market Dynamics, Policy Developments and Future Outlook
Neil Koehler, CEO Pacific Ethanol, Inc.
Brussels, BelgiumNovember 8, 2016
2
o 8 strategically located bio‐refineries located in the U.S.
o Production capacity of 515M gallons/yr.
o Current run rate of 1 billion gallons/yr. of marketing volume
o Co‐product production capacity of over 1.5M tons/yr. (dry matter basis)
o Positioned to access 48 states and export markets with ethanol production and
marketing
Mission: To be the leading producer and marketer of low‐carbon renewable fuels
Feedstock procurementEthanol & co‐
product productionMarketing, transportation
& logisticsDistribution & customer
services
Pacific Ethanol, Inc.
History: Founded in 2003, public in 2005 as the first pure‐play ethanol company
Stock Profile a 11/04/16:
• Nasdaq: PEIX
• Trading at $7.25
• Market cap of $313M
3
HQPacific Ethanol PlantsMarketing Partner PlantsTerminals
Pekin, IL100mmgyWet Mill
Pekin, IL60mmgyDry Mill
Aurora, NE110mmgyDry Mill
Boardman, OR40mmgyDry Mill
Burley, ID60mmgyDry Mill
Stockton, CA60mmgyDry Mill
Madera, CA40mmgyDry Mill
Aurora, NE45mmgyDry Mill
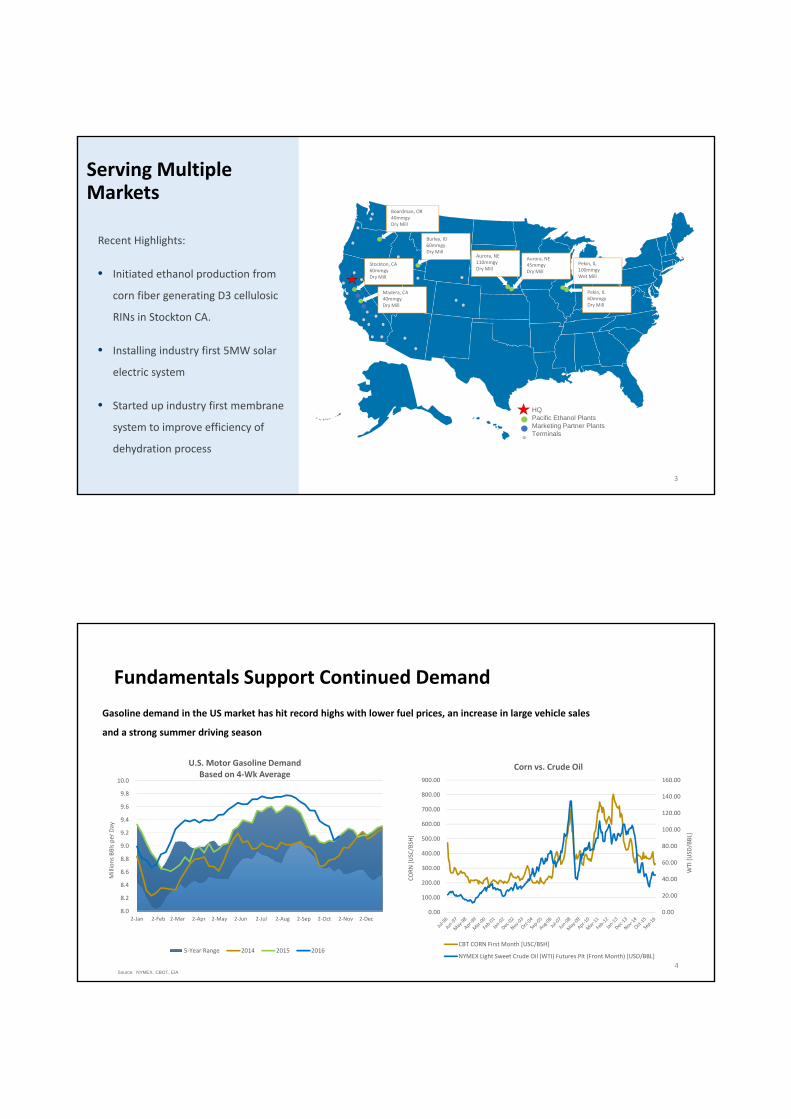
Serving Multiple Markets
Recent Highlights:
• Initiated ethanol production from
corn fiber generating D3 cellulosic
RINs in Stockton CA.
• Installing industry first 5MW solar
electric system
• Started up industry first membrane
system to improve efficiency of
dehydration process
4
Fundamentals Support Continued Demand
Gasoline demand in the US market has hit record highs with lower fuel prices, an increase in large vehicle sales
and a strong summer driving season
Source: NYMEX, CBOT, EIA
0.00
20.00
40.00
60.00
80.00
100.00
120.00
140.00
160.00
0.00
100.00
200.00
300.00
400.00
500.00
600.00
700.00
800.00
900.00
WTI [USD
/BBL]
CORN [USC/BSH
]
Corn vs. Crude Oil
CBT CORN First Month [USC/BSH]
NYMEX Light Sweet Crude Oil (WTI) Futures Pit (Front Month) [USD/BBL]
8.0
8.2
8.4
8.6
8.8
9.0
9.2
9.4
9.6
9.8
10.0
2‐Jan 2‐Feb 2‐Mar 2‐Apr 2‐May 2‐Jun 2‐Jul 2‐Aug 2‐Sep 2‐Oct 2‐Nov 2‐Dec
Millions BBls per Day
U.S. Motor Gasoline Demand Based on 4‐Wk Average
5‐Year Range 2014 2015 2016
5
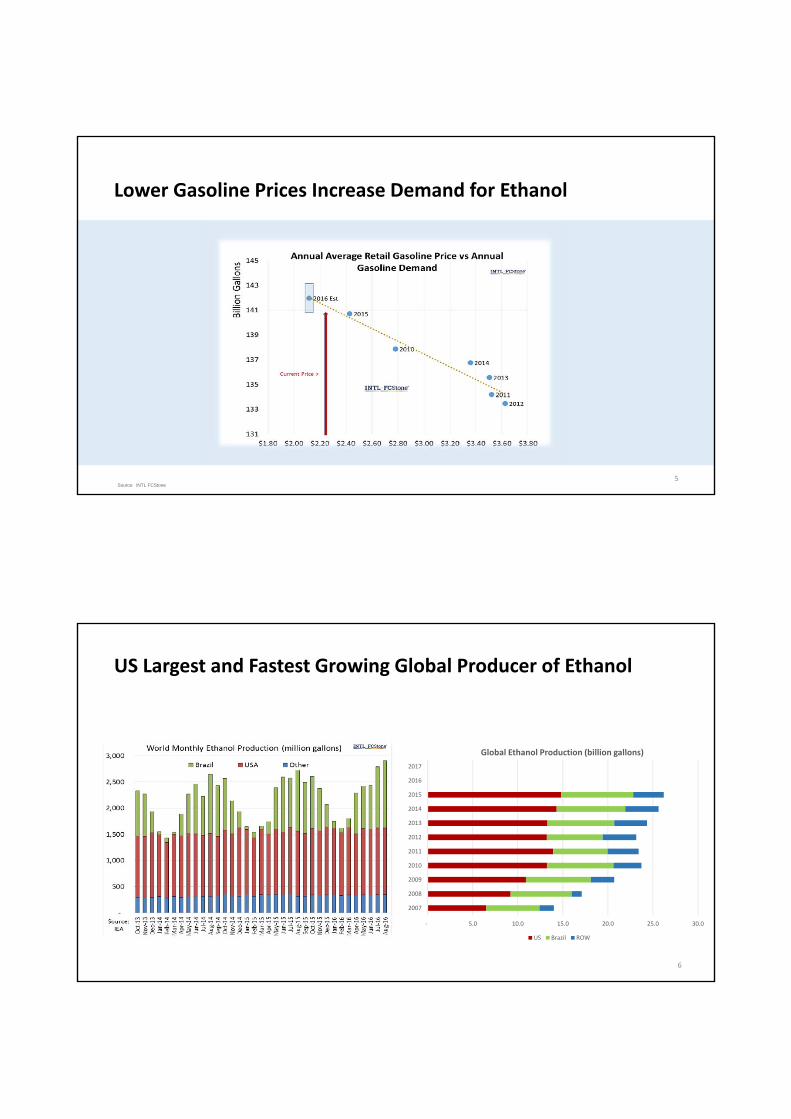
Lower Gasoline Prices Increase Demand for Ethanol
Source: INTL FCStone
6
US Largest and Fastest Growing Global Producer of Ethanol
‐ 5.0 10.0 15.0 20.0 25.0 30.0
2007
2008
2009
2010
2011
2012
2013
2014
2015
2016
2017
Global Ethanol Production (billion gallons)
US Brazil ROW
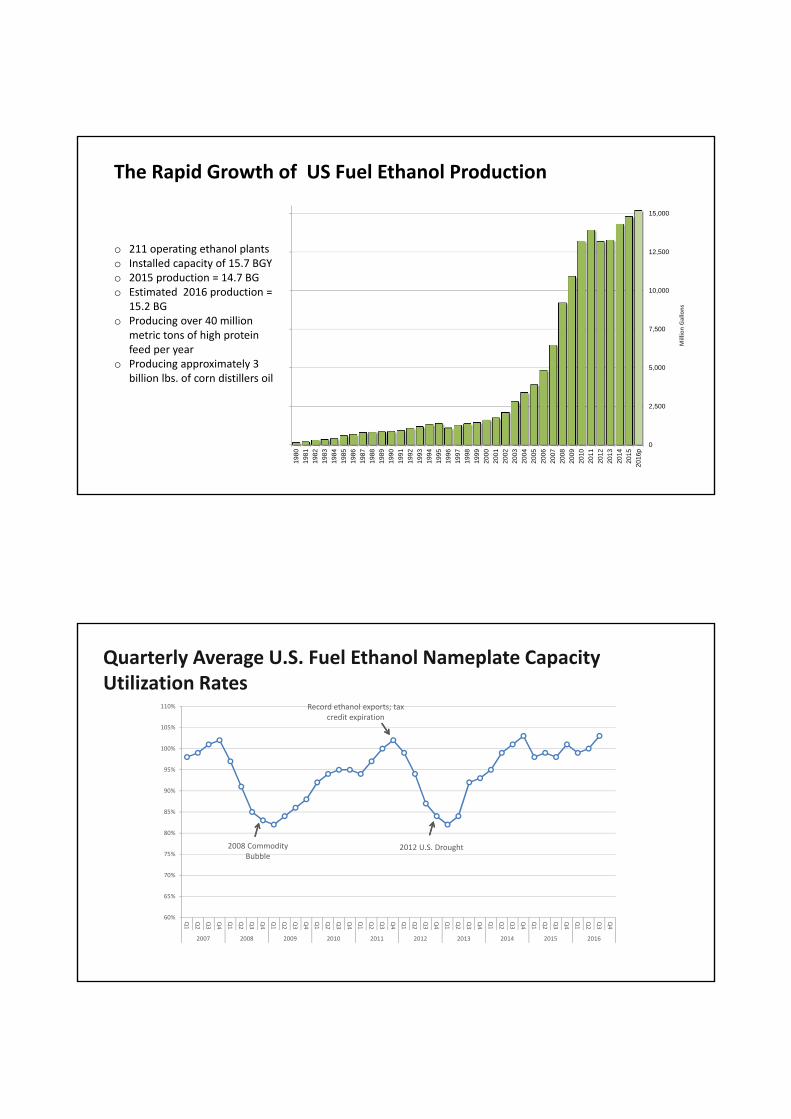
0
2,500
5,000
7,500
10,000
12,500
15,000
1980
1981
1982
1983
1984
1985
1986
1987
1988
1989
1990
1991
1992
1993
1994
1995
1996
1997
1998
1999
2000
2001
2002
2003
2004
2005
2006
2007
2008
2009
2010
2011
2012
2013
2014
2015
2016
p
Million Gallons
The Rapid Growth of US Fuel Ethanol Production
o 211 operating ethanol plantso Installed capacity of 15.7 BGYo 2015 production = 14.7 BGo Estimated 2016 production =
15.2 BGo Producing over 40 million
metric tons of high protein feed per year
o Producing approximately 3 billion lbs. of corn distillers oil
60%
65%
70%
75%
80%
85%
90%
95%
100%
105%
110%
Q1
Q2
Q3
Q4
Q1
Q2
Q3
Q4
Q1
Q2
Q3
Q4
Q1
Q2
Q3
Q4
Q1
Q2
Q3
Q4
Q1
Q2
Q3
Q4
Q1
Q2
Q3
Q4
Q1
Q2
Q3
Q4
Q1
Q2
Q3
Q4
Q1
Q2
Q3
Q4
2007 2008 2009 2010 2011 2012 2013 2014 2015 2016
2008 Commodity Bubble
2012 U.S. Drought
Record ethanol exports; tax credit expiration
Quarterly Average U.S. Fuel Ethanol Nameplate Capacity Utilization Rates
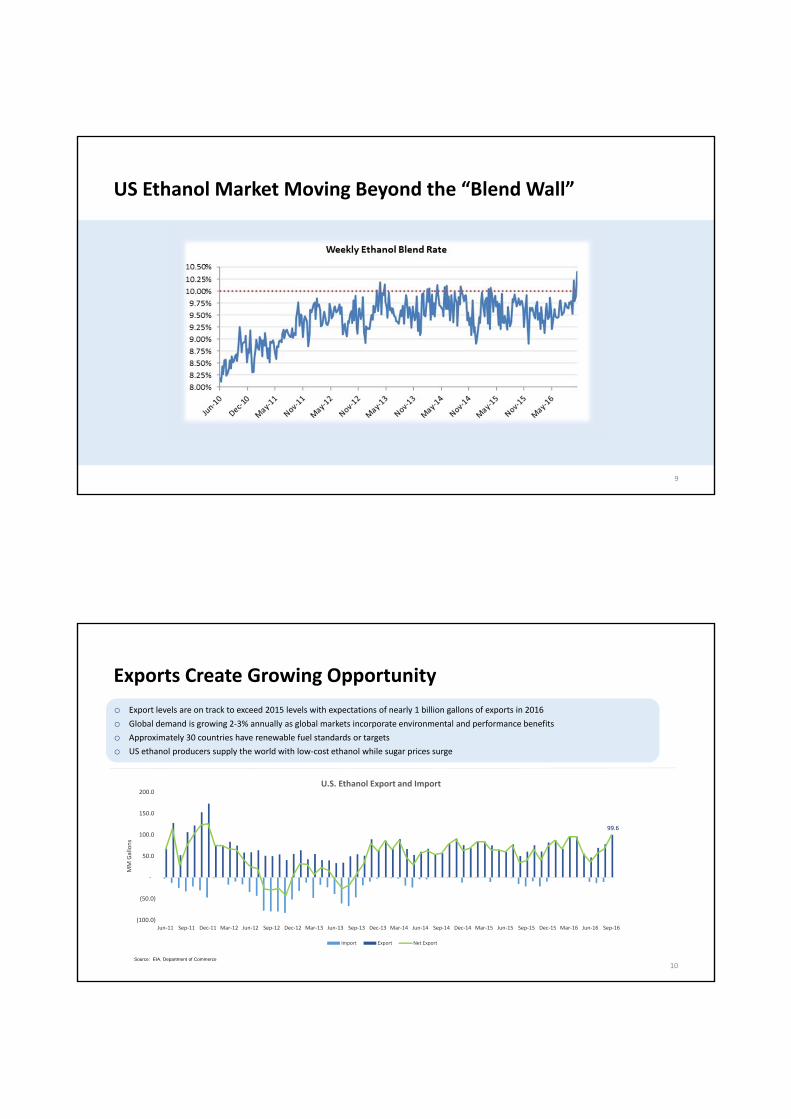
US Ethanol Market Moving Beyond the “Blend Wall”
9
10
o Export levels are on track to exceed 2015 levels with expectations of nearly 1 billion gallons of exports in 2016
o Global demand is growing 2‐3% annually as global markets incorporate environmental and performance benefits
o Approximately 30 countries have renewable fuel standards or targets
o US ethanol producers supply the world with low‐cost ethanol while sugar prices surge
Source: EIA, Department of Commerce
Exports Create Growing Opportunity
99.6
(100.0)
(50.0)
‐
50.0
100.0
150.0
200.0
Jun‐11 Sep‐11 Dec‐11 Mar‐12 Jun‐12 Sep‐12 Dec‐12 Mar‐13 Jun‐13 Sep‐13 Dec‐13 Mar‐14 Jun‐14 Sep‐14 Dec‐14 Mar‐15 Jun‐15 Sep‐15 Dec‐15 Mar‐16 Jun‐16 Sep‐16
MM Gallons
U.S. Ethanol Export and Import
Import Export Net Export
11Source: EIA
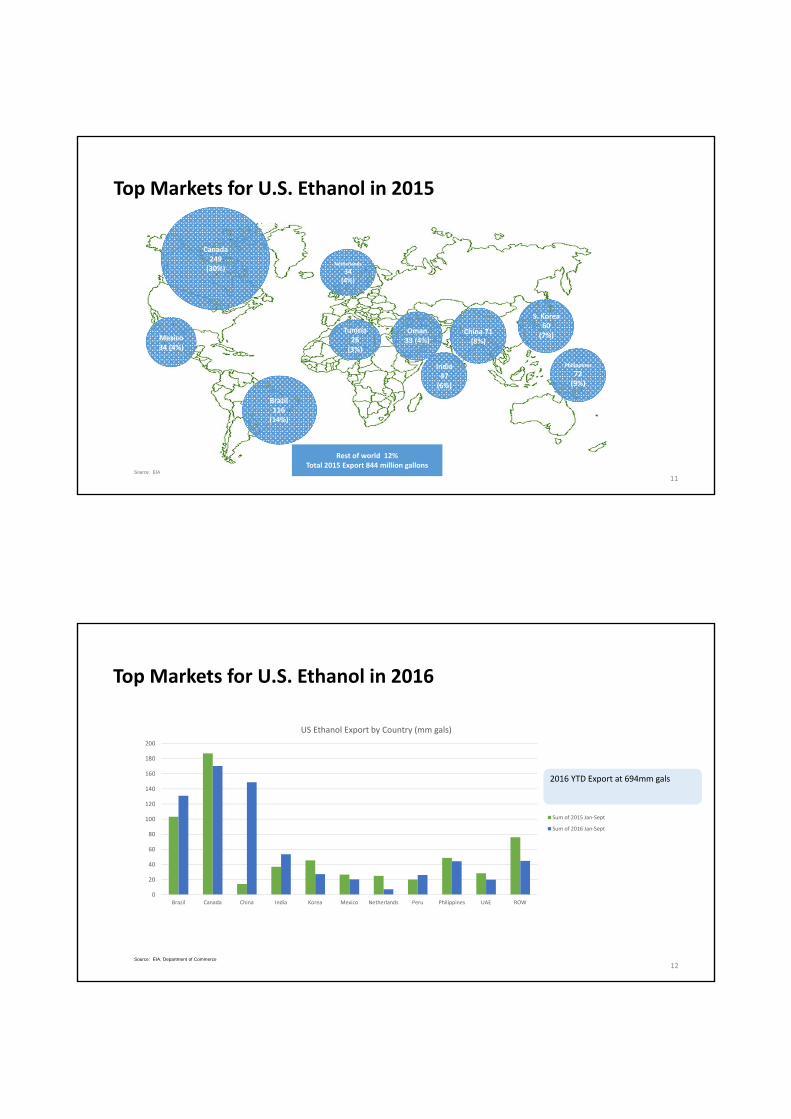
Top Markets for U.S. Ethanol in 2015
Canada249 (30%)
Mexico34 (4%)
Brazil116 (14%)
Oman33 (4%)
Philippines
72 (9%)
Tunisia26 (3%)
Rest of world 12% Total 2015 Export 844 million gallons
India47 (6%)
China 71(8%)
S. Korea 60 (7%)
Netherlands
34 (4%)
Top Markets for U.S. Ethanol in 2016
12
0
20
40
60
80
100
120
140
160
180
200
Brazil Canada China India Korea Mexico Netherlands Peru Philippines UAE ROW
US Ethanol Export by Country (mm gals)
Sum of 2015 Jan‐Sept
Sum of 2016 Jan‐Sept
Source: EIA, Department of Commerce
2016 YTD Export at 694mm gals
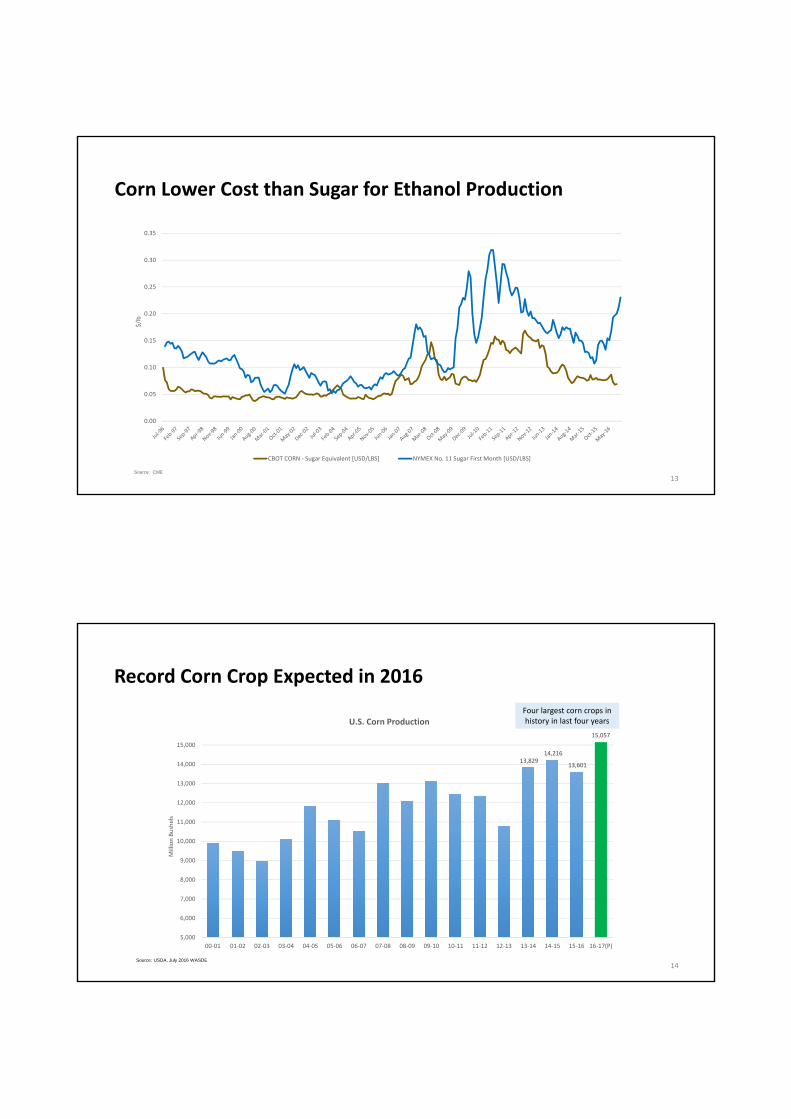
Corn Lower Cost than Sugar for Ethanol Production
0.00
0.05
0.10
0.15
0.20
0.25
0.30
0.35
$/lb
CBOT CORN ‐ Sugar Equivalent [USD/LBS] NYMEX No. 11 Sugar First Month [USD/LBS]
13Source: CME
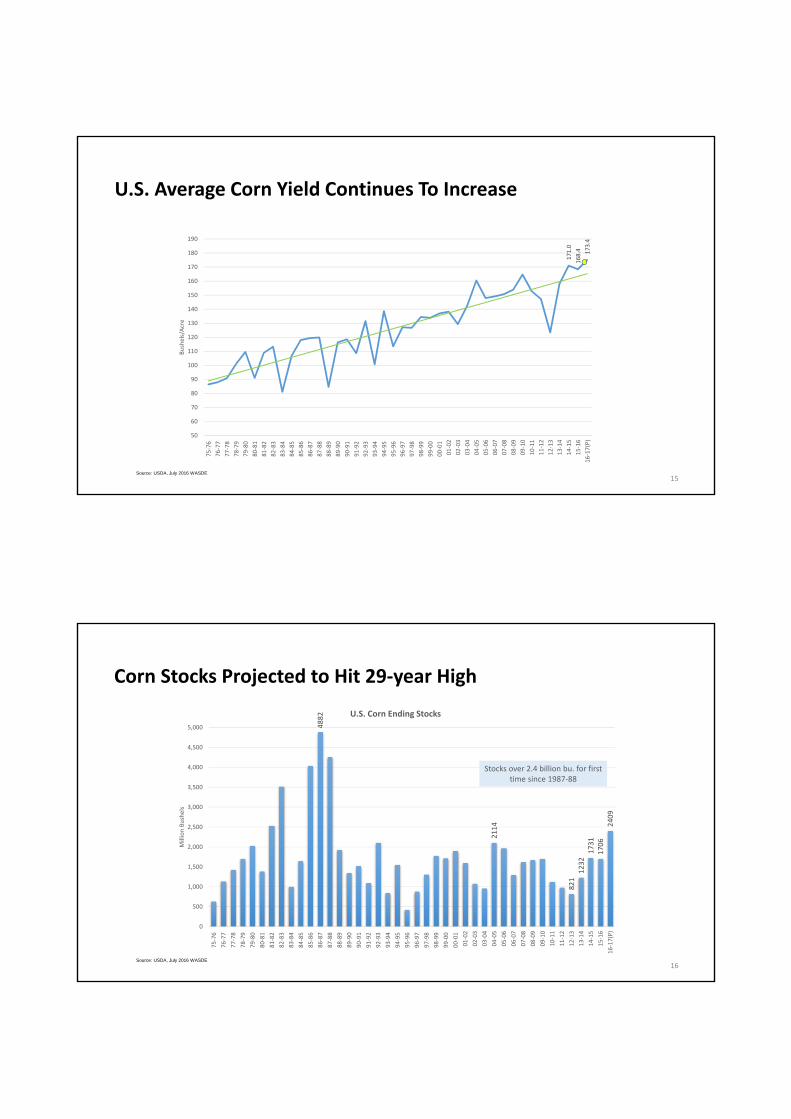
Record Corn Crop Expected in 2016
13,829 14,216
13,601
15,057
5,000
6,000
7,000
8,000
9,000
10,000
11,000
12,000
13,000
14,000
15,000
00‐01 01‐02 02‐03 03‐04 04‐05 05‐06 06‐07 07‐08 08‐09 09‐10 10‐11 11‐12 12‐13 13‐14 14‐15 15‐16 16‐17(P)
Million Bushels
U.S. Corn ProductionFour largest corn crops in history in last four years
Source: USDA, July 2016 WASDE14
171.0
168.4 173.4
50
60
70
80
90
100
110
120
130
140
150
160
170
180
190
75‐76
76‐77
77‐78
78‐79
79‐80
80‐81
81‐82
82‐83
83‐84
84‐85
85‐86
86‐87
87‐88
88‐89
89‐90
90‐91
91‐92
92‐93
93‐94
94‐95
95‐96
96‐97
97‐98
98‐99
99‐00
00‐01
01‐02
02‐03
03‐04
04‐05
05‐06
06‐07
07‐08
08‐ 09
09‐10
10‐11
11‐12
12‐13
13‐14
14‐15
15‐16
16‐17(P)
Bushels/Acre
U.S. Average Corn Yield Continues To Increase
15Source: USDA, July 2016 WASDE
Corn Stocks Projected to Hit 29‐year High
4882
2114
821
12321731
1706
2409
0
500
1,000
1,500
2,000
2,500
3,000
3,500
4,000
4,500
5,000
75‐76
76‐77
77‐78
78‐79
79‐80
80‐81
81‐82
82‐83
83‐84
84‐85
85‐86
86‐87
87‐88
88‐89
89‐90
90‐91
91‐92
92‐93
93‐94
94‐95
95‐96
96‐97
97‐98
98‐99
99‐00
00‐01
01‐02
02‐03
03‐04
04‐05
05‐06
06‐07
07‐08
08‐ 09
09‐10
10‐11
11‐12
12‐13
13‐14
14‐15
15‐16
16‐17(P)
Million Bushels
U.S. Corn Ending Stocks
Stocks over 2.4 billion bu. for first time since 1987‐88
16Source: USDA, July 2016 WASDE
Corn Prices Projected to Hit 10‐year Low in 2016‐17186
198 232 250
205
200
304
420
406
355
518
622
689
446
370
360
315
0
100
200
300
400
500
600
700
800
00‐01 01‐02 02‐03 03‐04 04‐05 05‐06 06‐07 07‐08 08‐09 09‐10 10‐11 11‐12 12‐13 13‐14 14‐15 15‐16 16‐17(P)
Cen
ts/Bushel
U.S. Season Average Corn Prices
17Source: USDA, July 2016 WASDE
18Source: NYMEX, CBOT, EIA
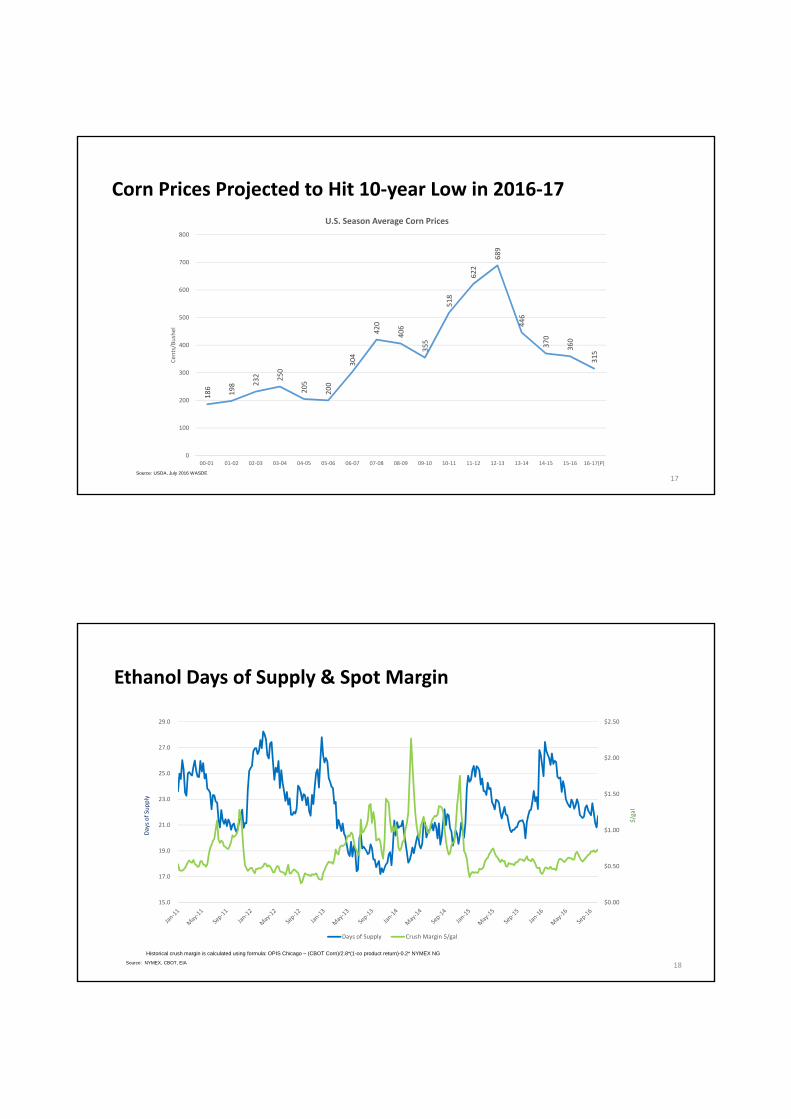
Ethanol Days of Supply & Spot Margin
Historical crush margin is calculated using formula: OPIS Chicago – (CBOT Corn)/2.8*(1-co product return)-0.2* NYMEX NG
$0.00
$0.50
$1.00
$1.50
$2.00
$2.50
15.0
17.0
19.0
21.0
23.0
25.0
27.0
29.0
$/gal
Days of Supply
Days of Supply Crush Margin $/gal
19Source: Renewable Fuels Association.
o Breaching the blend wall
o Only Federal fuels policy to reduce greenhouse gas (GHG) emissions
o Need regulatory certainty to secure development of cellulosic ethanol projects
Renewable Fuel Standard
‐
5.0
10.0
15.0
20.0
25.0
30.0
35.0
40.0
2005 2006 2007 2008 2009 2010 2011 2012 2013 2014 2015 2016 2017 2018 2019 2020 2021 2022
Billion Gallons
RFS‐ Conventional Biofuel RFS ‐ Advanced Biofuel Installed Capacity
Industry Production Total Demand Incl. Net Export blend ratio @ 10%
blend ratio @ 15% Domestic Ethanol Demand
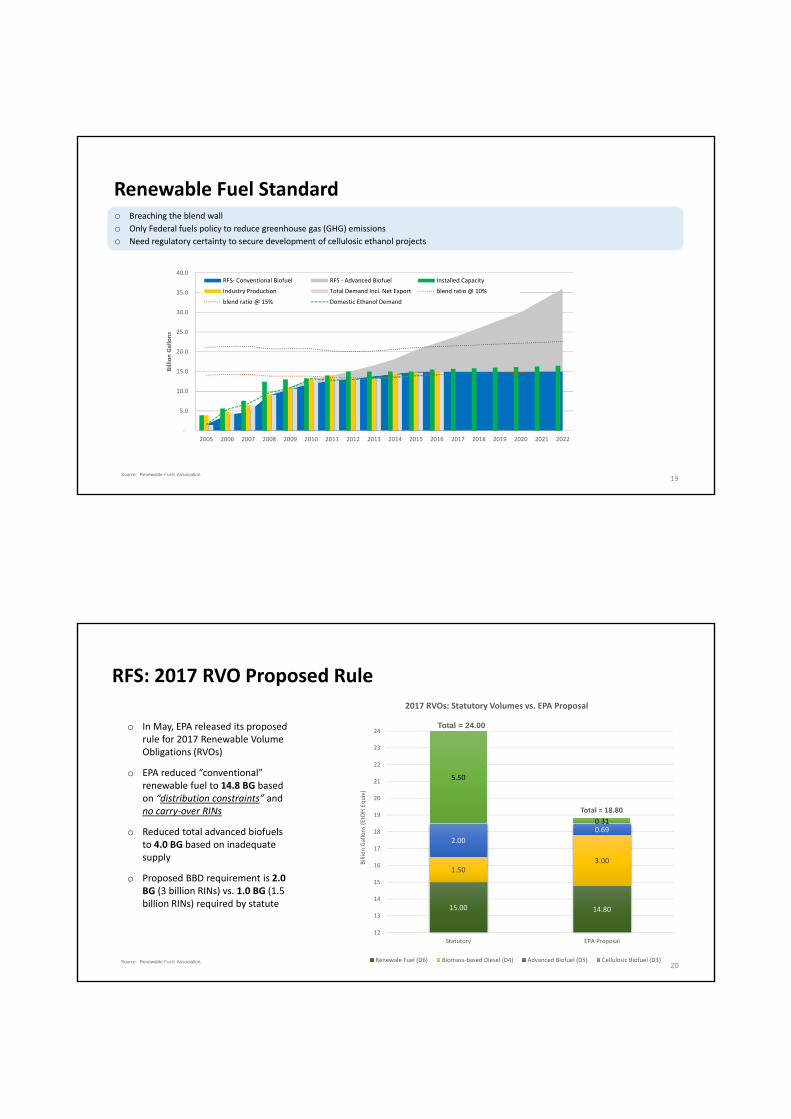
RFS: 2017 RVO Proposed Rule
15.00 14.80
1.503.00
2.00
0.69
5.50
0.31
12
13
14
15
16
17
18
19
20
21
22
23
24
Statutory EPA Proposal
Billion Gallons (EtOH Equiv)
2017 RVOs: Statutory Volumes vs. EPA Proposal
Renewale Fuel (D6) Biomass‐based Diesel (D4) Advanced Biofuel (D5) Cellulosic Biofuel (D3)
o In May, EPA released its proposed rule for 2017 Renewable Volume Obligations (RVOs)
o EPA reduced “conventional” renewable fuel to 14.8 BG based on “distribution constraints” andno carry‐over RINs
o Reduced total advanced biofuels to 4.0 BG based on inadequate supply
o Proposed BBD requirement is 2.0 BG (3 billion RINs) vs. 1.0 BG (1.5 billion RINs) required by statute
Total = 18.80
Total = 24.00
20Source: Renewable Fuels Association.
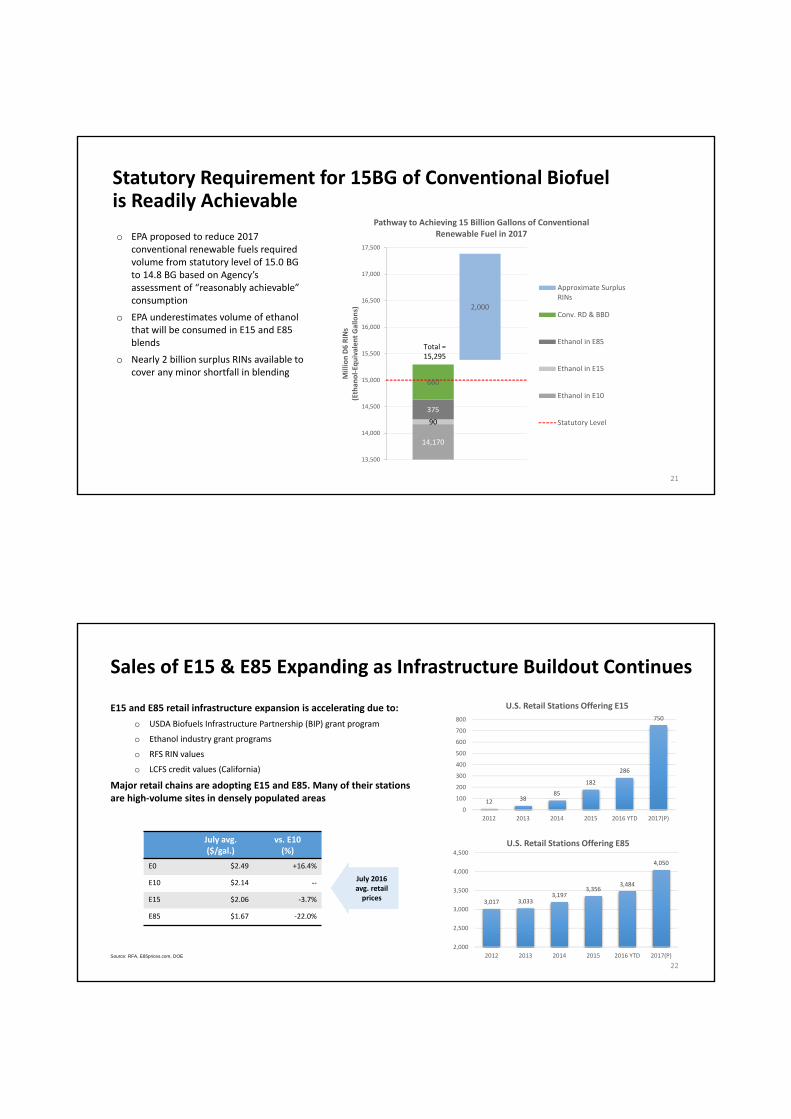
Statutory Requirement for 15BG of Conventional Biofuel is Readily Achievable
o EPA proposed to reduce 2017 conventional renewable fuels required volume from statutory level of 15.0 BG to 14.8 BG based on Agency’s assessment of “reasonably achievable” consumption
o EPA underestimates volume of ethanol that will be consumed in E15 and E85 blends
o Nearly 2 billion surplus RINs available to cover any minor shortfall in blending
21
14,170
90
375
660
2,000
13,500
14,000
14,500
15,000
15,500
16,000
16,500
17,000
17,500
Million D6 RINs
(Ethan
ol‐Eq
uivalen
t Gallons)
Pathway to Achieving 15 Billion Gallons of Conventional Renewable Fuel in 2017
Approximate SurplusRINs
Conv. RD & BBD
Ethanol in E85
Ethanol in E15
Ethanol in E10
Statutory Level
Total = 15,295
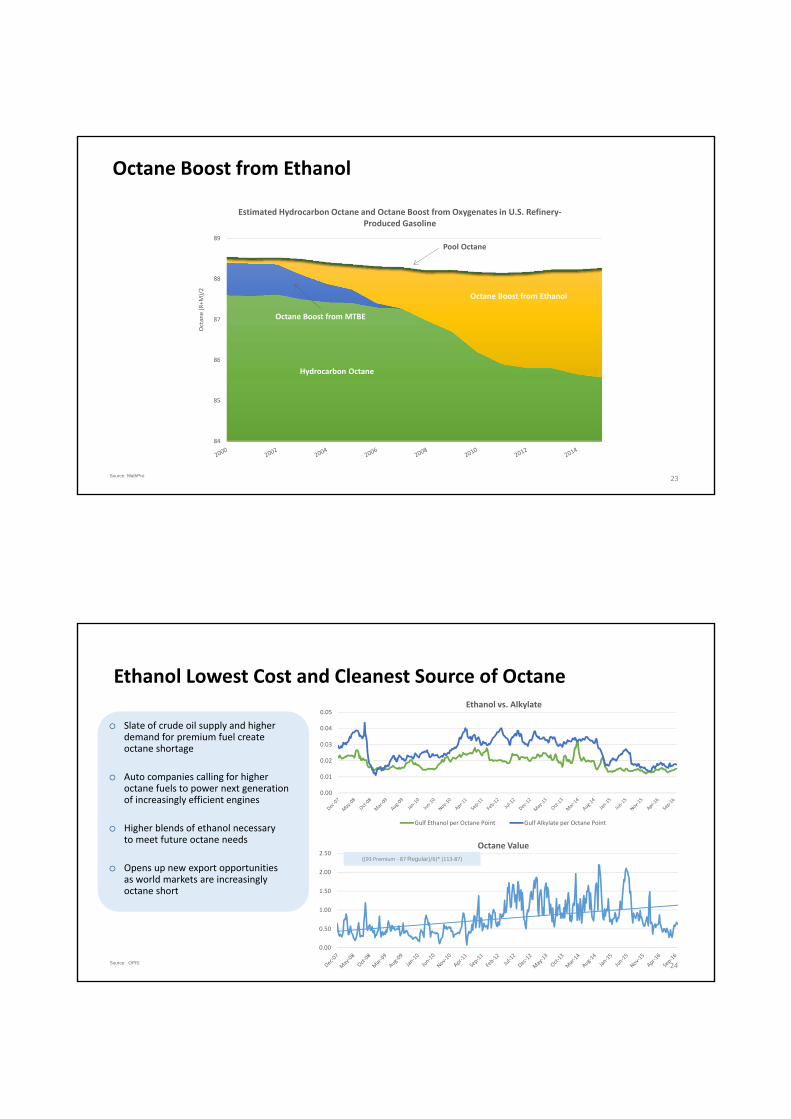
Sales of E15 & E85 Expanding as Infrastructure Buildout Continues
12 3885
182
286
750
0
100
200
300
400
500
600
700
800
2012 2013 2014 2015 2016 YTD 2017(P)
U.S. Retail Stations Offering E15
3,017 3,0333,197
3,3563,484
4,050
2,000
2,500
3,000
3,500
4,000
4,500
2012 2013 2014 2015 2016 YTD 2017(P)
U.S. Retail Stations Offering E85
E15 and E85 retail infrastructure expansion is accelerating due to:
o USDA Biofuels Infrastructure Partnership (BIP) grant program
o Ethanol industry grant programs
o RFS RIN values
o LCFS credit values (California)
Major retail chains are adopting E15 and E85. Many of their stations are high‐volume sites in densely populated areas
Source: RFA, E85prices.com, DOE
July avg.($/gal.)
vs. E10(%)
E0 $2.49 +16.4%
E10 $2.14 ‐‐
E15 $2.06 ‐3.7%
E85 $1.67 ‐22.0%
July 2016 avg. retail prices
22
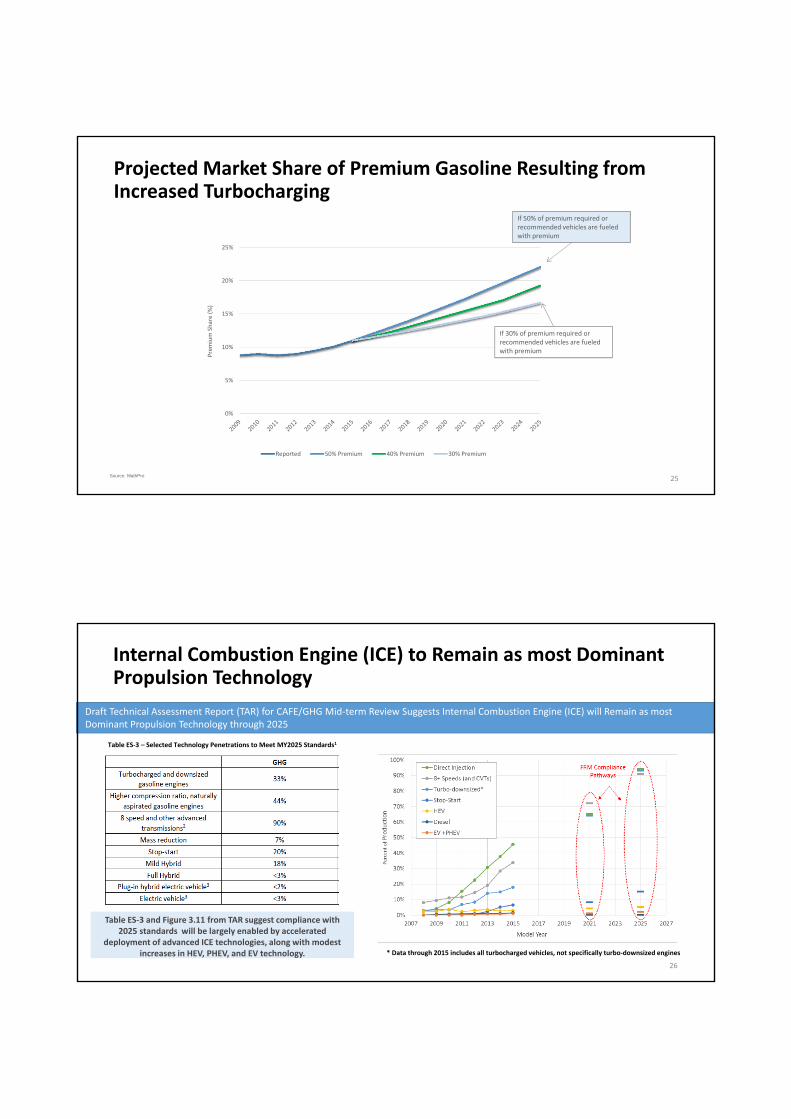
84
85
86
87
88
89
Octane (R+M
)/2
Estimated Hydrocarbon Octane and Octane Boost from Oxygenates in U.S. Refinery‐Produced Gasoline
Pool Octane
Octane Boost from Ethanol
Hydrocarbon Octane
Octane Boost from MTBE
23Source: MathPro
Octane Boost from Ethanol
24
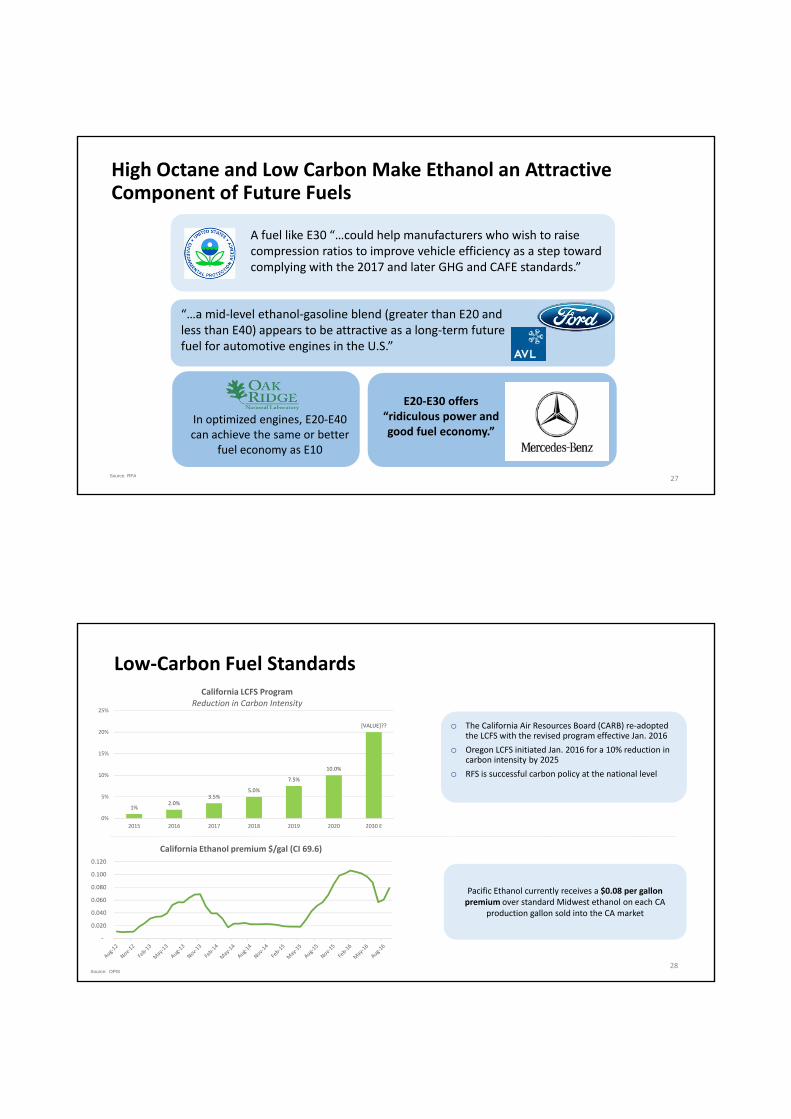
o Slate of crude oil supply and higher demand for premium fuel create octane shortage
o Auto companies calling for higher octane fuels to power next generation of increasingly efficient engines
o Higher blends of ethanol necessary to meet future octane needs
o Opens up new export opportunities as world markets are increasingly octane short
Ethanol Lowest Cost and Cleanest Source of Octane
Source: OPIS
0.00
0.50
1.00
1.50
2.00
2.50Octane Value
((93 Premium ‐ 87 Regular)/6)* (113‐87)
0.00
0.01
0.02
0.03
0.04
0.05Ethanol vs. Alkylate
Gulf Ethanol per Octane Point Gulf Alkylate per Octane Point
0%
5%
10%
15%
20%
25%
Premium Share (%)
Reported 50% Premium 40% Premium 30% Premium
If 30% of premium required or recommended vehicles are fueled with premium
If 50% of premium required or recommended vehicles are fueled with premium
25Source: MathPro
Projected Market Share of Premium Gasoline Resulting from Increased Turbocharging
Internal Combustion Engine (ICE) to Remain as most Dominant Propulsion Technology
26
Table ES‐3 and Figure 3.11 from TAR suggest compliance with 2025 standards will be largely enabled by accelerated
deployment of advanced ICE technologies, along with modest increases in HEV, PHEV, and EV technology.
Draft Technical Assessment Report (TAR) for CAFE/GHG Mid‐term Review Suggests Internal Combustion Engine (ICE) will Remain as most Dominant Propulsion Technology through 2025
Table ES‐3 – Selected Technology Penetrations to Meet MY2025 Standards1
* Data through 2015 includes all turbocharged vehicles, not specifically turbo‐downsized engines
High Octane and Low Carbon Make Ethanol an Attractive Component of Future Fuels
A fuel like E30 “…could help manufacturers who wish to raise compression ratios to improve vehicle efficiency as a step toward complying with the 2017 and later GHG and CAFE standards.”
E20‐E30 offers “ridiculous power and good fuel economy.”
“…a mid‐level ethanol‐gasoline blend (greater than E20 and less than E40) appears to be attractive as a long‐term future fuel for automotive engines in the U.S.”
In optimized engines, E20‐E40 can achieve the same or better
fuel economy as E10
27Source: RFA
28Source: OPIS
o The California Air Resources Board (CARB) re‐adopted the LCFS with the revised program effective Jan. 2016
o Oregon LCFS initiated Jan. 2016 for a 10% reduction in carbon intensity by 2025
o RFS is successful carbon policy at the national level
Pacific Ethanol currently receives a $0.08 per gallon premium over standard Midwest ethanol on each CA
production gallon sold into the CA market
Low‐Carbon Fuel Standards
‐
0.020
0.040
0.060
0.080
0.100
0.120
California Ethanol premium $/gal (CI 69.6)
1%2.0%
3.5%5.0%
7.5%
10.0%
[VALUE]??
0%
5%
10%
15%
20%
25%
2015 2016 2017 2018 2019 2020 2030 E
California LCFS ProgramReduction in Carbon Intensity
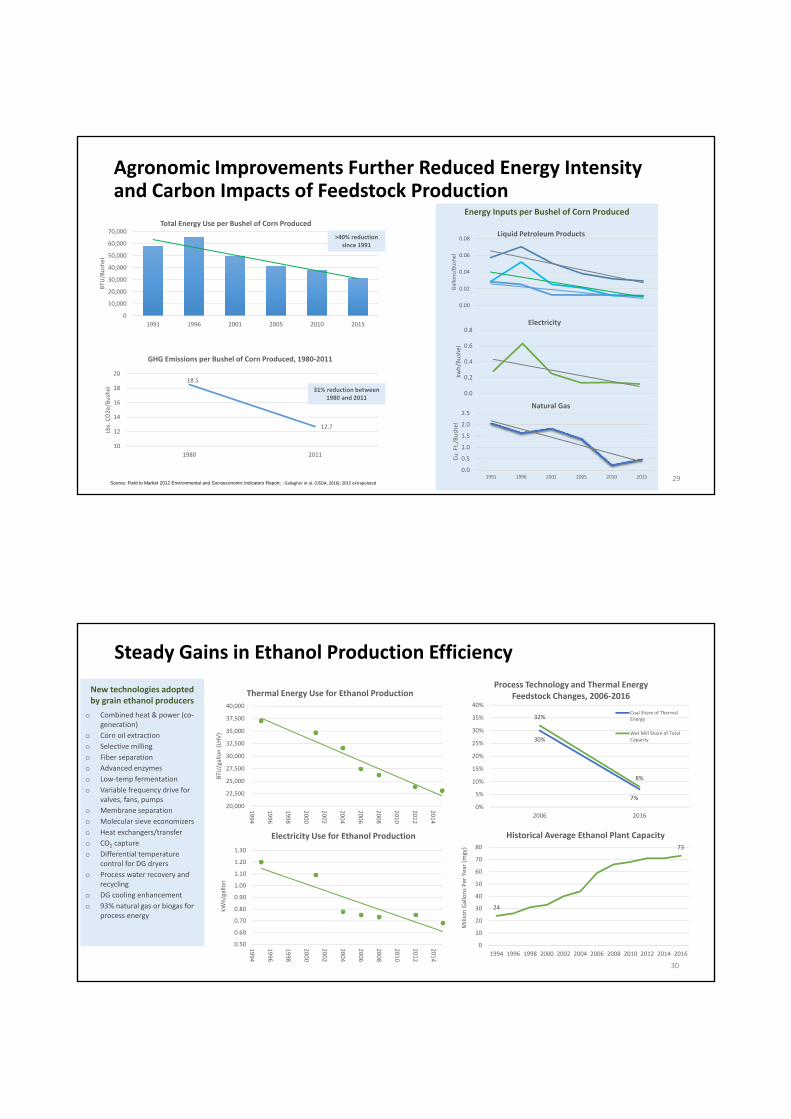
Agronomic Improvements Further Reduced Energy Intensity and Carbon Impacts of Feedstock Production
Energy Inputs per Bushel of Corn Produced
0
10,000
20,000
30,000
40,000
50,000
60,000
70,000
1991 1996 2001 2005 2010 2015
BTU
/Bushel
Total Energy Use per Bushel of Corn Produced
18.5
12.7
10
12
14
16
18
20
1980 2011
Lbs. CO2e/Bushel
GHG Emissions per Bushel of Corn Produced, 1980‐2011
>40% reduction since 1991
31% reduction between 1980 and 2011
Source: Field to Market 2012 Environmental and Socioeconomic Indicators Report; : Gallagher et al. (USDA, 2016); 2015 extrapolated29
0.0
0.5
1.0
1.5
2.0
2.5
1991 1996 2001 2005 2010 2015
Cu. Ft./Bushel
Natural Gas
0.00
0.02
0.04
0.06
0.08
Gallons/Bushel
Liquid Petroleum Products
0.0
0.2
0.4
0.6
0.8
kwh/Bushel
Electricity
Steady Gains in Ethanol Production Efficiency
30%
7%
32%
8%
0%
5%
10%
15%
20%
25%
30%
35%
40%
2006 2016
Process Technology and Thermal Energy Feedstock Changes, 2006‐2016
Coal Share of ThermalEnergy
Wet Mill Share of TotalCapacity
24
73
0
10
20
30
40
50
60
70
80
1994 1996 1998 2000 2002 2004 2006 2008 2010 2012 2014 2016
Million Gallons Per Year (m
gy)
Historical Average Ethanol Plant Capacity
20,000
22,500
25,000
27,500
30,000
32,500
35,000
37,500
40,000
1994
1996
1998
2000
2002
2004
2006
2008
2010
2012
2014
BTU
/gallon (LH
V)
Thermal Energy Use for Ethanol Production
0.50
0.60
0.70
0.80
0.90
1.00
1.10
1.20
1.30
1994
1996
1998
2000
2002
2004
2006
2008
2010
2012
2014
kWh/gallon
Electricity Use for Ethanol Production
New technologies adopted by grain ethanol producers
o Combined heat & power (co‐generation)
o Corn oil extraction
o Selective milling
o Fiber separation
o Advanced enzymes
o Low‐temp fermentation
o Variable frequency drive for valves, fans, pumps
o Membrane separation
o Molecular sieve economizers
o Heat exchangers/transfer
o CO2 capture
o Differential temperature control for DG dryers
o Process water recovery and recycling
o DG cooling enhancement
o 93% natural gas or biogas for process energy
30
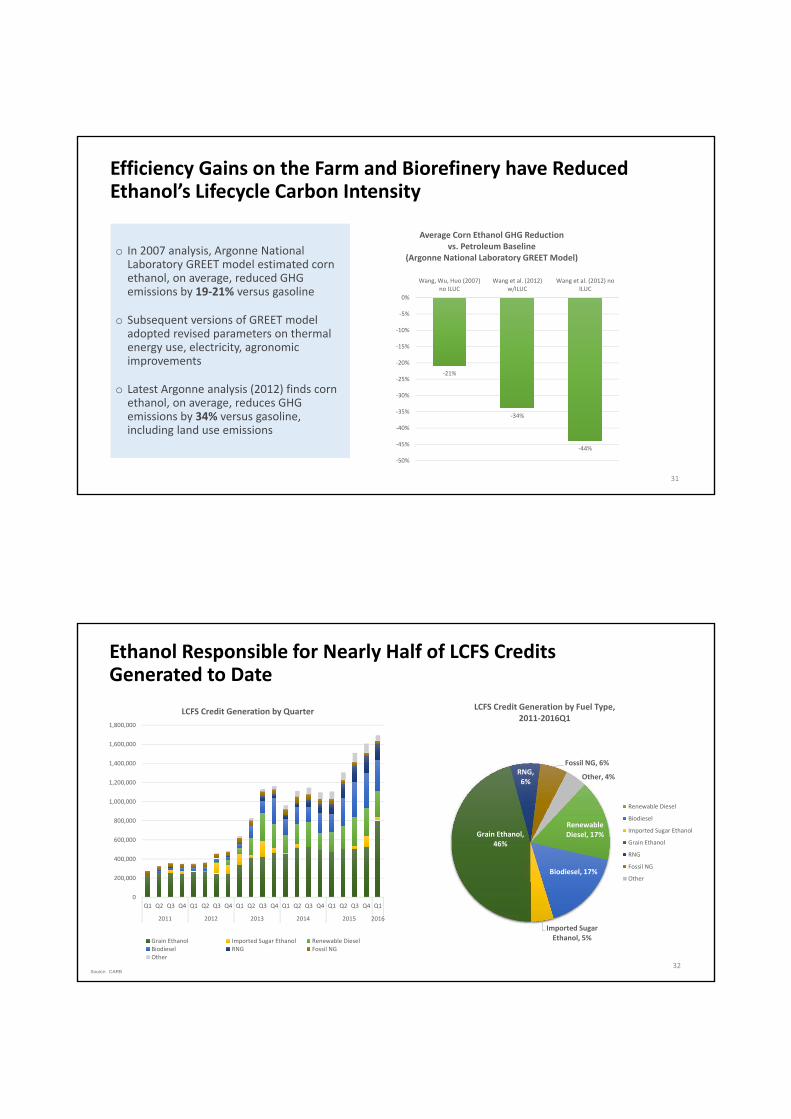
Efficiency Gains on the Farm and Biorefinery have Reduced Ethanol’s Lifecycle Carbon Intensity
‐21%
‐34%
‐44%
‐50%
‐45%
‐40%
‐35%
‐30%
‐25%
‐20%
‐15%
‐10%
‐5%
0%
Wang, Wu, Huo (2007)no ILUC
Wang et al. (2012)w/ILUC
Wang et al. (2012) noILUC
Average Corn Ethanol GHG Reduction vs. Petroleum Baseline
(Argonne National Laboratory GREET Model)o In 2007 analysis, Argonne National Laboratory GREET model estimated corn ethanol, on average, reduced GHG emissions by 19‐21% versus gasoline
o Subsequent versions of GREET model adopted revised parameters on thermal energy use, electricity, agronomic improvements
o Latest Argonne analysis (2012) finds corn ethanol, on average, reduces GHG emissions by 34% versus gasoline, including land use emissions
31
Ethanol Responsible for Nearly Half of LCFS Credits Generated to Date
Renewable Diesel, 17%
Biodiesel, 17%
Imported Sugar Ethanol, 5%
Grain Ethanol, 46%
RNG, 6%
Fossil NG, 6%
Other, 4%
LCFS Credit Generation by Fuel Type, 2011‐2016Q1
Renewable Diesel
Biodiesel
Imported Sugar Ethanol
Grain Ethanol
RNG
Fossil NG
Other
0
200,000
400,000
600,000
800,000
1,000,000
1,200,000
1,400,000
1,600,000
1,800,000
Q1 Q2 Q3 Q4 Q1 Q2 Q3 Q4 Q1 Q2 Q3 Q4 Q1 Q2 Q3 Q4 Q1 Q2 Q3 Q4 Q1
2011 2012 2013 2014 2015 2016
LCFS Credit Generation by Quarter
Grain Ethanol Imported Sugar Ethanol Renewable DieselBiodiesel RNG Fossil NGOther
32Source: CARB
Conclusions
o Lower oil prices increasing ethanol demand
o High Octane Low Carbon benefits driving growth
o Industry continues to innovate to improve efficiencies and meet environmental performance standards
o US exports support market growth globally
The Future Has Never Been Brighter
THANK YOU
34