Embed Size (px)
Citation preview
X‐ray Diffraction
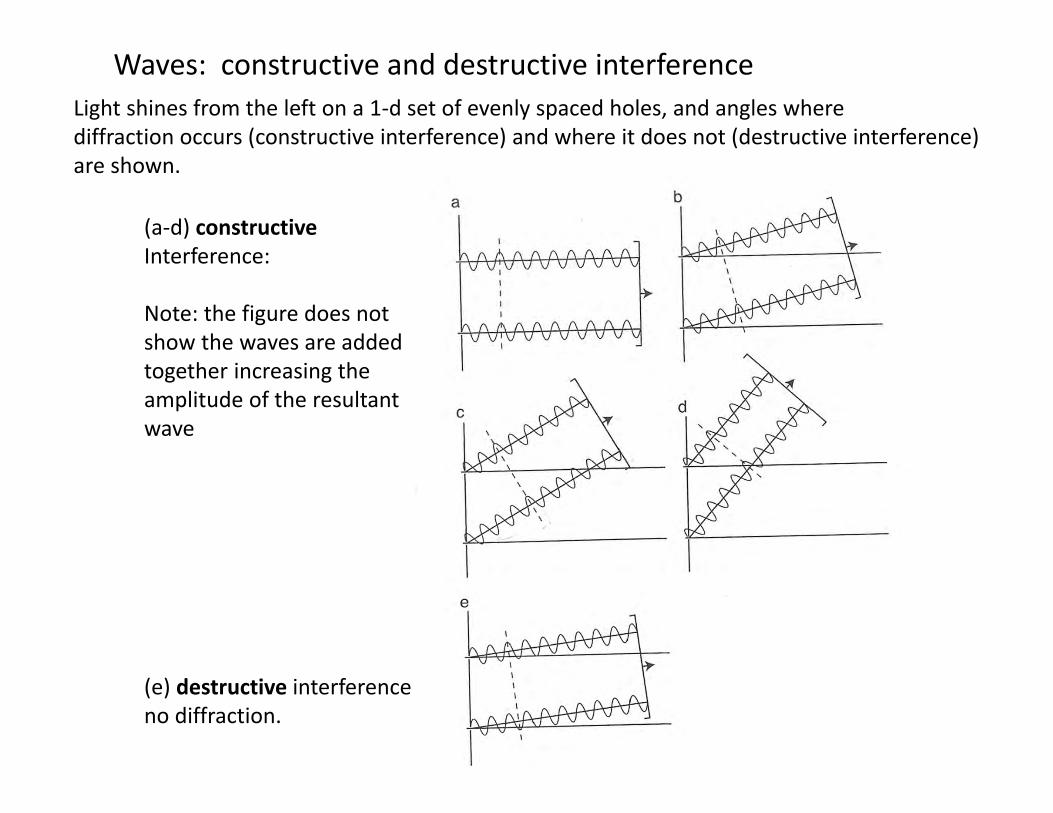
(a‐d) constructiveInterference:
Note: the figure does notshow the waves are addedtogether increasing theamplitude of the resultantwave
(e) destructive interferenceno diffraction.
Waves: constructive and destructive interference Light shines from the left on a 1‐d set of evenly spaced holes, and angles wherediffraction occurs (constructive interference) and where it does not (destructive interference) are shown.
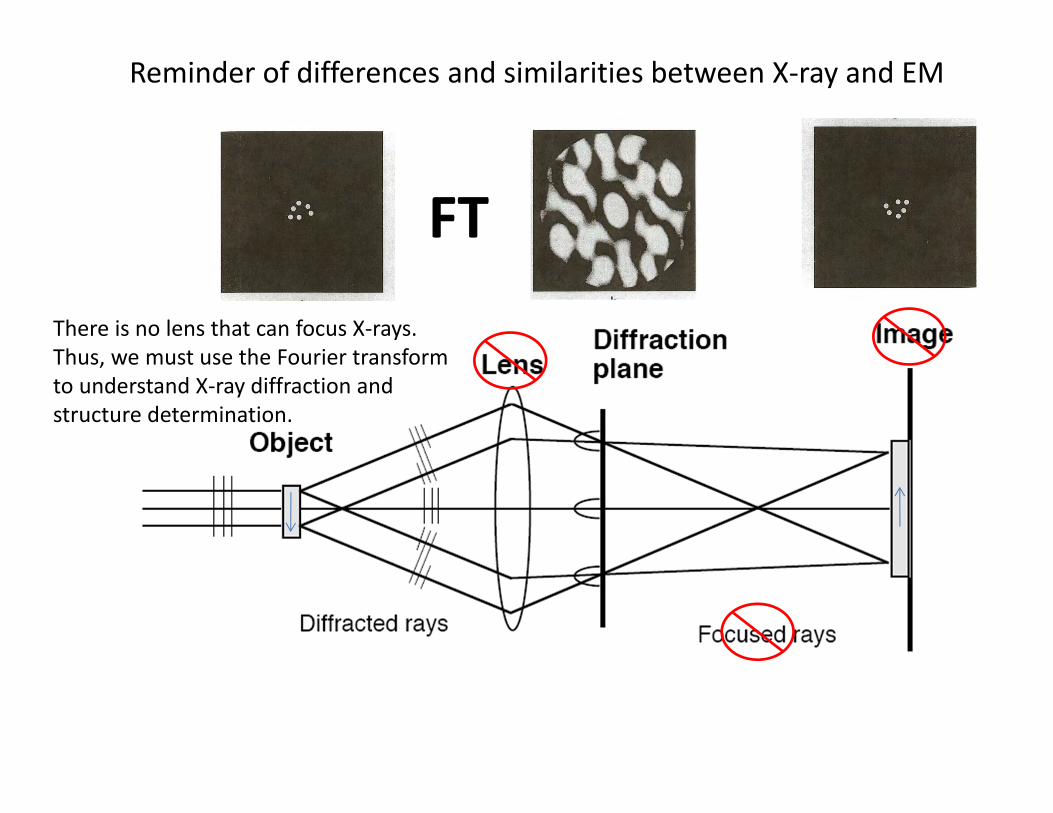
FTThere is no lens that can focus X‐rays.Thus, we must use the Fourier transformto understand X‐ray diffraction and structure determination.
Reminder of differences and similarities between X‐ray and EM
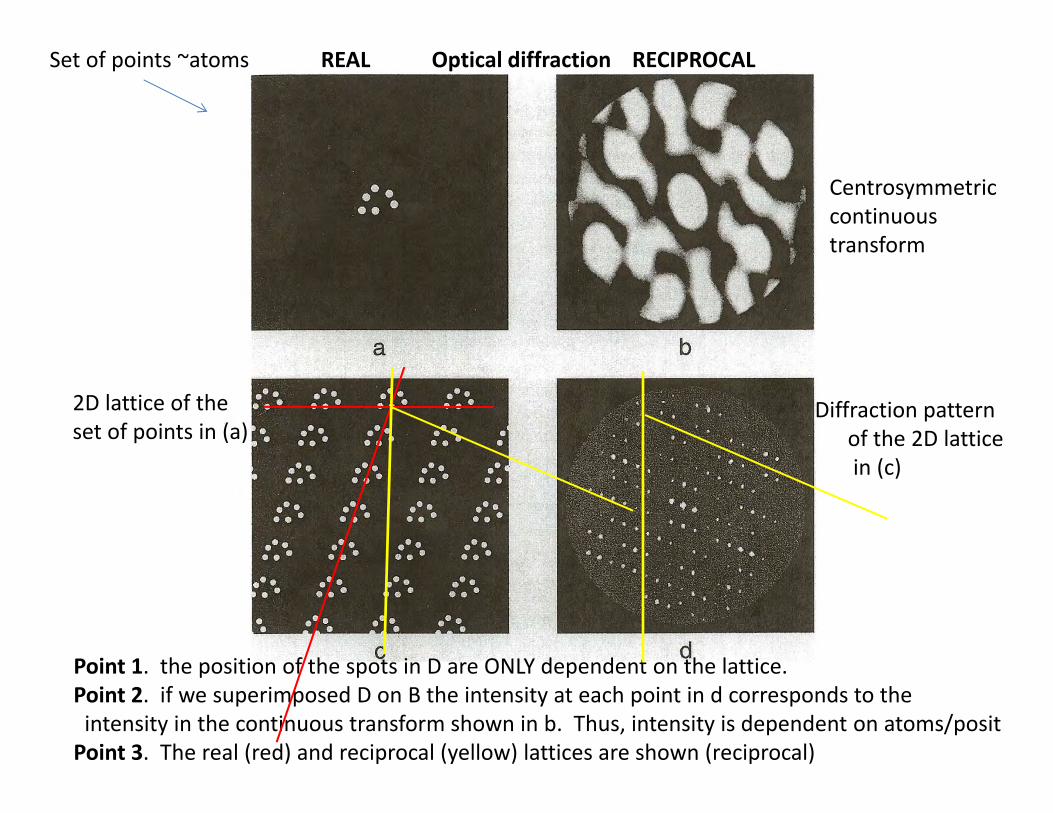
Set of points ~atoms Optical diffraction
2D lattice of the set of points in (a)
Diffraction patternof the 2D latticein (c)
Point 1. the position of the spots in D are ONLY dependent on the lattice. Point 2. if we superimposed D on B the intensity at each point in d corresponds to the intensity in the continuous transform shown in b. Thus, intensity is dependent on atoms/positPoint 3. The real (red) and reciprocal (yellow) lattices are shown (reciprocal)
Centrosymmetriccontinuous transform
REAL RECIPROCAL
d 1/d
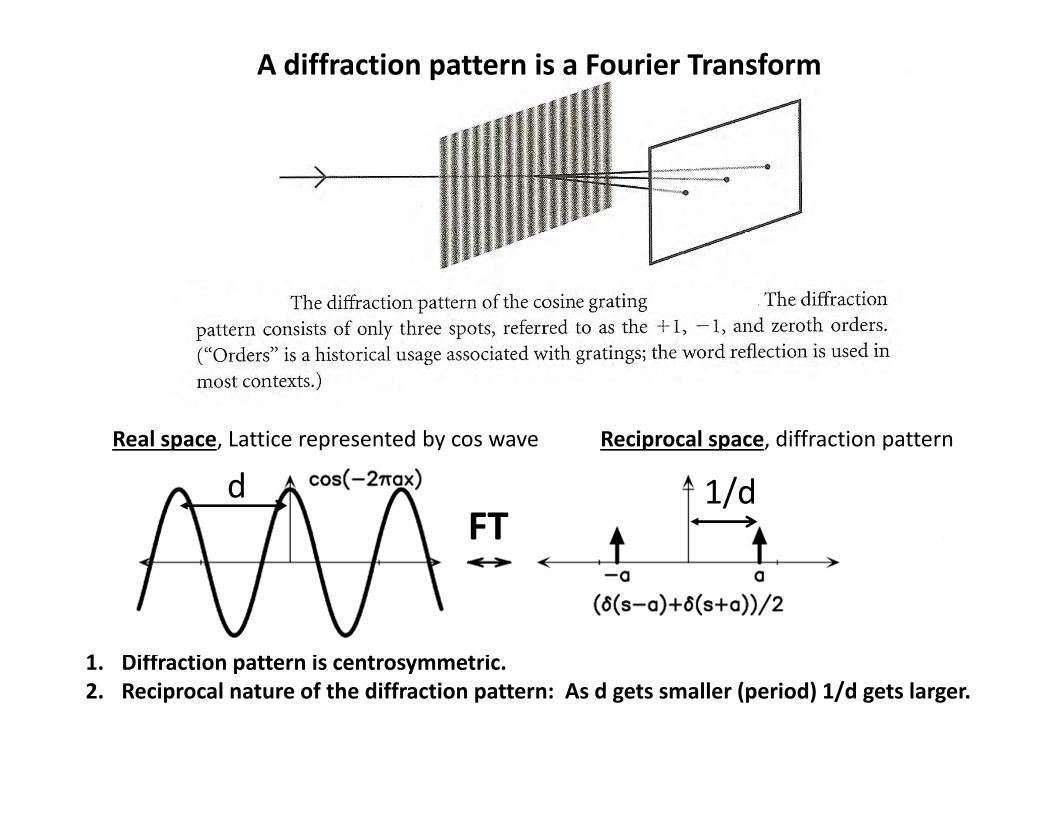
A diffraction pattern is a Fourier Transform
FT
1. Diffraction pattern is centrosymmetric.2. Reciprocal nature of the diffraction pattern: As d gets smaller (period) 1/d gets larger.
Real space, Lattice represented by cos wave Reciprocal space, diffraction pattern
d 1/dFT
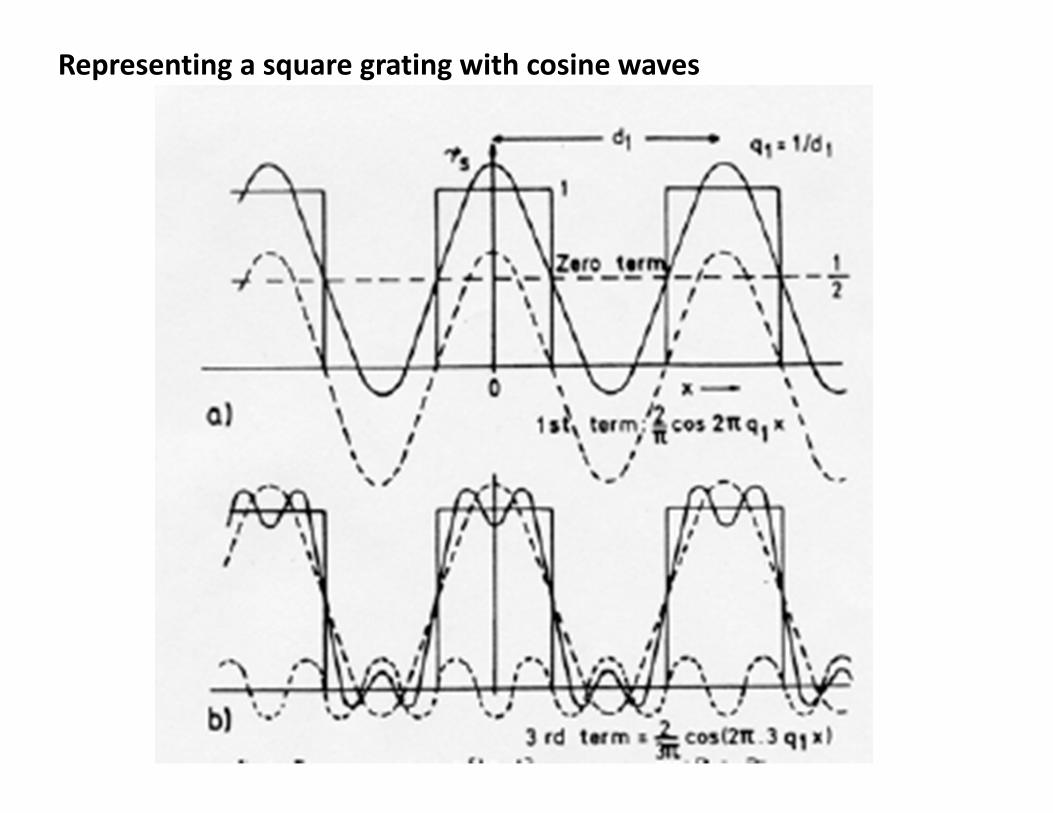
Representing a square grating with cosine waves
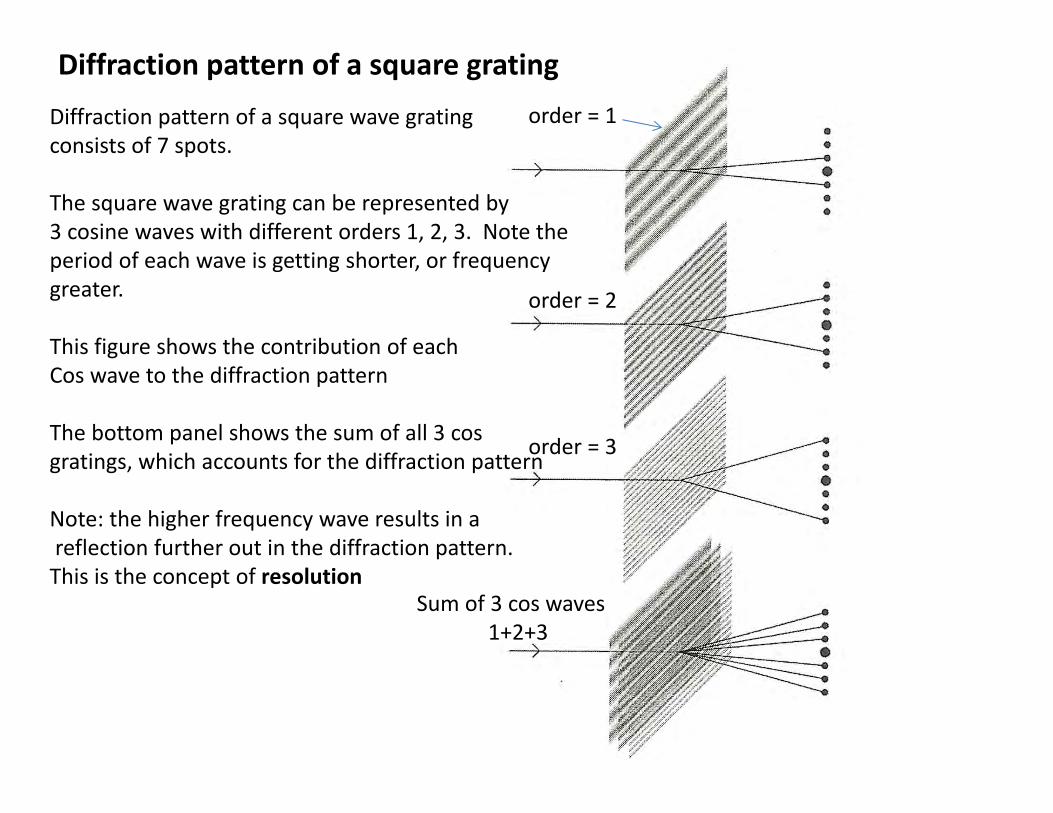
Diffraction pattern of a square gratingDiffraction pattern of a square wave gratingconsists of 7 spots.
The square wave grating can be represented by3 cosine waves with different orders 1, 2, 3. Note the period of each wave is getting shorter, or frequencygreater.
This figure shows the contribution of eachCos wave to the diffraction pattern
The bottom panel shows the sum of all 3 cosgratings, which accounts for the diffraction pattern
Note: the higher frequency wave results in a reflection further out in the diffraction pattern.This is the concept of resolution
order = 1
order = 2
order = 3
Sum of 3 cos waves 1+2+3
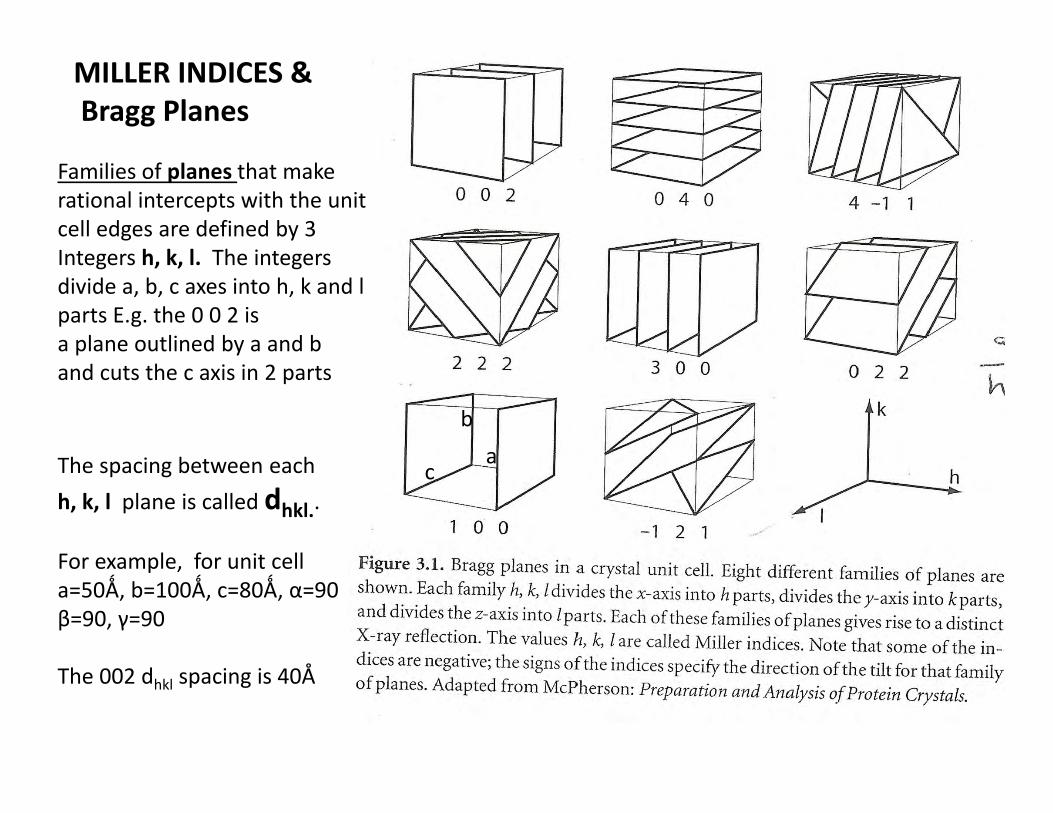
Families of planes that make rational intercepts with the unitcell edges are defined by 3Integers h, k, l. The integersdivide a, b, c axes into h, k and lparts E.g. the 0 0 2 is a plane outlined by a and band cuts the c axis in 2 parts
The spacing between each h, k, l plane is called dhkl..
For example, for unit cella=50Ǻ, b=100Ǻ, c=80Ǻ, α=90β=90, γ=90
The 002 dhkl spacing is 40Å
ab
c
MILLER INDICES &Bragg Planes
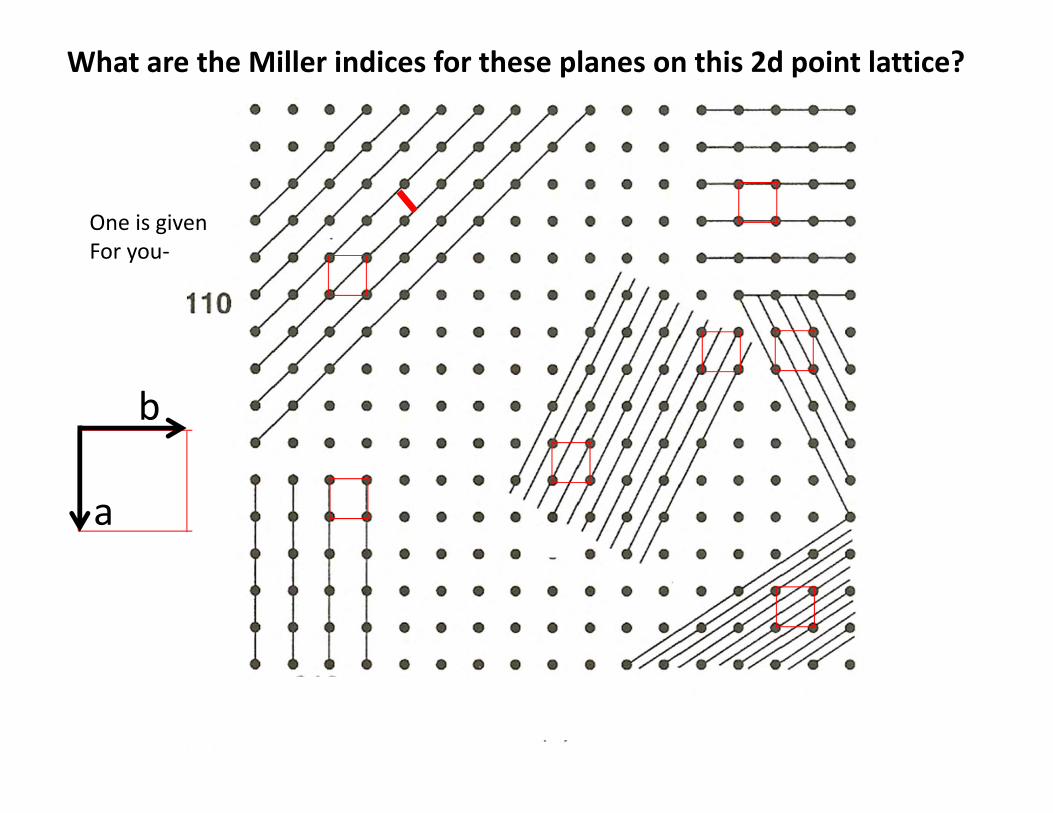
What are the Miller indices for these planes on this 2d point lattice?
One is givenFor you‐
a
b
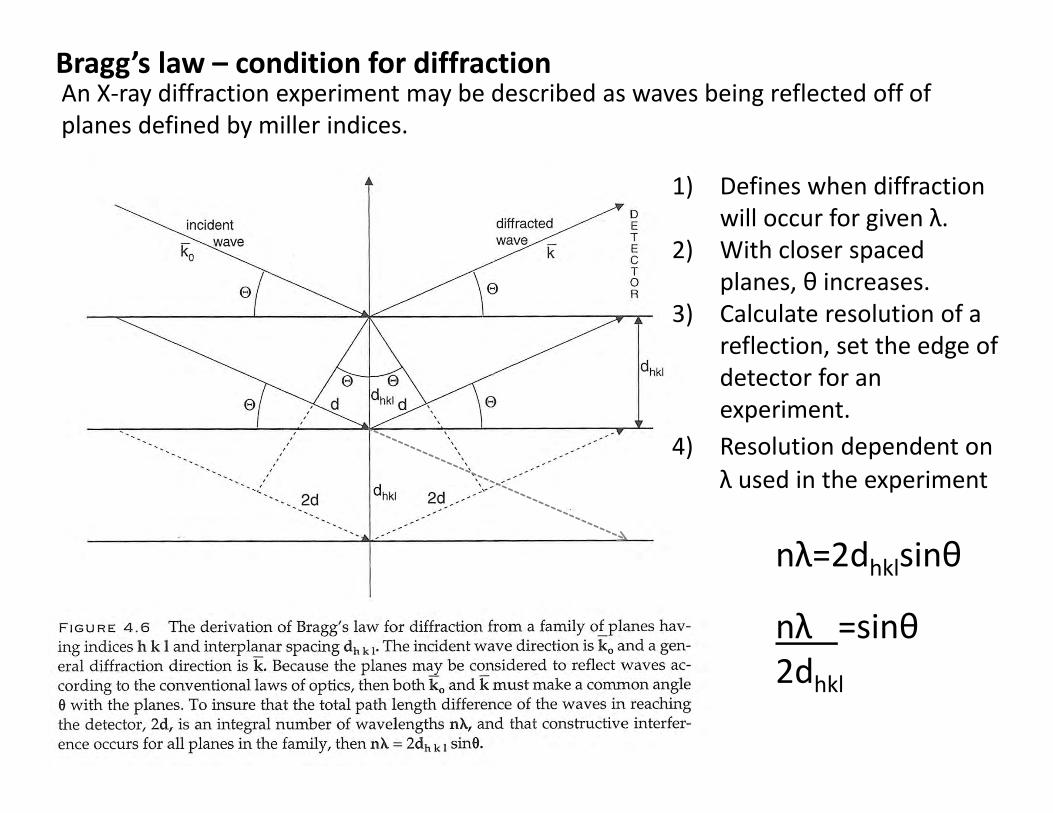
nλ=2dhklsinθ
Bragg’s law – condition for diffraction
nλ =sinθ2dhkl
1) Defines when diffraction will occur for given λ.
2) With closer spaced planes, θ increases.
3) Calculate resolution of a reflection, set the edge of detector for an experiment.
4) Resolution dependent onλ used in the experiment
An X‐ray diffraction experiment may be described as waves being reflected off of planes defined by miller indices.
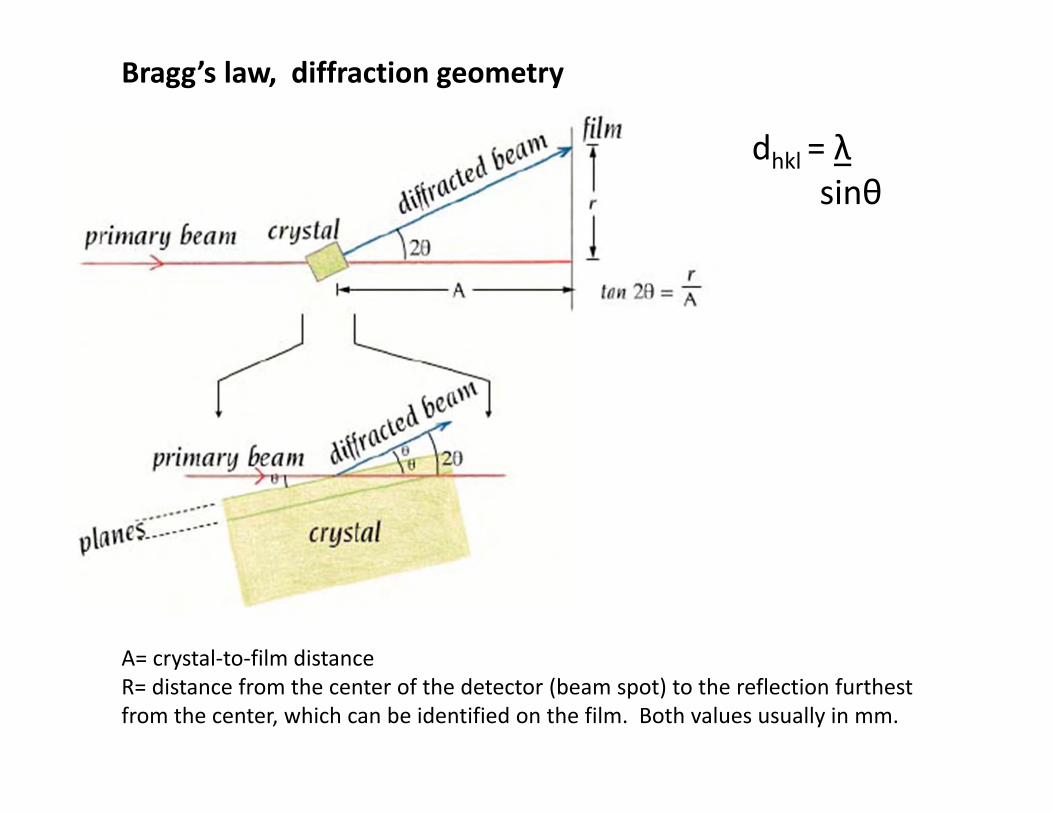
Bragg’s law, diffraction geometry
A= crystal‐to‐film distanceR= distance from the center of the detector (beam spot) to the reflection furthest from the center, which can be identified on the film. Both values usually in mm.
dhkl = λsinθ
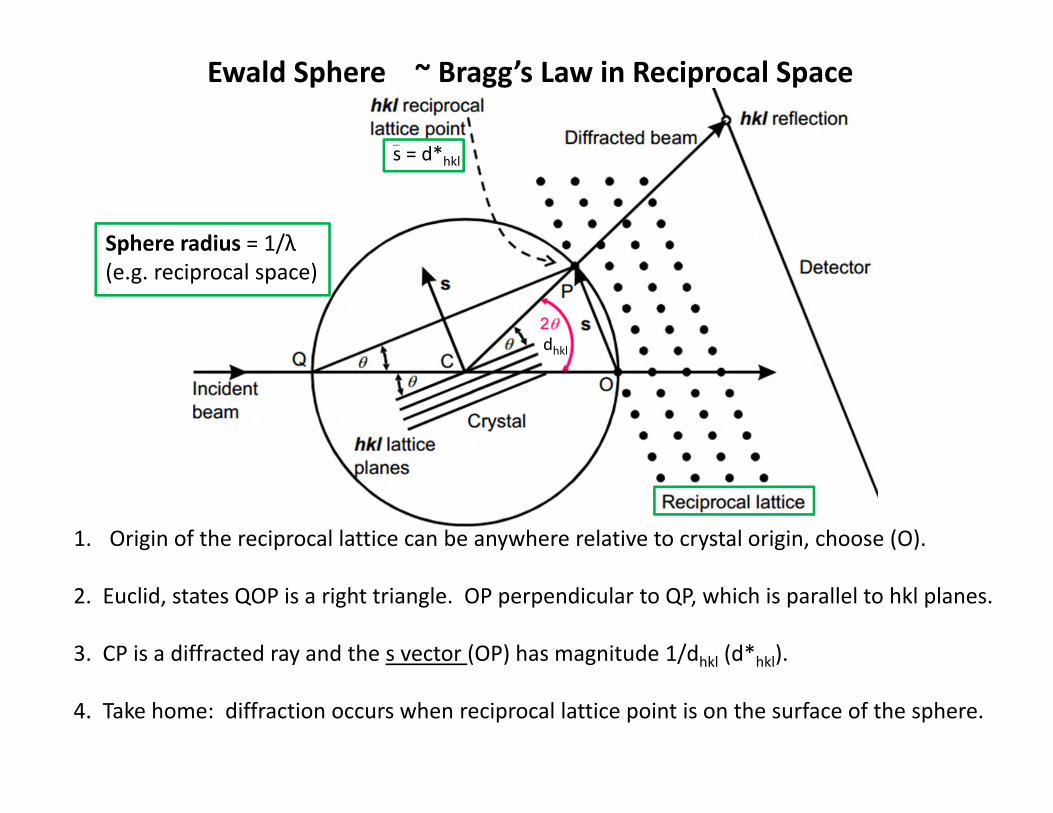
Ewald Sphere ~ Bragg’s Law in Reciprocal Space
Sphere radius = 1/λ(e.g. reciprocal space)
1. Origin of the reciprocal lattice can be anywhere relative to crystal origin, choose (O).
2. Euclid, states QOP is a right triangle. OP perpendicular to QP, which is parallel to hkl planes.
3. CP is a diffracted ray and the s vector (OP) has magnitude 1/dhkl (d*hkl).
4. Take home: diffraction occurs when reciprocal lattice point is on the surface of the sphere.
dhkl
s = d*hkl
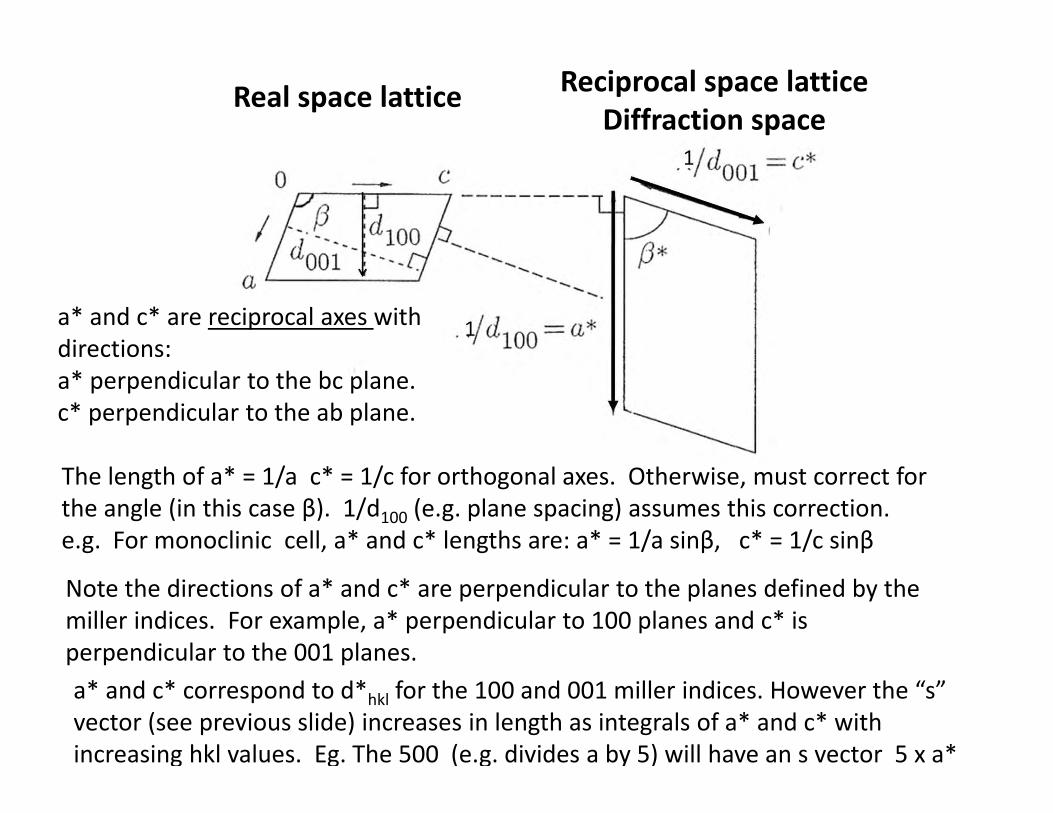
Real space lattice
The length of a* = 1/a c* = 1/c for orthogonal axes. Otherwise, must correct for the angle (in this case β). 1/d100 (e.g. plane spacing) assumes this correction.e.g. For monoclinic cell, a* and c* lengths are: a* = 1/a sinβ, c* = 1/c sinβ
Reciprocal space latticeDiffraction space
a* and c* are reciprocal axes with directions:a* perpendicular to the bc plane.c* perpendicular to the ab plane.
Note the directions of a* and c* are perpendicular to the planes defined by the miller indices. For example, a* perpendicular to 100 planes and c* is perpendicular to the 001 planes.a* and c* correspond to d*hkl for the 100 and 001 miller indices. However the “s”vector (see previous slide) increases in length as integrals of a* and c* with increasing hkl values. Eg. The 500 (e.g. divides a by 5) will have an s vector 5 x a*
020
200
Real Space Lattice
(0‐10)
(0‐20)
(100)
(200)
Reciprocal Space Lattice
(020)
(000)(010)
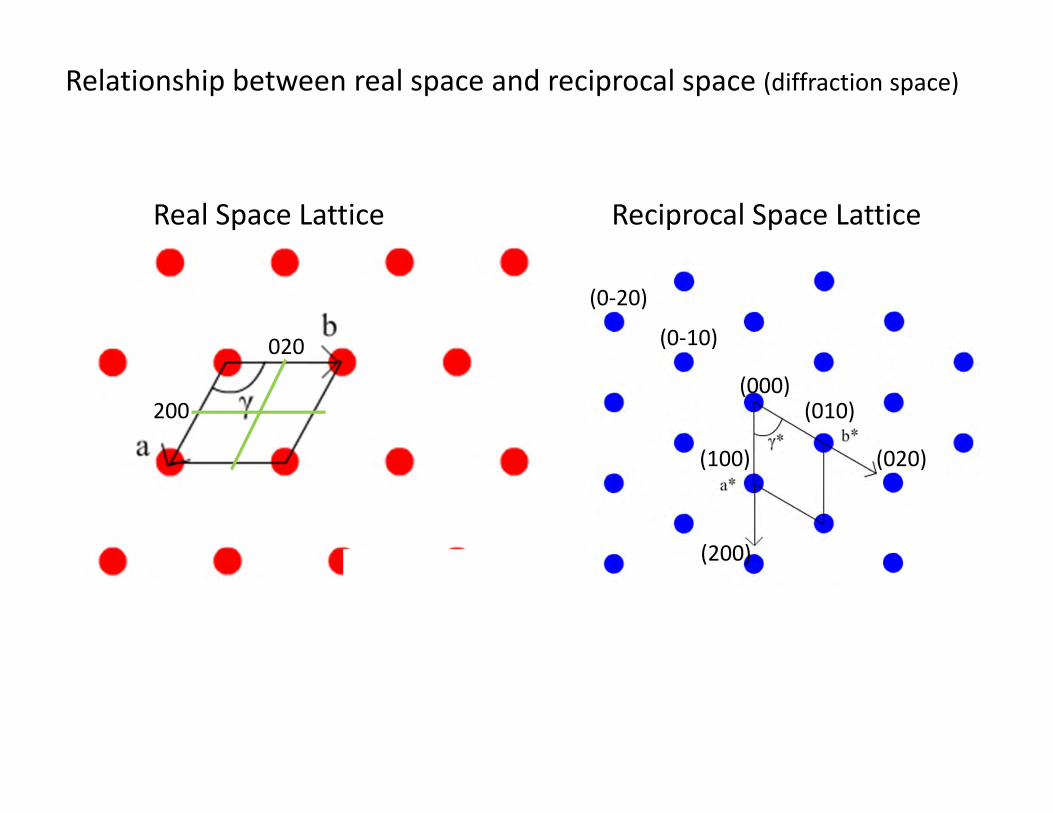
Relationship between real space and reciprocal space (diffraction space)
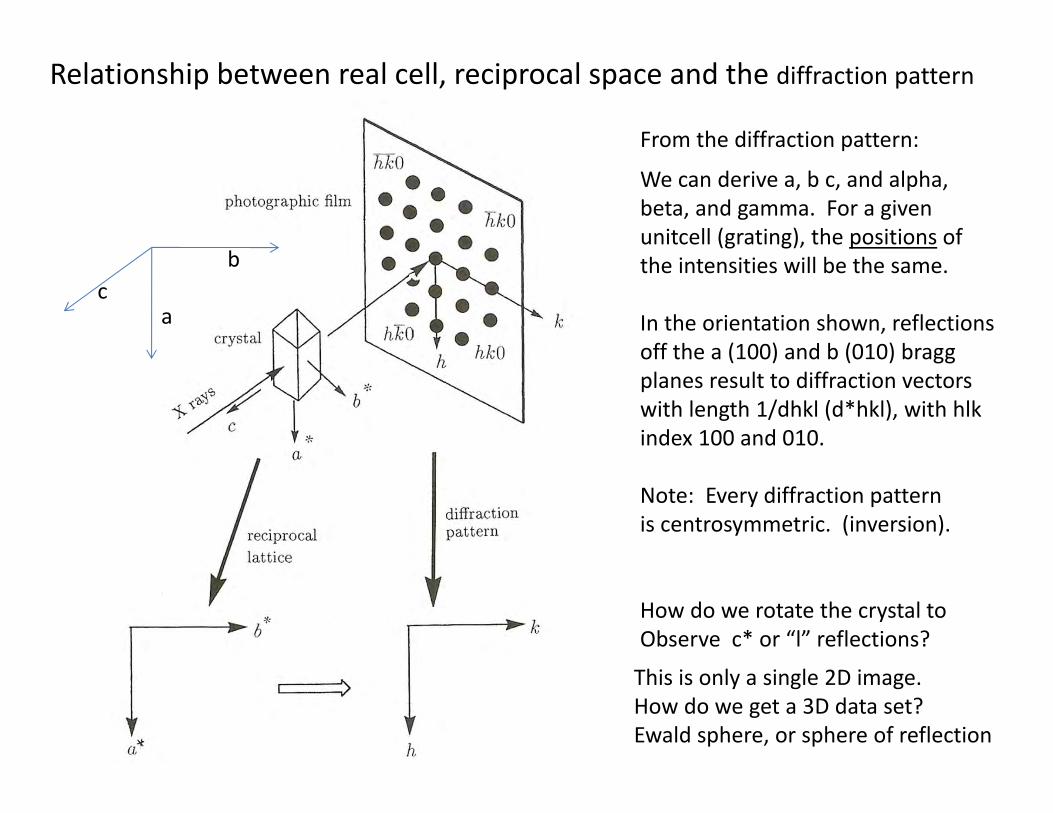
From the diffraction pattern:
We can derive a, b c, and alpha, beta, and gamma. For a given unitcell (grating), the positions of the intensities will be the same.
In the orientation shown, reflections off the a (100) and b (010) braggplanes result to diffraction vectors with length 1/dhkl (d*hkl), with hlkindex 100 and 010.
Note: Every diffraction pattern is centrosymmetric. (inversion).
How do we rotate the crystal to Observe c* or “l” reflections?
cb
a
Relationship between real cell, reciprocal space and the diffraction pattern
This is only a single 2D image.How do we get a 3D data set?Ewald sphere, or sphere of reflection
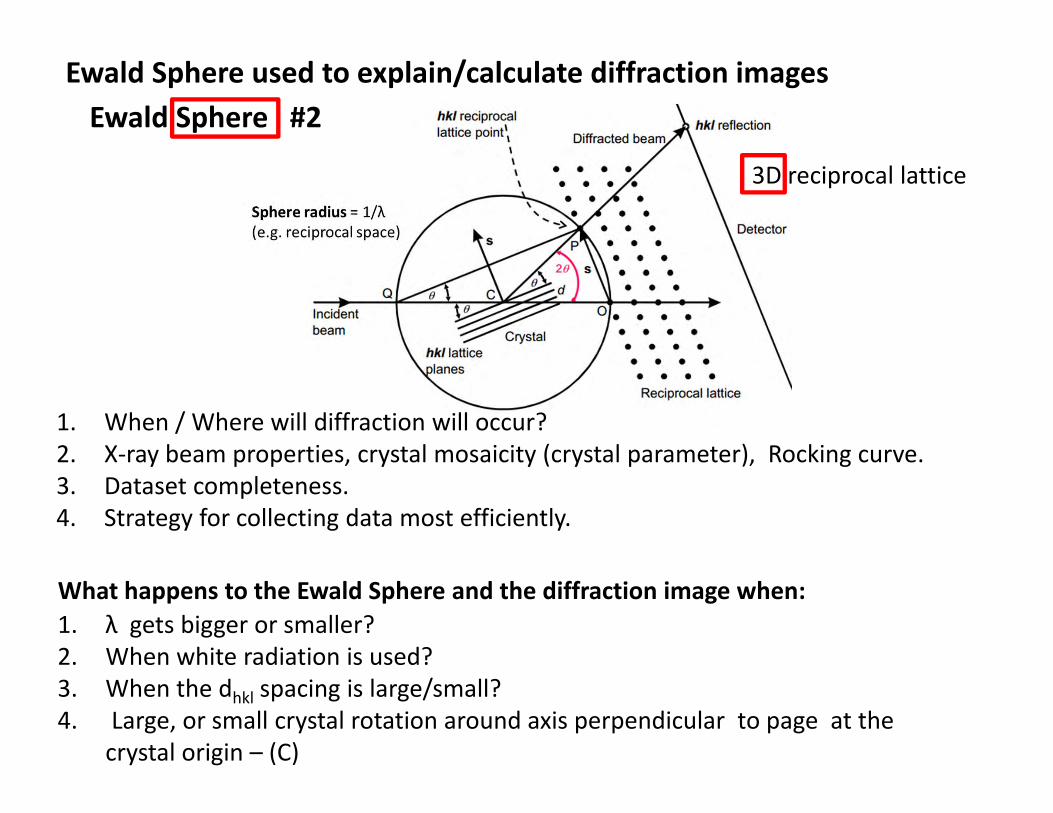
What happens to the Ewald Sphere and the diffraction image when:1. λ gets bigger or smaller?2. When white radiation is used?3. When the dhkl spacing is large/small?4. Large, or small crystal rotation around axis perpendicular to page at the
crystal origin – (C)
Ewald Sphere used to explain/calculate diffraction images
1. When / Where will diffraction will occur?2. X‐ray beam properties, crystal mosaicity (crystal parameter), Rocking curve.3. Dataset completeness.4. Strategy for collecting data most efficiently.
Ewald Sphere #2
3D reciprocal lattice
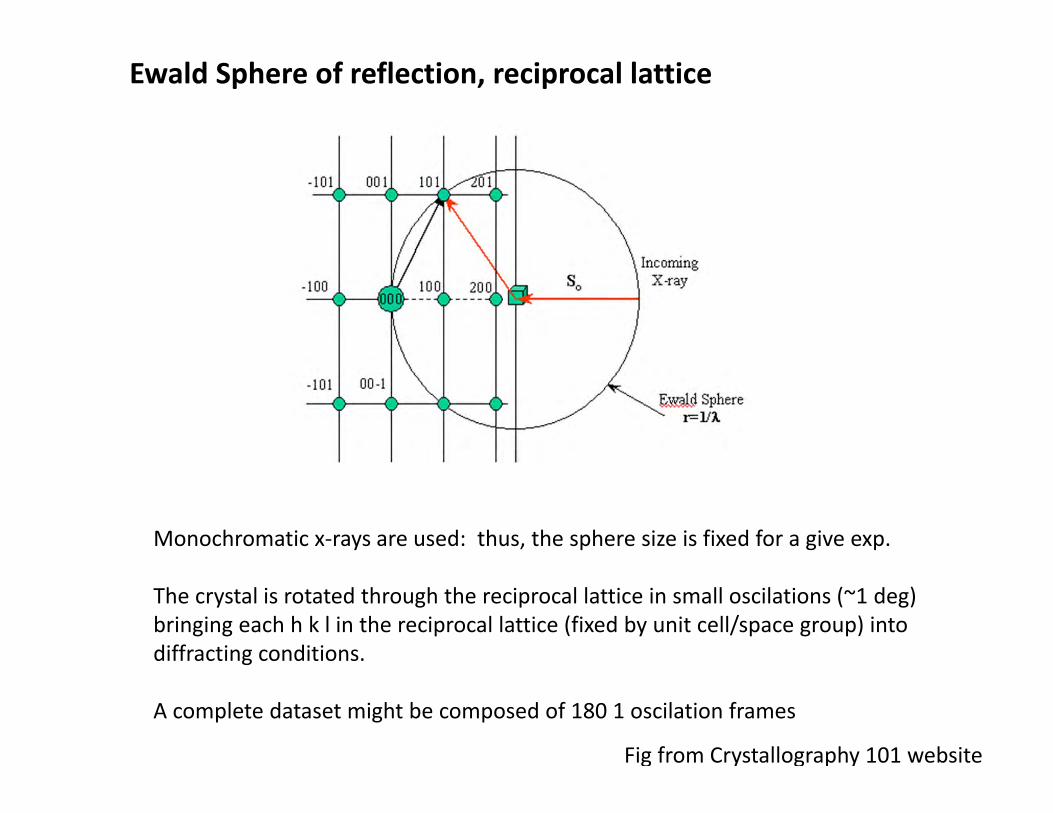
Fig from Crystallography 101 website
Ewald Sphere of reflection, reciprocal lattice
Monochromatic x‐rays are used: thus, the sphere size is fixed for a give exp.
The crystal is rotated through the reciprocal lattice in small oscilations (~1 deg)bringing each h k l in the reciprocal lattice (fixed by unit cell/space group) into diffracting conditions.
A complete dataset might be composed of 180 1 oscilation frames
N=4π * V *(1/dmin)33 n
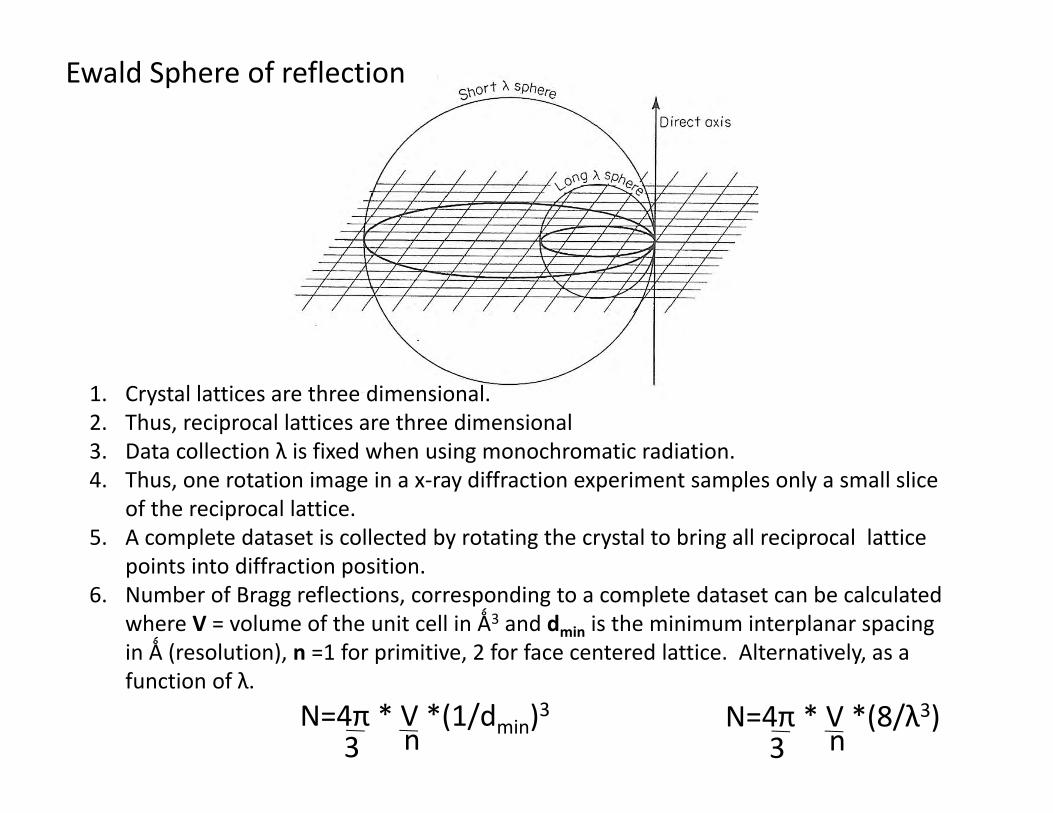
Ewald Sphere of reflection
1. Crystal lattices are three dimensional.2. Thus, reciprocal lattices are three dimensional3. Data collection λ is fixed when using monochromatic radiation.4. Thus, one rotation image in a x‐ray diffraction experiment samples only a small slice
of the reciprocal lattice. 5. A complete dataset is collected by rotating the crystal to bring all reciprocal lattice
points into diffraction position.6. Number of Bragg reflections, corresponding to a complete dataset can be calculated
where V = volume of the unit cell in Ǻ3 and dmin is the minimum interplanar spacing in Ǻ (resolution), n =1 for primitive, 2 for face centered lattice. Alternatively, as a function of λ.
N=4π * V *(8/λ3)3 n
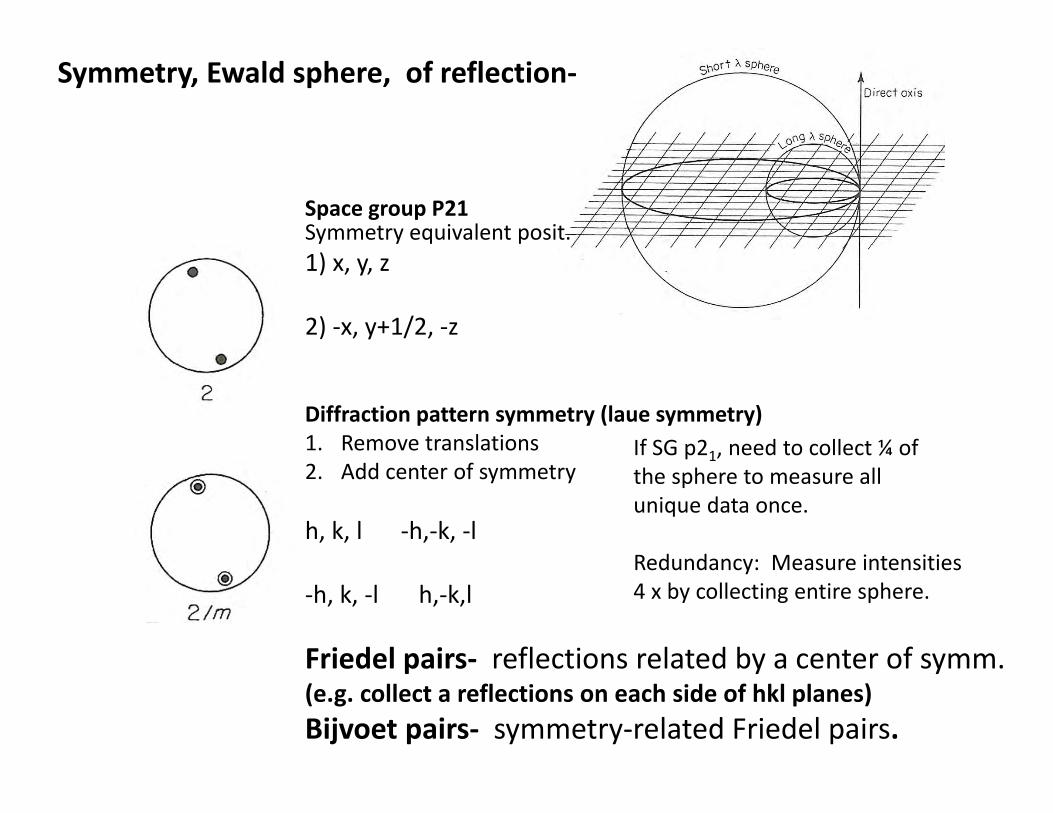
Symmetry, Ewald sphere, of reflection‐
Symmetry equivalent posit.1) x, y, z
2) ‐x, y+1/2, ‐z
Diffraction pattern symmetry (laue symmetry) 1. Remove translations2. Add center of symmetry
h, k, l ‐h,‐k, ‐l
‐h, k, ‐l h,‐k,l
Friedel pairs‐ reflections related by a center of symm.(e.g. collect a reflections on each side of hkl planes)Bijvoet pairs‐ symmetry‐related Friedel pairs.
If SG p21, need to collect ¼ of the sphere to measure all unique data once.
Redundancy: Measure intensities4 x by collecting entire sphere.
Space group P21
Add capillary‐
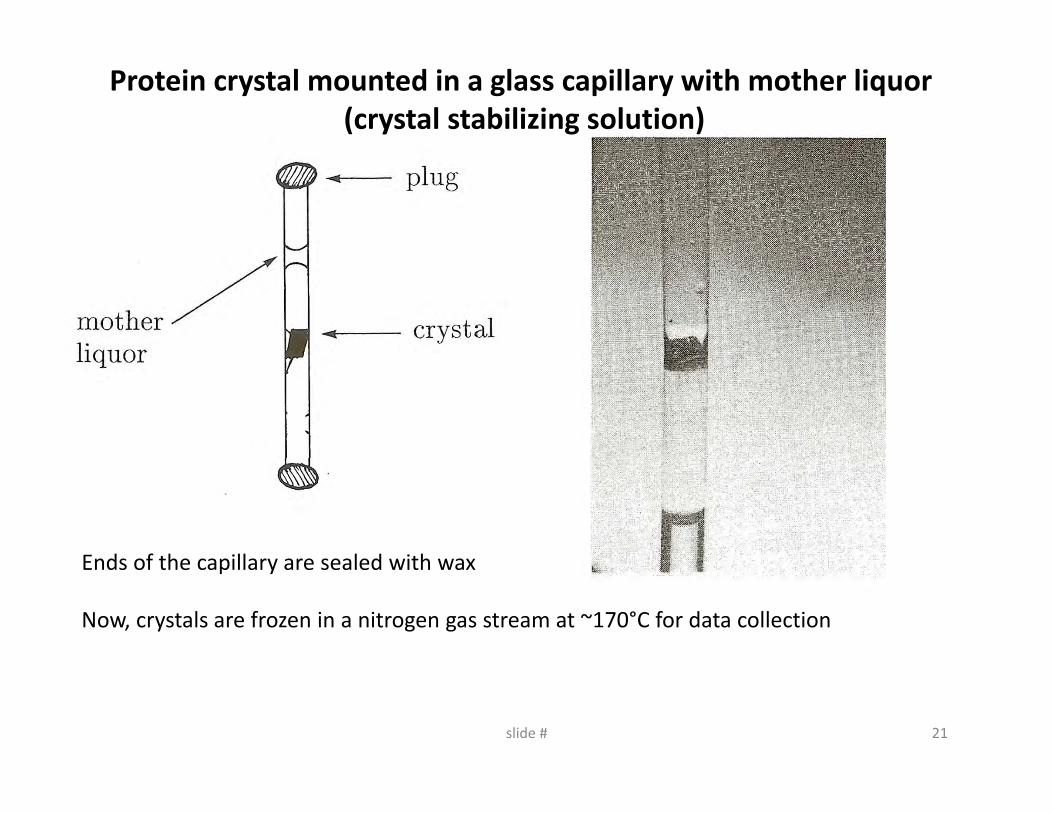
Protein crystal mounted in a glass capillary with mother liquor (crystal stabilizing solution)
Ends of the capillary are sealed with wax
Now, crystals are frozen in a nitrogen gas stream at ~170°C for data collection
21slide #
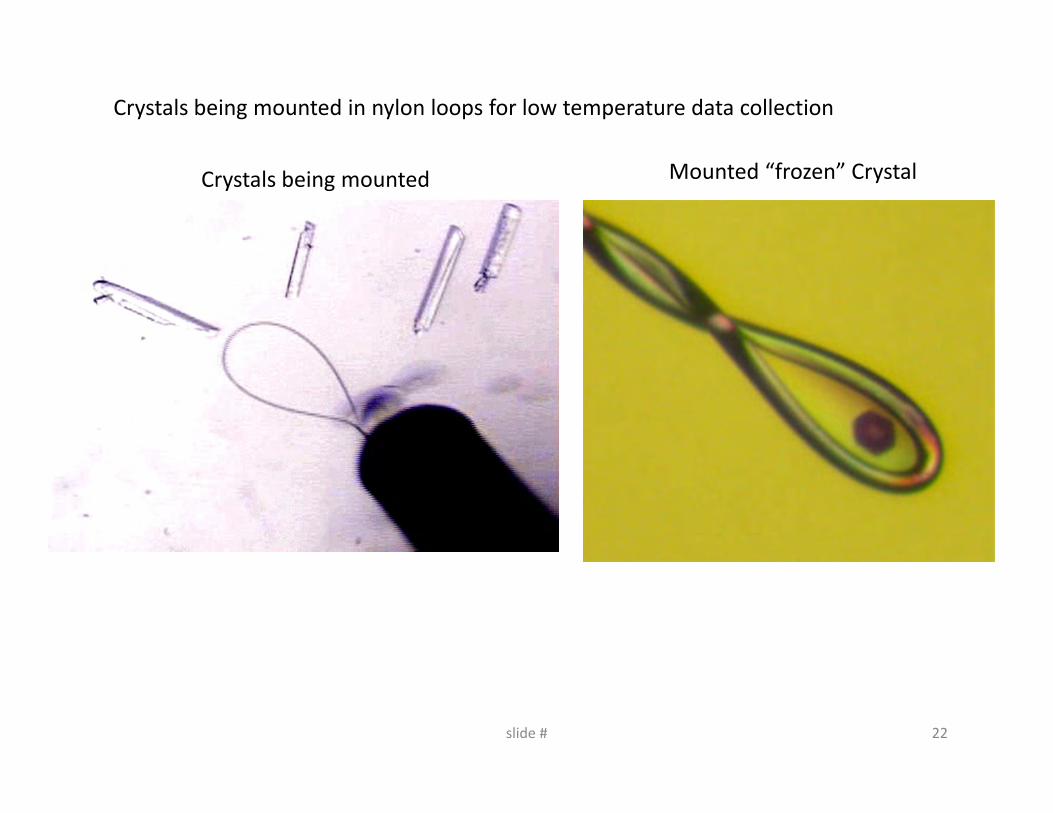
Crystals being mounted in nylon loops for low temperature data collection
Crystals being mounted Mounted “frozen” Crystal
22slide #
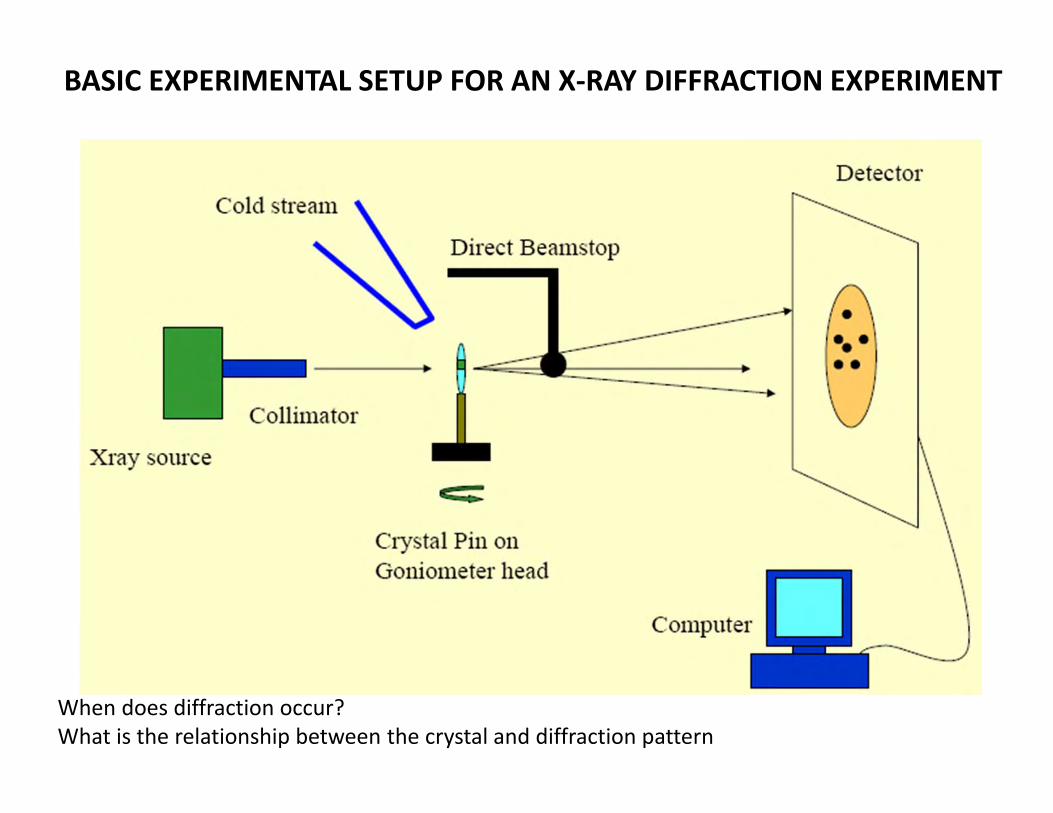
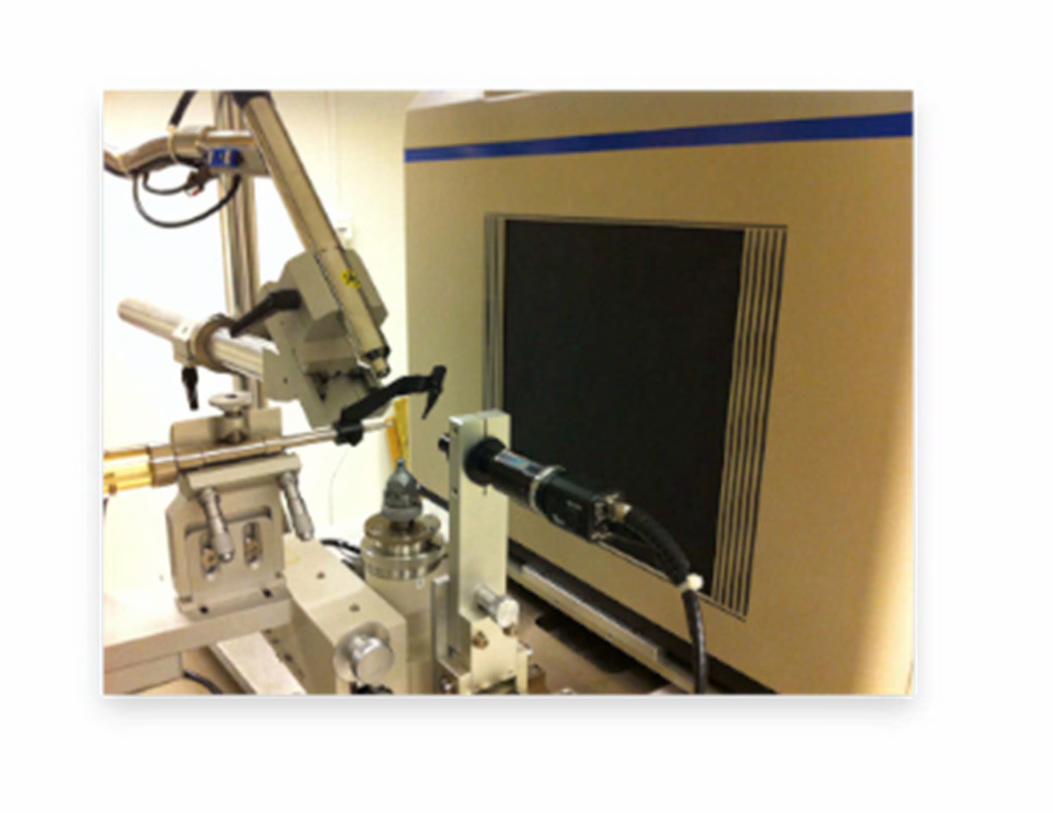
BASIC EXPERIMENTAL SETUP FOR AN X‐RAY DIFFRACTION EXPERIMENT
When does diffraction occur?What is the relationship between the crystal and diffraction pattern
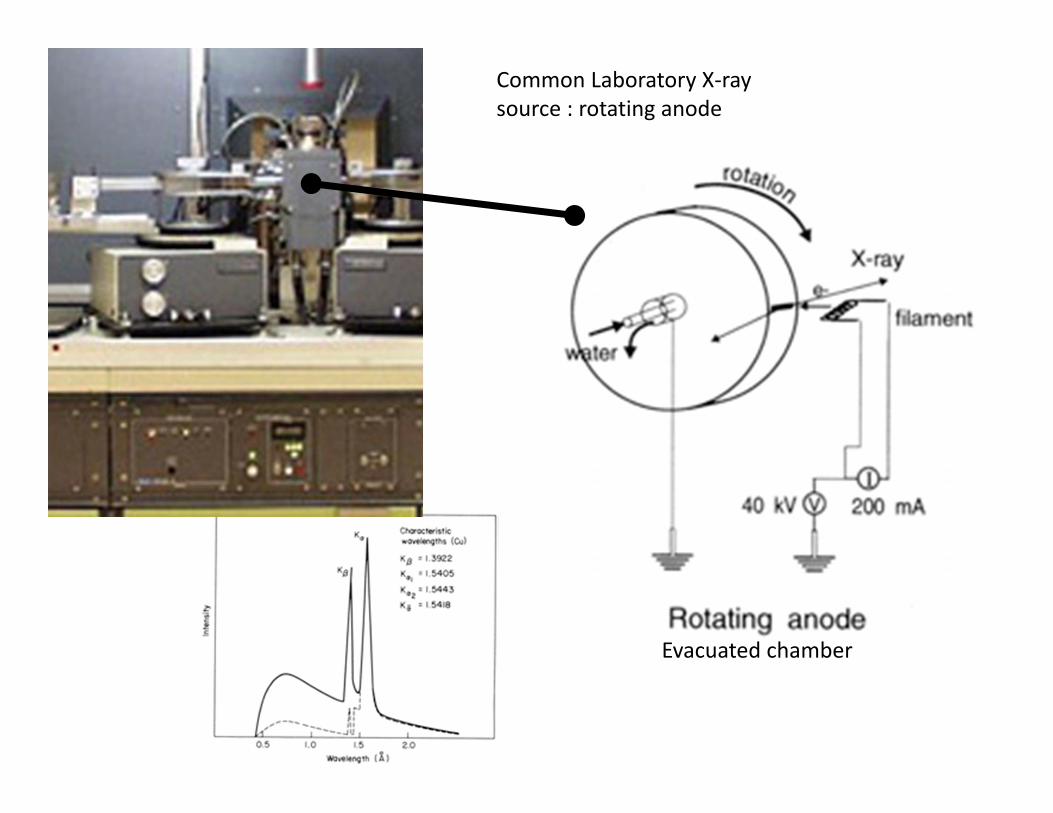
Evacuated chamber
Common Laboratory X‐ray source : rotating anode
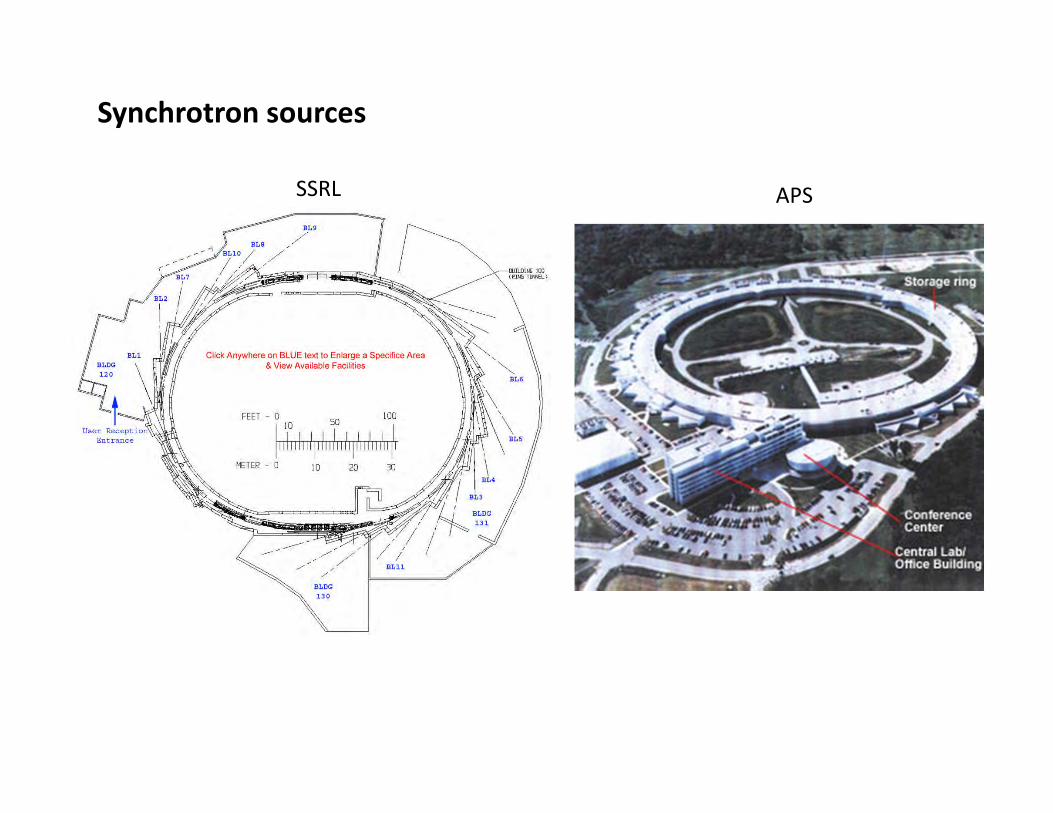
SSRL APS
Synchrotron sources
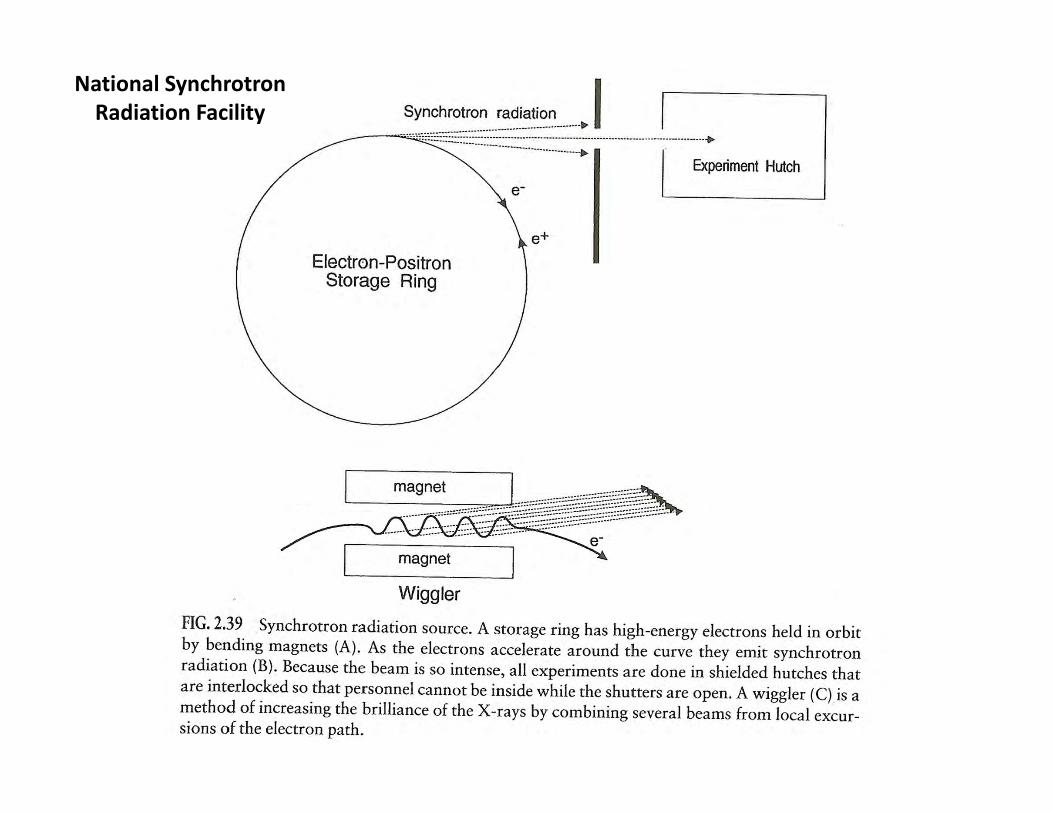
National SynchrotronRadiation Facility
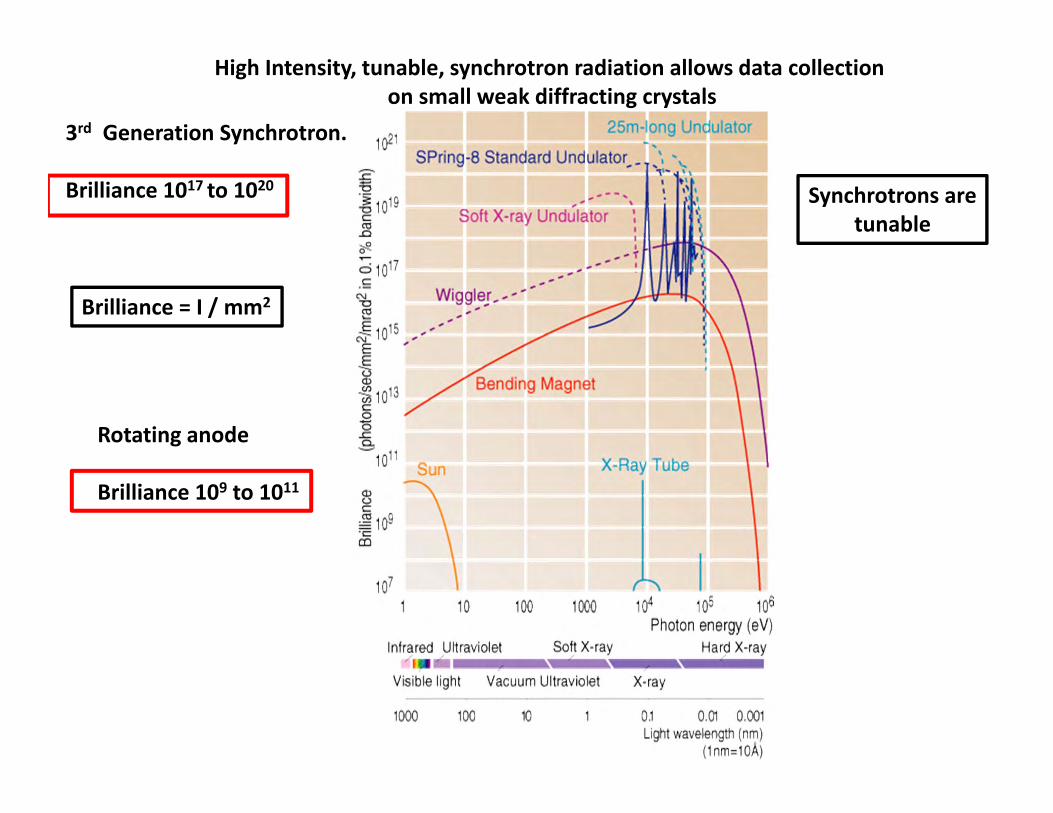
3rd Generation Synchrotron.
Brilliance 1017 to 1020
Rotating anode
Brilliance 109 to 1011
Brilliance = I / mm2
High Intensity, tunable, synchrotron radiation allows data collection on small weak diffracting crystals
Synchrotrons aretunable
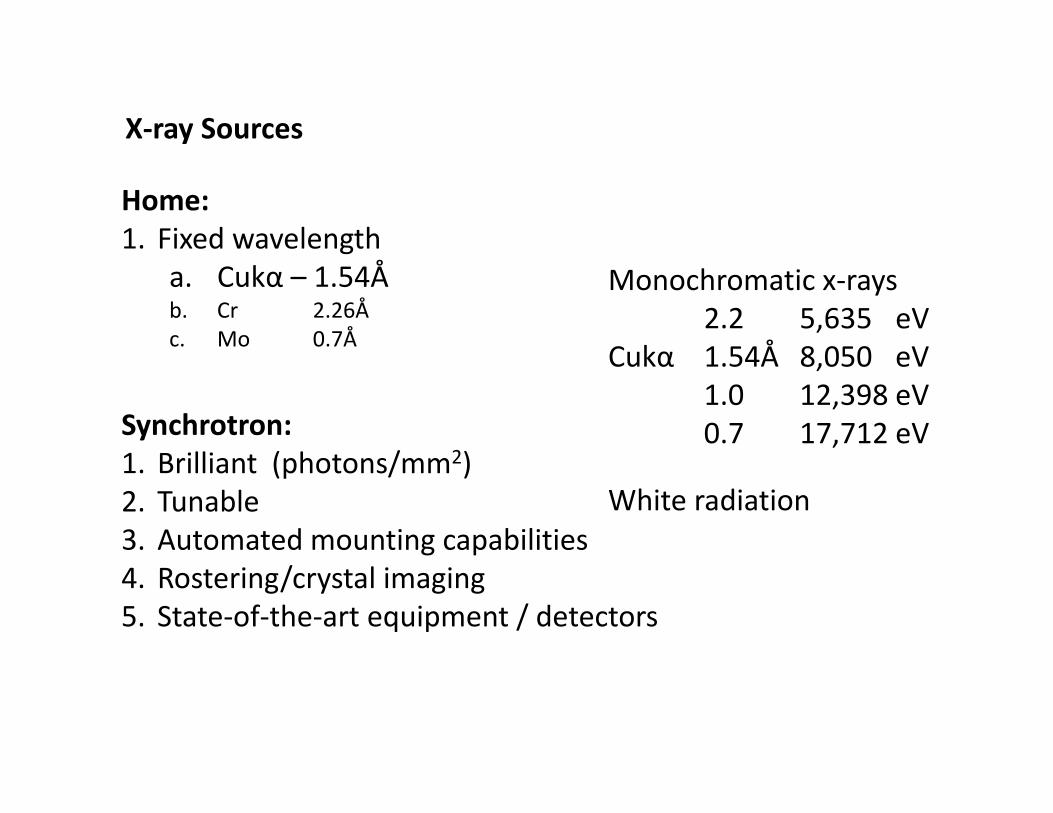
X‐ray Sources
Home:1. Fixed wavelength
a. Cukα – 1.54Åb. Cr 2.26Åc. Mo 0.7Å
Synchrotron:1. Brilliant (photons/mm2)2. Tunable 3. Automated mounting capabilities4. Rostering/crystal imaging 5. State‐of‐the‐art equipment / detectors
Monochromatic x‐rays2.2 5,635 eV
Cukα 1.54Å 8,050 eV1.0 12,398 eV0.7 17,712 eV
White radiation
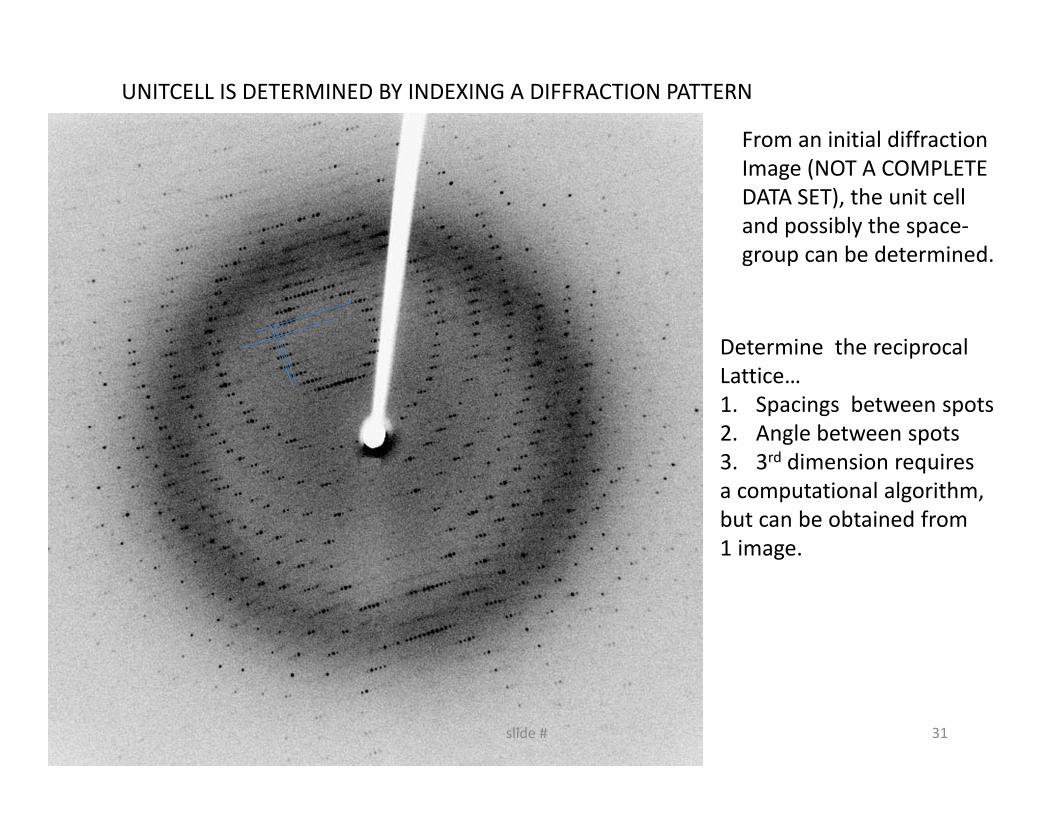
From an initial diffractionImage (NOT A COMPLETEDATA SET), the unit celland possibly the space‐group can be determined.
UNITCELL IS DETERMINED BY INDEXING A DIFFRACTION PATTERN
Determine the reciprocal Lattice… 1. Spacings between spots2. Angle between spots3. 3rd dimension requires a computational algorithm, but can be obtained from 1 image.
31slide #
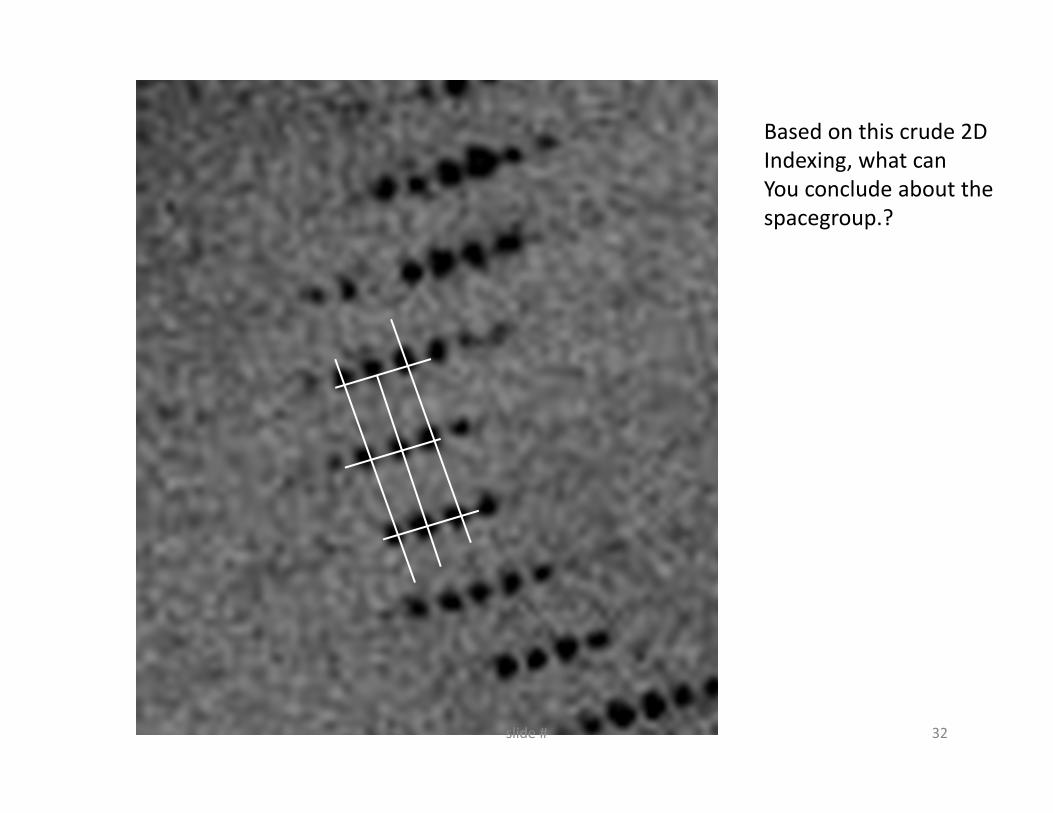
Based on this crude 2DIndexing, what canYou conclude about thespacegroup.?
32slide #
slide # 33
slide # 34
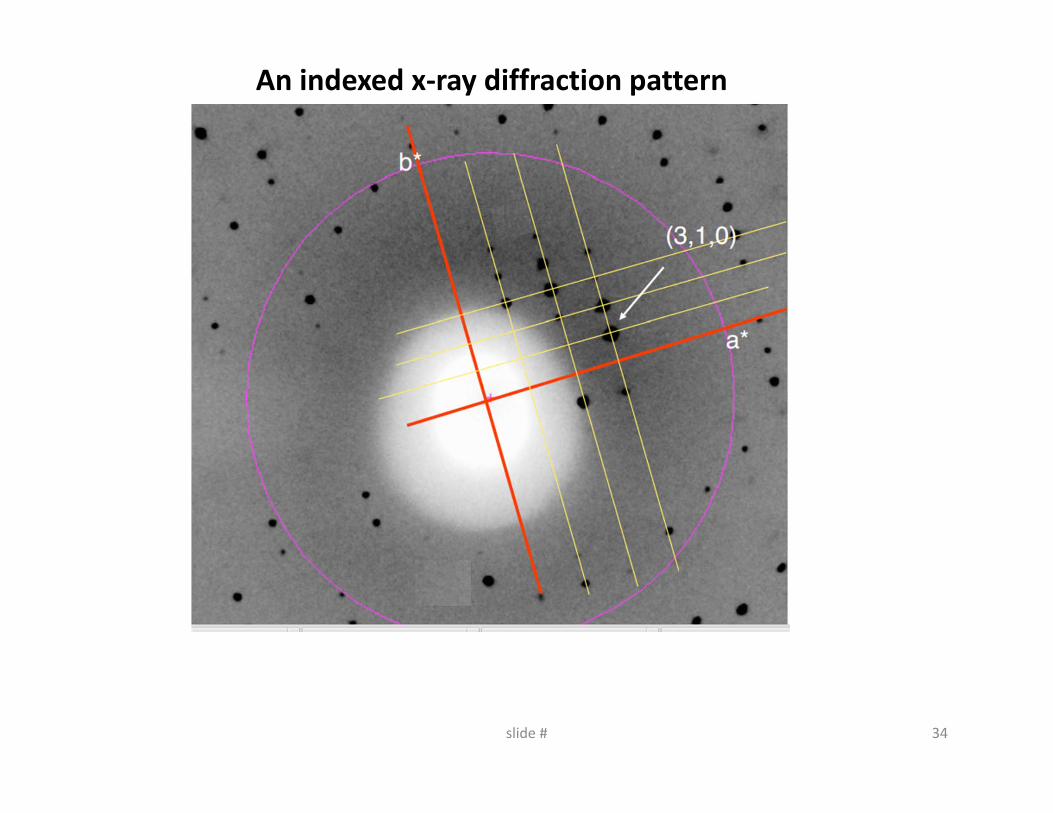
An indexed x‐ray diffraction pattern
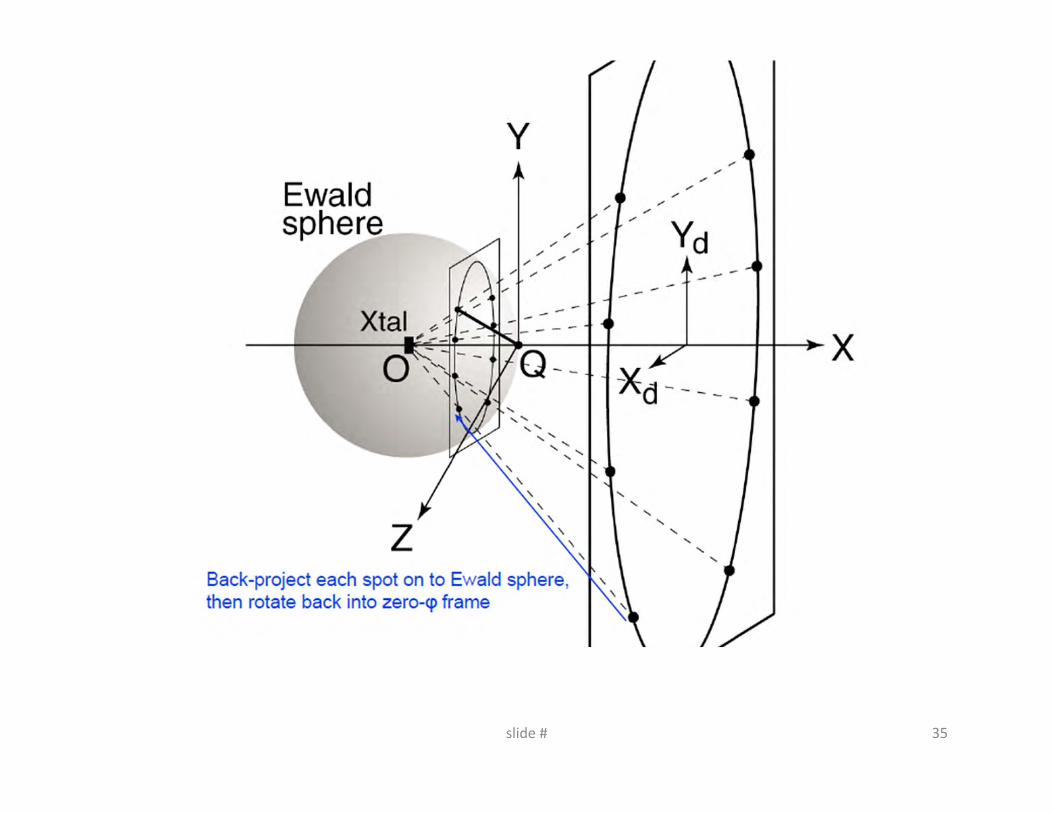
slide # 35
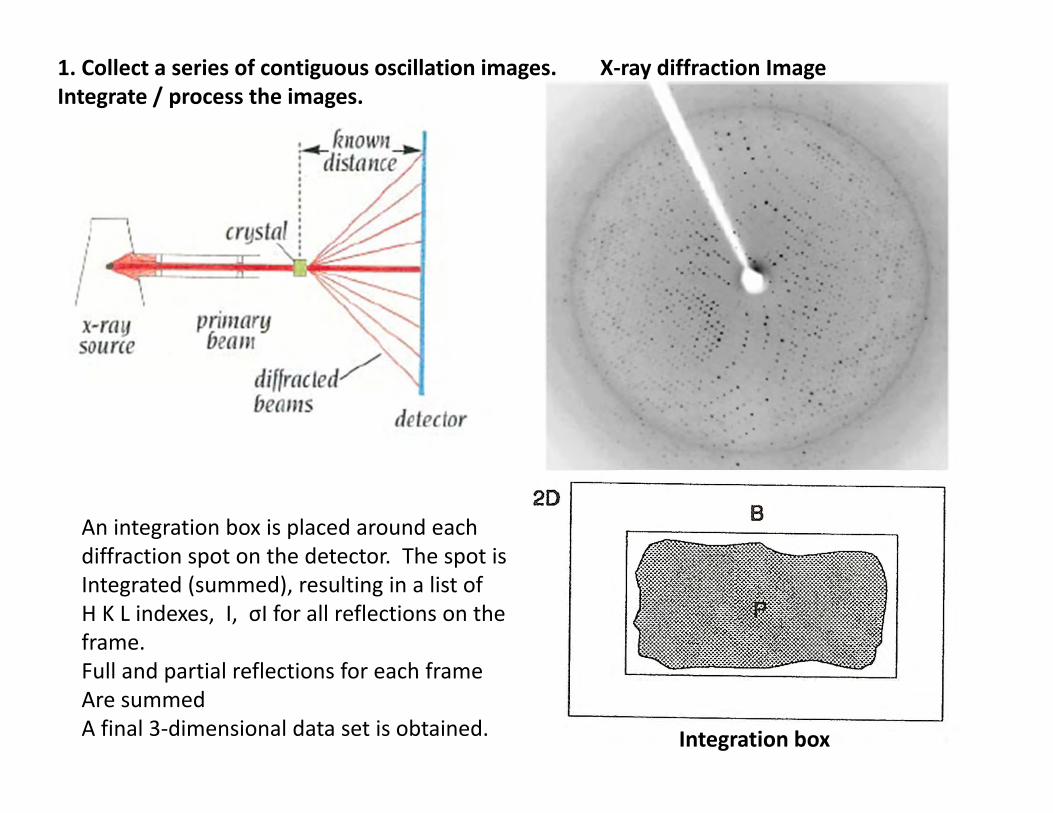
An integration box is placed around each diffraction spot on the detector. The spot isIntegrated (summed), resulting in a list of H K L indexes, I, σI for all reflections on theframe.Full and partial reflections for each frame Are summed A final 3‐dimensional data set is obtained. Integration box
X‐ray diffraction Image 1. Collect a series of contiguous oscillation images.Integrate / process the images.

User defined variables required for X‐ray data collection:
Wavelength *Tuneable: Only at a Synchrotron Facility. 0.6‐2.5Ågenerally described in KeV (~5‐15KeV).
*fixed at 1.54178Å on a rotating anode generator (lab source)
Take a single image, index and use a prediction/strategy program to determine:
Oscillation range per frame (no overlaps, suff. # of spots)
Total Oscillation range for the dataset (req. for complete data)
Exposure Length for each oscillation (radiation damage)
Crystal‐to‐Detector Distance (spot separation, low backgrounduse the entire detector surface)
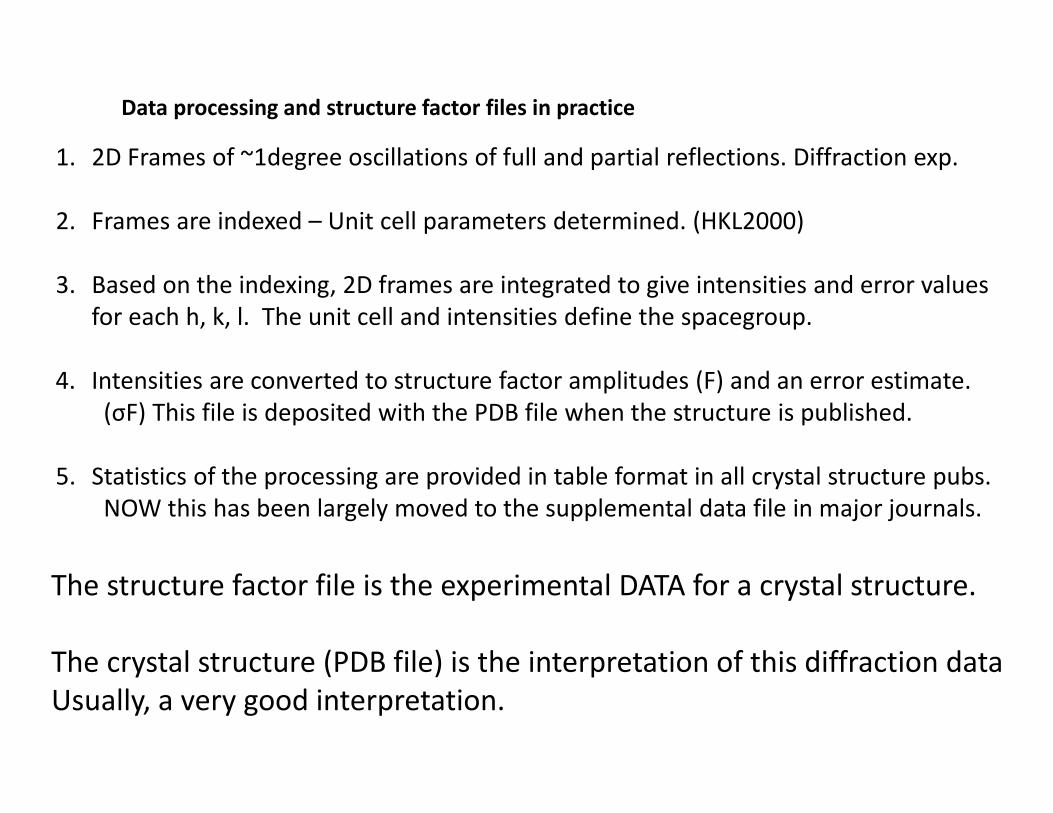
Data processing and structure factor files in practice
1. 2D Frames of ~1degree oscillations of full and partial reflections. Diffraction exp.
2. Frames are indexed – Unit cell parameters determined. (HKL2000)
3. Based on the indexing, 2D frames are integrated to give intensities and error valuesfor each h, k, l. The unit cell and intensities define the spacegroup.
4. Intensities are converted to structure factor amplitudes (F) and an error estimate. (σF) This file is deposited with the PDB file when the structure is published.
5. Statistics of the processing are provided in table format in all crystal structure pubs.NOW this has been largely moved to the supplemental data file in major journals.
The structure factor file is the experimental DATA for a crystal structure.
The crystal structure (PDB file) is the interpretation of this diffraction dataUsually, a very good interpretation.
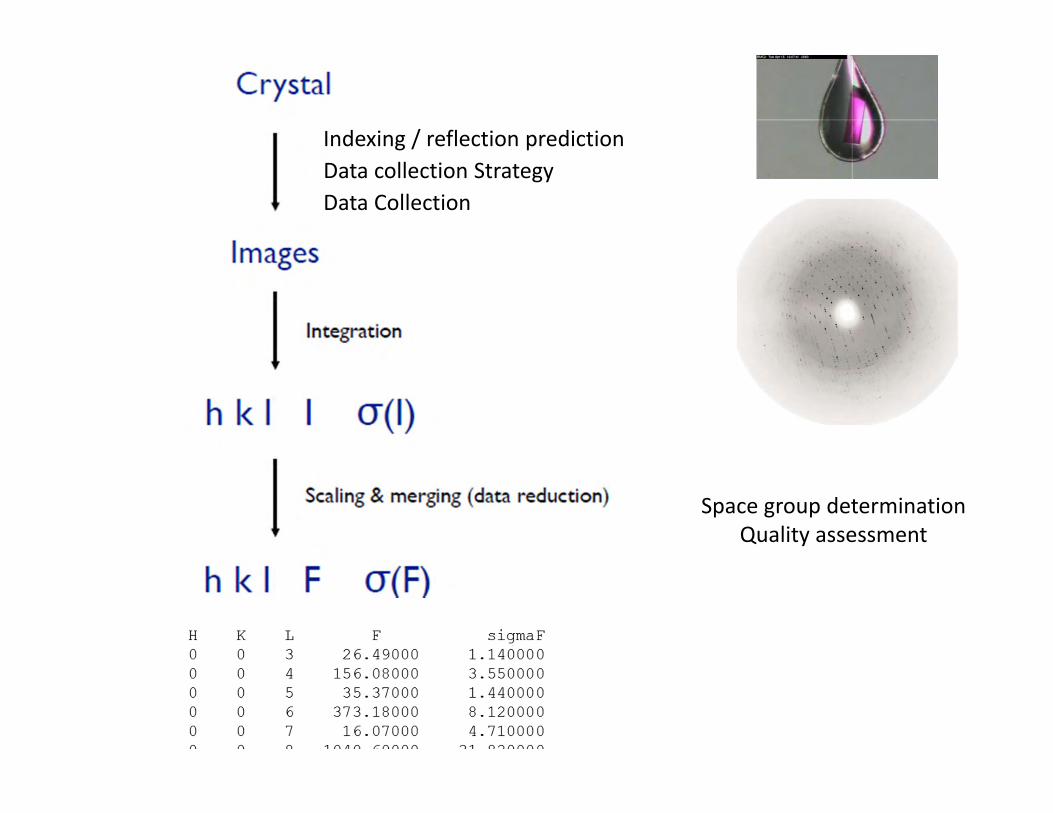
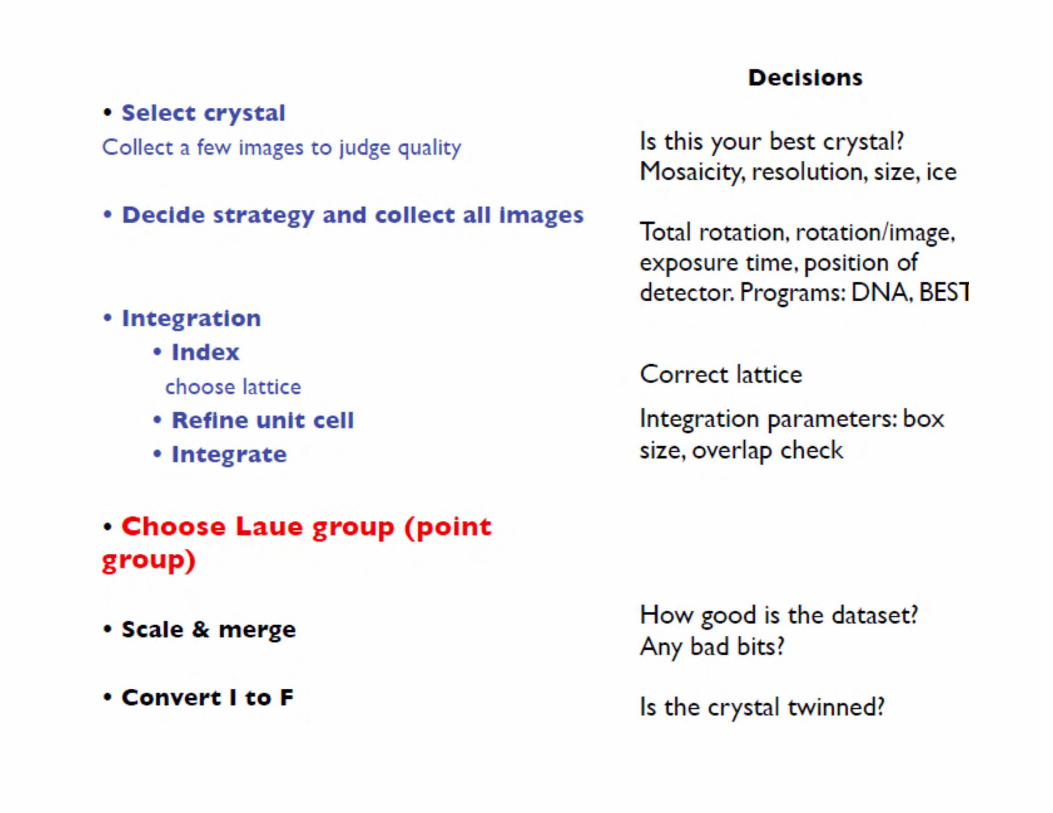
Indexing / reflection prediction
Data Collection
Space group determinationQuality assessment
Data collection Strategy