Embed Size (px)
Citation preview
KOBE STEEL GROUPAnnual Report 2014Year ended March 31, 2014
Buildinga Foundation for Growth
KO
BE STEEL GRO
UP A
NN
UA
L REPORT 2014
Caution Regarding Forward-Looking StatementsCertain statements in this annual report contain forward-looking state-
ments concerning forecasts, assertions, prospects, intentions and strat-
egies. The decisions and assumptions leading to these statements were
based on information currently available to Kobe Steel. Due to possible
changes in decisions and assumptions, future business operations, and
internal and external conditions, actual results may differ materially
from the projected forward-looking statements. Kobe Steel is not
obligated to revise the forward-looking contents in this publication.
Uncertain and variable factors include, but are not limited to:
• Changes in economic outlook, demand and market conditions
• Political situation and trade and other regulations
• Changes in currency exchange rates
• Availability and market conditions of raw materials
• Products and services of competing companies, pricing policy, alliances,
and business development including M&As
• Strategy changes of alliance partners
02 At a Glance
04 To Our Shareholders
08 Special Feature
14 Review of Operations
14 Iron & Steel Business
16 Welding Business
18 Aluminum & Copper Business
20 Machinery Business
22 Engineering Business
24 Kobelco Eco-Solutions
26 Kobelco Construction Machinery
28 Kobelco Cranes
30 Other Businesses
31 Domestic and Overseas Offices
32 Main Operating Locations in Japan
34 Main Operating Locations Overseas
36 R&D and Intellectual Property Activities
38 Corporate Social Responsibility
46 Directors, Audit & Supervisory Board Members and Corporate Officers
47 Financial Section
84 Investor Information
85 Company Outline
Laying the Foundation for Stable Profits and Business Growth08 Reinforcing Our Competitiveness
10 Securing Greater Competitiveness and Expanding Profitability in Each Business Segment
12 Making Cars Lighter
Contents
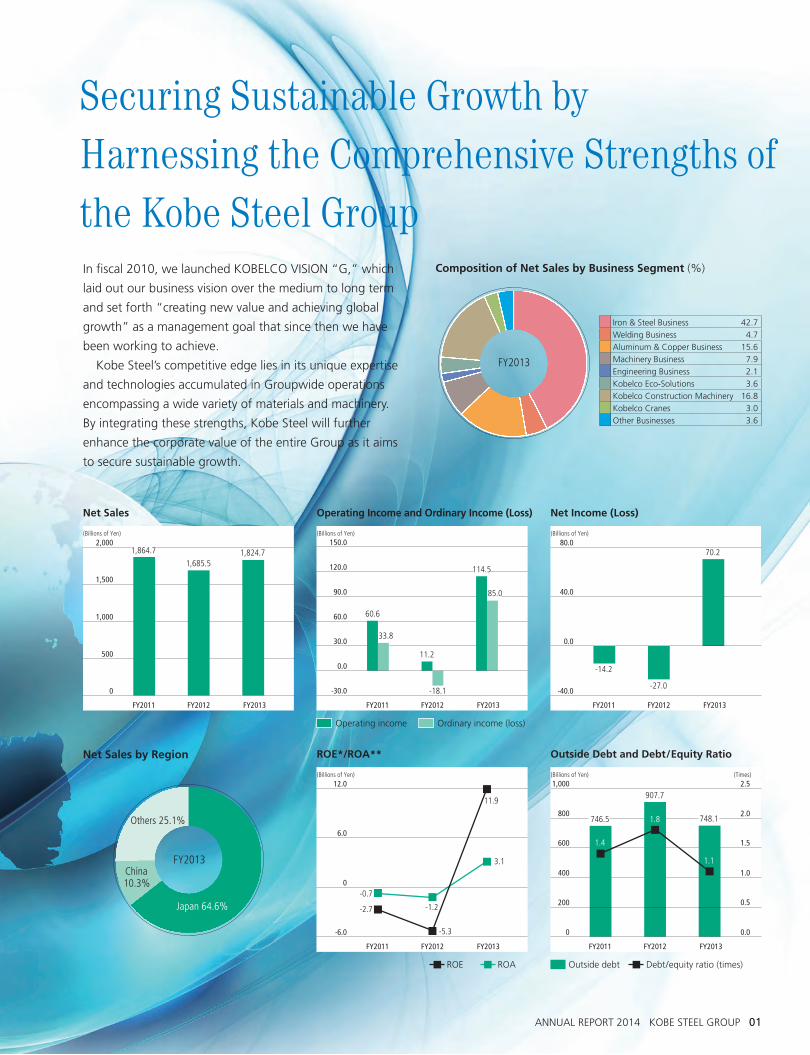
Securing Sustainable Growth by Harnessing the Comprehensive Strengths of the Kobe Steel GroupIn fiscal 2010, we launched KOBELCO VISION “G,” which
laid out our business vision over the medium to long term
and set forth “creating new value and achieving global
growth” as a management goal that since then we have
been working to achieve.
Kobe Steel’s competitive edge lies in its unique expertise
and technologies accumulated in Groupwide operations
encompassing a wide variety of materials and machinery.
By integrating these strengths, Kobe Steel will further
enhance the corporate value of the entire Group as it aims
to secure sustainable growth.
(Billions of Yen)
1,685.51,824.71,864.7
FY2011 FY2012 FY2013
0
500
1,000
1,500
2,000
Net Sales
(Billions of Yen)
60.6
11.2
114.5
33.8
-18.1
85.0
FY2011 FY2012 FY2013
-30.0
0.0
30.0
60.0
90.0
120.0
150.0
Operating Income and Ordinary Income (Loss)
(Billions of Yen)
70.2
-14.2
-27.0
FY2011 FY2012 FY2013
-40.0
0.0
40.0
80.0
Net Income (Loss)
Japan 64.6%
China 10.3%
Others 25.1%
FY2013
Net Sales by Region
FY2013
Composition of Net Sales by Business Segment (%)
ANNUAL REPORT 2014 KOBE STEEL GROUP 01
Iron & Steel Business 42.7
Welding Business 4.7
Aluminum & Copper Business 15.6
Machinery Business 7.9
Engineering Business 2.1
Kobelco Eco-Solutions 3.6
Kobelco Construction Machinery 16.8
Kobelco Cranes 3.0
Other Businesses 3.6
Operating income Ordinary income (loss)
(Billions of Yen)
748.1746.5
907.7
0
200
400
600
800
1,000
1.8
(Times)
1.1
1.4
0.0
0.5
1.0
1.5
2.0
2.5
FY2011 FY2012 FY2013
Outside Debt and Debt/Equity Ratio
(Billions of Yen)
-2.7
-0.7
-1.2
-5.3
3.1
11.9
FY2011 FY2012 FY2013
-6.0
0
6.0
12.0
ROE*/ROA**
Outside debt Debt/equity ratio (times) ROE ROA
02 ANNUAL REPORT 2014 KOBE STEEL GROUP
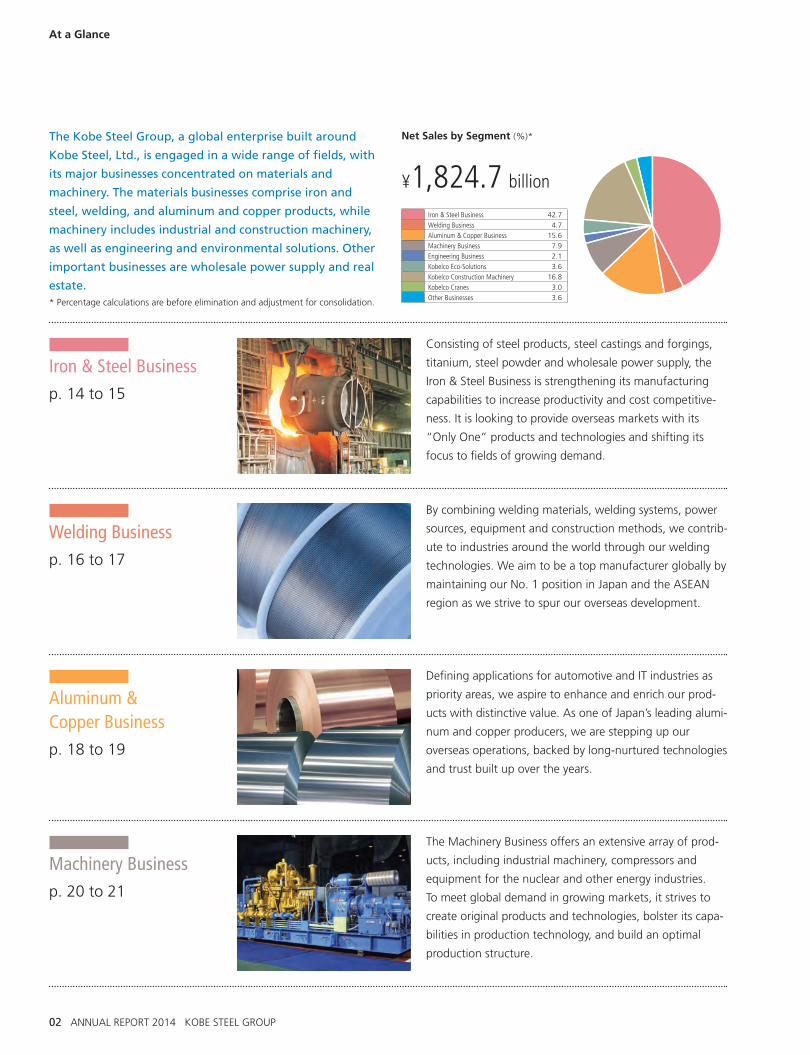
¥1,824.7 billion
At a Glance
Consisting of steel products, steel castings and forgings,
titanium, steel powder and wholesale power supply, the
Iron & Steel Business is strengthening its manufacturing
capabilities to increase productivity and cost competitive-
ness. It is looking to provide overseas markets with its
“Only One” products and technologies and shifting its
focus to fields of growing demand.
Iron & Steel Businessp. 14 to 15
Welding Businessp. 16 to 17
Aluminum & Copper Businessp. 18 to 19
Machinery Businessp. 20 to 21
By combining welding materials, welding systems, power
sources, equipment and construction methods, we contrib-
ute to industries around the world through our welding
technologies. We aim to be a top manufacturer globally by
maintaining our No. 1 position in Japan and the ASEAN
region as we strive to spur our overseas development.
Defining applications for automotive and IT industries as
priority areas, we aspire to enhance and enrich our prod-
ucts with distinctive value. As one of Japan’s leading alumi-
num and copper producers, we are stepping up our
overseas operations, backed by long-nurtured technologies
and trust built up over the years.
The Machinery Business offers an extensive array of prod-
ucts, including industrial machinery, compressors and
equipment for the nuclear and other energy industries.
To meet global demand in growing markets, it strives to
create original products and technologies, bolster its capa-
bilities in production technology, and build an optimal
production structure.
The Kobe Steel Group, a global enterprise built around
Kobe Steel, Ltd., is engaged in a wide range of fields, with
its major businesses concentrated on materials and
machinery. The materials businesses comprise iron and
steel, welding, and aluminum and copper products, while
machinery includes industrial and construction machinery,
as well as engineering and environmental solutions. Other
important businesses are wholesale power supply and real
estate.* Percentage calculations are before elimination and adjustment for consolidation.
Iron & Steel Business 42.7
Welding Business 4.7
Aluminum & Copper Business 15.6
Machinery Business 7.9
Engineering Business 2.1
Kobelco Eco-Solutions 3.6
Kobelco Construction Machinery 16.8
Kobelco Cranes 3.0
Other Businesses 3.6
Net Sales by Segment (%)*
ANNUAL REPORT 2014 KOBE STEEL GROUP 03
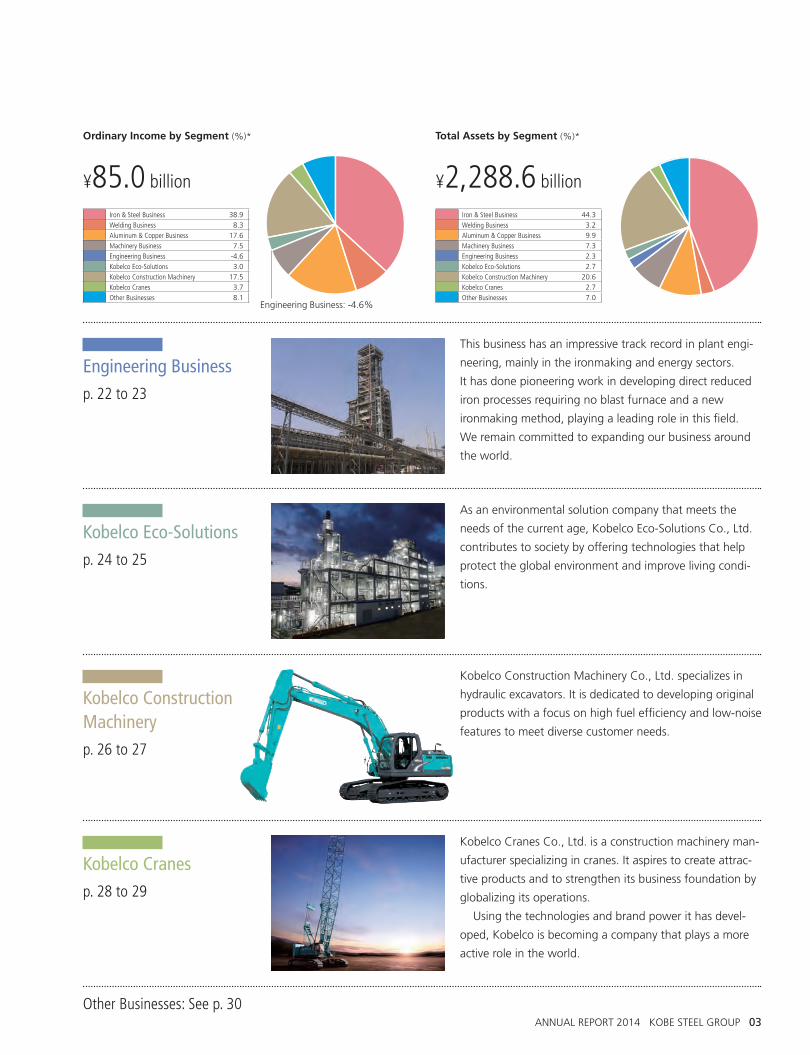
This business has an impressive track record in plant engi-
neering, mainly in the ironmaking and energy sectors.
It has done pioneering work in developing direct reduced
iron processes requiring no blast furnace and a new
ironmaking method, playing a leading role in this field.
We remain committed to expanding our business around
the world.
Engineering Businessp. 22 to 23
Kobelco Eco-Solutionsp. 24 to 25
Kobelco Construction Machineryp. 26 to 27
Kobelco Cranesp. 28 to 29
As an environmental solution company that meets the
needs of the current age, Kobelco Eco-Solutions Co., Ltd.
contributes to society by offering technologies that help
protect the global environment and improve living condi-
tions.
Kobelco Construction Machinery Co., Ltd. specializes in
hydraulic excavators. It is dedicated to developing original
products with a focus on high fuel efficiency and low-noise
features to meet diverse customer needs.
Kobelco Cranes Co., Ltd. is a construction machinery man-
ufacturer specializing in cranes. It aspires to create attrac-
tive products and to strengthen its business foundation by
globalizing its operations.
Using the technologies and brand power it has devel-
oped, Kobelco is becoming a company that plays a more
active role in the world.
¥85.0 billion ¥2,288.6 billion
Iron & Steel Business 44.3
Welding Business 3.2
Aluminum & Copper Business 9.9
Machinery Business 7.3
Engineering Business 2.3
Kobelco Eco-Solutions 2.7
Kobelco Construction Machinery 20.6
Kobelco Cranes 2.7
Other Businesses 7.0
Iron & Steel Business 38.9
Welding Business 8.3
Aluminum & Copper Business 17.6
Machinery Business 7.5
Engineering Business -4.6
Kobelco Eco-Solutions 3.0
Kobelco Construction Machinery 17.5
Kobelco Cranes 3.7
Other Businesses 8.1
Ordinary Income by Segment (%)* Total Assets by Segment (%)*
Other Businesses: See p. 30
Engineering Business: -4.6%
04 ANNUAL REPORT 2014 KOBE STEEL GROUP
To Our Shareholders
We are committed to becoming a corporate group with a prominent position in the global market
Hiroya Kawasaki President, CEO and Representative Director
ANNUAL REPORT 2014 KOBE STEEL GROUP 05
Fiscal 2013 in Review
The Japanese economy continued its steady rebound
due in part to increased public investment, including
recovery efforts related to the Great East Japan
Earthquake. Also, on the back of monetary, fiscal, and
other government economic measures, export indus-
tries began to pick up owing to a correction in the
yen, which remained high until the previous year. In
overseas markets, while the U.S. economy continued
to record gradual recovery, Europe remained weak. In
China, although economic growth was sustained, the
overall pace continued to slow.
Against this economic backdrop, the Kobe Steel
Group saw its sales volume of steel products and alu-
minum rolled products increase in fiscal 2013 com-
pared with the previous year due to strong demand
from the automotive sector and the correction in the
high yen that brought about an improvement in the
export environment. The sales volume of copper rolled
products increased year on year thanks in part to firm
demand from the automotive sector and a sustained
recovery in demand for semiconductors.
The sales volume of hydraulic excavators rose in
Japan owing to demand arising from earthquake
recovery efforts and a last-minute market surge prior
to the implementation of stricter exhaust emission
regulations. The sales volume overseas also grew com-
pared with the previous year as the slowdown in the
Chinese economy seemed to have bottomed out and
sales continued to steadily expand in North America
and Europe, although demand remained sluggish in
Southeast Asia.
As a result, fiscal 2013 consolidated net sales were
up ¥139.2 billion year on year to ¥1,824.7 billion.
Consolidated ordinary income amounted to ¥85.0 bil-
lion, a ¥103.2 billion reversal from a loss in the previous
fiscal year, owing to progress in reducing overall costs,
a favorable change in inventory valuation, and a
change in the depreciation method for fixed assets.
Outlook for Fiscal 2014
The world economy is anticipated to continue recover-
ing in fiscal 2014. Although demand in fiscal 2014 is
expected to soften in the wake of the last-minute
surge in demand in fiscal 2013 prior to the consump-
tion tax increase on April 1, domestic demand is fore-
cast to benefit from reconstruction demand and
government fiscal policy.
In overseas markets, demand is expected to contin-
ue to gradually recover, particularly in North America
and Europe. However, the overall outlook is unclear
due to the slowdown in Chinese economic growth
and the possible worsening of economic conditions in
many developing countries due to a tapering off of
quantitative easing in the United States. For the Kobe
Steel Group, demand is anticipated to be strong across
all its business segments. However, there are concerns
that sluggish demand in developing countries as well
as the ongoing overstock of steel products in the
Asian region will negatively affect operations.
Under these conditions, Kobe Steel anticipates that
consolidated sales will reach approximately ¥1,950.0
billion in fiscal 2014 and ordinary income is forecast to
reach approximately ¥80.0 billion.
Progress of the Kobe Steel Group’s 2013–2015
Medium-Term Business Plan
In May 2013, the Kobe Steel Group announced its
Fiscal 2013–2015 Medium-Term Business Plan.
We have positioned the three-year period of the
current medium-term business plan beginning from
fiscal 2013 as a time to rebuild the Group’s business
06 ANNUAL REPORT 2014 KOBE STEEL GROUP
improvement in earnings. We will continue to move
forward with competitiveness improvement initiatives
while striving to remain nimble in our response to
changes in the business environment to maximize
earnings.
As for our progress in improving financial perfor-
mance, in fiscal 2013, we secured ¥120.0 billion in
cash, exceeding the original plan by ¥20.0 billion,
through such cash creation measures as asset reduc-
tion involving selling investment securities and cutting
inventory. As a result, outside debt at the end of fiscal
2013 decreased ¥159.5 billion to ¥748.1 billion from
¥907.7 billion at the end of fiscal 2012 and the debt/
equity ratio improved to 1.11 times.
In fiscal 2014, we forecast outside debt to be
around ¥700.0 billion and the debt/equity ratio to
improve to 1.0 times due to the securing of earnings
as we continue to improve our financial position.
An overview of the important issues we are now
addressing as we build a foundation for stable profits
and business growth is presented in the special feature
section on the following pages.
foundation. At the same time, we view this period as
a time for establishing a foundation for stable profits
and business growth.
To rebuild our business foundation, we will tackle
the following four issues: strengthening the profitabili-
ty of the steel business, improving the competitiveness
of the Company, improving financial performance, and
securing sales volume in growth sectors and regions.
With regard to strengthening the profitability of the
steel business, we successfully achieved our goal of a
¥30.0 billion increase in fiscal 2013 thanks to raw
material cost improvements attributable to lower pro-
curement expenses, despite falling short of our fixed
costs reduction target owing to increased production.
As for our progress toward improving the competi-
tiveness of the Company, although due to stepped up
production in fiscal 2013 we were unable to meet
some original targets, such as for fixed costs, our ini-
tiatives yielded a roughly ¥19.0 billion year-on-year
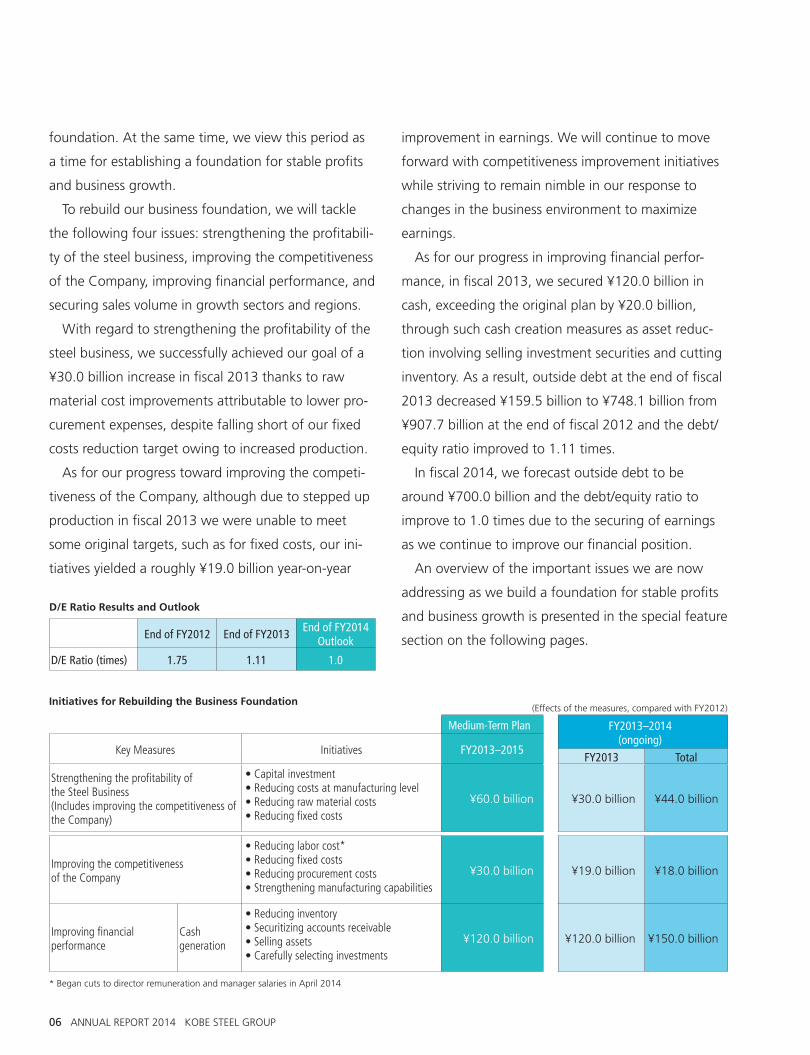
D/E Ratio Results and Outlook
End of FY2012 End of FY2013 End of FY2014 Outlook
D/E Ratio (times) 1.75 1.11 1.0
Initiatives for Rebuilding the Business Foundation
Medium-Term Plan FY2013–2014 (ongoing)
Key Measures Initiatives FY2013–2015FY2013 Total
Strengthening the profitability of the Steel Business (Includes improving the competitiveness of the Company)
• Capital investment• Reducing costs at manufacturing level• Reducing raw material costs• Reducing fixed costs
¥60.0 billion ¥30.0 billion ¥44.0 billion
Improving the competitiveness of the Company
• Reducing labor cost*• Reducing fixed costs• Reducing procurement costs• Strengthening manufacturing capabilities
¥30.0 billion ¥19.0 billion ¥18.0 billion
Improving financial performance
Cash generation
• Reducing inventory• Securitizing accounts receivable• Selling assets• Carefully selecting investments
¥120.0 billion ¥120.0 billion ¥150.0 billion
(Effects of the measures, compared with FY2012)
* Began cuts to director remuneration and manager salaries in April 2014
ANNUAL REPORT 2014 KOBE STEEL GROUP 07
Public Offerings to Raise Capital
To successfully reform our business foundation and lay
the foundation for stable earnings and business
growth as set out in the medium-term plan, we imple-
mented a public offering to raise capital in February
2014, our first such issuance in 24 years.
We procured a total of ¥83.6 billion through the
issuance of new shares and disposition of treasury
shares by way of public offering. We will allocate
¥13.2 billion of the funds to the Iron & Steel Business
for the establishment of a joint venture in China to
manufacture cold-rolled, high-strength steel for auto-
motive parts and the Aluminum & Copper Business for
the establishment of a company in China to manufac-
ture aluminum sheet for automotive panels.
The remaining funds will be used for the construc-
tion of a new hot-metal treatment plant at Kakogawa
Works; capital investment in highly efficient in-house
power plants and other measures to strengthen profit-
ability in the steel business; and capital investment
related to reforming the structure of the steel business
by consolidating Kobe Works’ upstream processes at
the Kakogawa Works, which is a more cost-efficient
producer of iron and steel.
Regarding Dividend Payments
The Kobe Steel Group views the returning of profits to
shareholders as one of its most important manage-
ment issues. The Group aims to pay dividends on a
stable and continuous basis. The actual amount of the
dividend is decided after taking into full account the
Company’s performance during each period, the divi-
dend payout ratio, investment capital needs for future
growth, relative improvement in financial position and
other factors. The dividend payout ratio we are target-
ing is 15% to 25% of consolidated net income.
In fiscal 2012, even though we did everything we
possibly could to improve profitability, with much
regret, we were unable to pay a dividend because of
the net loss we recorded, the second year in a row fol-
lowing a net loss in fiscal 2011. In fiscal 2013, consid-
ering the improved conditions in our financial position
and the current and prospective business environment,
we decided to resume the distribution of dividends
and paid out a dividend of ¥4 per share.
In Conclusion
As I mentioned previously, we cannot take lightly the
business environment the Group faces in fiscal 2014.
We remain focused on successfully carrying out the
medium-term plan by increasing our competitiveness
and bolstering our business structure.
I would like to thank all of our shareholders, inves-
tors and other stakeholders and ask for their contin-
ued understanding and support.
August 2014
President, CEO and Representative Director
08 ANNUAL REPORT 2014 KOBE STEEL GROUP
Laying the Foundation for Stable Profits and Business GrowthSpecial Feature
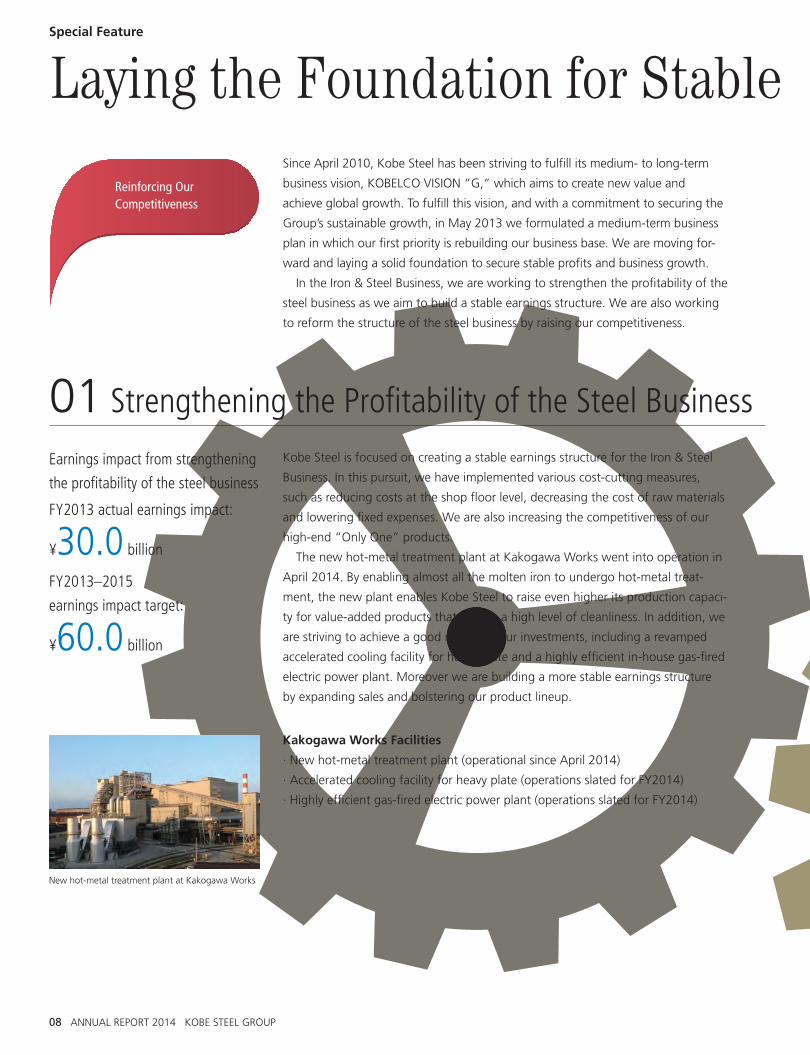
Earnings impact from strengthening
the profitability of the steel business
FY2013 actual earnings impact:
¥30.0 billion
FY2013–2015
earnings impact target:
¥60.0 billion
Kobe Steel is focused on creating a stable earnings structure for the Iron & Steel
Business. In this pursuit, we have implemented various cost-cutting measures,
such as reducing costs at the shop floor level, decreasing the cost of raw materials
and lowering fixed expenses. We are also increasing the competitiveness of our
high-end “Only One” products.
The new hot-metal treatment plant at Kakogawa Works went into operation in
April 2014. By enabling almost all the molten iron to undergo hot-metal treat-
ment, the new plant enables Kobe Steel to raise even higher its production capaci-
ty for value-added products that require a high level of cleanliness. In addition, we
are striving to achieve a good return on our investments, including a revamped
accelerated cooling facility for heavy plate and a highly efficient in-house gas-fired
electric power plant. Moreover we are building a more stable earnings structure
by expanding sales and bolstering our product lineup.
Kakogawa Works Facilities
· New hot-metal treatment plant (operational since April 2014)
· Accelerated cooling facility for heavy plate (operations slated for FY2014)
· Highly efficient gas-fired electric power plant (operations slated for FY2014)
Since April 2010, Kobe Steel has been striving to fulfill its medium- to long-term
business vision, KOBELCO VISION “G,” which aims to create new value and
achieve global growth. To fulfill this vision, and with a commitment to securing the
Group’s sustainable growth, in May 2013 we formulated a medium-term business
plan in which our first priority is rebuilding our business base. We are moving for-
ward and laying a solid foundation to secure stable profits and business growth.
In the Iron & Steel Business, we are working to strengthen the profitability of the
steel business as we aim to build a stable earnings structure. We are also working
to reform the structure of the steel business by raising our competitiveness.
Reinforcing Our Competitiveness
01 Strengthening the Profitability of the Steel Business
New hot-metal treatment plant at Kakogawa Works
ANNUAL REPORT 2014 KOBE STEEL GROUP 09
Laying the Foundation for Stable Profits and Business Growth
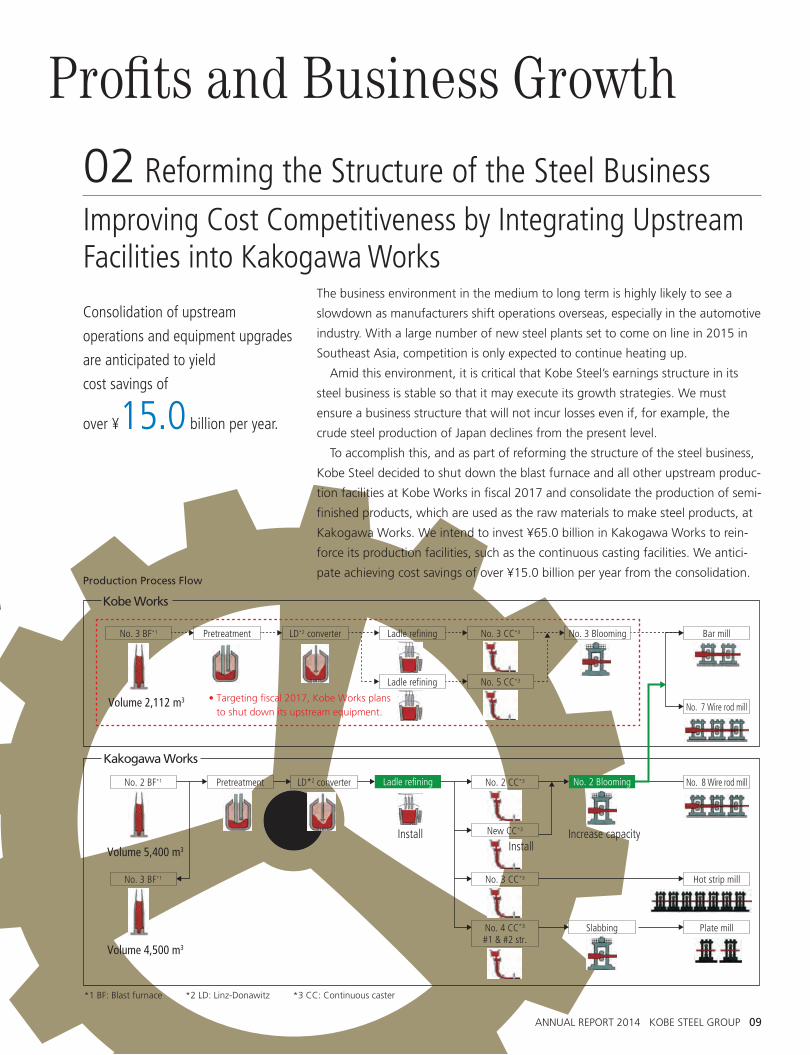
Consolidation of upstream
operations and equipment upgrades
are anticipated to yield
cost savings of
over ¥15.0 billion per year.
The business environment in the medium to long term is highly likely to see a
slowdown as manufacturers shift operations overseas, especially in the automotive
industry. With a large number of new steel plants set to come on line in 2015 in
Southeast Asia, competition is only expected to continue heating up.
Amid this environment, it is critical that Kobe Steel’s earnings structure in its
steel business is stable so that it may execute its growth strategies. We must
ensure a business structure that will not incur losses even if, for example, the
crude steel production of Japan declines from the present level.
To accomplish this, and as part of reforming the structure of the steel business,
Kobe Steel decided to shut down the blast furnace and all other upstream produc-
tion facilities at Kobe Works in fiscal 2017 and consolidate the production of semi-
finished products, which are used as the raw materials to make steel products, at
Kakogawa Works. We intend to invest ¥65.0 billion in Kakogawa Works to rein-
force its production facilities, such as the continuous casting facilities. We antici-
pate achieving cost savings of over ¥15.0 billion per year from the consolidation.
02 Reforming the Structure of the Steel Business
*1 BF: Blast furnace *2 LD: Linz-Donawitz *3 CC: Continuous caster
No. 3 BF*1 Pretreatment LD*2 converter Ladle refining
Ladle refining
No. 3 CC*3 No. 3 Blooming Bar mill
No. 7 Wire rod mill
No. 5 CC*3
No. 2 BF*1
No. 3 BF*1
Pretreatment LD*2 converter Ladle refining No. 2 CC*3 No. 2 Blooming No. 8 Wire rod mill
New CC*3
No. 3 CC*3
No. 4 CC*3
#1 & #2 str.Slabbing
Hot strip mill
Plate mill
Kobe Works
Kakogawa Works
• Targeting fiscal 2017, Kobe Works plans to shut down its upstream equipment.
Volume 2,112 m3
Volume 5,400 m3
Volume 4,500 m3
InstallInstall
Increase capacity
Production Process Flow
Improving Cost Competitiveness by Integrating Upstream Facilities into Kakogawa Works
10 ANNUAL REPORT 2014 KOBE STEEL GROUP
In the construction machinery, compressor and other businesses, we have estab-
lished locations around the world and are boldly pursuing global growth strate-
gies. In addition, we are expanding our business and creating new products, such
as binary power generation systems and products for hydrogen stations, by lever-
aging the diverse technologies and other strengths of the Group and combining
technologies through Groupwide projects.
In addition, we are active in the power supply business, viewing it as a stable
earnings base into the future.
Securing Greater Competitiveness and Expanding Profitability in Each Business Segment
Laying the Foundation for Stable Profits and Business GrowthSpecial Feature:
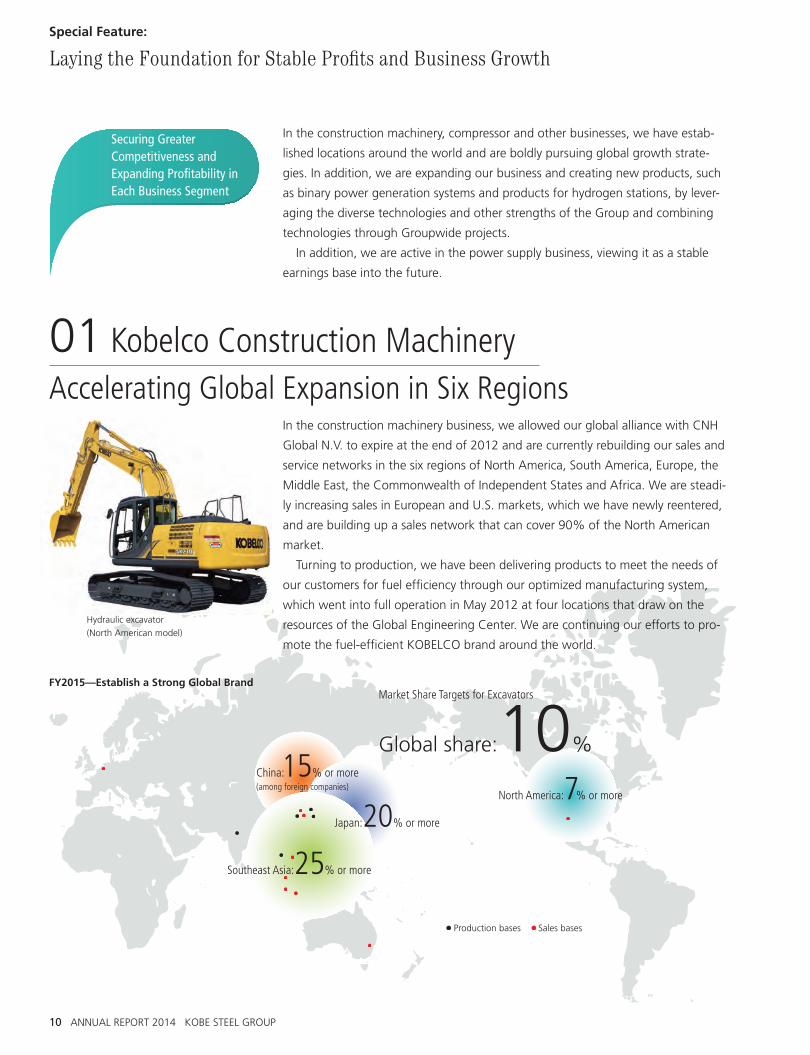
01 Kobelco Construction MachineryAccelerating Global Expansion in Six Regions
China:15% or more
Southeast Asia:25% or more
Japan:20% or more
North America:7% or more
Market Share Targets for Excavators
Global share:10%
Production bases Sales bases
(among foreign companies)
FY2015—Establish a Strong Global Brand
Hydraulic excavator
(North American model)
In the construction machinery business, we allowed our global alliance with CNH
Global N.V. to expire at the end of 2012 and are currently rebuilding our sales and
service networks in the six regions of North America, South America, Europe, the
Middle East, the Commonwealth of Independent States and Africa. We are steadi-
ly increasing sales in European and U.S. markets, which we have newly reentered,
and are building up a sales network that can cover 90% of the North American
market.
Turning to production, we have been delivering products to meet the needs of
our customers for fuel efficiency through our optimized manufacturing system,
which went into full operation in May 2012 at four locations that draw on the
resources of the Global Engineering Center. We are continuing our efforts to pro-
mote the fuel-efficient KOBELCO brand around the world.
ANNUAL REPORT 2014 KOBE STEEL GROUP 11
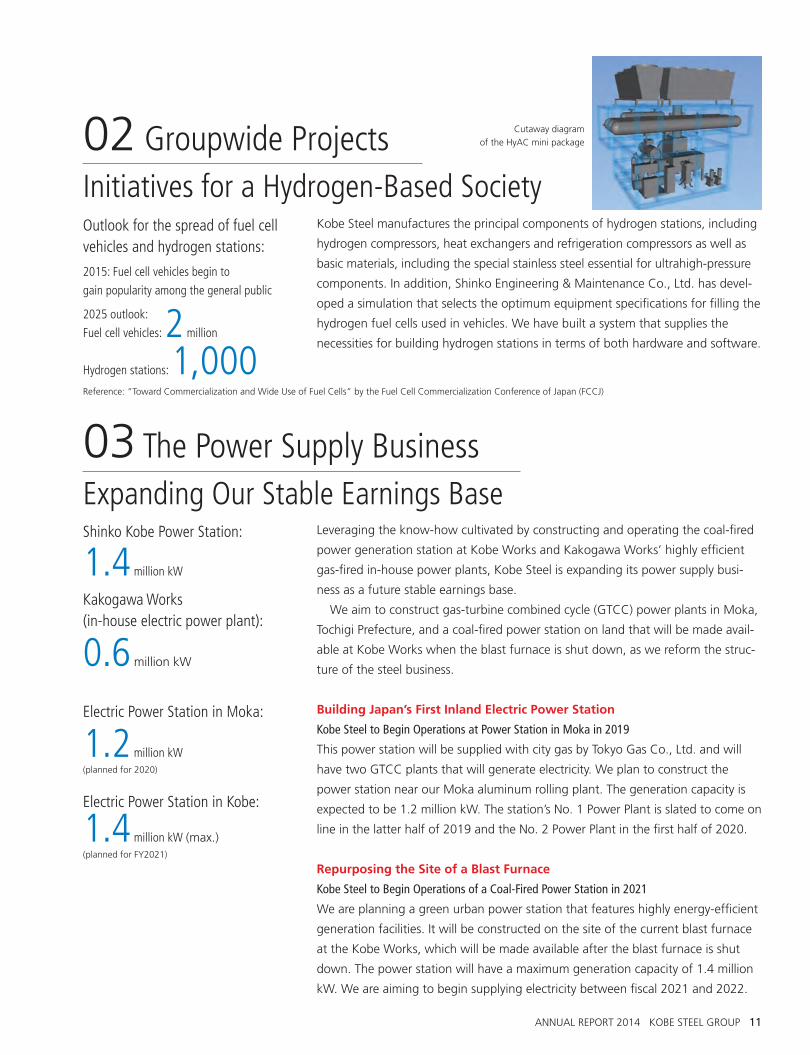
Kobe Steel manufactures the principal components of hydrogen stations, including
hydrogen compressors, heat exchangers and refrigeration compressors as well as
basic materials, including the special stainless steel essential for ultrahigh-pressure
components. In addition, Shinko Engineering & Maintenance Co., Ltd. has devel-
oped a simulation that selects the optimum equipment specifications for filling the
hydrogen fuel cells used in vehicles. We have built a system that supplies the
necessities for building hydrogen stations in terms of both hardware and software.
Leveraging the know-how cultivated by constructing and operating the coal-fired
power generation station at Kobe Works and Kakogawa Works’ highly efficient
gas-fired in-house power plants, Kobe Steel is expanding its power supply busi-
ness as a future stable earnings base.
We aim to construct gas-turbine combined cycle (GTCC) power plants in Moka,
Tochigi Prefecture, and a coal-fired power station on land that will be made avail-
able at Kobe Works when the blast furnace is shut down, as we reform the struc-
ture of the steel business.
Building Japan’s First Inland Electric Power Station
Kobe Steel to Begin Operations at Power Station in Moka in 2019
This power station will be supplied with city gas by Tokyo Gas Co., Ltd. and will
have two GTCC plants that will generate electricity. We plan to construct the
power station near our Moka aluminum rolling plant. The generation capacity is
expected to be 1.2 million kW. The station’s No. 1 Power Plant is slated to come on
line in the latter half of 2019 and the No. 2 Power Plant in the first half of 2020.
Repurposing the Site of a Blast Furnace
Kobe Steel to Begin Operations of a Coal-Fired Power Station in 2021
We are planning a green urban power station that features highly energy-efficient
generation facilities. It will be constructed on the site of the current blast furnace
at the Kobe Works, which will be made available after the blast furnace is shut
down. The power station will have a maximum generation capacity of 1.4 million
kW. We are aiming to begin supplying electricity between fiscal 2021 and 2022.
02 Groupwide ProjectsInitiatives for a Hydrogen-Based Society
03 The Power Supply BusinessExpanding Our Stable Earnings Base
Cutaway diagram
of the HyAC mini package
Outlook for the spread of fuel cell vehicles and hydrogen stations:
2015: Fuel cell vehicles begin to
gain popularity among the general public
2025 outlook:
Fuel cell vehicles: 2 million
Hydrogen stations: 1,000
Electric Power Station in Kobe:
1.4 million kW (max.)(planned for FY2021)
Shinko Kobe Power Station:
1.4 million kW
Kakogawa Works (in-house electric power plant):
0.6 million kW
Electric Power Station in Moka:
1.2 million kW(planned for 2020)
Reference: “Toward Commercialization and Wide Use of Fuel Cells” by the Fuel Cell Commercialization Conference of Japan (FCCJ)
12 ANNUAL REPORT 2014 KOBE STEEL GROUP
Laying the Foundation for Stable Profits and Business GrowthSpecial Feature:
With protecting the global environment becoming increasingly important, auto-
makers around the world are making their cars lighter to improve fuel economy
and thus reduce CO2 emissions. Also spurring automakers to reduce vehicle
weight has been the recent tightening of regulations on fuel consumption. As the
batteries of eco-friendly vehicles, including hybrid, electric and fuel-cell cars, are
intrinsically heavy, the main focus is to make car bodies even lighter. At the same
time, this cannot be done at the cost of sacrificing collision safety performance.
Against this backdrop, Kobe Steel is helping to make lighter cars a reality by
providing superior steel and aluminum products.
Making Cars Lighter
In steel products, Kobe Steel’s aggressive R&D has yielded high-strength steel
sheet that automakers have been putting to use, especially in car bodies
and frames.
In aluminum products, in collaboration with automakers we have developed
panels and other materials for hoods and trunk lids as well as forgings for suspen-
sions from the design stage that every major automaker has adopted.(See diagram on next page.)
02 Kobe Steel’s InitiativesMarket Penetration of Kobe Steel Products
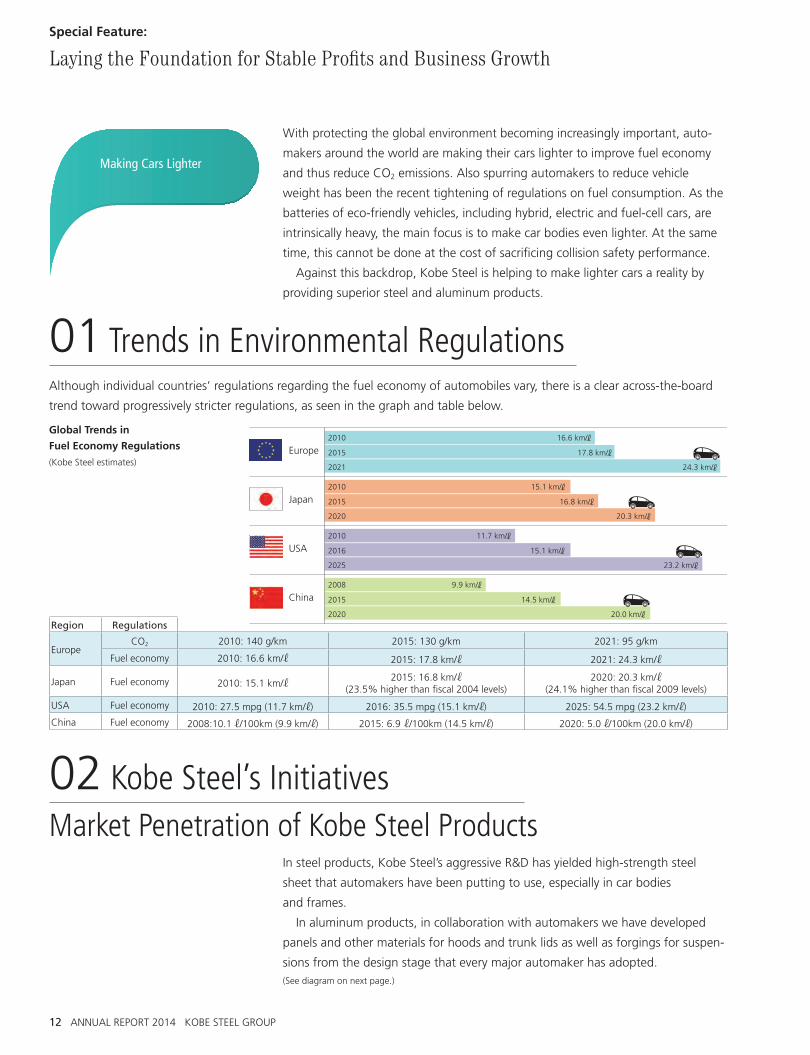
Although individual countries’ regulations regarding the fuel economy of automobiles vary, there is a clear across-the-board
trend toward progressively stricter regulations, as seen in the graph and table below.
01 Trends in Environmental Regulations
Global Trends in
Fuel Economy Regulations
(Kobe Steel estimates)
Region Regulations
EuropeCO2 2010: 140 g/km 2015: 130 g/km 2021: 95 g/km
Fuel economy 2010: 16.6 km/ 2015: 17.8 km/ 2021: 24.3 km/
Japan Fuel economy 2010: 15.1 km/2015: 16.8 km/
(23.5% higher than fiscal 2004 levels)2020: 20.3 km/
(24.1% higher than fiscal 2009 levels)
USA Fuel economy 2010: 27.5 mpg (11.7 km/ ) 2016: 35.5 mpg (15.1 km/ ) 2025: 54.5 mpg (23.2 km/ )
China Fuel economy 2008:10.1 /100km (9.9 km/ ) 2015: 6.9 /100km (14.5 km/ ) 2020: 5.0 /100km (20.0 km/ )
24.3 km/
17.8 km/
16.6 km/
2021
2015
2010
20.3 km/
16.8 km/
15.1 km/
23.2 km/
15.1 km/
11.7 km/
20.0 km/
14.5 km/
9.9 km/
Europe
Japan
USA
China
2020
2015
2010
2025
2016
2010
2020
2015
2008
ANNUAL REPORT 2014 KOBE STEEL GROUP 13
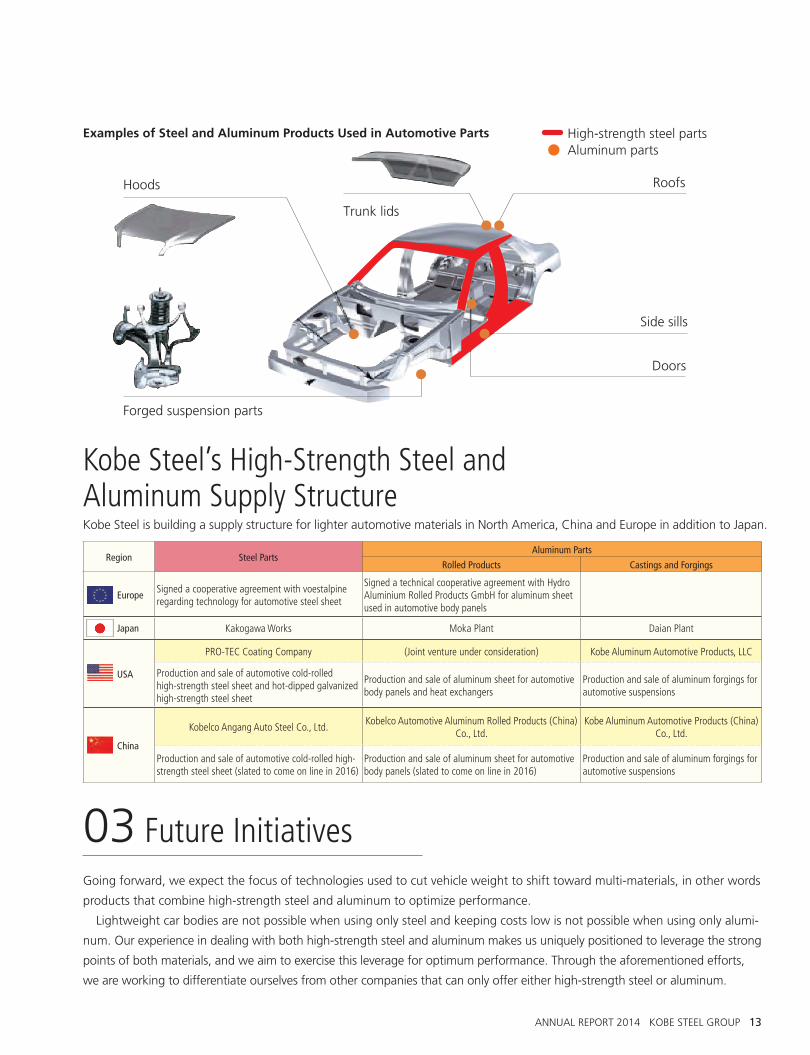
Hoods
Trunk lids
Side sills
Forged suspension parts
Roofs
Doors
Kobe Steel’s High-Strength Steel and Aluminum Supply StructureKobe Steel is building a supply structure for lighter automotive materials in North America, China and Europe in addition to Japan.
Region Steel PartsAluminum Parts
Rolled Products Castings and Forgings
EuropeSigned a cooperative agreement with voestalpine regarding technology for automotive steel sheet
Signed a technical cooperative agreement with Hydro Aluminium Rolled Products GmbH for aluminum sheet used in automotive body panels
Japan Kakogawa Works Moka Plant Daian Plant
USA
PRO-TEC Coating Company (Joint venture under consideration) Kobe Aluminum Automotive Products, LLC
Production and sale of automotive cold-rolled high-strength steel sheet and hot-dipped galvanized high-strength steel sheet
Production and sale of aluminum sheet for automotive body panels and heat exchangers
Production and sale of aluminum forgings for automotive suspensions
China
Kobelco Angang Auto Steel Co., Ltd.Kobelco Automotive Aluminum Rolled Products (China)
Co., Ltd.Kobe Aluminum Automotive Products (China)
Co., Ltd.
Production and sale of automotive cold-rolled high-strength steel sheet (slated to come on line in 2016)
Production and sale of aluminum sheet for automotive body panels (slated to come on line in 2016)
Production and sale of aluminum forgings for automotive suspensions
Going forward, we expect the focus of technologies used to cut vehicle weight to shift toward multi-materials, in other words
products that combine high-strength steel and aluminum to optimize performance.
Lightweight car bodies are not possible when using only steel and keeping costs low is not possible when using only alumi-
num. Our experience in dealing with both high-strength steel and aluminum makes us uniquely positioned to leverage the strong
points of both materials, and we aim to exercise this leverage for optimum performance. Through the aforementioned efforts,
we are working to differentiate ourselves from other companies that can only offer either high-strength steel or aluminum.
03 Future Initiatives
High-strength steel parts Aluminum parts
Examples of Steel and Aluminum Products Used in Automotive Parts
14 ANNUAL REPORT 2014 KOBE STEEL GROUP
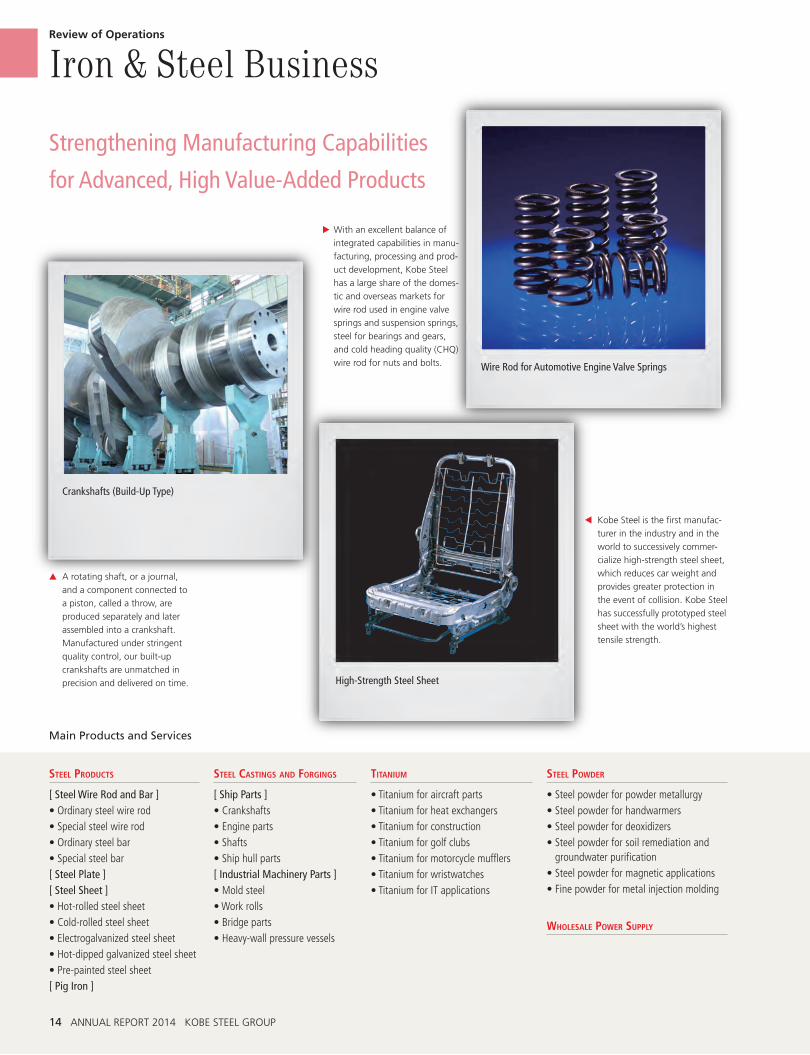
E With an excellent balance of
integrated capabilities in manu-
facturing, processing and prod-
uct development, Kobe Steel
has a large share of the domes-
tic and overseas markets for
wire rod used in engine valve
springs and suspension springs,
steel for bearings and gears,
and cold heading quality (CHQ)
wire rod for nuts and bolts.
G A rotating shaft, or a journal,
and a component connected to
a piston, called a throw, are
produced separately and later
assembled into a crankshaft.
Manufactured under stringent
quality control, our built-up
crankshafts are unmatched in
precision and delivered on time.
F Kobe Steel is the first manufac-
turer in the industry and in the
world to successively commer-
cialize high-strength steel sheet,
which reduces car weight and
provides greater protection in
the event of collision. Kobe Steel
has successfully prototyped steel
sheet with the world’s highest
tensile strength.
Strengthening Manufacturing Capabilities
for Advanced, High Value-Added Products
Wire Rod for Automotive Engine Valve Springs
Crankshafts (Build-Up Type)
Iron & Steel BusinessReview of Operations
TiTanium
• Titanium for aircraft parts• Titanium for heat exchangers• Titanium for construction• Titanium for golf clubs• Titanium for motorcycle mufflers• Titanium for wristwatches• Titanium for IT applications
STeel Powder
• Steel powder for powder metallurgy• Steel powder for handwarmers• Steel powder for deoxidizers• Steel powder for soil remediation and
groundwater purification• Steel powder for magnetic applications• Fine powder for metal injection molding
wholeSale Power SuPPly
STeel ProducTS
[ Steel Wire Rod and Bar ]• Ordinary steel wire rod• Special steel wire rod• Ordinary steel bar• Special steel bar[ Steel Plate ][ Steel Sheet ]• Hot-rolled steel sheet• Cold-rolled steel sheet• Electrogalvanized steel sheet• Hot-dipped galvanized steel sheet• Pre-painted steel sheet[ Pig Iron ]
STeel caSTingS and ForgingS
[ Ship Parts ]• Crankshafts• Engine parts• Shafts• Ship hull parts[ Industrial Machinery Parts ]• Mold steel• Work rolls• Bridge parts• Heavy-wall pressure vessels
High-Strength Steel Sheet
Main Products and Services
ANNUAL REPORT 2014 KOBE STEEL GROUP 15
Billions of yen
2012 2013 Change
Net sales ¥742.8 ¥808.5 +8.8%
Ordinary income (loss) (50.2) 33.6 ---
QFiscal 2013 Overview
Automotive demand has been strong both in Japan and overseas
and the sales volume of steel products therefore increased in
comparison with the previous year. Sales prices also increased due
to a rise in steel prices.
Sales of steel castings and forgings declined due to sluggish
demand in the shipbuilding industry and lower sales prices.
However, sales of titanium products increased.
As a result, consolidated segment sales in fiscal 2013 were up
8.8% to ¥808.5 billion. Ordinary income recovered from a loss of
¥50.2 billion in the previous year to income of ¥33.6 billion owing
to progress in reducing overall costs, a favorable change in
inventory valuation, and a change in the depreciation method for
fixed assets.
(--)
4.2%
Ordinary income ratio
+8.8%
¥808.5 billion
Net sales +¥83.8 billion
¥33.6 billion
Ordinary income
QTOPICS
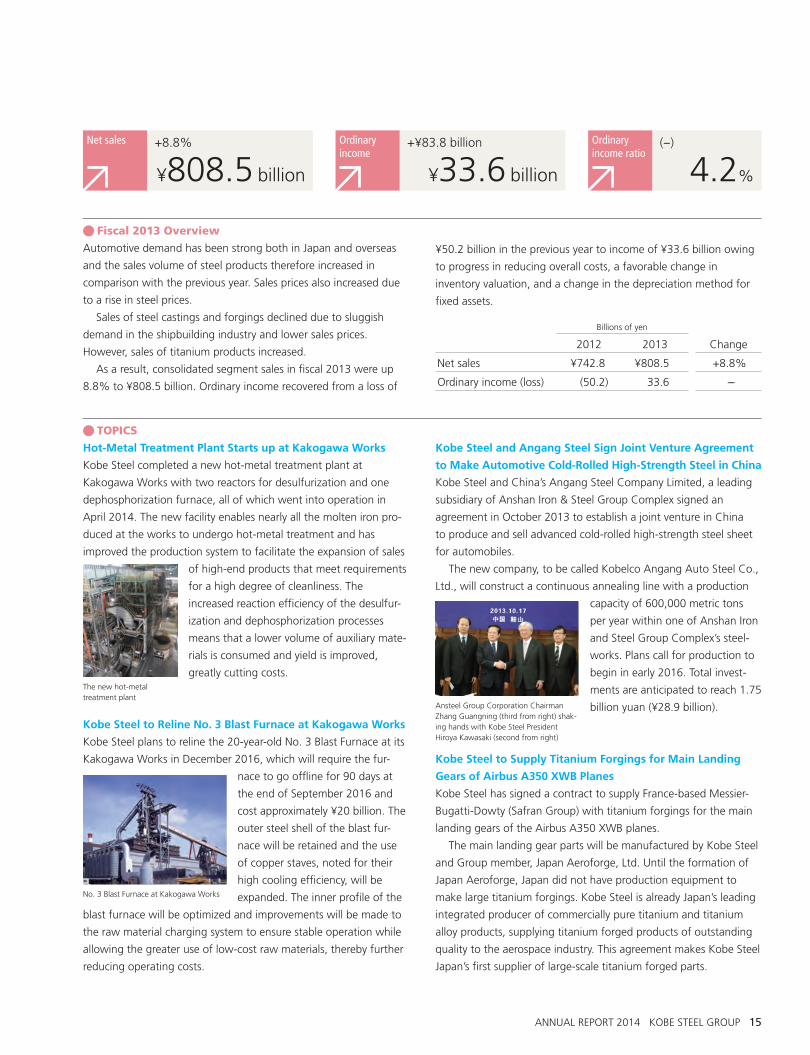
Hot-Metal Treatment Plant Starts up at Kakogawa Works
Kobe Steel completed a new hot-metal treatment plant at
Kakogawa Works with two reactors for desulfurization and one
dephosphorization furnace, all of which went into operation in
April 2014. The new facility enables nearly all the molten iron pro-
duced at the works to undergo hot-metal treatment and has
improved the production system to facilitate the expansion of sales
of high-end products that meet requirements
for a high degree of cleanliness. The
increased reaction efficiency of the desulfur-
ization and dephosphorization processes
means that a lower volume of auxiliary mate-
rials is consumed and yield is improved,
greatly cutting costs.
Kobe Steel to Reline No. 3 Blast Furnace at Kakogawa Works
Kobe Steel plans to reline the 20-year-old No. 3 Blast Furnace at its
Kakogawa Works in December 2016, which will require the fur-
nace to go offline for 90 days at
the end of September 2016 and
cost approximately ¥20 billion. The
outer steel shell of the blast fur-
nace will be retained and the use
of copper staves, noted for their
high cooling efficiency, will be
expanded. The inner profile of the
blast furnace will be optimized and improvements will be made to
the raw material charging system to ensure stable operation while
allowing the greater use of low-cost raw materials, thereby further
reducing operating costs.
Kobe Steel and Angang Steel Sign Joint Venture Agreement
to Make Automotive Cold-Rolled High-Strength Steel in China
Kobe Steel and China’s Angang Steel Company Limited, a leading
subsidiary of Anshan Iron & Steel Group Complex signed an
agreement in October 2013 to establish a joint venture in China
to produce and sell advanced cold-rolled high-strength steel sheet
for automobiles.
The new company, to be called Kobelco Angang Auto Steel Co.,
Ltd., will construct a continuous annealing line with a production
capacity of 600,000 metric tons
per year within one of Anshan Iron
and Steel Group Complex’s steel-
works. Plans call for production to
begin in early 2016. Total invest-
ments are anticipated to reach 1.75
billion yuan (¥28.9 billion).
Kobe Steel to Supply Titanium Forgings for Main Landing
Gears of Airbus A350 XWB Planes
Kobe Steel has signed a contract to supply France-based Messier-
Bugatti-Dowty (Safran Group) with titanium forgings for the main
landing gears of the Airbus A350 XWB planes.
The main landing gear parts will be manufactured by Kobe Steel
and Group member, Japan Aeroforge, Ltd. Until the formation of
Japan Aeroforge, Japan did not have production equipment to
make large titanium forgings. Kobe Steel is already Japan’s leading
integrated producer of commercially pure titanium and titanium
alloy products, supplying titanium forged products of outstanding
quality to the aerospace industry. This agreement makes Kobe Steel
Japan’s first supplier of large-scale titanium forged parts.
The new hot-metal treatment plant
No. 3 Blast Furnace at Kakogawa Works
Ansteel Group Corporation Chairman Zhang Guangning (third from right) shak-ing hands with Kobe Steel President Hiroya Kawasaki (second from right)
16 ANNUAL REPORT 2014 KOBE STEEL GROUP
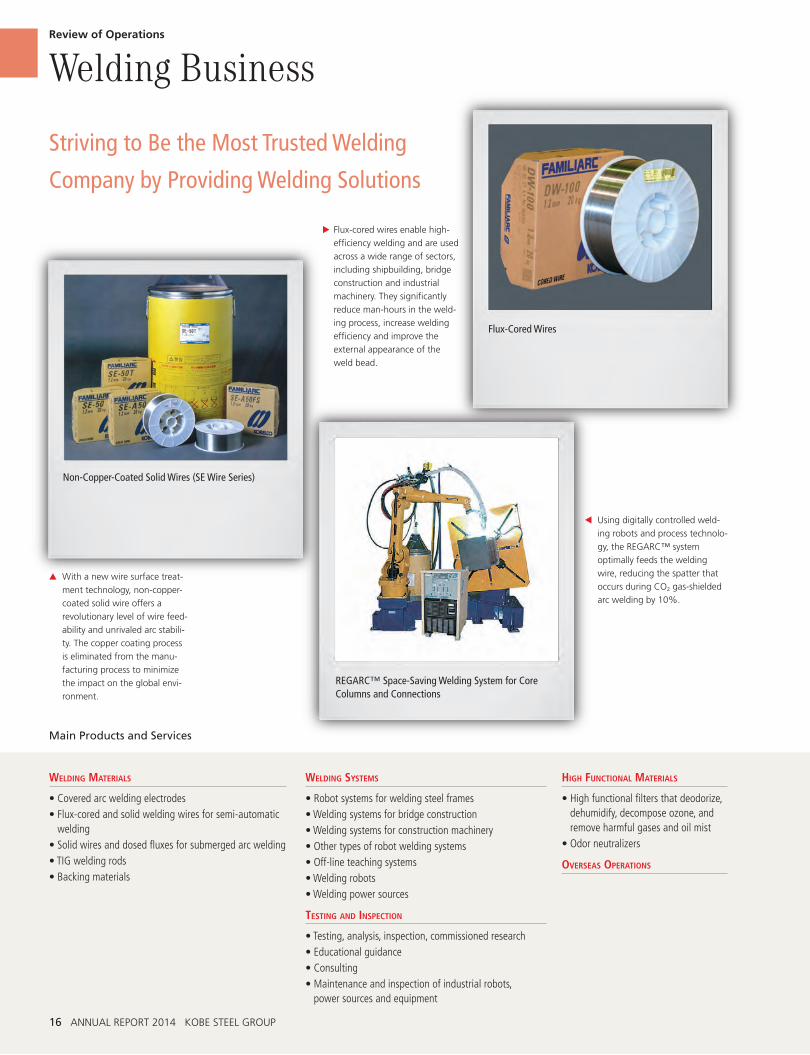
E Flux-cored wires enable high-
efficiency welding and are used
across a wide range of sectors,
including shipbuilding, bridge
construction and industrial
machinery. They significantly
reduce man-hours in the weld-
ing process, increase welding
efficiency and improve the
external appearance of the
weld bead.
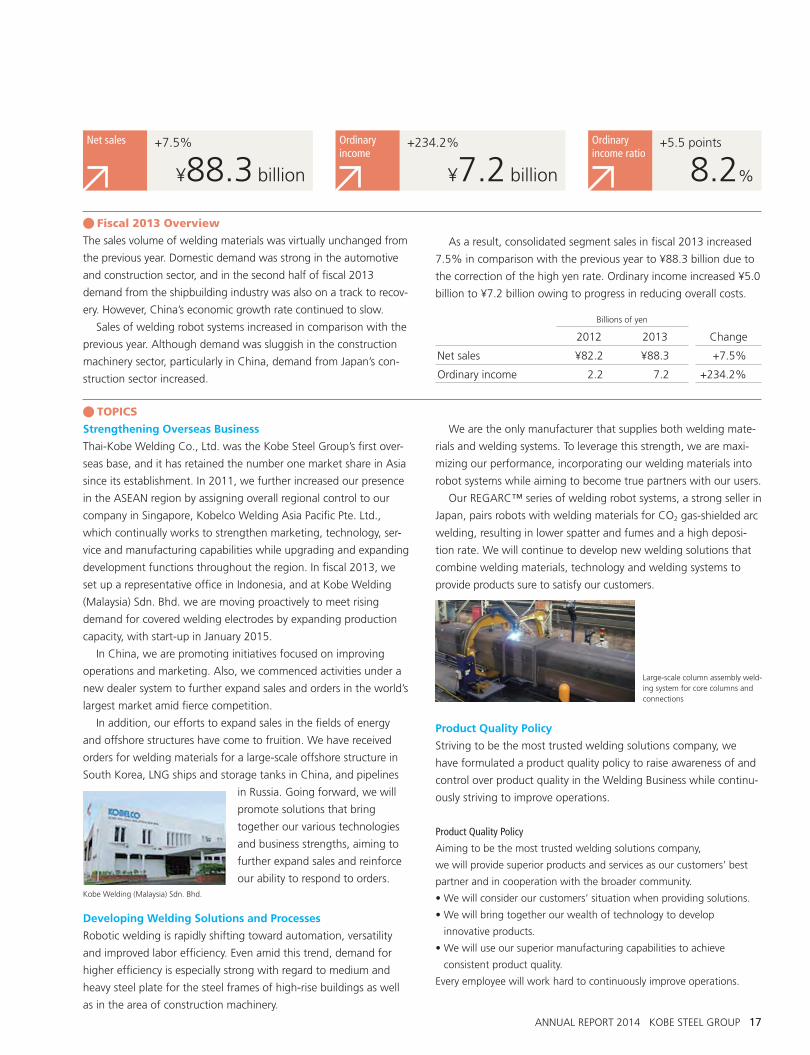
G With a new wire surface treat-
ment technology, non-copper-
coated solid wire offers a
revolutionary level of wire feed-
ability and unrivaled arc stabili-
ty. The copper coating process
is eliminated from the manu-
facturing process to minimize
the impact on the global envi-
ronment.
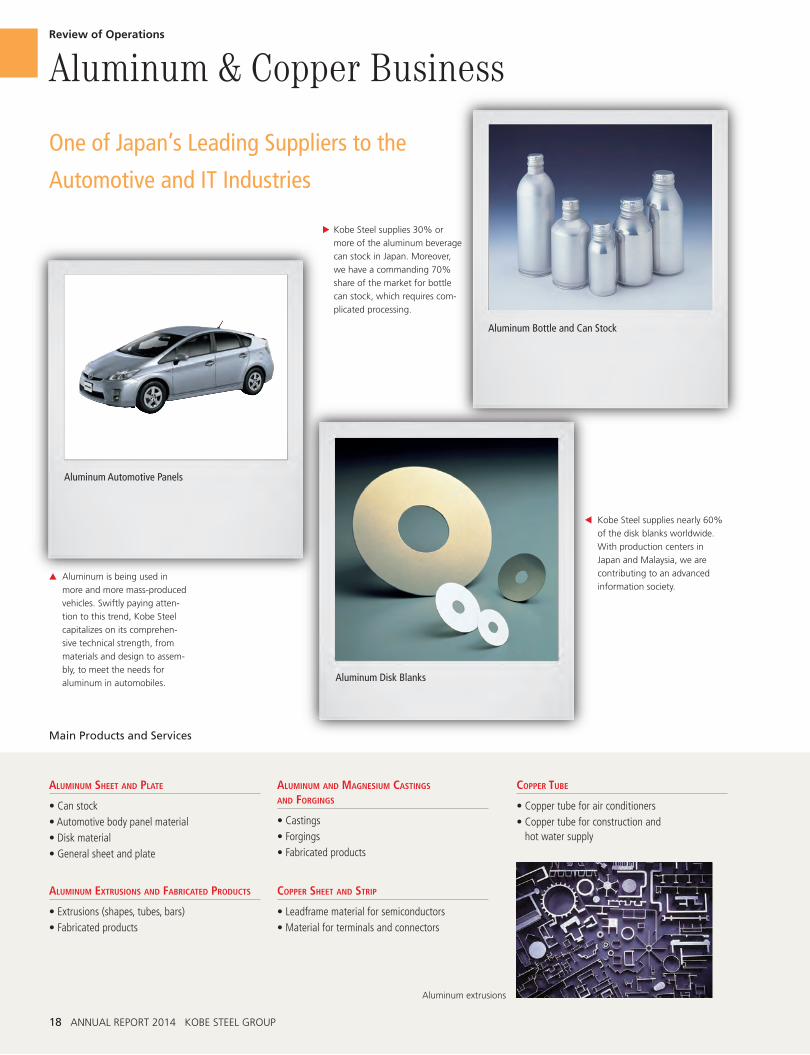
F Using digitally controlled weld-
ing robots and process technolo-
gy, the REGARC™ system
optimally feeds the welding
wire, reducing the spatter that
occurs during CO2 gas-shielded
arc welding by 10%.
Striving to Be the Most Trusted Welding
Company by Providing Welding Solutions
Flux-Cored Wires
Non-Copper-Coated Solid Wires (SE Wire Series)
Welding BusinessReview of Operations
high FuncTional maTerialS
• High functional filters that deodorize, dehumidify, decompose ozone, and remove harmful gases and oil mist
• Odor neutralizers
overSeaS oPeraTionS
welding maTerialS
• Covered arc welding electrodes• Flux-cored and solid welding wires for semi-automatic
welding• Solid wires and dosed fluxes for submerged arc welding• TIG welding rods• Backing materials
welding SySTemS
• Robot systems for welding steel frames• Welding systems for bridge construction• Welding systems for construction machinery• Other types of robot welding systems• Off-line teaching systems• Welding robots• Welding power sources
TeSTing and inSPecTion
• Testing, analysis, inspection, commissioned research• Educational guidance• Consulting• Maintenance and inspection of industrial robots,
power sources and equipment
REGARC™ Space-Saving Welding System for Core Columns and Connections
Main Products and Services
ANNUAL REPORT 2014 KOBE STEEL GROUP 17
Billions of yen
2012 2013 Change
Net sales ¥82.2 ¥88.3 +7.5%
Ordinary income 2.2 7.2 +234.2%
QFiscal 2013 Overview
The sales volume of welding materials was virtually unchanged from
the previous year. Domestic demand was strong in the automotive
and construction sector, and in the second half of fiscal 2013
demand from the shipbuilding industry was also on a track to recov-
ery. However, China’s economic growth rate continued to slow.
Sales of welding robot systems increased in comparison with the
previous year. Although demand was sluggish in the construction
machinery sector, particularly in China, demand from Japan’s con-
struction sector increased.
As a result, consolidated segment sales in fiscal 2013 increased
7.5% in comparison with the previous year to ¥88.3 billion due to
the correction of the high yen rate. Ordinary income increased ¥5.0
billion to ¥7.2 billion owing to progress in reducing overall costs.
+5.5 points
8.2%
Ordinary income ratio
+7.5%
¥88.3 billion
Net sales +234.2%
¥7.2 billion
Ordinary income
QTOPICS
Strengthening Overseas Business
Thai-Kobe Welding Co., Ltd. was the Kobe Steel Group’s first over-
seas base, and it has retained the number one market share in Asia
since its establishment. In 2011, we further increased our presence
in the ASEAN region by assigning overall regional control to our
company in Singapore, Kobelco Welding Asia Pacific Pte. Ltd.,
which continually works to strengthen marketing, technology, ser-
vice and manufacturing capabilities while upgrading and expanding
development functions throughout the region. In fiscal 2013, we
set up a representative office in Indonesia, and at Kobe Welding
(Malaysia) Sdn. Bhd. we are moving proactively to meet rising
demand for covered welding electrodes by expanding production
capacity, with start-up in January 2015.
In China, we are promoting initiatives focused on improving
operations and marketing. Also, we commenced activities under a
new dealer system to further expand sales and orders in the world’s
largest market amid fierce competition.
In addition, our efforts to expand sales in the fields of energy
and offshore structures have come to fruition. We have received
orders for welding materials for a large-scale offshore structure in
South Korea, LNG ships and storage tanks in China, and pipelines
in Russia. Going forward, we will
promote solutions that bring
together our various technologies
and business strengths, aiming to
further expand sales and reinforce
our ability to respond to orders.
Developing Welding Solutions and Processes
Robotic welding is rapidly shifting toward automation, versatility
and improved labor efficiency. Even amid this trend, demand for
higher efficiency is especially strong with regard to medium and
heavy steel plate for the steel frames of high-rise buildings as well
as in the area of construction machinery.
We are the only manufacturer that supplies both welding mate-
rials and welding systems. To leverage this strength, we are maxi-
mizing our performance, incorporating our welding materials into
robot systems while aiming to become true partners with our users.
Our REGARC™ series of welding robot systems, a strong seller in
Japan, pairs robots with welding materials for CO2 gas-shielded arc
welding, resulting in lower spatter and fumes and a high deposi-
tion rate. We will continue to develop new welding solutions that
combine welding materials, technology and welding systems to
provide products sure to satisfy our customers.
Product Quality Policy
Striving to be the most trusted welding solutions company, we
have formulated a product quality policy to raise awareness of and
control over product quality in the Welding Business while continu-
ously striving to improve operations.
Product Quality Policy
Aiming to be the most trusted welding solutions company,
we will provide superior products and services as our customers’ best
partner and in cooperation with the broader community.
• We will consider our customers’ situation when providing solutions.
• We will bring together our wealth of technology to develop
innovative products.
• We will use our superior manufacturing capabilities to achieve
consistent product quality.
Every employee will work hard to continuously improve operations.
Kobe Welding (Malaysia) Sdn. Bhd.
Large-scale column assembly weld-ing system for core columns and connections
18 ANNUAL REPORT 2014 KOBE STEEL GROUP
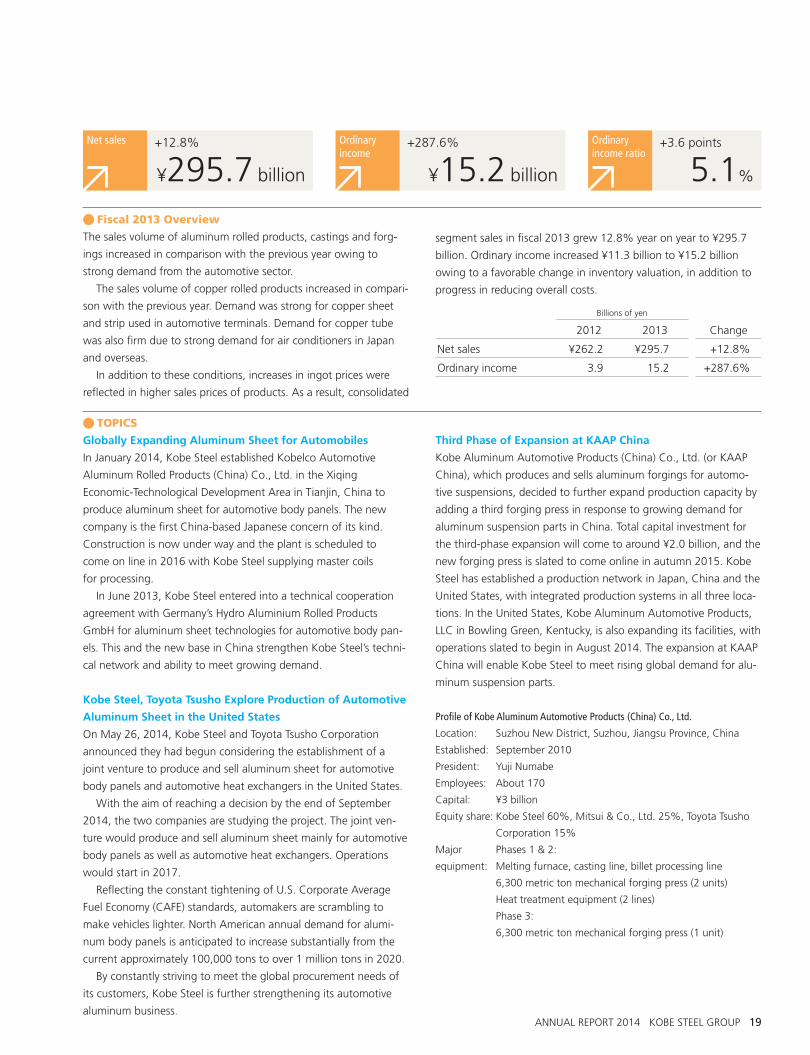
E Kobe Steel supplies 30% or
more of the aluminum beverage
can stock in Japan. Moreover,
we have a commanding 70%
share of the market for bottle
can stock, which requires com-
plicated processing.
G Aluminum is being used in
more and more mass-produced
vehicles. Swiftly paying atten-
tion to this trend, Kobe Steel
capitalizes on its comprehen-
sive technical strength, from
materials and design to assem-
bly, to meet the needs for
aluminum in automobiles.
F Kobe Steel supplies nearly 60%
of the disk blanks worldwide.
With production centers in
Japan and Malaysia, we are
contributing to an advanced
information society.
One of Japan’s Leading Suppliers to the
Automotive and IT Industries
Aluminum Bottle and Can Stock
Aluminum Automotive Panels
Aluminum & Copper BusinessReview of Operations
coPPer Tube
• Copper tube for air conditioners• Copper tube for construction and
hot water supply
aluminum SheeT and PlaTe
• Can stock• Automotive body panel material• Disk material• General sheet and plate
aluminum exTruSionS and FabricaTed ProducTS
• Extrusions (shapes, tubes, bars)• Fabricated products
aluminum and magneSium caSTingS and ForgingS
• Castings• Forgings• Fabricated products
coPPer SheeT and STriP
• Leadframe material for semiconductors• Material for terminals and connectors
Aluminum Disk Blanks
Main Products and Services
Aluminum extrusions
ANNUAL REPORT 2014 KOBE STEEL GROUP 19
Billions of yen
2012 2013 Change
Net sales ¥262.2 ¥295.7 +12.8%
Ordinary income 3.9 15.2 +287.6%
QFiscal 2013 Overview
The sales volume of aluminum rolled products, castings and forg-
ings increased in comparison with the previous year owing to
strong demand from the automotive sector.
The sales volume of copper rolled products increased in compari-
son with the previous year. Demand was strong for copper sheet
and strip used in automotive terminals. Demand for copper tube
was also firm due to strong demand for air conditioners in Japan
and overseas.
In addition to these conditions, increases in ingot prices were
reflected in higher sales prices of products. As a result, consolidated
segment sales in fiscal 2013 grew 12.8% year on year to ¥295.7
billion. Ordinary income increased ¥11.3 billion to ¥15.2 billion
owing to a favorable change in inventory valuation, in addition to
progress in reducing overall costs.
+3.6 points
5.1%
Ordinary income ratio
+12.8%
¥295.7 billion
Net sales +287.6%
¥15.2 billion
Ordinary income
QTOPICS
Globally Expanding Aluminum Sheet for Automobiles
In January 2014, Kobe Steel established Kobelco Automotive
Aluminum Rolled Products (China) Co., Ltd. in the Xiqing
Economic-Technological Development Area in Tianjin, China to
produce aluminum sheet for automotive body panels. The new
company is the first China-based Japanese concern of its kind.
Construction is now under way and the plant is scheduled to
come on line in 2016 with Kobe Steel supplying master coils
for processing.
In June 2013, Kobe Steel entered into a technical cooperation
agreement with Germany’s Hydro Aluminium Rolled Products
GmbH for aluminum sheet technologies for automotive body pan-
els. This and the new base in China strengthen Kobe Steel’s techni-
cal network and ability to meet growing demand.
Kobe Steel, Toyota Tsusho Explore Production of Automotive
Aluminum Sheet in the United States
On May 26, 2014, Kobe Steel and Toyota Tsusho Corporation
announced they had begun considering the establishment of a
joint venture to produce and sell aluminum sheet for automotive
body panels and automotive heat exchangers in the United States.
With the aim of reaching a decision by the end of September
2014, the two companies are studying the project. The joint ven-
ture would produce and sell aluminum sheet mainly for automotive
body panels as well as automotive heat exchangers. Operations
would start in 2017.
Reflecting the constant tightening of U.S. Corporate Average
Fuel Economy (CAFE) standards, automakers are scrambling to
make vehicles lighter. North American annual demand for alumi-
num body panels is anticipated to increase substantially from the
current approximately 100,000 tons to over 1 million tons in 2020.
By constantly striving to meet the global procurement needs of
its customers, Kobe Steel is further strengthening its automotive
aluminum business.
Third Phase of Expansion at KAAP China
Kobe Aluminum Automotive Products (China) Co., Ltd. (or KAAP
China), which produces and sells aluminum forgings for automo-
tive suspensions, decided to further expand production capacity by
adding a third forging press in response to growing demand for
aluminum suspension parts in China. Total capital investment for
the third-phase expansion will come to around ¥2.0 billion, and the
new forging press is slated to come online in autumn 2015. Kobe
Steel has established a production network in Japan, China and the
United States, with integrated production systems in all three loca-
tions. In the United States, Kobe Aluminum Automotive Products,
LLC in Bowling Green, Kentucky, is also expanding its facilities, with
operations slated to begin in August 2014. The expansion at KAAP
China will enable Kobe Steel to meet rising global demand for alu-
minum suspension parts.
Profile of Kobe Aluminum Automotive Products (China) Co., Ltd.
Location: Suzhou New District, Suzhou, Jiangsu Province, China
Established: September 2010
President: Yuji Numabe
Employees: About 170
Capital: ¥3 billion
Equity share: Kobe Steel 60%, Mitsui & Co., Ltd. 25%, Toyota Tsusho
Corporation 15%
Major Phases 1 & 2:
equipment: Melting furnace, casting line, billet processing line
6,300 metric ton mechanical forging press (2 units)
Heat treatment equipment (2 lines)
Phase 3:
6,300 metric ton mechanical forging press (1 unit)
20 ANNUAL REPORT 2014 KOBE STEEL GROUP
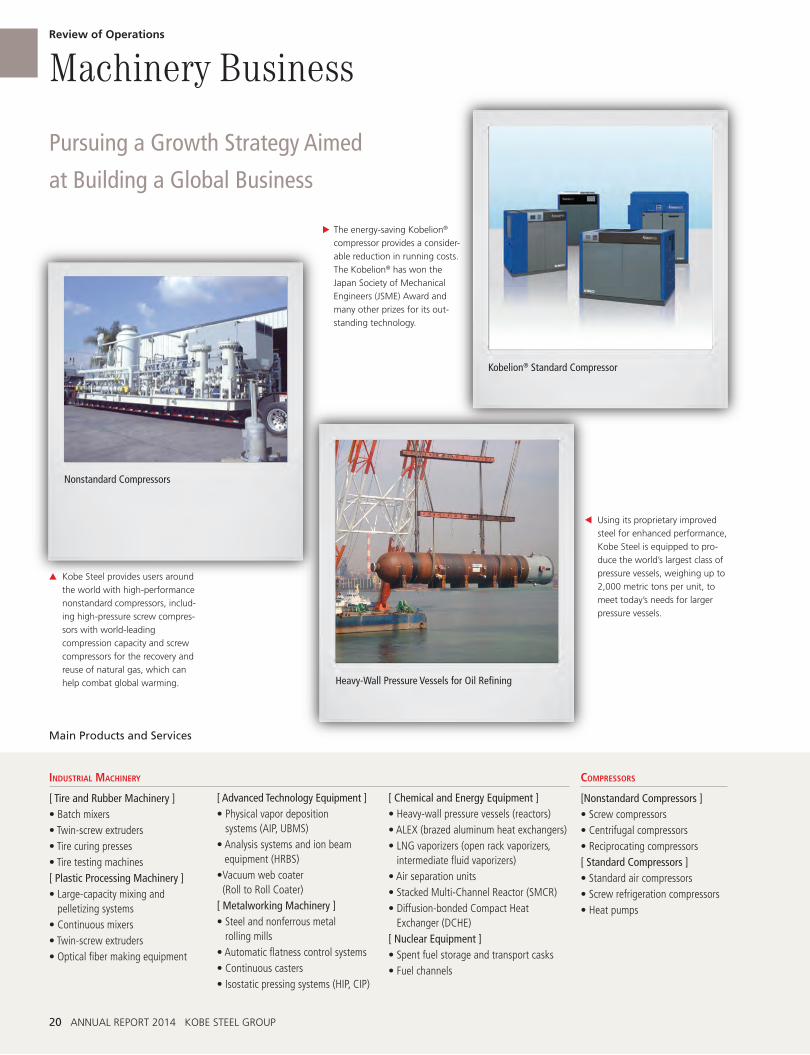
E The energy-saving Kobelion®
compressor provides a consider-
able reduction in running costs.
The Kobelion® has won the
Japan Society of Mechanical
Engineers (JSME) Award and
many other prizes for its out-
standing technology.
G Kobe Steel provides users around
the world with high-performance
nonstandard compressors, includ-
ing high-pressure screw compres-
sors with world-leading
compression capacity and screw
compressors for the recovery and
reuse of natural gas, which can
help combat global warming.
F Using its proprietary improved
steel for enhanced performance,
Kobe Steel is equipped to pro-
duce the world’s largest class of
pressure vessels, weighing up to
2,000 metric tons per unit, to
meet today’s needs for larger
pressure vessels.
Pursuing a Growth Strategy Aimed
at Building a Global Business
Kobelion® Standard Compressor
Nonstandard Compressors
Machinery BusinessReview of Operations
[ Chemical and Energy Equipment ]• Heavy-wall pressure vessels (reactors)• ALEX (brazed aluminum heat exchangers)• LNG vaporizers (open rack vaporizers,
intermediate fluid vaporizers)• Air separation units• Stacked Multi-Channel Reactor (SMCR)• Diffusion-bonded Compact Heat
Exchanger (DCHE)[ Nuclear Equipment ]• Spent fuel storage and transport casks• Fuel channels
comPreSSorS
[Nonstandard Compressors ]• Screw compressors• Centrifugal compressors• Reciprocating compressors[ Standard Compressors ]• Standard air compressors• Screw refrigeration compressors• Heat pumps
induSTrial machinery
[ Tire and Rubber Machinery ]• Batch mixers• Twin-screw extruders• Tire curing presses• Tire testing machines[ Plastic Processing Machinery ]• Large-capacity mixing and
pelletizing systems• Continuous mixers• Twin-screw extruders• Optical fiber making equipment
[ Advanced Technology Equipment ]• Physical vapor deposition
systems (AIP, UBMS)• Analysis systems and ion beam
equipment (HRBS)• Vacuum web coater
(Roll to Roll Coater)[ Metalworking Machinery ]• Steel and nonferrous metal
rolling mills• Automatic flatness control systems• Continuous casters• Isostatic pressing systems (HIP, CIP)
Heavy-Wall Pressure Vessels for Oil Refining
Main Products and Services
ANNUAL REPORT 2014 KOBE STEEL GROUP 21
Billions of yen
2012 2013 Change
Net sales ¥167.1 ¥149.8 -10.4%
Ordinary income 12.0 6.5 -46.1%
QFiscal 2013 Overview
Amid robust energy demand, particularly overseas, demand for
compressors used in the oil refining and petrochemical industries
continued to be strong. As a result, consolidated orders in fiscal
2013 increased 39.6% in comparison with the previous year to
¥152.8 billion. The backlog of orders at the end of the fiscal year
(ended March 31, 2014) stood at ¥122.2 billion.
However, consolidated segment sales in fiscal 2013 decreased
10.4% year on year to ¥149.8 billion due to the concentration of
sales of plastic processing machinery and other large-ticket items in
the previous fiscal year. Ordinary income decreased ¥5.5 billion to
¥6.5 billion.
-2.9 points
4.3%
Ordinary income ratio
-10.4%
¥149.8 billion
Net sales -46.1%
¥6.5 billion
Ordinary income
QTOPICS
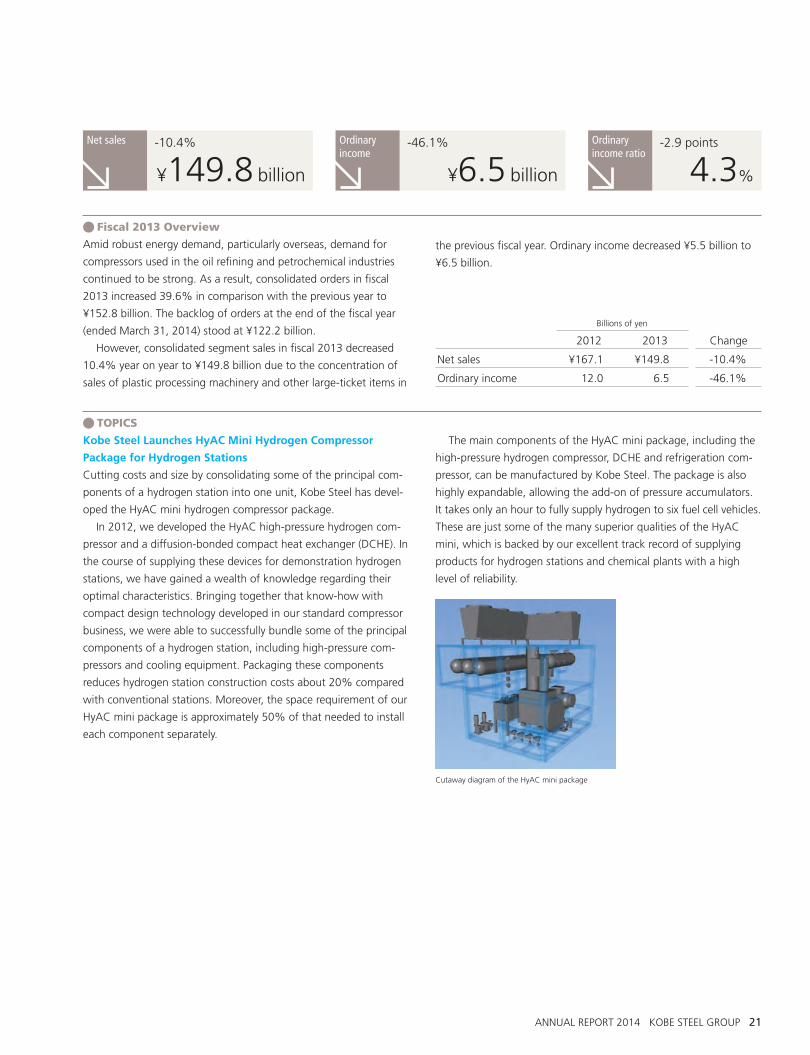
Kobe Steel Launches HyAC Mini Hydrogen Compressor
Package for Hydrogen Stations
Cutting costs and size by consolidating some of the principal com-
ponents of a hydrogen station into one unit, Kobe Steel has devel-
oped the HyAC mini hydrogen compressor package.
In 2012, we developed the HyAC high-pressure hydrogen com-
pressor and a diffusion-bonded compact heat exchanger (DCHE). In
the course of supplying these devices for demonstration hydrogen
stations, we have gained a wealth of knowledge regarding their
optimal characteristics. Bringing together that know-how with
compact design technology developed in our standard compressor
business, we were able to successfully bundle some of the principal
components of a hydrogen station, including high-pressure com-
pressors and cooling equipment. Packaging these components
reduces hydrogen station construction costs about 20% compared
with conventional stations. Moreover, the space requirement of our
HyAC mini package is approximately 50% of that needed to install
each component separately.
The main components of the HyAC mini package, including the
high-pressure hydrogen compressor, DCHE and refrigeration com-
pressor, can be manufactured by Kobe Steel. The package is also
highly expandable, allowing the add-on of pressure accumulators.
It takes only an hour to fully supply hydrogen to six fuel cell vehicles.
These are just some of the many superior qualities of the HyAC
mini, which is backed by our excellent track record of supplying
products for hydrogen stations and chemical plants with a high
level of reliability.
Cutaway diagram of the HyAC mini package
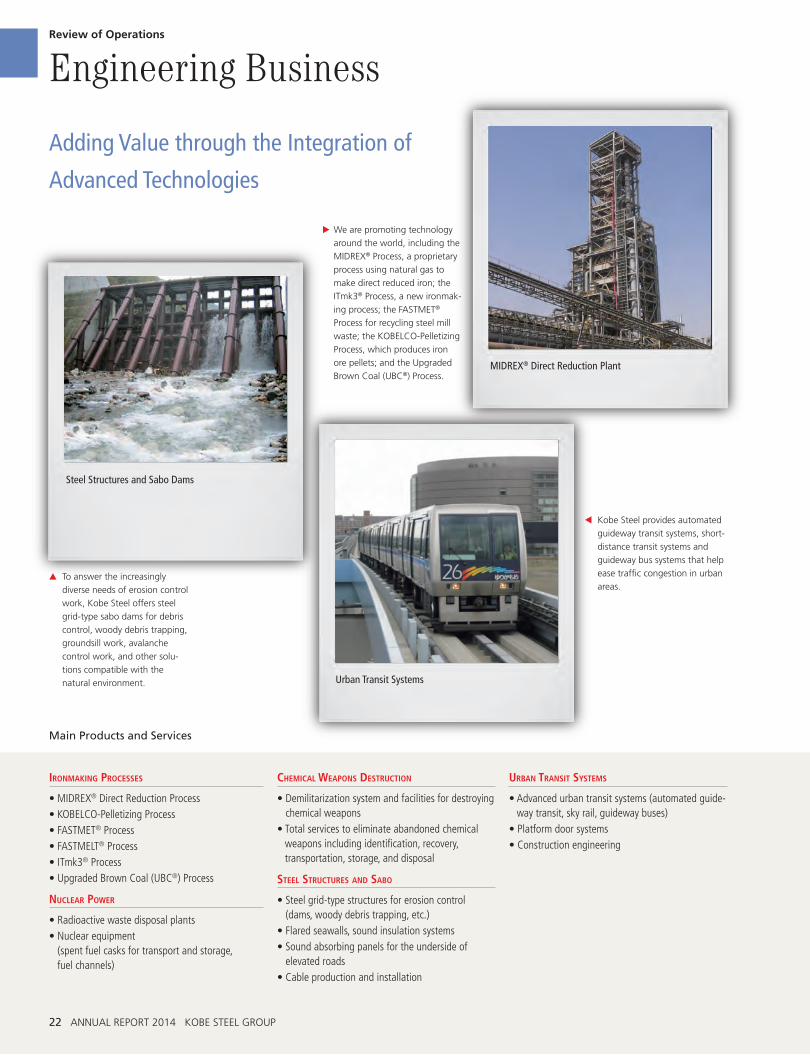
MIDREX® Direct Reduction Plant
urban TranSiT SySTemS
• Advanced urban transit systems (automated guide-way transit, sky rail, guideway buses)
• Platform door systems• Construction engineering
ironmaking ProceSSeS
• MIDREX® Direct Reduction Process• KOBELCO-Pelletizing Process• FASTMET® Process• FASTMELT® Process• ITmk3® Process• Upgraded Brown Coal (UBC®) Process
nuclear Power
• Radioactive waste disposal plants• Nuclear equipment
(spent fuel casks for transport and storage, fuel channels)
chemical weaPonS deSTrucTion
• Demilitarization system and facilities for destroying chemical weapons
• Total services to eliminate abandoned chemical weapons including identification, recovery, transportation, storage, and disposal
STeel STrucTureS and Sabo
• Steel grid-type structures for erosion control (dams, woody debris trapping, etc.)
• Flared seawalls, sound insulation systems• Sound absorbing panels for the underside of
elevated roads• Cable production and installation
22 ANNUAL REPORT 2014 KOBE STEEL GROUP
E We are promoting technology
around the world, including the
MIDREX® Process, a proprietary
process using natural gas to
make direct reduced iron; the
ITmk3® Process, a new ironmak-
ing process; the FASTMET®
Process for recycling steel mill
waste; the KOBELCO-Pelletizing
Process, which produces iron
ore pellets; and the Upgraded
Brown Coal (UBC®) Process.
G To answer the increasingly
diverse needs of erosion control
work, Kobe Steel offers steel
grid-type sabo dams for debris
control, woody debris trapping,
groundsill work, avalanche
control work, and other solu-
tions compatible with the
natural environment.
F Kobe Steel provides automated
guideway transit systems, short-
distance transit systems and
guideway bus systems that help
ease traffic congestion in urban
areas.
Adding Value through the Integration of
Advanced Technologies
Steel Structures and Sabo Dams
Engineering BusinessReview of Operations
Urban Transit Systems
Main Products and Services
ANNUAL REPORT 2014 KOBE STEEL GROUP 23
Billions of yen
2012 2013 Change
Net sales ¥46.5 ¥39.1 -15.9%
Ordinary loss (1.3) (3.9) ---
QFiscal 2013 Overview
Consolidated orders in fiscal 2013 increased 48.3% in comparison
with the previous year to ¥49.8 billion owing to an uptick in orders
from the nuclear power industry in Japan and for large direct
reduction plants in North America and Russia. The backlog of
orders at the end of fiscal 2013 came to ¥83.4 billion.
Consolidated segment sales in fiscal 2013 decreased 15.9% in
comparison with the previous year to ¥39.1 billion due to the
ongoing construction of the large direct reduction plants. Ordinary
loss was up ¥2.6 billion to ¥3.9 billion.
-15.9%
¥39.1 billion
Net sales -¥2.6 billion
-¥3.9 billion
Ordinary loss
QTOPICS
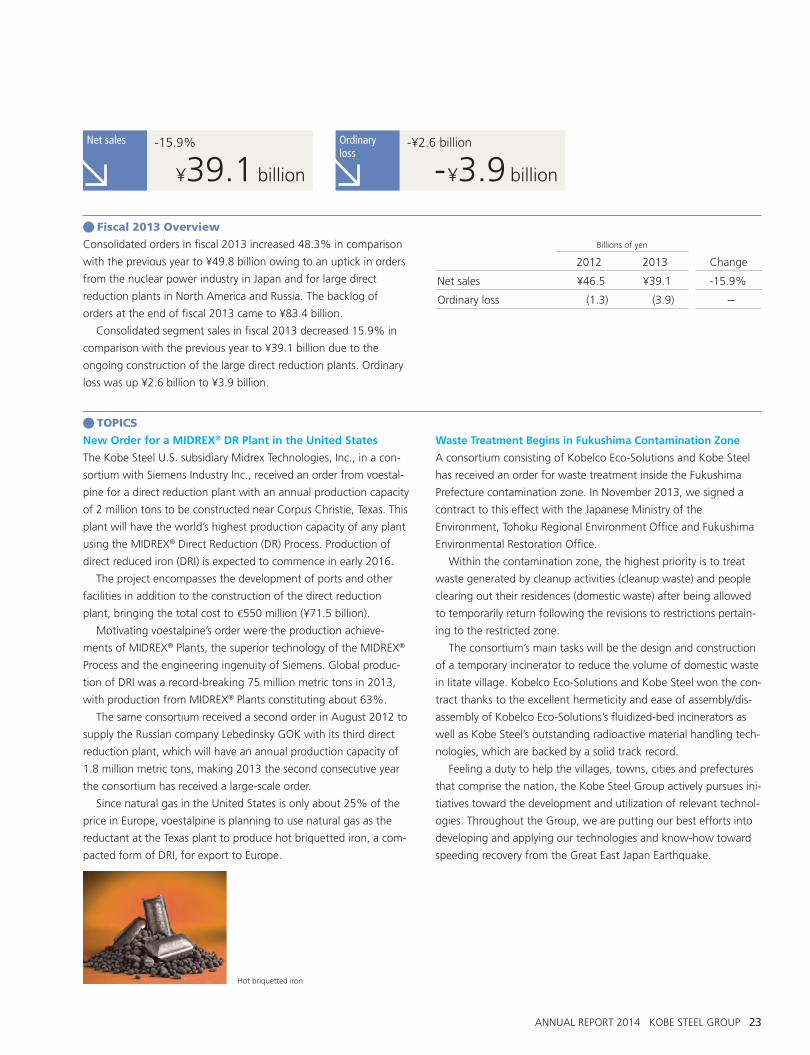
New Order for a MIDREX® DR Plant in the United States
The Kobe Steel U.S. subsidiary Midrex Technologies, Inc., in a con-
sortium with Siemens Industry Inc., received an order from voestal-
pine for a direct reduction plant with an annual production capacity
of 2 million tons to be constructed near Corpus Christie, Texas. This
plant will have the world’s highest production capacity of any plant
using the MIDREX® Direct Reduction (DR) Process. Production of
direct reduced iron (DRI) is expected to commence in early 2016.
The project encompasses the development of ports and other
facilities in addition to the construction of the direct reduction
plant, bringing the total cost to 550 million (¥71.5 billion).
Motivating voestalpine’s order were the production achieve-
ments of MIDREX® Plants, the superior technology of the MIDREX®
Process and the engineering ingenuity of Siemens. Global produc-
tion of DRI was a record-breaking 75 million metric tons in 2013,
with production from MIDREX® Plants constituting about 63%.
The same consortium received a second order in August 2012 to
supply the Russian company Lebedinsky GOK with its third direct
reduction plant, which will have an annual production capacity of
1.8 million metric tons, making 2013 the second consecutive year
the consortium has received a large-scale order.
Since natural gas in the United States is only about 25% of the
price in Europe, voestalpine is planning to use natural gas as the
reductant at the Texas plant to produce hot briquetted iron, a com-
pacted form of DRI, for export to Europe.
Waste Treatment Begins in Fukushima Contamination Zone
A consortium consisting of Kobelco Eco-Solutions and Kobe Steel
has received an order for waste treatment inside the Fukushima
Prefecture contamination zone. In November 2013, we signed a
contract to this effect with the Japanese Ministry of the
Environment, Tohoku Regional Environment Office and Fukushima
Environmental Restoration Office.
Within the contamination zone, the highest priority is to treat
waste generated by cleanup activities (cleanup waste) and people
clearing out their residences (domestic waste) after being allowed
to temporarily return following the revisions to restrictions pertain-
ing to the restricted zone.
The consortium’s main tasks will be the design and construction
of a temporary incinerator to reduce the volume of domestic waste
in Iitate village. Kobelco Eco-Solutions and Kobe Steel won the con-
tract thanks to the excellent hermeticity and ease of assembly/dis-
assembly of Kobelco Eco-Solutions’s fluidized-bed incinerators as
well as Kobe Steel’s outstanding radioactive material handling tech-
nologies, which are backed by a solid track record.
Feeling a duty to help the villages, towns, cities and prefectures
that comprise the nation, the Kobe Steel Group actively pursues ini-
tiatives toward the development and utilization of relevant technol-
ogies. Throughout the Group, we are putting our best efforts into
developing and applying our technologies and know-how toward
speeding recovery from the Great East Japan Earthquake.
Hot briquetted iron
24 ANNUAL REPORT 2014 KOBE STEEL GROUP
Water Treatment Facilities
environmenTal analySiS
• Water and sewage quality inspection• Water quality testing at factories and research
centers• Measurement of industrial wastes
(PCB, metals, organic matter, etc.)
waTer TreaTmenT
• City water, sewage and industrial water treatment plants and equipment, ultrapure and pure water production equipment, industrial water processing and wastewater treatment systems
• Recycling systems for sewage sludge, foodstuffs, and other organic waste
cooling TowerS
• Industrial cooling towers• Cooling towers for district heating and cooling• Super-low-noise cooling towers
waSTe TreaTmenT and recycling
• Municipal waste incineration and melting plants (fluidized-bed gasification and melting furnace, stoker-type incinerator, fluidized-bed incineration furnace, plasma melting furnace)
• Bulky waste and other recycling facilities• PCB waste treatment plant
ProceSS equiPmenT
• Glass-lined equipment• Polymerizers and reactors• Separation and refinement equipment• Powder equipment• High-purity hydrogen oxygen generators
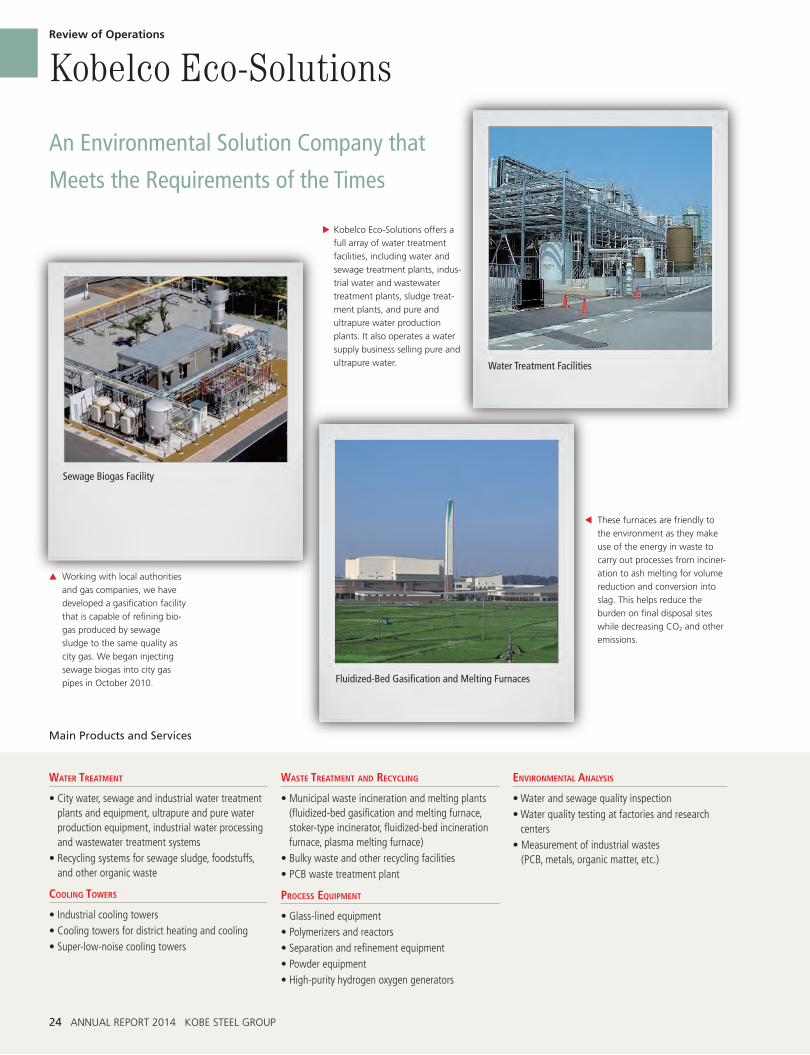
E Kobelco Eco-Solutions offers a
full array of water treatment
facilities, including water and
sewage treatment plants, indus-
trial water and wastewater
treatment plants, sludge treat-
ment plants, and pure and
ultrapure water production
plants. It also operates a water
supply business selling pure and
ultrapure water.
G Working with local authorities
and gas companies, we have
developed a gasification facility
that is capable of refining bio-
gas produced by sewage
sludge to the same quality as
city gas. We began injecting
sewage biogas into city gas
pipes in October 2010.
F These furnaces are friendly to
the environment as they make
use of the energy in waste to
carry out processes from inciner-
ation to ash melting for volume
reduction and conversion into
slag. This helps reduce the
burden on final disposal sites
while decreasing CO2 and other
emissions.
An Environmental Solution Company that
Meets the Requirements of the Times
Sewage Biogas Facility
Kobelco Eco-SolutionsReview of Operations
Fluidized-Bed Gasification and Melting Furnaces
Main Products and Services
ANNUAL REPORT 2014 KOBE STEEL GROUP 25
Billions of yen
2012 2013 Change
Net sales ¥72.7 ¥68.2 -6.2%
Ordinary income 3.9 2.6 -33.5%
QFiscal 2013 Overview
Despite receiving the order for the Sennan Clean Center from
Miyagi Prefecture’s Sennan Regional Administrative Association,
consolidated orders in fiscal 2013 were down 2.3% in comparison
with the previous year, which saw similar orders for large projects,
to ¥71.9 billion. The order backlog at the end of fiscal 2013 stood
at ¥47.2 billion.
Consolidated segment sales in fiscal 2013 were down 6.2% year
on year to ¥68.2 billion. Although sales increased due to the com-
pletion of existing large orders in the waste treatment business,
sales decreased in the water treatment business and the chemical
and food equipment business. Ordinary income fell ¥1.3 billion
from the previous year to ¥2.6 billion due to a change in the types
of projects undertaken.
-1.6 points
3.8%
Ordinary income ratio
-6.2%
¥68.2 billion
Net sales -33.5%
¥2.6 billion
Ordinary income
QTOPICS
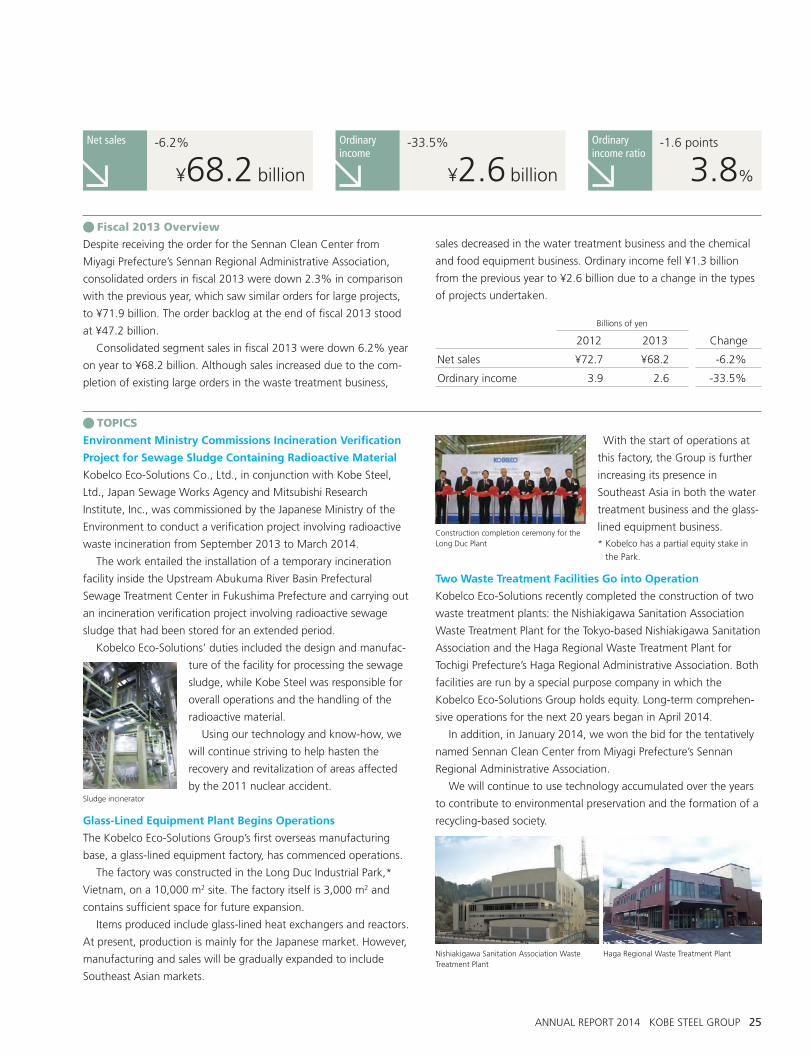
Environment Ministry Commissions Incineration Verification
Project for Sewage Sludge Containing Radioactive Material
Kobelco Eco-Solutions Co., Ltd., in conjunction with Kobe Steel,
Ltd., Japan Sewage Works Agency and Mitsubishi Research
Institute, Inc., was commissioned by the Japanese Ministry of the
Environment to conduct a verification project involving radioactive
waste incineration from September 2013 to March 2014.
The work entailed the installation of a temporary incineration
facility inside the Upstream Abukuma River Basin Prefectural
Sewage Treatment Center in Fukushima Prefecture and carrying out
an incineration verification project involving radioactive sewage
sludge that had been stored for an extended period.
Kobelco Eco-Solutions’ duties included the design and manufac-
ture of the facility for processing the sewage
sludge, while Kobe Steel was responsible for
overall operations and the handling of the
radioactive material.
Using our technology and know-how, we
will continue striving to help hasten the
recovery and revitalization of areas affected
by the 2011 nuclear accident.
Glass-Lined Equipment Plant Begins Operations
The Kobelco Eco-Solutions Group’s first overseas manufacturing
base, a glass-lined equipment factory, has commenced operations.
The factory was constructed in the Long Duc Industrial Park,*
Vietnam, on a 10,000 m2 site. The factory itself is 3,000 m2 and
contains sufficient space for future expansion.
Items produced include glass-lined heat exchangers and reactors.
At present, production is mainly for the Japanese market. However,
manufacturing and sales will be gradually expanded to include
Southeast Asian markets.
With the start of operations at
this factory, the Group is further
increasing its presence in
Southeast Asia in both the water
treatment business and the glass-
lined equipment business.
* Kobelco has a partial equity stake in
the Park.
Two Waste Treatment Facilities Go into Operation
Kobelco Eco-Solutions recently completed the construction of two
waste treatment plants: the Nishiakigawa Sanitation Association
Waste Treatment Plant for the Tokyo-based Nishiakigawa Sanitation
Association and the Haga Regional Waste Treatment Plant for
Tochigi Prefecture’s Haga Regional Administrative Association. Both
facilities are run by a special purpose company in which the
Kobelco Eco-Solutions Group holds equity. Long-term comprehen-
sive operations for the next 20 years began in April 2014.
In addition, in January 2014, we won the bid for the tentatively
named Sennan Clean Center from Miyagi Prefecture’s Sennan
Regional Administrative Association.
We will continue to use technology accumulated over the years
to contribute to environmental preservation and the formation of a
recycling-based society.
Sludge incinerator
Nishiakigawa Sanitation Association Waste Treatment Plant
Haga Regional Waste Treatment Plant
Construction completion ceremony for the Long Duc Plant
26 ANNUAL REPORT 2014 KOBE STEEL GROUP
Environmental Recycling Machines
conSTrucTion machinery
• Hydraulic excavators• Mini excavators• Wheel loaders• Mini wheel loaders
environmenTal recycling machinery
[Construction Recycling]• Building demolition machines[Metal Recycling]• Automobile dismantling machines• Magnet machines• Scrap loader machines, etc.[Resource Recycling]• Resource handling machines, etc.[Forestry Machinery]• Processor machines• Harvesters• Grapple machines
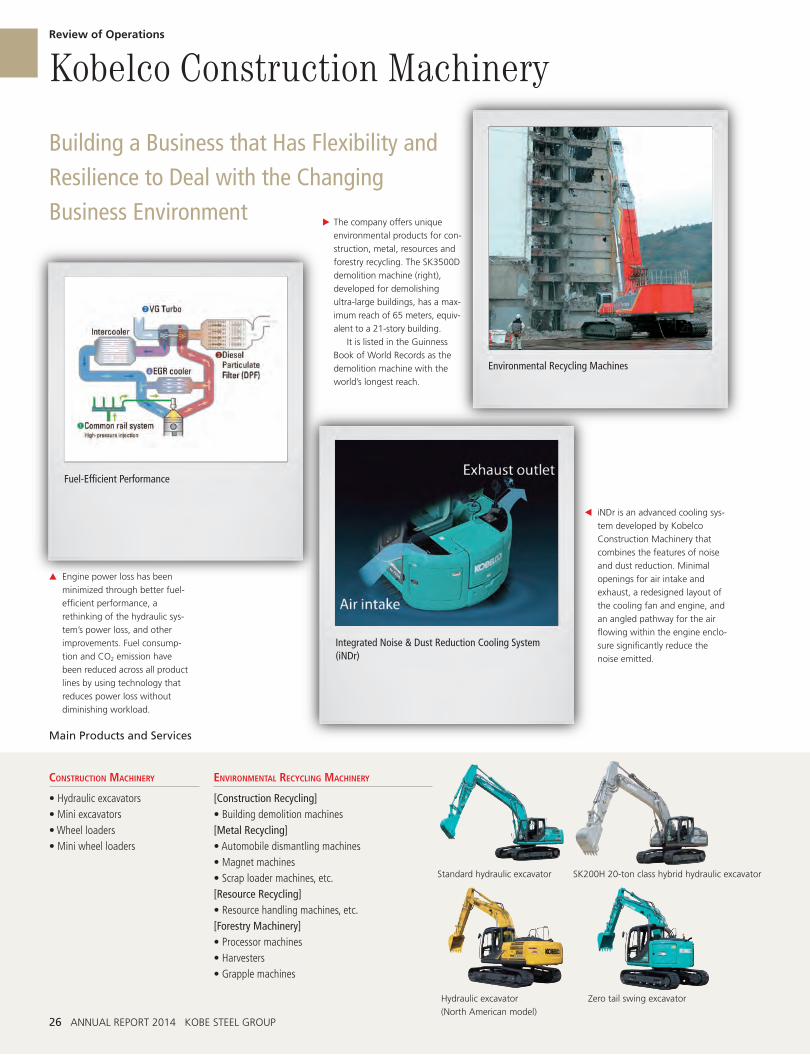
E The company offers unique
environmental products for con-
struction, metal, resources and
forestry recycling. The SK3500D
demolition machine (right),
developed for demolishing
ultra-large buildings, has a max-
imum reach of 65 meters, equiv-
alent to a 21-story building.
It is listed in the Guinness
Book of World Records as the
demolition machine with the
world’s longest reach.
G Engine power loss has been
minimized through better fuel-
efficient performance, a
rethinking of the hydraulic sys-
tem’s power loss, and other
improvements. Fuel consump-
tion and CO2 emission have
been reduced across all product
lines by using technology that
reduces power loss without
diminishing workload.
F iNDr is an advanced cooling sys-
tem developed by Kobelco
Construction Machinery that
combines the features of noise
and dust reduction. Minimal
openings for air intake and
exhaust, a redesigned layout of
the cooling fan and engine, and
an angled pathway for the air
flowing within the engine enclo-
sure significantly reduce the
noise emitted.
Building a Business that Has Flexibility and Resilience to Deal with the Changing Business Environment
Fuel-Efficient Performance
Kobelco Construction MachineryReview of Operations
Integrated Noise & Dust Reduction Cooling System (iNDr)
Main Products and Services
Standard hydraulic excavator
Hydraulic excavator
(North American model)
SK200H 20-ton class hybrid hydraulic excavator
Zero tail swing excavator
ANNUAL REPORT 2014 KOBE STEEL GROUP 27
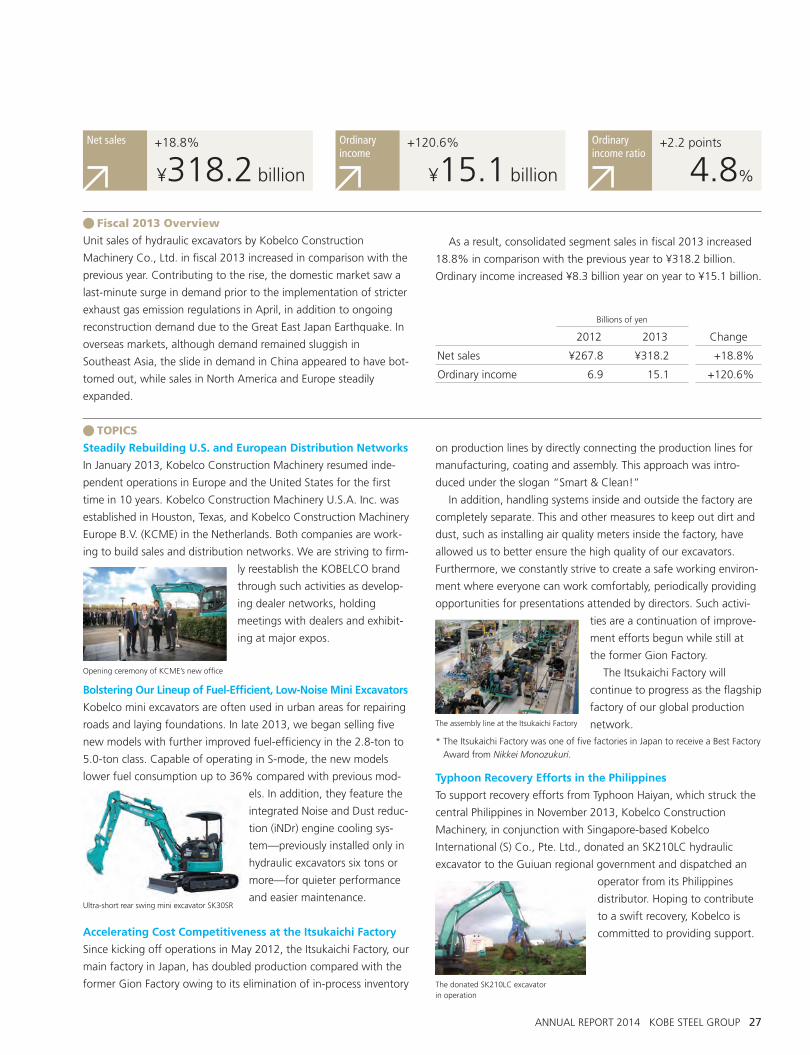
Billions of yen
2012 2013 Change
Net sales ¥267.8 ¥318.2 +18.8%
Ordinary income 6.9 15.1 +120.6%
QFiscal 2013 Overview
Unit sales of hydraulic excavators by Kobelco Construction
Machinery Co., Ltd. in fiscal 2013 increased in comparison with the
previous year. Contributing to the rise, the domestic market saw a
last-minute surge in demand prior to the implementation of stricter
exhaust gas emission regulations in April, in addition to ongoing
reconstruction demand due to the Great East Japan Earthquake. In
overseas markets, although demand remained sluggish in
Southeast Asia, the slide in demand in China appeared to have bot-
tomed out, while sales in North America and Europe steadily
expanded.
As a result, consolidated segment sales in fiscal 2013 increased
18.8% in comparison with the previous year to ¥318.2 billion.
Ordinary income increased ¥8.3 billion year on year to ¥15.1 billion.
Ordinary income ratio
+18.8%
¥318.2 billion
Net sales +120.6%
¥15.1 billion
Ordinary income
QTOPICS
Steadily Rebuilding U.S. and European Distribution Networks
In January 2013, Kobelco Construction Machinery resumed inde-
pendent operations in Europe and the United States for the first
time in 10 years. Kobelco Construction Machinery U.S.A. Inc. was
established in Houston, Texas, and Kobelco Construction Machinery
Europe B.V. (KCME) in the Netherlands. Both companies are work-
ing to build sales and distribution networks. We are striving to firm-
ly reestablish the KOBELCO brand
through such activities as develop-
ing dealer networks, holding
meetings with dealers and exhibit-
ing at major expos.
Bolstering Our Lineup of Fuel-Efficient, Low-Noise Mini Excavators
Kobelco mini excavators are often used in urban areas for repairing
roads and laying foundations. In late 2013, we began selling five
new models with further improved fuel-efficiency in the 2.8-ton to
5.0-ton class. Capable of operating in S-mode, the new models
lower fuel consumption up to 36% compared with previous mod-
els. In addition, they feature the
integrated Noise and Dust reduc-
tion (iNDr) engine cooling sys-
tem—previously installed only in
hydraulic excavators six tons or
more—for quieter performance
and easier maintenance.
Accelerating Cost Competitiveness at the Itsukaichi Factory
Since kicking off operations in May 2012, the Itsukaichi Factory, our
main factory in Japan, has doubled production compared with the
former Gion Factory owing to its elimination of in-process inventory
on production lines by directly connecting the production lines for
manufacturing, coating and assembly. This approach was intro-
duced under the slogan “Smart & Clean!”
In addition, handling systems inside and outside the factory are
completely separate. This and other measures to keep out dirt and
dust, such as installing air quality meters inside the factory, have
allowed us to better ensure the high quality of our excavators.
Furthermore, we constantly strive to create a safe working environ-
ment where everyone can work comfortably, periodically providing
opportunities for presentations attended by directors. Such activi-
ties are a continuation of improve-
ment efforts begun while still at
the former Gion Factory.
The Itsukaichi Factory will
continue to progress as the flagship
factory of our global production
network.
* The Itsukaichi Factory was one of five factories in Japan to receive a Best Factory
Award from Nikkei Monozukuri.
Typhoon Recovery Efforts in the Philippines
To support recovery efforts from Typhoon Haiyan, which struck the
central Philippines in November 2013, Kobelco Construction
Machinery, in conjunction with Singapore-based Kobelco
International (S) Co., Pte. Ltd., donated an SK210LC hydraulic
excavator to the Guiuan regional government and dispatched an
operator from its Philippines
distributor. Hoping to contribute
to a swift recovery, Kobelco is
committed to providing support.
Opening ceremony of KCME’s new office
The assembly line at the Itsukaichi Factory
The donated SK210LC excavator in operation
+2.2 points
4.8%
Ultra-short rear swing mini excavator SK30SR
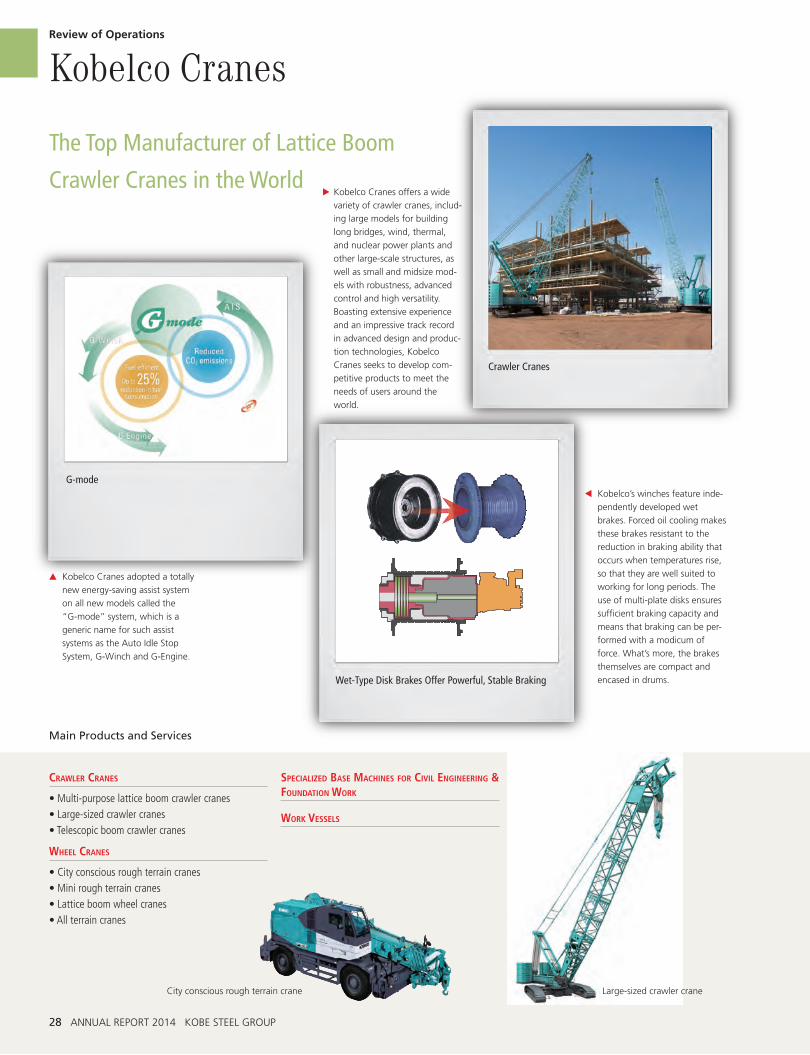
28 ANNUAL REPORT 2014 KOBE STEEL GROUP
Crawler Cranes
crawler craneS
• Multi-purpose lattice boom crawler cranes• Large-sized crawler cranes• Telescopic boom crawler cranes
wheel craneS
• City conscious rough terrain cranes• Mini rough terrain cranes• Lattice boom wheel cranes• All terrain cranes
SPecialized baSe machineS For civil engineering & FoundaTion work
work veSSelS
E Kobelco Cranes offers a wide
variety of crawler cranes, includ-
ing large models for building
long bridges, wind, thermal,
and nuclear power plants and
other large-scale structures, as
well as small and midsize mod-
els with robustness, advanced
control and high versatility.
Boasting extensive experience
and an impressive track record
in advanced design and produc-
tion technologies, Kobelco
Cranes seeks to develop com-
petitive products to meet the
needs of users around the
world.
G Kobelco Cranes adopted a totally
new energy-saving assist system
on all new models called the
“G-mode” system, which is a
generic name for such assist
systems as the Auto Idle Stop
System, G-Winch and G-Engine.
F Kobelco’s winches feature inde-
pendently developed wet
brakes. Forced oil cooling makes
these brakes resistant to the
reduction in braking ability that
occurs when temperatures rise,
so that they are well suited to
working for long periods. The
use of multi-plate disks ensures
sufficient braking capacity and
means that braking can be per-
formed with a modicum of
force. What’s more, the brakes
themselves are compact and
encased in drums.
The Top Manufacturer of Lattice Boom
Crawler Cranes in the World
G-mode
Kobelco CranesReview of Operations
Wet-Type Disk Brakes Offer Powerful, Stable Braking
Main Products and Services
City conscious rough terrain crane Large-sized crawler crane
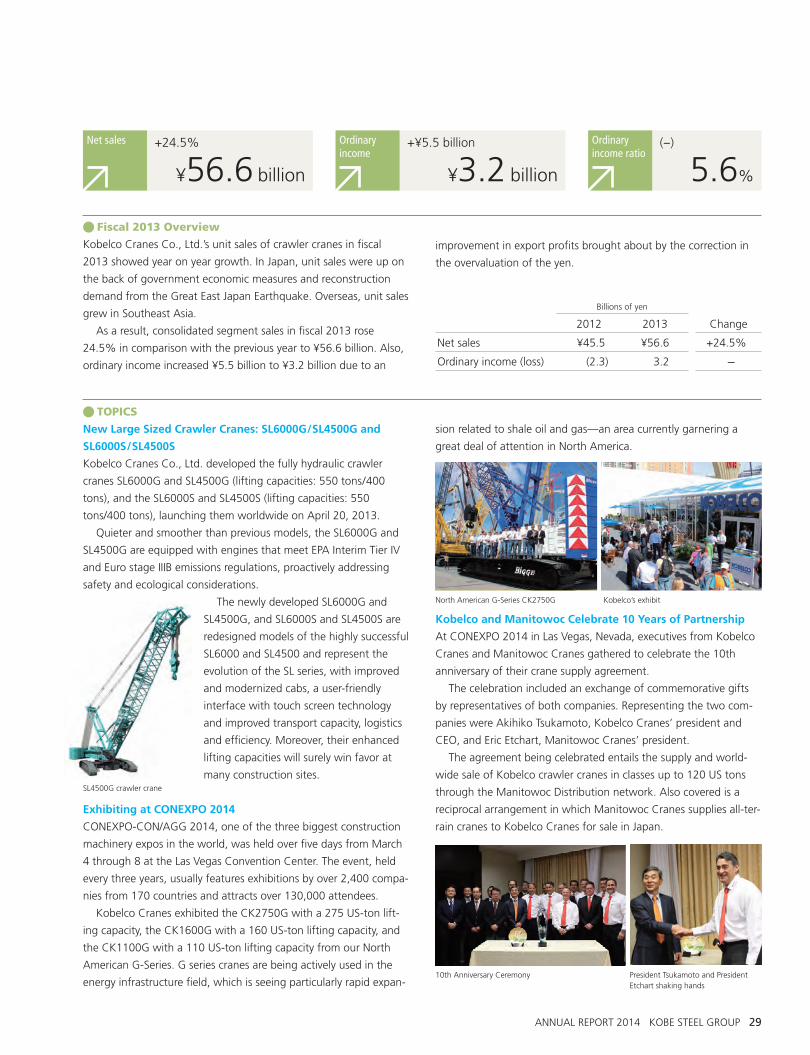
ANNUAL REPORT 2014 KOBE STEEL GROUP 29
Billions of yen
2012 2013 Change
Net sales ¥45.5 ¥56.6 +24.5%
Ordinary income (loss) (2.3) 3.2 ---
QFiscal 2013 Overview
Kobelco Cranes Co., Ltd.’s unit sales of crawler cranes in fiscal
2013 showed year on year growth. In Japan, unit sales were up on
the back of government economic measures and reconstruction
demand from the Great East Japan Earthquake. Overseas, unit sales
grew in Southeast Asia.
As a result, consolidated segment sales in fiscal 2013 rose
24.5% in comparison with the previous year to ¥56.6 billion. Also,
ordinary income increased ¥5.5 billion to ¥3.2 billion due to an
improvement in export profits brought about by the correction in
the overvaluation of the yen.
(--)
5.6%
Ordinary income ratio
+24.5%
¥56.6 billion
Net sales +¥5.5 billion
¥3.2 billion
Ordinary income
QTOPICS
New Large Sized Crawler Cranes: SL6000G/SL4500G and
SL6000S/SL4500S
Kobelco Cranes Co., Ltd. developed the fully hydraulic crawler
cranes SL6000G and SL4500G (lifting capacities: 550 tons/400
tons), and the SL6000S and SL4500S (lifting capacities: 550
tons/400 tons), launching them worldwide on April 20, 2013.
Quieter and smoother than previous models, the SL6000G and
SL4500G are equipped with engines that meet EPA Interim Tier IV
and Euro stage IIIB emissions regulations, proactively addressing
safety and ecological considerations.
The newly developed SL6000G and
SL4500G, and SL6000S and SL4500S are
redesigned models of the highly successful
SL6000 and SL4500 and represent the
evolution of the SL series, with improved
and modernized cabs, a user-friendly
interface with touch screen technology
and improved transport capacity, logistics
and efficiency. Moreover, their enhanced
lifting capacities will surely win favor at
many construction sites.
Exhibiting at CONEXPO 2014
CONEXPO-CON/AGG 2014, one of the three biggest construction
machinery expos in the world, was held over five days from March
4 through 8 at the Las Vegas Convention Center. The event, held
every three years, usually features exhibitions by over 2,400 compa-
nies from 170 countries and attracts over 130,000 attendees.
Kobelco Cranes exhibited the CK2750G with a 275 US-ton lift-
ing capacity, the CK1600G with a 160 US-ton lifting capacity, and
the CK1100G with a 110 US-ton lifting capacity from our North
American G-Series. G series cranes are being actively used in the
energy infrastructure field, which is seeing particularly rapid expan-
sion related to shale oil and gas—an area currently garnering a
great deal of attention in North America.
Kobelco and Manitowoc Celebrate 10 Years of Partnership
At CONEXPO 2014 in Las Vegas, Nevada, executives from Kobelco
Cranes and Manitowoc Cranes gathered to celebrate the 10th
anniversary of their crane supply agreement.
The celebration included an exchange of commemorative gifts
by representatives of both companies. Representing the two com-
panies were Akihiko Tsukamoto, Kobelco Cranes’ president and
CEO, and Eric Etchart, Manitowoc Cranes’ president.
The agreement being celebrated entails the supply and world-
wide sale of Kobelco crawler cranes in classes up to 120 US tons
through the Manitowoc Distribution network. Also covered is a
reciprocal arrangement in which Manitowoc Cranes supplies all-ter-
rain cranes to Kobelco Cranes for sale in Japan.
SL4500G crawler crane
10th Anniversary Ceremony President Tsukamoto and President Etchart shaking hands
North American G-Series CK2750G Kobelco’s exhibit
Large-sized crawler crane
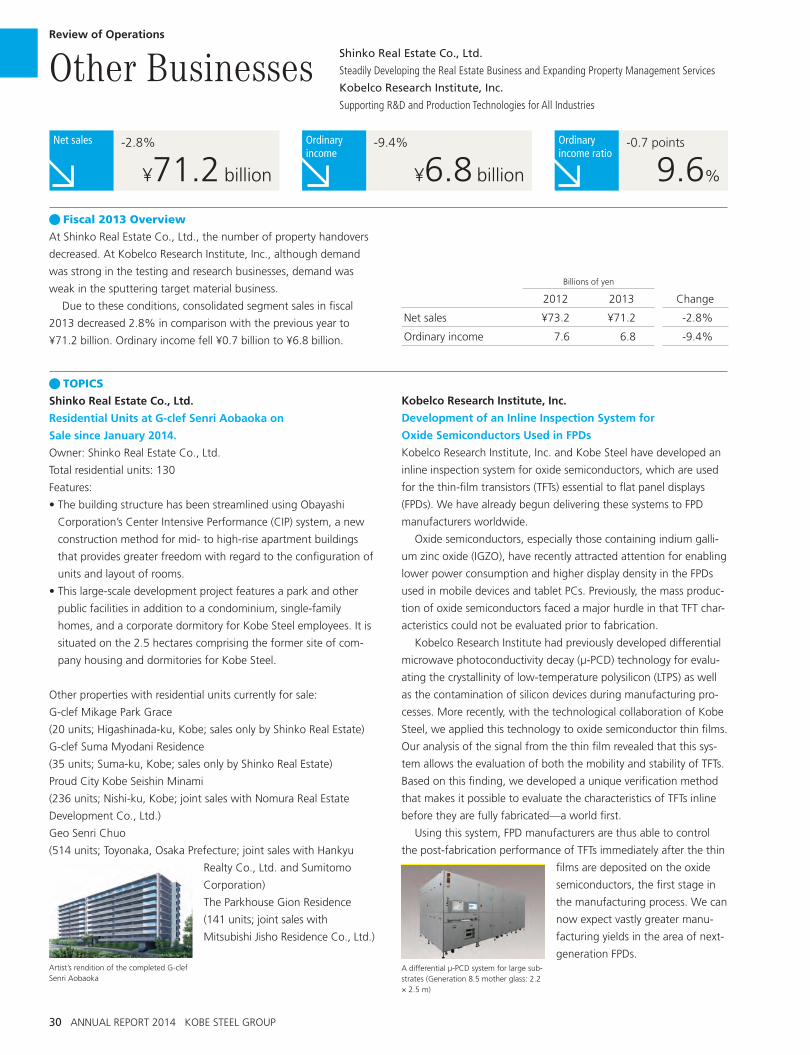
30 ANNUAL REPORT 2014 KOBE STEEL GROUP
Billions of yen
2012 2013 Change
Net sales ¥73.2 ¥71.2 -2.8%
Ordinary income 7.6 6.8 -9.4%
QFiscal 2013 Overview
At Shinko Real Estate Co., Ltd., the number of property handovers
decreased. At Kobelco Research Institute, Inc., although demand
was strong in the testing and research businesses, demand was
weak in the sputtering target material business.
Due to these conditions, consolidated segment sales in fiscal
2013 decreased 2.8% in comparison with the previous year to
¥71.2 billion. Ordinary income fell ¥0.7 billion to ¥6.8 billion.
-0.7 points
9.6%
Ordinary income ratio
-2.8%
¥71.2 billion
Net sales -9.4%
¥6.8 billion
Ordinary income
QTOPICS
Shinko Real Estate Co., Ltd.
Residential Units at G-clef Senri Aobaoka on
Sale since January 2014.
Owner: Shinko Real Estate Co., Ltd.
Total residential units: 130
Features:
• The building structure has been streamlined using Obayashi
Corporation’s Center Intensive Performance (CIP) system, a new
construction method for mid- to high-rise apartment buildings
that provides greater freedom with regard to the configuration of
units and layout of rooms.
• This large-scale development project features a park and other
public facilities in addition to a condominium, single-family
homes, and a corporate dormitory for Kobe Steel employees. It is
situated on the 2.5 hectares comprising the former site of com-
pany housing and dormitories for Kobe Steel.
Other properties with residential units currently for sale:
G-clef Mikage Park Grace
(20 units; Higashinada-ku, Kobe; sales only by Shinko Real Estate)
G-clef Suma Myodani Residence
(35 units; Suma-ku, Kobe; sales only by Shinko Real Estate)
Proud City Kobe Seishin Minami
(236 units; Nishi-ku, Kobe; joint sales with Nomura Real Estate
Development Co., Ltd.)
Geo Senri Chuo
(514 units; Toyonaka, Osaka Prefecture; joint sales with Hankyu
Realty Co., Ltd. and Sumitomo
Corporation)
The Parkhouse Gion Residence
(141 units; joint sales with
Mitsubishi Jisho Residence Co., Ltd.)
Kobelco Research Institute, Inc.
Development of an Inline Inspection System for
Oxide Semiconductors Used in FPDs
Kobelco Research Institute, Inc. and Kobe Steel have developed an
inline inspection system for oxide semiconductors, which are used
for the thin-film transistors (TFTs) essential to flat panel displays
(FPDs). We have already begun delivering these systems to FPD
manufacturers worldwide.
Oxide semiconductors, especially those containing indium galli-
um zinc oxide (IGZO), have recently attracted attention for enabling
lower power consumption and higher display density in the FPDs
used in mobile devices and tablet PCs. Previously, the mass produc-
tion of oxide semiconductors faced a major hurdle in that TFT char-
acteristics could not be evaluated prior to fabrication.
Kobelco Research Institute had previously developed differential
microwave photoconductivity decay (µ-PCD) technology for evalu-
ating the crystallinity of low-temperature polysilicon (LTPS) as well
as the contamination of silicon devices during manufacturing pro-
cesses. More recently, with the technological collaboration of Kobe
Steel, we applied this technology to oxide semiconductor thin films.
Our analysis of the signal from the thin film revealed that this sys-
tem allows the evaluation of both the mobility and stability of TFTs.
Based on this finding, we developed a unique verification method
that makes it possible to evaluate the characteristics of TFTs inline
before they are fully fabricated—a world first.
Using this system, FPD manufacturers are thus able to control
the post-fabrication performance of TFTs immediately after the thin
films are deposited on the oxide
semiconductors, the first stage in
the manufacturing process. We can
now expect vastly greater manu-
facturing yields in the area of next-
generation FPDs.A differential µ-PCD system for large sub-strates (Generation 8.5 mother glass: 2.2 × 2.5 m)
Artist’s rendition of the completed G-clef Senri Aobaoka
Other BusinessesReview of Operations
Shinko Real Estate Co., Ltd.
Steadily Developing the Real Estate Business and Expanding Property Management Services
Kobelco Research Institute, Inc.
Supporting R&D and Production Technologies for All Industries
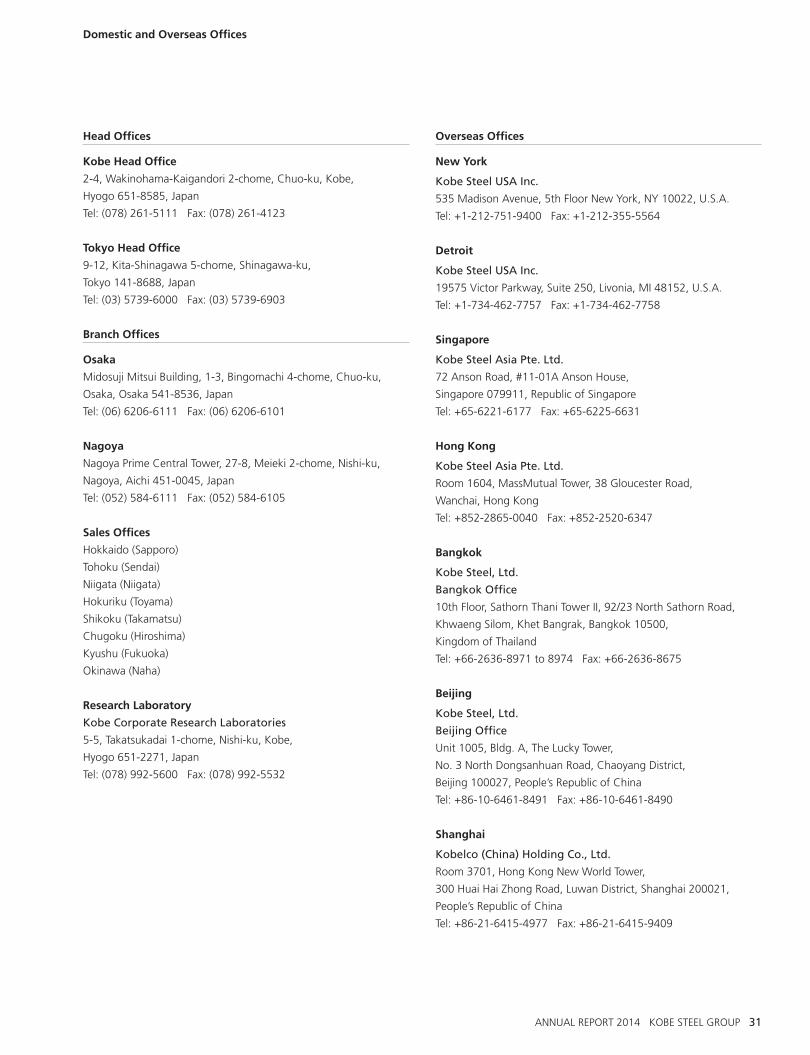
ANNUAL REPORT 2014 KOBE STEEL GROUP 31
Domestic and Overseas Offices
Head Offices
Kobe Head Office
2-4, Wakinohama-Kaigandori 2-chome, Chuo-ku, Kobe,
Hyogo 651-8585, Japan
Tel: (078) 261-5111 Fax: (078) 261-4123
Tokyo Head Office
9-12, Kita-Shinagawa 5-chome, Shinagawa-ku,
Tokyo 141-8688, Japan
Tel: (03) 5739-6000 Fax: (03) 5739-6903
Branch Offices
Osaka
Midosuji Mitsui Building, 1-3, Bingomachi 4-chome, Chuo-ku,
Osaka, Osaka 541-8536, Japan
Tel: (06) 6206-6111 Fax: (06) 6206-6101
Nagoya
Nagoya Prime Central Tower, 27-8, Meieki 2-chome, Nishi-ku,
Nagoya, Aichi 451-0045, Japan
Tel: (052) 584-6111 Fax: (052) 584-6105
Sales Offices
Hokkaido (Sapporo)
Tohoku (Sendai)
Niigata (Niigata)
Hokuriku (Toyama)
Shikoku (Takamatsu)
Chugoku (Hiroshima)
Kyushu (Fukuoka)
Okinawa (Naha)
Research Laboratory
Kobe Corporate Research Laboratories
5-5, Takatsukadai 1-chome, Nishi-ku, Kobe,
Hyogo 651-2271, Japan
Tel: (078) 992-5600 Fax: (078) 992-5532
Overseas Offices
New York
Kobe Steel USA Inc.
535 Madison Avenue, 5th Floor New York, NY 10022, U.S.A.
Tel: +1-212-751-9400 Fax: +1-212-355-5564
Detroit
Kobe Steel USA Inc.
19575 Victor Parkway, Suite 250, Livonia, MI 48152, U.S.A.
Tel: +1-734-462-7757 Fax: +1-734-462-7758
Singapore
Kobe Steel Asia Pte. Ltd.
72 Anson Road, #11-01A Anson House,
Singapore 079911, Republic of Singapore
Tel: +65-6221-6177 Fax: +65-6225-6631
Hong Kong
Kobe Steel Asia Pte. Ltd.
Room 1604, MassMutual Tower, 38 Gloucester Road,
Wanchai, Hong Kong
Tel: +852-2865-0040 Fax: +852-2520-6347
Bangkok
Kobe Steel, Ltd.
Bangkok Office
10th Floor, Sathorn Thani Tower II, 92/23 North Sathorn Road,
Khwaeng Silom, Khet Bangrak, Bangkok 10500,
Kingdom of Thailand
Tel: +66-2636-8971 to 8974 Fax: +66-2636-8675
Beijing
Kobe Steel, Ltd.
Beijing Office
Unit 1005, Bldg. A, The Lucky Tower,
No. 3 North Dongsanhuan Road, Chaoyang District,
Beijing 100027, People’s Republic of China
Tel: +86-10-6461-8491 Fax: +86-10-6461-8490
Shanghai
Kobelco (China) Holding Co., Ltd.
Room 3701, Hong Kong New World Tower,
300 Huai Hai Zhong Road, Luwan District, Shanghai 200021,
People’s Republic of China
Tel: +86-21-6415-4977 Fax: +86-21-6415-9409
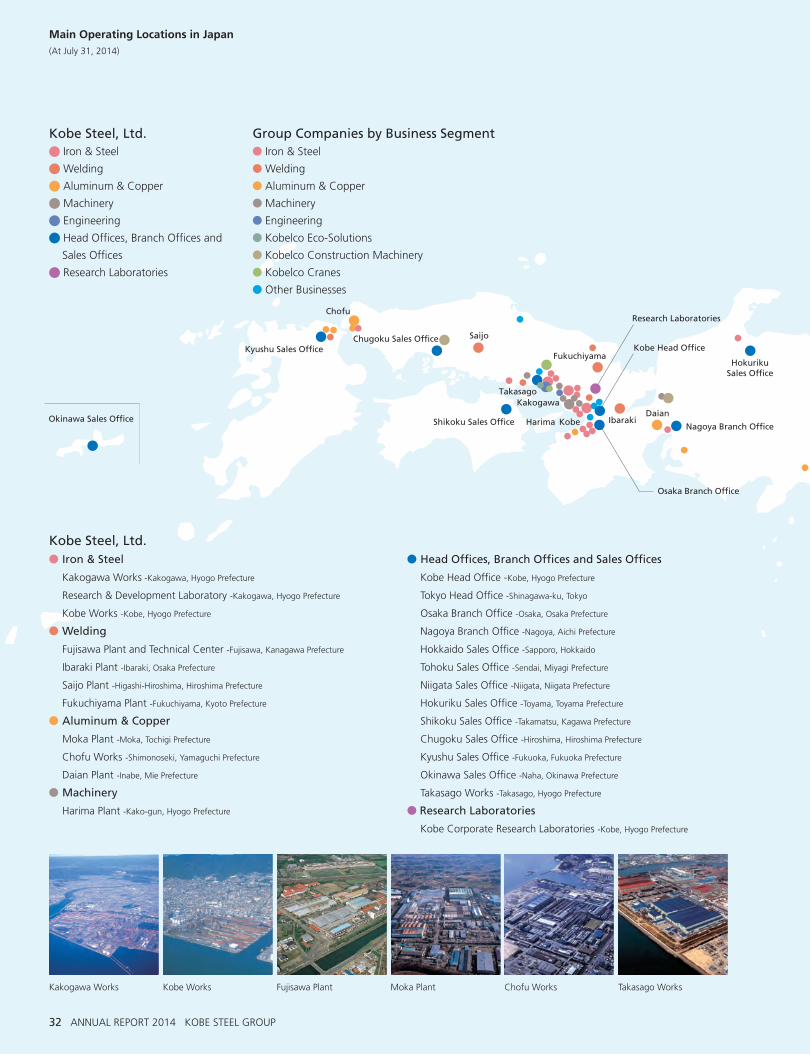
Okinawa Sales Office
Kyushu Sales OfficeChugoku Sales Office
Shikoku Sales Office
Niigata Sales Office
Tohoku Sales Office
Hokkaido Sales Office
HokurikuSales Office
Osaka Branch Office
Chofu
Saijo
Fukuchiyama
TakasagoKakogawa
Harima Kobe IbarakiDaian
Fujisawa
Moka
Nagoya Branch Office
TokyoHead Office
Kobe Head Office
Research Laboratories
32 ANNUAL REPORT 2014 KOBE STEEL GROUP
Main Operating Locations in Japan(At July 31, 2014)
Kobe Steel, Ltd.V Iron & Steel
Kakogawa Works -Kakogawa, Hyogo Prefecture
Research & Development Laboratory -Kakogawa, Hyogo Prefecture
Kobe Works -Kobe, Hyogo Prefecture
V Welding
Fujisawa Plant and Technical Center -Fujisawa, Kanagawa Prefecture
Ibaraki Plant -Ibaraki, Osaka Prefecture
Saijo Plant -Higashi-Hiroshima, Hiroshima Prefecture
Fukuchiyama Plant -Fukuchiyama, Kyoto Prefecture
V Aluminum & Copper
Moka Plant -Moka, Tochigi Prefecture
Chofu Works -Shimonoseki, Yamaguchi Prefecture
Daian Plant -Inabe, Mie Prefecture
V Machinery
Harima Plant -Kako-gun, Hyogo Prefecture
V Head Offices, Branch Offices and Sales Offices
Kobe Head Office -Kobe, Hyogo Prefecture
Tokyo Head Office -Shinagawa-ku, Tokyo
Osaka Branch Office -Osaka, Osaka Prefecture
Nagoya Branch Office -Nagoya, Aichi Prefecture
Hokkaido Sales Office -Sapporo, Hokkaido
Tohoku Sales Office -Sendai, Miyagi Prefecture
Niigata Sales Office -Niigata, Niigata Prefecture
Hokuriku Sales Office -Toyama, Toyama Prefecture
Shikoku Sales Office -Takamatsu, Kagawa Prefecture
Chugoku Sales Office -Hiroshima, Hiroshima Prefecture
Kyushu Sales Office -Fukuoka, Fukuoka Prefecture
Okinawa Sales Office -Naha, Okinawa Prefecture
Takasago Works -Takasago, Hyogo Prefecture
V Research Laboratories
Kobe Corporate Research Laboratories -Kobe, Hyogo Prefecture
Kakogawa Works Kobe Works Fujisawa Plant Moka Plant Chofu Works Takasago Works
Kobe Steel, Ltd.U Iron & Steel
U Welding
U Aluminum & Copper
U Machinery
U Engineering
U Head Offices, Branch Offices and
Sales Offices
U Research Laboratories
Group Companies by Business SegmentV Iron & Steel
V Welding
V Aluminum & Copper
V Machinery
V Engineering
V Kobelco Eco-Solutions
V Kobelco Construction Machinery
V Kobelco Cranes
V Other Businesses
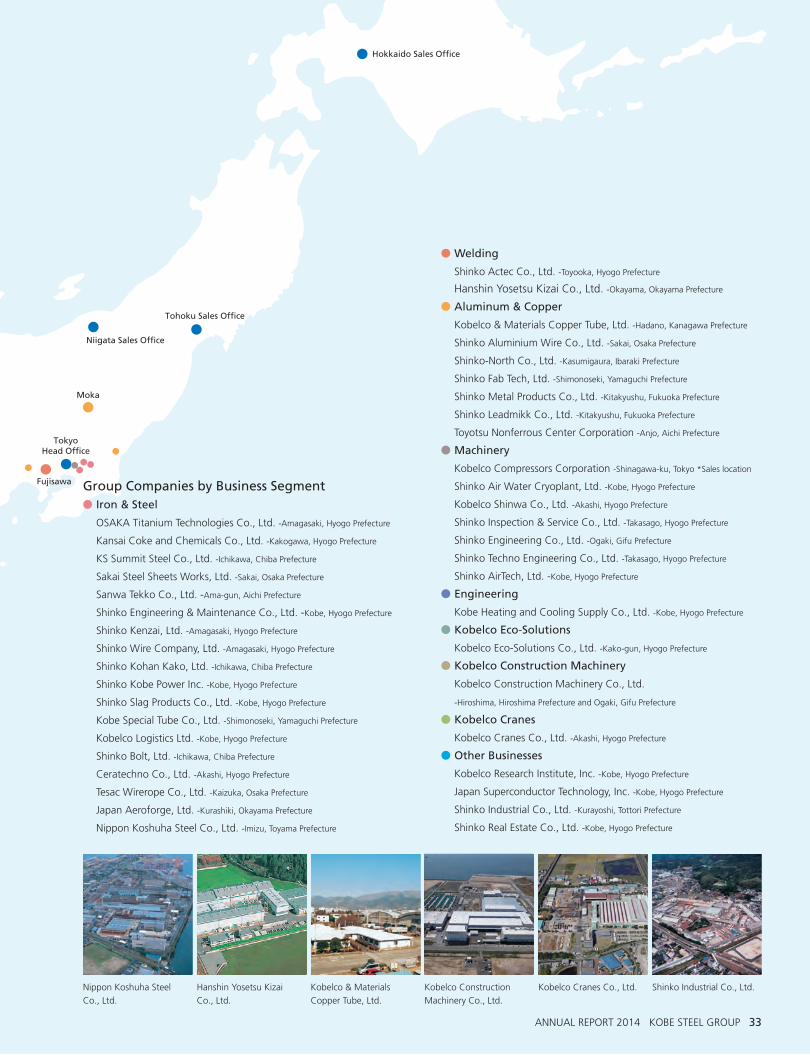
Okinawa Sales Office
Kyushu Sales OfficeChugoku Sales Office
Shikoku Sales Office
Niigata Sales Office
Tohoku Sales Office
Hokkaido Sales Office
HokurikuSales Office
Osaka Branch Office
Chofu
Saijo
Fukuchiyama
TakasagoKakogawa
Harima Kobe IbarakiDaian
Fujisawa
Moka
Nagoya Branch Office
TokyoHead Office
Kobe Head Office
Research Laboratories
ANNUAL REPORT 2014 KOBE STEEL GROUP 33
Group Companies by Business SegmentV Iron & Steel
OSAKA Titanium Technologies Co., Ltd. -Amagasaki, Hyogo Prefecture
Kansai Coke and Chemicals Co., Ltd. -Kakogawa, Hyogo Prefecture
KS Summit Steel Co., Ltd. -Ichikawa, Chiba Prefecture
Sakai Steel Sheets Works, Ltd. -Sakai, Osaka Prefecture
Sanwa Tekko Co., Ltd. -Ama-gun, Aichi Prefecture
Shinko Engineering & Maintenance Co., Ltd. -Kobe, Hyogo Prefecture
Shinko Kenzai, Ltd. -Amagasaki, Hyogo Prefecture
Shinko Wire Company, Ltd. -Amagasaki, Hyogo Prefecture
Shinko Kohan Kako, Ltd. -Ichikawa, Chiba Prefecture
Shinko Kobe Power Inc. -Kobe, Hyogo Prefecture
Shinko Slag Products Co., Ltd. -Kobe, Hyogo Prefecture
Kobe Special Tube Co., Ltd. -Shimonoseki, Yamaguchi Prefecture
Kobelco Logistics Ltd. -Kobe, Hyogo Prefecture
Shinko Bolt, Ltd. -Ichikawa, Chiba Prefecture
Ceratechno Co., Ltd. -Akashi, Hyogo Prefecture
Tesac Wirerope Co., Ltd. -Kaizuka, Osaka Prefecture
Japan Aeroforge, Ltd. -Kurashiki, Okayama Prefecture
Nippon Koshuha Steel Co., Ltd. -Imizu, Toyama Prefecture
V Welding
Shinko Actec Co., Ltd. -Toyooka, Hyogo Prefecture
Hanshin Yosetsu Kizai Co., Ltd. -Okayama, Okayama Prefecture
V Aluminum & Copper
Kobelco & Materials Copper Tube, Ltd. -Hadano, Kanagawa Prefecture
Shinko Aluminium Wire Co., Ltd. -Sakai, Osaka Prefecture
Shinko-North Co., Ltd. -Kasumigaura, Ibaraki Prefecture
Shinko Fab Tech, Ltd. -Shimonoseki, Yamaguchi Prefecture
Shinko Metal Products Co., Ltd. -Kitakyushu, Fukuoka Prefecture
Shinko Leadmikk Co., Ltd. -Kitakyushu, Fukuoka Prefecture
Toyotsu Nonferrous Center Corporation -Anjo, Aichi Prefecture
V Machinery
Kobelco Compressors Corporation -Shinagawa-ku, Tokyo *Sales location
Shinko Air Water Cryoplant, Ltd. -Kobe, Hyogo Prefecture
Kobelco Shinwa Co., Ltd. -Akashi, Hyogo Prefecture
Shinko Inspection & Service Co., Ltd. -Takasago, Hyogo Prefecture
Shinko Engineering Co., Ltd. -Ogaki, Gifu Prefecture
Shinko Techno Engineering Co., Ltd. -Takasago, Hyogo Prefecture
Shinko AirTech, Ltd. -Kobe, Hyogo Prefecture
V Engineering
Kobe Heating and Cooling Supply Co., Ltd. -Kobe, Hyogo Prefecture
V Kobelco Eco-Solutions
Kobelco Eco-Solutions Co., Ltd. -Kako-gun, Hyogo Prefecture
V Kobelco Construction Machinery
Kobelco Construction Machinery Co., Ltd.
-Hiroshima, Hiroshima Prefecture and Ogaki, Gifu Prefecture
V Kobelco Cranes
Kobelco Cranes Co., Ltd. -Akashi, Hyogo Prefecture
V Other Businesses
Kobelco Research Institute, Inc. -Kobe, Hyogo Prefecture
Japan Superconductor Technology, Inc. -Kobe, Hyogo Prefecture
Shinko Industrial Co., Ltd. -Kurayoshi, Tottori Prefecture
Shinko Real Estate Co., Ltd. -Kobe, Hyogo Prefecture
Nippon Koshuha Steel
Co., Ltd.
Hanshin Yosetsu Kizai
Co., Ltd.
Kobelco & Materials
Copper Tube, Ltd.
Kobelco Construction
Machinery Co., Ltd.
Kobelco Cranes Co., Ltd. Shinko Industrial Co., Ltd.
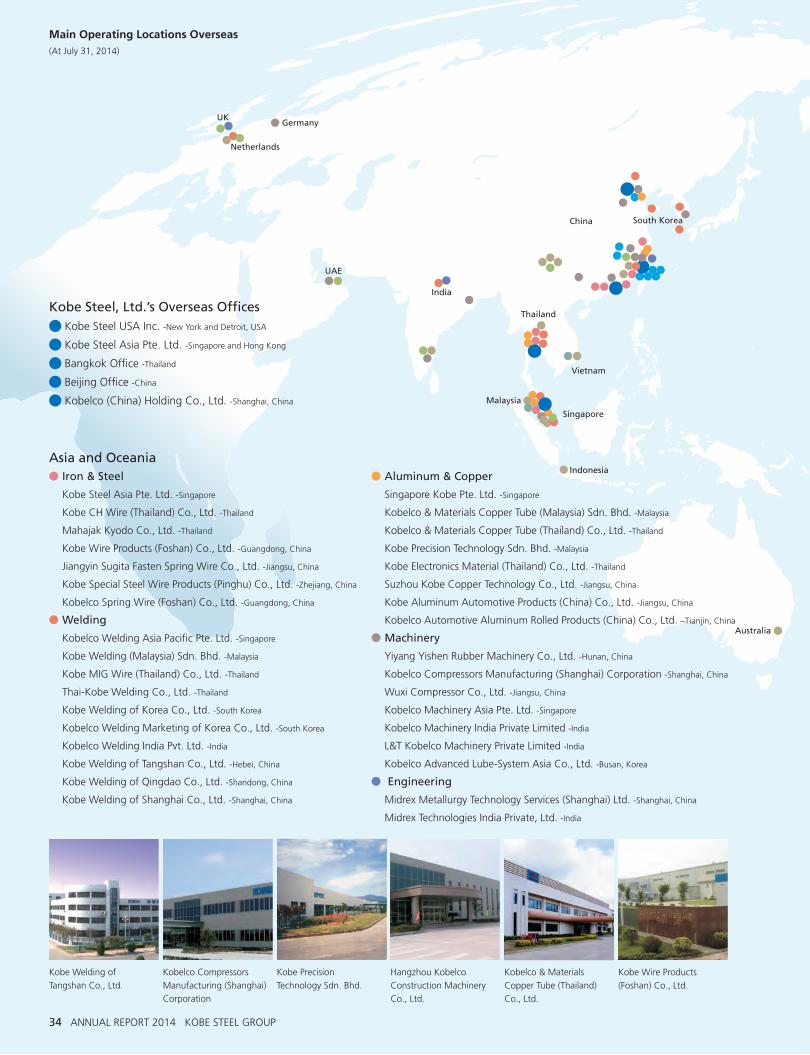
Australia
Netherlands
GermanyUK
UAE
India
Thailand
China South Korea
Singapore
Indonesia
Malaysia
Vietnam
USA
34 ANNUAL REPORT 2014 KOBE STEEL GROUP
Main Operating Locations Overseas(At July 31, 2014)
Asia and OceaniaV Iron & Steel
Kobe Steel Asia Pte. Ltd. -Singapore
Kobe CH Wire (Thailand) Co., Ltd. -Thailand
Mahajak Kyodo Co., Ltd. -Thailand
Kobe Wire Products (Foshan) Co., Ltd. -Guangdong, China
Jiangyin Sugita Fasten Spring Wire Co., Ltd. -Jiangsu, China
Kobe Special Steel Wire Products (Pinghu) Co., Ltd. -Zhejiang, China
Kobelco Spring Wire (Foshan) Co., Ltd. -Guangdong, China
V Welding
Kobelco Welding Asia Pacific Pte. Ltd. -Singapore
Kobe Welding (Malaysia) Sdn. Bhd. -Malaysia
Kobe MIG Wire (Thailand) Co., Ltd. -Thailand
Thai-Kobe Welding Co., Ltd. -Thailand
Kobe Welding of Korea Co., Ltd. -South Korea
Kobelco Welding Marketing of Korea Co., Ltd. -South Korea
Kobelco Welding India Pvt. Ltd. -India
Kobe Welding of Tangshan Co., Ltd. -Hebei, China
Kobe Welding of Qingdao Co., Ltd. -Shandong, China
Kobe Welding of Shanghai Co., Ltd. -Shanghai, China
V Aluminum & Copper
Singapore Kobe Pte. Ltd. -Singapore
Kobelco & Materials Copper Tube (Malaysia) Sdn. Bhd. -Malaysia
Kobelco & Materials Copper Tube (Thailand) Co., Ltd. -Thailand
Kobe Precision Technology Sdn. Bhd. -Malaysia
Kobe Electronics Material (Thailand) Co., Ltd. -Thailand
Suzhou Kobe Copper Technology Co., Ltd. -Jiangsu, China
Kobe Aluminum Automotive Products (China) Co., Ltd. -Jiangsu, China
Kobelco Automotive Aluminum Rolled Products (China) Co., Ltd. –Tianjin, China
V Machinery
Yiyang Yishen Rubber Machinery Co., Ltd. -Hunan, China
Kobelco Compressors Manufacturing (Shanghai) Corporation -Shanghai, China
Wuxi Compressor Co., Ltd. -Jiangsu, China
Kobelco Machinery Asia Pte. Ltd. -Singapore
Kobelco Machinery India Private Limited -India
L&T Kobelco Machinery Private Limited -India
Kobelco Advanced Lube-System Asia Co., Ltd. -Busan, Korea
V Engineering
Midrex Metallurgy Technology Services (Shanghai) Ltd. -Shanghai, China
Midrex Technologies India Private, Ltd. -India
Kobe Welding of
Tangshan Co., Ltd.
Kobelco Compressors
Manufacturing (Shanghai)
Corporation
Kobe Precision
Technology Sdn. Bhd.
Hangzhou Kobelco
Construction Machinery
Co., Ltd.
Kobelco & Materials
Copper Tube (Thailand)
Co., Ltd.
Kobe Wire Products
(Foshan) Co., Ltd.
Kobe Steel, Ltd.’s Overseas OfficesU Kobe Steel USA Inc. -New York and Detroit, USA
U Kobe Steel Asia Pte. Ltd. -Singapore and Hong Kong
U Bangkok Office -Thailand
U Beijing Office -China
U Kobelco (China) Holding Co., Ltd. -Shanghai, China
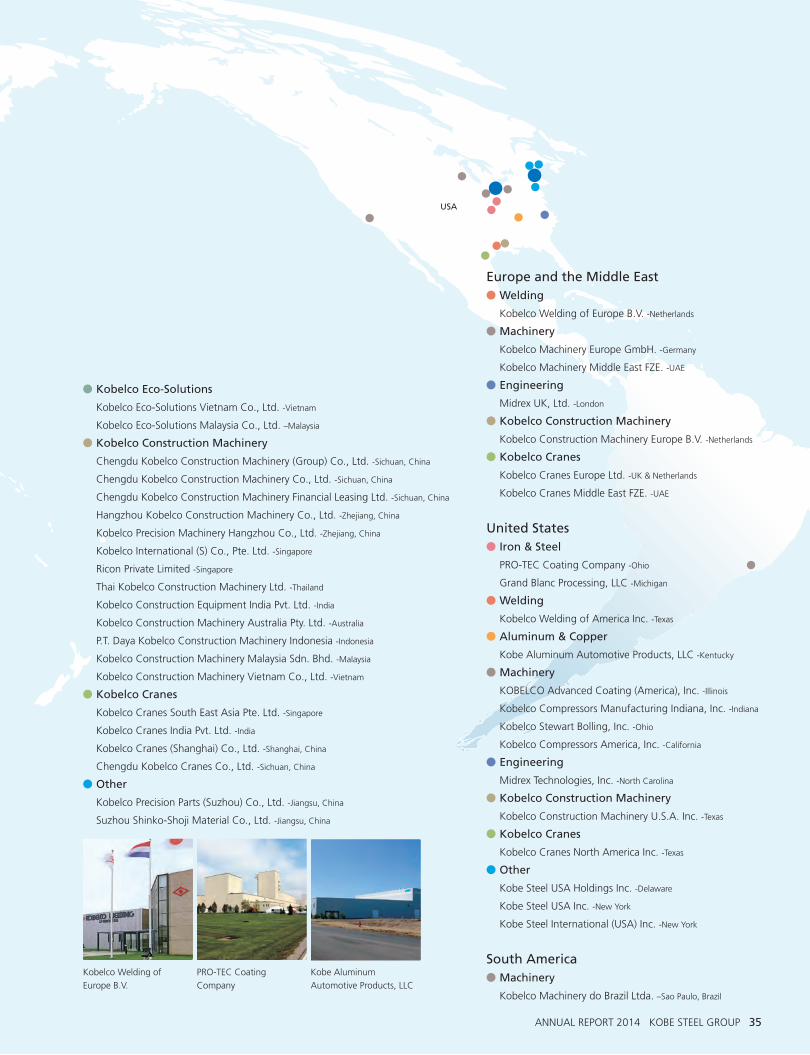
Australia
Netherlands
GermanyUK
UAE
India
Thailand
China South Korea
Singapore
Indonesia
Malaysia
Vietnam
USA
ANNUAL REPORT 2014 KOBE STEEL GROUP 35
V Kobelco Eco-Solutions
Kobelco Eco-Solutions Vietnam Co., Ltd. -Vietnam
Kobelco Eco-Solutions Malaysia Co., Ltd. –Malaysia
V Kobelco Construction Machinery
Chengdu Kobelco Construction Machinery (Group) Co., Ltd. -Sichuan, China
Chengdu Kobelco Construction Machinery Co., Ltd. -Sichuan, China
Chengdu Kobelco Construction Machinery Financial Leasing Ltd. -Sichuan, China
Hangzhou Kobelco Construction Machinery Co., Ltd. -Zhejiang, China
Kobelco Precision Machinery Hangzhou Co., Ltd. -Zhejiang, China
Kobelco International (S) Co., Pte. Ltd. -Singapore
Ricon Private Limited -Singapore
Thai Kobelco Construction Machinery Ltd. -Thailand
Kobelco Construction Equipment India Pvt. Ltd. -India
Kobelco Construction Machinery Australia Pty. Ltd. -Australia
P.T. Daya Kobelco Construction Machinery Indonesia -Indonesia
Kobelco Construction Machinery Malaysia Sdn. Bhd. -Malaysia
Kobelco Construction Machinery Vietnam Co., Ltd. -Vietnam
V Kobelco Cranes
Kobelco Cranes South East Asia Pte. Ltd. -Singapore
Kobelco Cranes India Pvt. Ltd. -India
Kobelco Cranes (Shanghai) Co., Ltd. -Shanghai, China
Chengdu Kobelco Cranes Co., Ltd. -Sichuan, China
V Other
Kobelco Precision Parts (Suzhou) Co., Ltd. -Jiangsu, China
Suzhou Shinko-Shoji Material Co., Ltd. -Jiangsu, China
Kobelco Welding of
Europe B.V.
PRO-TEC Coating
Company
Kobe Aluminum
Automotive Products, LLC
Europe and the Middle EastV Welding
Kobelco Welding of Europe B.V. -Netherlands
V Machinery
Kobelco Machinery Europe GmbH. -Germany
Kobelco Machinery Middle East FZE. -UAE
V Engineering
Midrex UK, Ltd. -London
V Kobelco Construction Machinery
Kobelco Construction Machinery Europe B.V. -Netherlands
V Kobelco Cranes
Kobelco Cranes Europe Ltd. -UK & Netherlands
Kobelco Cranes Middle East FZE. -UAE
United StatesV Iron & Steel
PRO-TEC Coating Company -Ohio
Grand Blanc Processing, LLC -Michigan
V Welding
Kobelco Welding of America Inc. -Texas
V Aluminum & Copper
Kobe Aluminum Automotive Products, LLC -Kentucky
V Machinery
KOBELCO Advanced Coating (America), Inc. -Illinois
Kobelco Compressors Manufacturing Indiana, Inc. -Indiana
Kobelco Stewart Bolling, Inc. -Ohio
Kobelco Compressors America, Inc. -California
V Engineering
Midrex Technologies, Inc. -North Carolina
V Kobelco Construction Machinery
Kobelco Construction Machinery U.S.A. Inc. -Texas
V Kobelco Cranes
Kobelco Cranes North America Inc. -Texas
V Other
Kobe Steel USA Holdings Inc. -Delaware
Kobe Steel USA Inc. -New York
Kobe Steel International (USA) Inc. -New York
South AmericaV Machinery
Kobelco Machinery do Brazil Ltda. –Sao Paulo, Brazil
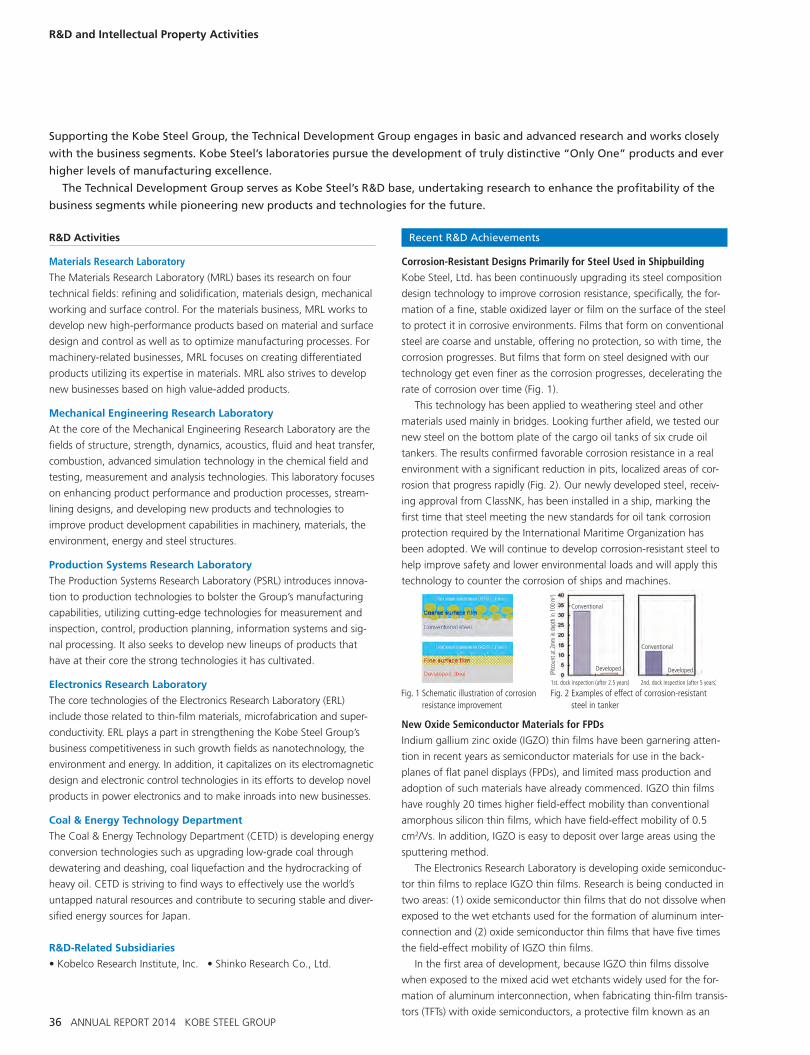
36 ANNUAL REPORT 2014 KOBE STEEL GROUP
R&D and Intellectual Property Activities
Supporting the Kobe Steel Group, the Technical Development Group engages in basic and advanced research and works closely
with the business segments. Kobe Steel’s laboratories pursue the development of truly distinctive “Only One” products and ever
higher levels of manufacturing excellence.
The Technical Development Group serves as Kobe Steel’s R&D base, undertaking research to enhance the profitability of the
business segments while pioneering new products and technologies for the future.
R&D Activities
Materials Research Laboratory
The Materials Research Laboratory (MRL) bases its research on four
technical fields: refining and solidification, materials design, mechanical
working and surface control. For the materials business, MRL works to
develop new high-performance products based on material and surface
design and control as well as to optimize manufacturing processes. For
machinery-related businesses, MRL focuses on creating differentiated
products utilizing its expertise in materials. MRL also strives to develop
new businesses based on high value-added products.
Mechanical Engineering Research Laboratory
At the core of the Mechanical Engineering Research Laboratory are the
fields of structure, strength, dynamics, acoustics, fluid and heat transfer,
combustion, advanced simulation technology in the chemical field and
testing, measurement and analysis technologies. This laboratory focuses
on enhancing product performance and production processes, stream-
lining designs, and developing new products and technologies to
improve product development capabilities in machinery, materials, the
environment, energy and steel structures.
Production Systems Research Laboratory
The Production Systems Research Laboratory (PSRL) introduces innova-
tion to production technologies to bolster the Group’s manufacturing
capabilities, utilizing cutting-edge technologies for measurement and
inspection, control, production planning, information systems and sig-
nal processing. It also seeks to develop new lineups of products that
have at their core the strong technologies it has cultivated.
Electronics Research Laboratory
The core technologies of the Electronics Research Laboratory (ERL)
include those related to thin-film materials, microfabrication and super-
conductivity. ERL plays a part in strengthening the Kobe Steel Group’s
business competitiveness in such growth fields as nanotechnology, the
environment and energy. In addition, it capitalizes on its electromagnetic
design and electronic control technologies in its efforts to develop novel
products in power electronics and to make inroads into new businesses.
Coal & Energy Technology Department
The Coal & Energy Technology Department (CETD) is developing energy
conversion technologies such as upgrading low-grade coal through
dewatering and deashing, coal liquefaction and the hydrocracking of
heavy oil. CETD is striving to find ways to effectively use the world’s
untapped natural resources and contribute to securing stable and diver-
sified energy sources for Japan.
R&D-Related Subsidiaries
• Kobelco Research Institute, Inc. • Shinko Research Co., Ltd.
Recent R&D Achievements
Corrosion-Resistant Designs Primarily for Steel Used in Shipbuilding
Kobe Steel, Ltd. has been continuously upgrading its steel composition
design technology to improve corrosion resistance, specifically, the for-
mation of a fine, stable oxidized layer or film on the surface of the steel
to protect it in corrosive environments. Films that form on conventional
steel are coarse and unstable, offering no protection, so with time, the
corrosion progresses. But films that form on steel designed with our
technology get even finer as the corrosion progresses, decelerating the
rate of corrosion over time (Fig. 1).
This technology has been applied to weathering steel and other
materials used mainly in bridges. Looking further afield, we tested our
new steel on the bottom plate of the cargo oil tanks of six crude oil
tankers. The results confirmed favorable corrosion resistance in a real
environment with a significant reduction in pits, localized areas of cor-
rosion that progress rapidly (Fig. 2). Our newly developed steel, receiv-
ing approval from ClassNK, has been installed in a ship, marking the
first time that steel meeting the new standards for oil tank corrosion
protection required by the International Maritime Organization has
been adopted. We will continue to develop corrosion-resistant steel to
help improve safety and lower environmental loads and will apply this
technology to counter the corrosion of ships and machines.
New Oxide Semiconductor Materials for FPDs
Indium gallium zinc oxide (IGZO) thin films have been garnering atten-
tion in recent years as semiconductor materials for use in the back-
planes of flat panel displays (FPDs), and limited mass production and
adoption of such materials have already commenced. IGZO thin films
have roughly 20 times higher field-effect mobility than conventional
amorphous silicon thin films, which have field-effect mobility of 0.5
cm2/Vs. In addition, IGZO is easy to deposit over large areas using the
sputtering method.
The Electronics Research Laboratory is developing oxide semiconduc-
tor thin films to replace IGZO thin films. Research is being conducted in
two areas: (1) oxide semiconductor thin films that do not dissolve when
exposed to the wet etchants used for the formation of aluminum inter-
connection and (2) oxide semiconductor thin films that have five times
the field-effect mobility of IGZO thin films.
In the first area of development, because IGZO thin films dissolve
when exposed to the mixed acid wet etchants widely used for the for-
mation of aluminum interconnection, when fabricating thin-film transis-
tors (TFTs) with oxide semiconductors, a protective film known as an
Conventional
Developed
Conventional
Developed
1st. dock inspection (after 2.5 years) 2nd. dock inspection (after 5 years)
(Pitc
ount
at 2
mm
in d
epth
in 1
00 m
2 )
Fig. 1 Schematic illustration of corrosion resistance improvement
Fig. 2 Examples of effect of corrosion-resistant steel in tanker
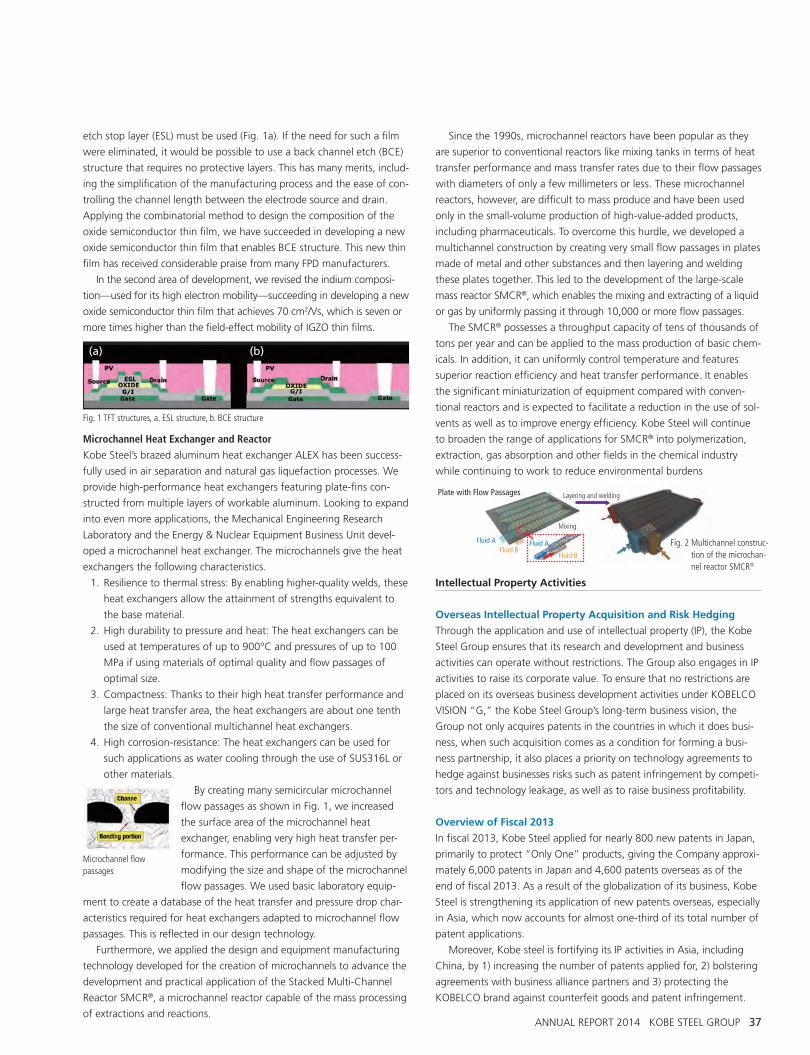
ANNUAL REPORT 2014 KOBE STEEL GROUP 37
etch stop layer (ESL) must be used (Fig. 1a). If the need for such a film
were eliminated, it would be possible to use a back channel etch (BCE)
structure that requires no protective layers. This has many merits, includ-
ing the simplification of the manufacturing process and the ease of con-
trolling the channel length between the electrode source and drain.
Applying the combinatorial method to design the composition of the
oxide semiconductor thin film, we have succeeded in developing a new
oxide semiconductor thin film that enables BCE structure. This new thin
film has received considerable praise from many FPD manufacturers.
In the second area of development, we revised the indium composi-
tion—used for its high electron mobility—succeeding in developing a new
oxide semiconductor thin film that achieves 70 cm2/Vs, which is seven or
more times higher than the field-effect mobility of IGZO thin films.
Microchannel Heat Exchanger and Reactor
Kobe Steel’s brazed aluminum heat exchanger ALEX has been success-
fully used in air separation and natural gas liquefaction processes. We
provide high-performance heat exchangers featuring plate-fins con-
structed from multiple layers of workable aluminum. Looking to expand
into even more applications, the Mechanical Engineering Research
Laboratory and the Energy & Nuclear Equipment Business Unit devel-
oped a microchannel heat exchanger. The microchannels give the heat
exchangers the following characteristics.
1. Resilience to thermal stress: By enabling higher-quality welds, these
heat exchangers allow the attainment of strengths equivalent to
the base material.
2. High durability to pressure and heat: The heat exchangers can be
used at temperatures of up to 900°C and pressures of up to 100
MPa if using materials of optimal quality and flow passages of
optimal size.
3. Compactness: Thanks to their high heat transfer performance and
large heat transfer area, the heat exchangers are about one tenth
the size of conventional multichannel heat exchangers.
4. High corrosion-resistance: The heat exchangers can be used for
such applications as water cooling through the use of SUS316L or
other materials.
By creating many semicircular microchannel
flow passages as shown in Fig. 1, we increased
the surface area of the microchannel heat
exchanger, enabling very high heat transfer per-
formance. This performance can be adjusted by
modifying the size and shape of the microchannel
flow passages. We used basic laboratory equip-
ment to create a database of the heat transfer and pressure drop char-
acteristics required for heat exchangers adapted to microchannel flow
passages. This is reflected in our design technology.
Furthermore, we applied the design and equipment manufacturing
technology developed for the creation of microchannels to advance the
development and practical application of the Stacked Multi-Channel
Reactor SMCR®, a microchannel reactor capable of the mass processing
of extractions and reactions.
Since the 1990s, microchannel reactors have been popular as they
are superior to conventional reactors like mixing tanks in terms of heat
transfer performance and mass transfer rates due to their flow passages
with diameters of only a few millimeters or less. These microchannel
reactors, however, are difficult to mass produce and have been used
only in the small-volume production of high-value-added products,
including pharmaceuticals. To overcome this hurdle, we developed a
multichannel construction by creating very small flow passages in plates
made of metal and other substances and then layering and welding
these plates together. This led to the development of the large-scale
mass reactor SMCR®, which enables the mixing and extracting of a liquid
or gas by uniformly passing it through 10,000 or more flow passages.
The SMCR® possesses a throughput capacity of tens of thousands of
tons per year and can be applied to the mass production of basic chem-
icals. In addition, it can uniformly control temperature and features
superior reaction efficiency and heat transfer performance. It enables
the significant miniaturization of equipment compared with conven-
tional reactors and is expected to facilitate a reduction in the use of sol-
vents as well as to improve energy efficiency. Kobe Steel will continue
to broaden the range of applications for SMCR® into polymerization,
extraction, gas absorption and other fields in the chemical industry
while continuing to work to reduce environmental burdens
Intellectual Property Activities
Overseas Intellectual Property Acquisition and Risk Hedging
Through the application and use of intellectual property (IP), the Kobe
Steel Group ensures that its research and development and business
activities can operate without restrictions. The Group also engages in IP
activities to raise its corporate value. To ensure that no restrictions are
placed on its overseas business development activities under KOBELCO
VISION “G,” the Kobe Steel Group’s long-term business vision, the
Group not only acquires patents in the countries in which it does busi-
ness, when such acquisition comes as a condition for forming a busi-
ness partnership, it also places a priority on technology agreements to
hedge against businesses risks such as patent infringement by competi-
tors and technology leakage, as well as to raise business profitability.
Overview of Fiscal 2013
In fiscal 2013, Kobe Steel applied for nearly 800 new patents in Japan,
primarily to protect “Only One” products, giving the Company approxi-
mately 6,000 patents in Japan and 4,600 patents overseas as of the
end of fiscal 2013. As a result of the globalization of its business, Kobe
Steel is strengthening its application of new patents overseas, especially
in Asia, which now accounts for almost one-third of its total number of
patent applications.
Moreover, Kobe steel is fortifying its IP activities in Asia, including
China, by 1) increasing the number of patents applied for, 2) bolstering
agreements with business alliance partners and 3) protecting the
KOBELCO brand against counterfeit goods and patent infringement.
Fig. 1 TFT structures, a. ESL structure, b. BCE structure
Microchannel flow passages
Plate with Flow Passages Layering and welding
Mixing
Fluid A Fluid AFluid B
Fluid B
Fig. 2 Multichannel construc-tion of the microchan-nel reactor SMCR®
(a) (b)
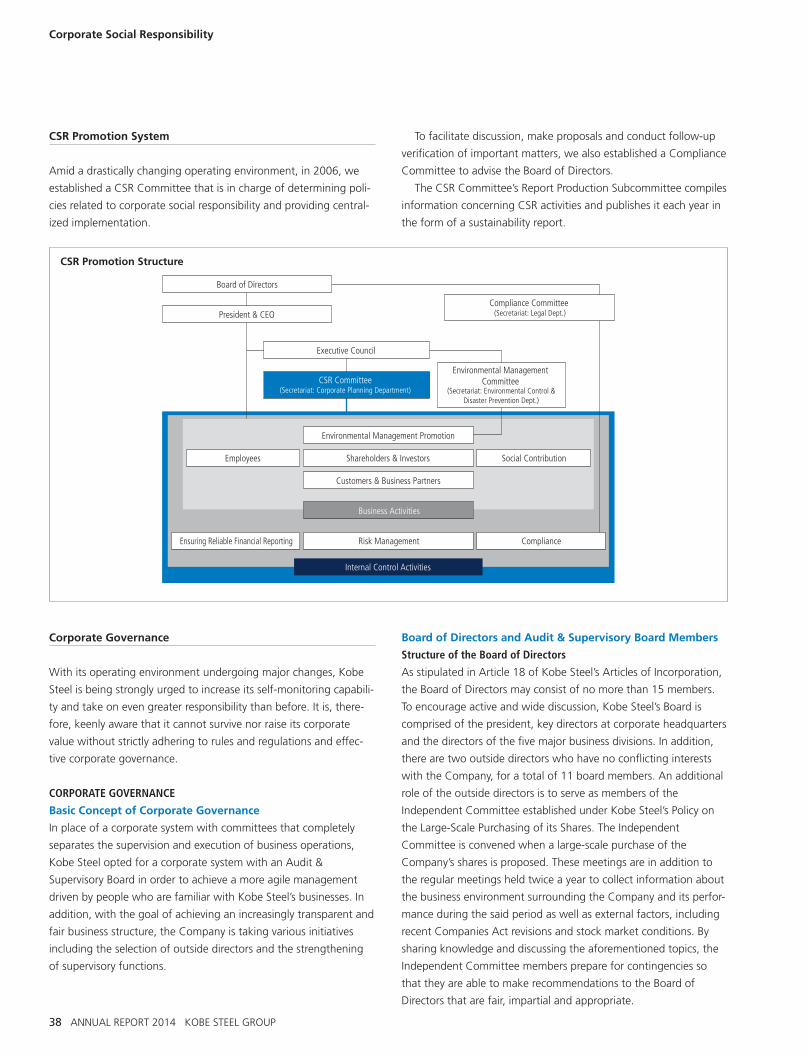
38 ANNUAL REPORT 2014 KOBE STEEL GROUP
Corporate Social Responsibility
CSR Promotion System
Amid a drastically changing operating environment, in 2006, we
established a CSR Committee that is in charge of determining poli-
cies related to corporate social responsibility and providing central-
ized implementation.
Corporate Governance
With its operating environment undergoing major changes, Kobe
Steel is being strongly urged to increase its self-monitoring capabili-
ty and take on even greater responsibility than before. It is, there-
fore, keenly aware that it cannot survive nor raise its corporate
value without strictly adhering to rules and regulations and effec-
tive corporate governance.
CORPORATE GOVERNANCE
Basic Concept of Corporate Governance
In place of a corporate system with committees that completely
separates the supervision and execution of business operations,
Kobe Steel opted for a corporate system with an Audit &
Supervisory Board in order to achieve a more agile management
driven by people who are familiar with Kobe Steel’s businesses. In
addition, with the goal of achieving an increasingly transparent and
fair business structure, the Company is taking various initiatives
including the selection of outside directors and the strengthening
of supervisory functions.
To facilitate discussion, make proposals and conduct follow-up
verification of important matters, we also established a Compliance
Committee to advise the Board of Directors.
The CSR Committee’s Report Production Subcommittee compiles
information concerning CSR activities and publishes it each year in
the form of a sustainability report.
Board of Directors and Audit & Supervisory Board Members
Structure of the Board of Directors
As stipulated in Article 18 of Kobe Steel’s Articles of Incorporation,
the Board of Directors may consist of no more than 15 members.
To encourage active and wide discussion, Kobe Steel’s Board is
comprised of the president, key directors at corporate headquarters
and the directors of the five major business divisions. In addition,
there are two outside directors who have no conflicting interests
with the Company, for a total of 11 board members. An additional
role of the outside directors is to serve as members of the
Independent Committee established under Kobe Steel’s Policy on
the Large-Scale Purchasing of its Shares. The Independent
Committee is convened when a large-scale purchase of the
Company’s shares is proposed. These meetings are in addition to
the regular meetings held twice a year to collect information about
the business environment surrounding the Company and its perfor-
mance during the said period as well as external factors, including
recent Companies Act revisions and stock market conditions. By
sharing knowledge and discussing the aforementioned topics, the
Independent Committee members prepare for contingencies so
that they are able to make recommendations to the Board of
Directors that are fair, impartial and appropriate.
Ensuring Reliable Financial Reporting Risk Management Compliance
Shareholders & Investors Social ContributionEmployees
Customers & Business Partners
Business Activities
Internal Control Activities
Compliance Committee (Secretariat: Legal Dept.)President & CEO
Board of Directors
Executive Council
Environmental ManagementCommittee
(Secretariat: Environmental Control &Disaster Prevention Dept.)
Environmental Management Promotion
CSR Committee(Secretariat: Corporate Planning Department)
CSR Promotion Structure
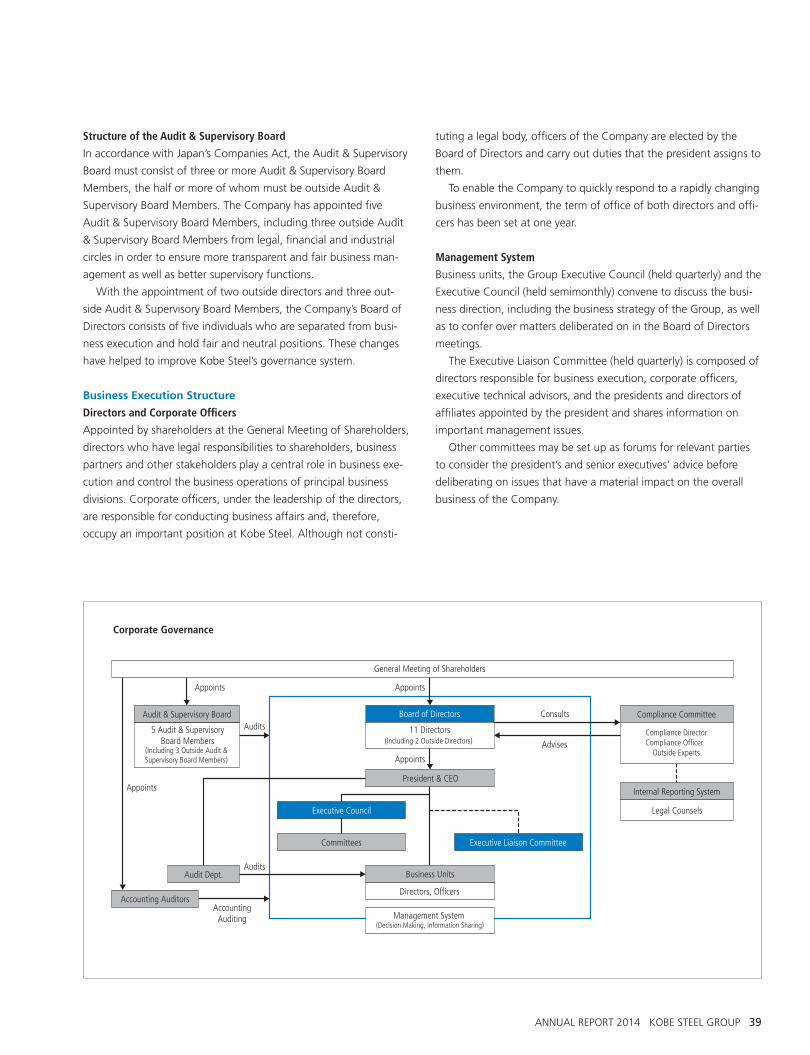
ANNUAL REPORT 2014 KOBE STEEL GROUP 39
tuting a legal body, officers of the Company are elected by the
Board of Directors and carry out duties that the president assigns to
them.
To enable the Company to quickly respond to a rapidly changing
business environment, the term of office of both directors and offi-
cers has been set at one year.
Management System
Business units, the Group Executive Council (held quarterly) and the
Executive Council (held semimonthly) convene to discuss the busi-
ness direction, including the business strategy of the Group, as well
as to confer over matters deliberated on in the Board of Directors
meetings.
The Executive Liaison Committee (held quarterly) is composed of
directors responsible for business execution, corporate officers,
executive technical advisors, and the presidents and directors of
affiliates appointed by the president and shares information on
important management issues.
Other committees may be set up as forums for relevant parties
to consider the president’s and senior executives’ advice before
deliberating on issues that have a material impact on the overall
business of the Company.
Structure of the Audit & Supervisory Board
In accordance with Japan’s Companies Act, the Audit & Supervisory
Board must consist of three or more Audit & Supervisory Board
Members, the half or more of whom must be outside Audit &
Supervisory Board Members. The Company has appointed five
Audit & Supervisory Board Members, including three outside Audit
& Supervisory Board Members from legal, financial and industrial
circles in order to ensure more transparent and fair business man-
agement as well as better supervisory functions.
With the appointment of two outside directors and three out-
side Audit & Supervisory Board Members, the Company’s Board of
Directors consists of five individuals who are separated from busi-
ness execution and hold fair and neutral positions. These changes
have helped to improve Kobe Steel’s governance system.
Business Execution Structure
Directors and Corporate Officers
Appointed by shareholders at the General Meeting of Shareholders,
directors who have legal responsibilities to shareholders, business
partners and other stakeholders play a central role in business exe-
cution and control the business operations of principal business
divisions. Corporate officers, under the leadership of the directors,
are responsible for conducting business affairs and, therefore,
occupy an important position at Kobe Steel. Although not consti-
Management System (Decision Making, Information Sharing)
Audit & Supervisory Board
Appoints
Appoints
Audits
AccountingAuditing
Appoints
ConsultsAudits
Advises
Appoints
General Meeting of Shareholders
Audit Dept.
Accounting Auditors
5 Audit & SupervisoryBoard Members
(Including 3 Outside Audit &Supervisory Board Members)
Board of Directors
President & CEO
Executive Council
Committees Executive Liaison Committee
11 Directors(Including 2 Outside Directors)
Internal Reporting System
Legal Counsels
Business Units
Directors, Officers
Compliance Committee
Compliance DirectorCompliance Officer
Outside Experts
Corporate Governance
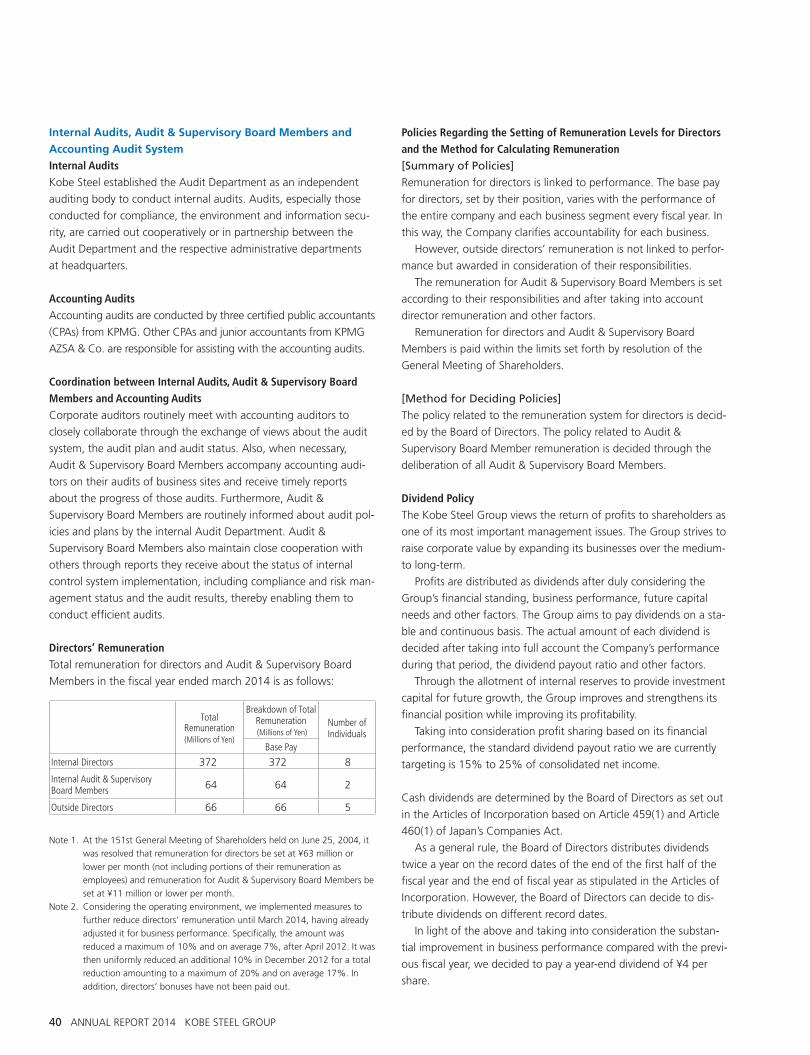
40 ANNUAL REPORT 2014 KOBE STEEL GROUP
Internal Audits, Audit & Supervisory Board Members and
Accounting Audit System
Internal AuditsKobe Steel established the Audit Department as an independent
auditing body to conduct internal audits. Audits, especially those
conducted for compliance, the environment and information secu-
rity, are carried out cooperatively or in partnership between the
Audit Department and the respective administrative departments
at headquarters.
Accounting AuditsAccounting audits are conducted by three certified public accountants
(CPAs) from KPMG. Other CPAs and junior accountants from KPMG
AZSA & Co. are responsible for assisting with the accounting audits.
Coordination between Internal Audits, Audit & Supervisory Board Members and Accounting AuditsCorporate auditors routinely meet with accounting auditors to
closely collaborate through the exchange of views about the audit
system, the audit plan and audit status. Also, when necessary,
Audit & Supervisory Board Members accompany accounting audi-
tors on their audits of business sites and receive timely reports
about the progress of those audits. Furthermore, Audit &
Supervisory Board Members are routinely informed about audit pol-
icies and plans by the internal Audit Department. Audit &
Supervisory Board Members also maintain close cooperation with
others through reports they receive about the status of internal
control system implementation, including compliance and risk man-
agement status and the audit results, thereby enabling them to
conduct efficient audits.
Directors’ RemunerationTotal remuneration for directors and Audit & Supervisory Board
Members in the fiscal year ended march 2014 is as follows:
Policies Regarding the Setting of Remuneration Levels for Directors and the Method for Calculating Remuneration[Summary of Policies]
Remuneration for directors is linked to performance. The base pay
for directors, set by their position, varies with the performance of
the entire company and each business segment every fiscal year. In
this way, the Company clarifies accountability for each business.
However, outside directors’ remuneration is not linked to perfor-
mance but awarded in consideration of their responsibilities.
The remuneration for Audit & Supervisory Board Members is set
according to their responsibilities and after taking into account
director remuneration and other factors.
Remuneration for directors and Audit & Supervisory Board
Members is paid within the limits set forth by resolution of the
General Meeting of Shareholders.
[Method for Deciding Policies]
The policy related to the remuneration system for directors is decid-
ed by the Board of Directors. The policy related to Audit &
Supervisory Board Member remuneration is decided through the
deliberation of all Audit & Supervisory Board Members.
Dividend PolicyThe Kobe Steel Group views the return of profits to shareholders as
one of its most important management issues. The Group strives to
raise corporate value by expanding its businesses over the medium-
to long-term.
Profits are distributed as dividends after duly considering the
Group’s financial standing, business performance, future capital
needs and other factors. The Group aims to pay dividends on a sta-
ble and continuous basis. The actual amount of each dividend is
decided after taking into full account the Company’s performance
during that period, the dividend payout ratio and other factors.
Through the allotment of internal reserves to provide investment
capital for future growth, the Group improves and strengthens its
financial position while improving its profitability.
Taking into consideration profit sharing based on its financial
performance, the standard dividend payout ratio we are currently
targeting is 15% to 25% of consolidated net income.
Cash dividends are determined by the Board of Directors as set out
in the Articles of Incorporation based on Article 459(1) and Article
460(1) of Japan’s Companies Act.
As a general rule, the Board of Directors distributes dividends
twice a year on the record dates of the end of the first half of the
fiscal year and the end of fiscal year as stipulated in the Articles of
Incorporation. However, the Board of Directors can decide to dis-
tribute dividends on different record dates.
In light of the above and taking into consideration the substan-
tial improvement in business performance compared with the previ-
ous fiscal year, we decided to pay a year-end dividend of ¥4 per
share.
Note 1. At the 151st General Meeting of Shareholders held on June 25, 2004, it
was resolved that remuneration for directors be set at ¥63 million or
lower per month (not including portions of their remuneration as
employees) and remuneration for Audit & Supervisory Board Members be
set at ¥11 million or lower per month.
Note 2. Considering the operating environment, we implemented measures to
further reduce directors’ remuneration until March 2014, having already
adjusted it for business performance. Specifically, the amount was
reduced a maximum of 10% and on average 7%, after April 2012. It was
then uniformly reduced an additional 10% in December 2012 for a total
reduction amounting to a maximum of 20% and on average 17%. In
addition, directors’ bonuses have not been paid out.
Total Remuneration(Millions of Yen)
Breakdown of Total Remuneration (Millions of Yen)
Number of Individuals
Base Pay
Internal Directors 372 372 8
Internal Audit & Supervisory Board Members 64 64 2
Outside Directors 66 66 5
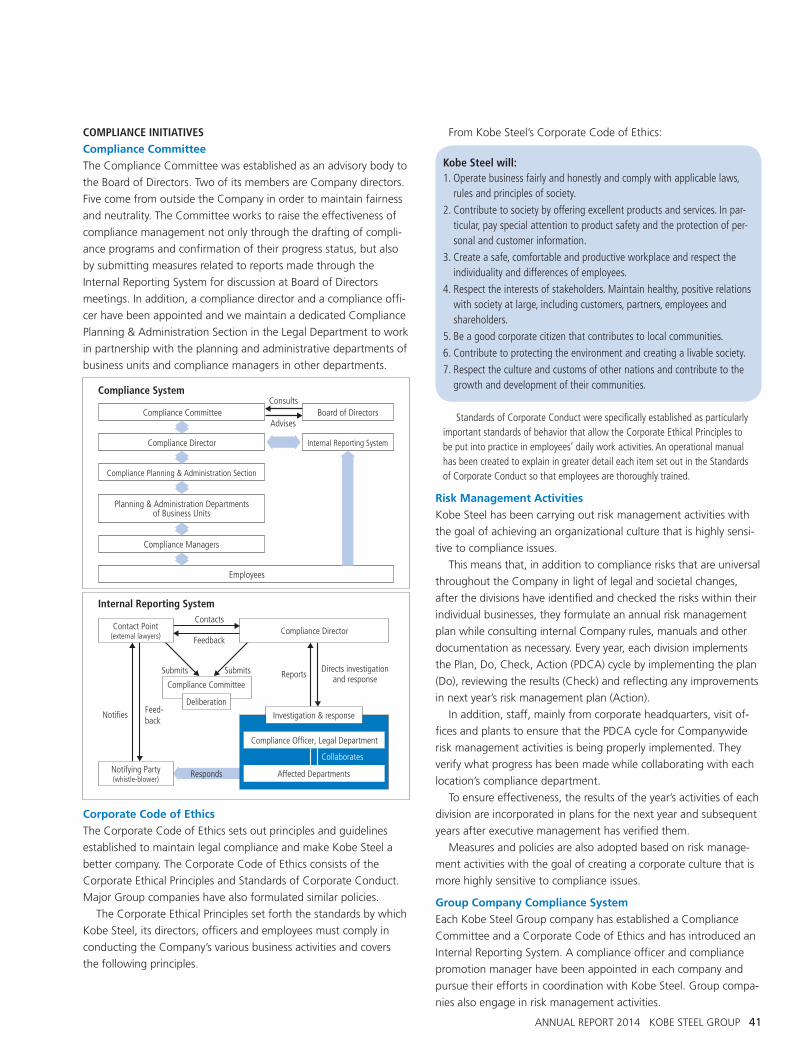
ANNUAL REPORT 2014 KOBE STEEL GROUP 41
From Kobe Steel’s Corporate Code of Ethics:
Risk Management Activities
Kobe Steel has been carrying out risk management activities with
the goal of achieving an organizational culture that is highly sensi-
tive to compliance issues.
This means that, in addition to compliance risks that are universal
throughout the Company in light of legal and societal changes,
after the divisions have identified and checked the risks within their
individual businesses, they formulate an annual risk management
plan while consulting internal Company rules, manuals and other
documentation as necessary. Every year, each division implements
the Plan, Do, Check, Action (PDCA) cycle by implementing the plan
(Do), reviewing the results (Check) and reflecting any improvements
in next year’s risk management plan (Action).
In addition, staff, mainly from corporate headquarters, visit of-
fices and plants to ensure that the PDCA cycle for Companywide
risk management activities is being properly implemented. They
verify what progress has been made while collaborating with each
location’s compliance department.
To ensure effectiveness, the results of the year’s activities of each
division are incorporated in plans for the next year and subsequent
years after executive management has verified them.
Measures and policies are also adopted based on risk manage-
ment activities with the goal of creating a corporate culture that is
more highly sensitive to compliance issues.
Group Company Compliance System
Each Kobe Steel Group company has established a Compliance
Committee and a Corporate Code of Ethics and has introduced an
Internal Reporting System. A compliance officer and compliance
promotion manager have been appointed in each company and
pursue their efforts in coordination with Kobe Steel. Group compa-
nies also engage in risk management activities.
Kobe Steel will:1. Operate business fairly and honestly and comply with applicable laws,
rules and principles of society.
2. Contribute to society by offering excellent products and services. In par-ticular, pay special attention to product safety and the protection of per-sonal and customer information.
3. Create a safe, comfortable and productive workplace and respect the individuality and differences of employees.
4. Respect the interests of stakeholders. Maintain healthy, positive relations with society at large, including customers, partners, employees and shareholders.
5. Be a good corporate citizen that contributes to local communities.
6. Contribute to protecting the environment and creating a livable society.
7. Respect the culture and customs of other nations and contribute to the growth and development of their communities.
Standards of Corporate Conduct were specifically established as particularly important standards of behavior that allow the Corporate Ethical Principles to be put into practice in employees’ daily work activities. An operational manual has been created to explain in greater detail each item set out in the Standards of Corporate Conduct so that employees are thoroughly trained.
COMPLIANCE INITIATIVESCompliance Committee
The Compliance Committee was established as an advisory body to
the Board of Directors. Two of its members are Company directors.
Five come from outside the Company in order to maintain fairness
and neutrality. The Committee works to raise the effectiveness of
compliance management not only through the drafting of compli-
ance programs and confirmation of their progress status, but also
by submitting measures related to reports made through the
Internal Reporting System for discussion at Board of Directors
meetings. In addition, a compliance director and a compliance offi-
cer have been appointed and we maintain a dedicated Compliance
Planning & Administration Section in the Legal Department to work
in partnership with the planning and administrative departments of
business units and compliance managers in other departments.
Corporate Code of Ethics
The Corporate Code of Ethics sets out principles and guidelines
established to maintain legal compliance and make Kobe Steel a
better company. The Corporate Code of Ethics consists of the
Corporate Ethical Principles and Standards of Corporate Conduct.
Major Group companies have also formulated similar policies.
The Corporate Ethical Principles set forth the standards by which
Kobe Steel, its directors, officers and employees must comply in
conducting the Company’s various business activities and covers
the following principles.
Consults
AdvisesCompliance Committee
Compliance Director
Compliance Planning & Administration Section
Planning & Administration Departmentsof Business Units
Board of Directors
Internal Reporting System
Employees
Compliance Managers
Compliance System
Compliance Director
Compliance Officer, Legal Department
Investigation & response
Collaborates
Directs investigationand responseReports
Affected DepartmentsNotifying Party(whistle-blower)
Responds
Contact Point(external lawyers)
Deliberation
Contacts
Feedback
Submits Submits
Notifies Feed-back
Compliance Committee
Internal Reporting System
42 ANNUAL REPORT 2014 KOBE STEEL GROUP
Basic Policies for Parties Affecting Policy Decisions of Kobe
Steel’s Financial and Business Affairs
(hereinafter, “Basic Policies on Corporate Control”)
BASIC POLICY
Kobe Steel, Ltd. (hereinafter, “Kobe Steel” or the “Company”), as
a listed company, naturally accepts, in the course of open stock
trading, large-scale purchases of its shares (hereinafter,“Large-Scale
Purchases” or “Large-Scale Purchasing”) that result in changes in
corporate control if such purchase facilitates the protection and
enhancement of its corporate value and, ultimately, the common
interests of its shareholders.
However, Japanese capital markets have recently witnessed a
number of instances in which corporate shares have been rapidly
purchased on a massive scale without the adequate disclosure of
information to public shareholders or investors. Large-scale purchas-
es or proposals of this type may cause irreparable harm to Kobe
Steel or may not provide its shareholders with needed information
or sufficient time for them to determine whether to accept these
large-scale purchases. Such purchases may harm Kobe Steel’s corpo-
rate value and, ultimately, the common interests of its shareholders.
More specifically, Kobe Steel is engaged in a wide range of busi-
nesses, including in the materials and machinery sectors, and
because the Company has broad business interests, it has numer-
ous stakeholders and many synergies created as a result of its busi-
nesses. Kobe Steel views all of these factors as sources of its
corporate value. Therefore, if Large-Scale Purchasers who lack an
adequate understanding of these stakeholder relationships and
synergies among businesses were to control the finances and the
business policies of Kobe Steel, the corporate value of the
Company and, ultimately, the common interests of its shareholders
could be impaired. Accordingly, Kobe Steel believes that any party
that is to have any influence over its financial and business policy
decisions must be one that fully understands the Company’s man-
agement principles, the sources of its corporate value, and the rela-
tionships of mutual trust it shares with its stakeholders, which are
necessary and indispensable for the enhancement of corporate
value and, ultimately, the common interests of shareholders.
Therefore, such a party must also be able to protect and enhance
Kobe Steel’s corporate value and, ultimately, the common interests
of its shareholders. On the contrary, Kobe Steel views any party
involved in a Large-Scale Purchase or proposal described above to
be an unsuitable party to have influence over its financial and busi-
ness policy decisions.
In light of Kobe Steel’s operating environment—with ever
intensifying international competition—corporate acquisitions are
quite naturally increasing. Therefore, a Large-Scale Purchase of our
stock that materially impacts our management policies is undeni-
ably possible.
On the other hand, in the takeover bid system that would be
used in such Large-Scale Purchases, as long as it is at least based on
the current system, there may be times when shareholders do not
have sufficient information or time to review the relative merits of a
Large-Scale Purchase in order to make a decision.
In light of past large merger and acquisition projects in Japan
and abroad, even when conducted amicably, in many cases it has
taken more than six months to negotiate an agreement. To contrib-
ute to increasing corporate value and, ultimately, the common
interests of shareholders, Large-Scale Purchases, even those that
are undertaken without the prior consent of management, must be
ensured the same time period for information disclosure and exam-
ination and evaluation as is provided in the case of friendly acquisi-
tions. The Company believes that procedures to ensure this are
necessary when shareholders select the party who is to be in con-
trol of determining the Company’s financial and business policies.
With the above in mind, Kobe Steel established the rules out-
lined below.
INITIATIVES TO PREVENT UNSUITABLE PARTIES FROM INFLUENCING
KOBE STEEL’S FINANCIAL AND BUSINESS POLICY DECISIONS IN LIGHT
OF ITS BASIC POLICY ON CORPORATE CONTROL
At the General Meeting of Shareholders held on June 26, 2013,
the following plan (hereinafter, “the Plan”) to prevent Kobe Steel’s
financial and business policies from being controlled by parties
deemed inappropriate was approved.
Overview of the Plan
The Plan stipulates that the following procedures be taken when a
Large-Scale Purchase of the Company’s shares is made.
1. Purpose of the Plan
In the event of a proposed Large-Scale Purchase, i.e., a purchase of
15% or more of Kobe Steel’s stock, the potential Large-Scale
Purchaser is required to provide sufficient information in advance
for the review of all shareholders, who will determine whether or
not to allow the purchase. The Board of Directors will then be given
a period of time to examine and evaluate the proposed Large-Scale
Purchase based on the information provided, and the Large-Scale
Purchase may not be initiated until after the period has elapsed.
2. Establishment of an Independent Committee
To prevent its Board of Directors from making arbitrary judgments
and ensure that procedures under the share purchasing rules
remain objective, fair and reasonable, an Independent Committee
has been established independent from the Board of Directors.
Comprising at least three members, the Independent Committee is
composed of outside attorneys, certified public accountants, tax
accountants, academic experts and outside managers as well as
outside directors of the Company.
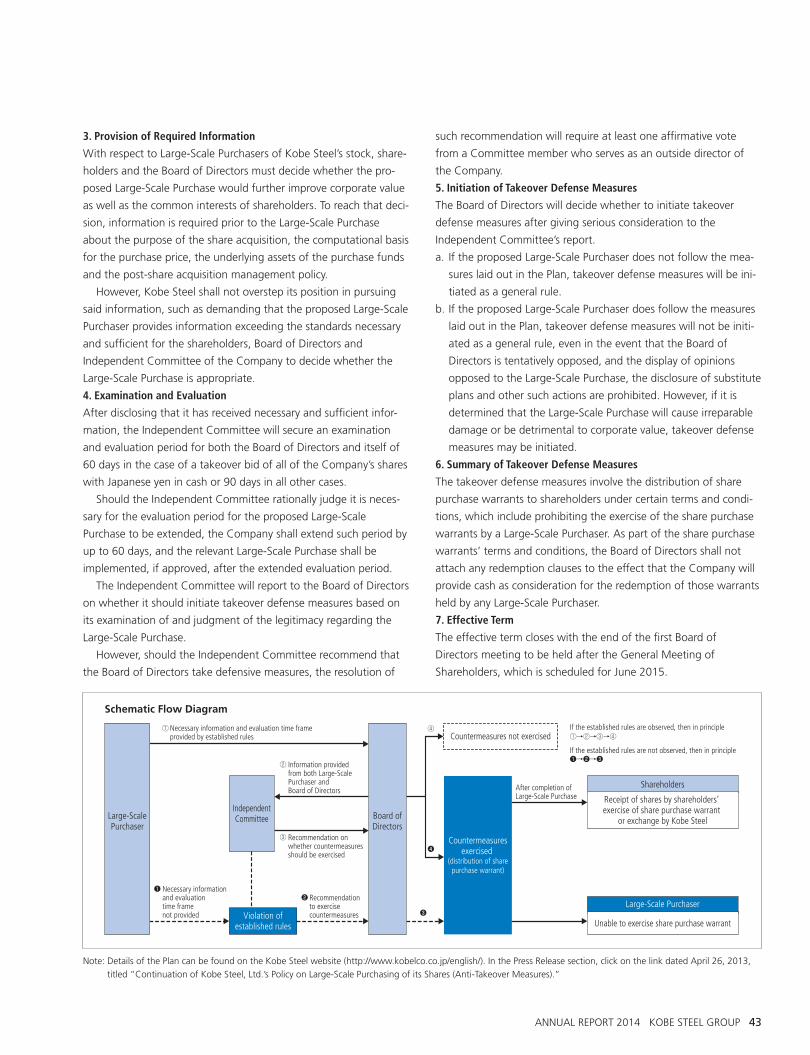
ANNUAL REPORT 2014 KOBE STEEL GROUP 43
3. Provision of Required Information
With respect to Large-Scale Purchasers of Kobe Steel’s stock, share-
holders and the Board of Directors must decide whether the pro-
posed Large-Scale Purchase would further improve corporate value
as well as the common interests of shareholders. To reach that deci-
sion, information is required prior to the Large-Scale Purchase
about the purpose of the share acquisition, the computational basis
for the purchase price, the underlying assets of the purchase funds
and the post-share acquisition management policy.
However, Kobe Steel shall not overstep its position in pursuing
said information, such as demanding that the proposed Large-Scale
Purchaser provides information exceeding the standards necessary
and sufficient for the shareholders, Board of Directors and
Independent Committee of the Company to decide whether the
Large-Scale Purchase is appropriate.
4. Examination and Evaluation
After disclosing that it has received necessary and sufficient infor-
mation, the Independent Committee will secure an examination
and evaluation period for both the Board of Directors and itself of
60 days in the case of a takeover bid of all of the Company’s shares
with Japanese yen in cash or 90 days in all other cases.
Should the Independent Committee rationally judge it is neces-
sary for the evaluation period for the proposed Large-Scale
Purchase to be extended, the Company shall extend such period by
up to 60 days, and the relevant Large-Scale Purchase shall be
implemented, if approved, after the extended evaluation period.
The Independent Committee will report to the Board of Directors
on whether it should initiate takeover defense measures based on
its examination of and judgment of the legitimacy regarding the
Large-Scale Purchase.
However, should the Independent Committee recommend that
the Board of Directors take defensive measures, the resolution of
such recommendation will require at least one affirmative vote
from a Committee member who serves as an outside director of
the Company.
5. Initiation of Takeover Defense Measures
The Board of Directors will decide whether to initiate takeover
defense measures after giving serious consideration to the
Independent Committee’s report.
a. If the proposed Large-Scale Purchaser does not follow the mea-
sures laid out in the Plan, takeover defense measures will be ini-
tiated as a general rule.
b. If the proposed Large-Scale Purchaser does follow the measures
laid out in the Plan, takeover defense measures will not be initi-
ated as a general rule, even in the event that the Board of
Directors is tentatively opposed, and the display of opinions
opposed to the Large-Scale Purchase, the disclosure of substitute
plans and other such actions are prohibited. However, if it is
determined that the Large-Scale Purchase will cause irreparable
damage or be detrimental to corporate value, takeover defense
measures may be initiated.
6. Summary of Takeover Defense Measures
The takeover defense measures involve the distribution of share
purchase warrants to shareholders under certain terms and condi-
tions, which include prohibiting the exercise of the share purchase
warrants by a Large-Scale Purchaser. As part of the share purchase
warrants’ terms and conditions, the Board of Directors shall not
attach any redemption clauses to the effect that the Company will
provide cash as consideration for the redemption of those warrants
held by any Large-Scale Purchaser.
7. Effective Term
The effective term closes with the end of the first Board of
Directors meeting to be held after the General Meeting of
Shareholders, which is scheduled for June 2015.
After completion ofLarge-Scale Purchase
Information providedfrom both Large-Scale Purchaser andBoard of Directors
Recommendation onwhether countermeasuresshould be exercised
Necessary information and evaluation time frameprovided by established rules
Necessary informationand evaluationtime framenot provided
If the established rules are observed, then in principle
If the established rules are not observed, then in principle
Violation ofestablished rules
Large-Scale Purchaser
Unable to exercise share purchase warrant
Shareholders
Receipt of shares by shareholders’ exercise of share purchase warrant
or exchange by Kobe Steel
Countermeasures not exercised
Recommendationto exercisecountermeasures
Large-ScalePurchaser
IndependentCommittee Board of
Directors
Countermeasuresexercised
(distribution of sharepurchase warrant)
Schematic Flow Diagram
Note: Details of the Plan can be found on the Kobe Steel website (http://www.kobelco.co.jp/english/). In the Press Release section, click on the link dated April 26, 2013,
titled “Continuation of Kobe Steel, Ltd.’s Policy on Large-Scale Purchasing of its Shares (Anti-Takeover Measures).”
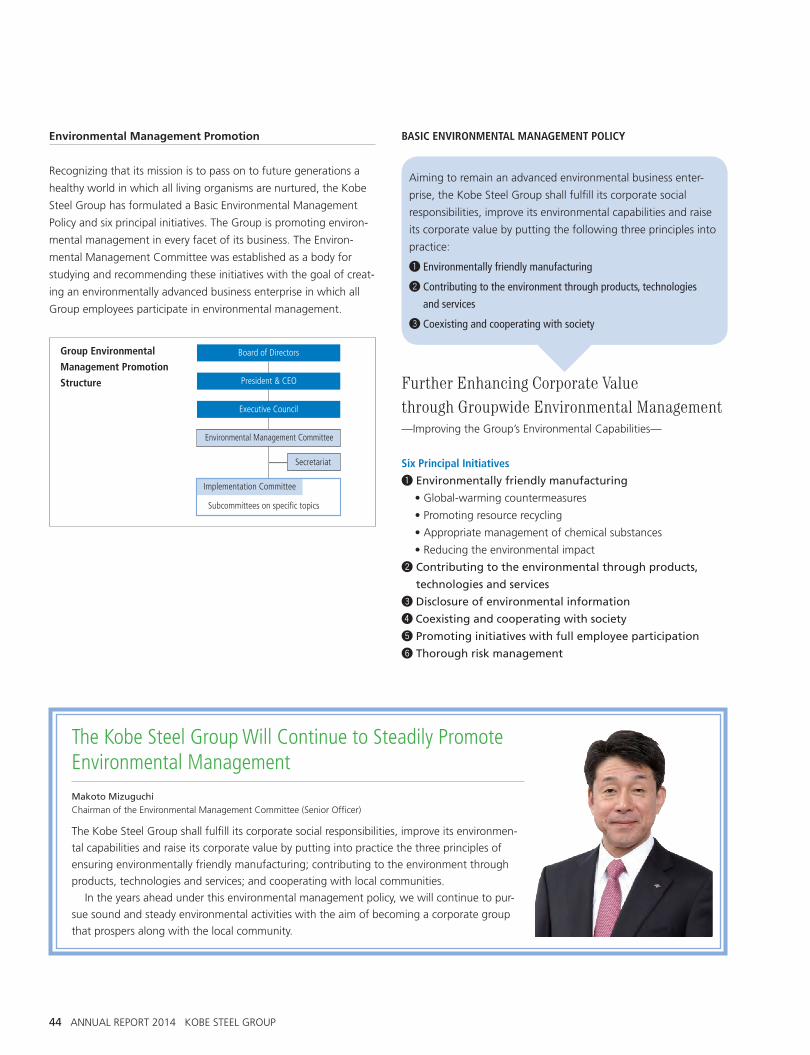
44 ANNUAL REPORT 2014 KOBE STEEL GROUP
BASIC ENVIRONMENTAL MANAGEMENT POLICY
Further Enhancing Corporate Valuethrough Groupwide Environmental Management—Improving the Group’s Environmental Capabilities—
Six Principal Initiatives
1 Environmentally friendly manufacturing
• Global-warming countermeasures
• Promoting resource recycling
• Appropriate management of chemical substances
• Reducing the environmental impact
2 Contributing to the environmental through products,
technologies and services
3 Disclosure of environmental information
4 Coexisting and cooperating with society
5 Promoting initiatives with full employee participation
6 Thorough risk management
Environmental Management Promotion
Recognizing that its mission is to pass on to future generations a
healthy world in which all living organisms are nurtured, the Kobe
Steel Group has formulated a Basic Environmental Management
Policy and six principal initiatives. The Group is promoting environ-
mental management in every facet of its business. The Environ-
mental Management Committee was established as a body for
studying and recommending these initiatives with the goal of creat-
ing an environmentally advanced business enterprise in which all
Group employees participate in environmental management.
Aiming to remain an advanced environmental business enter-
prise, the Kobe Steel Group shall fulfill its corporate social
responsibilities, improve its environmental capabilities and raise
its corporate value by putting the following three principles into
practice:
1 Environmentally friendly manufacturing
2 Contributing to the environment through products, technologies
and services
3 Coexisting and cooperating with society
Board of Directors
President & CEO
Executive Council
Environmental Management Committee
Implementation Committee
Subcommittees on specific topics
Secretariat
Group Environmental
Management Promotion
Structure
The Kobe Steel Group Will Continue to Steadily Promote Environmental ManagementMakoto Mizuguchi Chairman of the Environmental Management Committee (Senior Officer)
The Kobe Steel Group shall fulfill its corporate social responsibilities, improve its environmen-
tal capabilities and raise its corporate value by putting into practice the three principles of
ensuring environmentally friendly manufacturing; contributing to the environment through
products, technologies and services; and cooperating with local communities.
In the years ahead under this environmental management policy, we will continue to pur-
sue sound and steady environmental activities with the aim of becoming a corporate group
that prospers along with the local community.
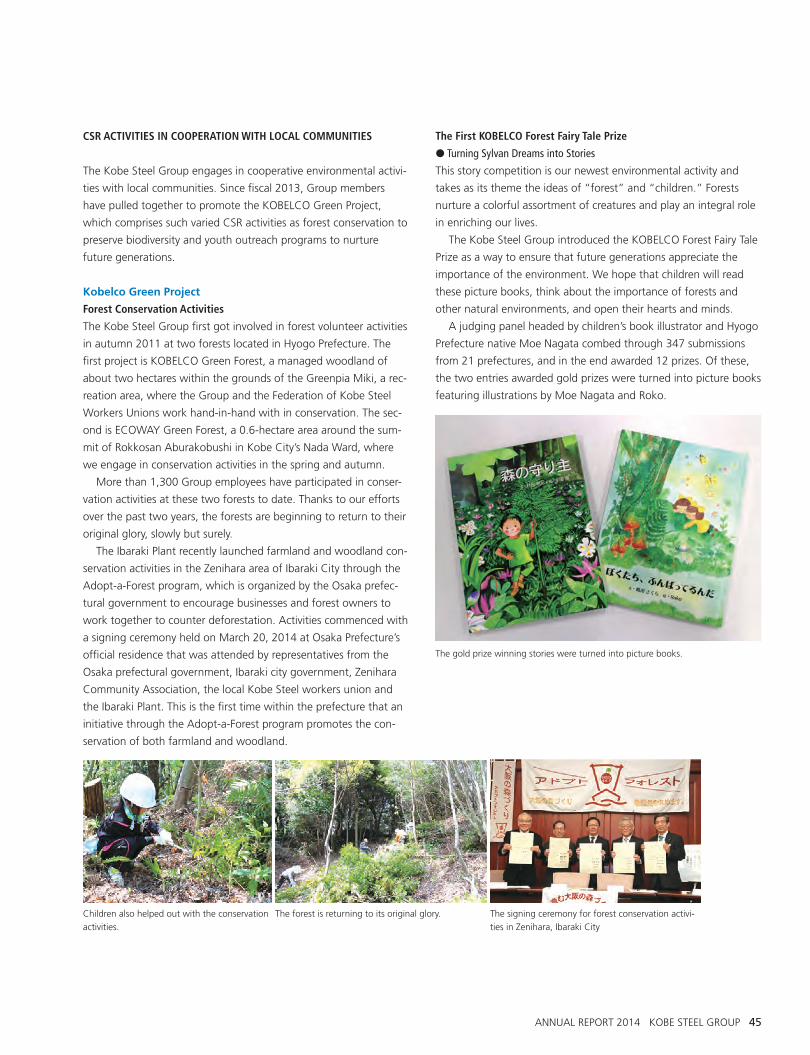
ANNUAL REPORT 2014 KOBE STEEL GROUP 45
CSR ACTIVITIES IN COOPERATION WITH LOCAL COMMUNITIES
The Kobe Steel Group engages in cooperative environmental activi-
ties with local communities. Since fiscal 2013, Group members
have pulled together to promote the KOBELCO Green Project,
which comprises such varied CSR activities as forest conservation to
preserve biodiversity and youth outreach programs to nurture
future generations.
Kobelco Green Project
Forest Conservation Activities
The Kobe Steel Group first got involved in forest volunteer activities
in autumn 2011 at two forests located in Hyogo Prefecture. The
first project is KOBELCO Green Forest, a managed woodland of
about two hectares within the grounds of the Greenpia Miki, a rec-
reation area, where the Group and the Federation of Kobe Steel
Workers Unions work hand-in-hand with in conservation. The sec-
ond is ECOWAY Green Forest, a 0.6-hectare area around the sum-
mit of Rokkosan Aburakobushi in Kobe City’s Nada Ward, where
we engage in conservation activities in the spring and autumn.
More than 1,300 Group employees have participated in conser-
vation activities at these two forests to date. Thanks to our efforts
over the past two years, the forests are beginning to return to their
original glory, slowly but surely.
The Ibaraki Plant recently launched farmland and woodland con-
servation activities in the Zenihara area of Ibaraki City through the
Adopt-a-Forest program, which is organized by the Osaka prefec-
tural government to encourage businesses and forest owners to
work together to counter deforestation. Activities commenced with
a signing ceremony held on March 20, 2014 at Osaka Prefecture’s
official residence that was attended by representatives from the
Osaka prefectural government, Ibaraki city government, Zenihara
Community Association, the local Kobe Steel workers union and
the Ibaraki Plant. This is the first time within the prefecture that an
initiative through the Adopt-a-Forest program promotes the con-
servation of both farmland and woodland.
The First KOBELCO Forest Fairy Tale Prize
P Turning Sylvan Dreams into Stories
This story competition is our newest environmental activity and
takes as its theme the ideas of “forest” and “children.” Forests
nurture a colorful assortment of creatures and play an integral role
in enriching our lives.
The Kobe Steel Group introduced the KOBELCO Forest Fairy Tale
Prize as a way to ensure that future generations appreciate the
importance of the environment. We hope that children will read
these picture books, think about the importance of forests and
other natural environments, and open their hearts and minds.
A judging panel headed by children’s book illustrator and Hyogo
Prefecture native Moe Nagata combed through 347 submissions
from 21 prefectures, and in the end awarded 12 prizes. Of these,
the two entries awarded gold prizes were turned into picture books
featuring illustrations by Moe Nagata and Roko.
The gold prize winning stories were turned into picture books.
Children also helped out with the conservation
activities.
The forest is returning to its original glory. The signing ceremony for forest conservation activi-
ties in Zenihara, Ibaraki City
46 ANNUAL REPORT 2014 KOBE STEEL GROUP
Directors, Audit & Supervisory Board Members and Corporate Officers(At June 25, 2014)
Chairman of the Board and Representative Director
Hiroshi Sato
President, CEO and Representative Director
Hiroya Kawasaki
Head OfficeSenior Managing Director
Naoto Umehara
Managing Director
Yasuaki Sugizaki
Executive Officer
Seiji Okita
Senior Officer
Takafumi Morichi
Officers
Toshiya Miyake
Kazuaki Kawahara
Jiro Kitagawa
Koji Yamamoto
Iron & Steel BusinessExecutive Vice President and Representative Director
Yoshinori Onoe*
Executive Officers
Yukimasa Miyashita
Koji Fujii
Senior Officers
Shinya Miyawaki
Takashi Goto
Makoto Mizuguchi
Koichiro Shibata
Officers
Yasushi Tsushima
Hiroaki Matsubara
Yoshihiro Oka
Welding BusinessSenior Managing Director
Tsuyoshi Kasuya*
Senior Officer
Fusaki Koshiishi
Aluminum & Copper BusinessSenior Managing Director
Akira Kaneko*
Senior Officers
Hiroshi Kato
Takumi Fujii
Machinery BusinessExecutive Vice President and Representative Director
Kazuhide Naraki*
Executive Officer
Takao Ohama
Senior Officers
Mitsugu Yamaguchi
Akio Matsuda
Engineering BusinessExecutive Vice President and Representative Director
Jun Tanaka*
Senior Officers
Shohei Manabe
Kazuto Morisaki
Officer
Hiroshi Ishikawa
Outside DirectorsTakao Kitabata
Hiroshi Ochi
Audit & Supervisory Board MembersHiroaki Fujiwara
Yoshimasa Yamamoto
Shigeo Sasaki**
Takashi Okimoto**
Shinya Sakai**
* Head of the business unit
** Outside Audit & Supervisory Board Member
Financial SectionContents
Consolidated 10-Year Summary 48
Management’s Discussion and Results 50
Business Risks 52
Consolidated Balance Sheets 54
Consolidated Statements of Operations and
Consolidated Statements of Comprehensive Income56
Consolidated Statements of Changes in Net Assets 57
Consolidated Statements of Cash Flows 58
Notes to Consolidated Financial Statements 59
Independent Auditor’s Report 83
ANNUAL REPORT 2014 KOBE STEEL GROUP 47
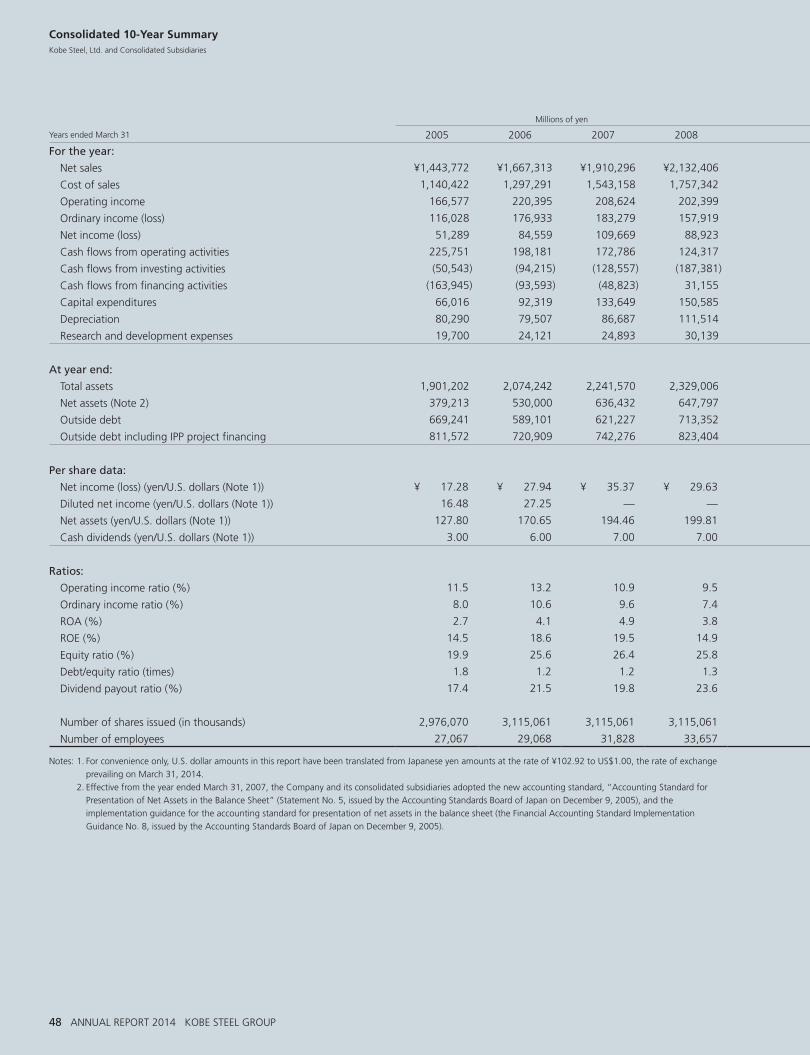
Millions of yen
Millions of yen
Thousands of U.S. dollars (Note 1)
Years ended March 31 2005 2006 2007 2008 2009 2010 2011 2012 2013 2014 Change 2014/2013 2014
For the year:
Net sales ¥1,443,772 ¥1,667,313 ¥1,910,296 ¥2,132,406 ¥2,177,290 ¥1,671,022 ¥1,858,574 ¥1,864,691 ¥1,685,529 ¥1,824,699 8.3% $17,729,290
Cost of sales 1,140,422 1,297,291 1,543,158 1,757,342 1,890,318 1,475,461 1,570,779 1,635,862 1,510,512 1,537,250 1.8 14,936,357
Operating income 166,577 220,395 208,624 202,399 116,934 46,016 124,551 60,555 11,235 114,548 919.6 1,112,984
Ordinary income (loss) 116,028 176,933 183,279 157,919 60,876 10,259 89,083 33,780 (18,146) 85,044 — 826,316
Net income (loss) 51,289 84,559 109,669 88,923 (31,438) 6,305 52,940 (14,248) (26,976) 70,192 — 682,001
Cash flows from operating activities 225,751 198,181 172,786 124,317 118,200 172,893 177,795 39,486 45,402 194,294 327.9 1,887,816
Cash flows from investing activities (50,543) (94,215) (128,557) (187,381) (127,405) (120,324) (96,687) (85,267) (123,513) (62,105) — (603,431)
Cash flows from financing activities (163,945) (93,593) (48,823) 31,155 138,700 (29,641) (98,196) (40,233) 127,644 (138,502) — (1,345,724)
Capital expenditures 66,016 92,319 133,649 150,585 118,044 128,739 91,378 96,085 114,936 101,403 (11.8) 985,256
Depreciation 80,290 79,507 86,687 111,514 128,701 118,835 114,820 118,038 106,725 82,936 (22.3) 805,832
Research and development expenses 19,700 24,121 24,893 30,139 31,029 28,255 29,833 31,437 30,763 28,494 (7.4) 276,858
At year end:
Total assets 1,901,202 2,074,242 2,241,570 2,329,006 2,295,489 2,249,346 2,231,533 2,159,512 2,226,997 2,288,637 2.8 22,237,047
Net assets (Note 2) 379,213 530,000 636,432 647,797 513,461 557,002 597,368 571,258 569,923 734,679 28.9 7,138,351
Outside debt 669,241 589,101 621,227 713,352 855,972 837,770 769,840 746,471 907,657 748,138 (17.6) 7,269,125
Outside debt including IPP project financing 811,572 720,909 742,276 823,404 954,791 925,120 845,484 810,172 959,180 787,246 (17.9) 7,649,108
Per share data:
Net income (loss) (yen/U.S. dollars (Note 1)) ¥ 17.28 ¥ 27.94 ¥ 35.37 ¥ 29.63 ¥ (10.47) ¥ 2.10 ¥ 17.63 ¥ (4.75) ¥ (8.99) ¥ 22.63 — $ 0.22
Diluted net income (yen/U.S. dollars (Note 1)) 16.48 27.25 — — — — — — — — — —
Net assets (yen/U.S. dollars (Note 1)) 127.80 170.65 194.46 199.81 159.58 172.09 182.81 171.84 170.63 184.11 7.9 1.79
Cash dividends (yen/U.S. dollars (Note 1)) 3.00 6.00 7.00 7.00 3.50 1.50 3.00 1.00 — 4.00 — 0.04
Points
Ratios:
Operating income ratio (%) 11.5 13.2 10.9 9.5 5.4 2.8 6.7 3.2 0.7 6.3 5.6
Ordinary income ratio (%) 8.0 10.6 9.6 7.4 2.8 0.6 4.8 1.8 (1.1) 4.7 5.7
ROA (%) 2.7 4.1 4.9 3.8 (1.4) 0.3 2.4 (0.7) (1.2) 3.1 4.3
ROE (%) 14.5 18.6 19.5 14.9 (5.8) 1.3 9.9 (2.7) (5.3) 11.9 17.1
Equity ratio (%) 19.9 25.6 26.4 25.8 20.9 23.0 24.6 23.9 23.0 29.2 6.2
Debt/equity ratio (times) 1.8 1.2 1.2 1.3 1.7 1.6 1.4 1.4 1.8 1.1 (0.7)
Dividend payout ratio (%) 17.4 21.5 19.8 23.6 — 71.4 17.0 — — 17.7 —
Number of shares issued (in thousands) 2,976,070 3,115,061 3,115,061 3,115,061 3,115,061 3,115,061 3,115,061 3,115,061 3,115,061 3,643,642 528,581
Number of employees 27,067 29,068 31,828 33,657 33,526 33,629 34,772 35,496 36,018 36,019 1
Notes: 1. For convenience only, U.S. dollar amounts in this report have been translated from Japanese yen amounts at the rate of ¥102.92 to US$1.00, the rate of exchange
prevailing on March 31, 2014.
2. Effective from the year ended March 31, 2007, the Company and its consolidated subsidiaries adopted the new accounting standard, “Accounting Standard for
Presentation of Net Assets in the Balance Sheet” (Statement No. 5, issued by the Accounting Standards Board of Japan on December 9, 2005), and the
implementation guidance for the accounting standard for presentation of net assets in the balance sheet (the Financial Accounting Standard Implementation
Guidance No. 8, issued by the Accounting Standards Board of Japan on December 9, 2005).
Consolidated 10-Year SummaryKobe Steel, Ltd. and Consolidated Subsidiaries
48 ANNUAL REPORT 2014 KOBE STEEL GROUP
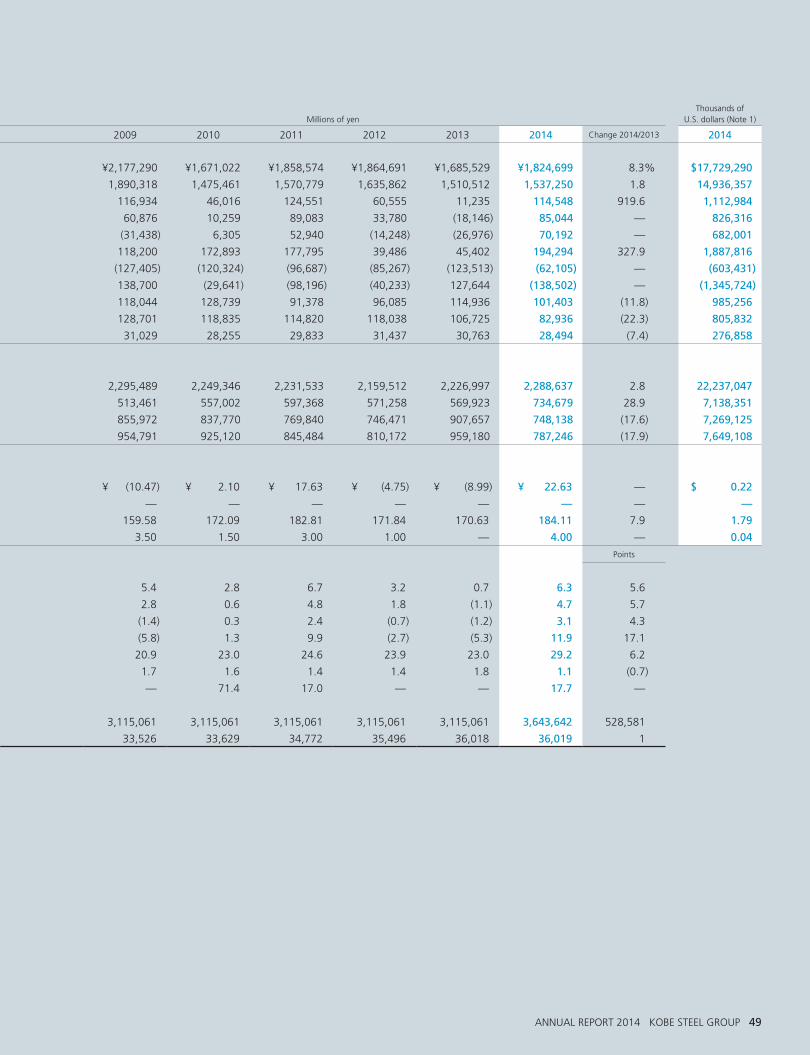
Millions of yen
Millions of yen
Thousands of U.S. dollars (Note 1)
Years ended March 31 2005 2006 2007 2008 2009 2010 2011 2012 2013 2014 Change 2014/2013 2014
For the year:
Net sales ¥1,443,772 ¥1,667,313 ¥1,910,296 ¥2,132,406 ¥2,177,290 ¥1,671,022 ¥1,858,574 ¥1,864,691 ¥1,685,529 ¥1,824,699 8.3% $17,729,290
Cost of sales 1,140,422 1,297,291 1,543,158 1,757,342 1,890,318 1,475,461 1,570,779 1,635,862 1,510,512 1,537,250 1.8 14,936,357
Operating income 166,577 220,395 208,624 202,399 116,934 46,016 124,551 60,555 11,235 114,548 919.6 1,112,984
Ordinary income (loss) 116,028 176,933 183,279 157,919 60,876 10,259 89,083 33,780 (18,146) 85,044 — 826,316
Net income (loss) 51,289 84,559 109,669 88,923 (31,438) 6,305 52,940 (14,248) (26,976) 70,192 — 682,001
Cash flows from operating activities 225,751 198,181 172,786 124,317 118,200 172,893 177,795 39,486 45,402 194,294 327.9 1,887,816
Cash flows from investing activities (50,543) (94,215) (128,557) (187,381) (127,405) (120,324) (96,687) (85,267) (123,513) (62,105) — (603,431)
Cash flows from financing activities (163,945) (93,593) (48,823) 31,155 138,700 (29,641) (98,196) (40,233) 127,644 (138,502) — (1,345,724)
Capital expenditures 66,016 92,319 133,649 150,585 118,044 128,739 91,378 96,085 114,936 101,403 (11.8) 985,256
Depreciation 80,290 79,507 86,687 111,514 128,701 118,835 114,820 118,038 106,725 82,936 (22.3) 805,832
Research and development expenses 19,700 24,121 24,893 30,139 31,029 28,255 29,833 31,437 30,763 28,494 (7.4) 276,858
At year end:
Total assets 1,901,202 2,074,242 2,241,570 2,329,006 2,295,489 2,249,346 2,231,533 2,159,512 2,226,997 2,288,637 2.8 22,237,047
Net assets (Note 2) 379,213 530,000 636,432 647,797 513,461 557,002 597,368 571,258 569,923 734,679 28.9 7,138,351
Outside debt 669,241 589,101 621,227 713,352 855,972 837,770 769,840 746,471 907,657 748,138 (17.6) 7,269,125
Outside debt including IPP project financing 811,572 720,909 742,276 823,404 954,791 925,120 845,484 810,172 959,180 787,246 (17.9) 7,649,108
Per share data:
Net income (loss) (yen/U.S. dollars (Note 1)) ¥ 17.28 ¥ 27.94 ¥ 35.37 ¥ 29.63 ¥ (10.47) ¥ 2.10 ¥ 17.63 ¥ (4.75) ¥ (8.99) ¥ 22.63 — $ 0.22
Diluted net income (yen/U.S. dollars (Note 1)) 16.48 27.25 — — — — — — — — — —
Net assets (yen/U.S. dollars (Note 1)) 127.80 170.65 194.46 199.81 159.58 172.09 182.81 171.84 170.63 184.11 7.9 1.79
Cash dividends (yen/U.S. dollars (Note 1)) 3.00 6.00 7.00 7.00 3.50 1.50 3.00 1.00 — 4.00 — 0.04
Points
Ratios:
Operating income ratio (%) 11.5 13.2 10.9 9.5 5.4 2.8 6.7 3.2 0.7 6.3 5.6
Ordinary income ratio (%) 8.0 10.6 9.6 7.4 2.8 0.6 4.8 1.8 (1.1) 4.7 5.7
ROA (%) 2.7 4.1 4.9 3.8 (1.4) 0.3 2.4 (0.7) (1.2) 3.1 4.3
ROE (%) 14.5 18.6 19.5 14.9 (5.8) 1.3 9.9 (2.7) (5.3) 11.9 17.1
Equity ratio (%) 19.9 25.6 26.4 25.8 20.9 23.0 24.6 23.9 23.0 29.2 6.2
Debt/equity ratio (times) 1.8 1.2 1.2 1.3 1.7 1.6 1.4 1.4 1.8 1.1 (0.7)
Dividend payout ratio (%) 17.4 21.5 19.8 23.6 — 71.4 17.0 — — 17.7 —
Number of shares issued (in thousands) 2,976,070 3,115,061 3,115,061 3,115,061 3,115,061 3,115,061 3,115,061 3,115,061 3,115,061 3,643,642 528,581
Number of employees 27,067 29,068 31,828 33,657 33,526 33,629 34,772 35,496 36,018 36,019 1
Notes: 1. For convenience only, U.S. dollar amounts in this report have been translated from Japanese yen amounts at the rate of ¥102.92 to US$1.00, the rate of exchange
prevailing on March 31, 2014.
2. Effective from the year ended March 31, 2007, the Company and its consolidated subsidiaries adopted the new accounting standard, “Accounting Standard for
Presentation of Net Assets in the Balance Sheet” (Statement No. 5, issued by the Accounting Standards Board of Japan on December 9, 2005), and the
implementation guidance for the accounting standard for presentation of net assets in the balance sheet (the Financial Accounting Standard Implementation
Guidance No. 8, issued by the Accounting Standards Board of Japan on December 9, 2005).
ANNUAL REPORT 2014 KOBE STEEL GROUP 49
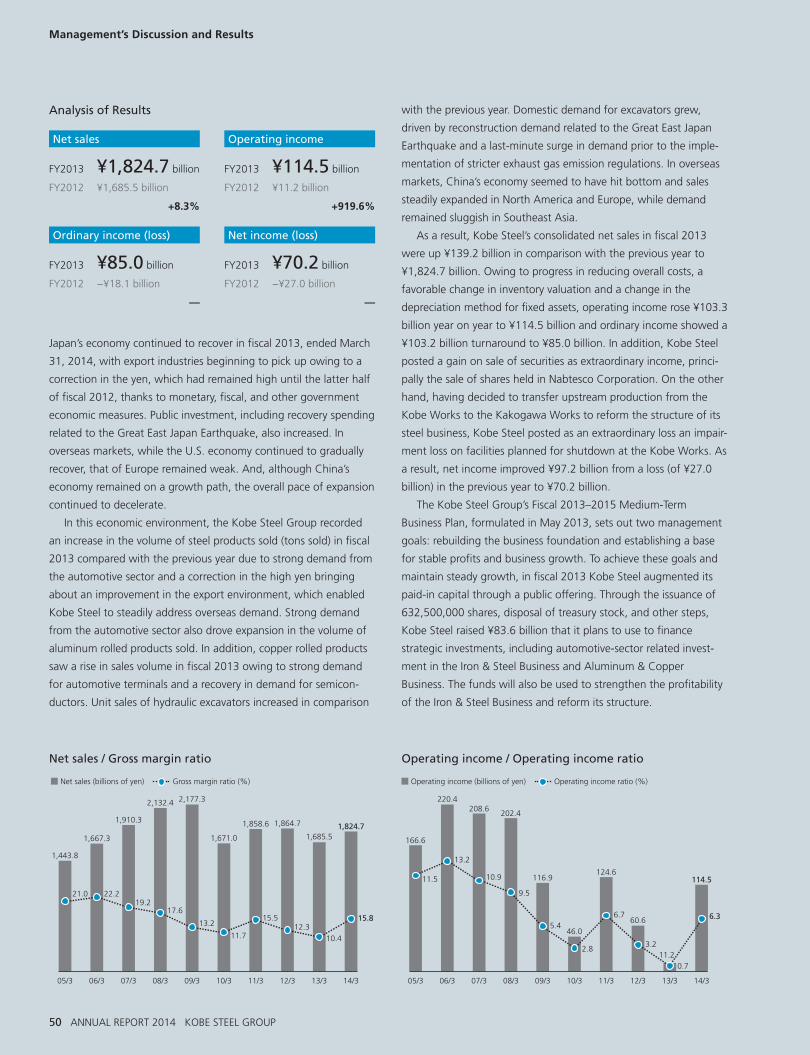
Management’s Discussion and Results
Analysis of Results
Japan’s economy continued to recover in fiscal 2013, ended March
31, 2014, with export industries beginning to pick up owing to a
correction in the yen, which had remained high until the latter half
of fiscal 2012, thanks to monetary, fiscal, and other government
economic measures. Public investment, including recovery spending
related to the Great East Japan Earthquake, also increased. In
overseas markets, while the U.S. economy continued to gradually
recover, that of Europe remained weak. And, although China’s
economy remained on a growth path, the overall pace of expansion
continued to decelerate.
In this economic environment, the Kobe Steel Group recorded
an increase in the volume of steel products sold (tons sold) in fiscal
2013 compared with the previous year due to strong demand from
the automotive sector and a correction in the high yen bringing
about an improvement in the export environment, which enabled
Kobe Steel to steadily address overseas demand. Strong demand
from the automotive sector also drove expansion in the volume of
aluminum rolled products sold. In addition, copper rolled products
saw a rise in sales volume in fiscal 2013 owing to strong demand
for automotive terminals and a recovery in demand for semicon-
ductors. Unit sales of hydraulic excavators increased in comparison
Net sales
FY2013 ¥1,824.7 billion
FY2012 ¥1,685.5 billion
+8.3%
Operating income
FY2013 ¥114.5 billion
FY2012 ¥11.2 billion
+919.6%
Ordinary income (loss)
FY2013 ¥85.0 billion
FY2012 −¥18.1 billion
—
Net income (loss)
FY2013 ¥70.2 billion
FY2012 −¥27.0 billion
—
with the previous year. Domestic demand for excavators grew,
driven by reconstruction demand related to the Great East Japan
Earthquake and a last-minute surge in demand prior to the imple-
mentation of stricter exhaust gas emission regulations. In overseas
markets, China’s economy seemed to have hit bottom and sales
steadily expanded in North America and Europe, while demand
remained sluggish in Southeast Asia.
As a result, Kobe Steel’s consolidated net sales in fiscal 2013
were up ¥139.2 billion in comparison with the previous year to
¥1,824.7 billion. Owing to progress in reducing overall costs, a
favorable change in inventory valuation and a change in the
depreciation method for fixed assets, operating income rose ¥103.3
billion year on year to ¥114.5 billion and ordinary income showed a
¥103.2 billion turnaround to ¥85.0 billion. In addition, Kobe Steel
posted a gain on sale of securities as extraordinary income, princi-
pally the sale of shares held in Nabtesco Corporation. On the other
hand, having decided to transfer upstream production from the
Kobe Works to the Kakogawa Works to reform the structure of its
steel business, Kobe Steel posted as an extraordinary loss an impair-
ment loss on facilities planned for shutdown at the Kobe Works. As
a result, net income improved ¥97.2 billion from a loss (of ¥27.0
billion) in the previous year to ¥70.2 billion.
The Kobe Steel Group’s Fiscal 2013–2015 Medium-Term
Business Plan, formulated in May 2013, sets out two management
goals: rebuilding the business foundation and establishing a base
for stable profits and business growth. To achieve these goals and
maintain steady growth, in fiscal 2013 Kobe Steel augmented its
paid-in capital through a public offering. Through the issuance of
632,500,000 shares, disposal of treasury stock, and other steps,
Kobe Steel raised ¥83.6 billion that it plans to use to finance
strategic investments, including automotive-sector related invest-
ment in the Iron & Steel Business and Aluminum & Copper
Business. The funds will also be used to strengthen the profitability
of the Iron & Steel Business and reform its structure.
05/3 06/3 07/3 08/3 09/3 10/3 11/3 12/3 13/3 14/3
1,910.3
1,667.3
1,443.8
2,132.4 2,177.3
1,864.71,858.6
1,671.0 1,685.51,824.7
19.222.221.0
17.6
13.2 12.315.5
11.7 10.4
15.8
Net sales (billions of yen) Gross margin ratio (%)
05/3 06/3 07/3 08/3 09/3 10/3 11/3 12/3 13/3 14/3
208.6220.4
166.6
202.4
116.9
60.6
124.6
46.0
11.2
114.510.9
13.2
11.5
9.5
5.4
3.2
6.7
2.8
0.7
6.3
Operating income (billions of yen) Operating income ratio (%)
Net sales / Gross margin ratio Operating income / Operating income ratio
50 ANNUAL REPORT 2014 KOBE STEEL GROUP
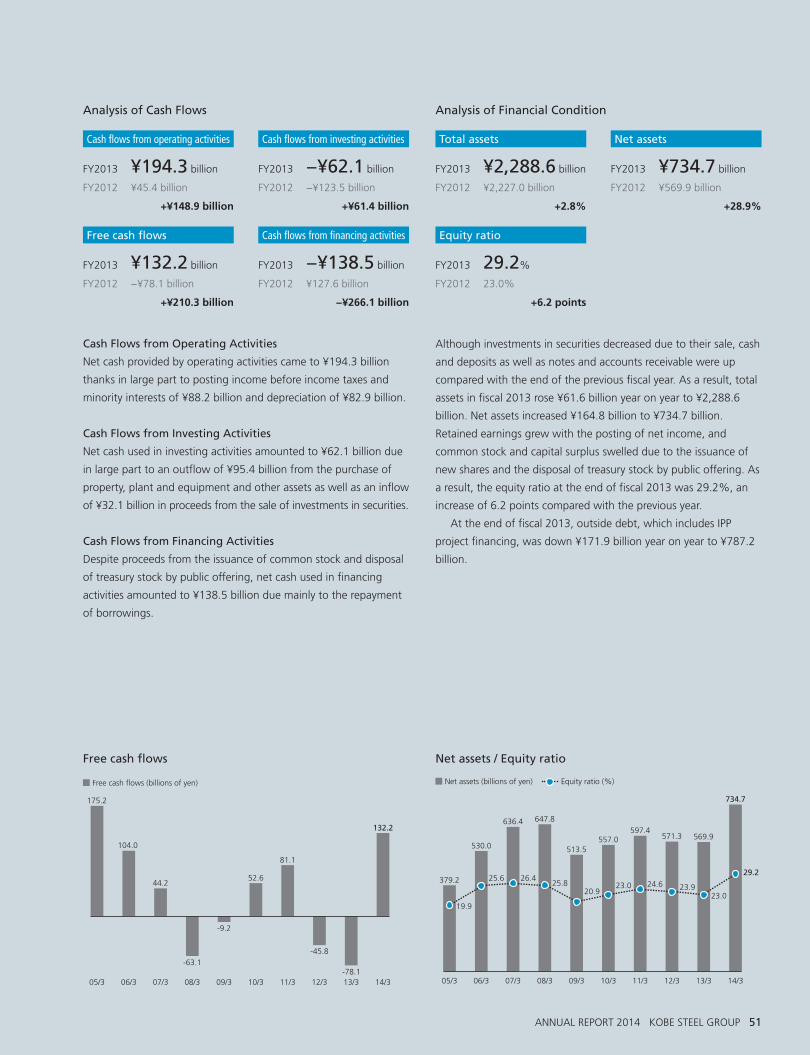
Analysis of Cash Flows
Cash flows from operating activities
FY2013 ¥194.3 billion
FY2012 ¥45.4 billion
+¥148.9 billion
Cash flows from investing activities
FY2013 −¥62.1 billion
FY2012 −¥123.5 billion
+¥61.4 billion
Free cash flows
FY2013 ¥132.2 billion
FY2012 −¥78.1 billion
+¥210.3 billion
Cash flows from financing activities
FY2013 −¥138.5 billion
FY2012 ¥127.6 billion
−¥266.1 billion
Analysis of Financial Condition
Total assets
FY2013 ¥2,288.6 billion
FY2012 ¥2,227.0 billion
+2.8%
Net assets
FY2013 ¥734.7 billion
FY2012 ¥569.9 billion
+28.9%
Equity ratio
FY2013 29.2%
FY2012 23.0%
+6.2 points
Cash Flows from Operating Activities
Net cash provided by operating activities came to ¥194.3 billion
thanks in large part to posting income before income taxes and
minority interests of ¥88.2 billion and depreciation of ¥82.9 billion.
Cash Flows from Investing Activities
Net cash used in investing activities amounted to ¥62.1 billion due
in large part to an outflow of ¥95.4 billion from the purchase of
property, plant and equipment and other assets as well as an inflow
of ¥32.1 billion in proceeds from the sale of investments in securities.
Cash Flows from Financing Activities
Despite proceeds from the issuance of common stock and disposal
of treasury stock by public offering, net cash used in financing
activities amounted to ¥138.5 billion due mainly to the repayment
of borrowings.
Although investments in securities decreased due to their sale, cash
and deposits as well as notes and accounts receivable were up
compared with the end of the previous fiscal year. As a result, total
assets in fiscal 2013 rose ¥61.6 billion year on year to ¥2,288.6
billion. Net assets increased ¥164.8 billion to ¥734.7 billion.
Retained earnings grew with the posting of net income, and
common stock and capital surplus swelled due to the issuance of
new shares and the disposal of treasury stock by public offering. As
a result, the equity ratio at the end of fiscal 2013 was 29.2%, an
increase of 6.2 points compared with the previous year.
At the end of fiscal 2013, outside debt, which includes IPP
project financing, was down ¥171.9 billion year on year to ¥787.2
billion.
Free cash flows Net assets / Equity ratio
05/3 06/3 07/3 08/3 09/3 10/3 11/3 12/3 13/3 14/3
44.2
104.0
175.2
-63.1
-9.2
-45.8
81.1
52.6
-78.1
132.2
Free cash flows (billions of yen)
05/3 06/3 07/3 08/3 09/3 10/3 11/3 12/3 13/3 14/3
636.4
530.0
379.2
647.8
513.5
571.3597.4
557.0 569.9
734.7
26.425.6
19.9
25.820.9 23.924.623.0
23.0
29.2
Net assets (billions of yen) Equity ratio (%)
ANNUAL REPORT 2014 KOBE STEEL GROUP 51
Business Risks
Discussed below are a number of factors affecting the business and
financial situation of the Kobe Steel Group encompasses that could
have a material impact on investor decisions. Furthermore, forward-
looking statements in this text represent decisions made by the Kobe
Steel Group at the end of the fiscal year ended March 31, 2014.
1. Economic Conditions in Key Markets
Automobiles, shipbuilding, electrical machinery, construction and
civil engineering, IT, beverage containers and industrial machinery
constitute the principal areas contributing to the Kobe Steel Group’s
domestic sales. In the fiscal year ended March 31, 2014, overseas
sales represented 35.4% of total sales, with Asia, including
China—the largest single source of demand in the region—
accounting for over half of overseas sales.
The Kobe Steel Group’s performance is therefore affected by
demand trends in these fields, regional economic conditions and
other factors. In addition, political and social trends, difficulties in
supervising and regulating local businesses, and labor issues as well
as changes in customs duties, import and export regulations, trade
and taxes, and other statutory regulations could affect the Kobe
Steel Group’s performance.
Moreover, domestic and foreign companies in each of its prod-
uct markets present the Kobe Steel Group with intense competi-
tion, which could affect the Group’s performance if competitors
were to develop products with superior performance or quickly put
out new products.
2. Fluctuations in Steel Volume and Prices
The volume and price of steel sold by the Kobe Steel Group are
affected by trends in domestic and overseas demand as well as
global steel supply and demand and market conditions.
Domestic steel sales are broadly divided between contract sales,
for which product volume and specifications are directly negotiated
with customers before shipment, and spot sales of products that
are shipped for use by unspecified customers. Nearly all of Kobe
Steel’s sales are of the contract variety. Spot sales prices are more
sensitive to fluctuations in the supply and demand balance,
although contract sales prices are also eventually affected. In
addition, the sales volume and price of steel exports, which com-
prise about 30% of steel shipments, are affected by regional
variations in the balance of supply and demand. Fluctuations in
steel shipments and prices could affect the Kobe Steel Group’s
performance.
3. Fluctuating Prices of Raw Materials
Steel raw material prices and ocean freight charges for iron ore,
coal, ferroalloys, nonferrous metals and scrap procured by the Kobe
Steel Group are affected by global market conditions, exchange
rates, statutory regulations, natural disasters, political trends and
other factors. Fluctuations in these prices and charges could affect
the Kobe Steel Group’s performance.
Because a limited number of suppliers and countries around the
world produce iron ore and coking coal in particular, global market
conditions tend to be strongly affected by the balance of supply
and demand.
In the Aluminum & Copper segment, fluctuations in aluminum
and copper ingot prices are passed on to customers in the product
prices. Nevertheless, when the spot prices of aluminum and copper
ingots fluctuate wildly over the short term, the Kobe Steel Group’s
performance could be temporarily affected by inventory valuations.
The Kobe Steel Group procures sub-materials, including refrac-
tory products, and capital investment-related materials as well as
materials for electrical components, hydraulic equipment and
internal combustion engines. Fluctuations in prices for these
materials and equipment could affect the Kobe Steel Group’s
performance.
In addition, significant changes in the above-mentioned raw
material prices or the trading relationships with the suppliers of
these materials and equipment could also affect the Kobe Steel
Group’s performance.
4. Impact of Environmental Regulations
Waste and byproducts arise during the production process, espe-
cially in the Iron & Steel and Aluminum & Copper segments.
Although the Kobe Steel Group makes every effort to comply with
domestic and foreign environmental regulations, expenditures
could arise because of stricter regulations and other factors, includ-
ing requirements to clean up contaminated soil at old factory sites
that have already been sold.
If production restraints and taxes are imposed on such emissions
as carbon dioxide, this would restrict the business activities of the
Kobe Steel Group, especially in the Iron & Steel segment, and could
affect the Kobe Steel Group’s performance.
5. Impact on Operations due to Accidents,
Natural Disasters, etc.
The production equipment of the Kobe Steel Group includes
equipment that is operated at high temperatures and pressures,
such as blast furnaces and basic oxygen furnaces used for iron and
steel production. The Group also has factories that handle materials
and chemicals under high-temperature conditions. The Kobe Steel
Group takes every possible measure to prevent accidents that could
affect people or property. Nevertheless, should a serious accident
occur, production activities could be hindered and the Kobe Steel
Group’s performance could be affected.
If a natural disaster such as a massive earthquake or typhoon
were to strike, an infectious disease such as a new strain of influ-
enza were to spread or some other unpredictable situation were to
52 ANNUAL REPORT 2014 KOBE STEEL GROUP
occur, these events could hinder operations and affect the Kobe
Steel Group’s performance.
6. Litigation Risks
The Kobe Steel Group’s business activities span a wide range of
fields in Japan and abroad. In carrying out these activities, the Kobe
Steel Group strives to observe applicable laws, regulations and
social norms, and is guided by business practices that are sound,
fair and impartial. Nevertheless, whether or not there has been a
violation of a law or regulation by a Kobe Steel Group company or
employee, a lawsuit or other litigation could be filed in relation to
product liability laws and intellectual property rights. Fines could be
handed down for violating said law and could, as a result, affect
the Group’s performance or reputation. In addition, the Kobe Steel
Group may be unable to legally protect its technology and know-
how in accordance with intellectual property laws, which could
affect the Group’s performance.
7. Financial Risk
(1) Exchange Rate Fluctuations
Foreign currency denominated transactions of the Kobe Steel Group
are primarily U.S. dollar-based, with U.S. dollar-based transactions
showing an import surplus in the fiscal year under review. As a
short-term measure to protect against fluctuations in exchange
rates, the Kobe Steel Group has taken out foreign exchange
contracts. However, because of the difficulties in totally eliminating
volatility risks, foreign exchange fluctuations could affect the Kobe
Steel Group’s performance.
(2) Interest Rate Fluctuations
Total outside debt for the Kobe Steel Group at March 31, 2014
stood at ¥748.1 billion (¥787.2 billion, including project financing
related to the wholesale power supply business). Fluctuations in
interest rates and other terms of this debt, new borrowings and
corporate bonds, etc., could, due to changing financial conditions
and other factors, affect the Group’s performance.
(3) Decline in Value of Inventories
If the asset value of inventories held by the Group were to decline
due to decreased profitability, this could affect the Kobe Steel
Group’s performance.
(4) Fluctuating Prices of Investment Securities
At March 31, 2014, the consolidated balance sheet amount for
investment securities held by the Kobe Steel Group stood at ¥179.6
billion. Fluctuations in the prices of investment securities associated
with changes in the share prices of listed shares could affect the
Kobe Steel Group’s performance.
Furthermore, actuarial differences could arise in the calculation of
liability for severance and retirement benefits due to fluctuations in
the share prices of listed shares, which are included in pension
funds, and affect the Kobe Steel Group’s performance.
(5) Recording of Deferred Income Taxes
With respect to deferred income taxes, future taxable income is
reasonably estimated and collectability is determined and then
recorded. Nevertheless, if significant changes arise, such as changes
in the estimate of future taxable income, deferred income taxes
could be reversed and this could affect the Group’s performance.
(6) Decline in Value of Fixed Assets
If the value of fixed assets held by the Group declines due to
decreased market value or decreased profitability, this could affect
the Kobe Steel Group’s performance.
8. Medium-Term Business Plan
The Kobe Steel Group unveiled its Medium-Term Business Plan in
May 2013. The assumptions set out in the plan, including the market
conditions and exchange rates in certain growth fields and regions,
could differ from reality and, depending on the degree to which
they differ, it may not be possible to execute the plan as originally
expected. There is also the possibility that the Kobe Steel Group will
be unable to successfully carry out the initiatives outlined in the
plan, including strengthening the profitability of the steel business,
strategically growing the machinery-related businesses and expand-
ing the power supply business. In addition, while the Kobe Steel
Group is promoting business alliances and joint ventures with
overseas companies, these endeavors may not go smoothly as there
may be difficulty in providing services or developing products and
the synergistic effects originally envisioned may not come to fruition.
It is also possible that the Kobe Steel Group will not secure the
future business opportunities it originally foresaw.
Furthermore, the financial condition and business performance of
the Kobe Steel Group could be affected by events other than those
mentioned above that could not be anticipated at March 31, 2014.
ANNUAL REPORT 2014 KOBE STEEL GROUP 53
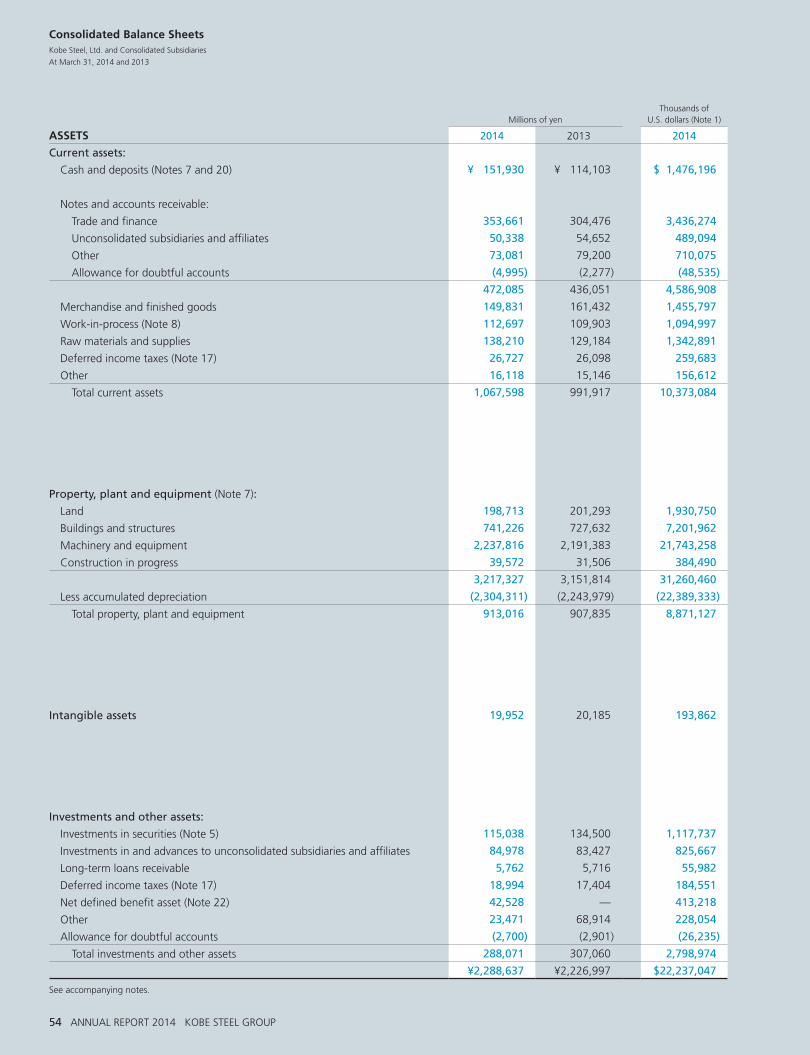
Consolidated Balance SheetsKobe Steel, Ltd. and Consolidated Subsidiaries
At March 31, 2014 and 2013
Millions of yen
Thousands of U.S. dollars (Note 1)
ASSETS 2014 2013 2014
Current assets:
Cash and deposits (Notes 7 and 20) ¥ 151,930 ¥ 114,103 $ 1,476,196
Notes and accounts receivable:
Trade and finance 353,661 304,476 3,436,274
Unconsolidated subsidiaries and affiliates 50,338 54,652 489,094
Other 73,081 79,200 710,075
Allowance for doubtful accounts (4,995) (2,277) (48,535)
472,085 436,051 4,586,908
Merchandise and finished goods 149,831 161,432 1,455,797
Work-in-process (Note 8) 112,697 109,903 1,094,997
Raw materials and supplies 138,210 129,184 1,342,891
Deferred income taxes (Note 17) 26,727 26,098 259,683
Other 16,118 15,146 156,612
Total current assets 1,067,598 991,917 10,373,084
Property, plant and equipment (Note 7):
Land 198,713 201,293 1,930,750
Buildings and structures 741,226 727,632 7,201,962
Machinery and equipment 2,237,816 2,191,383 21,743,258
Construction in progress 39,572 31,506 384,490
3,217,327 3,151,814 31,260,460
Less accumulated depreciation (2,304,311) (2,243,979) (22,389,333)
Total property, plant and equipment 913,016 907,835 8,871,127
Intangible assets 19,952 20,185 193,862
Investments and other assets:
Investments in securities (Note 5) 115,038 134,500 1,117,737
Investments in and advances to unconsolidated subsidiaries and affiliates 84,978 83,427 825,667
Long-term loans receivable 5,762 5,716 55,982
Deferred income taxes (Note 17) 18,994 17,404 184,551
Net defined benefit asset (Note 22) 42,528 — 413,218
Other 23,471 68,914 228,054
Allowance for doubtful accounts (2,700) (2,901) (26,235)
Total investments and other assets 288,071 307,060 2,798,974
¥2,288,637 ¥2,226,997 $22,237,047
See accompanying notes.
54 ANNUAL REPORT 2014 KOBE STEEL GROUP
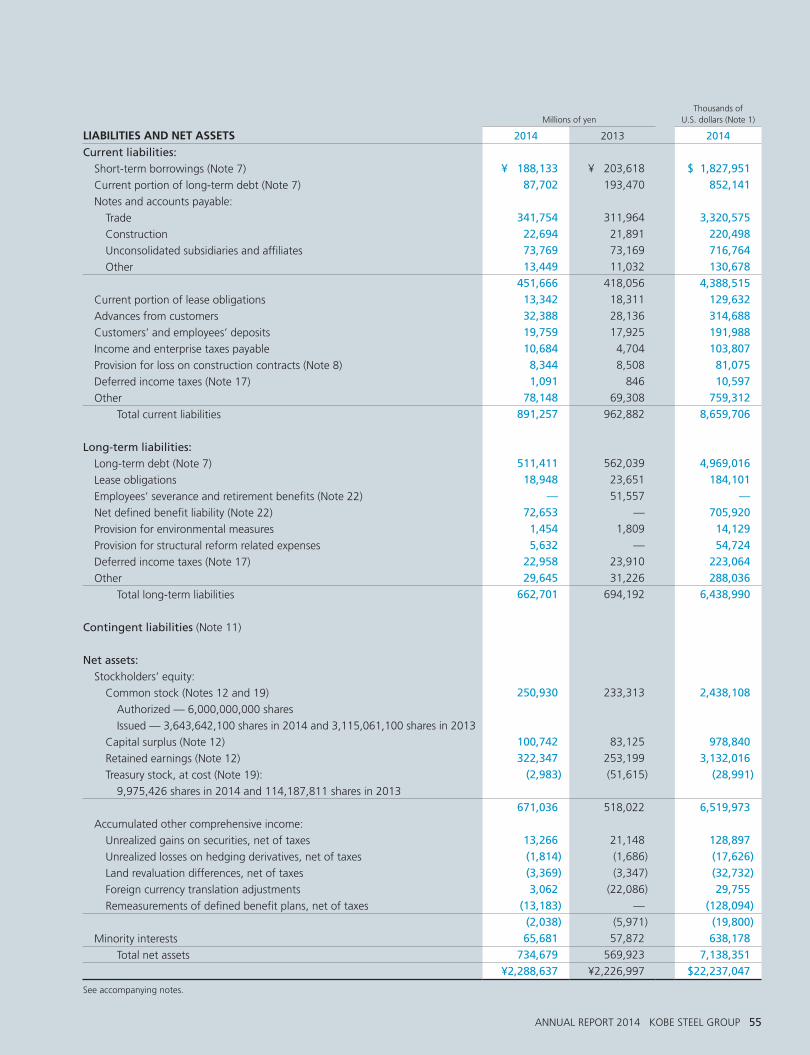
Millions of yen
Thousands of U.S. dollars (Note 1)
LIABILITIES AND NET ASSETS 2014 2013 2014
Current liabilities:
Short-term borrowings (Note 7) ¥ 188,133 ¥ 203,618 $ 1,827,951
Current portion of long-term debt (Note 7) 87,702 193,470 852,141
Notes and accounts payable:
Trade 341,754 311,964 3,320,575
Construction 22,694 21,891 220,498
Unconsolidated subsidiaries and affiliates 73,769 73,169 716,764
Other 13,449 11,032 130,678
451,666 418,056 4,388,515
Current portion of lease obligations 13,342 18,311 129,632
Advances from customers 32,388 28,136 314,688
Customers’ and employees’ deposits 19,759 17,925 191,988
Income and enterprise taxes payable 10,684 4,704 103,807
Provision for loss on construction contracts (Note 8) 8,344 8,508 81,075
Deferred income taxes (Note 17) 1,091 846 10,597
Other 78,148 69,308 759,312
Total current liabilities 891,257 962,882 8,659,706
Long-term liabilities:
Long-term debt (Note 7) 511,411 562,039 4,969,016
Lease obligations 18,948 23,651 184,101
Employees’ severance and retirement benefits (Note 22) — 51,557 —
Net defined benefit liability (Note 22) 72,653 — 705,920
Provision for environmental measures 1,454 1,809 14,129
Provision for structural reform related expenses 5,632 — 54,724
Deferred income taxes (Note 17) 22,958 23,910 223,064
Other 29,645 31,226 288,036
Total long-term liabilities 662,701 694,192 6,438,990
Contingent liabilities (Note 11)
Net assets:
Stockholders’ equity:
Common stock (Notes 12 and 19) 250,930 233,313 2,438,108
Authorized — 6,000,000,000 shares
Issued — 3,643,642,100 shares in 2014 and 3,115,061,100 shares in 2013
Capital surplus (Note 12) 100,742 83,125 978,840
Retained earnings (Note 12) 322,347 253,199 3,132,016
Treasury stock, at cost (Note 19): (2,983) (51,615) (28,991)
9,975,426 shares in 2014 and 114,187,811 shares in 2013
671,036 518,022 6,519,973
Accumulated other comprehensive income:
Unrealized gains on securities, net of taxes 13,266 21,148 128,897
Unrealized losses on hedging derivatives, net of taxes (1,814) (1,686) (17,626)
Land revaluation differences, net of taxes (3,369) (3,347) (32,732)
Foreign currency translation adjustments 3,062 (22,086) 29,755
Remeasurements of defined benefit plans, net of taxes (13,183) — (128,094)
(2,038) (5,971) (19,800)
Minority interests 65,681 57,872 638,178
Total net assets 734,679 569,923 7,138,351
¥2,288,637 ¥2,226,997 $22,237,047
See accompanying notes.
ANNUAL REPORT 2014 KOBE STEEL GROUP 55
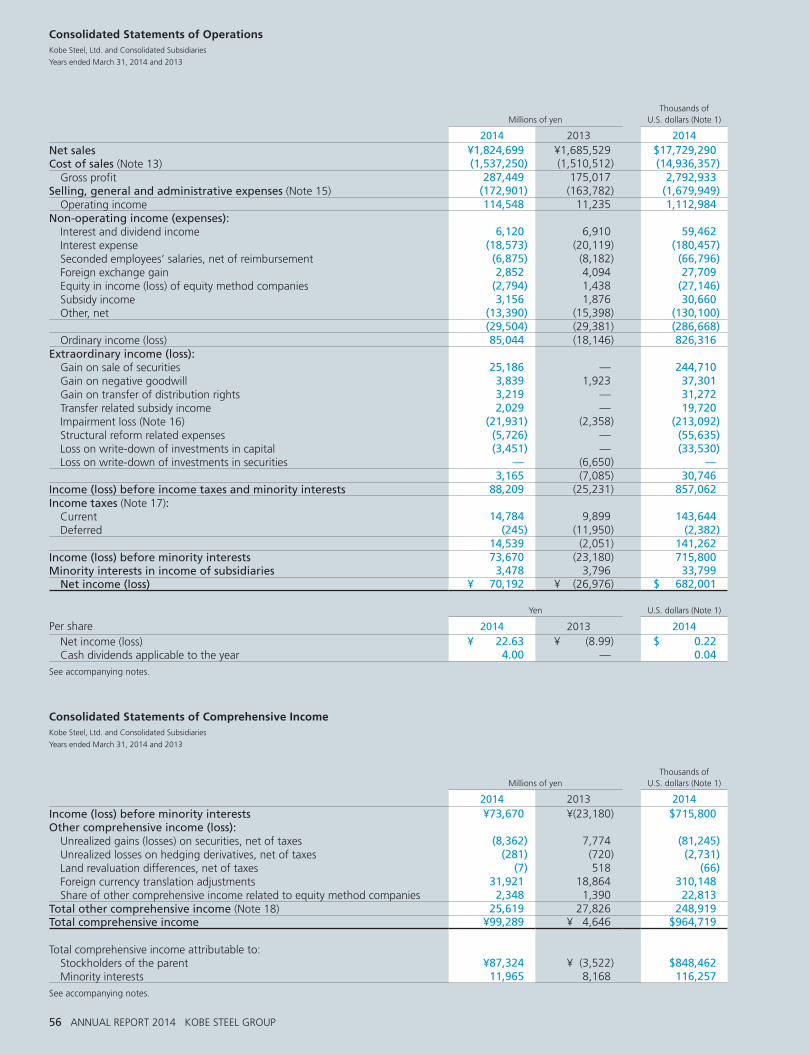
Consolidated Statements of OperationsKobe Steel, Ltd. and Consolidated Subsidiaries
Years ended March 31, 2014 and 2013
Millions of yen
Thousands of U.S. dollars (Note 1)
2014 2013 2014Net sales ¥1,824,699 ¥1,685,529 $17,729,290Cost of sales (Note 13) (1,537,250) (1,510,512) (14,936,357) Gross profit 287,449 175,017 2,792,933Selling, general and administrative expenses (Note 15) (172,901) (163,782) (1,679,949) Operating income 114,548 11,235 1,112,984Non-operating income (expenses): Interest and dividend income 6,120 6,910 59,462 Interest expense (18,573) (20,119) (180,457) Seconded employees’ salaries, net of reimbursement (6,875) (8,182) (66,796) Foreign exchange gain 2,852 4,094 27,709 Equity in income (loss) of equity method companies (2,794) 1,438 (27,146) Subsidy income 3,156 1,876 30,660 Other, net (13,390) (15,398) (130,100)
(29,504) (29,381) (286,668) Ordinary income (loss) 85,044 (18,146) 826,316Extraordinary income (loss): Gain on sale of securities 25,186 — 244,710 Gain on negative goodwill 3,839 1,923 37,301 Gain on transfer of distribution rights 3,219 — 31,272 Transfer related subsidy income 2,029 — 19,720 Impairment loss (Note 16) (21,931) (2,358) (213,092) Structural reform related expenses (5,726) — (55,635) Loss on write-down of investments in capital (3,451) — (33,530) Loss on write-down of investments in securities — (6,650) —
3,165 (7,085) 30,746Income (loss) before income taxes and minority interests 88,209 (25,231) 857,062Income taxes (Note 17): Current 14,784 9,899 143,644 Deferred (245) (11,950) (2,382)
14,539 (2,051) 141,262Income (loss) before minority interests 73,670 (23,180) 715,800Minority interests in income of subsidiaries 3,478 3,796 33,799 Net income (loss) ¥ 70,192 ¥ (26,976) $ 682,001
Yen
U.S. dollars (Note 1)
Per share 2014 2013 2014 Net income (loss) ¥ 22.63 ¥ (8.99) $ 0.22 Cash dividends applicable to the year 4.00 — 0.04See accompanying notes.
Consolidated Statements of Comprehensive IncomeKobe Steel, Ltd. and Consolidated Subsidiaries
Years ended March 31, 2014 and 2013
Millions of yen
Thousands of U.S. dollars (Note 1)
2014 2013 2014Income (loss) before minority interests ¥73,670 ¥(23,180) $715,800Other comprehensive income (loss): Unrealized gains (losses) on securities, net of taxes (8,362) 7,774 (81,245) Unrealized losses on hedging derivatives, net of taxes (281) (720) (2,731) Land revaluation differences, net of taxes (7) 518 (66) Foreign currency translation adjustments 31,921 18,864 310,148 Share of other comprehensive income related to equity method companies 2,348 1,390 22,813Total other comprehensive income (Note 18) 25,619 27,826 248,919Total comprehensive income ¥99,289 ¥ 4,646 $964,719
Total comprehensive income attributable to: Stockholders of the parent ¥87,324 ¥ (3,522) $848,462 Minority interests 11,965 8,168 116,257See accompanying notes.
56 ANNUAL REPORT 2014 KOBE STEEL GROUP
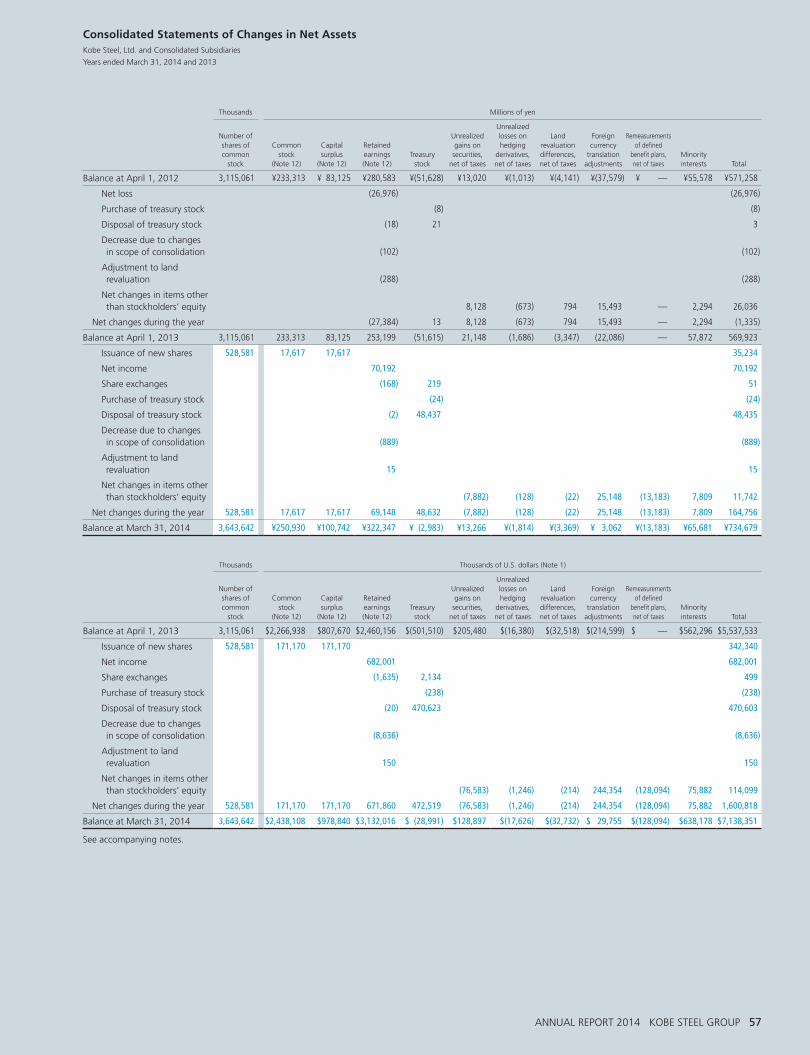
Consolidated Statements of Changes in Net AssetsKobe Steel, Ltd. and Consolidated Subsidiaries
Years ended March 31, 2014 and 2013
Thousands Millions of yen
Number of shares of common
stock
Common stock
(Note 12)
Capital surplus
(Note 12)
Retained earnings (Note 12)
Treasury stock
Unrealized gains on securities,
net of taxes
Unrealized losses on hedging
derivatives, net of taxes
Land
revaluation differences, net of taxes
Foreign currency
translation adjustments
Remeasurements
of defined benefit plans, net of taxes
Minority interests
Total
Balance at April 1, 2012 3,115,061 ¥233,313 ¥ 83,125 ¥280,583 ¥(51,628) ¥13,020 ¥(1,013) ¥(4,141) ¥(37,579) ¥ — ¥55,578 ¥571,258
Net loss (26,976) (26,976)
Purchase of treasury stock (8) (8)
Disposal of treasury stock (18) 21 3
Decrease due to changes in scope of consolidation
(102)
(102)
Adjustment to land revaluation
(288)
(288)
Net changes in items other than stockholders’ equity
8,128
(673)
794
15,493
—
2,294
26,036
Net changes during the year (27,384) 13 8,128 (673) 794 15,493 — 2,294 (1,335)
Balance at April 1, 2013 3,115,061 233,313 83,125 253,199 (51,615) 21,148 (1,686) (3,347) (22,086) — 57,872 569,923
Issuance of new shares 528,581 17,617 17,617 35,234
Net income 70,192 70,192
Share exchanges (168) 219 51
Purchase of treasury stock (24) (24)
Disposal of treasury stock (2) 48,437 48,435
Decrease due to changes in scope of consolidation
(889)
(889)
Adjustment to land revaluation
15
15
Net changes in items other than stockholders’ equity
(7,882)
(128)
(22)
25,148
(13,183)
7,809
11,742
Net changes during the year 528,581 17,617 17,617 69,148 48,632 (7,882) (128) (22) 25,148 (13,183) 7,809 164,756
Balance at March 31, 2014 3,643,642 ¥250,930 ¥100,742 ¥322,347 ¥ (2,983) ¥13,266 ¥(1,814) ¥(3,369) ¥ 3,062 ¥(13,183) ¥65,681 ¥734,679
Thousands Thousands of U.S. dollars (Note 1)
Number of shares of common
stock
Common stock
(Note 12)
Capital surplus
(Note 12)
Retained earnings (Note 12)
Treasury stock
Unrealized gains on securities,
net of taxes
Unrealized losses on hedging
derivatives, net of taxes
Land
revaluation differences, net of taxes
Foreign currency
translation adjustments
Remeasurements
of defined benefit plans, net of taxes
Minority interests
Total
Balance at April 1, 2013 3,115,061 $2,266,938 $807,670 $2,460,156 $(501,510) $205,480 $(16,380) $(32,518) $(214,599) $ — $562,296 $5,537,533
Issuance of new shares 528,581 171,170 171,170 342,340
Net income 682,001 682,001
Share exchanges (1,635) 2,134 499
Purchase of treasury stock (238) (238)
Disposal of treasury stock (20) 470,623 470,603
Decrease due to changes in scope of consolidation
(8,636)
(8,636)
Adjustment to land revaluation
150
150
Net changes in items other than stockholders’ equity
(76,583)
(1,246)
(214)
244,354
(128,094)
75,882
114,099
Net changes during the year 528,581 171,170 171,170 671,860 472,519 (76,583) (1,246) (214) 244,354 (128,094) 75,882 1,600,818
Balance at March 31, 2014 3,643,642 $2,438,108 $978,840 $3,132,016 $ (28,991) $128,897 $(17,626) $(32,732) $ 29,755 $(128,094) $638,178 $7,138,351
See accompanying notes.
ANNUAL REPORT 2014 KOBE STEEL GROUP 57
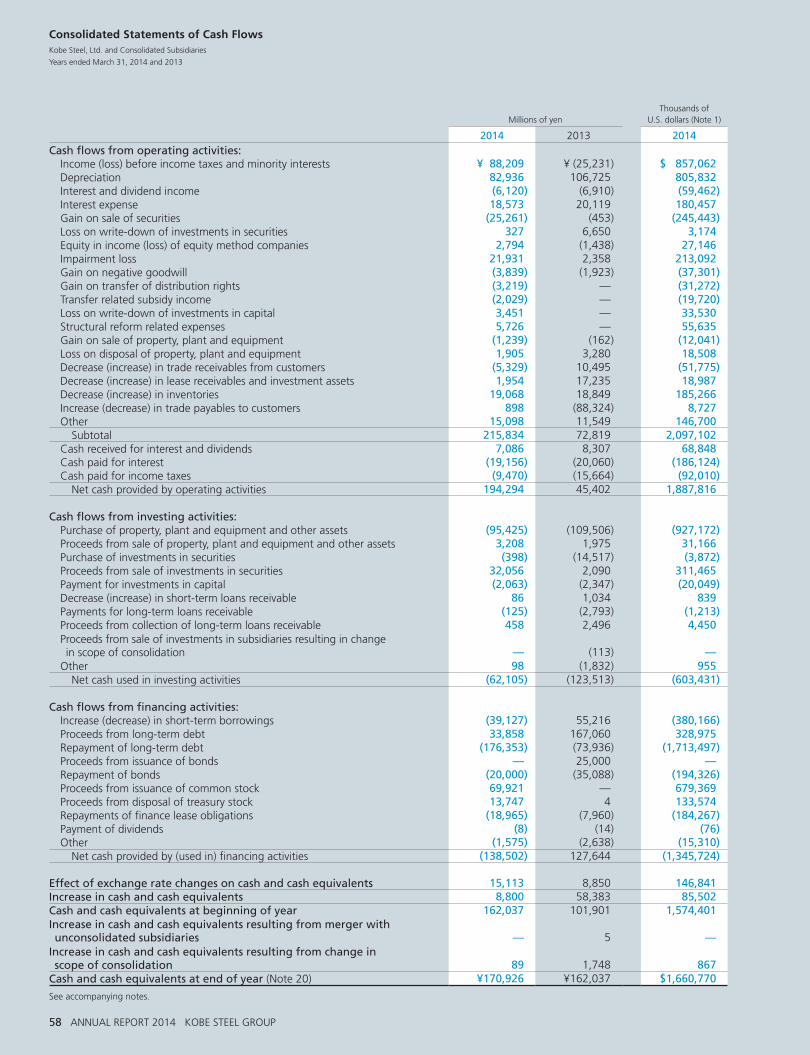
Consolidated Statements of Cash FlowsKobe Steel, Ltd. and Consolidated Subsidiaries
Years ended March 31, 2014 and 2013
Millions of yen
Thousands of U.S. dollars (Note 1)
2014 2013 2014Cash flows from operating activities: Income (loss) before income taxes and minority interests ¥ 88,209 ¥ (25,231) $ 857,062 Depreciation 82,936 106,725 805,832 Interest and dividend income (6,120) (6,910) (59,462) Interest expense 18,573 20,119 180,457 Gain on sale of securities (25,261) (453) (245,443) Loss on write-down of investments in securities 327 6,650 3,174 Equity in income (loss) of equity method companies 2,794 (1,438) 27,146 Impairment loss 21,931 2,358 213,092 Gain on negative goodwill (3,839) (1,923) (37,301) Gain on transfer of distribution rights (3,219) — (31,272) Transfer related subsidy income (2,029) — (19,720) Loss on write-down of investments in capital 3,451 — 33,530 Structural reform related expenses 5,726 — 55,635 Gain on sale of property, plant and equipment (1,239) (162) (12,041) Loss on disposal of property, plant and equipment 1,905 3,280 18,508 Decrease (increase) in trade receivables from customers (5,329) 10,495 (51,775) Decrease (increase) in lease receivables and investment assets 1,954 17,235 18,987 Decrease (increase) in inventories 19,068 18,849 185,266 Increase (decrease) in trade payables to customers 898 (88,324) 8,727 Other 15,098 11,549 146,700 Subtotal 215,834 72,819 2,097,102 Cash received for interest and dividends 7,086 8,307 68,848 Cash paid for interest (19,156) (20,060) (186,124) Cash paid for income taxes (9,470) (15,664) (92,010) Net cash provided by operating activities 194,294 45,402 1,887,816
Cash flows from investing activities: Purchase of property, plant and equipment and other assets (95,425) (109,506) (927,172) Proceeds from sale of property, plant and equipment and other assets 3,208 1,975 31,166 Purchase of investments in securities (398) (14,517) (3,872) Proceeds from sale of investments in securities 32,056 2,090 311,465 Payment for investments in capital (2,063) (2,347) (20,049) Decrease (increase) in short-term loans receivable 86 1,034 839 Payments for long-term loans receivable (125) (2,793) (1,213) Proceeds from collection of long-term loans receivable 458 2,496 4,450 Proceeds from sale of investments in subsidiaries resulting in change in scope of consolidation
—
(113)
—
Other 98 (1,832) 955 Net cash used in investing activities (62,105) (123,513) (603,431)
Cash flows from financing activities: Increase (decrease) in short-term borrowings (39,127) 55,216 (380,166) Proceeds from long-term debt 33,858 167,060 328,975 Repayment of long-term debt (176,353) (73,936) (1,713,497) Proceeds from issuance of bonds — 25,000 — Repayment of bonds (20,000) (35,088) (194,326) Proceeds from issuance of common stock 69,921 — 679,369 Proceeds from disposal of treasury stock 13,747 4 133,574 Repayments of finance lease obligations (18,965) (7,960) (184,267) Payment of dividends (8) (14) (76) Other (1,575) (2,638) (15,310) Net cash provided by (used in) financing activities (138,502) 127,644 (1,345,724)
Effect of exchange rate changes on cash and cash equivalents 15,113 8,850 146,841Increase in cash and cash equivalents 8,800 58,383 85,502Cash and cash equivalents at beginning of year 162,037 101,901 1,574,401Increase in cash and cash equivalents resulting from merger with unconsolidated subsidiaries
—
5
—
Increase in cash and cash equivalents resulting from change in scope of consolidation
89
1,748
867
Cash and cash equivalents at end of year (Note 20) ¥170,926 ¥162,037 $1,660,770
See accompanying notes.
58 ANNUAL REPORT 2014 KOBE STEEL GROUP
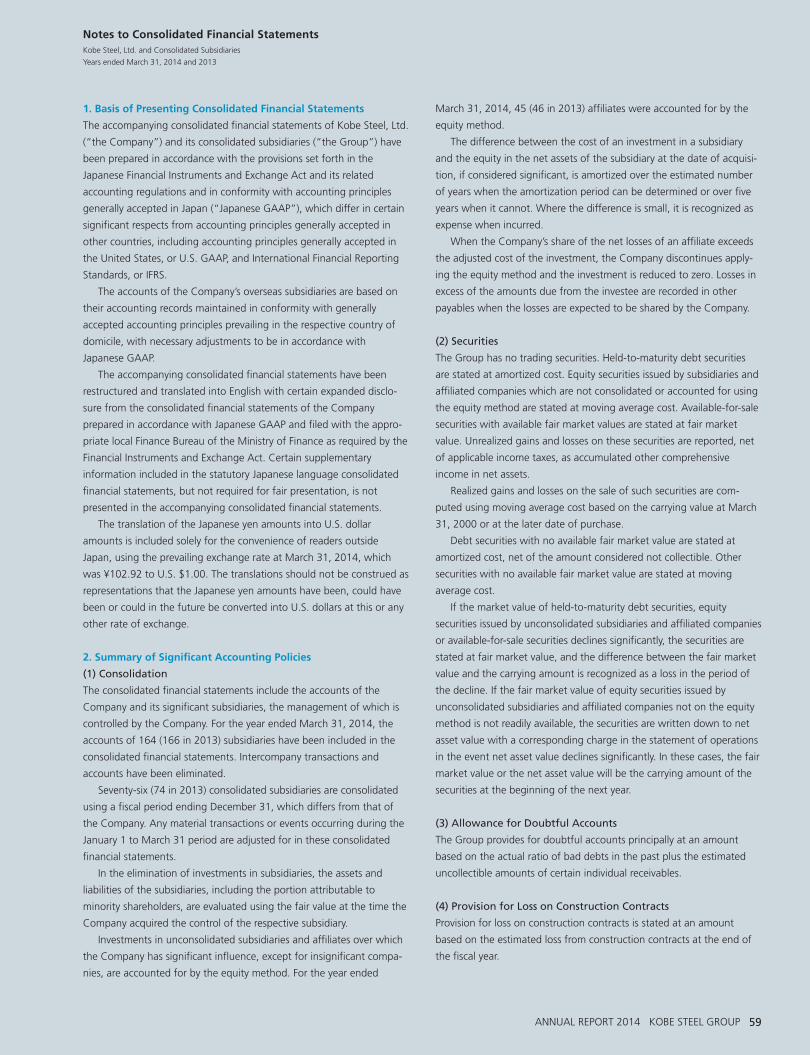
Notes to Consolidated Financial StatementsKobe Steel, Ltd. and Consolidated Subsidiaries
Years ended March 31, 2014 and 2013
1. Basis of Presenting Consolidated Financial Statements
The accompanying consolidated financial statements of Kobe Steel, Ltd.
(“the Company”) and its consolidated subsidiaries (“the Group”) have
been prepared in accordance with the provisions set forth in the
Japanese Financial Instruments and Exchange Act and its related
accounting regulations and in conformity with accounting principles
generally accepted in Japan (“Japanese GAAP”), which differ in certain
significant respects from accounting principles generally accepted in
other countries, including accounting principles generally accepted in
the United States, or U.S. GAAP, and International Financial Reporting
Standards, or IFRS.
The accounts of the Company’s overseas subsidiaries are based on
their accounting records maintained in conformity with generally
accepted accounting principles prevailing in the respective country of
domicile, with necessary adjustments to be in accordance with
Japanese GAAP.
The accompanying consolidated financial statements have been
restructured and translated into English with certain expanded disclo-
sure from the consolidated financial statements of the Company
prepared in accordance with Japanese GAAP and filed with the appro-
priate local Finance Bureau of the Ministry of Finance as required by the
Financial Instruments and Exchange Act. Certain supplementary
information included in the statutory Japanese language consolidated
financial statements, but not required for fair presentation, is not
presented in the accompanying consolidated financial statements.
The translation of the Japanese yen amounts into U.S. dollar
amounts is included solely for the convenience of readers outside
Japan, using the prevailing exchange rate at March 31, 2014, which
was ¥102.92 to U.S. $1.00. The translations should not be construed as
representations that the Japanese yen amounts have been, could have
been or could in the future be converted into U.S. dollars at this or any
other rate of exchange.
2. Summary of Significant Accounting Policies
(1) Consolidation
The consolidated financial statements include the accounts of the
Company and its significant subsidiaries, the management of which is
controlled by the Company. For the year ended March 31, 2014, the
accounts of 164 (166 in 2013) subsidiaries have been included in the
consolidated financial statements. Intercompany transactions and
accounts have been eliminated.
Seventy-six (74 in 2013) consolidated subsidiaries are consolidated
using a fiscal period ending December 31, which differs from that of
the Company. Any material transactions or events occurring during the
January 1 to March 31 period are adjusted for in these consolidated
financial statements.
In the elimination of investments in subsidiaries, the assets and
liabilities of the subsidiaries, including the portion attributable to
minority shareholders, are evaluated using the fair value at the time the
Company acquired the control of the respective subsidiary.
Investments in unconsolidated subsidiaries and affiliates over which
the Company has significant influence, except for insignificant compa-
nies, are accounted for by the equity method. For the year ended
March 31, 2014, 45 (46 in 2013) affiliates were accounted for by the
equity method.
The difference between the cost of an investment in a subsidiary
and the equity in the net assets of the subsidiary at the date of acquisi-
tion, if considered significant, is amortized over the estimated number
of years when the amortization period can be determined or over five
years when it cannot. Where the difference is small, it is recognized as
expense when incurred.
When the Company’s share of the net losses of an affiliate exceeds
the adjusted cost of the investment, the Company discontinues apply-
ing the equity method and the investment is reduced to zero. Losses in
excess of the amounts due from the investee are recorded in other
payables when the losses are expected to be shared by the Company.
(2) Securities
The Group has no trading securities. Held-to-maturity debt securities
are stated at amortized cost. Equity securities issued by subsidiaries and
affiliated companies which are not consolidated or accounted for using
the equity method are stated at moving average cost. Available-for-sale
securities with available fair market values are stated at fair market
value. Unrealized gains and losses on these securities are reported, net
of applicable income taxes, as accumulated other comprehensive
income in net assets.
Realized gains and losses on the sale of such securities are com-
puted using moving average cost based on the carrying value at March
31, 2000 or at the later date of purchase.
Debt securities with no available fair market value are stated at
amortized cost, net of the amount considered not collectible. Other
securities with no available fair market value are stated at moving
average cost.
If the market value of held-to-maturity debt securities, equity
securities issued by unconsolidated subsidiaries and affiliated companies
or available-for-sale securities declines significantly, the securities are
stated at fair market value, and the difference between the fair market
value and the carrying amount is recognized as a loss in the period of
the decline. If the fair market value of equity securities issued by
unconsolidated subsidiaries and affiliated companies not on the equity
method is not readily available, the securities are written down to net
asset value with a corresponding charge in the statement of operations
in the event net asset value declines significantly. In these cases, the fair
market value or the net asset value will be the carrying amount of the
securities at the beginning of the next year.
(3) Allowance for Doubtful Accounts
The Group provides for doubtful accounts principally at an amount
based on the actual ratio of bad debts in the past plus the estimated
uncollectible amounts of certain individual receivables.
(4) Provision for Loss on Construction Contracts
Provision for loss on construction contracts is stated at an amount
based on the estimated loss from construction contracts at the end of
the fiscal year.
ANNUAL REPORT 2014 KOBE STEEL GROUP 59
(5) Provision for Environmental Measures
The provision for environmental measures for obligatory PCB treatment
is stated as an estimated cost at the end of the fiscal year.
(6) Provision for Structural Reform Related Expenses
The provision for structural reform related expenses is stated at an
amount based on the estimated cost of structural reform at the end of
the fiscal year.
(7) Inventories
Inventories are valued at the lower of cost or net realizable value. Cost
is determined principally by the average method in the Iron & Steel,
Welding and Aluminum & Copper segments and by the specific identifi-
cation method for finished goods and work in progress in the
Machinery, Engineering, Kobelco Eco-Solutions, Kobelco Construction
Machinery and Kobelco Cranes segments.
(8) Depreciation
Depreciation of tangible and intangible assets is provided principally by
the straight-line method.
The useful life of these assets is determined mainly by schedules in
Japanese tax laws. Intangible assets include software for internal use,
which is amortized over the estimated useful life of five years.
Depreciation of leased assets under finance leases that do not
transfer ownership of the lease assets is provided by the straight-line
method with the lease term as the useful life.
(9) Income Taxes
The Company and its domestic consolidated subsidiaries apply deferred
tax accounting to recognize the tax effects of temporary differences
between the carrying amounts of assets and liabilities for tax and
financial reporting purposes.
Deferred taxes relating to temporary differences between financial
accounting and tax reporting are also recognized by certain foreign
consolidated subsidiaries.
(10) Employees’ Severance and Retirement Benefits
The Company and its domestic consolidated subsidiaries operate two
defined benefit retirement plans which consist of unfunded lump-sum
payment plans and funded non-contributory pension plans. Some
unfunded lump-sum payment plans became funded as a result of
contributions of securities to retirement benefit trusts. Certain domestic
consolidated subsidiaries operate contribution pension plans.
The Company and its domestic consolidated subsidiaries provide
for employees’ severance and retirement benefits based on the esti-
mated amounts of projected benefit obligation and the fair value of
plan assets. The Group attributes expected benefits to periods by the
straight-line basis.
Prior service cost is recognized in expenses using the straight-line
method over mainly 16 years, which is within the average of the
estimated remaining service years of employees. Actuarial gains and
losses are recognized in expenses using the straight-line method over
mainly 17 years for those accrued in 2014 and 2013, mainly 16 years
for those accrued in 2012 and 2011, mainly 15 years for those accrued
in 2010, mainly 14 years for those accrued in 2009 and 2008, and
mainly 12 years for those accrued in and before 2007, which is within
the average of the estimated remaining service years of employees
commencing with the following period.
(11) Bond Issue Expenses and Share Issue Expenses
Bond issue expenses and share issue expenses are charged to expenses
as they are incurred by the Company and its consolidated subsidiaries.
(12) Translation of Foreign Currencies
Receivables and payables denominated in foreign currencies are
translated into Japanese yen at year-end rates.
Balance sheets of consolidated overseas subsidiaries are translated
into Japanese yen at year-end rates, except net asset accounts, which
are translated at historical rates. Statements of operations of consoli-
dated overseas subsidiaries are translated into Japanese yen at average
rates for the period, except items resulting from transactions with the
Company, which are translated at rates used by the Company.
The Company and its domestic consolidated subsidiaries report foreign
currency translation adjustments in net assets and minority interests.
(13) Construction Contracts
The Company and its domestic consolidated companies apply the
percentage of completion method to work in which the outcome of
individual contracts can be estimated reliably, otherwise, the completed
contract method is applied.
(14) Derivatives
The Company and its domestic consolidated subsidiaries state derivative
financial instruments at fair value and recognize changes in the fair
value as gain or loss unless the derivative financial instrument was used
for hedging purposes.
If derivative financial instruments are used as hedges and meet
certain hedging criteria, the Group defers recognition of gain or loss
resulting from changes in the fair value of the derivative financial
instruments until the related loss or gain on the corresponding hedged
item is recognized (“deferred hedge” method). Deferred gains and
losses on these derivative instruments are reported, net of applicable
income taxes, as a separate component of accumulated other compre-
hensive income in net assets.
If foreign currency exchange contracts are used as hedges and meet
certain hedging criteria, the hedged items are stated at the forward
exchange rates (“assigning” method). Also, if interest rate swap
contracts are used as hedges and meet certain hedging criteria, the net
amount to be paid or received under the interest rate swap contract is
added to or deducted from the interest on the assets or liabilities for
which the swap contract was executed (“exceptional” method).
(15) Consumption Tax
Consumption tax withheld upon sale, as well as that paid for purchases
of goods or services, is recorded as a liability or an asset and is excluded
from the relevant revenue, costs or expenses.
60 ANNUAL REPORT 2014 KOBE STEEL GROUP
(16) Consolidated Tax Return
From the year ended March 31, 2004, the Company has filed a consoli-
dated tax return with certain domestic subsidiaries.
(17) Cash and Cash Equivalents
In preparing the consolidated statements of cash flows, cash on hand,
readily-available deposits and short-term highly liquid investments with
maturities not exceeding three months at the time of purchase are
considered to be cash and cash equivalents.
(18) Changes in Accounting Policies
Application of the Accounting Standard for Retirement Benefits
Effective from the year ended March 31, 2014, the Group has applied
the Accounting Standard for Retirement Benefits (Accounting Standards
Board of Japan Statement No. 26, May 17, 2012; hereinafter the
“Accounting Standard for Retirement Benefits”) and the Guidance on
Accounting Standard for Retirement Benefits (ASBJ Guidance No. 25,
May 17, 2012; hereinafter the “Guidance on Retirement Benefits”)
(except for the article 35 of the Accounting Standard for Retirement
Benefits and the article 67 of the Guidance on Retirement Benefits).
The Group has changed its accounting method to recognize the
difference between retirement benefit obligations and plan assets as
net defined benefit liability and to recognize actuarial gains and losses
and prior service costs that are yet to be recognized as net defined
benefit liability. If plan assets exceed retirement benefit obligations, the
Group recognizes the difference as net defined benefit asset.
In accordance with the article 37 of Accounting Standard for
Retirement Benefits, the effect of the change in accounting policies
arising from initial application has been recognized in remeasurements
of defined benefit plans, net of taxes in accumulated other comprehen-
sive income. As a result of the application, accumulated other compre-
hensive income has decreased by ¥13,183 million in the year ended
March 31, 2014.
Change in accounting policies that is difficult to distinguish from
changes in accounting estimates
With regard to the depreciation method for tangible fixed assets, the
Group had used principally the straight-line method for buildings and
structures and the declining-balance method for the machinery and
equipment. From the year ended March 31, 2014, the Group has
changed the depreciation method for machinery and equipment from
the declining-balance method to the straight-line method.
In response to changes in the business environment in recent years,
the Group has been increasing investments to bolster its competitive-
ness, although starting with the steel business conventional investments
to increase production capacity have been decreasing. In addition, with
a new medium-term business plan starting in the year ended March 31,
2014, the Group anticipates a long and stable operation of its produc-
tion equipment, a leveling of maintenance costs for equipment and a
reduction in obsolescence risks arising from changes in the market
environment and technology. Taking into account these conditions,
the Group has changed to the straight-line method in order to match
costs more appropriately to earnings and accurately reflect current
business conditions.
Due to this change, depreciation expense decreased by ¥23,363
million in comparison to the previous depreciation method. As a result,
operating income increased by ¥20,880 million, and ordinary income
and income before income taxes and minority interests each increased
by ¥20,883 million.
(19) Unapplied Accounting Standards
“Accounting Standard for Retirement Benefits” (ASBJ Statement No. 26,
May 17, 2012) and “Guidance on Accounting Standard for Retirement
Benefits” (ASBJ Guidance No. 25, May 17, 2012)
1. Summary
Under the amended rule, actuarial gains and losses and prior service
costs that are yet to be recognized in profit or loss would be recognized
within the net asset section after adjusting for tax effects, and the
deficit or surplus would be recognized as a liability or asset without any
adjustments. For determining the method of attributing expected
benefits to periods, the Standard allows the choice of benefit formula
basis or straight-line basis. The method for determining the discount
rate has also been amended.
2. Effective dates
The amendments relating to the determination of retirement benefit
obligations and current service costs are effective from the beginning of
annual periods beginning on or after April 1, 2014.
3. Effect of application of the standard
The amendments relating to the determination of retirement benefit
obligations and current service costs will increase retained earnings at
April 1, 2014 by approximately ¥5 billion.
In addition, the effect of the amendments to consolidated state-
ments of operations seems to be minor.
(20) Reclassifications
Certain prior year amounts have been reclassified to conform to the
current year presentation. These reclassifications had no impact on
previously reported results of operations or retained earnings.
ANNUAL REPORT 2014 KOBE STEEL GROUP 61
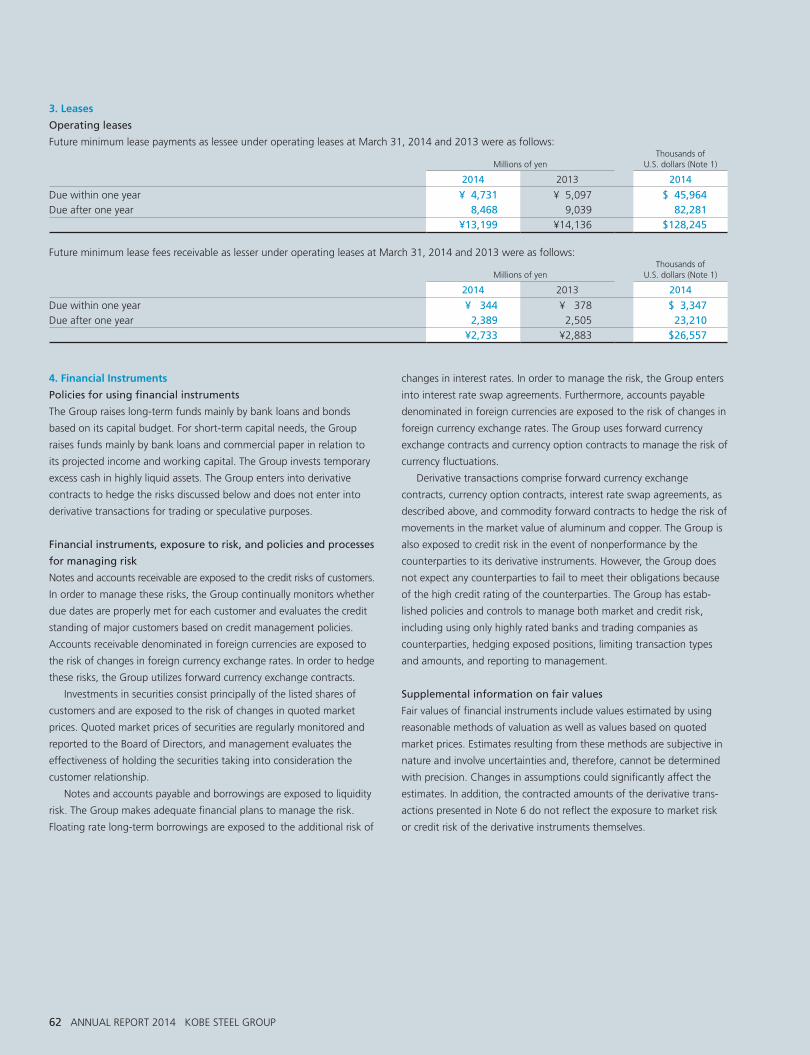
changes in interest rates. In order to manage the risk, the Group enters
into interest rate swap agreements. Furthermore, accounts payable
denominated in foreign currencies are exposed to the risk of changes in
foreign currency exchange rates. The Group uses forward currency
exchange contracts and currency option contracts to manage the risk of
currency fluctuations.
Derivative transactions comprise forward currency exchange
contracts, currency option contracts, interest rate swap agreements, as
described above, and commodity forward contracts to hedge the risk of
movements in the market value of aluminum and copper. The Group is
also exposed to credit risk in the event of nonperformance by the
counterparties to its derivative instruments. However, the Group does
not expect any counterparties to fail to meet their obligations because
of the high credit rating of the counterparties. The Group has estab-
lished policies and controls to manage both market and credit risk,
including using only highly rated banks and trading companies as
counterparties, hedging exposed positions, limiting transaction types
and amounts, and reporting to management.
Supplemental information on fair values
Fair values of financial instruments include values estimated by using
reasonable methods of valuation as well as values based on quoted
market prices. Estimates resulting from these methods are subjective in
nature and involve uncertainties and, therefore, cannot be determined
with precision. Changes in assumptions could significantly affect the
estimates. In addition, the contracted amounts of the derivative trans-
actions presented in Note 6 do not reflect the exposure to market risk
or credit risk of the derivative instruments themselves.
3. Leases
Operating leases
Future minimum lease payments as lessee under operating leases at March 31, 2014 and 2013 were as follows:
Millions of yenThousands of
U.S. dollars (Note 1)
2014 2013 2014
Due within one year ¥ 4,731 ¥ 5,097 $ 45,964Due after one year 8,468 9,039 82,281
¥13,199 ¥14,136 $128,245
Future minimum lease fees receivable as lesser under operating leases at March 31, 2014 and 2013 were as follows:
Millions of yenThousands of
U.S. dollars (Note 1)
2014 2013 2014
Due within one year ¥ 344 ¥ 378 $ 3,347Due after one year 2,389 2,505 23,210
¥2,733 ¥2,883 $26,557
4. Financial Instruments
Policies for using financial instruments
The Group raises long-term funds mainly by bank loans and bonds
based on its capital budget. For short-term capital needs, the Group
raises funds mainly by bank loans and commercial paper in relation to
its projected income and working capital. The Group invests temporary
excess cash in highly liquid assets. The Group enters into derivative
contracts to hedge the risks discussed below and does not enter into
derivative transactions for trading or speculative purposes.
Financial instruments, exposure to risk, and policies and processes
for managing risk
Notes and accounts receivable are exposed to the credit risks of customers.
In order to manage these risks, the Group continually monitors whether
due dates are properly met for each customer and evaluates the credit
standing of major customers based on credit management policies.
Accounts receivable denominated in foreign currencies are exposed to
the risk of changes in foreign currency exchange rates. In order to hedge
these risks, the Group utilizes forward currency exchange contracts.
Investments in securities consist principally of the listed shares of
customers and are exposed to the risk of changes in quoted market
prices. Quoted market prices of securities are regularly monitored and
reported to the Board of Directors, and management evaluates the
effectiveness of holding the securities taking into consideration the
customer relationship.
Notes and accounts payable and borrowings are exposed to liquidity
risk. The Group makes adequate financial plans to manage the risk.
Floating rate long-term borrowings are exposed to the additional risk of
62 ANNUAL REPORT 2014 KOBE STEEL GROUP
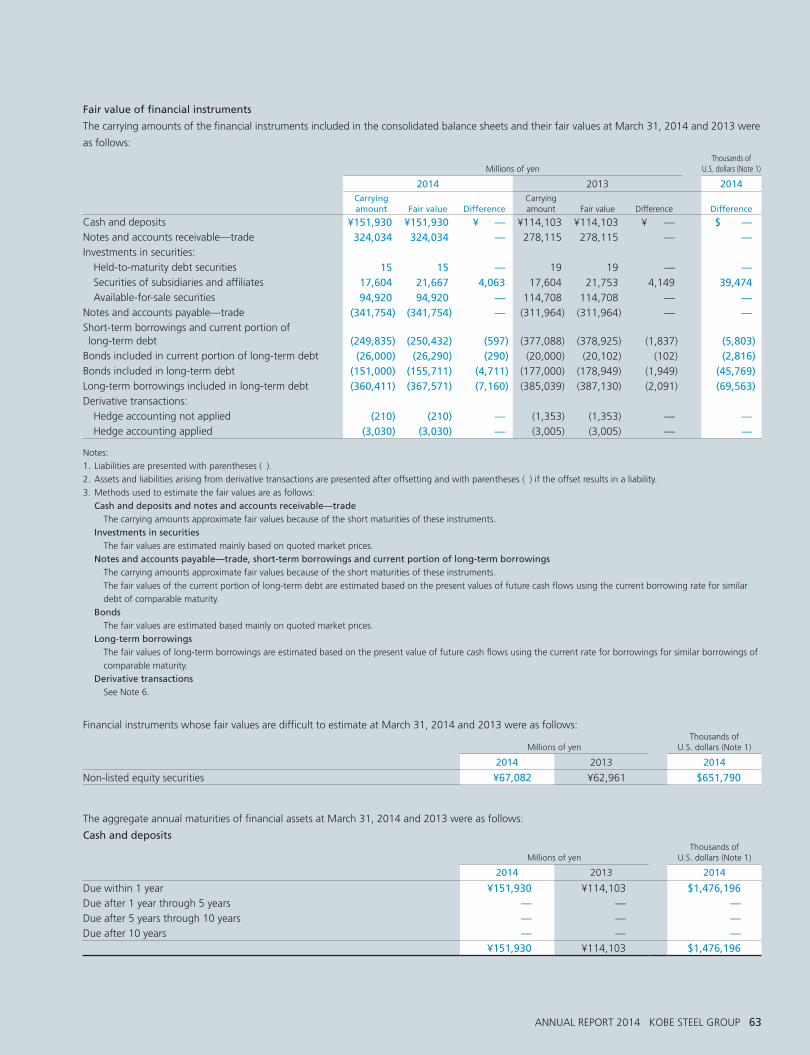
Fair value of financial instruments
The carrying amounts of the financial instruments included in the consolidated balance sheets and their fair values at March 31, 2014 and 2013 were
as follows:
Millions of yenThousands of
U.S. dollars (Note 1)
2014 2013 2014Carrying amount
Fair value
Difference
Carrying amount
Fair value
Difference
Difference
Cash and deposits ¥151,930 ¥151,930 ¥ — ¥114,103 ¥114,103 ¥ — $ —Notes and accounts receivable—trade 324,034 324,034 — 278,115 278,115 — —Investments in securities:
Held-to-maturity debt securities 15 15 — 19 19 — — Securities of subsidiaries and affiliates 17,604 21,667 4,063 17,604 21,753 4,149 39,474 Available-for-sale securities 94,920 94,920 — 114,708 114,708 — —Notes and accounts payable—trade (341,754) (341,754) — (311,964) (311,964) — —Short-term borrowings and current portion of long-term debt
(249,835)
(250,432)
(597)
(377,088)
(378,925)
(1,837)
(5,803)
Bonds included in current portion of long-term debt (26,000) (26,290) (290) (20,000) (20,102) (102) (2,816)Bonds included in long-term debt (151,000) (155,711) (4,711) (177,000) (178,949) (1,949) (45,769)Long-term borrowings included in long-term debt (360,411) (367,571) (7,160) (385,039) (387,130) (2,091) (69,563)Derivative transactions:
Hedge accounting not applied (210) (210) — (1,353) (1,353) — — Hedge accounting applied (3,030) (3,030) — (3,005) (3,005) — —
Notes:
1. Liabilities are presented with parentheses ( ).
2. Assets and liabilities arising from derivative transactions are presented after offsetting and with parentheses ( ) if the offset results in a liability.
3. Methods used to estimate the fair values are as follows:
Cash and deposits and notes and accounts receivable—trade The carrying amounts approximate fair values because of the short maturities of these instruments.
Investments in securities The fair values are estimated mainly based on quoted market prices.
Notes and accounts payable—trade, short-term borrowings and current portion of long-term borrowings The carrying amounts approximate fair values because of the short maturities of these instruments.
The fair values of the current portion of long-term debt are estimated based on the present values of future cash flows using the current borrowing rate for similar
debt of comparable maturity.
Bonds The fair values are estimated based mainly on quoted market prices.
Long-term borrowings The fair values of long-term borrowings are estimated based on the present value of future cash flows using the current rate for borrowings for similar borrowings of
comparable maturity.
Derivative transactions See Note 6.
Financial instruments whose fair values are difficult to estimate at March 31, 2014 and 2013 were as follows:
Millions of yenThousands of
U.S. dollars (Note 1)
2014 2013 2014
Non-listed equity securities ¥67,082 ¥62,961 $651,790
The aggregate annual maturities of financial assets at March 31, 2014 and 2013 were as follows:
Cash and deposits
Millions of yenThousands of
U.S. dollars (Note 1)
2014 2013 2014
Due within 1 year ¥151,930 ¥114,103 $1,476,196Due after 1 year through 5 years — — —Due after 5 years through 10 years — — —Due after 10 years — — —
¥151,930 ¥114,103 $1,476,196
ANNUAL REPORT 2014 KOBE STEEL GROUP 63
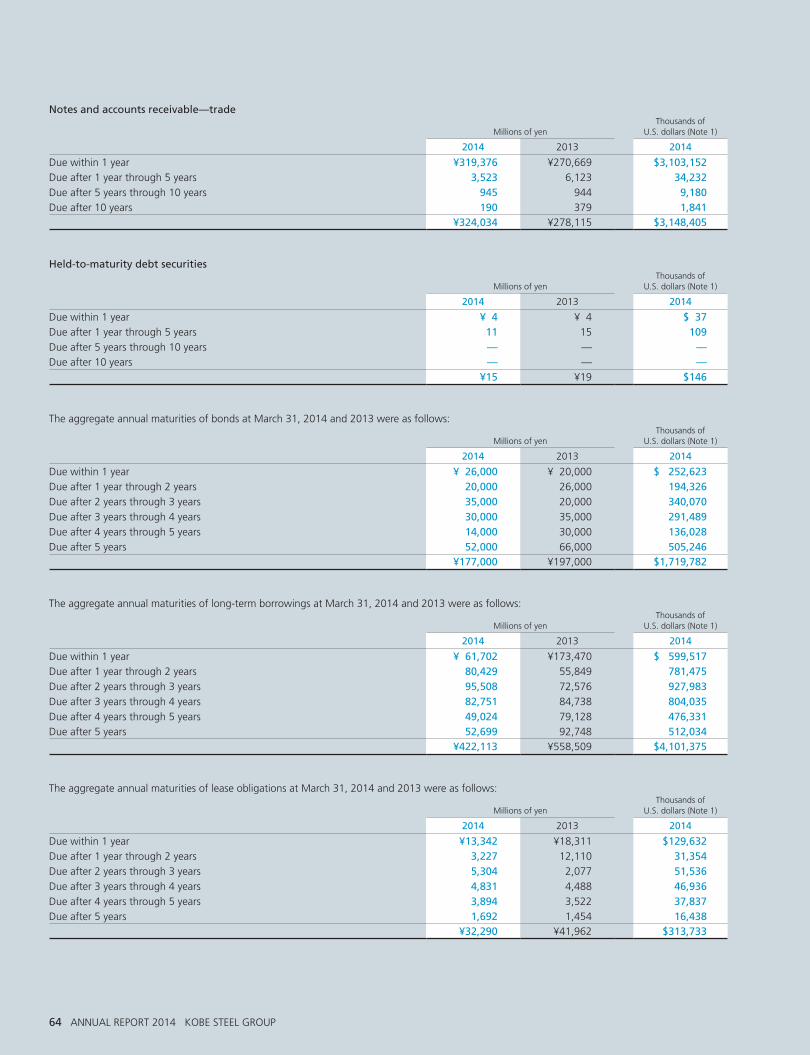
Notes and accounts receivable—trade
Millions of yenThousands of
U.S. dollars (Note 1)
2014 2013 2014
Due within 1 year ¥319,376 ¥270,669 $3,103,152Due after 1 year through 5 years 3,523 6,123 34,232Due after 5 years through 10 years 945 944 9,180Due after 10 years 190 379 1,841
¥324,034 ¥278,115 $3,148,405
Held-to-maturity debt securities
Millions of yenThousands of
U.S. dollars (Note 1)
2014 2013 2014
Due within 1 year ¥ 4 ¥ 4 $ 37Due after 1 year through 5 years 11 15 109Due after 5 years through 10 years — — —Due after 10 years — — —
¥15 ¥19 $146
The aggregate annual maturities of bonds at March 31, 2014 and 2013 were as follows:
Millions of yenThousands of
U.S. dollars (Note 1)
2014 2013 2014
Due within 1 year ¥ 26,000 ¥ 20,000 $ 252,623Due after 1 year through 2 years 20,000 26,000 194,326Due after 2 years through 3 years 35,000 20,000 340,070Due after 3 years through 4 years 30,000 35,000 291,489Due after 4 years through 5 years 14,000 30,000 136,028Due after 5 years 52,000 66,000 505,246
¥177,000 ¥197,000 $1,719,782
The aggregate annual maturities of long-term borrowings at March 31, 2014 and 2013 were as follows:
Millions of yenThousands of
U.S. dollars (Note 1)
2014 2013 2014
Due within 1 year ¥ 61,702 ¥173,470 $ 599,517Due after 1 year through 2 years 80,429 55,849 781,475Due after 2 years through 3 years 95,508 72,576 927,983Due after 3 years through 4 years 82,751 84,738 804,035Due after 4 years through 5 years 49,024 79,128 476,331Due after 5 years 52,699 92,748 512,034
¥422,113 ¥558,509 $4,101,375
The aggregate annual maturities of lease obligations at March 31, 2014 and 2013 were as follows:
Millions of yenThousands of
U.S. dollars (Note 1)
2014 2013 2014
Due within 1 year ¥13,342 ¥18,311 $129,632Due after 1 year through 2 years 3,227 12,110 31,354Due after 2 years through 3 years 5,304 2,077 51,536Due after 3 years through 4 years 4,831 4,488 46,936Due after 4 years through 5 years 3,894 3,522 37,837Due after 5 years 1,692 1,454 16,438
¥32,290 ¥41,962 $313,733
64 ANNUAL REPORT 2014 KOBE STEEL GROUP
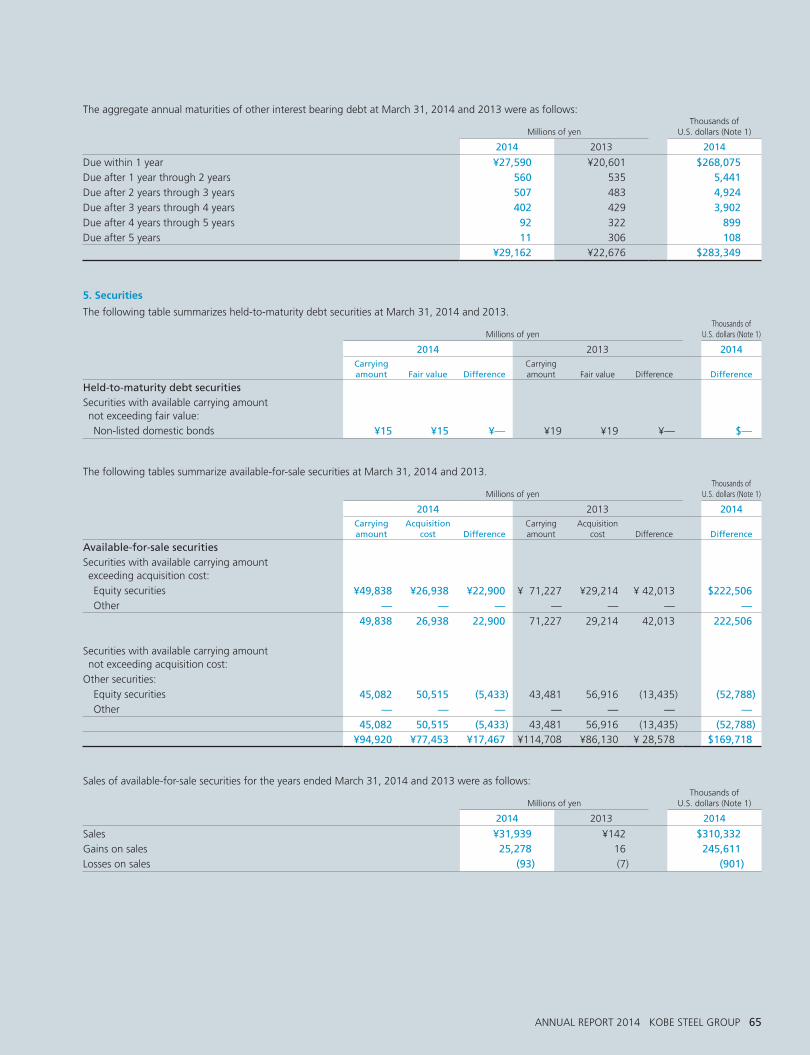
5. Securities
The following table summarizes held-to-maturity debt securities at March 31, 2014 and 2013.
Millions of yenThousands of
U.S. dollars (Note 1)
2014 2013 2014Carrying amount
Fair value
Difference
Carrying amount
Fair value
Difference
Difference
Held-to-maturity debt securitiesSecurities with available carrying amount not exceeding fair value: Non-listed domestic bonds ¥15 ¥15 ¥— ¥19 ¥19 ¥— $—
The following tables summarize available-for-sale securities at March 31, 2014 and 2013.
Millions of yenThousands of
U.S. dollars (Note 1)
2014 2013 2014Carrying amount
Acquisition cost
Difference
Carrying amount
Acquisition cost
Difference
Difference
Available-for-sale securitiesSecurities with available carrying amount exceeding acquisition cost:
Equity securities ¥49,838 ¥26,938 ¥22,900 ¥ 71,227 ¥29,214 ¥ 42,013 $222,506 Other — — — — — — —
49,838 26,938 22,900 71,227 29,214 42,013 222,506
Securities with available carrying amount not exceeding acquisition cost:
Other securities:
Equity securities 45,082 50,515 (5,433) 43,481 56,916 (13,435) (52,788) Other — — — — — — —
45,082 50,515 (5,433) 43,481 56,916 (13,435) (52,788)¥94,920 ¥77,453 ¥17,467 ¥114,708 ¥86,130 ¥ 28,578 $169,718
Sales of available-for-sale securities for the years ended March 31, 2014 and 2013 were as follows:
Millions of yenThousands of
U.S. dollars (Note 1)
2014 2013 2014
Sales ¥31,939 ¥142 $310,332Gains on sales 25,278 16 245,611Losses on sales (93) (7) (901)
The aggregate annual maturities of other interest bearing debt at March 31, 2014 and 2013 were as follows:
Millions of yenThousands of
U.S. dollars (Note 1)
2014 2013 2014
Due within 1 year ¥27,590 ¥20,601 $268,075Due after 1 year through 2 years 560 535 5,441Due after 2 years through 3 years 507 483 4,924Due after 3 years through 4 years 402 429 3,902Due after 4 years through 5 years 92 322 899Due after 5 years 11 306 108
¥29,162 ¥22,676 $283,349
ANNUAL REPORT 2014 KOBE STEEL GROUP 65
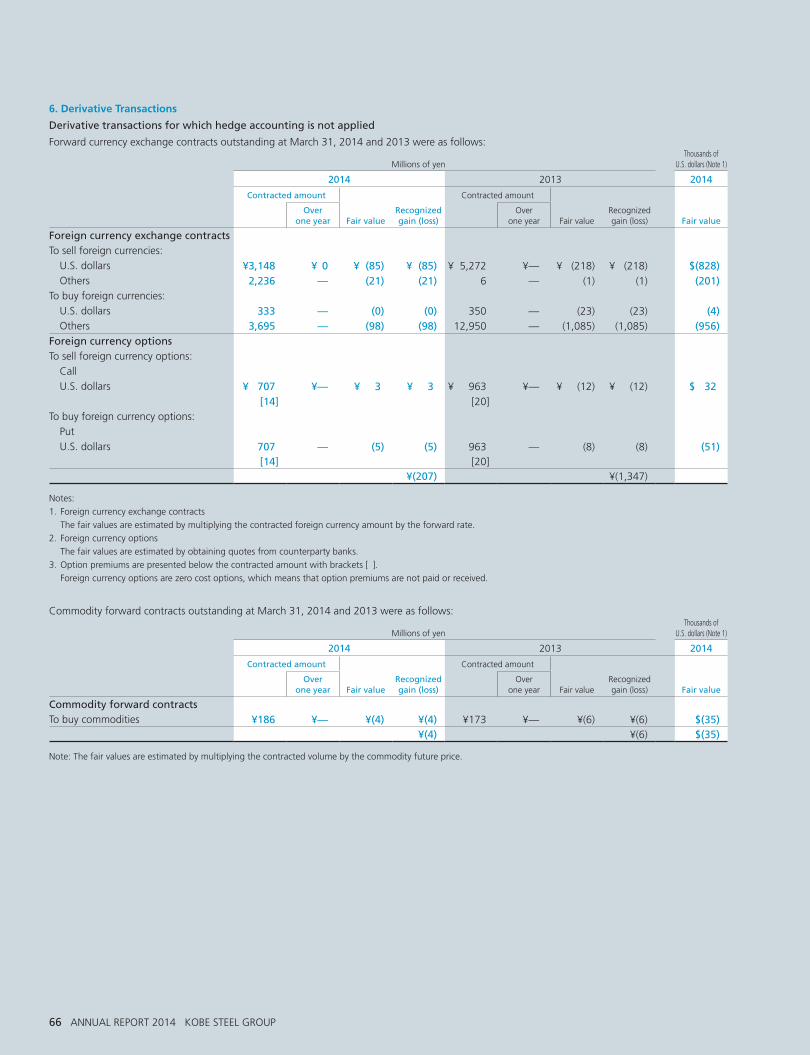
6. Derivative Transactions
Derivative transactions for which hedge accounting is not applied
Forward currency exchange contracts outstanding at March 31, 2014 and 2013 were as follows:
Millions of yenThousands of
U.S. dollars (Note 1)
2014 2013 2014
Contracted amount Contracted amount
Over one year
Fair value
Recognized gain (loss)
Over one year
Fair value
Recognized gain (loss)
Fair value
Foreign currency exchange contractsTo sell foreign currencies:
U.S. dollars ¥3,148 ¥ 0 ¥ (85) ¥ (85) ¥ 5,272 ¥— ¥ (218) ¥ (218) $(828) Others 2,236 — (21) (21) 6 — (1) (1) (201)To buy foreign currencies:
U.S. dollars 333 — (0) (0) 350 — (23) (23) (4) Others 3,695 — (98) (98) 12,950 — (1,085) (1,085) (956)Foreign currency optionsTo sell foreign currency options:
Call
U.S. dollars ¥ 707 ¥— ¥ 3 ¥ 3 ¥ 963 ¥— ¥ (12) ¥ (12) $ 32[14] [20]
To buy foreign currency options:
Put
U.S. dollars 707 — (5) (5) 963 — (8) (8) (51)[14] [20]
¥(207) ¥(1,347)
Notes:
1. Foreign currency exchange contracts
The fair values are estimated by multiplying the contracted foreign currency amount by the forward rate.
2. Foreign currency options
The fair values are estimated by obtaining quotes from counterparty banks.
3. Option premiums are presented below the contracted amount with brackets [ ].
Foreign currency options are zero cost options, which means that option premiums are not paid or received.
Commodity forward contracts outstanding at March 31, 2014 and 2013 were as follows:
Millions of yenThousands of
U.S. dollars (Note 1)
2014 2013 2014
Contracted amount Contracted amount
Over one year
Fair value
Recognized gain (loss)
Over one year
Fair value
Recognized gain (loss)
Fair value
Commodity forward contractsTo buy commodities ¥186 ¥— ¥(4) ¥(4) ¥173 ¥— ¥(6) ¥(6) $(35)
¥(4) ¥(6) $(35)
Note: The fair values are estimated by multiplying the contracted volume by the commodity future price.
66 ANNUAL REPORT 2014 KOBE STEEL GROUP
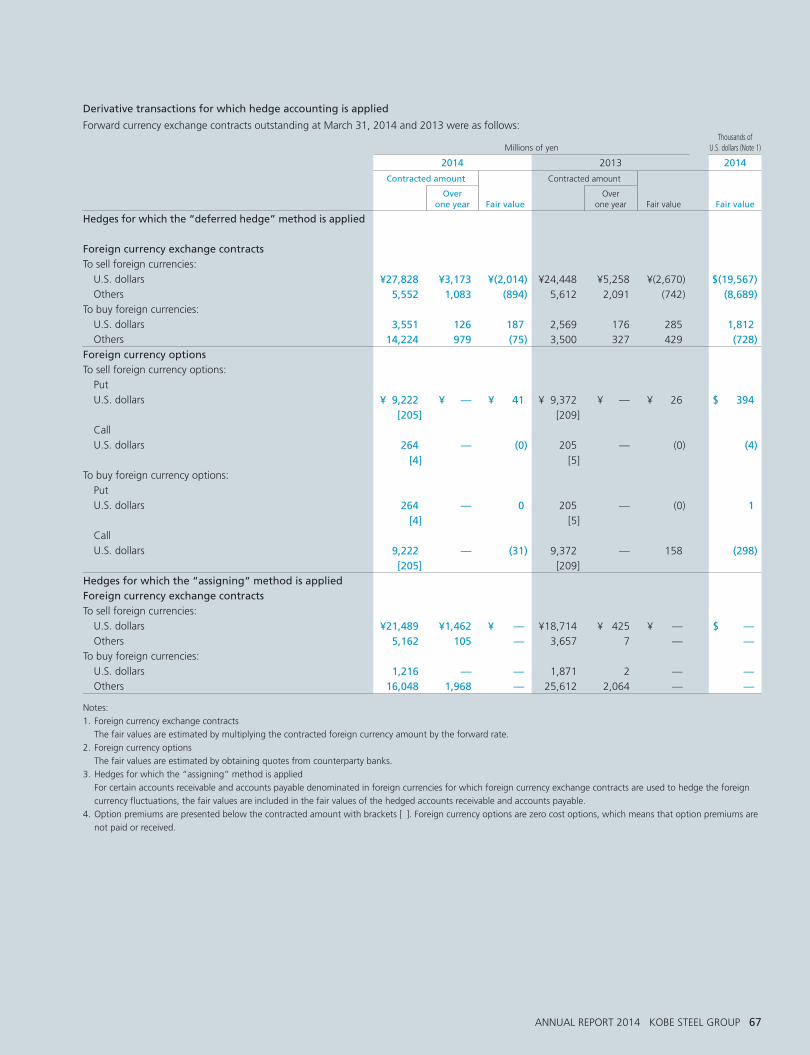
Derivative transactions for which hedge accounting is applied
Forward currency exchange contracts outstanding at March 31, 2014 and 2013 were as follows:
Millions of yenThousands of
U.S. dollars (Note 1)
2014 2013 2014
Contracted amount Contracted amount
Over one year
Fair value
Over one year
Fair value
Fair value
Hedges for which the “deferred hedge” method is applied
Foreign currency exchange contractsTo sell foreign currencies:
U.S. dollars ¥27,828 ¥3,173 ¥(2,014) ¥24,448 ¥5,258 ¥(2,670) $(19,567) Others 5,552 1,083 (894) 5,612 2,091 (742) (8,689)To buy foreign currencies:
U.S. dollars 3,551 126 187 2,569 176 285 1,812 Others 14,224 979 (75) 3,500 327 429 (728)Foreign currency optionsTo sell foreign currency options:
Put
U.S. dollars ¥ 9,222 ¥ — ¥ 41 ¥ 9,372 ¥ — ¥ 26 $ 394[205] [209]
Call
U.S. dollars 264 — (0) 205 — (0) (4)[4] [5]
To buy foreign currency options:
Put
U.S. dollars 264 — 0 205 — (0) 1[4] [5]
Call
U.S. dollars 9,222 — (31) 9,372 — 158 (298)[205] [209]
Hedges for which the “assigning“ method is appliedForeign currency exchange contractsTo sell foreign currencies:
U.S. dollars ¥21,489 ¥1,462 ¥ — ¥18,714 ¥ 425 ¥ — $ — Others 5,162 105 — 3,657 7 — —To buy foreign currencies:
U.S. dollars 1,216 — — 1,871 2 — — Others 16,048 1,968 — 25,612 2,064 — —
Notes:
1. Foreign currency exchange contracts
The fair values are estimated by multiplying the contracted foreign currency amount by the forward rate.
2. Foreign currency options
The fair values are estimated by obtaining quotes from counterparty banks.
3. Hedges for which the “assigning” method is applied
For certain accounts receivable and accounts payable denominated in foreign currencies for which foreign currency exchange contracts are used to hedge the foreign
currency fluctuations, the fair values are included in the fair values of the hedged accounts receivable and accounts payable.
4. Option premiums are presented below the contracted amount with brackets [ ]. Foreign currency options are zero cost options, which means that option premiums are
not paid or received.
ANNUAL REPORT 2014 KOBE STEEL GROUP 67
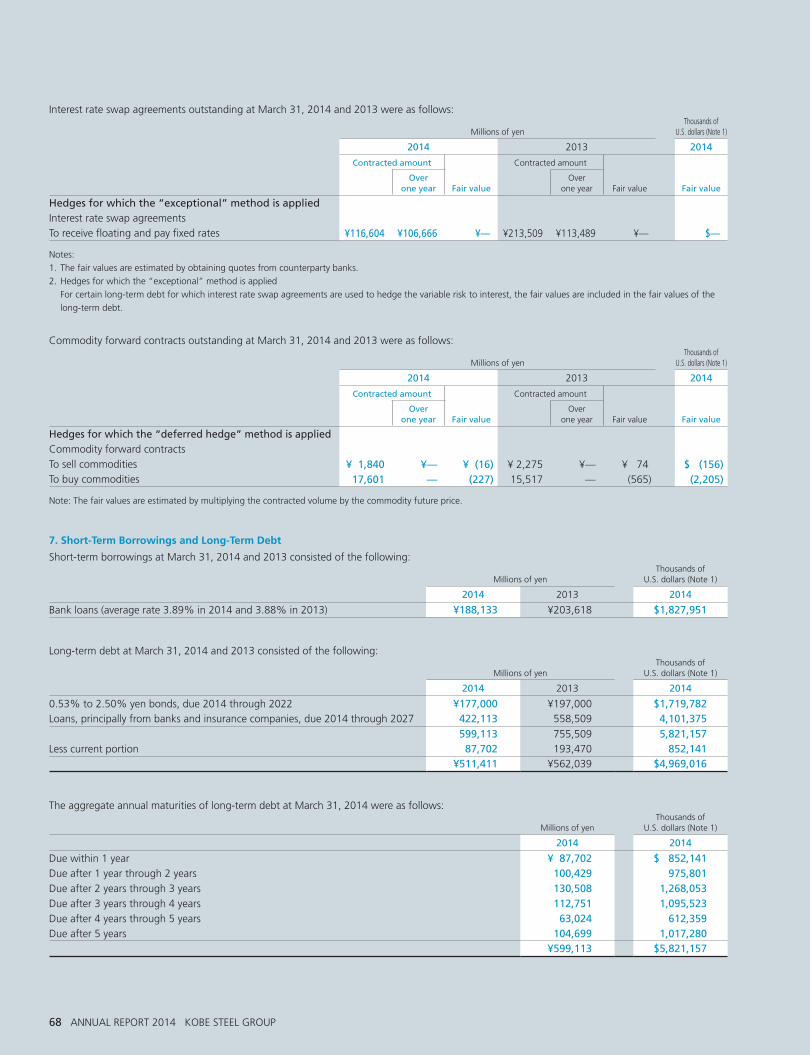
Interest rate swap agreements outstanding at March 31, 2014 and 2013 were as follows:
Millions of yenThousands of
U.S. dollars (Note 1)
2014 2013 2014
Contracted amount Contracted amount
Over one year
Fair value
Over one year
Fair value
Fair value
Hedges for which the “exceptional” method is appliedInterest rate swap agreements
To receive floating and pay fixed rates ¥116,604 ¥106,666 ¥— ¥213,509 ¥113,489 ¥— $—
Notes:
1. The fair values are estimated by obtaining quotes from counterparty banks.
2. Hedges for which the “exceptional” method is applied
For certain long-term debt for which interest rate swap agreements are used to hedge the variable risk to interest, the fair values are included in the fair values of the
long-term debt.
Commodity forward contracts outstanding at March 31, 2014 and 2013 were as follows:
Millions of yenThousands of
U.S. dollars (Note 1)
2014 2013 2014
Contracted amount Contracted amount
Over one year
Fair value
Over one year
Fair value
Fair value
Hedges for which the “deferred hedge” method is appliedCommodity forward contracts
To sell commodities ¥ 1,840 ¥— ¥ (16) ¥ 2,275 ¥— ¥ 74 $ (156)To buy commodities 17,601 — (227) 15,517 — (565) (2,205)
Note: The fair values are estimated by multiplying the contracted volume by the commodity future price.
7. Short-Term Borrowings and Long-Term Debt
Short-term borrowings at March 31, 2014 and 2013 consisted of the following:
Millions of yenThousands of
U.S. dollars (Note 1)
2014 2013 2014
Bank loans (average rate 3.89% in 2014 and 3.88% in 2013) ¥188,133 ¥203,618 $1,827,951
Long-term debt at March 31, 2014 and 2013 consisted of the following:
Millions of yenThousands of
U.S. dollars (Note 1)
2014 2013 2014
0.53% to 2.50% yen bonds, due 2014 through 2022 ¥177,000 ¥197,000 $1,719,782Loans, principally from banks and insurance companies, due 2014 through 2027 422,113 558,509 4,101,375
599,113 755,509 5,821,157Less current portion 87,702 193,470 852,141
¥511,411 ¥562,039 $4,969,016
The aggregate annual maturities of long-term debt at March 31, 2014 were as follows:
Millions of yenThousands of
U.S. dollars (Note 1)
2014 2014
Due within 1 year ¥ 87,702 $ 852,141Due after 1 year through 2 years 100,429 975,801Due after 2 years through 3 years 130,508 1,268,053Due after 3 years through 4 years 112,751 1,095,523Due after 4 years through 5 years 63,024 612,359Due after 5 years 104,699 1,017,280
¥599,113 $5,821,157
68 ANNUAL REPORT 2014 KOBE STEEL GROUP

At March 31, 2014 and 2013, assets pledged as collateral for short-term borrowings and long-term debt were as follows:
Millions of yenThousands of
U.S. dollars (Note 1)
2014 2013 2014
Assets pledged as collateral:
Cash and deposits ¥ 22,105 ¥ 21,056 $ 214,780 Property, plant and equipment, net of accumulated depreciation 80,976 94,143 786,785 Other assets 17,061 17,285 165,767
¥120,142 ¥132,484 $1,167,332
Secured short-term borrowings and long-term debt:
Short-term borrowings ¥ 5,689 ¥ 18,491 $ 55,275 Long-term borrowings 42,320 55,135 411,194
¥ 48,009 ¥ 73,626 $ 466,469
At March 31, 2014 and 2013, included in the assets pledged as collateral were assets that were promised to be pledged as collateral for short-term
borrowings and long-term borrowings as follows:
Millions of yenThousands of
U.S. dollars (Note 1)
2014 2013 2014
Short-term borrowings ¥— ¥ 791 $—Long-term borrowings — 3,064 —
¥— ¥3,855 $—
8. Provision for Loss on Construction Contracts
Inventories for construction contracts with anticipated losses and provision for loss on construction contracts were not offset. The inventories for the
construction contracts for which the provision for loss on construction contracts was provided were ¥2,416 million ($23,478 thousand) for the year
ended March 31, 2014 and ¥3,732 million for the year ended March 31, 2013. These amounts were included in “Work-in-process.”
10. Commitment Line
The unexercised portion of facilities based on commitment line contracts at March 31, 2014 and 2013 was as follows:
Millions of yenThousands of
U.S. dollars (Note 1)
2014 2013 2014
Total commitment available ¥133,714 ¥125,842 $1,299,207Less amount utilized 3,472 — 33,735
¥130,242 ¥125,842 $1,265,472
9. Land Revaluation
In the years ended March 31, 2002 and 2001, land used for operations was revaluated by certain consolidated subsidiaries in accordance with the
Land Revaluation Law. The revaluation amount, net of related taxes, is shown as accumulated other comprehensive income in net assets.
The excess of the carrying amounts of the revalued land over its fair value at March 31, 2014 and 2013 was as follows:
Millions of yenThousands of
U.S. dollars (Note 1)
Revaluation date 2014 2013 2014
March 31, 2001 ¥(1,049) ¥(1,711) $(10,193)March 31, 2002 (5,113) (5,050) (49,683)
¥(6,162) ¥(6,761) $(59,876)
ANNUAL REPORT 2014 KOBE STEEL GROUP 69
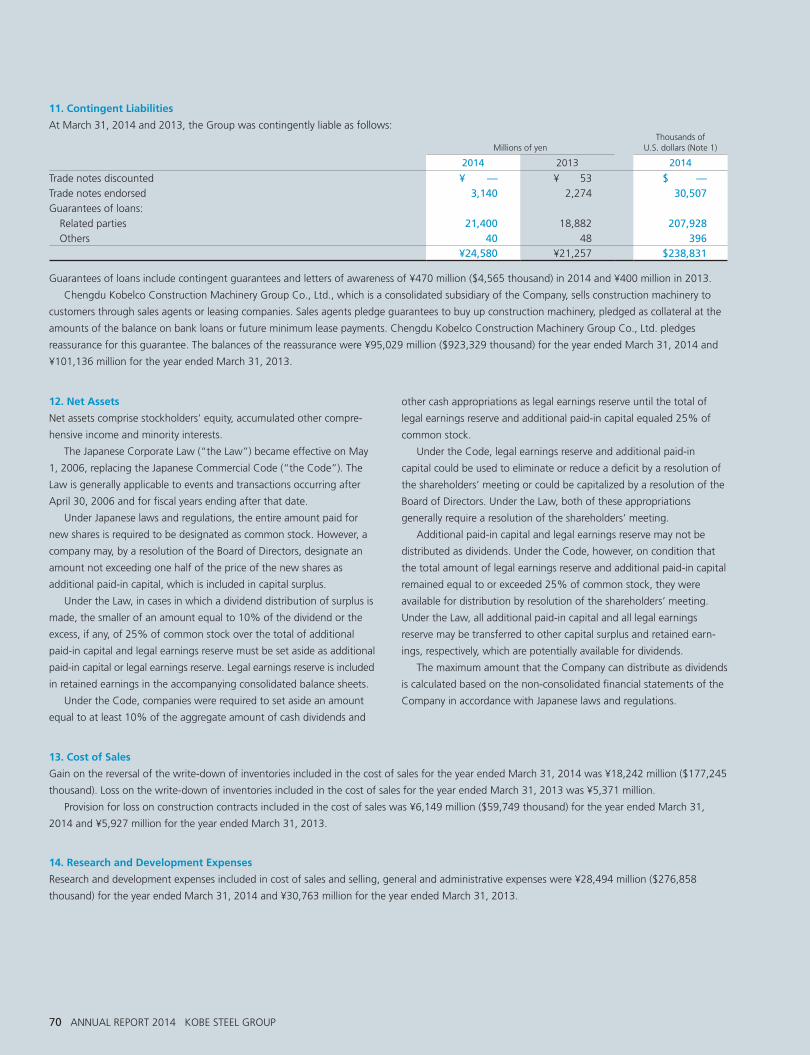
other cash appropriations as legal earnings reserve until the total of
legal earnings reserve and additional paid-in capital equaled 25% of
common stock.
Under the Code, legal earnings reserve and additional paid-in
capital could be used to eliminate or reduce a deficit by a resolution of
the shareholders’ meeting or could be capitalized by a resolution of the
Board of Directors. Under the Law, both of these appropriations
generally require a resolution of the shareholders’ meeting.
Additional paid-in capital and legal earnings reserve may not be
distributed as dividends. Under the Code, however, on condition that
the total amount of legal earnings reserve and additional paid-in capital
remained equal to or exceeded 25% of common stock, they were
available for distribution by resolution of the shareholders’ meeting.
Under the Law, all additional paid-in capital and all legal earnings
reserve may be transferred to other capital surplus and retained earn-
ings, respectively, which are potentially available for dividends.
The maximum amount that the Company can distribute as dividends
is calculated based on the non-consolidated financial statements of the
Company in accordance with Japanese laws and regulations.
13. Cost of Sales
Gain on the reversal of the write-down of inventories included in the cost of sales for the year ended March 31, 2014 was ¥18,242 million ($177,245
thousand). Loss on the write-down of inventories included in the cost of sales for the year ended March 31, 2013 was ¥5,371 million.
Provision for loss on construction contracts included in the cost of sales was ¥6,149 million ($59,749 thousand) for the year ended March 31,
2014 and ¥5,927 million for the year ended March 31, 2013.
14. Research and Development Expenses
Research and development expenses included in cost of sales and selling, general and administrative expenses were ¥28,494 million ($276,858
thousand) for the year ended March 31, 2014 and ¥30,763 million for the year ended March 31, 2013.
12. Net Assets
Net assets comprise stockholders’ equity, accumulated other compre-
hensive income and minority interests.
The Japanese Corporate Law (“the Law”) became effective on May
1, 2006, replacing the Japanese Commercial Code (“the Code”). The
Law is generally applicable to events and transactions occurring after
April 30, 2006 and for fiscal years ending after that date.
Under Japanese laws and regulations, the entire amount paid for
new shares is required to be designated as common stock. However, a
company may, by a resolution of the Board of Directors, designate an
amount not exceeding one half of the price of the new shares as
additional paid-in capital, which is included in capital surplus.
Under the Law, in cases in which a dividend distribution of surplus is
made, the smaller of an amount equal to 10% of the dividend or the
excess, if any, of 25% of common stock over the total of additional
paid-in capital and legal earnings reserve must be set aside as additional
paid-in capital or legal earnings reserve. Legal earnings reserve is included
in retained earnings in the accompanying consolidated balance sheets.
Under the Code, companies were required to set aside an amount
equal to at least 10% of the aggregate amount of cash dividends and
11. Contingent Liabilities
At March 31, 2014 and 2013, the Group was contingently liable as follows:
Millions of yenThousands of
U.S. dollars (Note 1)
2014 2013 2014
Trade notes discounted ¥ — ¥ 53 $ —Trade notes endorsed 3,140 2,274 30,507Guarantees of loans:
Related parties 21,400 18,882 207,928 Others 40 48 396
¥24,580 ¥21,257 $238,831
Guarantees of loans include contingent guarantees and letters of awareness of ¥470 million ($4,565 thousand) in 2014 and ¥400 million in 2013.
Chengdu Kobelco Construction Machinery Group Co., Ltd., which is a consolidated subsidiary of the Company, sells construction machinery to
customers through sales agents or leasing companies. Sales agents pledge guarantees to buy up construction machinery, pledged as collateral at the
amounts of the balance on bank loans or future minimum lease payments. Chengdu Kobelco Construction Machinery Group Co., Ltd. pledges
reassurance for this guarantee. The balances of the reassurance were ¥95,029 million ($923,329 thousand) for the year ended March 31, 2014 and
¥101,136 million for the year ended March 31, 2013.
70 ANNUAL REPORT 2014 KOBE STEEL GROUP
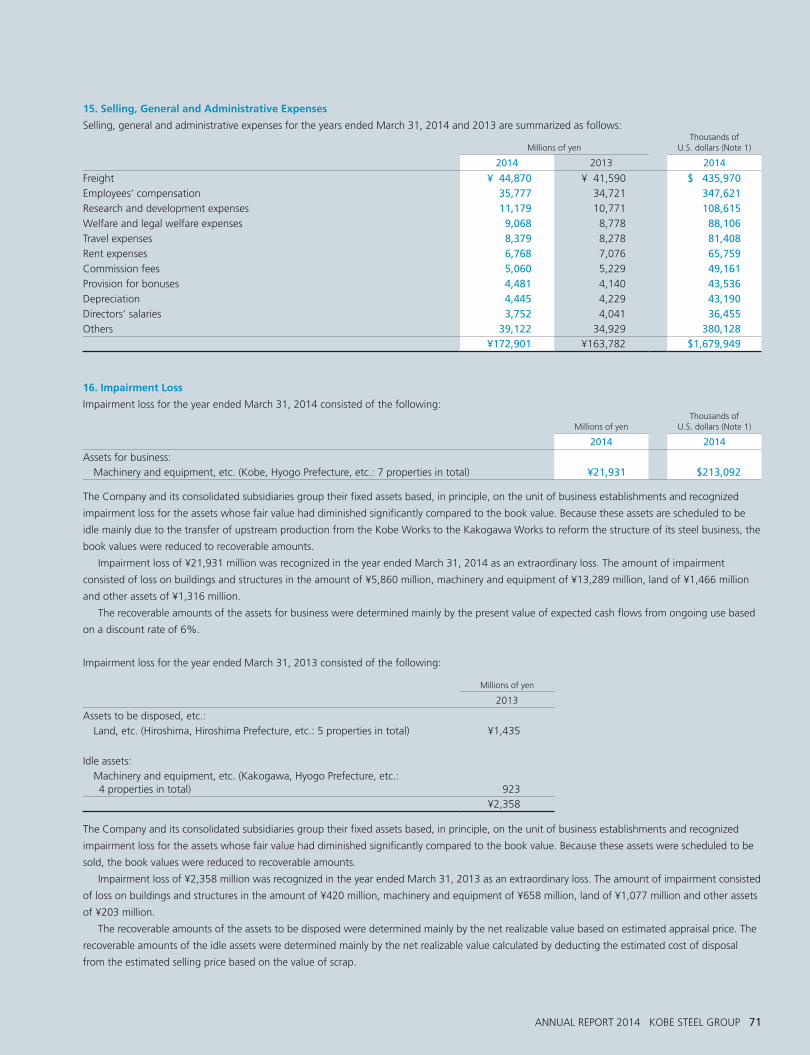
15. Selling, General and Administrative Expenses
Selling, general and administrative expenses for the years ended March 31, 2014 and 2013 are summarized as follows:
Millions of yenThousands of
U.S. dollars (Note 1)
2014 2013 2014
Freight ¥ 44,870 ¥ 41,590 $ 435,970Employees’ compensation 35,777 34,721 347,621Research and development expenses 11,179 10,771 108,615Welfare and legal welfare expenses 9,068 8,778 88,106Travel expenses 8,379 8,278 81,408Rent expenses 6,768 7,076 65,759Commission fees 5,060 5,229 49,161Provision for bonuses 4,481 4,140 43,536Depreciation 4,445 4,229 43,190Directors’ salaries 3,752 4,041 36,455Others 39,122 34,929 380,128
¥172,901 ¥163,782 $1,679,949
16. Impairment Loss
Impairment loss for the year ended March 31, 2014 consisted of the following:
Millions of yenThousands of
U.S. dollars (Note 1)
2014 2014
Assets for business: Machinery and equipment, etc. (Kobe, Hyogo Prefecture, etc.: 7 properties in total) ¥21,931 $213,092
The Company and its consolidated subsidiaries group their fixed assets based, in principle, on the unit of business establishments and recognized
impairment loss for the assets whose fair value had diminished significantly compared to the book value. Because these assets are scheduled to be
idle mainly due to the transfer of upstream production from the Kobe Works to the Kakogawa Works to reform the structure of its steel business, the
book values were reduced to recoverable amounts.
Impairment loss of ¥21,931 million was recognized in the year ended March 31, 2014 as an extraordinary loss. The amount of impairment
consisted of loss on buildings and structures in the amount of ¥5,860 million, machinery and equipment of ¥13,289 million, land of ¥1,466 million
and other assets of ¥1,316 million.
The recoverable amounts of the assets for business were determined mainly by the present value of expected cash flows from ongoing use based
on a discount rate of 6%.
Impairment loss for the year ended March 31, 2013 consisted of the following:
Millions of yen
2013
Assets to be disposed, etc.:
Land, etc. (Hiroshima, Hiroshima Prefecture, etc.: 5 properties in total) ¥1,435
Idle assets: Machinery and equipment, etc. (Kakogawa, Hyogo Prefecture, etc.: 4 properties in total)
923
¥2,358
The Company and its consolidated subsidiaries group their fixed assets based, in principle, on the unit of business establishments and recognized
impairment loss for the assets whose fair value had diminished significantly compared to the book value. Because these assets were scheduled to be
sold, the book values were reduced to recoverable amounts.
Impairment loss of ¥2,358 million was recognized in the year ended March 31, 2013 as an extraordinary loss. The amount of impairment consisted
of loss on buildings and structures in the amount of ¥420 million, machinery and equipment of ¥658 million, land of ¥1,077 million and other assets
of ¥203 million.
The recoverable amounts of the assets to be disposed were determined mainly by the net realizable value based on estimated appraisal price. The
recoverable amounts of the idle assets were determined mainly by the net realizable value calculated by deducting the estimated cost of disposal
from the estimated selling price based on the value of scrap.
ANNUAL REPORT 2014 KOBE STEEL GROUP 71
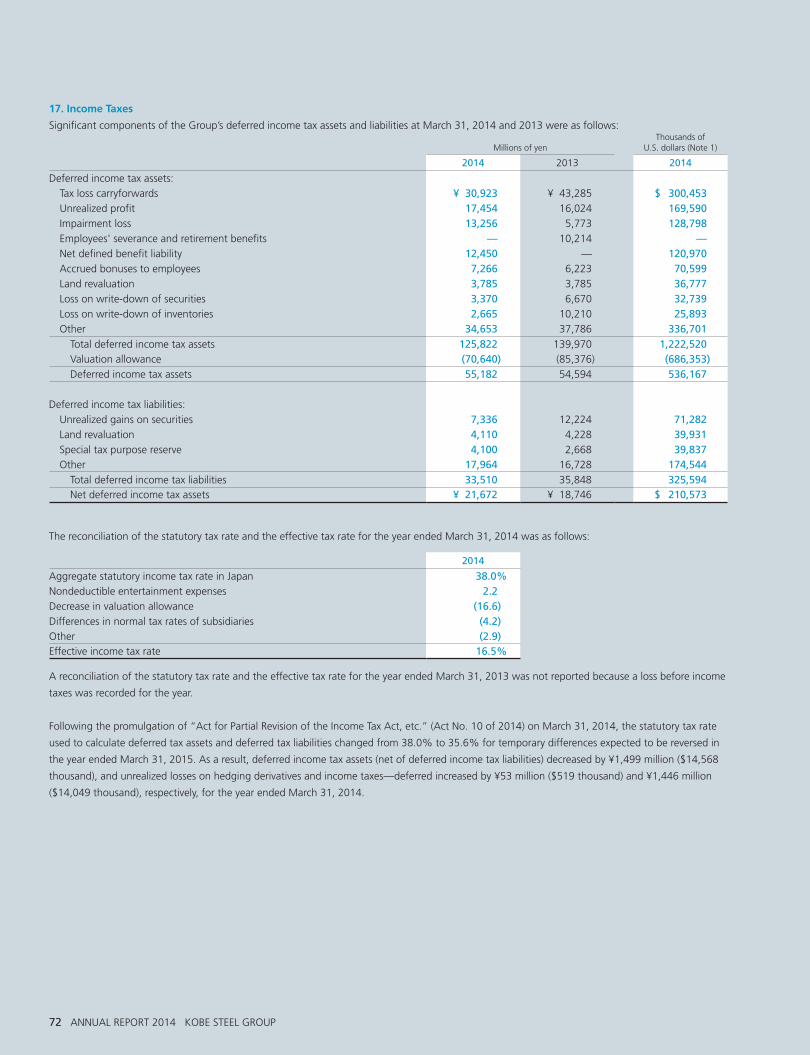
17. Income Taxes
Significant components of the Group’s deferred income tax assets and liabilities at March 31, 2014 and 2013 were as follows:
Millions of yenThousands of
U.S. dollars (Note 1)
2014 2013 2014
Deferred income tax assets:
Tax loss carryforwards ¥ 30,923 ¥ 43,285 $ 300,453 Unrealized profit 17,454 16,024 169,590 Impairment loss 13,256 5,773 128,798 Employees' severance and retirement benefits — 10,214 — Net defined benefit liability 12,450 — 120,970 Accrued bonuses to employees 7,266 6,223 70,599 Land revaluation 3,785 3,785 36,777 Loss on write-down of securities 3,370 6,670 32,739 Loss on write-down of inventories 2,665 10,210 25,893 Other 34,653 37,786 336,701 Total deferred income tax assets 125,822 139,970 1,222,520 Valuation allowance (70,640) (85,376) (686,353) Deferred income tax assets 55,182 54,594 536,167
Deferred income tax liabilities:
Unrealized gains on securities 7,336 12,224 71,282 Land revaluation 4,110 4,228 39,931 Special tax purpose reserve 4,100 2,668 39,837 Other 17,964 16,728 174,544 Total deferred income tax liabilities 33,510 35,848 325,594 Net deferred income tax assets ¥ 21,672 ¥ 18,746 $ 210,573
The reconciliation of the statutory tax rate and the effective tax rate for the year ended March 31, 2014 was as follows:
2014
Aggregate statutory income tax rate in Japan 38.0%Nondeductible entertainment expenses 2.2Decrease in valuation allowance (16.6)Differences in normal tax rates of subsidiaries (4.2)Other (2.9)Effective income tax rate 16.5%
A reconciliation of the statutory tax rate and the effective tax rate for the year ended March 31, 2013 was not reported because a loss before income
taxes was recorded for the year.
Following the promulgation of “Act for Partial Revision of the Income Tax Act, etc.” (Act No. 10 of 2014) on March 31, 2014, the statutory tax rate
used to calculate deferred tax assets and deferred tax liabilities changed from 38.0% to 35.6% for temporary differences expected to be reversed in
the year ended March 31, 2015. As a result, deferred income tax assets (net of deferred income tax liabilities) decreased by ¥1,499 million ($14,568
thousand), and unrealized losses on hedging derivatives and income taxes—deferred increased by ¥53 million ($519 thousand) and ¥1,446 million
($14,049 thousand), respectively, for the year ended March 31, 2014.
72 ANNUAL REPORT 2014 KOBE STEEL GROUP
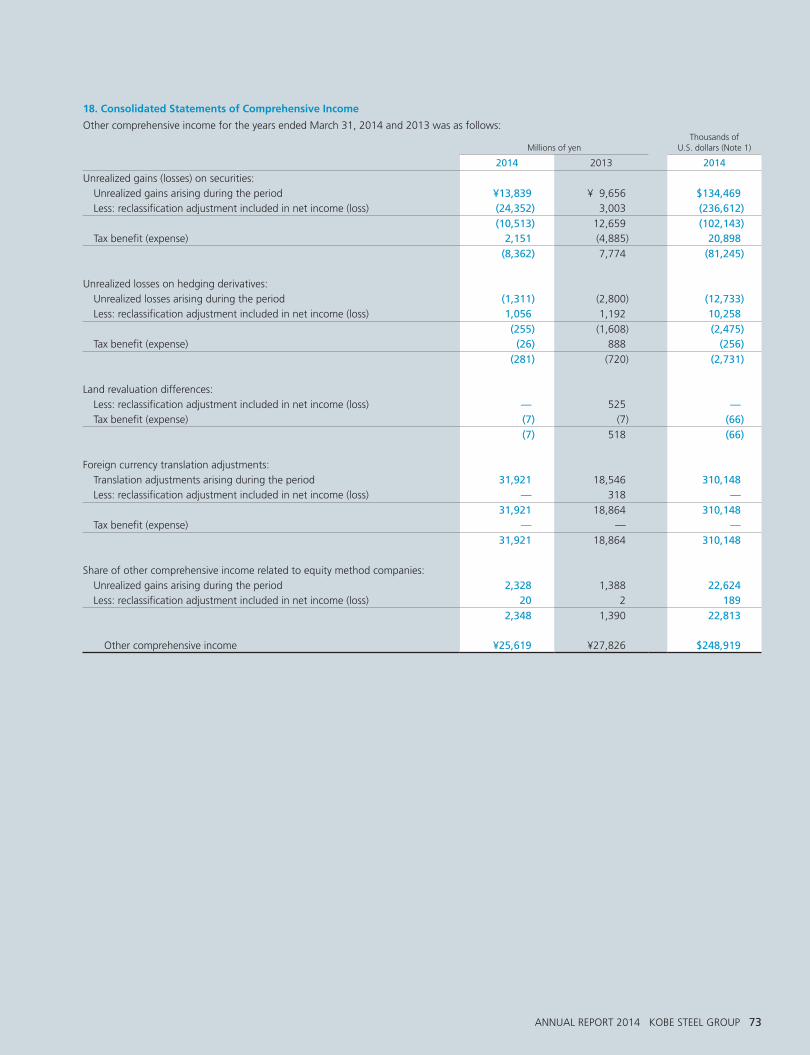
18. Consolidated Statements of Comprehensive Income
Other comprehensive income for the years ended March 31, 2014 and 2013 was as follows:
Millions of yenThousands of
U.S. dollars (Note 1)
2014 2013 2014
Unrealized gains (losses) on securities:
Unrealized gains arising during the period ¥13,839 ¥ 9,656 $134,469 Less: reclassification adjustment included in net income (loss) (24,352) 3,003 (236,612)
(10,513) 12,659 (102,143) Tax benefit (expense) 2,151 (4,885) 20,898
(8,362) 7,774 (81,245)
Unrealized losses on hedging derivatives:
Unrealized losses arising during the period (1,311) (2,800) (12,733) Less: reclassification adjustment included in net income (loss) 1,056 1,192 10,258
(255) (1,608) (2,475) Tax benefit (expense) (26) 888 (256)
(281) (720) (2,731)
Land revaluation differences:
Less: reclassification adjustment included in net income (loss) — 525 — Tax benefit (expense) (7) (7) (66)
(7) 518 (66)
Foreign currency translation adjustments:
Translation adjustments arising during the period 31,921 18,546 310,148 Less: reclassification adjustment included in net income (loss) — 318 —
31,921 18,864 310,148 Tax benefit (expense) — — —
31,921 18,864 310,148
Share of other comprehensive income related to equity method companies:
Unrealized gains arising during the period 2,328 1,388 22,624 Less: reclassification adjustment included in net income (loss) 20 2 189
2,348 1,390 22,813
Other comprehensive income ¥25,619 ¥27,826 $248,919
ANNUAL REPORT 2014 KOBE STEEL GROUP 73
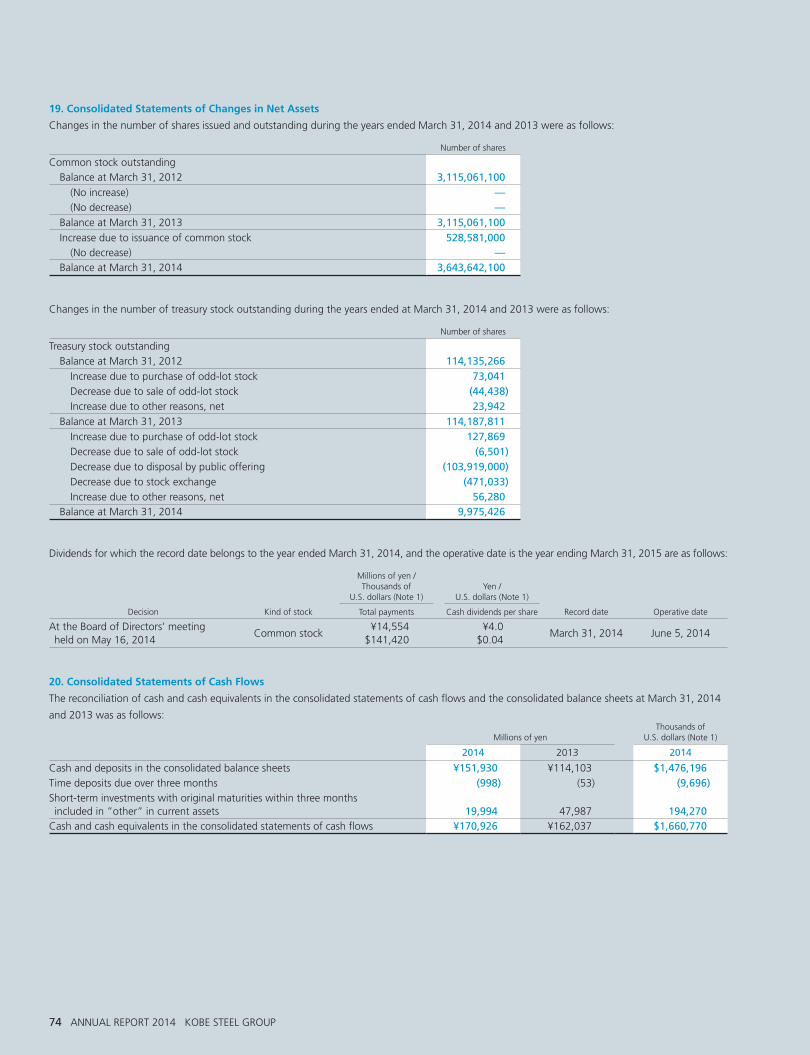
20. Consolidated Statements of Cash Flows
The reconciliation of cash and cash equivalents in the consolidated statements of cash flows and the consolidated balance sheets at March 31, 2014
and 2013 was as follows:
Millions of yenThousands of
U.S. dollars (Note 1)
2014 2013 2014
Cash and deposits in the consolidated balance sheets ¥151,930 ¥114,103 $1,476,196Time deposits due over three months (998) (53) (9,696)Short-term investments with original maturities within three months included in ”other” in current assets
19,994
47,987
194,270
Cash and cash equivalents in the consolidated statements of cash flows ¥170,926 ¥162,037 $1,660,770
19. Consolidated Statements of Changes in Net Assets
Changes in the number of shares issued and outstanding during the years ended March 31, 2014 and 2013 were as follows:
Number of shares
Common stock outstanding Balance at March 31, 2012 3,115,061,100 (No increase) — (No decrease) — Balance at March 31, 2013 3,115,061,100 Increase due to issuance of common stock 528,581,000 (No decrease) — Balance at March 31, 2014 3,643,642,100
Changes in the number of treasury stock outstanding during the years ended at March 31, 2014 and 2013 were as follows:
Number of shares
Treasury stock outstanding Balance at March 31, 2012 114,135,266 Increase due to purchase of odd-lot stock 73,041 Decrease due to sale of odd-lot stock (44,438) Increase due to other reasons, net 23,942 Balance at March 31, 2013 114,187,811 Increase due to purchase of odd-lot stock 127,869 Decrease due to sale of odd-lot stock (6,501) Decrease due to disposal by public offering (103,919,000) Decrease due to stock exchange (471,033) Increase due to other reasons, net 56,280 Balance at March 31, 2014 9,975,426
Dividends for which the record date belongs to the year ended March 31, 2014, and the operative date is the year ending March 31, 2015 are as follows:
Millions of yen / Thousands of
U.S. dollars (Note 1)
Yen / U.S. dollars (Note 1)
Decision Kind of stock Total payments Cash dividends per share Record date Operative date
At the Board of Directors’ meeting held on May 16, 2014
Common stock¥14,554
$141,420¥4.0
$0.04March 31, 2014 June 5, 2014
74 ANNUAL REPORT 2014 KOBE STEEL GROUP
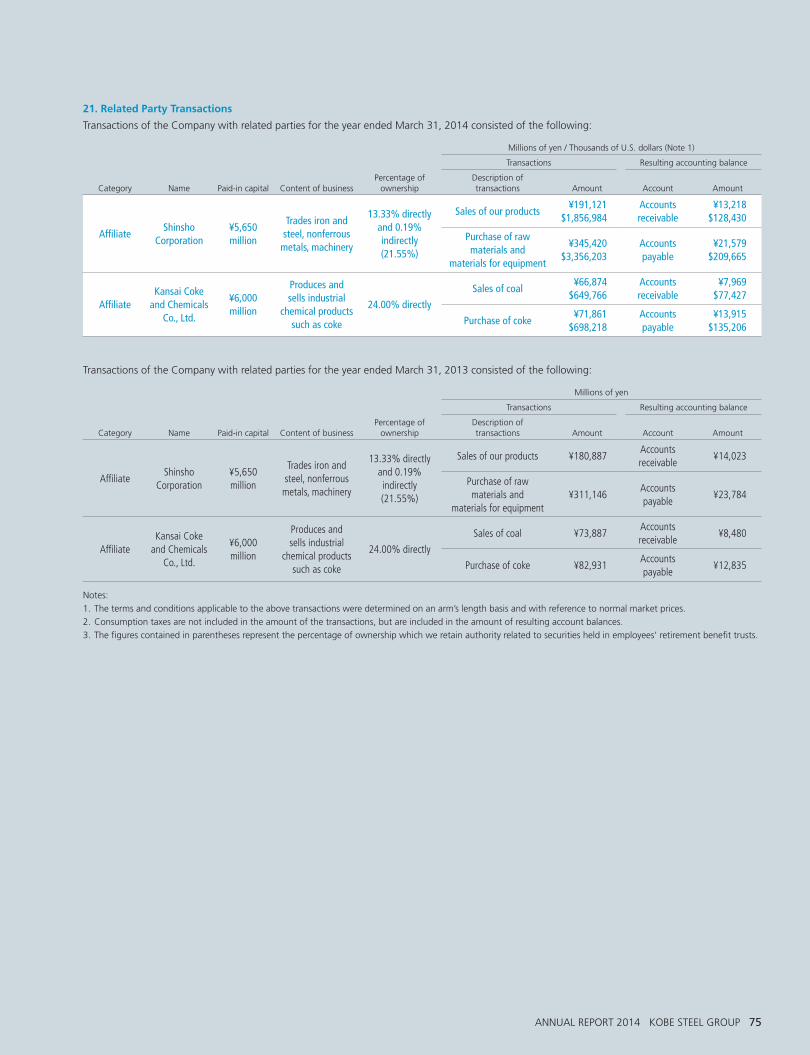
21. Related Party Transactions
Transactions of the Company with related parties for the year ended March 31, 2014 consisted of the following:
Millions of yen / Thousands of U.S. dollars (Note 1)
Transactions Resulting accounting balance
Category
Name
Paid-in capital
Content of business
Percentage of ownership
Description of transactions
Amount
Account
Amount
AffiliateShinsho
Corporation¥5,650 million
Trades iron and steel, nonferrous
metals, machinery
13.33% directly and 0.19% indirectly(21.55%)
Sales of our products¥191,121
$1,856,984Accounts receivable
¥13,218$128,430
Purchase of raw materials and
materials for equipment
¥345,420$3,356,203
Accounts payable
¥21,579$209,665
AffiliateKansai Coke
and Chemicals Co., Ltd.
¥6,000 million
Produces and sells industrial
chemical products such as coke
24.00% directly
Sales of coal¥66,874
$649,766Accounts receivable
¥7,969$77,427
Purchase of coke¥71,861
$698,218Accounts payable
¥13,915$135,206
Transactions of the Company with related parties for the year ended March 31, 2013 consisted of the following:
Millions of yen
Transactions Resulting accounting balance
Category
Name
Paid-in capital
Content of business
Percentage of ownership
Description of transactions
Amount
Account
Amount
AffiliateShinsho
Corporation¥5,650 million
Trades iron and steel, nonferrous metals, machinery
13.33% directly and 0.19% indirectly(21.55%)
Sales of our products ¥180,887Accounts receivable
¥14,023
Purchase of raw materials and
materials for equipment¥311,146
Accounts payable
¥23,784
AffiliateKansai Coke
and Chemicals Co., Ltd.
¥6,000 million
Produces and sells industrial
chemical products such as coke
24.00% directly
Sales of coal ¥73,887Accounts receivable
¥8,480
Purchase of coke ¥82,931Accounts payable
¥12,835
Notes:
1. The terms and conditions applicable to the above transactions were determined on an arm’s length basis and with reference to normal market prices.
2. Consumption taxes are not included in the amount of the transactions, but are included in the amount of resulting account balances.
3. The figures contained in parentheses represent the percentage of ownership which we retain authority related to securities held in employees’ retirement benefit trusts.
ANNUAL REPORT 2014 KOBE STEEL GROUP 75
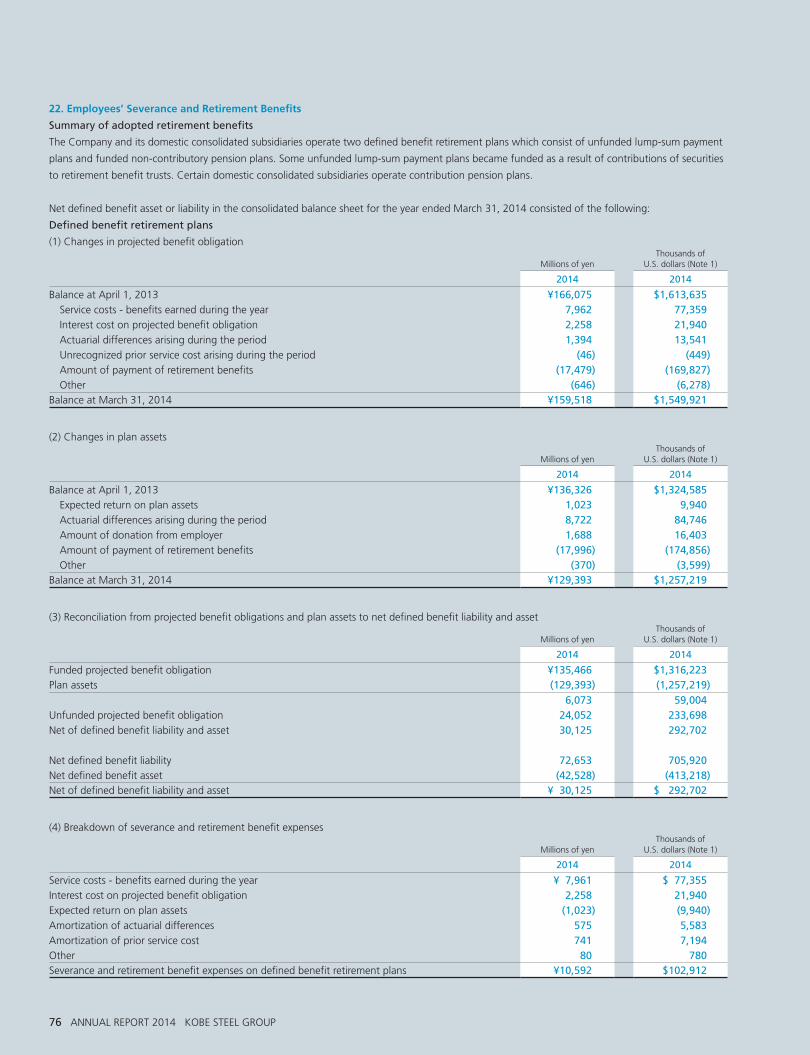
22. Employees’ Severance and Retirement Benefits
Summary of adopted retirement benefits
The Company and its domestic consolidated subsidiaries operate two defined benefit retirement plans which consist of unfunded lump-sum payment
plans and funded non-contributory pension plans. Some unfunded lump-sum payment plans became funded as a result of contributions of securities
to retirement benefit trusts. Certain domestic consolidated subsidiaries operate contribution pension plans.
Net defined benefit asset or liability in the consolidated balance sheet for the year ended March 31, 2014 consisted of the following:
Defined benefit retirement plans
(1) Changes in projected benefit obligation
Millions of yenThousands of
U.S. dollars (Note 1)
2014 2014
Balance at April 1, 2013 ¥166,075 $1,613,635 Service costs - benefits earned during the year 7,962 77,359 Interest cost on projected benefit obligation 2,258 21,940 Actuarial differences arising during the period 1,394 13,541 Unrecognized prior service cost arising during the period (46) (449) Amount of payment of retirement benefits (17,479) (169,827) Other (646) (6,278)Balance at March 31, 2014 ¥159,518 $1,549,921
(2) Changes in plan assets
Millions of yenThousands of
U.S. dollars (Note 1)
2014 2014
Balance at April 1, 2013 ¥136,326 $1,324,585 Expected return on plan assets 1,023 9,940 Actuarial differences arising during the period 8,722 84,746 Amount of donation from employer 1,688 16,403 Amount of payment of retirement benefits (17,996) (174,856) Other (370) (3,599)Balance at March 31, 2014 ¥129,393 $1,257,219
(3) Reconciliation from projected benefit obligations and plan assets to net defined benefit liability and asset
Millions of yenThousands of
U.S. dollars (Note 1)
2014 2014
Funded projected benefit obligation ¥135,466 $1,316,223Plan assets (129,393) (1,257,219)
6,073 59,004Unfunded projected benefit obligation 24,052 233,698Net of defined benefit liability and asset 30,125 292,702
Net defined benefit liability 72,653 705,920Net defined benefit asset (42,528) (413,218)Net of defined benefit liability and asset ¥ 30,125 $ 292,702
(4) Breakdown of severance and retirement benefit expenses
Millions of yenThousands of
U.S. dollars (Note 1)
2014 2014
Service costs - benefits earned during the year ¥ 7,961 $ 77,355Interest cost on projected benefit obligation 2,258 21,940Expected return on plan assets (1,023) (9,940)Amortization of actuarial differences 575 5,583Amortization of prior service cost 741 7,194Other 80 780Severance and retirement benefit expenses on defined benefit retirement plans ¥10,592 $102,912
76 ANNUAL REPORT 2014 KOBE STEEL GROUP
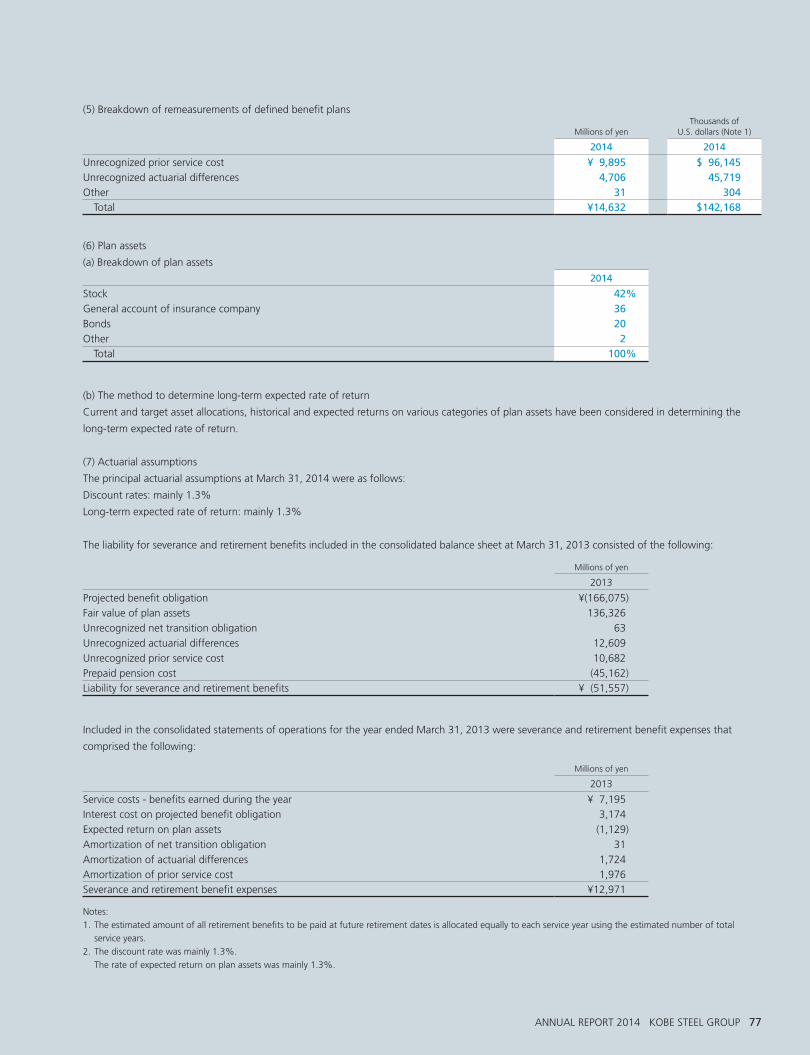
(5) Breakdown of remeasurements of defined benefit plans
Millions of yenThousands of
U.S. dollars (Note 1)
2014 2014
Unrecognized prior service cost ¥ 9,895 $ 96,145Unrecognized actuarial differences 4,706 45,719Other 31 304 Total ¥14,632 $142,168
(6) Plan assets
(a) Breakdown of plan assets
2014
Stock 42%General account of insurance company 36Bonds 20Other 2 Total 100%
(b) The method to determine long-term expected rate of return
Current and target asset allocations, historical and expected returns on various categories of plan assets have been considered in determining the
long-term expected rate of return.
(7) Actuarial assumptions
The principal actuarial assumptions at March 31, 2014 were as follows:
Discount rates: mainly 1.3%
Long-term expected rate of return: mainly 1.3%
The liability for severance and retirement benefits included in the consolidated balance sheet at March 31, 2013 consisted of the following:
Millions of yen
2013
Projected benefit obligation ¥(166,075)
Fair value of plan assets 136,326
Unrecognized net transition obligation 63
Unrecognized actuarial differences 12,609
Unrecognized prior service cost 10,682
Prepaid pension cost (45,162)Liability for severance and retirement benefits ¥ (51,557)
Included in the consolidated statements of operations for the year ended March 31, 2013 were severance and retirement benefit expenses that
comprised the following:
Millions of yen
2013
Service costs - benefits earned during the year ¥ 7,195
Interest cost on projected benefit obligation 3,174
Expected return on plan assets (1,129)
Amortization of net transition obligation 31
Amortization of actuarial differences 1,724
Amortization of prior service cost 1,976Severance and retirement benefit expenses ¥12,971
Notes:
1. The estimated amount of all retirement benefits to be paid at future retirement dates is allocated equally to each service year using the estimated number of total
service years.
2. The discount rate was mainly 1.3%.
The rate of expected return on plan assets was mainly 1.3%.
ANNUAL REPORT 2014 KOBE STEEL GROUP 77
23. Segment Information
(1) Overview of reportable segments
The reportable segments of the Group are defined as components
which separate financial information is available and reviewed regularly
by the Board of Directors to decide how to allocate management
resources and to evaluate operating performance.
The Company has business units based on products and services (a
part of which is made by subsidiaries) and every business unit and subsid-
iary plans domestic and foreign global strategies to operate business.
The Group consists of segments of business units and subsidiaries
based on products and services. The reportable segments of the Group
consist of the five business units of the Company and its subsidiaries
(Iron & Steel, Welding, Aluminum & Copper, Machinery and Engineering)
and three business units of the subsidiaries (Kobelco Eco-Solutions,
Kobelco Construction Machinery, Kobelco Cranes).
Main products and services of the reportable segments are as
follows:
Iron & Steel: steel wire rods and bars, steel plates, steel sheets, pig iron,
steel castings and forgings, titanium, steel powder and power supply
Welding: welding materials, welding systems, high functional materials
and related services
Aluminum & Copper: aluminum sheets and plates, aluminum extrusions
and fabricated products, aluminum castings and forgings, copper sheets
and strips and copper tubes
Machinery: tire and rubber machinery, plastic processing machinery,
advanced technology equipment, metalworking machinery, nonstandard
compressors, standard compressors, chemical and energy equipment,
nuclear power equipment and related services
Engineering: ironmaking processes, iron ore-pelletizing system, nuclear
power products, chemical weapons destruction services, steel structures
and sabo, urban transit systems and upgrading of low-rank coal
Kobelco Eco-Solutions: water treatment products, cooling towers, waste
treatment and recycling, process equipment and environmental analysis
Kobelco Construction Machinery: construction equipment, construction
recycling machinery, metal recycling machinery, resource recycling
machinery and forestry machinery
Kobelco Cranes: crawler cranes, wheel cranes, specialized base
machines for civil engineering and foundation work, and work vessels
Other Businesses: including Shinko Real Estate (real estate development,
construction, sales and other), Kobelco Research Institute (material
analysis and testing, structural assessment, manufacture and sale of
sputtering targets and other), and other businesses
(2) Methods to calculate sales, income (loss), assets and other
items of reportable segments
The accounting policies of the reportable segments are the same as
ones described in Note 2, “Summary of Significant Accounting
Policies.” Profit (loss) of reportable segments is based on ordinary
income (loss). Intersegment sales prices are based on prices applicable
to transactions with third parties.
With regard to the depreciation method for tangible fixed assets, the
Group had used principally the straight-line method for buildings and
structures and the declining-balance method for the machinery and
equipment. From the year ended March 31, 2014 the Group has
changed the depreciation method for machinery and equipment from
the declining-balance method to the straight-line method.
In response to changes in the business environment in recent years,
the Group has been increasing investments to bolster its competitive-
ness, although starting with the steel business conventional investments
to increase production capacity have been decreasing. In addition,
with a new medium-term business plan starting in the year ended
March 31, 2014, the Group anticipates a long and stable operation of
its production equipment, a leveling of maintenance costs for equip-
ment, and a reduction in obsolescence risks arising from changes in the
market environment and technology. Taking into account these condi-
tions, the Group has changed to the straight-line method in order to
match more appropriately to costs and earnings and accurately reflect
current business conditions.
Due to this change, in comparison to the previous depreciation
method, income has increased for the Iron & Steel segment by ¥17,929
million, the Welding segment by ¥213 million, the Aluminum & Copper
segment by ¥1,953 million, the Machinery segment by ¥589 million,
the Kobelco Eco-Solutions segment by ¥9 million, and Other Businesses
by ¥157 million, respectively. Loss for the Engineering segment has
decreased by ¥33 million.
78 ANNUAL REPORT 2014 KOBE STEEL GROUP
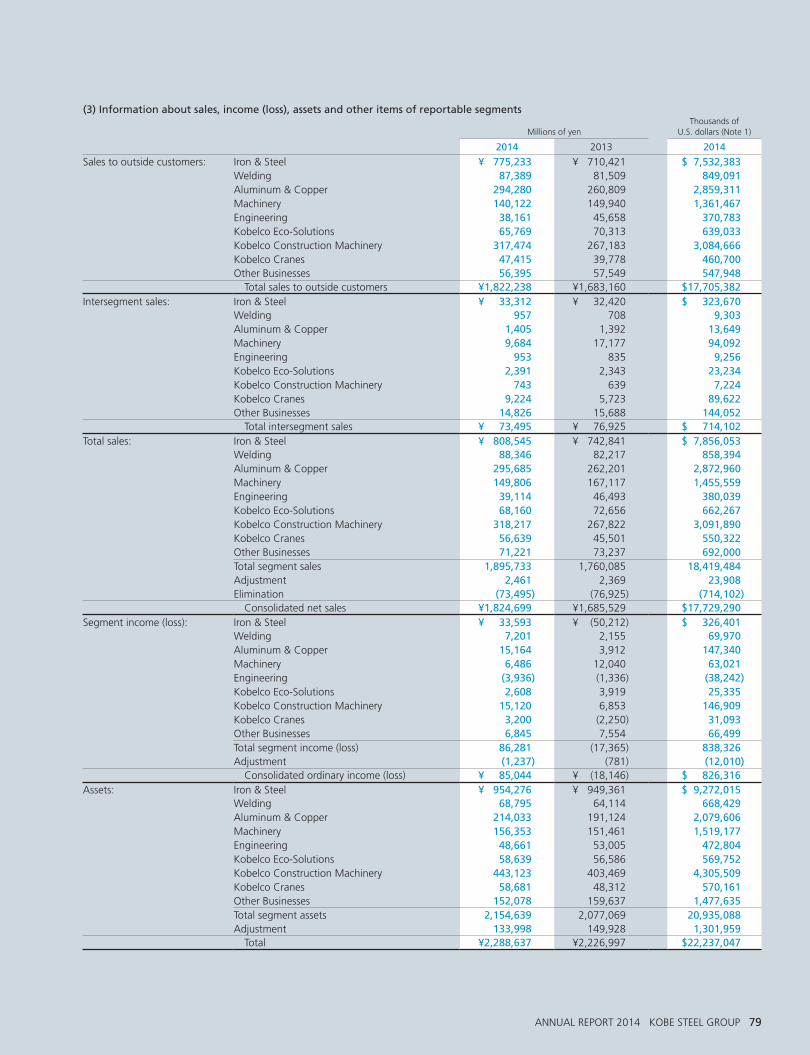
(3) Information about sales, income (loss), assets and other items of reportable segments
Millions of yenThousands of
U.S. dollars (Note 1)
2014 2013 2014
Sales to outside customers: Iron & Steel ¥ 775,233 ¥ 710,421 $ 7,532,383Welding 87,389 81,509 849,091Aluminum & Copper 294,280 260,809 2,859,311Machinery 140,122 149,940 1,361,467Engineering 38,161 45,658 370,783Kobelco Eco-Solutions 65,769 70,313 639,033Kobelco Construction Machinery 317,474 267,183 3,084,666Kobelco Cranes 47,415 39,778 460,700Other Businesses 56,395 57,549 547,948 Total sales to outside customers ¥1,822,238 ¥1,683,160 $17,705,382
Intersegment sales: Iron & Steel ¥ 33,312 ¥ 32,420 $ 323,670Welding 957 708 9,303Aluminum & Copper 1,405 1,392 13,649Machinery 9,684 17,177 94,092Engineering 953 835 9,256Kobelco Eco-Solutions 2,391 2,343 23,234Kobelco Construction Machinery 743 639 7,224Kobelco Cranes 9,224 5,723 89,622Other Businesses 14,826 15,688 144,052 Total intersegment sales ¥ 73,495 ¥ 76,925 $ 714,102
Total sales: Iron & Steel ¥ 808,545 ¥ 742,841 $ 7,856,053Welding 88,346 82,217 858,394Aluminum & Copper 295,685 262,201 2,872,960Machinery 149,806 167,117 1,455,559Engineering 39,114 46,493 380,039Kobelco Eco-Solutions 68,160 72,656 662,267Kobelco Construction Machinery 318,217 267,822 3,091,890Kobelco Cranes 56,639 45,501 550,322Other Businesses 71,221 73,237 692,000Total segment sales 1,895,733 1,760,085 18,419,484Adjustment 2,461 2,369 23,908Elimination (73,495) (76,925) (714,102) Consolidated net sales ¥1,824,699 ¥1,685,529 $17,729,290
Segment income (loss): Iron & Steel ¥ 33,593 ¥ (50,212) $ 326,401Welding 7,201 2,155 69,970Aluminum & Copper 15,164 3,912 147,340Machinery 6,486 12,040 63,021Engineering (3,936) (1,336) (38,242)Kobelco Eco-Solutions 2,608 3,919 25,335Kobelco Construction Machinery 15,120 6,853 146,909Kobelco Cranes 3,200 (2,250) 31,093Other Businesses 6,845 7,554 66,499Total segment income (loss) 86,281 (17,365) 838,326Adjustment (1,237) (781) (12,010) Consolidated ordinary income (loss) ¥ 85,044 ¥ (18,146) $ 826,316
Assets: Iron & Steel ¥ 954,276 ¥ 949,361 $ 9,272,015Welding 68,795 64,114 668,429Aluminum & Copper 214,033 191,124 2,079,606Machinery 156,353 151,461 1,519,177Engineering 48,661 53,005 472,804Kobelco Eco-Solutions 58,639 56,586 569,752Kobelco Construction Machinery 443,123 403,469 4,305,509Kobelco Cranes 58,681 48,312 570,161Other Businesses 152,078 159,637 1,477,635Total segment assets 2,154,639 2,077,069 20,935,088Adjustment 133,998 149,928 1,301,959 Total ¥2,288,637 ¥2,226,997 $22,237,047
ANNUAL REPORT 2014 KOBE STEEL GROUP 79
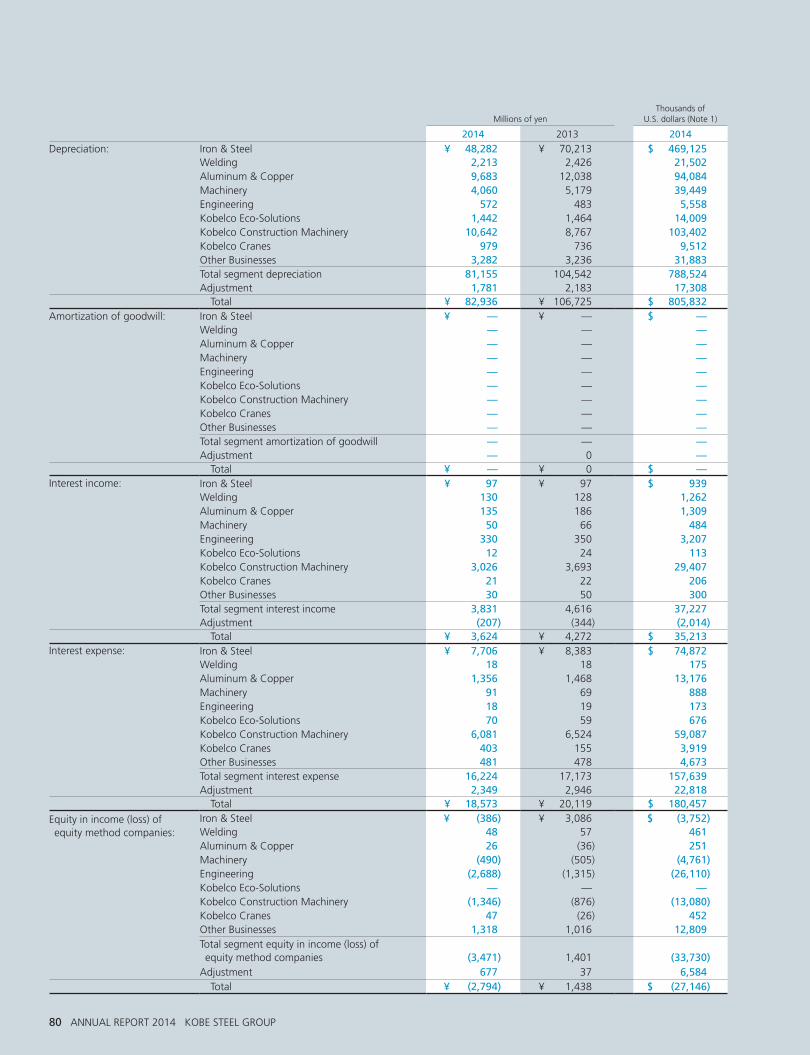
Millions of yen
Thousands of U.S. dollars (Note 1)
2014 2013 2014
Depreciation: Iron & Steel ¥ 48,282 ¥ 70,213 $ 469,125Welding 2,213 2,426 21,502Aluminum & Copper 9,683 12,038 94,084Machinery 4,060 5,179 39,449Engineering 572 483 5,558Kobelco Eco-Solutions 1,442 1,464 14,009Kobelco Construction Machinery 10,642 8,767 103,402Kobelco Cranes 979 736 9,512Other Businesses 3,282 3,236 31,883Total segment depreciation 81,155 104,542 788,524Adjustment 1,781 2,183 17,308 Total ¥ 82,936 ¥ 106,725 $ 805,832
Amortization of goodwill: Iron & Steel ¥ — ¥ — $ —Welding — — —Aluminum & Copper — — —Machinery — — —Engineering — — —Kobelco Eco-Solutions — — —Kobelco Construction Machinery — — —Kobelco Cranes — — —Other Businesses — — —Total segment amortization of goodwill — — —Adjustment — 0 — Total ¥ — ¥ 0 $ —
Interest income: Iron & Steel ¥ 97 ¥ 97 $ 939Welding 130 128 1,262Aluminum & Copper 135 186 1,309Machinery 50 66 484Engineering 330 350 3,207Kobelco Eco-Solutions 12 24 113Kobelco Construction Machinery 3,026 3,693 29,407Kobelco Cranes 21 22 206Other Businesses 30 50 300Total segment interest income 3,831 4,616 37,227Adjustment (207) (344) (2,014) Total ¥ 3,624 ¥ 4,272 $ 35,213
Interest expense: Iron & Steel ¥ 7,706 ¥ 8,383 $ 74,872Welding 18 18 175Aluminum & Copper 1,356 1,468 13,176Machinery 91 69 888Engineering 18 19 173Kobelco Eco-Solutions 70 59 676Kobelco Construction Machinery 6,081 6,524 59,087Kobelco Cranes 403 155 3,919Other Businesses 481 478 4,673Total segment interest expense 16,224 17,173 157,639Adjustment 2,349 2,946 22,818 Total ¥ 18,573 ¥ 20,119 $ 180,457
Equity in income (loss) of equity method companies:
Iron & Steel ¥ (386) ¥ 3,086 $ (3,752)Welding 48 57 461Aluminum & Copper 26 (36) 251Machinery (490) (505) (4,761)Engineering (2,688) (1,315) (26,110)Kobelco Eco-Solutions — — —Kobelco Construction Machinery (1,346) (876) (13,080)Kobelco Cranes 47 (26) 452Other Businesses 1,318 1,016 12,809Total segment equity in income (loss) of equity method companies
(3,471)
1,401
(33,730)
Adjustment 677 37 6,584 Total ¥ (2,794) ¥ 1,438 $ (27,146)
80 ANNUAL REPORT 2014 KOBE STEEL GROUP
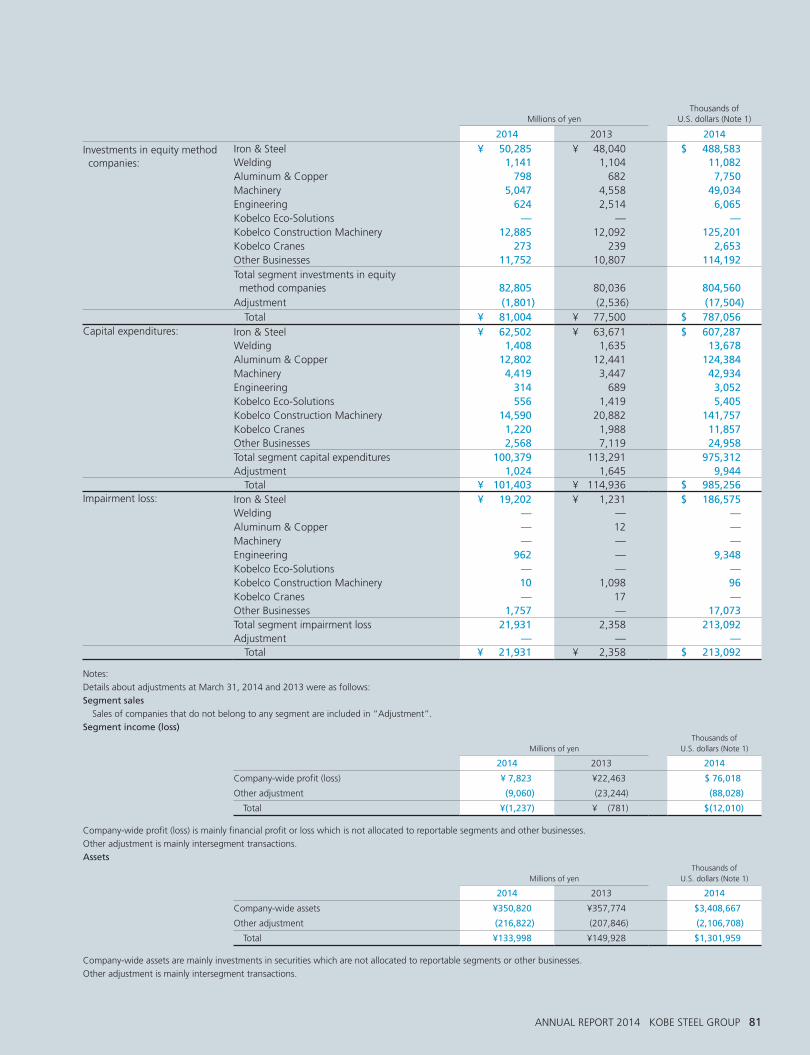
Millions of yen
Thousands of U.S. dollars (Note 1)
2014 2013 2014
Investments in equity method companies:
Iron & Steel ¥ 50,285 ¥ 48,040 $ 488,583Welding 1,141 1,104 11,082Aluminum & Copper 798 682 7,750Machinery 5,047 4,558 49,034Engineering 624 2,514 6,065Kobelco Eco-Solutions — — —Kobelco Construction Machinery 12,885 12,092 125,201Kobelco Cranes 273 239 2,653Other Businesses 11,752 10,807 114,192Total segment investments in equity method companies
82,805
80,036
804,560
Adjustment (1,801) (2,536) (17,504) Total ¥ 81,004 ¥ 77,500 $ 787,056
Capital expenditures: Iron & Steel ¥ 62,502 ¥ 63,671 $ 607,287Welding 1,408 1,635 13,678Aluminum & Copper 12,802 12,441 124,384Machinery 4,419 3,447 42,934Engineering 314 689 3,052Kobelco Eco-Solutions 556 1,419 5,405Kobelco Construction Machinery 14,590 20,882 141,757Kobelco Cranes 1,220 1,988 11,857Other Businesses 2,568 7,119 24,958Total segment capital expenditures 100,379 113,291 975,312Adjustment 1,024 1,645 9,944 Total ¥ 101,403 ¥ 114,936 $ 985,256
Impairment loss: Iron & Steel ¥ 19,202 ¥ 1,231 $ 186,575Welding — — —Aluminum & Copper — 12 —Machinery — — —Engineering 962 — 9,348Kobelco Eco-Solutions — — —Kobelco Construction Machinery 10 1,098 96Kobelco Cranes — 17 —Other Businesses 1,757 — 17,073Total segment impairment loss 21,931 2,358 213,092Adjustment — — — Total ¥ 21,931 ¥ 2,358 $ 213,092
Notes:
Details about adjustments at March 31, 2014 and 2013 were as follows:
Segment sales Sales of companies that do not belong to any segment are included in “Adjustment”.
Segment income (loss)
Millions of yenThousands of
U.S. dollars (Note 1)
2014 2013 2014
Company-wide profit (loss) ¥ 7,823 ¥22,463 $ 76,018
Other adjustment (9,060) (23,244) (88,028)
Total ¥(1,237) ¥ (781) $(12,010)
Company-wide profit (loss) is mainly financial profit or loss which is not allocated to reportable segments and other businesses.
Other adjustment is mainly intersegment transactions.
Assets
Millions of yenThousands of
U.S. dollars (Note 1)
2014 2013 2014
Company-wide assets ¥350,820 ¥357,774 $3,408,667
Other adjustment (216,822) (207,846) (2,106,708)
Total ¥133,998 ¥149,928 $1,301,959
Company-wide assets are mainly investments in securities which are not allocated to reportable segments or other businesses.
Other adjustment is mainly intersegment transactions.
ANNUAL REPORT 2014 KOBE STEEL GROUP 81

Depreciation Adjustment is related mainly to the assets of administrative departments which are not allocated to reportable segments or other businesses.
Interest income Adjustment is related mainly to intersegment transactions.
Interest expense Adjustment is related mainly to financial liabilities which are not allocated to reportable segments or other businesses.
Equity in income (loss) of equity method companies Adjustment is related mainly to the income (loss) of affiliates which is not allocated to reportable segments or other businesses.
Investments in equity method companies Adjustment is related mainly to intersegment transactions.
Capital expenditures Adjustment is related mainly to the assets of administrative departments which are not allocated to reportable segments or other businesses.
Related information
(1) Information by geographic area
(a) Net sales
Millions of yenThousands of
U.S. dollars (Note 1)
2014 2013 2014
Japan ¥1,179,140 ¥1,113,068 $11,456,857China 187,983 145,763 1,826,493Others 457,576 426,698 4,445,940 Total ¥1,824,699 ¥1,685,529 $17,729,290
(b) Property, plant and equipment by geographic location
Substantially all of the Group’s property, plant and equipment is located in Japan.
(2) Information by major customer
Net sales
Millions of yenThousands of
U.S. dollars (Note 1)
Related segment 2014 2013 2014
Shinsho Corporation Iron & Steel, etc. ¥248,619 ¥229,016 $2,415,653Metal One Corporation Iron & Steel, etc. ¥184,333 ¥173,368 $1,791,035
24. Net Income (Loss) Per Share
The basis of calculating net income (loss) per share for the years ended March 31, 2014 and 2013 was as follows:
Millions of yen
Thousands of shares
Yen
U.S. dollars (Note 1)
Net income (loss)
Weighted average number of shares
Net income (loss) per share
Net income (loss) per share
For the year ended March 31, 2014 Net income attributable to common stockholders ¥70,192 3,101,853 ¥22.63 $0.22For the year ended March 31, 2013 Net loss attributable to common stockholders (26,976) 3,000,911 (8.99) (0.10)
82 ANNUAL REPORT 2014 KOBE STEEL GROUP
Independent Auditor’s Report
To the Board of Directors of
Kobe Steel, Ltd.:
We have audited the accompanying consolidated financial statements of Kobe Steel, Ltd. and its consolidated subsidiaries (the
“Group”), which comprise the consolidated balance sheets as at March 31, 2014 and 2013, and the consolidated statements of
operations, statements of comprehensive income, statements of changes in net assets and statements of cash flows for the years
then ended, and a summary of significant accounting policies and other explanatory information.
Management’s Responsibility for the Consolidated Financial Statements
Management is responsible for the preparation and fair presentation of these consolidated financial statements in accordance with
accounting principles generally accepted in Japan, and for such internal control as management determines is necessary to enable
the preparation of consolidated financial statements that are free from material misstatements, whether due to fraud or error.
Auditor’s Responsibility
Our responsibility is to express an opinion on these consolidated financial statements based on our audits. We conducted our audits
in accordance with auditing standards generally accepted in Japan. Those standards require that we comply with ethical require-
ments and plan and perform the audit to obtain reasonable assurance about whether the consolidated financial statements are free
from material misstatement.
An audit involves performing procedures to obtain audit evidence about the amounts and disclosures in the consolidated finan-
cial statements. The procedures selected depend on our judgement, including the assessment of the risks of material misstatement
of the consolidated financial statements, whether due to fraud or error. In making those risk assessments, we consider internal
control relevant to the entity’s preparation and fair presentation of the consolidated financial statements in order to design audit
procedures that are appropriate in the circumstances, while the objective of the financial statement audit is not for the purpose of
expressing an opinion on the effectiveness of the entity’s internal control. An audit also includes evaluating the appropriateness of
accounting policies used and the reasonableness of accounting estimates made by management, as well as evaluating the overall
presentation of the consolidated financial statements.
We believe that the audit evidence we have obtained is sufficient and appropriate to provide a basis for our audit opinion.
Opinion
In our opinion, the consolidated financial statements present fairly, in all material respects, the financial position of Kobe Steel, Ltd.
and its consolidated subsidiaries as at March 31, 2014 and 2013, and their financial performance and cash flows for the years then
ended in accordance with accounting principles generally accepted in Japan.
Emphasis of Matter
Without qualifying our opinion, we draw attention to Note 2 to the consolidated financial statements, from the year ended March
31, 2014, the Group has changed the depreciation method for machinery and equipment from the declining-balance method to the
straight-line method.
Convenience Translation
The U.S. dollar amounts in the accompanying consolidated financial statements with respect to the year ended March 31, 2014 are
presented solely for convenience. Our audit also included the translation of yen amounts into U.S. dollar amounts and, in our opinion,
such translation has been made on the basis described in Note 1 to the consolidated financial statements.
June 25, 2014
Osaka, Japan
ANNUAL REPORT 2014 KOBE STEEL GROUP 83
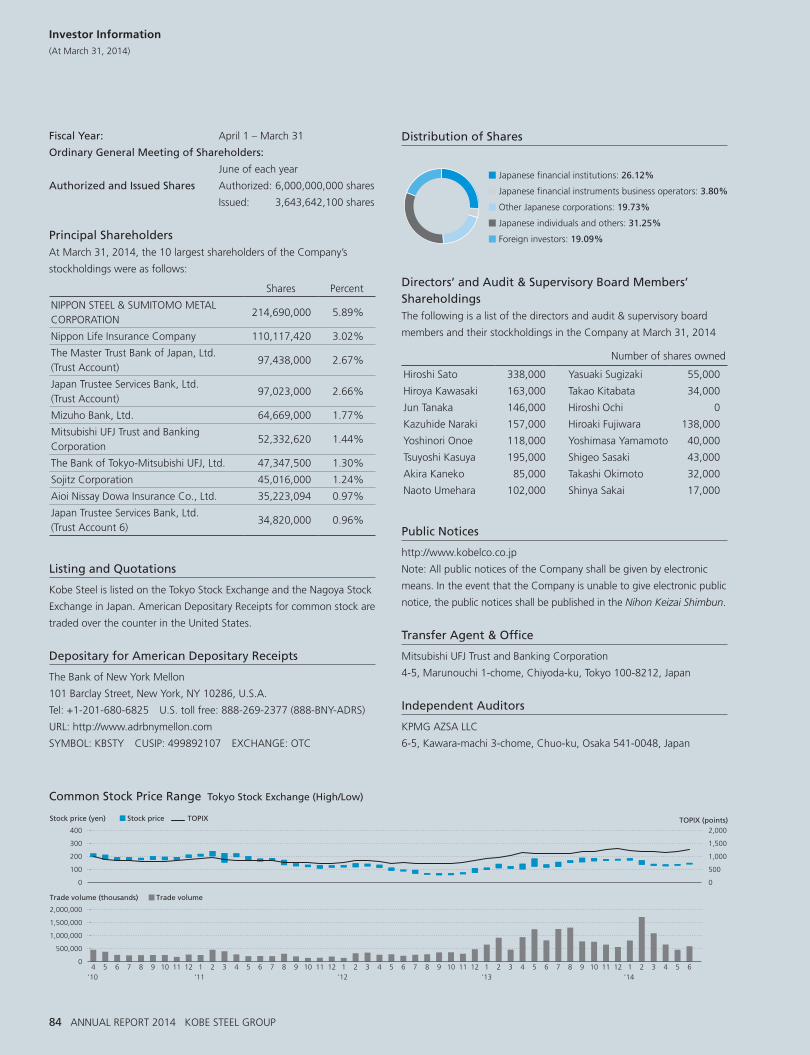
Investor Information(At March 31, 2014)
Fiscal Year: April 1 – March 31
Ordinary General Meeting of Shareholders:
June of each year
Authorized and Issued Shares Authorized: 6,000,000,000 shares
Issued: 3,643,642,100 shares
Principal ShareholdersAt March 31, 2014, the 10 largest shareholders of the Company’s
stockholdings were as follows:
Shares Percent
NIPPON STEEL & SUMITOMO METAL CORPORATION
214,690,000 5.89%
Nippon Life Insurance Company 110,117,420 3.02%
The Master Trust Bank of Japan, Ltd. (Trust Account)
97,438,000 2.67%
Japan Trustee Services Bank, Ltd. (Trust Account)
97,023,000 2.66%
Mizuho Bank, Ltd. 64,669,000 1.77%
Mitsubishi UFJ Trust and Banking Corporation
52,332,620 1.44%
The Bank of Tokyo-Mitsubishi UFJ, Ltd. 47,347,500 1.30%
Sojitz Corporation 45,016,000 1.24%
Aioi Nissay Dowa Insurance Co., Ltd. 35,223,094 0.97%
Japan Trustee Services Bank, Ltd. (Trust Account 6)
34,820,000 0.96%
Listing and Quotations
Kobe Steel is listed on the Tokyo Stock Exchange and the Nagoya Stock
Exchange in Japan. American Depositary Receipts for common stock are
traded over the counter in the United States.
Depositary for American Depositary Receipts
The Bank of New York Mellon
101 Barclay Street, New York, NY 10286, U.S.A.
Tel: +1-201-680-6825 U.S. toll free: 888-269-2377 (888-BNY-ADRS)
URL: http://www.adrbnymellon.com
SYMBOL: KBSTY CUSIP: 499892107 EXCHANGE: OTC
Distribution of Shares
Directors’ and Audit & Supervisory Board Members’ ShareholdingsThe following is a list of the directors and audit & supervisory board
members and their stockholdings in the Company at March 31, 2014
Number of shares owned
Hiroshi Sato 338,000 Yasuaki Sugizaki 55,000
Hiroya Kawasaki 163,000 Takao Kitabata 34,000
Jun Tanaka 146,000 Hiroshi Ochi 0
Kazuhide Naraki 157,000 Hiroaki Fujiwara 138,000
Yoshinori Onoe 118,000 Yoshimasa Yamamoto 40,000
Tsuyoshi Kasuya 195,000 Shigeo Sasaki 43,000
Akira Kaneko 85,000 Takashi Okimoto 32,000
Naoto Umehara 102,000 Shinya Sakai 17,000
Public Notices
http://www.kobelco.co.jp
Note: All public notices of the Company shall be given by electronic
means. In the event that the Company is unable to give electronic public
notice, the public notices shall be published in the Nihon Keizai Shimbun.
Transfer Agent & Office
Mitsubishi UFJ Trust and Banking Corporation
4-5, Marunouchi 1-chome, Chiyoda-ku, Tokyo 100-8212, Japan
Independent Auditors
KPMG AZSA LLC
6-5, Kawara-machi 3-chome, Chuo-ku, Osaka 541-0048, Japan
Common Stock Price Range Tokyo Stock Exchange (High/Low)
500
1,000
1,500
2,000
00
100
200
300
400
0
500,000
1,000,000
1,500,000
2,000,000
4’10
5 6 7 8 9 10 11 12 5 6 7 8 9 10 11 121’11
2 3 4 5 6 7 8 9 10 11 121’12
2 3 4 5 6 7 8 9 10 11 121’13
2 3 4 5 61’14
2 3 4
Stock price TOPIXStock price (yen)
Trade volumeTrade volume (thousands)
TOPIX (points)
� Japanese financial institutions: 26.12%
� Japanese financial instruments business operators: 3.80%
� Other Japanese corporations: 19.73%
� Japanese individuals and others: 31.25%
� Foreign investors: 19.09%
84 ANNUAL REPORT 2014 KOBE STEEL GROUP
Company Outline
(At March 31, 2014)
Company Name: Kobe Steel, Ltd.
Corporate Logo and Brand Name of the Kobe Steel Group:
Founded: September 1905
Incorporated: June 1911
Capital: ¥250,930,033,900
President & CEO: Hiroya Kawasaki
Employees: 10,586 (Consolidated 36,019)
Information:
Kobe Head Office: 2-4, Wakinohama-Kaigandori 2-chome, Chuo-ku, Kobe, Hyogo 651-8585, Japan
Tel: +81-78-261-5111
Tokyo Head Office: IR Group, Corporate Planning Department, Kobe Steel, Ltd.
9-12, Kita-Shinagawa 5-chome, Shinagawa-ku, Tokyo 141-8688, Japan
Tel: +81-3-5739-6045 Fax: +81-3-5739-5973
USA: Kobe Steel USA Inc.
535 Madison Avenue, 5th Floor, New York, NY 10022, U.S.A.
Tel: +1-212-751-9400 Fax: +1-212-355-5564
URL: http://www.kobelco.com
ANNUAL REPORT 2014 KOBE STEEL GROUP 85
14087000PR-IRC Printed in Japan
This report is printed on environmentally friendly paper with vegetable oil-based ink.
KO
BE STEEL GRO
UP A
NN
UA
L REPORT 2014