Embed Size (px)
Citation preview

8/13/2019 Zhao Xueheng 200408 Phd
http://slidepdf.com/reader/full/zhao-xueheng-200408-phd 1/127
ANALYSIS OF FUNGAL DEGRADATION PRODUCTS OF AZO DYES
by
XUEHENG ZHAO
(Under the Direction of Ian R. Hardin)
ABSTRACT
Azo dyes, which represent about one- half of all dyes in common use, are also the most common
synthetic colorants released into the environment. Bioremediation of azo dyes in textile waste
effluents by fungi is an alternative to conventional methods for its relatively low expense
involved and environmental friendly nature. However, knowledge of fungal degradation
mechanisms of organic pollutants including dyes is still lacking. This study employed a
comprehensive approach for investigating the degradation of carefully chosen model azo dyes by
white rot fungi using a wide spectrum of analytical techniques. The metabolites of ionized and
unionized azo dyes were identified and quantified. Possible pathways leading to formation of
these products are discussed.
INDEX WORDS: Azo dyes, White rot fungi, Biodegradation, Mechanism, Identification,High performance liquid chromatography, Capillary electrophoresis,
Electrospray-mass spectrometry, Gas chromatography- massspectrometry, Thin layer chromatography

8/13/2019 Zhao Xueheng 200408 Phd
http://slidepdf.com/reader/full/zhao-xueheng-200408-phd 2/127
ANALYSIS OF FUNGAL DEGRADATION PRODUCTS OF AZO DYES
by
XUEHENG ZHAO
B.E. Beijing Institute of Clothing Technology, China, 1994
M.E. Beijing Institute of Clothing Technology, China, 1997
A Dissertation Submitted to the Graduate Faculty of The University of Georgia in Partial
Fulfillment of the Requirements for the Degree
DOCTOR OF PHILOSOPHY
ATHENS, GEORGIA
2004

8/13/2019 Zhao Xueheng 200408 Phd
http://slidepdf.com/reader/full/zhao-xueheng-200408-phd 3/127
© 2004
Xueheng Zhao
All Rights Reserved

8/13/2019 Zhao Xueheng 200408 Phd
http://slidepdf.com/reader/full/zhao-xueheng-200408-phd 4/127
ANALYSIS OF FUNGAL DEGRADATION PRODUCTS OF AZO DYES
by
XUEHENG ZHAO
Major Professor: Ian R. Hardin
Committee: George L. Baughman
Dennis R. PhillipsDanny E. Akin
Electronic Version Approved:
Maureen Grasso
Dean of the Graduate SchoolThe University of Georgia
August 2004

8/13/2019 Zhao Xueheng 200408 Phd
http://slidepdf.com/reader/full/zhao-xueheng-200408-phd 5/127
DEDICATION
To my parents, for their love and patience in me.
iv

8/13/2019 Zhao Xueheng 200408 Phd
http://slidepdf.com/reader/full/zhao-xueheng-200408-phd 6/127
ACKNOWLEDGEMENTS
The past five years have been very enriching and have taught me many things. I would
like to thank many people who made my study at Georgia successful.
I would like to thank Dr. Ian R. Hardin for his support, guidance and for letting me know
the importance to communicate with people in different fields.
Without the support of Prof. George L. Baughman, I would not learn so much from my
research. His love in chemistry inspired me and his encouragement and confidence in me
motivated me to perform the best in the daily work. Special thanks to Dr. Dennis R. Phillips for
his help and guidance in mass spectrometry setup and operation, without which a major part of
my dissertation would not have been possible. I would also like to thank Dr. Danny E. Akin for
serving on my committee.
I appreciate Yiping, Wang, Susan, Min and other TMI faulty, staff and graduate students,
who have given me valuable help and friendship and contributed my success in my study.
Finally, my special gratitude goes to my parents and my sister for their forever love and
support. I would like thank my wife, Yarong, without her tremendous help and patience, I would
not be of success in my life.
v

8/13/2019 Zhao Xueheng 200408 Phd
http://slidepdf.com/reader/full/zhao-xueheng-200408-phd 7/127
TABLE OF CONTENTS
Page
ACKNOWLEDGEMENTS.............................................................................................................v
LIST OF TABLES........................................................................................................................ vii
LIST OF FIGURES ..................................................................................................................... viii
CHAPTER
1 INTRODUCTION AND REVIEW OF LITERATURE ...............................................1
2 MATERIALS AND METHODS.................................................................................21
3 IDENTIFICATION AND QUANTIFICATION OF DEGRADATION PRODUCTS
OF DISPERSE ORANGE 3....................................................................................32
4 IDENTIFICATION AND QUANTIFICATION OF DEGRADATION PRODUCTS
FROM DISPERSE YELLOW 3 .............................................................................59
5 IDENTIFICATION AND QUANTIFICATION OF PRODUCTS FROM MODEL
IONIC DYES BY CAPILLARY ELECTROPHORESIS – MASS
SPECTROMETRY AND HPLC.............................................................................71
6 CONCLUSION AND FURTHER DISCUSSION ....................................................106
REFERENCES ............................................................................................................................109
vi

8/13/2019 Zhao Xueheng 200408 Phd
http://slidepdf.com/reader/full/zhao-xueheng-200408-phd 8/127
LIST OF TABLES
Page
Table 2.1: Model azo dyes used in this study................................................................................29
Table 2.2: Composition of Kirk’s medium....................................................................................30
Table 3.1: TLC analysis of DO3 degradation samples..................................................................41
Table 3.2: UV-Vis spectrophotometric analysis of DO3 in degradation.......................................42
Table 3.3: Mobile phase program for the HPLC gradient .............................................................43
Table 4.1: TLC analysis of DY3 degradation samples..................................................................63
Table 4.2: UV-Vis spectrophotometric analysis of DY3 in degradation.......................................64
Table 5.1: Mass balance of products from model azo dyes degradation by Pleurotus ostreatus..81
Table 5.2: Calibration curves for products of ionic model azo compounds ..................................82
vii

8/13/2019 Zhao Xueheng 200408 Phd
http://slidepdf.com/reader/full/zhao-xueheng-200408-phd 9/127
LIST OF FIGURES
Page
Figure 1.1: Catalytic cycle of heme-containing peroxidases ........................................................18
Figure 1.2: Illustration of the catalytic cycle of laccases...............................................................19
Figure 1.3: Interface of CE-MS .....................................................................................................20
Figure 2.1: Structures of model azo dyes.......................................................................................31
Figure 3.1: Identification of products from DO3 and metabolites ofPleurotus ostreatus
using
GC-MS.........................................................................................................................44
Figure 3.2: Mass spectra of standards and Compounds.................................................................45
Figure 3.3: UV-Vis spectra of DO3 during biodegradation by P. ostreatus .................................52
Figure 3.4: Separation of veratryl alcohol, 4-nitroaniline, veratryl aldehyde, 4-nitrophenol,
nitrobenzene, and 4-nitroanisole standards by HPLC..................................................53
Figure 3.5: Effect of temperature on HPLC (30°C).......................................................................54
Figure 3.6: Blank culture medium and culture medium spiked with standards.............................55
Figure 3.7: Kinetic profiles of degradation products from DO3 by Pleurotus ostreatus ..............56
Figure 3.8: Diagram of biodegradation pathway of DO3 by Pleurotus ostreatus.........................57
Figure 3.9: Detection of 4-nitroanisole as the major degradation product from 4-nitrophenol by
Pleurotus ostreatus
using GC-MS...............................................................................58
Figure 4.1: Identification of acetanilide as the major degradation product from DY3 by Pleurotus
ostreatus using GC-MS................................................................................................65
Figure 4.2: Mass spectra of major product (acetanilide) from DY3 by Pleurotus ostreatus.........66
viii

8/13/2019 Zhao Xueheng 200408 Phd
http://slidepdf.com/reader/full/zhao-xueheng-200408-phd 10/127
Figure 4.3: HPLC chromatograms of fungal degradation samples from DY3..............................67
Figure 4.4: UV-Vis spectra of DY3 during biodegradation by P. ostreatus .................................68
Figure 4.5: Kinetic profile of acetanilide from DY3 by Pleurotus ostreatus ................................69
Figure 4.6: Formation of acetanilide from DY3 degradation by Pleurotus ostreatus ...................70
Figure 5.1: Mass spectrum of 4HABA anion with CE-ESI-MS....................................................83
Figure 5.2: Mass spectrum of Orange II anion with CE-ESI-MS..................................................84
Figure 5.3: Effect of the composition of sheath liquid on ion intensity with CE-MS...................85
Figure 5.4: Effect of the nebulizing gas flow on ion intensity with CE-MS .................................86
Figure 5.5: Effect of the drying gas flow on ion intensity with CE-MS........................................87
Figure 5.6: Effect of the drying gas temperature on ion intensity with CE-MS............................88
Figure 5.7: Effect of concentration of running buffer on ion intensity with CE-MS ....................89
Figure 5.8: CE-MS analysis of fungal degradation of Orange II: base peak electrophorogram
before biodegradation ..................................................................................................90
Figure 5.9: CE-MS analysis of fungal degradation of Orange II: base peak electrophorogram
after biodegradation (2 days) .......................................................................................91
Figure 5.10: CE-MS analysis of product 1, benesulfonic acid, from Orange II: mass spectrum
and extracted ion electrophorogram (m/z 157)..........................................................92
Figure 5.11: CE-MS analysis of product 2, 4-hydroxy-benesulfonic acid, from Orange II: mass
spectrum and extracted ion electrophorogram (m/z 173) ..........................................93
Figure 5.12: CE-MS analysis of standard 4-hydroxy-benzenesulfonic acid, sodium salt: mass
spectrum and extracted ion electrophorogram (m/z 173) ..........................................94
Figure 5.13: CE-MS analysis of standard benzenesulfonic acid, sodium salt: mass spectrum and
extracted ion electrophorogram (m/z 157).................................................................95
ix

8/13/2019 Zhao Xueheng 200408 Phd
http://slidepdf.com/reader/full/zhao-xueheng-200408-phd 11/127
Figure 5.14: HPLC analysis of fungal degradation of Orange II: identification of 1,2-
naphthoquinone as a product .....................................................................................96
Figure 5.15: CE-MS analysis of fungal degradation of 4HABA: Base peak electrophorogram
before biodegradation ................................................................................................98
Figure 5.16: CE-MS analysis of fungal degradation of 4HABA: Base peak electrophorogram
after biodegradation (2 days) .....................................................................................99
Figure 5.17: CE-MS analysis of product 1, benzenesulfonic acid, from 4HABA: mass spectrum
and extracted ion electrophorogram (m/z 157)........................................................100
Figure 5.18: CE-MS analysis of product 2, 4-hydroxy-benzenesulfonic acid, from 4HABA: mass
spectrum and extracted ion electrophorogram (m/z 173) ........................................101
Figure 5.19: Kinetic profiles of fungal degradation of 4HABA by Pleurotus ostreatus.............102
Figure 5.20: Kinetic profiles of fungal degradation of Orange II by Pleurotus ostreatus...........103
Figure 5.21: Formation of degradation products of 4HABA by Pleurotus ostreatus .................104
Figure 5.22: Formation of degradation products of Orange II by Pleurotus ostreatus ...............105
x

8/13/2019 Zhao Xueheng 200408 Phd
http://slidepdf.com/reader/full/zhao-xueheng-200408-phd 12/127
CHAPTER 1
INTRODUCTION AND REVIEW OF LITERATURE
Azo dyes, which represent about one-half of all dyes in common use, are employed as
coloring agents in the food, pharmaceutical, and textile industries. The popularity and
widespread use of azo dyes is due to several factors. As a group, they are color-fast and
encompass the entire visible spectrum, and many are easily synthesized from inexpensive and
easily obtained starting materials. Also azo dyes are typically amenable to structural
modification, and can be made to bind to most synthetic and natural textile fibers.
It is estimated that about 15 percent of dyes is released into waste water during textile
processing (Wesenberg et al., 2003), with azo dyes being the most common synthetic colorants
released into the environment (Bumpus, 1995). Because they are highly colored, azo dyes are
readily apparent and can create a significant environmental problem by affecting water
transparency as well as aesthetic problems (Banat et al., 1996). Dyes in wastewater not only
present aesthetic objections, but they can pose threats to public health. Some of the dyes, their
precursors, or their biotransformation products such as aromatic amines, have been shown to be
carcinogenic (Razo-Flores et al., 1997). Most textile effluents have to be treated to remove these
dyes to meet increasingly stringent legislation or to meet local citizenry objections.
Dyes are designed to be resistant to light, water and oxidizing agents, so it is difficult to
remove them once they are released into the environment. Dye-containing effluents are only
slightly decolorized by conventional biological wastewater treatments (Wesenberg et al., 2003;
Shaul et al., 1991). Generally, textile dyes in wastewater can be physically or chemically
1

8/13/2019 Zhao Xueheng 200408 Phd
http://slidepdf.com/reader/full/zhao-xueheng-200408-phd 13/127
removed by flocculation, adsorption, extraction, filtration or oxidation. Most physical methods
simply accumulate and concentrate dyes and create solid waste, but a disposal problem still
exists. Chemical oxidation with either peroxide or ozone can destroy dyestuffs effectively but
this approach is very expensive.
It is necessary to clarify the concepts of decolorization, degradation, and mineralization of
dyes in that these words often occur in the literature and sometimes were misused.
Decolorization is simply the disappearance of the color in wastewater without the actual
breaking apart of the dye molecules, which does not necessarily mean degradation of the
complex dye molecules. Degradation is the destruction of the large dye molecule to smaller
components, along with the breakdown of the chromophores. While chromophore groups of
dyes may be destroyed, the intermediate produced may be more toxic than the original
compounds and could present significant problems for receiving water bodies (Hao et al., 2000).
Mineralization means organic compounds are converted to inorganic compounds, i.e., nitrate,
carbon dioxide, and water. In this case, a complete detoxification is achieved and no secondary
pollution will be introduced.
Bioremediation of azo dyes in textile waste effluents by bacteria or fungi is an alternative to
conventional methods and a very promising area of study because of the relatively low expense
involved. It has been shown that microorganisms are able to utilize a wide of variety of organic
compounds as precursors for the synthesis of their own cell material or as sources of energy,
even when such compounds are present at low concentrations in the environment (Egli, 1995).
Bioremediation includes biodegradation and biotransformation, with a goal to mineralize
hazardous contaminants in the environment. Thus, there is less potential for environmental
2

8/13/2019 Zhao Xueheng 200408 Phd
http://slidepdf.com/reader/full/zhao-xueheng-200408-phd 14/127
impact with bioremediation because this method is targeted to break down the dye molecules to
non-toxic inorganic compounds.
A problem emerges when anaerobic bacteria are used in degradation of azo dyes. In most
cases, bacterial anaerobic degradation is initiated by the reduction of the azo linkage to generate
aromatic amines (Spadaro et al., 1992), which may be strongly carcinogenic and are themselves
a disposal problem.
By far the single class of microorganisms most efficient in breaking down synthetic dyes is
white rot fungi (Wesenberg et al., 2003). The nonspecific nature of the lignin-degrading systems
of white rot fungi is a potential advantage for biotreatment of textile effluents, since a mixture of
dyes, surfactants and other compounds exist in the wastewater. Another important advantage for
degradation of azo dyes using white rot fungi is that ligninolytic enzymes degrade azo dyes by
oxidation, in contrast to the reduction pathway in bacterial degradation.
Previous work in our laboratories demonstrated the feasibility of using white rot fungi to
decolorize a range of commercial dyes of different structures (azo, disazo, anthraquinone) (Cao,
2000). Various white rot fungi, including Phanerochaete chrysosporium, Pycnoporus
cinnabarinus, Trametes versicolor, Ceriporiopsis subvermispora, Cyathus stercoreus, Pleurotus
ostreatus, Phellinus tremellia, Phellinus oxysponum, and Phellinus pini, were screened for their
ability to decolorize commercially used dyes. Among them, Pleurotus ostreatus demonstrated a
high potential for decolorizing various azo dyes (Cao, 2000).
For biotreatment applications, it is important to identify the final degradation products as
well as intermediates of dyes by fungi because of concern that these compounds may increase
the aquatic toxicity of the overall effluent. However, knowledge of fungal degradation
mechanisms of organic pollutants including dyes is still lacking. Without insight into the
3

8/13/2019 Zhao Xueheng 200408 Phd
http://slidepdf.com/reader/full/zhao-xueheng-200408-phd 15/127
intermediates generated in biodegradation, the true technical potential of white rot fungi cannot
be evaluated. The purpose of the study described in this dissertation is to set up analytical
methods aiming at identification of products and understanding the processes that create such
products. A comprehensive approach for investigating the degradation of dyes by white rot
fungi using a wide spectrum of analytical techniques was established and used for examination
of the degradation products of carefully selected model azo dyes. The metabolites of ionic and
nonionic azo dyes were identified and quantified. With identification of these products, some
fundamental insights into fungal degradation mechanisms and toxicity of wastewater containing
azo dyes after decolorization by white rot fungi can be proposed.
1.1 Decolorization of azo dyes by white rot fungi
Azo dyes are considered recalcitrant xenobiotic compounds due to the presence of a nitrogen
double bond (-N=N-) bond and other groups (i.e. sulfonic group) that are not easily biodegraded
(Adosinda, et al., 2001). Wastewaters containing these azo dyes are usually resistant to normal
biological waste treatment for color removal.
In recent years, extensive studies of microbial degradation of azo dyes have been conducted
and the potential for using white rot fungi to degrade dyes has been demonstrated (Bumpus,
1995; Heinfling, et al., 1997). Decolorization of azo dyes by the ligninolytic fungus,
Phanerochaete chrysosporium, was described for the first time by Cripps et al. (1990). Three azo
dyes, Orange II (4-[(2-hydroxy-1-naphthalenyl)azo]-benzenesulfonic acid), Tropaeolin O (4-
[(2,4-dihydroxyphenyl)azo]-benzenesulfonic acid), and Congo Red (3,3′- [1,1′- biphenyl]-4,4′-
diylbis(azo)]bis[4-amino-1-naphthalenesulfonic acid]) were decolorized extensively (96-100
percent) during five days of incubation. Overall, Phanerochaete chrysosporium has been the
4
8/13/2019 Zhao Xueheng 200408 Phd
http://slidepdf.com/reader/full/zhao-xueheng-200408-phd 16/127
8/13/2019 Zhao Xueheng 200408 Phd
http://slidepdf.com/reader/full/zhao-xueheng-200408-phd 17/127
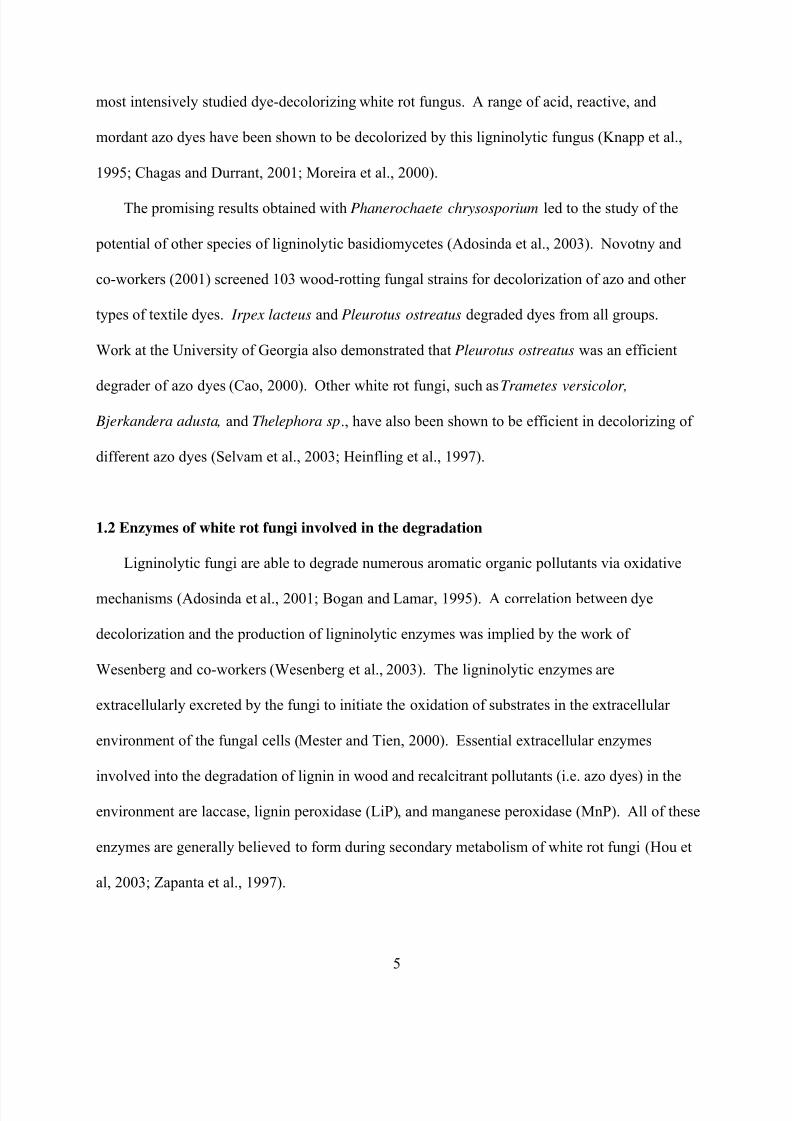
LiP is a classical hemeprotein peroxidase containing heme in the active site with molecular
weight between 38 and 47 KDa (Wesenberg et al., 2003). Due to its high redox potential, LiP is
able to directly oxidize non-phenolic lignin units (Sarkar et al., 1997). LiP reacts directly with
aromatic substrates by abstracting single electrons from their aromatic rings, leading to the
formation of a cation radical and subsequent cleavage reactions (Zheng and Obbard, 2002). A
characteristic of LiP, which is also shared by non-ligninolytic peroxidases, is its relative
unspecificity for substrates such as phenolic compounds and dyes (Martinez, 2002). Whereas
phenoxy radicals are the first product of phenolic substrate oxidation by peroxidases, aromatic
cations are formed after non-phenolic aromatic ring oxidation by LiP (Martinez, 2002; Kersten et
al., 1985).
The catalytic cycle of peroxidases is shown in Figure 1. The ligninolytic peroxidases have a
typical enzymatic cycle characteristic of other peroxidases (Mester and Tien, 2000; Tien and
Kirk, 1984; Wariishi et al., 1988). The heme group of the native enzyme (ferric form) is
oxidized by H2O2 with two electrons to compound I. One electron is removed from ferric
(Fe(III)) iron to form ferryl (Fe(IV)) while the second electron is withdrawn from the porphyrin
ring to form a porphyrin cation radical (Aust, 1995). During this reaction step, H2O2 is reduced
to water. Compound I oxidizes substrates by one electron and is reduced to compound II. In this
step, the porphyrin ring gains the electron. Thus, compound I is able to oxidize substrates with a
higher redox potential than compound II (Mester and Tien, 2000). Compound II then reacts with
reducing substrates by gaining one electron and changing back to resting enzyme. Substrates
(RH) of compound I can also react with compound II and give rise to radical R•. Compound II
can also react with H2O2 resulting in compound III (Cai and Tien, 1992), which leads to
inactivation of the peroxidase (Torres et al., 2003).
6

8/13/2019 Zhao Xueheng 200408 Phd
http://slidepdf.com/reader/full/zhao-xueheng-200408-phd 18/127
To avoid inactivation of LiP, veratryl alcohol completes the catalytic cycle of LiP by
reducing compound II to resting enzyme. Veratryl alcohol (3,4-dimethoxybenzyl alcohol) is a
secondary metabolite synthesized from glucose by several fungi, but mainly the basidiomycetes
(Suguimoto et al., 2001; Jong et al., 1994). It is oxidized via two separate one-electron
oxidations to give veratraldehyde (Zapanta and Tien, 1997; Tien, 1987). Veratryl alcohol is
thought to be produced at the same time as LiP (Fenn and Kirk, 1981). In liquid cultures, the
addition of veratryl alcohol causes an increase in LiP activity (Faison and Kirk, 1985). Veratryl
alcohol plays a role in the LiP action in three ways. Firstly, it acts as a cation radical redox
mediator of remote substrates. Secondly, it acts to protect LiP from inactivation by H2O2.
Finally, it acts to complete the catalytic cycle of LiP in the presence of substrates that cannot
reduce compound II to native enzyme (Zapanta and Tien, 1997; Goodwin et al., 1995;
Schoemaker et al., 1994).
Like LiP, MnP is a heme-containing peroxidase (Zapanta and Tien, 1997) and is the most
common ligninolytic peroxidase produced by almost all white rot basidiomycetes (Wesenberg et
al., 2003). MnP is a glycoprotein with a heme (ferric protoporphyrin) group and a molecular
weight of 32 to 62.5 KDa (Hofrichter, 2002; Glenn and Gold, 1985). It shares mechanistic
properties with LiP and forms the oxidized intermediates, compound I and compound II (Zapanta
and Tien, 1997; Cai and Tien, 1993). It also requires the presence of H2O2 to oxidize lignin and
lignin-related compounds (Mester and Tien, 2000).
MnP exhibits a dependence on Mn (II) as a substrate for compound II (Wariishi et al., 1988).
Mn (II) is also a preferred substrate for compound I. In the degradation of lignin and other
substrates, MnP oxidizes Mn (II) to Mn (III) in the presence of H2O2, and Mn (III) oxidizes a
variety of compounds (Mester and Tien, 2000; Glenn et al., 1986). The chelation of Mn (II) and
7

8/13/2019 Zhao Xueheng 200408 Phd
http://slidepdf.com/reader/full/zhao-xueheng-200408-phd 19/127
Mn (III) by organic acids, such as oxalate, is necessary for MnP activity (Zapanta and Tien,
1997). Oxalate is an organic acid chelator produced by white rot fungi at the same time as MnP
in the liquid cultures of Phanerochaete chrysosporium (Zapanta and Tien, 1997; Wariishi et al.,
1992; Kuan and Tien, 1993).
Laccase belongs to a group of enzymes called blue copper oxidases with a molecular weight
of 60 to 390 KDa (Call and Muke, 1997). Laccase also has broad substrate specificity and is
capable of oxidizing phenols and aromatic amines by reducing molecular oxygen (instead of
H2O2) to water by a multicopper system (Hublik and Schinner, 2000; Hou et al., 2003). In the
reaction, the substrates are oxidized by one electron to generate the corresponding phenoxy
radicals, which either polymerize to yield a phenolic polymer or are further oxidized by laccase
to produce a quinone (Chivukula and Renganathan, 1995). In this procedure, oxygen gets the
electron from the substrate and is reduced to water.
Like MnP, laccase acts primarily on phenolic units, but also on non-phenolic ones in the
presence of primary co-substrates (Sarkar et al., 1997; Bourbonnais et al., 1996). It was found
that a nitrogen limited culture is of benefit to laccase production, and that certain redox
mediators, such as 2,2’-azino-bis-(3-ethylbenzothiazole-6-sulfonic acid) (ABTS) and 1-
hydroxybenzotriazole (HOBT), can extend this specificity to non-phenolic compounds (Hou et
al. 2003, Mester and Tien, 2000). It is still not clear, however, if a laccase mediator system
exists in the lignin degradation system (Mester and Tien, 2000).
Pleurotus ostreatus also produces other extracellular enzymes, Pleurotus ostreatus
peroxidase (Kang et al., 1993), Remazol Brilliant Blue R decolorizing enzyme (Shin et al.,
1997), a new kind of enzyme called versatile peroxidase (Martinez, 2002), and glucose oxidase
(Shin et al., 1993). Pleurotus ostreatus peroxidase and Remazol Brilliant Blue R decolorizing
8

8/13/2019 Zhao Xueheng 200408 Phd
http://slidepdf.com/reader/full/zhao-xueheng-200408-phd 20/127
enzyme are H2O2 dependent, catalyzing oxidation of phenolic compounds by one electron but
having no affinity for nonphenolic compounds. Versatile peroxidase, however, is able to oxidize
both LiP and MnP substrates (Martinez, 2002). It was shown that versatile peroxidase could
efficiently oxidize some aromatic substrates, including dyes (Martinez, 2002; Heinfling et al.,
1998).
All three major ligninolytic enzymes are produced in multiple isoforms and are affected by
many external factors, such as nutrient level, mediator compounds and metal ions (Wesenberg et
al., 2003). It has also been shown that both the composition of culture media and the
fermentation time exert a considerable influence on the activity of peroxidases from white rot
fungi (Morais et al., 2002).
1.3 Enzymatic reactions with azo dyes
Despite the fact that ligninolytic enzymes have been intensively studied for their role in
degradation of lignin and some other organic pollutants, their mechanisms of biodegradation are
not well understood. They include a complex process of oxidation, reduction, methylation, and
hydroxylation. The reaction of the extracelluar ligninolytic enzymes also involves numerous low
molecular weight cofactors that may serve as redox mediators (Mester and Tien, 2000).
LiP is considered to be the principal decolorizing enzyme in cultures of Phanerochaete
chrysosporium and it is clear that ligninolytic enzymes play a significant role in biodegradation
of dyes by white rot fungi (Podgornik et al., 1999; McMullan et al., 2001). Whether a
compound can serve as a substrate for LiP appears to be determined by the size of the molecule
and its redox potential (Mester and Tien, 2000). LiP has a higher redox potential than other
9

8/13/2019 Zhao Xueheng 200408 Phd
http://slidepdf.com/reader/full/zhao-xueheng-200408-phd 21/127
peroxidases. The role of purified lignin peroxidase in the decolorization of several azo dyes has
been investigated (Rodriguez et al., 1999; Paszczynski et al., 1991).
Spadaro and Renganathan (1994) described the mechanism for the peroxidase-catalyzed
degradation of an azo dye, Disperse Yellow 3. The naphthol analog of Disperse Yellow 3 [1-(4'-
acetamidophenylazo)-2-naphthol] was also used as a model compound in their study. Three
peroxidases, lignin peroxidase (LiP), manganese peroxidase (MnP), and horseradish peroxidase
(HRP), were investigated in the degradation of azo dyes and the products from each system were
identified. The peroxidases were indicated to be responsible for the degradation of azo dyes.
Asymmetric cleavage of nitrogen-nitrogen double bond (-N=N-) occurred in the degradation.
The intermediate compounds generated were suggested to be 4-acetamidophenyldiazene and 4-
methyl-1,2-benzoquinone. Phenyldiazene is unstable and is readily oxidized by oxygen. The azo
linkage is released as molecular nitrogen and acetanilide, one of the major products from
Disperse Yellow 3 and its naphthol analog, is proposed to form through phenyl radical
abstracting a hydrogen radical from the surrounding.
Goszczynski and co-workers (1994) studied the mechanism of sulfonated azo dyes
degradation by peroxidases of Phanerochaete chrysosporium and proposed a cationic radical
pathway that was similar to that by Spadaro and Renganathan (1994). However, Goszczynski
and co-workers indicated symmetrical splitting of azo linkage as another possibility for initial
attack on azo dyes.
A mechanism for the peroxidase-catalyzed oxidation of phenolic azo dyes has been
proposed by Torres and co-workers (2003). In their scheme, two successive one-electron
oxidations of the phenolic ring by peroxidase produce a carbonium ion. Then water reacts with
the phenolic carbon bearing the azo bond to produce an unstable intermediate. Subsequent
10

8/13/2019 Zhao Xueheng 200408 Phd
http://slidepdf.com/reader/full/zhao-xueheng-200408-phd 22/127
reactions of the intermediate produce a quinone and an amidophenyldiazine. The latter could
react with oxygen to give rise to a phenyl radical via the unstable intermediate phenyldiazene
radical. It was also suggested that detoxification of azo dyes is achieved because of the absence
of aromatic amines in the final products. Laccase-catalyzed oxidation of azo dyes apparently
follows a similar mechanism.
Pasti-Grigsby and co-workers (1992) also found that various sulfonated azo dyes were not
equally susceptible to microbial attack. Twenty-two azo dyes were studied to determine the
influence of aromatic substitution on azo dye degradation by Phanerochaete chrysosporium.
They found that dyes with hydroxyl and azo groups in the 1,2-positions were degraded fastest
among test dyes. Spadaro and Renganathan (1992) indicated that aromatic rings with
substituents such as hydroxyl, amino, acetamido, or nitro groups were degraded to a greater
extent than unsubstituted rings.
1.4 Mineralization of azo dyes by white rot fungi
Ligninolytic enzymes mineralize lignin by combining with other additional enzymes
(Wesenberg et al., 2003). It has been demonstrated that some azo dyes can also be mineralized
to carbon dioxide by white rot fungus Phanerochaete chrysosporium (Paszczynski et al., 1992;
Spadaro et al., 1992).
Spadaro and co-workers (1992) showed that Phanerochaete chrysosporium could mineralize
the radio-labeled azo compounds 4-phenylazophenol, 4-phenylazo-2-methoxyphenol, Disperse
Yellow 3 (N-[4-[(2-hydroxy-5-methylphenyl)azo]phenyl]-acetamide), 4-phenylazoaniline, N,N-
dimethyl-4-phenylazoaniline, Disperse Orange 3 (4-[(4-nitrophenyl)azo]-benzeneamine) and
Solvent Yellow 14 (1-(phenylazo)-2-naphthalenol) to the extent of 23.1 percent to 48.1 percent.
11

8/13/2019 Zhao Xueheng 200408 Phd
http://slidepdf.com/reader/full/zhao-xueheng-200408-phd 23/127
Paszczynski and co-workers (1992) used14
C-labeled azo dyes, such as Orange I (4-[(4-hydroxy-
1-naphthalenyl)azo]-benzenesulfonic acid), Orange II (4-[(2-hydroxy-1-naphthalenyl)azo]-
benzenesulfonic acid), Acid Yellow 9 (2-amino-5-[(4-sulfophenyl)azo]-benzenesulfonic acid), 4-
(3-methoxy-4- hydroxyphenylazo) benzenesulfonic acid, and 4-(2-sulfo-3'-methoxy-4-
hydroxyazobenzene-4-azo) benzenesulfonic acid mono sodium salt, to determine that the
mineralization of these dyes by Phanerochaete chrysosporium was in the range of 17.2 percent
to 34.8 percent.
Nevertheless, it is clear that dye decolorization is not equivalent to dye mineralization.
There is a gap in current knowledge between decolorization and degradation mechanisms, with a
lack of knowledge concerning potentially toxic colorless intermediates (Wesenberg et al., 2003).
The nature of metabolites of azo dyes and their biodegradability are not clear yet and need
further investigation, since complete mineralization of azo dyes by white rot fungi cannot be
expected (Heinfling et al., 1997). It is generally agreed that practical application of
biodegradation systems using white rot fungi must be preceded by a better understanding of the
biodegradation mechanisms involved.
1.5 Analytical techniques
Due to the different properties of azo dyes and their metabolites, such as solubility,
volatility, and structure, state-of-the-art analytical methodologies are needed. Therefore, a wide
range of advanced analytical techniques, including spectrophotometry, chromatography, mass
spectrometry, and capillary electrophoresis, have been employed in this study. The inherent
complexity of dye structures and the not well-understood biotransformation mechanisms make
12

8/13/2019 Zhao Xueheng 200408 Phd
http://slidepdf.com/reader/full/zhao-xueheng-200408-phd 24/127

8/13/2019 Zhao Xueheng 200408 Phd
http://slidepdf.com/reader/full/zhao-xueheng-200408-phd 25/127
limitation of this technique is that the sample must be volatile and thermally stable at the
temperature of analysis (Poole and Poole, 1992).
High performance liquid chromatography (HPLC) has been used for analysis of various
dyes in wastewater and metabolites from various degradation procedures (Baiocchi et al., 2002;
Conneely et al., 1999; Nachiyar and Rajkumar, 2003; Pielesz et al., 2002; Plum et al., 2003;
Vinodgopal and Peller, 2003; Wang and Tsai, 2003). HPLC is advantageous over GC because it
does not need the sample to be volatile or stable to elevated temperatures.
Reversed phase liquid chromatography (RPLC) is the most commonly used mode in HPLC
and was employed in this study. Reversed phase means that the stationary phase is less polar
than the mobile phase. Solute retention in RPLC is mainly driven by the hydrophobic interaction
between the solute and the non-polar stationary phase. Thus, compounds with different polarity
elute at different retention times. Resolution is governed by three parameters: retention, column
efficiency and selectivity. The most popular detector used for HPLC is the UV-VIS. Under
adequate peak resolution, UV-VIS systems can detect components in a complex mixture to ppb
levels and quantitate them to ppm levels.
1.5.2 Capillary electrophoresis (CE)
Capillary electrophoresis (CE) has been used for analysis of dyes recently and can be more
suitable than HPLC for the analysis of charged dyes because of its separation principle, higher
separation efficiency and simpler method development (Takeda et al., 1999). Other advantages
of CE also include low sample quantities (usually nanoliters) and low consumption of organic
solvents. CE employs the powerful separation mechanisms of electrophoresis and the
instrumentation and automation techniques of chromatography. Electrophoresis is based on
“differential migration of electrically charged particles in an electric field” (Righetti, 1992).
14
8/13/2019 Zhao Xueheng 200408 Phd
http://slidepdf.com/reader/full/zhao-xueheng-200408-phd 26/127
Capillary zone electrophoresis (CZE) is a versatile CE mode and employed in this study.
CZE performs electrophoresis in a capillary (usually 50-100 µm I.D.) and separation is based on
differences in the speed of migration (migration velocity) of ions when a strong electric field is
applied across the capillary.
Both physical and chemical parameters that are crucial to an optimum separation have been
summarized by Benedek and Guttman (2001). Physical parameters include the field strength,
temperature, column length and diameter, and injection mode and size. The chemical parameters
are the type and composition of electrolyte (including pH, concentration, viscosity, and
additives), sample composition, and the capillary coating.
1.5.3 Mass spectrometry (MS)
Mass spectrometers analyze mass/charge (m/z) ratios and the relative abundance of positive
or negative gas phase ions formed from a sample. These data, in turn, can provide structural
information and molecular weight of analytes, with the ability for quantitative assays. The mass
spectrometers coupled with CE include magnetic sector, ion trap, time of flight (TOF), and
Fourier transform ion cyclotron (FTICR) (Perkins and Tomer, 1994; Wey and Thormann, 2002;
Verhaert et al., 2001; Marshall, 2000; Severs et al., 1996).
The ion trap mass spectrometer has been shown to be very useful for the structural
elucidation and is used in this study. Because the ion trap performs functions through mass
accumulation and selective mass isolation, it can supply highly sensitive and selective mass
measurements. Its unique MS
n
capability provides valuable information on compound structure.
CE-MSn is suited for the analysis of compounds at low concentrations in small amount of
complex samples.
15

8/13/2019 Zhao Xueheng 200408 Phd
http://slidepdf.com/reader/full/zhao-xueheng-200408-phd 27/127
1.5.4 CE-MS interface
Since its first introduction in 1987 (Olivares et al., 1987), capillary electrophoresis- mass
spectrometry (CE-MS) has been applied to the fields of environmental science, forensics,
pharmaceutics and life science. CE-MS combines the capillary electrophoretic concepts
introduced by Mikkers and Jorgenson in the early 1980s with MS using electrospray ionization
(ESI) developed concurrently by Dole and Fenn (Schmitt-Kopplin and Frommberger, 2003).
Compared to ultraviolet (UV) detection, which offers little information on the structure of
unknown compounds, mass spectrometric (MS) detections reveal unambiguous information on
the solute’s molecular weight and possibly its structure. Although CE-MS has been used in the
determination of dyes in wastewater (Riu et al., 1997), this study is the first one to use this
technique to identify and quantify metabolites of dyes in fungal decolorization.
The interface of CE-MS is a critical part in the connection of these two instruments. In
contrast to the widely used HPLC-MS, the amount of sample injection for CE-MS is usually in a
range of nanoliters instead of the microliter range used in LC-MS. Another major difference
compared to LC-MS is the flow rate, which is driven by the electroosmotic flow and is in the
range of sub-microliters. Both of these characteristics have to been considered in the
development of the CE-MS interface.
Smith and co-workers first developed an interface using an electrospray ionization technique
combined with a sheath liquid (Smith et al., 1988). This technique is commonly used in the CE-
MS instruments for its ease of implementation and versatility (Kirby et al., 1996). The interface
uses coaxial sheath-flow design. The CE capillary is in the center of the triple tubes, surrounded
by the sheath liquid tube and the nebulizing gas tube. The sheath liquid electrically connects the
CE outlet to the sprayer and produces the necessary flow for a stable electrospray. A gas-
16

8/13/2019 Zhao Xueheng 200408 Phd
http://slidepdf.com/reader/full/zhao-xueheng-200408-phd 28/127
assisted nebulizer generates gas phase ions from the CE effluent under application of a high
voltage (HV) field. The function of nebulizing gas is to combine with the applied HV and drying
gas to supply efficient droplet generation (Figure 1.3).
Electrospray ionization (ESI) is conducted at atmospheric pressure and consists of four
steps: formations of ions, nebulization, desolvation, and ion evaporation. Nebulizing gas and the
strong electrostatic field (2-6V) in the spray chamber draw out the sample solution and break it
into droplets. An electrical charge will be created on the surface of droplets by the electrostatic
field and finally dispersed into a fine spray of charged droplets. The solvent in droplets along
with analyte ions is evaporated by a counter flow of heated dry nitrogen. Large droplets will
break into small ones with high surface-charge density through the decrease of diameter and
increase of Coulomb repulsion. This disintegration will continue until charge density reaches
approximately 108 V/cm
3, and then ion evaporation will occur. Single ions are emitted directly
from the charged droplets into the gas phase (Fenn et al., 1989).
17

8/13/2019 Zhao Xueheng 200408 Phd
http://slidepdf.com/reader/full/zhao-xueheng-200408-phd 29/127
Figure 1.1 Catalytic cycle of heme-containing peroxidases.
(Modified based on Torres et al., 2003)
18

8/13/2019 Zhao Xueheng 200408 Phd
http://slidepdf.com/reader/full/zhao-xueheng-200408-phd 30/127
Figure 1.2 Illustration of the catalytic cycle of laccases (Wesenberg et al., 2003).
19

8/13/2019 Zhao Xueheng 200408 Phd
http://slidepdf.com/reader/full/zhao-xueheng-200408-phd 31/127
Figure 1.3 Interface of CE-MS (Agilent® Technologies)
20

8/13/2019 Zhao Xueheng 200408 Phd
http://slidepdf.com/reader/full/zhao-xueheng-200408-phd 32/127
CHAPTER 2
MATERIALS AND METHODS
2.1 Materials
2.1.1 Chemicals
Two model non-ionic dyes, Disperse Orange 3 (4-[(4-nitrophenyl)azo]-benzeneamine, Color
Index No. 11005, 90% colorant content), Disperse Orange 3 (Color Index No. 11005, 20%
colorant content), and Disperse Yellow 3 ((N-[4-[(2-hydroxy-5-methylphenyl)azo]phenyl]-
acetamide, Color Index No. 11855, 30% colorant content) (Table 2.1), was purchased from
Aldrich Chemical Co. (Milwaukee, Wis.). The commercial forms of these dyes contain
dispersing agents and surfactants. The structures of disperse dyes are shown in Figure 2.1.
Compounds used as standards were analytical grade reagents and were obtained from Aldrich
Chemical Co.. They are: 4-nitroaniline, 4-nitrophenol, 4-nitroanisole, nitrobenzene, veratryl
alcohol, veratryl aldehyde, 1,4-phenylenediamine, 1,4-dinitrobenzene, 4-nitrocatechol, 2-amino-
5-nitrophenol, aniline, 2-nitroaniline, 3-nitroaniline, acetanilide, 4'-aminoacetanilide, 4-
acetamidophenol, 4'-nitroacetanilide, and 6-amino-m-cresol.
Two model ionic azo compounds, 4-[(4-hydroxyphenyl)azo]-benzenesulfonic acid and 4-
[(2-hydroxy-1-naphthalenyl)azo]-benzenesulfonic acid (Orange II, Color Index No. 15510)
(Table 2.1, Figure 2.1), were purchased from Aldrich Chemical Co. (Milwaukee, Wis.).
Compounds used as standards, benzenesulfonic acid, 4-hydroxy-benzenesulfonic acid, veratryl
21

8/13/2019 Zhao Xueheng 200408 Phd
http://slidepdf.com/reader/full/zhao-xueheng-200408-phd 33/127
alcohol, veratryl aldehyde, and other possible products, sulfanilic acid, 1,2-naphthoquinone,
benzenequinone, were analytical grade reagents and were obtained from Aldrich.
Acetonitrile (Aldrich) and methanol (EMD Chemicals, Gibbstown, NJ) used in analysis and
sample preparation were of HPLC grade. Phosphoric acid (85%), potassium dihydrogen
phosphate and sodium hydroxide pellets were analytical grade (J. T. Baker, Phillipsburg, NJ).
Ammonium acetate was obtained from Aldrich and ammonium hydroxide (28%) was purchased
from J. T. Baker (Phillipsburg NJ). All other chemicals used throughout this study were reagent-
grade chemicals. Purified water was obtained from an ion exchange and membrane filtration
system from U.S. Filter (Warrendale, PA).
2.1.2 Microorganism
Previous workers in our lab had screened a number of white rot fungi for their ability to
decolorize a variety of dyes (Cao, 2000). One of the most effective organisms, Pleurotus
ostreatus (strain Florida), was used in this work. This fungus was obtained from the laboratory
of Dr. Karl-Erik Eriksson at the University of Georgia. The culture was maintained on malt agar
plates (malt extract 20 g/L, agar 15 g/L) at 30°C, with subcultures routinely made every month.
2.1.3 Culture conditions of white rot fungus
Nitrogen-limited cultures of Pleurotus ostreatus grown in Kirk’s medium (Table 2.1) were
incubated at 30 ºC in 250 ml Erlenmeyer flasks at pH 5.0. Cultures were established in the
incubator, shaken at 200 rpm, and allowed to grow for three days.
22

8/13/2019 Zhao Xueheng 200408 Phd
http://slidepdf.com/reader/full/zhao-xueheng-200408-phd 34/127
2.2 Methods
2.2.1 Purification of disperse azo dyes
Disperse Orange 3 (DO3) was further purified by recrystallization from acetonitrile. The
purity of DO3 was examined by high performance liquid chromatography (HPLC) using UV-
Visible detection, and observable impurities were not found. Disperse Yellow 3 (DY3) was also
purified by recrystallization with ethyl alcohol and the purity was checked by HPLC. The
purified DY3 was used in the degradation product analysis with thin layer chromatography.
2.2.2 Degradation of disperse azo dye
On day three, DO3, which had been finely ground, was added to flasks containing the fungal
system to give an initial solid to liquid ratio (wt/v) of 80 ppm of the dye. The shaking rate in the
biodegradation was reduced to 150 rpm and samples were taken daily over a period of 9 days.
Controls were carried out under the same conditions but without dyes and /or inoculum. All
results reported are based on at least three replicated experiments.
Commercial disperse dyes contain formulating agents and exist in the dispersion forms
when put in water. A concentration of 200 ppm of commercial dye in dispersion was added to
each flask. Controls were carried out under the identical conditions with fungal degradation but
without dyes and /or inoculum.
2.2.3 Biodegradation of ionic acid azo dyes
The concentration of each dye was 100 ppm in the flask and samples were taken daily
everyday for 7 days. Controls were carried out under the identical conditions with fungal
degradation but without dyes and /or inoculum.
23

8/13/2019 Zhao Xueheng 200408 Phd
http://slidepdf.com/reader/full/zhao-xueheng-200408-phd 35/127
2.2.4 Thin Layer Chromatography (TLC)
The supernatant liquid (around 125 ml) from the fungal culture was filtered, and then
extracted three times with methylene chloride (totally 60 ml). The organic phases were
combined and concentrated to about 10 ml. The samples were kept at low temperature for further
analysis. A salting out procedure in sample solution was used to facilitate the extraction.
The analysis was performed on a 5 × 20 cm Selecto Silica Gel 60, F-254 plates from Selecto
Scientific (Suwanee, GA). The specimens with a volume of 4-5 microliters were applied to the
starting line. The mobile phases were ethyl acetate - hexane (2:1) for products from DO3 and
ethyl acetate - hexane (4:1) for products from DY3. The chromatograms were run until the
solvent front traveled 80 mm. Spots of original dyes were easily to be detected on the plate
because of their color. Non-colored products were detected under UV light (254 nm). The R f
value of each product was compared to the standard to determine the identification of the
structure. To prevent errors from a single run, all the samples were run on three different plates
and the average R f values of spots for the three runs were used in identification. For the purpose
of double-checking, the standard compounds were run on the same plate again with the
degradation solutions.
2.2.5 Gas chromatography-mass spectrometry (GC-MS)
Cultures were gravity filtered with P8 filter paper from Fisher Scientific (Hampton, NH).
The filtrate from each flask (around 120 ml) was extracted with methylene chloride three times.
The combined organic layers, approximately 30 ml, were concentrated to about 1 ml under
reduced pressure after drying with sodium sulfate.
GC-MS was performed using a QP5000 mass spectrometer from Shimadzu (Kyoto, Japan)
fitted with a GC-17A gas chromatograph (Shimadzu; Kyoto, Japan). The ionization voltage was
24

8/13/2019 Zhao Xueheng 200408 Phd
http://slidepdf.com/reader/full/zhao-xueheng-200408-phd 36/127

8/13/2019 Zhao Xueheng 200408 Phd
http://slidepdf.com/reader/full/zhao-xueheng-200408-phd 37/127
into the fungal medium to keep a constant volume in the degradation system. The adsorption of
dye by fungal biomass was specifically measured with UV-Visible spectrophotometer.
Adsorption of the dye was determined by experimentation with dead cells. Fungal pellets were
collected after 3 days incubation and were autoclaved to kill living cells. Then they were put
back into the liquid medium with a dye concentration of 100 ppm and were incubated for six
hours at conditions identical to those for the biodegradation. The percent of adsorption was
determined by measuring the decrease at the wavelength maximum for the specific dye.
2.2.7 High performance liquid chromatography (HPLC)
Three milliliters of supernatant were taken from the fungal culture by pre-autoclaved pipette
each day for 9 days. The same amount of liquid medium containing 200 ppm disperse dye was
added after each sampling to keep a constant volume in the culture flask. Four replicate flasks
with the same dye concentration were used for the study and results were reported as an average
of the four samples. It was observed that no significant variation of dye concentration was
induced by photo-degradation and no degradation products were detected in control samples
(that is, samples with no fungal culture included). The samples were filtered through a 0.45 µm
membrane filter prior to HPLC analysis.
A Hewlett-Packard 1100 series HPLC system (Hewlett-Packard GmbH, Germany),
consisting of a model G1311A quaternary pump, G1322A degasser, and a diode array detector
(Model G1315A), was used to perform the analysis. HP ChemStation software (version 3.1) was
used for data processing and reporting. A volume of 100 µl was added by an automatic injector
(Model 1313A). The flow rate was held at 1 ml/min during the run.
Standards were created by dilution of stock solutions, which were prepared in methanol or
water (1.00 mg/ml) and were stored at 4°C, to give concentrations of 0.05, 0.10, 0.25, 0.50, and
26

8/13/2019 Zhao Xueheng 200408 Phd
http://slidepdf.com/reader/full/zhao-xueheng-200408-phd 38/127
1.25 µg/ml. Calibration equations were obtained by linear regression of peak areas against
concentrations of the standard solutions. Concentration of products in the samples was
calculated using the linear regression equations. Because most of the disperse dye exists in the
form of particles in the liquid, and was retained by the membrane filter, quantitation of the dye
was not conducted in the study. Peak areas were always based on λmax of each compound . All
calibration curves were linear (r 2 > 0.999) over the investigated concentration range.
2.2.8 Capillary electrophoresis – mass spectrometry (CE-MS)
The CE equipment used was Hewlett Packard3D
CE (Palo Alto, CA). The capillaries for CE
separation (50 µm I. D., 360 µm O. D.) were preconditioned with acetonitrile, 1 N NaOH, 0.1 M
HCl, and water for 10 min each, and conditioned with running buffer for 20 min before the first
run and for 3 min between runs. Sheath liquid was delivered by a syringe pump (Cole-Parmer
Instrument Co. Vernon Hills, IL) using a 1000 mL syringe (Hamilton Co. Reno, NE).
Hydrodynamic injection was performed with a pressure of 50 mbar (1 mbar = 100 Pa). The
voltage applied in separation was +30 kV. The mass spectrometer used was an Esquire 3000
plus ion trap equipped with an electrospray ionization (ESI) interface (Bruker Daltonics,
Billerica, MA), which was operated in negative ionization mode. ESI voltage was 4.0 kV. CE
and MS are connected through a commercial interface based on coaxial sheath flow. The length
of the CE capillary was 100 cm. The position of the CE capillary with ESI needle was adjusted
during optimization. Mass spectrometric parameters used in the analysis were listed as follows:
maximum accumulation time 50 ms; scan 60-400 m/z; average 8; compound stability 100%;
scan range normal; trap drive level 100%; ion charge control activated; mass resolution 0.45 u.
The standard solutions and buffers were filtered with 0.20 µm Spartan-13 NY membrane
(Schleicher &.Schuell MicroScience, Dassel, Germany).
27

8/13/2019 Zhao Xueheng 200408 Phd
http://slidepdf.com/reader/full/zhao-xueheng-200408-phd 39/127

8/13/2019 Zhao Xueheng 200408 Phd
http://slidepdf.com/reader/full/zhao-xueheng-200408-phd 40/127
Table 2.1 Model azo dyes used in this study
DESIGNATION DYE
NAME
CHEMICAL NAME CAS NO. COLOR.
INDEX NO.
DO3 Disperse
Orange 3
4-[(4-nitrophenyl)azo]-benzeneamine 730-40-5 11005
DY3 DisperseYellow 3
N-[4-[(2-hydroxy-5-methylphenyl)azo]phenyl]-acetamide
2832-40-8 11855
4HABA 4-[(4-hydroxyphenyl)azo]-
benzenesulfonic acid, sodium salt
2918-83-4
Orange II Acid
Orange 7
4-[(2-hydroxy-1-naphthalenyl)azo]-
benzenesulfonic acid, sodium salt
633-96-5 15510
29

8/13/2019 Zhao Xueheng 200408 Phd
http://slidepdf.com/reader/full/zhao-xueheng-200408-phd 41/127
Table 2.2 Composition of Kirk’s medium (Kirk et al. 1978)
CHEMICALS CONCENTRATION (G/L)
Potassium dihydrogenphosphate 0.2
Magnesium sulfate 0.05
Calcium chloride 0.01
Ammonium tartrate 0.22
Glucose 10
Nitrilotriacetate 1.5e-3
MgSO4• 7H2O 3.0e-3
MgSO4• H2O 5.0e-4
NaCl 1.0e-3
FeSO4• 7H2O 1.0e-4
CoSO4 1.0e-4
ZnSO4 1.0e-4
CuSO4• 5H2O 1.0e-5
AlK(SO4)2 1.0e-5
H3BO3 1.0e-5
NaMoO4 1.0e-5
Biotin 1.0e-3
Folic acid 2.5e-3
Thiamine• HCl 2.5e-3
Riboflavin 2.5e-3Pyridoxine• HCl 5.0e-3
Cyanocobalamine 5.0e-5
Nicotinic acid 2.5e-3
DL-calcium pantothenate 2.5e-3
p-Aminobenzoic acid 2.5e-3
Thioctic acid 2.5e-3
A quantity of 1.2 ml glacial acetic acid was added to 1 liter of the above solution and the pH was
adjusted to 5.0 by 6 N sodium hydroxide solution.
30

8/13/2019 Zhao Xueheng 200408 Phd
http://slidepdf.com/reader/full/zhao-xueheng-200408-phd 42/127

8/13/2019 Zhao Xueheng 200408 Phd
http://slidepdf.com/reader/full/zhao-xueheng-200408-phd 43/127
CHAPTER 3
IDENTIFICATION AND QUANTIFICATION
OF DEGRADATION PRODUCTS OF DISPERSE ORANGE 3
3.1 Identification of products
3.1.1 Thin layer chromatography (TLC)
Thin layer chromatography was used to primarily identify the degradation products from
DO3. In the course of developing the optimal mobile phase for TLC, the following components
were tested - benzene, methanol, acetone, chloroform, tetrahydrofuran, toluene, n-hexane, and
ethyl acetate. The combination of n-hexane and ethyl acetate proved to be the best
chromatographic system. Ethyl acetate and n-hexane were tried at different ratios and
satisfactory separation of the degradation products was achieved at a 2:1 ratio.
The results indicated that two spots other than the dye itself could be detected on TLC. Six
standard compounds, 4-aminophenol, 4-nitrophenol, 1,2-benzoquinone, 4-nitroaniline, aniline,
and 1,4-phenylenediamine, were run on the same plate with the sample for qualitative
identification of the separated spots. Among these compounds, 4-nitroaniline was a possible
product. By running both samples and standard on the same plate several times, 4-nitroaniline
and the product from DO3 showed identical R f value (Table 3.1). The filtered fungal spores
were also extracted with methylene chloride and the organic layer was analyzed by the same
TLC method. No additional degradation product was found.
32

8/13/2019 Zhao Xueheng 200408 Phd
http://slidepdf.com/reader/full/zhao-xueheng-200408-phd 44/127
Detection of 4-nitroaniline and another possible product from DO3 by TLC showed that this
non-phenolic azo dye could be degraded in Pleurotus ostreatus culture. Since various
extracellular enzymes are known to be present in Pleurotus ostreatus, some other degradation
products were expected by the interaction of dye with these enzymes. The extracellular enzymes
have been shown to use a cationic radical pathway to degrade azo dyes in vitro (Spadaro and
Renganathan, 1994, Goszczynski et al. 1994). Despite these researches on the degradation of
azo dyes by the free enzymes, mainly peroxidases, knowledge of expected degradation products
from dyes in cell culture of white rot fungi is still lacking.
DO3 has no phenolic substituent, a type of azo dye whose degradation by white rot fungi has
not been explored in depth before. Because of its structure, DO3 may display different
characteristics in degradation by white rot fungi compared to phenolic compounds.
3.1.2 Gas chromatography – mass spectrometry (GC-MS)
The identification of several degradation products from purified DO3 by Pleurotus ostreatus
was achieved with GC-MS (Figure 3.1). The results showed four compounds, nitrobenzene, 4-
nitrophenol, 4-nitroaniline, and 4-nitroanisole, as degradation products (Figure 3.2a, 3.2b, 3.2e,
3.2f). One of these products, 4-nitroaniline, had also been detected by thin layer
chromatography. None of these compounds was detected in the control samples. Veratryl
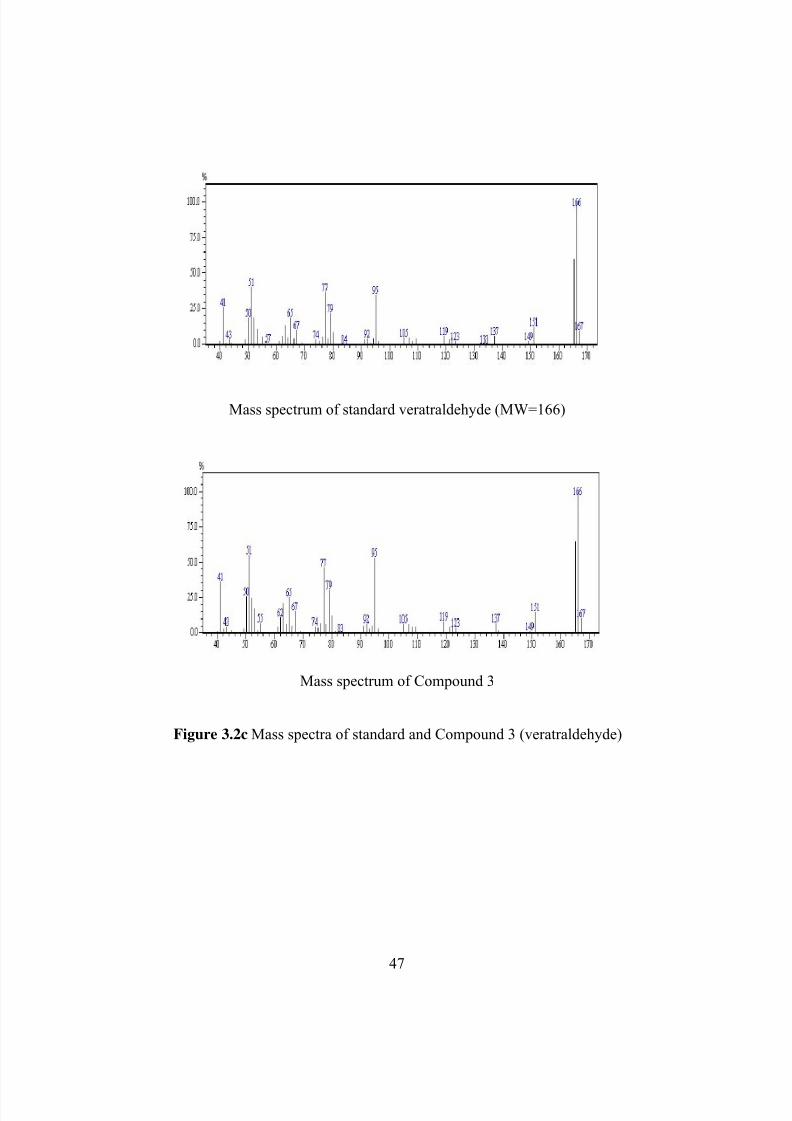
alcohol (Figure 3.2d) and its oxidation product, veratraldehyde (Figure 3.2c), were also found in
the Pleurotus ostreatus supernatant after incubation with azo dyes. Most of the other major
peaks in the mass chromatogram (Figure 3.1) were impurities or compounds generated in fungal
metabolism, which also appeared in the control samples.
33

8/13/2019 Zhao Xueheng 200408 Phd
http://slidepdf.com/reader/full/zhao-xueheng-200408-phd 45/127
3.2 Quantification of products
3.2.1 Determination of decolorization
The absorptivities are intrinsic properties of a colorant and the spectral curves of dyes during
biodegradation provided a means to determine the reaction rate and gave evidence of the
structural change of dyes during biodegradation. Thus, decolorization of DO3 was determined
using the decrease of absorbance maximum of dye.
DO3 (Figure 2.1) contains two substituted aromatic rings, one with an amino substituent and
the other with a nitro substituent, typical of many monoazo disperse dyes. The visible spectrum
of DO3 has its maximum at 415 nm (Figure 3.3). The decrease in absorbance at the maximum
wavelength of this disperse dye occurred primarily in the first few days of treatment, with little
further decrease in absorbance as the treatment time was increased. After ten days of
biotreatment, λmax shifted to 388 nm and decreased by 57 percent. This change indicated that
some products absorbed in the lower wavelength and color became yellow.
Bioaccumulation and sorption of hydrophobic organic compounds in biomass has been well
reviewed by Baughman and Paris (1981), who suggested an octanol-water partition coefficient
(K ow) could be used in estimation of sorption. The K ow of DO3 is 103.5
, which indicates DO3 is
very hydrophobic and its sorption by fungal cells is not insignificant. The sorption of disperse
dyes by biomass contributed to the high decolorization of disperse dye. Sorption was determined
by experimentation with dead cells. The fungal pellets were collected and autoclaved to kill
living cells. Then they were put back in liquid medium with 200 ppm dye in shaker and operated
for six hours at the identical conditions of biodegradation. The dead fungal cells adsorbed 10
percent of dye as determined using UV-Vis spectrophotometric analysis. Thus, degradation of
dye accounted for four-fifths of the total decolorization.
34

8/13/2019 Zhao Xueheng 200408 Phd
http://slidepdf.com/reader/full/zhao-xueheng-200408-phd 46/127
3.2.2 Optimization of the HPLC method for quantification
HPLC was chosen to quantify products of the commercial azo dye in this study because of
its accuracy, high separation efficiency and relatively simple sample preparation. The
supernatant culture liquid sample contained background interferences such as nutrients and
fungal cells but did not greatly complicate HPLC chromatography after filtration. The sample
employed in the quantification needs not further purification except filtration. This method is
more accurate and saves tedious work in sample preparation compared to the GC-MS analysis.
The culture supernatant used in the HPLC analysis contains various organic compounds with
different polarities. To separate the degradation products with the best resolution and highest
sensitivity, two columns were tested in analysis and composition of mobile phase, pH value, and
running temperature were optimized.
3.2.2.1. Analytical column selection
Two different analytical columns from Phenomenex (Torrance, CA) were tested for their
effectiveness in analysis of biodegradation products. A LunaTM
cyano column (150 × 4.6 mm I.
D., 5 µm, Phenomenex) was first tested because of its ability to retain polar compounds
(degradation products) without extensively retaining hydrophobic compounds (azo dyes with
relatively larger molecules and low polarity).
Four key products, 4-nitrophenol, 4-nitroaniline, nitrobenzene, 4-nitroanisole, as well as
veratryl alcohol, a secondary metabolite from white rot fungi and a mediator for lignin
peroxidase, and its oxidation product, veratryl aldehyde, were the target analytes for HPLC
analysis. Thus, HPLC was developed to separate these compounds first.
When the cyano column was used in HPLC analysis, the retention times for most
degradation products and azo dyes were satisfactory. However, two products, 4-nitroaniline and
35

8/13/2019 Zhao Xueheng 200408 Phd
http://slidepdf.com/reader/full/zhao-xueheng-200408-phd 47/127
4-nitrophenol, could not be completely separated regardless of how other variables were
changed. Although it took a longer time to separate all the target analytes with a gradient
method on an UltracarbTM
ODS column (150 × 4.6 mm I. D., 5 µm, Phenomenex), the base-line
resolution was achieved for all compounds of interest with little compromise in sensitivity.
Thus, a stainless steel Ultracarb ODS column with 5 µm packing from Phenomenex (150 × 4.6
mm I. D.) was chosen as the analytical column and a RP-C18 guard pre-column was used to
protect the analytical column.
3.2.2.2 Composition of mobile phase
The organic component in the mobile phase has an important influence in the selective
separation of analytes. Both methanol and acetonitrile were tested as organic modifier in the
mobile phase optimization. The chromatographic peaks of 4-nitrophenol and veratryl aldehyde
broadened when methanol was used in the mobile phase. Adjusting the buffer pH to 2.5 did not
sharpen those peaks to a satisfactory shape. The use of acetonitrile in the mobile phase not only
gave a narrower peak but less baseline drift in the analysis. Thus, acetonitrile was used as
organic modifier for the mobile phase throughout the analysis.
3.2.2.3 pH value and concentration of buffer
The effects of pH values of the buffer were investigated to obtain the best separation.
Buffers with different pH values ranging from 3.0 to 7.0 were tried in the analysis. The
separation performance declined as the pH value of the buffer increased. The pH 3.0 phosphate
buffer provided the best separation efficiency among the buffers tested. Since further adjusting
the pH values of the buffer to 2.5 and 3.5 did not improve the separation efficiency and
resolution, the mobile phase consisting of buffer with pH 3.0 was chosen for subsequent
experiments. Increasing the concentration of phosphate from 0.010 M to 0.025 M improved the
36

8/13/2019 Zhao Xueheng 200408 Phd
http://slidepdf.com/reader/full/zhao-xueheng-200408-phd 48/127
symmetry of the chromatographic peaks. The gradient method with the 0.025 M phosphate
buffer (pH=3.0)- acetonitrile mobile phase was selected (Table 3.3). The chromatogram of the
six standards is shown in Figure 3.4.
3.2.2.4 Temperature
Generally, increasing the temperature of the column will decrease the retention time for all
analytes. However, increasing temperature does not necessarily improve column performance.
A range of 20-40°C was tested in the study. At 20 °C, the separation was adequate but the
running time was too long. Above 25 °C, the peaks of 4-nitrophenol and veratryl aldehyde
began to overlap (Figure 3.5). Thus, 25 °C was chosen for the best resolution and an acceptable
retention time.
3.2.2.5 Selectivity
To determine the selectivity and accuracy of the developed method, a known weight of each
standard was spiked into the fungal culture system containing azo dye with a concentration of
200 ppm. All the products were well separated from each other and interferences from culture
fluid constituents (Figure 3.6). Recovery of the spiked standards was reported based on average
of four replicates. The recovery test showed that all the degradation products had instant
recovery of more than 80 percent and more than 70 percent for recovery after 24 hours of
treatment under the same biodegradation procedure.
3.2.3 Quantification of products by HPLC
Kinetic profiles of the degradation products are shown in Figure 3.7. One of the products, 4-
nitroaniline, reached maximum on day 2 and then decreased, indicating that 4-nitroaniline was
further degraded in the culture. Nitrobenzene increased markedly after three days and for the
remaining nine days of biodegradation. Another product, 4-nitrophenol, was detected after 4
37

8/13/2019 Zhao Xueheng 200408 Phd
http://slidepdf.com/reader/full/zhao-xueheng-200408-phd 49/127
days along with its methylated product, 4-nitroanisole. The curves indicate a possible
relationship between 4-nitroanisole and 4-nitrophenol.
3.3 Mechanism study of fungal degradation of DO3
The biodegradation of aromatic pollutants is a complex process of oxidation, reduction,
methylation and hydroxylation (Mester and Tien, 2000). Thus, the biodegradation of azo dyes is
complicated and consists of a mixture of these reactions.
Pleurotus ostreatus is known to produce three main liginolytic enzymes, including LiP in
Kirk’s media (Robinson et al. 2001). Veratryl alcohol is crucial in the lignin peroxidase cycle
during oxidations of azo dyes. Helping to complete the catalytic cycle of LiP, veratryl alcohol
acts as a third substrate (with hydrogen peroxide and azo dyes) in the reaction (Paszcznski and
Crawford, 1991). Veratryl alcohol can be oxidized to veratraldehyde by LiP. Thus,
identification of veratryl alcohol and veratraldehye in the degradation system implies that lignin
peroxidase is involved in the degradation of this dye. Laccase degrades the azo dyes in a way
that is similar to the mechanism for LiP, and both enzymatic reactions follow a radical-initiated
oxidation (Chivukula and Renganathan, 1995).
Formation of nitrobenzene (III) occurs in accordance with this peroxidase reaction
mechanism (Figure 3.8). It can be generated from the unstable intermediate, 4-
nitrophenyldiazene (I), by homolytic bond cleavage to produce nitrobenzene and molecular
nitrogen. Hydroxylization of the diazonium salt generated in the azo linkage asymmetric
cleavage would yield 4-nitrophenol (IV).
The product 4-nitroanisole (V) is a result of multiple step degradation of DO3. Based on the
quantification results, it was probable that 4-nitroanisole came from 4-nitrophenol (IV). To
38

8/13/2019 Zhao Xueheng 200408 Phd
http://slidepdf.com/reader/full/zhao-xueheng-200408-phd 50/127
further examine this possibility, 4- nitrophenol (IV) was added to fungal cultures and its
degradation was examined by GC-MS in a separate experiment. Over a period of 4 days, the 4-
nitrophenol (IV) was obviously degraded to 4-nitroanisole (Figure 3.9). 4-Nitroanisole was not
detected in the control culture sample concurrently ran. Methylation of phenolic compounds by
another fungus Phanerochaete chrysosporium has been reported (Valli and Gold, 1991; Valli et
al., 1992). These results demonstrated that methylation also occurs with degradation by
Pleurotus ostreatus. The oxidative coupling to form dimers or polymers from 4-nitrophenol,
which is related to laccase oxidation (Hublik and Schinner, 2000), was not found in this study.
This result may have occurred because these dimers or polymers are nonvolatile and not
detectable in GC-MS analysis.
In the decolorization study using Pleurotus ostreatus, Rodriguez and co-workers (1999)
found that an enzymatic mechanism other than extracellular enzymes could be involved in the
decolorization. Formation of 4-nitroaniline (II) suggested a reduction system might be involved
in the biodegradation. Although azo dyes resist biodegradation in aerobic conditions, the azo
bond is vulnerable to reductive cleavage (Pinheiro et al., 2004). The ability of Pleurotus
ostreatus to reduce 1,4-dinitrobenzene to 4-nitroaniline (II) has been observed when the
possibility of 1,4-dinitrobenzene as a product was tested in the experiment. It is still unclear if
reduction is the only pathway for the production of 4-nitroaniline (II), or if other reactions are
involved. Another potential reduction product, 4-phenylenediamine, was not be detected in the
culture supernatant by HPLC or GC-MS.
Our results demonstrate that three dominant degradation products, nitrobenzene, 4-
nitrophenol, and 4-nitroaniline, and one minor product, 4-nitroanisole, were generated in the
biodegradation of DO3 by whole cultures of Pleurotus ostreatus.
39

8/13/2019 Zhao Xueheng 200408 Phd
http://slidepdf.com/reader/full/zhao-xueheng-200408-phd 51/127

8/13/2019 Zhao Xueheng 200408 Phd
http://slidepdf.com/reader/full/zhao-xueheng-200408-phd 52/127
Table 3.1 TLC analysis of DO3 degradation samples
SAMPLES SAMPLE
INFORMATION
R F VALUES OF
SPOTS
COLOR OF
SPOTS
Disperse Orange 3 Purified dye 0.62 Orange
Disperse Orange 3 Control 0.63 Orange
Degradation sample 3 days degradation 0.63
0.54
0.44
Orange
Yellow
Yellow
4-Nitroaniline Standard 0.56 Yellow
Mobile phase: ethyl acetate-n-hexane (2:1)
Plates were detected under daylight and UV 254 nm light after drying in air.
41

8/13/2019 Zhao Xueheng 200408 Phd
http://slidepdf.com/reader/full/zhao-xueheng-200408-phd 53/127
Table 3.2 UV-Vis spectrophotometric analysis of DO3 in degradation
DAY ABSORBANCE DECREASE (@ λMAX) (%)
0 0
2 36
4 39
6 53
8 59
10 57
42

8/13/2019 Zhao Xueheng 200408 Phd
http://slidepdf.com/reader/full/zhao-xueheng-200408-phd 54/127
Table 3.3 Mobile phase program for the HPLC gradient
TIME (MIN) FLOW (ML/MIN) %A %B CURVE
0.0 1.0 5.0 95.0 Linear
20.0 1.0 25.0 75.0 Linear
30.0 1.0 40.0 60.0 Linear
40.0 1.0 40.0 60.0
45.0 1.0 5.0 95.0 Linear
A: AcetonitrileB: 0.025 M phosphate buffer with pH 3.0
43

8/13/2019 Zhao Xueheng 200408 Phd
http://slidepdf.com/reader/full/zhao-xueheng-200408-phd 55/127
Figure 3.1 Identification of products from DO3 and metabolites of Pleurotus ostreatus using
GC-MS. Peak 1, nitrobenzene; Peak 2, 4-nitroanisole; Peak 3, veratraldehyde; Peak 4, veratryl
alcohol; Peak 5, 4-nitrophenol; Peak 6, 4-nitroaniline; Peak 7, Disperse Orange 3. Unlabeled
peaks belong to impurities or fungal contaminants, which also appealed in controls.
44

8/13/2019 Zhao Xueheng 200408 Phd
http://slidepdf.com/reader/full/zhao-xueheng-200408-phd 56/127
Mass spectrum of standard nitrobenzene (MW=123)
Mass spectrum of Compound 1
Figure 3.2a Mass spectra of standard and Compound 1 (nitrobenzene)
45

8/13/2019 Zhao Xueheng 200408 Phd
http://slidepdf.com/reader/full/zhao-xueheng-200408-phd 57/127
8/13/2019 Zhao Xueheng 200408 Phd
http://slidepdf.com/reader/full/zhao-xueheng-200408-phd 58/127
Mass spectrum of standard veratraldehyde (MW=166)
Mass spectrum of Compound 3
Figure 3.2c Mass spectra of standard and Compound 3 (veratraldehyde)
47

8/13/2019 Zhao Xueheng 200408 Phd
http://slidepdf.com/reader/full/zhao-xueheng-200408-phd 59/127
Mass spectrum of standard veratryl alcohol (MW=168)
Mass spectrum of Compound 4
Figure 3.2d Mass spectra of standard and Compound 4 (veratryl alcohol)
48

8/13/2019 Zhao Xueheng 200408 Phd
http://slidepdf.com/reader/full/zhao-xueheng-200408-phd 60/127
Mass spectrum of standard 4-nitrophenol (MW=139)
Mass spectrum of Compound 5
Figure 3.2e Mass spectra of standard and Compound 5 (4-nitrophenol)
49

8/13/2019 Zhao Xueheng 200408 Phd
http://slidepdf.com/reader/full/zhao-xueheng-200408-phd 61/127
Mass spectrum of standard 4-nitroaniline (MW=138)
Mass spectrum of Compound 6
Figure 3.2f Mass spectra of standard and Compound 6 (4-nitroaniline)
50

8/13/2019 Zhao Xueheng 200408 Phd
http://slidepdf.com/reader/full/zhao-xueheng-200408-phd 62/127

8/13/2019 Zhao Xueheng 200408 Phd
http://slidepdf.com/reader/full/zhao-xueheng-200408-phd 63/127
Figure 3.3 UV-Vis spectra of DO3 during biodegradation by P. ostreatus. The curves represent
2 day intervals and absorbance at λ max (415 nm) decrease continuously in the degradation.
52

8/13/2019 Zhao Xueheng 200408 Phd
http://slidepdf.com/reader/full/zhao-xueheng-200408-phd 64/127

8/13/2019 Zhao Xueheng 200408 Phd
http://slidepdf.com/reader/full/zhao-xueheng-200408-phd 65/127

8/13/2019 Zhao Xueheng 200408 Phd
http://slidepdf.com/reader/full/zhao-xueheng-200408-phd 66/127

8/13/2019 Zhao Xueheng 200408 Phd
http://slidepdf.com/reader/full/zhao-xueheng-200408-phd 67/127
0
0.5
1
1.5
22.5
3
0 2 4 6 8
Days
C o m c e n t r a t i o n ( u
M )
10
4-nitroaniline 4-nitrophenol
Nitrobenzene 4-nitroanisole
Figure 3.7 Kinetic profiles of degradation products from DO3 by Pleurotus ostreatus
56

8/13/2019 Zhao Xueheng 200408 Phd
http://slidepdf.com/reader/full/zhao-xueheng-200408-phd 68/127
N NO2 NH2 N
Biodegradation by P.ostreatus
NO2 NH2
NO2 + OH NO2
Methylation
OCH3 NO2
NO2 N N H
N2
OHH
I I
III IV
V
I
Figure 3.8 Diagram of biodegradation pathway of DO3 by Pleurotus ostreatus.
57

8/13/2019 Zhao Xueheng 200408 Phd
http://slidepdf.com/reader/full/zhao-xueheng-200408-phd 69/127
Figure 3.9 Detection of 4-nitroanisole as the major degradation product from 4-nitrophenol by
Pleurotus ostreatus using GC-MS
58

8/13/2019 Zhao Xueheng 200408 Phd
http://slidepdf.com/reader/full/zhao-xueheng-200408-phd 70/127
CHAPTER 4
IDENTIFICATION AND QUANTIFICATION
OF DEGRADATION PRODUCTS FROM DISPERSE YELLOW 3
4.1 Identification of products
The second disperse dye examined was Disperse Yellow 3 (DY3), which is a phenolic azo
compound (Figure 2.1) and a widely used yellow dye in the United States. It is also a potential
carcinogen (Spadaro et al., 1992). TLC was used preliminarily to look for possible products.
The mobile phase used in TLC was optimized based on the migration of dye and possible
products. Ethyl acetate: n-hexane (4:1) was chosen and used for the TLC analysis. One possible
degradation product from DY3 was detected by TLC at UV 254nm (Table 4.1). Acetanilide, 4'-
aminoacetanilide, 4-acetamidophenol, 4'-nitroacetanilide, and 6-amino-m-cresol were run on
TLC to identify this spot, but none of them was a match.
To identify the possible products, the supernatant of the degradation culture was extracted
by methylene chloride three times, and the organic layer was concentrated before being analyzed
with GC-MS. Figure 4.1 shows the GC-MS chromatograms for the first four days of
degradation. The GC-MS method was adopted from that used with DO3. The presence of
acetanilide in the decolorization sample was indicated by comparison of the mass spectrum and
retention times of standard (Figure 4.2). Another major peak in the chromatogram was identified
as veratryl alcohol, the mediator for LiP. All the other peaks in GC-MS could not be assigned to
products, and control runs indicated that those peaks resulted from background and/or solvent.
59

8/13/2019 Zhao Xueheng 200408 Phd
http://slidepdf.com/reader/full/zhao-xueheng-200408-phd 71/127
HPLC was used to look for other possible products from biodegradation. This analysis
resulted in a chromatogram with three peaks having polarity close to that of DY3 and had
absorbance at 254 nm (Figure 4.3). These unknown peaks did not correspond to 4'-
aminoacetanilide, 4-acetamidophenol, 4'-nitroacetanilide, and 6-amino-m-cresol. These
unknown peaks have UV-Visible spectra similar to that of the dye, but these peaks were not
identified at this time.
4.2 Quantification of products
4.2.1 Quantification of decolorization by UV-Vis spectrophotometric analysis
Treatment of DY3 with P. ostreatus after 5 days caused 57 percent decolorization (Figure
4.4 and Table 4.2), which was indicated by calculation of the decrease in absorption at the
wavelength maximum for this dye (λmax=354 nm). There were no new absorbence peaks after
biodegradation. Since the octanol-water partition coefficient (K ow) of DY3 is 102.9
, which
indicates DY3 is hydrophobic, its sorption by fungal cells could not be ignored. Sorption of
DY3 on fungal biomass was determined by the method described in Chapter III. It was
estimated that 11 percent of decolorization resulted from adsorption onto the biomass.
Therefore, about 46 percent of the dye broke down during biodegradation.
4.2.2 Quantification of products by HPLC
The kinetic profile of the degradation product, acetanilide, was determined by HPLC.
The calibration curve was constructed by regressing the peak area against concentrations of the
standard solutions in the range of 1-10 ppm. The concentration of products in the samples was
calculated using linear regression equations from the calibration curves. HPLC quantification
was carried out with the detection wavelength set at 254 nm. The calibration curve was linear (r 2
60

8/13/2019 Zhao Xueheng 200408 Phd
http://slidepdf.com/reader/full/zhao-xueheng-200408-phd 72/127

8/13/2019 Zhao Xueheng 200408 Phd
http://slidepdf.com/reader/full/zhao-xueheng-200408-phd 73/127
Renganathan, 1994). The amount of acetanilide stayed constant in the later period of
degradation (Figure 4.5), which indicated that it resisted further transformation or was degraded
by fungi at a very low rate. The unidentified possible products might generate from further
degradation of acetanilide or from biotransformation of DY3 by other enzymes of P. ostreatus.
A possible brief scheme for formation of major products from DY3 is given in Figure 4.6.
62

8/13/2019 Zhao Xueheng 200408 Phd
http://slidepdf.com/reader/full/zhao-xueheng-200408-phd 74/127
Table 4.1 TLC analysis of DY3 degradation samples
SAMPLES SAMPLE
INFORMATION
R F VALUES OF
SPOTS
COLOR OF
SPOTS
Disperse Yellow 3 Purified dye 0.45 Yellow
Disperse Yellow 3 Control 0.44 Yellow
Degradation sample 3 days degradation 0.45
0.25
Yellow
Colorless (UV)
Mobile phase: ethyl acetate-n-hexane (4:1)Plates were detected under daylight and UV 254 nm light after drying in air.
63

8/13/2019 Zhao Xueheng 200408 Phd
http://slidepdf.com/reader/full/zhao-xueheng-200408-phd 75/127
Table 4.2 UV-Vis spectrophotometric analysis of DY3 in degradation
DAY ABSORBANCE DECREASE (@ λMAX) (%)
0 0
1 26
2 32
3 44
4 50
5 57
64

8/13/2019 Zhao Xueheng 200408 Phd
http://slidepdf.com/reader/full/zhao-xueheng-200408-phd 76/127
Figure 4.1 Identification of acetanilide as the major degradation product
from DY3 by Pleurotus ostreatus using GC-MS. Other major peaks
are from background of fungal culture or impurities in the samples.
65

8/13/2019 Zhao Xueheng 200408 Phd
http://slidepdf.com/reader/full/zhao-xueheng-200408-phd 77/127
Mass spectrum of standard acetanilide
Mass spectrum of major product
Figure 4.2 Mass spectra of major product (acetanilide) from DY3 by Pleurotus ostreatus
66

8/13/2019 Zhao Xueheng 200408 Phd
http://slidepdf.com/reader/full/zhao-xueheng-200408-phd 78/127
(A)
(B)
Figure 4.3 HPLC chromatograms of fungal degradation samples from DY3.
(A) Days 0, Disperse Yellow 3 (tR =35.922 min).
(B) Days 7, Veratryl alcohol (tR =15.972 min), acetanilide (tR =18.693 min), unknown metabolite1 (tR =24.655 min), unknown metabolite 2 (tR =27.378 min), unknown metabolite 3 (tR =28.386
min), Disperse Yellow 3 (tR =35.953 min).
67

8/13/2019 Zhao Xueheng 200408 Phd
http://slidepdf.com/reader/full/zhao-xueheng-200408-phd 79/127

8/13/2019 Zhao Xueheng 200408 Phd
http://slidepdf.com/reader/full/zhao-xueheng-200408-phd 80/127
0
10
20
30
40
0 2 4 6 8
Days
C o n c e n t r a t i o n ( u M )
Acetanilide
Figure 4.5 Kinetic profile of acetanilide from DY3 by Pleurotus ostreatus
69

8/13/2019 Zhao Xueheng 200408 Phd
http://slidepdf.com/reader/full/zhao-xueheng-200408-phd 81/127

8/13/2019 Zhao Xueheng 200408 Phd
http://slidepdf.com/reader/full/zhao-xueheng-200408-phd 82/127
CHAPTER 5
IDENTIFICATION AND QUANTIFICATION OF PRODUCTS FROM MODEL IONIC DYES
BY CAPILLARY ELECTROPHORESIS – MASS SPECTROMETRY AND HPLC
The identification of unknown degradation products of ionic model azo compounds in the
complex fungal culture supernatant requires an effective analytical technique. The ideal
technique should offer fast, high-resolution separation with sensitive, information-rich detection.
Most ionic dyestuffs, such as sulfonated azo dyes, are nonvolatile and thermally unstable, and
are thus not easily analyzed by gas chromatography (GC). On the other hand, the polar and ionic
analytes, which are not GC amenable, are also problematic in usual HPLC separations. For the
above reasons, capillary electrophoresis coupled with mass spectrometry (CE-MS) was chosen as
the major analytical tool to separate and identify metabolites in the sample.
5.1 Setup of CE-MS method for identification of degradation products from ionic dyes
The combination of CE and MS is a relatively sophisticated analytical technique and a
higher limit of detection compared to LC-MS is a drawback resulting from the employment of
sheath liquid and a low injection volume. A robust interface is crucial for stable and sensitive
CE-MS operation. Therefore, it is necessary to carefully optimize the parameters affecting the
CE-MS performance to achieve the best sensitivity and stability.
5.1.1 Optimization of CE-ESI-MS interface with sheath liquid
CE-MS interfacing is often achieved with a liquid sheath because of its versatility, which
was first demonstrated by Smith and co-workers (1988). The interface is a tripletublar
71

8/13/2019 Zhao Xueheng 200408 Phd
http://slidepdf.com/reader/full/zhao-xueheng-200408-phd 83/127
configuration, with a separation capillary inside a coaxial liquid sheath tube, which is surrounded
by a second coaxial tube supplying the nebulizing gas. The sheath liquid provides electrical
contact for CE operation and a stable electrospray. However, achieving stable electrospray with
a liquid sheath can be problematic and involves simultaneous balancing of multiple parameters
such as capillary position, liquid sheath flow rate and composition, nebulizing gas flow, and ESI
conditions (Kirby et al. 1996).
The mass spectra of the model azo dyes were obtained by direct infusion of the standard
solution into ion trap MS. Base peaks for both azo compounds were the original compound
sulfonated ions in solution, with m/z 277 for 4HABA (Figure 5.1) and m/z 327 for Orange II
(Figure 5.2). Electrospray is a very soft ionization mode and molecular ions are usually the most
abundant peak in the mass spectra. The dyes exist as sulfonated ions in the solution, thus readily
forming gaseous ions during the ESI procedure. Optimization of the CE-MS interface conditions
was made by monitoring the signal intensity of these sulfonated ions.
5.1.1.1 Sheath liquid composition and flow rate
Sheath liquid not only supplies the electric contact for the CE operation but also provides the
necessary stable electrospray. Flow rate of sheath liquid should be small but still sufficient to
give stable spray and electrical contact. Because 2-propanol is superior for the purpose of sheath
liquid and best for ionization of negative sulfonate ions (Vuorensola et al. 2001), it was chosen
for the organic solvent in the sheath liquid. The flow rate of sheath liquid was tested in a range
of 2 µl/min to 4 µl/min, and the lower rate of 2 µl/min was suitable for CE-ESI-MS interfacing.
The composition of sheath liquid was optimized with 2-propanol in water with a range of 50:50 –
100:0 v/v. The signal intensity increased considerably with the increasing proportion of organic
solvent. A mixture of 80:20 v/v gave the most intense signals for both model azo compounds
72

8/13/2019 Zhao Xueheng 200408 Phd
http://slidepdf.com/reader/full/zhao-xueheng-200408-phd 84/127
(Figure 5.3). Furthermore, the electrospray was not stable with a very high percentage of organic
solvent, for example more than 95 percent. Therefore, a 2-propanol to water mixture of 80:20
v/v was selected as the sheath liquid composition finally based on both the signal intensity and
electrospray stability. Since the sulfonate ions are readily formed even before the ESI, there was
no additive (e.g. ammonium hydroxide) used in the sheath liquid in order to keep the number of
ionic compounds in the ESI to a minimum.
5.1.1.2 Nebulizing gas
The effect of nebulizing gas flow on the CE-MS was examined with the pressure raised in
steps of 1 p.s.i. from 5 to 10 p.s.i. (1 p.s.i = 6894.76 Pa) while keeping the other parameters
constant (Figure 5.4). The results showed that the influence from the nebulizing gas pressure on
the sensitivity of ESI was not very significant from 5 p.s.i. to 10 p.s.i. for both azo compound
ions. The signal-to-noise ratio of the 4HABA sulfonate ion increased from 5 p.s.i. to 6 p.s.i..
However, above 6 p.s.i., the signal-to-noise ratio did not increase anymore. For the Orange II
molecular ion, an improvement of signal-to-noise ratio was not observed when nebulizing gas
pressure changed. This observation probably indicated that the ion evaporation process was not
improved by increasing the nebulizing gas pressure. On the other hand, it was found that
increasing the gas pressure decreased the migration times and increased the apparent CE ion
mobility of the analyte ions, an effect which decreased resolution. This effect was also observed
by Huikko and co-workers (2002). This phenomenon resulted from the decrease of the pressure
at the capillary tip when increasing nebulizing gas velocity, which brought about a
hydrodynamic bulk flow inside the CE capillary (Huikko et al. 2002). Therefore, a low
nebulizing gas pressure of 5 p.s.i. was chosen for this study.
73

8/13/2019 Zhao Xueheng 200408 Phd
http://slidepdf.com/reader/full/zhao-xueheng-200408-phd 85/127
5.1.1.3 Drying gas flow and temperature
Drying gas flow rate and temperature affects the intensity and stability of ESI signals
(Huikko et al. 2002). The flow rate was changed from 3 to 5 l/min and its effect on ESI is shown
in Figure 5.5. It was determined that 4 l/min was optimal for the ESI. The effect of drying gas
temperature was also examined. The temperature was raised gradually from 150°C to 300°C. It
was found that a high gas temperature did not enhance signal-to-noise ratio (Figure 5.6). Thus,
150°C was used in the interfacing.
5.1.2 Optimization of CE operation
Capillary positioning has a big influence on the stability of electrospray and the intensity of
ion signals. The capillary tip was adjusted relative to the sprayer needle for best sensitivity. It
was also found that the cross-sectional dimension of the capillary influenced the ESI
significantly. A 360 µm O.D. capillary was found to give stable and sensitive ion signals. The separation in CE was also optimized for satisfactory migration time and best sensitivity
of MS signals. Because the length of capillary is 100 cm for the CE-MS coupling, a high
separation voltage of positive 30 kV was applied to obtain a field strength of 300 V/cm. The
concentration of carrying electrolyte (running buffer) of CE impacted the analyte ionization
efficiency and MS signals. The range of 10 – 40 mM concentration of ammonium buffer was
tested for their operation. When the concentration of ammonium acetate was more than 20 mM,
the intensity of analyte ions was suppressed due to the ionization competition from acetate anion
in ESI. A 10 mM running buffer was chosen because of the superior ionization efficiency of
molecular ions of analytes at this concentration (Figure 5.7). The pH value of running buffer is
critical to the electroosmotic flow velocity (EOF) and migration time of analytes. The EOF was
strong enough to bring all ions from anode to cathode under a voltage of 30 kV in the neutral or
74

8/13/2019 Zhao Xueheng 200408 Phd
http://slidepdf.com/reader/full/zhao-xueheng-200408-phd 86/127
basic running buffer. The pH values in the range of 7.0 to 10.0 were tested, with pH 9.0 found
suitable for both 4HABA and Orange II. The migration times for both model compounds were
less than 15 min.
5.1.3 Optimization of MS conditions
The ESI voltage influenced the ionization efficiency and signal intensity. The voltage was
optimized automatically in the range of 3.0 kV to 4.5 kV and 4.0 kV was chosen as the suitable
parameter. The ESI voltage was thus + 4.0 kV, which was applied on the end plate of MS
capillary instead of the sprayer needle. This design avoids introducing potential to the CE outlet.
5.2 Identification of degradation products from ionic azo compounds with CE-MS
The major degradation products in the P. ostreatus degradation flasks from both azo dyes
were identified with the CE-ESI-MS method. The base peak electrophorogram (BPE) showed
better peak shape and signal-to-noise ratio than the total ion electrophorogram (TIE) in the study.
Thus, the possible products were determined by examining the BPE of samples during
biodegradation and comparing with those of controls.
Before biodegradation of Orange II, a large electrophorogram peak having a base peak at
m/z 327 was easily identified as the sulfonated anion of the dye itself (Figure 5.8). After
incubation in Pleurotus ostreatus culture for two days, the dye peak totally disappeared from
BPE with two potential new product peaks at migration times of 15 min and 17 min (Figure 5.9).
Mass spectra of these CE peaks had their base peaks at m/z 156.9 (product 1) and 172.9 (product
2) respectively (Figure 5.10, Figure 5.11). Takeda (1999) reported the determination of products
from wet oxidation of Orange II with solid catalysts by CE and CE-MS. In that case, Orange II
was broken down into 4-hydroxy-benzenesulfonic acid (p-phenolsulfonate) and 1,2-
75

8/13/2019 Zhao Xueheng 200408 Phd
http://slidepdf.com/reader/full/zhao-xueheng-200408-phd 87/127
dihydroxynaphthalene. Thus, the product 2 with base peak at m/z 172.9 was inferred to be 4-
hydroxy-bezenesulfonic acid. The identity of this product was confirmed by running the
standard compound (Figure 5.12). Based on structure of the dye and molecular weight of the
product, the peak with a base peak at m/z 156.9 was inferred to be benzenesulfonic acid. This
product was also confirmed by running the reference compound (Figure 5.13).
In addition, HPLC was used for identification of nonionic or less polar products. Several
possible products, including 2-naphthol, 1,2-naphthalenediol, 1,2-naphthoquinone, and 1-amino-
2-naphthol, were examined based on analysis of the structure of the original azo dyes. Only 1,2-
naphthoquinone was identified as a product from biodegradation by comparison of retention time
and UV-Visible spectrum with the reference compound (Figure 5.14).
4HABA degradation by white rot fungas was studied using the same protocols as for the
other dyes. Figure 5.15 shows the base peak electrophorogram of 4HABA before being
subjected to fungal degradation. In comparison, Figure 5.16 shows the base peak
electrophorogram of 4HABA after being subjected to degradation by P. ostreatus. A major peak
in BPE having a base peak at m/z 156.9 was also found in the culture medium (Figure 5.17). By
comparison with the reference compound, this product was also identified as benzenesulfonic
acid. Because of the similarity of the structure of 4HABA with that of Orange II, 4-hydroxy-
benzenesulfonic acid was also anticipated to be one of major products. Analysis of the extracted
ion electrophorogram (EIE) of m/z 173 demonstrated that 4-hydroxy-benzenesulfonic acid was
also a major product (Figure 5.18).
Therefore, benzenesulfonic acid salt and 4-hydroxy-benzenesulfonic acid salt were two
major products from both model dyes, and 1,2-naphthoquinone was also a major product for
Orange II.
76

8/13/2019 Zhao Xueheng 200408 Phd
http://slidepdf.com/reader/full/zhao-xueheng-200408-phd 88/127
5.3 Determination of biodegradation
Biodegradation of azo compounds is determined based on measurement of
decolorization and sorption of dyes on biomass. Decolorization of both model ionic azo
compounds with Pleurotus ostreatus was measured by UV-Visible spectrophotometer daily.
It was found that decolorization was 75 percent and 98 percent for 4HABA and Orange II
(Table 5.1), respectively, after 5 days. The sorption rates for the two ionic compounds on
fungal biomass were 9 and 24 percent, respectively. Therefore, the actual biodegradation
was estimated at 66 percent and 74 percent for 4HABA and Orange II, respectively, when
adsorption was considered. The color of live cells in the biodegradation was lighter than that
of dead cells, which were used in adsorption measurement. This observation indicated that
dead cells absorbed more dyes than live cells, and adsorption in the biodegradation, therefore,
should be less than the measured ones. A similar result was reported by Bakshi and co-
workers (1999) in determination of biosorption of mixtures of textile dyes by Phanerochaete
chrysosporium and reviewed by Baughman and Paris (1981).
5.4 Quantification of products
The running buffer of CE was optimized for quantification of target analytes, and pH 9.0
was finally chosen for giving best migration time and resolution in the electrophoresis.
Standards were prepared by dilution of stock solutions (1mg/ml) with fungal medium to
give concentrations of benzenesulfonic acid ranging from 5 to 50 µg/ml and concentrations
of 4-hydroxybenzenesulfonic acid ranging from 5 to 40 µg/ml. Quantification data were
handled using the QuantAnalysis™ software of Bruker Daltonics. Calibration curves were
obtained by regressing peak area of the extracted ion electrophorogram (EIE, m/z 157 for
77

8/13/2019 Zhao Xueheng 200408 Phd
http://slidepdf.com/reader/full/zhao-xueheng-200408-phd 89/127
benzenesulfonic acid salt and m/z 173 for 4-hydroxybenzenesulfonic acid salt) against
concentrations of the standard solutions. Peak areas based on the EIE of each compound
were used for determination. All calibration curves were linear (r 2 > 0.99) over the
investigated concentration range (Table 5.2). The concentration of products in the samples
was calculated using linear regression equations from the calibration curves. The LOD
(Limit of detection) was calculated based on 3 times the noise level. The LOD was relatively
high for CE-MS, i.e. 3 ppm for benzenesulfonic acid and 5 ppm for 4-
hydroxybenzenesulfonic acid, due to dilution by sheath liquid in the ESI interface.
5.5 Biodegradation mechanism study
Quantification of products from both model azo dyes, i.e. benzenesulfonic acid and 4-
hydroxybenzenesulfonic acid, and decrease of dyes, are shown in Figure 5.19 and Figure
5.20. The above mentioned products were found in the culture liquid of both model ionic
dyes after 24 hour incubation. The highest level of 4-hydroxybenzenesulfonic acid was
detected at the first day for Orange II and the second day for 4HABA. In this latter case, the
product disappeared totally after 5 days. This observation led to the conclusion that 4-
hydroxybenzenesulfonic acid was an intermediate in the fungal degradation and underwent
further transformation. Thus, 4-hydroxybenzenesulfonic acid may not accumulate after
degradation. On the other hand, a notable amount of benzenesulfonic acid in the culture
liquid accumulated and stayed constant after several days’ incubation, indicating that this
product is not easily degraded further or degraded at very low rate. Accumulation of this
compound is a potential source of secondary pollutants and should be further studied.
78

8/13/2019 Zhao Xueheng 200408 Phd
http://slidepdf.com/reader/full/zhao-xueheng-200408-phd 90/127
To determine if the products identified so far are responsible for most of biodegradation
of dyes, a mass balance of degradation of model azo dyes and products was conducted (Table
5.1). The results of the mass balance calculation demonstrated that the yields of 4-
hydroxybenzenesulfonic acid and benzenesulfonic acid accounted for 40 percent (for
4HABA) and 60 percent (for Orange II) of the total molar amount of the dyes. The
comparison of the yield of products and extent of biodegradation of the dyes confirms that
these compounds are major products in the fungal decolorization.
Because very little is known about how white rot fungi break down the azo compounds
and the characteristics by which different enzymes act in the decolorization, it is only
possible to assume that the known extracellur enzymes are responsible for the degradation
and use this assumption to explain the results at this time. Fortunately, the mechanism of
biodegradation of phenolic azo dyes by peroxidases and laccase from white rot fungi has
been investigated before (Spadaro and Renganathan 1994, Chivukula and Renganathan
1995). Results with Pleurotus ostreatus suggest that peroxidases or laccase are (at least in
part) responsible for the biodegradation of the model azo dyes because the degradation
products from the fungal cultures in this study coincide well with the products expected for
the peroxidase oxidation mechanism. A possible pathway, which illustrates the formation of
identified products, is summarized in Figure 5.21 and Figure 5.22 for the dyes investigated.
Pleurotus ostreatus probably adopts a pathway involving similar reactions as that of
peroxidases. That is, the peroxidase substrate, ionic azo dyes, were metabolized to
phenyldiazene intermediate and quinone in the degradation. Although 1,4-benzenequinone
was not detected in the degradation of 4HABA, 1,2-naphthoquinone was identified in the
degradation of Orange II to support this proposed pathway. The reason why 1.4-
79

8/13/2019 Zhao Xueheng 200408 Phd
http://slidepdf.com/reader/full/zhao-xueheng-200408-phd 91/127
benzenequinone was not detected in the culture medium could not be determined.
Benzenesulfonic acid and 4-hydroxybenzenesulfonic acid were produced from phenyldiazene
via radical reactions. It is expected to find some of same products generated from two model
azo dyes with similar structures, and the results confirmed this proposition. This observation
suggests that it is possible to predict products based on the structures of original dyes in
biodegradation with more knowledge about fungal enzymes gained in the future.
80

8/13/2019 Zhao Xueheng 200408 Phd
http://slidepdf.com/reader/full/zhao-xueheng-200408-phd 92/127
Table 5.1 Mass balance of products from model azo dyes degradation
by Pleurotus ostreatus
4HABA ORANGE II
Decolorization rate (%) 75 98
Adsorption by biomass (%) 9 24
Biodegradation rate (%) 66 74
Yield of benzenesulfonic acid (%) 30 39
Yield of 4-hydroxybenzenesulfonic acid (%) 10 20
Unidentified (%) 26 15
81

8/13/2019 Zhao Xueheng 200408 Phd
http://slidepdf.com/reader/full/zhao-xueheng-200408-phd 93/127

8/13/2019 Zhao Xueheng 200408 Phd
http://slidepdf.com/reader/full/zhao-xueheng-200408-phd 94/127
Figure 5.1 Mass spectrum of 4HABA anion with CE-ESI-MS
83

8/13/2019 Zhao Xueheng 200408 Phd
http://slidepdf.com/reader/full/zhao-xueheng-200408-phd 95/127
Figure 5.2 Mass spectrum of Orange II anion with CE-ESI-MS
84

8/13/2019 Zhao Xueheng 200408 Phd
http://slidepdf.com/reader/full/zhao-xueheng-200408-phd 96/127
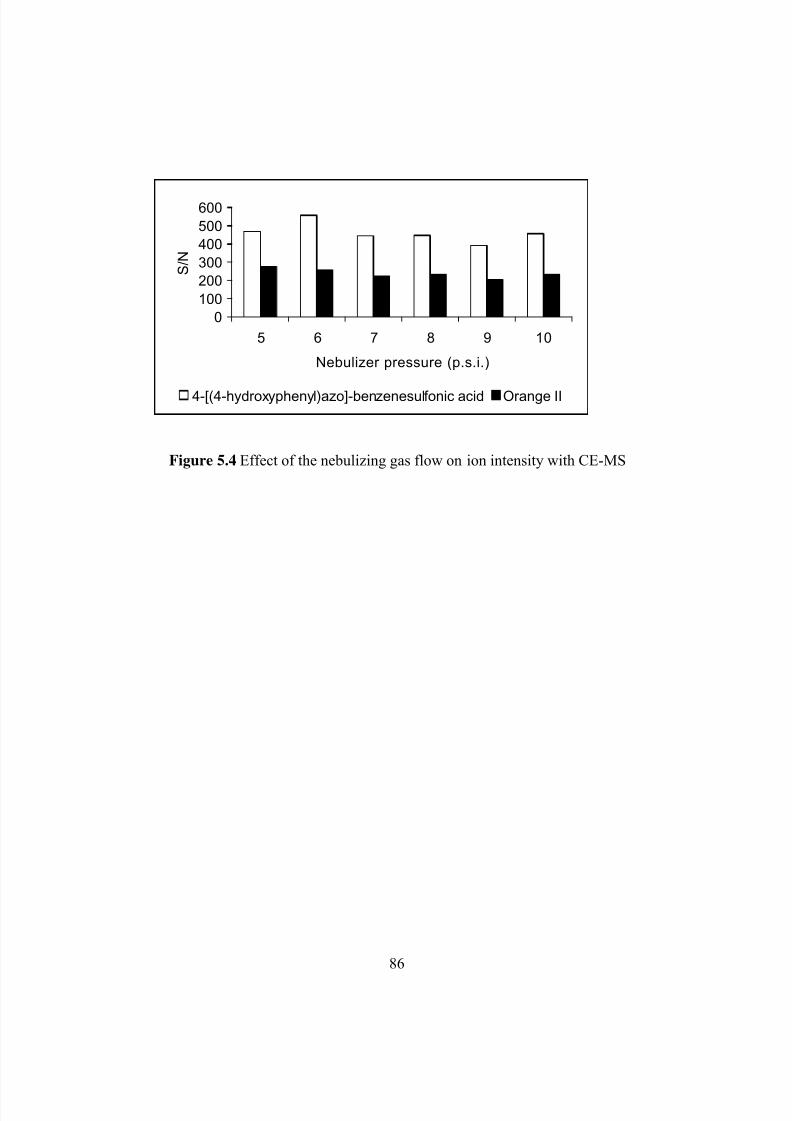
8/13/2019 Zhao Xueheng 200408 Phd
http://slidepdf.com/reader/full/zhao-xueheng-200408-phd 97/127
0
100
200
300
400
500
600
5 6 7 8 9 10
Nebulizer pressure (p.s.i.)
S / N
4-[(4-hydroxyphenyl)azo]-benzenesulfonic acid Orange II
Figure 5.4 Effect of the nebulizing gas flow on ion intensity with CE-MS
86

8/13/2019 Zhao Xueheng 200408 Phd
http://slidepdf.com/reader/full/zhao-xueheng-200408-phd 98/127

8/13/2019 Zhao Xueheng 200408 Phd
http://slidepdf.com/reader/full/zhao-xueheng-200408-phd 99/127

8/13/2019 Zhao Xueheng 200408 Phd
http://slidepdf.com/reader/full/zhao-xueheng-200408-phd 100/127
0
200
400
600
8001000
5 10 15 20
Concentration of running buffer (mM)
S / N
4-[(4-hydroxyphenyl)azo]-benzenesulfonic acid Orange II
Figure 5.7 Effect of concentration of running buffer on ion intensity with CE-MS
89

8/13/2019 Zhao Xueheng 200408 Phd
http://slidepdf.com/reader/full/zhao-xueheng-200408-phd 101/127

8/13/2019 Zhao Xueheng 200408 Phd
http://slidepdf.com/reader/full/zhao-xueheng-200408-phd 102/127
Figure 5.9 CE-MS analysis of fungal degradation of Orange II: base peak electrophorogram
after biodegradation (2 days). Product 1, benzenesulfonic acid; Product 2, 4-hydroxy-
benzenesulfonic acid.
91

8/13/2019 Zhao Xueheng 200408 Phd
http://slidepdf.com/reader/full/zhao-xueheng-200408-phd 103/127
Figure 5.10 CE-MS analysis of product 1, benesulfonic acid, from Orange II:
mass spectrum and extracted ion electrophorogram (m/z 157).
92

8/13/2019 Zhao Xueheng 200408 Phd
http://slidepdf.com/reader/full/zhao-xueheng-200408-phd 104/127

8/13/2019 Zhao Xueheng 200408 Phd
http://slidepdf.com/reader/full/zhao-xueheng-200408-phd 105/127

8/13/2019 Zhao Xueheng 200408 Phd
http://slidepdf.com/reader/full/zhao-xueheng-200408-phd 106/127
Figure 5.13 CE-MS analysis of standard benzenesulfonic acid, sodium salt:
mass spectrum and extracted ion electrophorogram (m/z 157)
95

8/13/2019 Zhao Xueheng 200408 Phd
http://slidepdf.com/reader/full/zhao-xueheng-200408-phd 107/127
Product
LC Chromatogram of degradation sample
1,2-na ho uinone
LC Chromatogram of standard1,2-naphthoqunione
Figure 5.14a HPLC analysis of fungal degradation of Orange II: identification of 1,2-
naphthoquinone as a product
96

8/13/2019 Zhao Xueheng 200408 Phd
http://slidepdf.com/reader/full/zhao-xueheng-200408-phd 108/127
UV-Vis spectrum of product peak
UV-Vis spectrum of standard 1,2-naphthoqunione
Figure 5.14b HPLC analysis of fungal degradation of Orange II: identification of 1,2-
naphthoquinone as a product
97

8/13/2019 Zhao Xueheng 200408 Phd
http://slidepdf.com/reader/full/zhao-xueheng-200408-phd 109/127
Figure 5.15 CE-MS analysis of fungal degradation of 4HABA: Base peak electrophorogram
before biodegradation
98

8/13/2019 Zhao Xueheng 200408 Phd
http://slidepdf.com/reader/full/zhao-xueheng-200408-phd 110/127
Figure 5.16 CE-MS analysis of fungal degradation of 4HABA: Base peak electrophorogram
after biodegradation (2 days). Product 1, benzenesulfonic acid; Product 2, 4-hydroxy-
benzenesulfonic acid.
99

8/13/2019 Zhao Xueheng 200408 Phd
http://slidepdf.com/reader/full/zhao-xueheng-200408-phd 111/127
Figure 5.17 CE-MS analysis of product 1, benzenesulfonic acid, from 4HABA:
mass spectrum and extracted ion electrophorogram (m/z 157)
100

8/13/2019 Zhao Xueheng 200408 Phd
http://slidepdf.com/reader/full/zhao-xueheng-200408-phd 112/127
Figure 5.18 CE-MS analysis of product 2, 4-hydroxy-benzenesulfonic acid, from 4HABA:
mass spectrum and extracted ion electrophorogram (m/z 173)
101

8/13/2019 Zhao Xueheng 200408 Phd
http://slidepdf.com/reader/full/zhao-xueheng-200408-phd 113/127
0
50
100
150
200
250
300
350
0 1 2 3 4 5Days
C o n c e n t r a t i o n ( u M )
6
4HABA Benzenesulfonic acid
4-Hydroxybenzenesulfonic acid
Figure 5.19 Kinetic profiles of fungal degradation of 4HABA by Pleurotus ostreatus
102

8/13/2019 Zhao Xueheng 200408 Phd
http://slidepdf.com/reader/full/zhao-xueheng-200408-phd 114/127
0
50
100
150
200
250
300
0 1 2 3 4 5
Days
C o n c e n t r a t i o n ( u M )
6
Orange II Benzenesulfonic acid
4-Hydroxybenzenesulfonic acid
Figure 5.20 Kinetic profiles of fungal degradation of Orange II by Pleurotus ostreatus
103

8/13/2019 Zhao Xueheng 200408 Phd
http://slidepdf.com/reader/full/zhao-xueheng-200408-phd 115/127
H2O
NO3S N
OH
O
Laccase/peroxidase
N OHNO3S
Benzenesulfonic acid anion4-Hydroxybenzenesulfonic acid anion
O2 and H2O
N2+O3S+OHO3S
+NO3S NH
2e
4HABA
OO
1,4-benzoquinone
(Not observed)
(Product 1)(Product 2)
Figure 5.21 Formation of degradation products of 4HABA by Pleurotus ostreatus
104

8/13/2019 Zhao Xueheng 200408 Phd
http://slidepdf.com/reader/full/zhao-xueheng-200408-phd 116/127
H2O
NO3S N
O
HO
N
OH
NO3S
N2
OHH
O
ONHNO3S +
OHO3S+O3S
Peroxidases or laccase
1,2-naphthoquinone
Benzesulfonic acid anion 4-hydroxy-benzenesulfonic acid anion
2e
(Product 1) (Product 2)
Orange II
Figure 5.22 Formation of degradation products of Orange II by Pleurotus ostreatus
105

8/13/2019 Zhao Xueheng 200408 Phd
http://slidepdf.com/reader/full/zhao-xueheng-200408-phd 117/127
CHAPTER 6
CONCLUSION AND FURTHER DISCUSSION
This study investigated the biodegradation of model nonionic and ionic azo dyes by a white
rot fungus, Pleurotus ostreatus. The major products from the dyes during biodegradation have
been identified and quantified. Possible pathways leading to formation of these products are
discussed. The major findings are summarized as follows.
a. Pleurotus ostreatus is capable of degrading nonionic and anionic azo dyes. This white
rot fungus is particularly efficient in degradation of anionic azo dyes with a phenolic
structure or having hydroxyl groups on aromatic rings.
b. Biodegradation of different model azo dyes indicated that water-soluble anionic dyes
were degraded more (up to 98 percent in 5 days) by Pleurotus ostreatus than water-
insoluble nonionic dyes (up to 57 percent in 10 days).
c. Dyes with different structures, i.e. phenolic and nonphenolic dyes, showed that fungal
biodegradation was influenced by the functional groups on the benzene ring. Azo dyes
having a phenolic ring yield products expected from peroxidase oxidation; however, the
model nonphenolic dye produced a range of compounds by an unidentified mechanism.
d. The model nonphenolic dye, DO3, produced 4-nitrophenol and 4-nitrobenzene in
accordance with a peroxidase oxidation pathway, while production of 4-nitroaniline
indicated that some new enzymatic systems may be involved.
e. Methylation of the hydroxyl group on 4-nitrophenol by Pleurotus ostreatus to produce 4-
nitroanisole was confirmed by experiments with the reference compound. This finding
106

8/13/2019 Zhao Xueheng 200408 Phd
http://slidepdf.com/reader/full/zhao-xueheng-200408-phd 118/127
shows that methylation is a step in fungal degradation of aromatic compounds with
hydroxyl groups.
f. DY3, 4HABA and Orange II all contain an aromatic hydroxy group and when degraded,
they produce products indicative of peroxidase enzyme activity.
g. Veratryl alcohol, a redox mediator for LiP catalytic cycle, and its oxidant, veratraldehyde,
were identified in the cultures of Pleurotus ostreatus in this study.
h. A quantification method for studying the biodegradation of nonionic azo dyes was
established using HPLC and CE-MS was used for the quantitation of ionic azo dye
products.
i. Kinetic studies of degradation products demonstrated that some primary products could
be further transformed by Pleurotus ostreatus, while others did not because of a low
degradation rate.
j. Possible pathways to form the identified products from model ionic and nonionic azo
dyes with phenolic and nonphenolic structures were discussed and proposed (Chapter 3,
4, and 5).
It has been shown that the products from model azo dyes with a phenolic structure follow a
proposed peroxidase or laccase oxidation pathway in the fungal degradation. This finding
suggests that it is possible to predict the expected products based on the structure of azo dyes in
the wastewater. However, analysis of model azo dyes with nonphenolic structures suggested
that other mechanisms maybe involved in the fungal degradation. The analytical methods
described herein can be used for the further study of dyes.
107

8/13/2019 Zhao Xueheng 200408 Phd
http://slidepdf.com/reader/full/zhao-xueheng-200408-phd 119/127
There is still some research needed to fully understand the biodegradation mechanism used
by white rot fungi to degrade azo and other types of dyes. A series of experiments are
recommended for the future study, specifically
a. Assessment of toxicity of organic pollutants after biodegradation
It has been demonstrated that some products accumulate after decolorization of azo dyes by
white rot fungi. The biotransformation products that resist further degradation may be toxic or
genotoxic. Thus, the toxicity of dyes after fungal degradation should be assayed. The
relationship between the structures of parent pollutants and toxicity after treatment should be
studied, and methods to detoxify the toxic products are needed.
b. Investigation of extracellular enzymes from white rot fungi
Nonspecific enzymes secreted from white rot fungi under food starvation are responsible for
the biodegradation of lignin and structurally different organic compounds. To clarify how these
enzymes respond to different dye structures is important to understanding of biodegradation by
white rot fungi. This assessment could be done by:
• Measuring activities of major enzymes in white rot fungal culture, which are responsible
for biodegradation;
• Comparing results of individual enzymes with those from fungal culture in
biodegradation of azo dyes;
• Preparing and purifying crude enzymes from white rot fungal cultures and characterizing
unknown enzymes contributing to the biodegradation;
• Examining other factors that may influence degradation, both enzymatic and non-
enzymatic, such as mediators and the presence of small molecules;
• Setting up immobilization technology to reuse enzymes and fungi.
108

8/13/2019 Zhao Xueheng 200408 Phd
http://slidepdf.com/reader/full/zhao-xueheng-200408-phd 120/127
REFERENCES
Adosinda, M.; Martins, M.; Ferreira, I.C.; Santos, I.M.; Wueiroz, M.J. and Lima, N.Biodegradation of bioaccessible textile azo dyes by Phanerochaete chrysosporium. Journal of
Biotechnology, 89, 91-98, 2001.
Adosinda, M.; Martins, M.; Lima, N.; Silvestre, A.; Queiroz, M. Comparative studies of fungal
degradation of single or mixed bioaccessible reactive azo dyes. Chemosphere, 52, 967, 2003.
Ansari, A. A.; Thakur, B. D. Extraction, characterisation and application of a natural dye: The
eco-friendly textile colorant. Colourage, 47, 15-16, 18-20, 2000.
Aust, S.D. Mechanisms of degradation by white rot fungi. Environmental Health Perspectives,103, 59-61, 1995
Baiocchi, C.; Brussino, M. C.; Pramauro, E.; Prevot, A. B.; Palmisano, L.; Marci, G.Characterization of methyl orange and its photocatalytic degradation products by HPLC/UV-VIS
diode array and atmospheric pressure ionization quadrupole ion trap mass spectrometry.
International Journal of Mass Spectrometry, 214, 247-256, 2002.
Bakshi, D. K., Gupta, K.G., and Sharma, P. Enhanced biodecolorization of synthetic textile dyeeffluent by Phanerochaete chrysosporium under improved culture conditions. World Journal of
Microbiology and Biotechnology, 15, 507-509, 1999.
Banat, I.M., Nigam, P., Singh, D., and Marchant, R., Microbial decolorization of textile-dye-containing effluents: a review. Bioresource Technology, 58, 217-227, 1996.
Baughman, G. L. and Paris, D. F. Microbial bioconcentration of organic pollutants from aquaticsystems – a critical review. CRC Critical Reviews in Microbiology, 7, 205-228,1981.
Benedek, K. and Guttman, A. High performance capillary electrophoresis: an overview. In
HPLC: practical and industrial application. J. K. Swadesh, Ed., CRC press, Boca Raton, FL, 2001.
Bogan, B.W. and Lamar, R.T. One-electron oxidation in the degradation of creosote polycyclicaromatic hydrocarbons by Phanerochaete chrysosporium. Applied and Environmental
Microbiology, 61, 2631-2635, 1995.
Bourbonnais, R., Paice, M.G., Freiermuth, B., Bodie, E., Bornemann, S. Reactivities of various
mediators and laccases with kraft pulp and lignin model compounds. Applied and Environmental
Microbiology, 63, 4627-4632, 1996.
109

8/13/2019 Zhao Xueheng 200408 Phd
http://slidepdf.com/reader/full/zhao-xueheng-200408-phd 121/127
Bras, R.; Ferra, M.; Isabel, M.; Pinheiro, H. M.; Goncalves, I. C. Batch tests for assessing
decolorization of azo dyes by methanogenic and mixed cultures. Journal of Biotechnology, 89,155-162, 2001.
Bumpus, J. Microbial Degradation of Azo Dyes. In Biotransformations: Microbial degradation
of health-risk compounds. V. Singh, Ed., Elsevier, New York, 1995.
Cai, D. and Tien, M. Lignin-degrading peroxidases of Phanerochaete chrysosporium. Journal of
Biotechnology, 30, 79-90, 1993.
Cai, D. and Tien, M. Kinetic studies on the formation and decomposition of compound II and III.
Reactions of lignin peroxidase with H2O2. Journal of Biological Chemistry, 267, 11149-11155,1992.
Call, H. P. and Mucke, I. Minireview: history, overview and applications of mediatedligninolytic systems, especially laccase-mediator-systems (Lignozym-Process). Journal of
Biotechnology, 53, 163-202, 1997.
Cao, H. Decolorization of textile dyes by white rot fungi. Ph. D. dissertation, University ofGeorgia, Athens, GA, 2000
Chagas, E.P. and Durrant, L. R. Decolorization of azo dyes by Phanerochaete chrysosporium
and Pleurotus sajorcaju. Enzyme and Microbial Technology, 29, 474-477, 2001.
Chivukula, M. and Renganathan, V. Phenolic azo dye oxidation by laccase from Pyricularia
oryzae. Applied and Environmental Microbiology, 61, 4374-4377, 1995.
Chivukula, M.; Spadaro, J.T.; Renganathan, V. Lignin peroxidase-catalyzed oxidation of
sulfonated azo dyes generates novel sulfophenyl hydroperoxides. Biochemistry, 34, 7765-7772,
1995.
Conneely, A.; Smyth, W. F.; McMullan, G. Metabolism of the phthalocyanine textile dye
Remazol Turquoise Blue by Phanerochaete chrysosporium. FEMS Microbiology Letters, 179,
333-337, 1999.
Cripps, C.; Bumpus, J. and Aust, S. Biodegradation of azo and heterocyclic dyes byPhanerochaete chrysosporium. Applied and Environmental Microbiology, 56, 1114-1118, 1990.
Egli, T. W. General strategies in the biodegradation of pollutants. In Metal ions in biological
systems. H. Sigel and A. Sigel, Eds., pp. 1-41, Marcel Dekker, New York, NY, 1992.
Faison, B.D. and Kirk, T.K. Factors involved in the regulation of ligninase activity in
Phanerochaete chrysosporium. Applied and Environmental Microbiology, 49, 299-304, 1985.
Fenn, J. B.; Mann, M.; Meng, C.K.; Wong, S.F.; Whitehouse, G.M.; Electrospray Ionization for
Mass Spectrometry of Large Biomolecules. Science, 246, 64-71,1989.
110

8/13/2019 Zhao Xueheng 200408 Phd
http://slidepdf.com/reader/full/zhao-xueheng-200408-phd 122/127
Fenn, P. and Kirk, T.K. Relationship of nitrogen to the onset and suppression of ligninolytic
activity and secondary metabolism in Phanerochaete chrysosporium. Archives of Microbiology,130, 59-65, 1981.
Glenn, J. K. and Gold, M. H. Purification and characterization of an extracellular Mn (II)-
dependent peroxidase from the lignin-degrading basidiomycete, Phanerochaete chrysosporium.Archives of Biochemistry and Biophysics, 242, 329-341, 1985.
Glenn, J. K.; Alileswaran, L. and Gold, M. H. Mn(II) oxidation is the principal function of theextracellular Mn-peroxidase from Phanerochaete chrysosporium. Archives of Biochemistry and
Biophysics, 251, 688-696, 1986.
Goodwin, D.C.; Aust, S.D. and Grover, T.A. Evidence for veratryl alcohol as a redox mediator
in lignin peroxidase-catalysed oxidation. Biochemistry, 34, 5060-5065, 1995.
Goszczynski, S.; Paszczynski, A.; Pasti-Grigsby, M.B.; Crawford, R.L. New pathway for
degradation of sulfonated azo dyes by microbial peroxidases of Phanerochaete chrysosporium and Streptomyces chromofuscus. Journal of Bacteriology, 176, 1339-1347,1994.
Hao, O. J., Kim, H., and Chiang, P. Decolorization of wastewater. Critical Reviews in
Environmental Science and Technology, 30, 449-505, 2000.
Heinfling, A.; Bergbauer, M. and Szewzyk, U. Biodegradation of azo and phthalocyanine dyes
by Trametes versicolor and Bjerkandera adusta. Applied Microbiology and Biotechnology, 48,
261-266, 1997.
Heinfling, A.; Ruiz-Duenas, F.J.; Martinez, F.J.; Bergbauer, M.; Szewzyk, U. and Martinez, A.T.A study on reducing substrates of manganese-oxidizing peroxidases from Pleurotus eryngii, and
Bjerkandera adusta. FEBS Letters, 428, 141-146, 1998.
Hofrichter, M. Review: Lignin conversion by manganese peroxidase (MnP). Enzyme and
Microbial Technology, 30, 454-466, 2002.
Hou, H.; Zhou, J.; Wang, J.; Du, C.; and Yan, B. Enhancement of laccase production byPleurotus ostreatus and its use for the decolorization of anthraquinone dye. Process
Biochemistry, 39, 1415-1419, 2003.
Huang, P.C. and Kosower, E. M. Diazenes. III. Properties of phenyldiazene. Journal of American
Chemical Society, 90, 2367 – 2376, 1968.
Hublik, G. and Schinner, F. Characterization and immobilization of the laccase from Pleurotus
ostreatus and its use for the continuous elimination of phenolic pollutants. Enzyme and
Microbial Technology, 27, 330-336, 2000.
111

8/13/2019 Zhao Xueheng 200408 Phd
http://slidepdf.com/reader/full/zhao-xueheng-200408-phd 123/127
Huikko, K., Kotiaho, T., and Kostianinen, R. Effects of nebulizing and drying gas flow on
capillary electrophoresis/mass spectrometry. Rapid Communications in mass spectrometry, 16,
1562-1568, 2002.
Jong, E. D.; Field, J.M. and De Bont, J.A.M. Aryl alcohols in the physiology of ligninolytic
fungi. FEMS Microbiology Review, 13, 153-188, 1994.
Kang, S.O.; Shin, K.S.; Han, Y.H.; Youn, H.D. and Hah, Y.C. Purification and characterization
of an extracellular peroxidase from white rot fungus Pleurotus ostreatus. Biochimica et
Biophysica Acta, 1163, 158-164, 1993.
Kersten, P.J.; Tien, M.; Kalyanaraman, B. and Kirk, T.K. The ligninase of Phanerochaete
chrysosporium generates cation radicals from methoxybenzenes. Journal of Biological
Chemistry, 260, 2609-2612, 1985.
Kirby, D.P.; Thorne, J.M.; Gotzinger, W.K. and Karger, B.L. A CE/MS interface for stable,
low-flow operation. Analytical Chemistry, 68, 4451-4457, 1996.
Kirk, T. K.; Schultz, E.; Cornors, W. J.; Lorenz, L. F.; and Zeikus, J. G. Influence of culture
parameters on lignin metabolism by Phanerochaete chrysosporium. Archives of Microbiology,
117, 3144-3149, 1978.
Knapp, J.S.; Newby, P.S. and Reece, L.P. Decolorization of dyes by wood-rotting
basidiomycete fungi. Enzyme and Microbiological Technology, 17, 664-668, 1995.
Kuan, I.C. and Tien, M. Stimulation of Mn peroxidase activity: A possible role for oxalate in
lignin biodegradation. Proceeding of the National Academy of Sciences of the United States of
America, 90, 1242-1246, 1993
Marshall, A. G. Milestones in Fourier transform ion cyclotron resonance mass spectrometry
technique development. International Journal of Mass Spectrometry, 200, 331-356, 2000.
Martinez, A.T. Molecular biology and structure-function of lignin-degrading heme peroxidases.
Enzyme and Microbial Technology, 30, 425-444, 2002.
McMullan, G.; Meehan, C.; Conneely, A.; Kirby, N.; Robinson, T. and Nigam, P. Mini-review:
microbial decolourisation and degradation of textile dyes. Applied Microbiology andBiotechnology, 56, 81-87, 2001.
Mester, T. and Tien, M. Oxidation mechanism of ligninolytic enzymes involved in thedegradation of environmental pollutants. International Biodeterioration & Biodegradation, 46,
51-59, 2000.
Milojkovic-Opsenica, D. M.; Lazarevic, K.; Ivackovic, V.; Tesic, Z. L. Reversed-phase thin-layer chromatography of some foodstuff dyes. Journal of Planar Chromatography—Modern
TLC, 16, 276-279, 2003.
112

8/13/2019 Zhao Xueheng 200408 Phd
http://slidepdf.com/reader/full/zhao-xueheng-200408-phd 124/127
Morais, H.; Ramos, C., Forgacs, E.; Cserhati, T. and Oliviera, J. Using spectrophotometry and
spectral mapping technique for the study of the production of manganese-dependent andmanganese-independent peroxidases by Pleurotus ostreatus. Journal of Biochemical and
Biophysical Methods, 50, 99-109, 2002.
Moreira, M.T.; Mielgo, I.; Feijoo, G. and Lema, J.M. Evaluation of different fungal strains in thedecolorisation of synthetic dyes. Biotechnology letters, 22, 1499-1503, 2000.
Nachiyar, C. V.; Rajkumar, G. S. Degradation of a tannery and textile dye, Navitan Fast BlueS5R by Pseudomonas aeruginosa. World Journal of Microbiology & Biotechnology, 19, 609-
614, 2003.
Novotny, C.; Rawal, B.; Bhatt, M.; Patel, M.; Sasek, V. and Molitoris, H.P. Capacity of Irpex
lacteus and Pleurotus ostreatus for decolorization of chemically different dyes. Journal of
Biotechnology, 89,113-122, 2001.
Olivares, J.A.; Nguyen, N.T.; Yonker, C. R. and Smith, R. D. On-line mass spectrometricdetection for capillary zone electrophoresis. Analytical Chemistry, 59, 1230 – 1232, 1987.
Pasti-Grigsbty, M. B., Paszczynski, A., Gosczynski, S., Crawford, D. L., Crawford, R. L.
Influence of aromatic substitution patterns on azo dye degradability by Streptomyces
chromofuscus and Phanerochaete chrysosporium. Applied Environmental Microbiology, 58,3605-3613, 1992.
Paszczynski, A. and Crawford, R.L. Degradation of azo compounds by ligninase fromPhanerochaete chrysosporium: involvement of veratryl alcohol. Biochemical and Biophysical
Research Communications, 178, 1056-1063, 1991.
Paszczynski, A; Pasti-Grigsby, M.B.; Goszczynski, S.; Crawford, R. L. and Crawford, D.L.
Mineralization of sulfonated azo dyes and sulfanilic acid by Phanerochaete chrysosporium andStreptomyces chromofuscus. Applied and Environmental Microbiology, 58, 3598-3604, 1992.
Perkins, J. R.; Tomer, K. B. Capillary electrophoresis/electrospray mass spectrometry using a
high-performance magnetic sector mass spectrometer. Analytical Chemistry, 66, 2835-40, 1994.
Pielesz, A.; Baranowska, I.; Rybak, A.; Wlochowicz, A. Detection and determination of
aromatic amines as products of reductive splitting from selected azo dyes. Ecotoxicology andEnvironmental Safety, 53, 42-47, 2002.
Pinheiro, H.M., Touraud, E. and Thomas, O. Aromatic amines from azo dye reduction: statusreview with emphasis on direct UV spectrophotometric detection in textile industry wastewaters.
Dyes and Pigments, 61, 121-139, 2004.
Plum, A.; Braun, G.; Rehorek, A. Process monitoring of anaerobic azo dye degradation by high-
performance liquid chromatography-diode array detection continuously coupled to membrane
filtration sampling modules. Journal of Chromatography, A, 987, 395-402, 2003.
113

8/13/2019 Zhao Xueheng 200408 Phd
http://slidepdf.com/reader/full/zhao-xueheng-200408-phd 125/127

8/13/2019 Zhao Xueheng 200408 Phd
http://slidepdf.com/reader/full/zhao-xueheng-200408-phd 126/127
Shaul, G.M.; Holdsworth, T.J.; Dempsey, C.R.; Dostall, K.A. Fate of water soluble azo dyes in
the activated sludge process. Chemosphere, 22, 107-119, 1991.
Sherma, J. Planar chromatography. Analytical Chemistry, 72, 9-25, 2000.
Shin, K.S. and Kim, C.J. Decolorisation of artificial dyes by peroxidase from the white-rotfungus, Pleurotus ostreatus. Biotechnology letters, 20, 569-572, 1998.
Shin, K.S.; Oh, I. K. and Kim, C.J. Production and purification of Remazol Brilliant Blue Rdecolorizing peroxidase from the culture filtrate of Pleurotus ostreatus. Applied and
Environmental Microbiology, 63, 1744-1748, 1997.
Shin, K.S.; Youn, H.D.; Han, Y.H.; Kang, S.O. and Hah, Y.C. Purification and characterization
of D-glucose oxidase from white rot fungus Pleurotus ostreatus. European Journal of
Biochemistry, 215, 747-752, 1993.
Smith, R. D.; Barinaga, C. J.; Udseth, H. R. Improved electrospray ionization interface forcapillary zone electrophoresis-mass spectrometry. Analytical Chemistry, 60, 1948-1952, 1988.
Spadaro, J. T.; Gold, M. H. and Renganathan, V. Degradation of azo dyes by the lignin-
degrading fungus Phanerochaete chrysosporium. Applied Environmental Microbiology, 58,
2397-2401, 1992.
Spadaro, J.T. and Renganathan, V. Peroxidase-catalyzed oxidation of azo dyes: mechanism of
Disperse Yellow 3 degradation. Archives of Biochemistry and Biophysics. 312, 301-307, 1994.
Suguimoto, H. H.; Barbosa, A.M.; Dekker, R.F. and Castro-Gomez, R.J. Veratryl alcoholstimulates fruiting body formation in the oyster mushroom, Pleurotus ostreatus. FEMS
Microbiology Letters 194, 235-238, 2001.
Takeda, S., Tanaka, Y., Nishimura, Y., Yamane, M., Siroma, Z., and Wakida, S., Analysis of
dyestuff degradation products by capillary electrophoresis. Journal of Chromatography A, 853,
503-509, 1999.
Tien M. and Kirk, T.K. Lignin-degrading enzyme from Phanerochaete chrysosporium:
purification, characterization, and catalytic properties of a unique H2O2 –requiring oxygenase.
Proceeding of the National Academy of Sciences of the United States of America, 81, 2280-2284, 1984.
Tien, M. Properties of ligninase from Phanerochaete chrysosporium and their possibleapplications. CRC Critical Reviews in Microbiology, 15, 141-168, 1987.
Torres, E., Bustos-jaimes, I., and Borgne, S. L. Potential use of oxidative enzymes for thedetoxification of organic pollutants. Applied Catalysis B: Environmental, 46, 1-15, 2003.
115

8/13/2019 Zhao Xueheng 200408 Phd
http://slidepdf.com/reader/full/zhao-xueheng-200408-phd 127/127
Valli, K. and Gold, M. Degradation of 2,4-dichlorophenol by the lignin-degrading fungusPhanerochaete chrysosporium. Journal of Bacteriology, 173, 345-352, 1991.
Valli, K., Brock, B., Joshi, D., and Gold, M. Degradation of 2,4-dinitrotoluene by the lignin-
degrading fungus Phanerochaete chrysosporium. Applied and Environmental Microbiology, 58,
221-228, 1992.
Verhaert, P.; Uttenweiler-Joseph, S.; Vries, M.; Loboda, A.; Ens, W.; Standing, K. G. Matrix-
assisted laser desorption/ionization quadrupole time-of-flight mass spectrometry: an elegant toolfor peptidomics. Proteomics, 1, 118-131, 2001.
Vinodgopal, K.; Peller, J. Hydroxyl radical-mediated advanced oxidation processes for textiledyes: A comparison of the radiolytic and sonolytic degradation of the monoazo dye Acid Orange
7. Research on Chemical Intermediates, 29, 307-316, 2003.
Vuorensola, K.; Kollonen, J.; Siren, H.; Ketola, R. Optimization of capillary electrophoretic-
electrospray ionization-mass spectrometric analysis of catecholamines. Electrophoresis, 22,4347-4354, 2001.
Wang, L. and Tsai, S. Simultaneous determination of oxidative hair dye p-phenylenediamine
and its metabolites in human and rabbit biological fluids. Analytical Biochemistry, 312, 201-207, 2003.
Wariishi, H.; Akileswaran, L. and Gold, M.H. Manganese peroxidase from the basidiomycetePhanerochaete chrysosporium: spectral characterization of the oxidized states and the catalytic
cycle. Biochemistry, 27, 5365-5370, 1988.
Wariishi, H.; Valli, K. and Gold, M.H. Manganese(II) oxidation by manganese peroxidase fromthe basidiomycete Phanerochaete chrysosporium. Journal of Biological Chemistry, 267, 23688-
23695 1992