8/3/2019 11-12 CURS INTRODUCERE 061020111908
http://slidepdf.com/reader/full/11-12-curs-introducere-061020111908 1/80
sistemul sanitar
-
sanatate - - semestrul III - An univ. 2011 – 2012
ro . r. an e a ncu, acu a ea anagemen
[email protected]; [email protected]
10/16/2011 MSS MAPSS - 2011-2012 110/16/2011 1

8/3/2019 11-12 CURS INTRODUCERE 061020111908
http://slidepdf.com/reader/full/11-12-curs-introducere-061020111908 2/80
Tematica curs si seminar n ro ucere
I. Problematica previziunii – metode calitative si cantitative
1.1. Prezentare generala – concepte, clasificari1.2. Teme de discutie – tipuri particulare de previziuni
1.3. Analiza seriilor dinamice
II. Metode de previziune aplicate2.1. Metode de ajustare, Ajustarea exponentiala. A plicatie nr. 1 –
Previziunea pentru cursul de schimb valutar leu - euro ptr. octombrie 2011 (daterea e pentru omania – www. nro.ro
2.2. Extrapolarea analitica si fenomenologica
2.3. Analiza de regresie si corelatie. Regresia liniara - Aplicatiile nr.- - . rev z unea nr. e me c a ocu or oman a; es area core a e
- Aplicatia nr. 5. PIB vs. speranta de viata la nastere
10/16/2011 MSS MAPSS - 2011-2012 210/16/2011 2

8/3/2019 11-12 CURS INTRODUCERE 061020111908
http://slidepdf.com/reader/full/11-12-curs-introducere-061020111908 3/80
Tematica curs si seminar .
3.1.Procesul cunoaşterii ştiinţifice – etape. Informatii – procese
obtinere/procesare. . – .
3.3. Teoria deciziilor statistice. Decizii multicriteriale – multiatribut. Aplicatia nr. 6. Efectuarea unor clasamente. Decizii cu mai multe criterii – comparatii, prioritizari
3.4. Actualitate in analiza deciziilor. Teoria deciziilor – economie cognitiva- economia comportamentala. Elemente de managementul riscului. Aplicatia nr. 7. Evaluari cantitative ale riscului
. . – p ca e numer ca nr. .
IV. Elemente introductive de Managementul proiectului si ACB. . – . p ca a nr. . xemp care cons ru re mo e nanc ar pentru venituri si cheltuieli. Calculul unor indicatori VNA (NPV) si RIR (IRR)
4.2. Analiza cost – eficacitate si Analiza cost – utilitate. Aplicatia nr. 10. Calcule de
eficienta.
10/16/2011 MSS MAPSS - 2011-2012 310/16/2011 3
8/3/2019 11-12 CURS INTRODUCERE 061020111908
http://slidepdf.com/reader/full/11-12-curs-introducere-061020111908 4/80
Surse de informatii si date statistice
http://data.euro.who.int/hfadb/
European health for all database (HFA-DB) World Health Organization Regional Office
for Europe
EUROPE IN FIGURES http://ec.europa.eu/eurostat
Eurostat yearbook 2010 - chapter 2 “Population: , chapter 3 “Health”, chapter 6 “Livingconditions and welfare”
Eurostat yearbook 2009 - chapter 5 “Health”, chapter 6 “Living conditions and welfare”
WORLD HEALTH STATISTICS 2011; www.who.int/whosis/whostat/EN_WHS 2011 _Full. pdf
,http://www.who.int/whosis/whostat/EN_WHS10_Full.pdf
WORLD HEALTH STATISTICS 2009, © World Health Organization 2009
p: www.cnp.ro ro prognoze
PROIECŢIA PRINCIPALILOR INDICATORI MACROECONOMICI PENTRUPERIOADA 2010 – 2014, Prognoza de primăvar ă 2011
10/16/2011 MSS MAPSS - 2011-2012 410/16/2011 4
8/3/2019 11-12 CURS INTRODUCERE 061020111908
http://slidepdf.com/reader/full/11-12-curs-introducere-061020111908 5/80
Bibliografie Jones, Andrew, Rice Nigel, Bago d’Uva Teresa, Balia Silvia – Applied Health Economics, Routledge
A vance texts n Econom cs an F nance, 2007
Raportul “STRATEGIA NAŢIONALĂ DE RAŢIONALIZARE A SPITALELOR ” elaborat 2010Ministerul Sanatatii, Banca Mondiala
Raportul “UN SISTEM SANITAR CENTRAT PE NEVOILE CETĂŢEANULUI”, Raportul Comisiei Prezidenţiale, ,
Bucuresti
Health statistics - Atlas on mortality in the European Union, EU 2009, Product code: KS-30-08-357ISBN: 978-92-79-08763-9
WORLD HEALTH STATISTICS 2010, World Health Organization 2010,p: www.w o. n w os s w os a _ _ u .p
Health and safety at work in Europe (1999–2007) A statistical portraithttp://epp.eurostat.ec.europa.eu/cache/ITY_OFFPUB/KS-31-09-290/EN/KS-31-09-290-EN.PDF
Euro Health Consumer Index 2009, 2008
http://www.eurofound.europa.eu/publications/htmlfiles/ef0902.htm
Human Development Report 2009 “Overcoming barriers: Human mobility and development”
“Systematic review of the effectiveness and cost-effectiveness of home versus hospital or satellite unit haemodialysis for people with end stage renal failure”, NHS R&D HTA Programme
Decision Analysis in healthcare, George Mason University, web site:http://guston.gmu.edu/healthscience/730/IntroductiontoDecisionAnalysis
10/16/2011 MSS MAPSS - 2011-2012 510/16/2011 5
8/3/2019 11-12 CURS INTRODUCERE 061020111908
http://slidepdf.com/reader/full/11-12-curs-introducere-061020111908 6/80
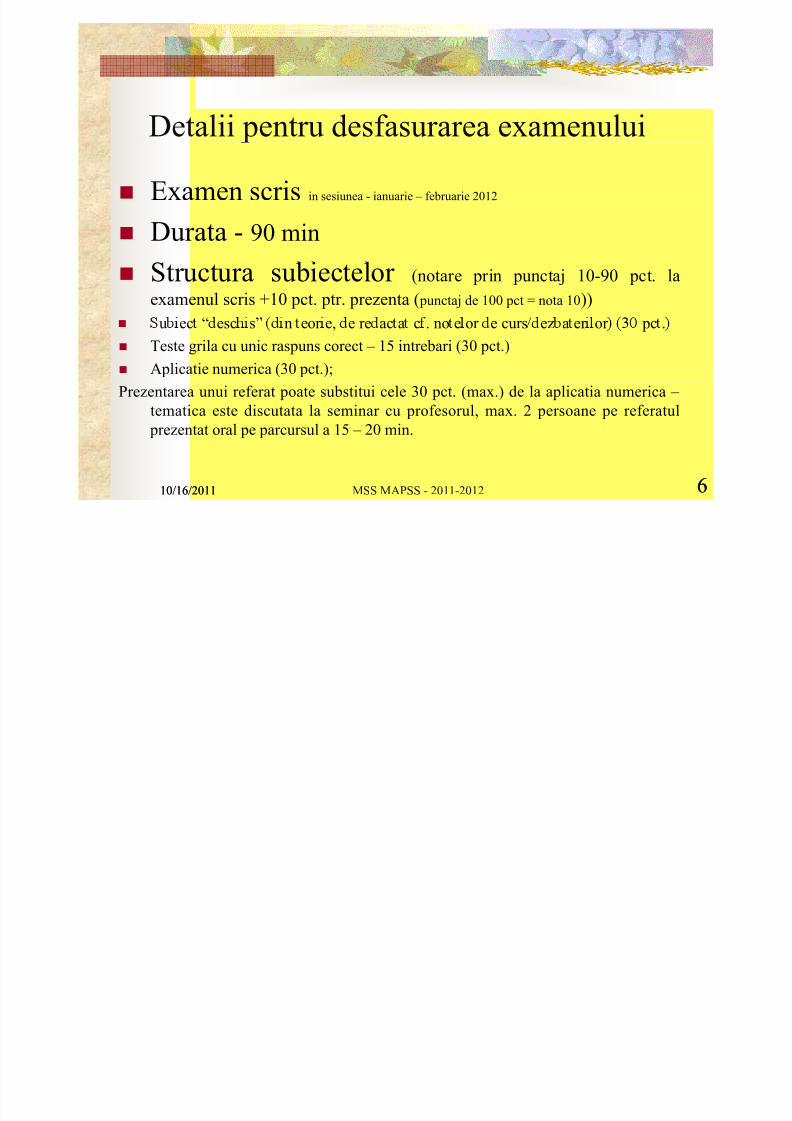
Detalii pentru desfasurarea examenului
Examen scris in sesiunea - ianuarie – februarie 2012
Durata - 90 min
Structura subiectelor (notare prin punctaj 10-90 pct. laexamenul scris +10 pct. ptr. prezenta ( punctaj de 100 pct = nota 10))
“ ”u ec esc s n eor e, e re ac a c . no e or e curs ez a er or pc .
Teste grila cu unic raspuns corect – 15 intrebari (30 pct.)
Aplicatie numerica (30 pct.);Prezentarea unui referat poate substitui cele 30 pct. (max.) de la aplicatia numerica –
tematica este discutata la seminar cu profesorul, max. 2 persoane pe referatul
prezentat oral pe parcursul a 15 – 20 min.
10/16/2011 MSS MAPSS - 2011-2012 610/16/2011 6

8/3/2019 11-12 CURS INTRODUCERE 061020111908
http://slidepdf.com/reader/full/11-12-curs-introducere-061020111908 7/80
EHCI European Health Consumer Index 2009; Indexulsistemului sanitar european 2009
Surse de date:
World Health Organization (WHO)The ECHI (European Community Health Indicators)
European Health for All database (HFA-DB)
EUROSTAT statistics by themesECHI (European Community Health Indicators)
8/3/2019 11-12 CURS INTRODUCERE 061020111908
http://slidepdf.com/reader/full/11-12-curs-introducere-061020111908 8/80
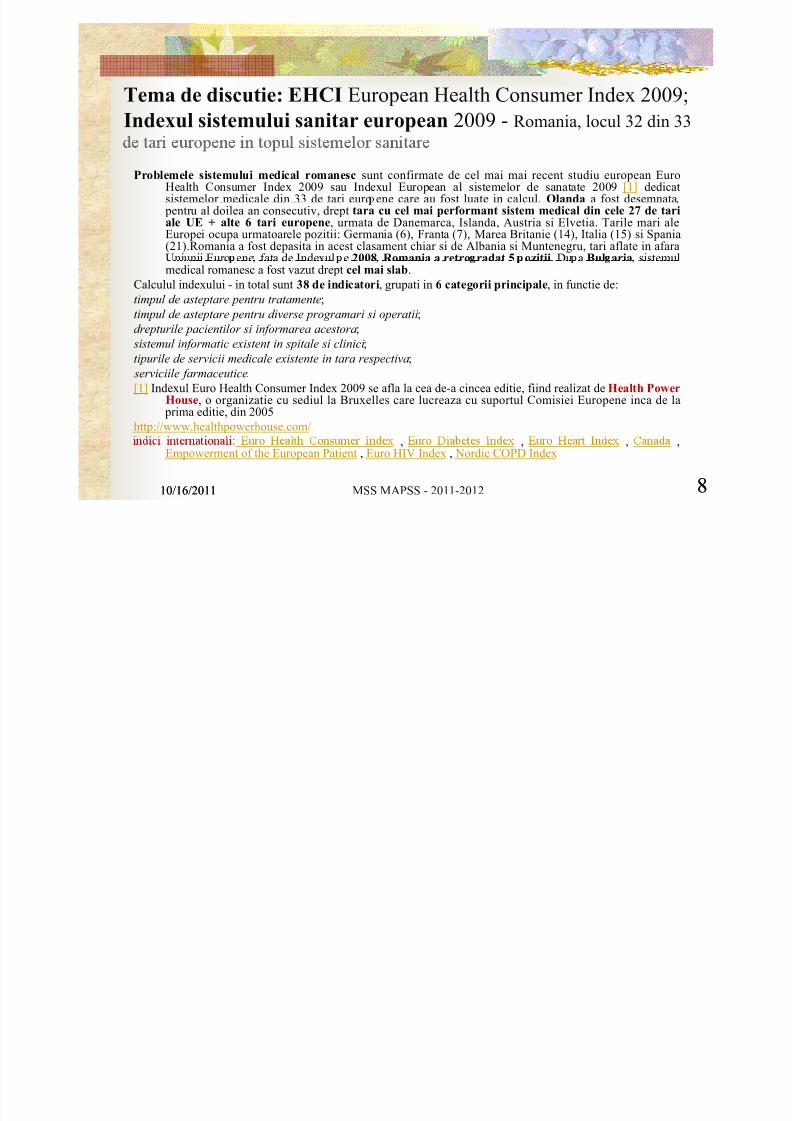
Tema de discutie: EHCI European Health Consumer Index 2009;Indexul sistemului sanitar european 2009 - Romania, locul 32 din 33
Problemele sistemului medical romanesc sunt confirmate de cel mai mai recent studiu european Euro
Health Consumer Index 2009 sau Indexul European al sistemelor de sanatate 2009 [1] dedicatsistemelor medicale din 33 de tari euro ene care au fost luate in calcul. Olanda a fost desemnata
pentru al doilea an consecutiv, drept tara cu cel mai performant sistem medical din cele 27 de tariale UE + alte 6 tari europene, urmata de Danemarca, Islanda, Austria si Elvetia. Tarile mari aleEuropei ocupa urmatoarele pozitii: Germania (6), Franta (7), Marea Britanie (14), Italia (15) si Spania(21).Romania a fost depasita in acest clasament chiar si de Albania si Muntenegru, tari aflate in afaraUniunii Euro ene fata de Indexul e 2008 Romania a retro radat 5 ozitii. Du a Bul aria sistemulmedical romanesc a fost vazut drept cel mai slab.
Calculul indexului - in total sunt 38 de indicatori, grupati in 6 categorii principale, in functie de:
timpul de asteptare pentru tratamente;
timpul de asteptare pentru diverse programari si operatii;
drepturile pacientilor si informarea acestora;
sistemul informatic existent in spitale si clinici;
tipurile de servicii medicale existente in tara respectiva;
serviciile farmaceutice.
[1] Indexul Euro Health Consumer Index 2009 se afla la cea de-a cincea editie, fiind realizat de Health PowerHouse, o organizatie cu sediul la Bruxelles care lucreaza cu suportul Comisiei Europene inca de la
prima editie, din 2005
http://www.healthpowerhouse.com/
10/16/2011 MSS MAPSS - 2011-2012 810/16/2011 8
, , , ,Empowerment of the European Patient , Euro HIV Index , Nordic COPD Index

8/3/2019 11-12 CURS INTRODUCERE 061020111908
http://slidepdf.com/reader/full/11-12-curs-introducere-061020111908 9/80
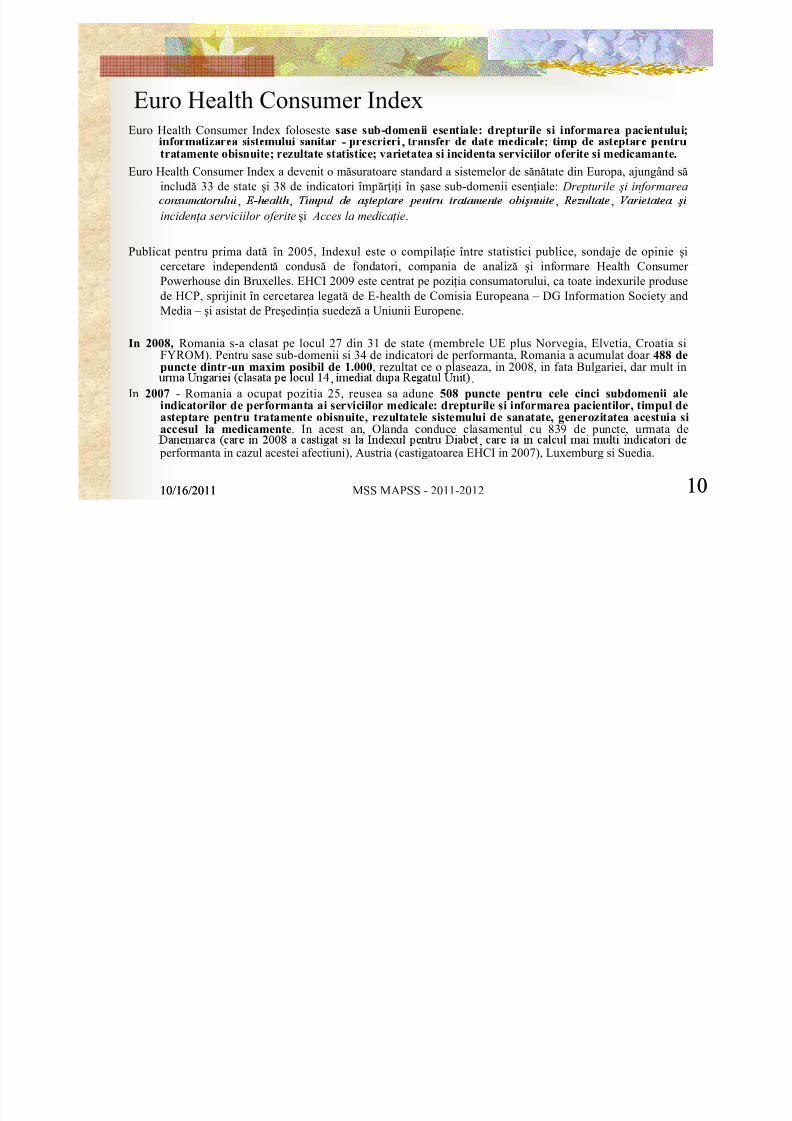
Euro Health Consumer Index
Indexul European de Sănătate[1] Raportul reprezinta o cercetare comparativă a sistemelor de profil dinUE.
Cercetarea comparativă anuală a sistemelor de sănătate din Europa 2009 a clasat România penultima din
33 de ţări europene, cu 489 puncte din 1000 posibile. Olanda câştigă din nou clasamentul cu 863 depuncte, urmată de Danemarca (care î şi păstrează şi ea locul de anul trecut), şi Islanda.
România nu poate să se laude nici măcar cu drepturi de bază ale pacienţilor sau E-health, categorii uşor
ameliorabile; de rezultate nici nu poate fi vorba. Singura ţar ă mai prost clasată decât România este
Bulgaria, cele două noi state membre UE fiind întrecute până şi de Albania, Croaţia sau FYROM.
„ România are, din pă cate, scoruri proaste în majoritatea domeniilor să nă t ăţ ii” , spune Dr. Arne Björnberg,
Directorul de Cercetare al Euro Health Consumer Index. „Se are că l ăţ ile informale a şteptate de la
pacien ţ i sunt încă o problemă serioasă şi o piedică în ajungerea la un sistem de să nă tate bazat pe
echitate.”
Clasamentul din 2009subliniază faptul că statele câştigătoare încep să folosească informaţii despre sănătate şi
alegere pentru a implica pacienţii în luarea deciziilor, construind un proces de jos în sus pentru
îmbunătăţirea performanţelor.
La sfâr şitul clasamentului se afla un grup de ţări blocate în “vechiul” sistem de sănătate, ierarhizat şi lipsit de
transparenţă. Această diferenţă constituie o provocare pentru principiile de echitate şi solidaritate aleUniunii Europene.
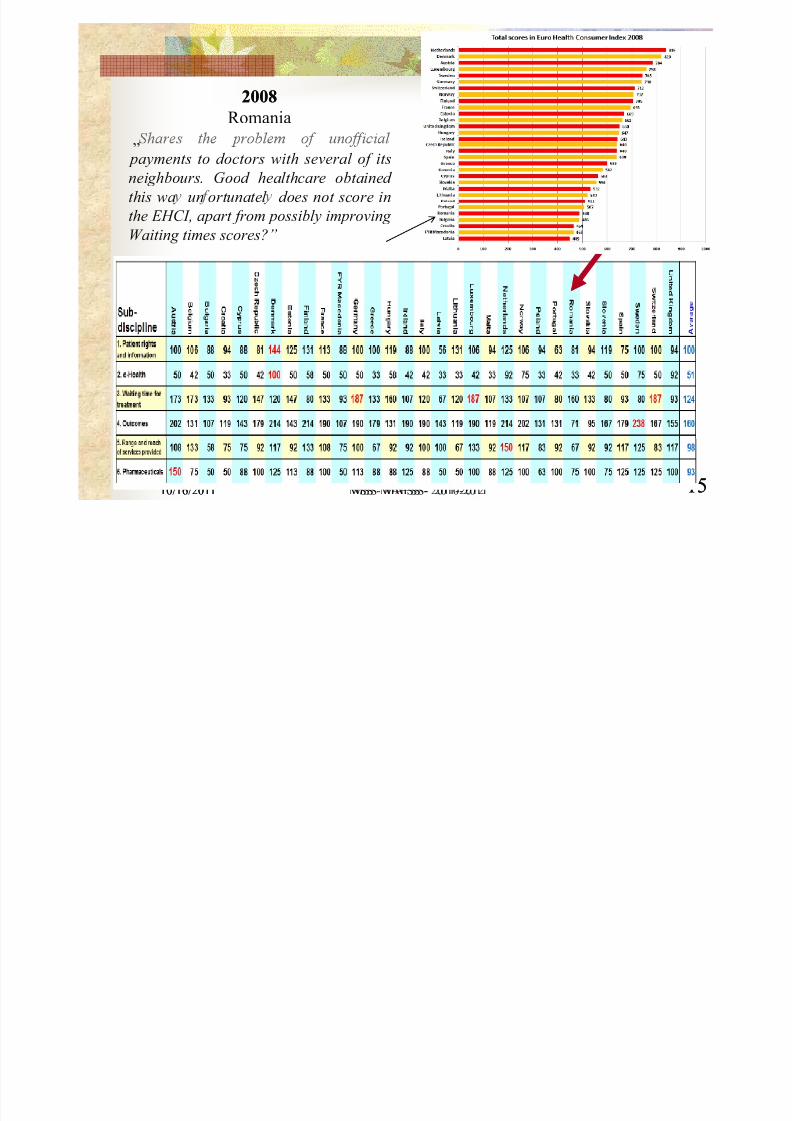
[1] Countries included in Euro Health Consumer Index 2008: Austria, Belgium, Bulgaria, Croatia, Cyprus, Czech Republic, Denmark, Estonia,Finland, France, FYR Macedonia, Germany, Greece, Hungary, Ireland, Italy, Latvia, Lithuania, Luxembourg, Malta, Netherlands,
Norway, Poland, Portugal, Romania, Slovakia, Slovenia, Spain, Sweden, Switzerland, United Kingdom
10/16/2011 MSS MAPSS - 2011-2012 910/16/2011 9
8/3/2019 11-12 CURS INTRODUCERE 061020111908
http://slidepdf.com/reader/full/11-12-curs-introducere-061020111908 10/80

8/3/2019 11-12 CURS INTRODUCERE 061020111908
http://slidepdf.com/reader/full/11-12-curs-introducere-061020111908 11/80
The Euro Health Consumer Index 2009
is an attempt at measuring and ranking the performance of healthcare provision
.results definitely contain informationquality problems.
There is a shortage of pan-European,uniform set procedures for dataga er ng.
- the HCP finds it far better to present theresults to the public, and to promoteconstructive discussion rather thanstaying with the only too commonopinion that as long as healthcareinformation is not a hundred percentcomplete it should be kept in thecloset.
- it is im ortant to stress that the Indexdisplays consumer information, notmedically or individually sensitivedata.
10/16/2011 MSS MAPSS - 2011-2012 1110/16/2011 11

8/3/2019 11-12 CURS INTRODUCERE 061020111908
http://slidepdf.com/reader/full/11-12-curs-introducere-061020111908 12/80
e uro ea onsumer n ex
10/16/2011 MSS MAPSS - 2011-2012 1210/16/2011 12
8/3/2019 11-12 CURS INTRODUCERE 061020111908
http://slidepdf.com/reader/full/11-12-curs-introducere-061020111908 13/80
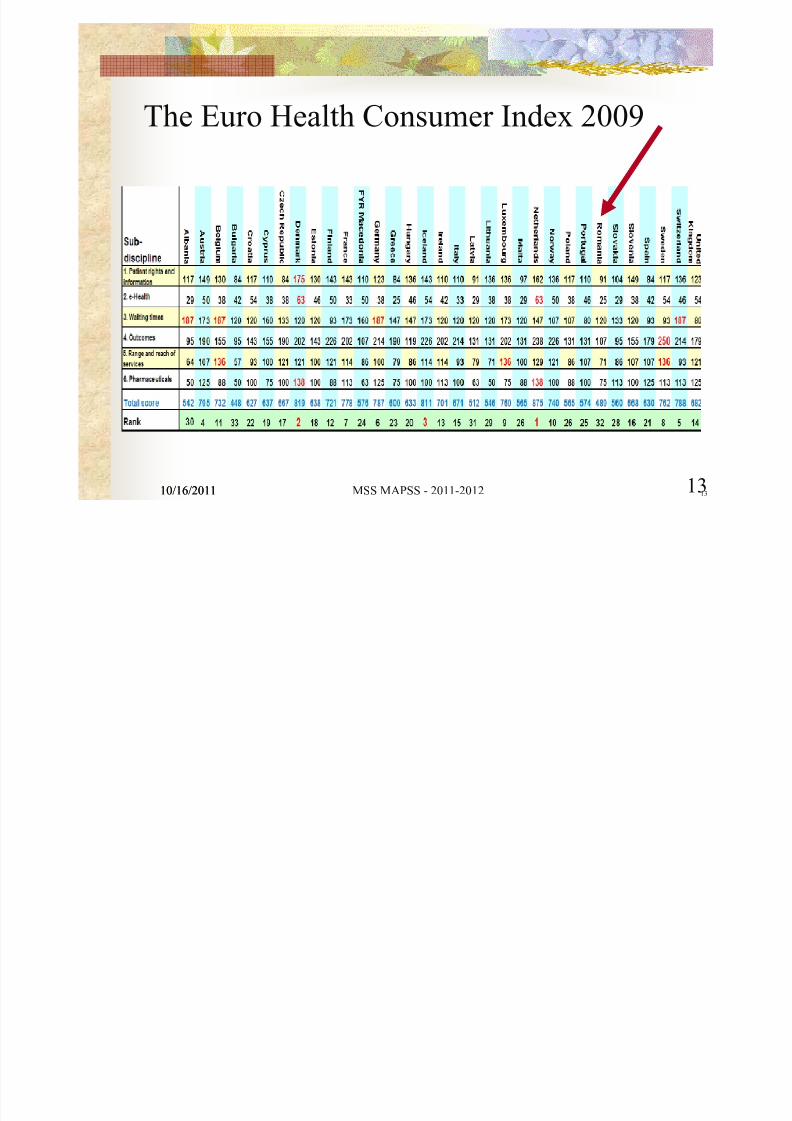
The Euro Health Consumer Index 2009
10/16/2011 MSS MAPSS - 2011-2012 1310/16/2011 13

8/3/2019 11-12 CURS INTRODUCERE 061020111908
http://slidepdf.com/reader/full/11-12-curs-introducere-061020111908 14/80
Healthcare spends per capita in PPP dollars have been taken from the WHO HfA database
(August 2009; latest available numbers, most frequently 2007); For countries not having a 2007 value
in the database, the “latest available” number has been multiplied by the average % increase in the EU since the
“latest available” year.
10/16/2011 MSS MAPSS - 2011-2012 1410/16/2011 14
8/3/2019 11-12 CURS INTRODUCERE 061020111908
http://slidepdf.com/reader/full/11-12-curs-introducere-061020111908 15/80
20082008Romania
„
payments to doctors with several of its
neighbours. Good healthcare obtained
this wa un ortunatel does not score in
the EHCI, apart from possibly improving
Waiting times scores?”
10/16/2011 MSS MAPSS - 2011-2012 1510/16/2011 MSS - MAPSS- 2010-2011 15

8/3/2019 11-12 CURS INTRODUCERE 061020111908
http://slidepdf.com/reader/full/11-12-curs-introducere-061020111908 16/80
HCP has now started up the work on the 6th updated edition of the
Euro Health Consumer Index (EHCI 2011). The partially new
Expert Reference Panel will meet on October 3. The Index will be
published around Easter 2012, with some novel additionaln ca ors, u s a ow ng ong u na ana ys s. e nes
edition will cover 34 European countries, Serbia being the latest
.
10/16/2011 MSS MAPSS - 2011-2012 1610/16/2011 MSS - MAPSS- 2010-2011 16
8/3/2019 11-12 CURS INTRODUCERE 061020111908
http://slidepdf.com/reader/full/11-12-curs-introducere-061020111908 17/80
Surse de date (1) – World Health Organization
WHO Statistical Information S stem WHOSISincorporated in Global Health Observatory
' –
data and analyses for monitoring the global
ea s ua on; prov es cr ca a a an
analyses for key health themes, as well asdirect access to the full database.
10/16/2011 MSS MAPSS - 2011-2012 1710/16/2011 MSS - MAPSS- 2010-2011 17 p: www.w o. n
8/3/2019 11-12 CURS INTRODUCERE 061020111908
http://slidepdf.com/reader/full/11-12-curs-introducere-061020111908 18/80
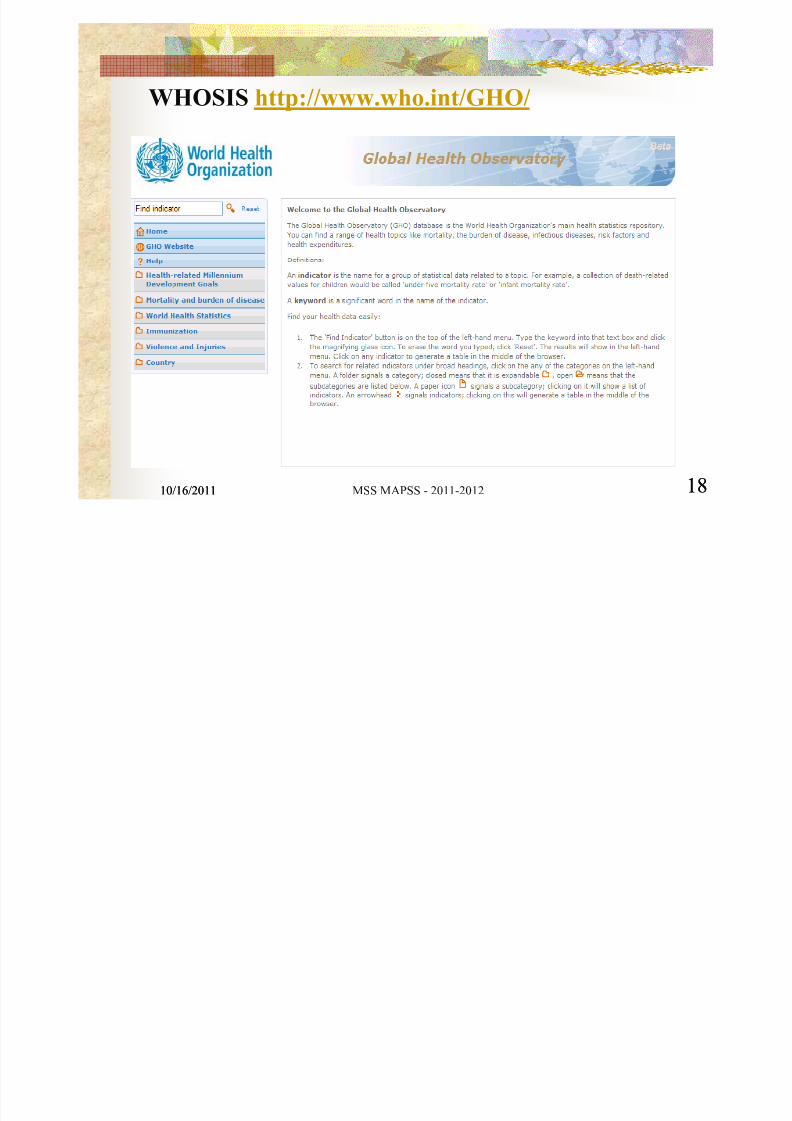
WHOSIS http://www.who.int/GHO/
10/16/2011 MSS MAPSS - 2011-2012 1810/16/2011 18

8/3/2019 11-12 CURS INTRODUCERE 061020111908
http://slidepdf.com/reader/full/11-12-curs-introducere-061020111908 19/80
Surse de date (2):
The ECHI project was carried out in the framework of the Health Monitoring- .
a list of 'indicators' for the public health field arranged according to a conceptual
view on health and health determinants.
-
Comprehensiveness: all aspects of the public health field should be covered. Meeting user needs: the set should cover the main priorities in public health policies of the
.
Being innovative: the set should not just be data-driven, but also indicate development needs.
Using earlier work : the efforts of international institutions with Eurostat and other
-, ,
indicators and standard variables have been taken on board as much as possible.
Using Health Monitoring Programme and Public Health Programme results: the results
of projects should be included in the data where appropriate.
10/16/2011 MSS MAPSS - 2011-2012 1910/16/2011 19

8/3/2019 11-12 CURS INTRODUCERE 061020111908
http://slidepdf.com/reader/full/11-12-curs-introducere-061020111908 20/80
The ECHI (European Community Health Indicators)
Indicators are at the crossroads of policy questions and data sets. Indicators reflect a policy interest
as well as a selected set of possibilities in terms of what can be calculated. Therefore they willon one hand be ustified from the olic side and on the other hand a short characterisation of the data source it's added.
ICHI (International Compendium of Health Indicators) is a web-based application containing- ,
databases.
ICHI provides a selection of the most relevant indicator names and definitions as listed by theseorganisations. It also includes the complete list of health indicators developed by the ECHI
ro ect. All indicators are arran ed followin the ECHI taxonom .
The ECHI list and the ICHI website have been developed by the ECHI project (EuropeanCommunity Health Indicators, in two phases, 1998-2004) project, run under the EU HealthMonitoring Programme. ICHI offers an easy entry to the indicator definitions used by the
international organisations in their databases. This allows for a quick comparison betweenindicators and their definitions, in one coherent and structured system.
10/16/2011 MSS MAPSS - 2011-2012 2010/16/2011 20

8/3/2019 11-12 CURS INTRODUCERE 061020111908
http://slidepdf.com/reader/full/11-12-curs-introducere-061020111908 21/80
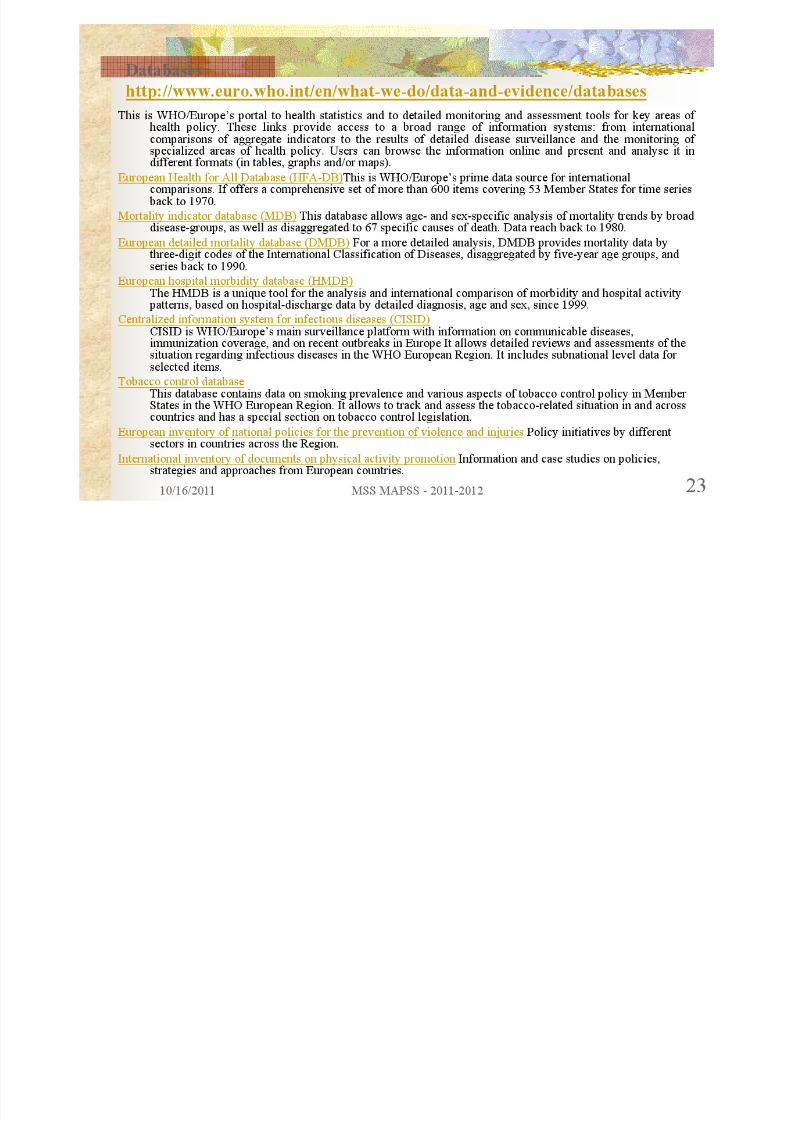
http://www.euro.who.int/en/what-we-do/data-and-evidence
10/16/2011 MSS MAPSS - 2011-2012 2110/16/2011 21
8/3/2019 11-12 CURS INTRODUCERE 061020111908
http://slidepdf.com/reader/full/11-12-curs-introducere-061020111908 22/80
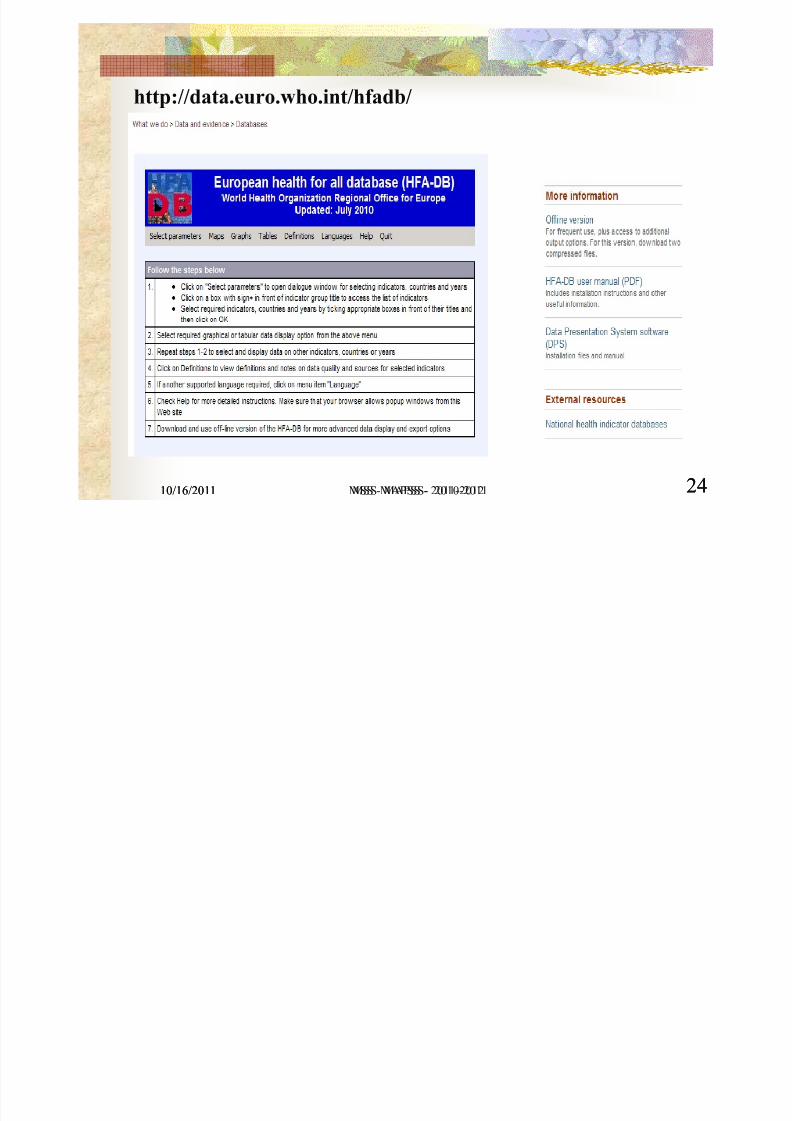
http://www.euro.who.int/en/what-we-do/data-and-evidence/databases European Health for All database (HFA-DB)
HFA-DB is a central database of independent, comparable and up-to-date basic health statistics.
http://data.euro.who.int/hfadb/
launched it in the mid-1980s.
It contains time series from 1970.
HFA-DB is updated biannually and contains about 600 indicators for the 53 Member States in the.
The indicators cover:
basic demographics;
health status (mortality, morbidity, maternal health and child health);
health determinants (such as lifestyle and environment)
.
HFA-DB allows country and intercountry analyses to be displayed as charts, curves or maps,which can be exported free of charge to other software programs.
10/16/2011 MSS MAPSS - 2011-2012 2210/16/2011 22
8/3/2019 11-12 CURS INTRODUCERE 061020111908
http://slidepdf.com/reader/full/11-12-curs-introducere-061020111908 23/80
8/3/2019 11-12 CURS INTRODUCERE 061020111908
http://slidepdf.com/reader/full/11-12-curs-introducere-061020111908 24/80
http://data.euro.who.int/hfadb/
10/16/2011 MSS MAPSS - 2011-2012 2410/16/2011 MSS - MAPSS- 2010-2011 24
8/3/2019 11-12 CURS INTRODUCERE 061020111908
http://slidepdf.com/reader/full/11-12-curs-introducere-061020111908 25/80
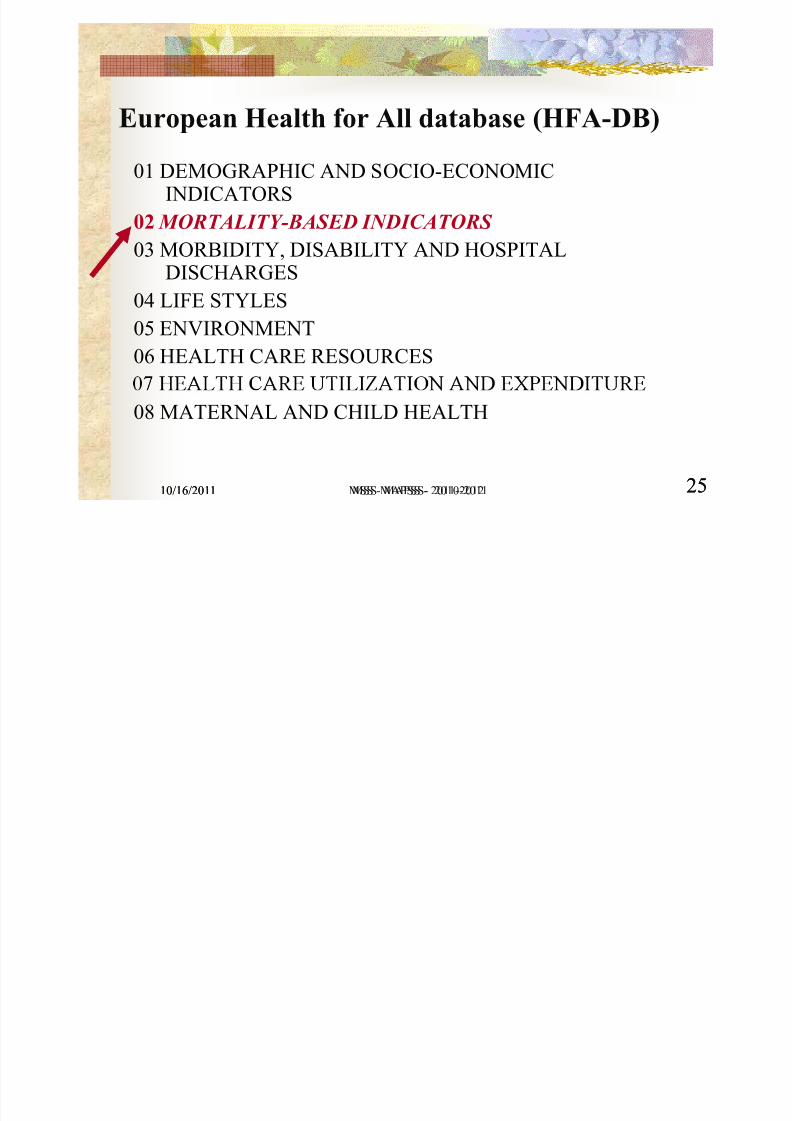
European Health for All database (HFA-DB)
01 DEMOGRAPHIC AND SOCIO-ECONOMIC
INDICATORS
02 MORTALITY-BASED INDICATORS
03 MORBIDITY, DISABILITY AND HOSPITAL
DISCHARGES04 LIFE STYLES
05 ENVIRONMENT
06 HEALTH CARE RESOURCES
08 MATERNAL AND CHILD HEALTH
10/16/2011 MSS MAPSS - 2011-2012 2510/16/2011 MSS - MAPSS- 2010-2011 25
8/3/2019 11-12 CURS INTRODUCERE 061020111908
http://slidepdf.com/reader/full/11-12-curs-introducere-061020111908 26/80
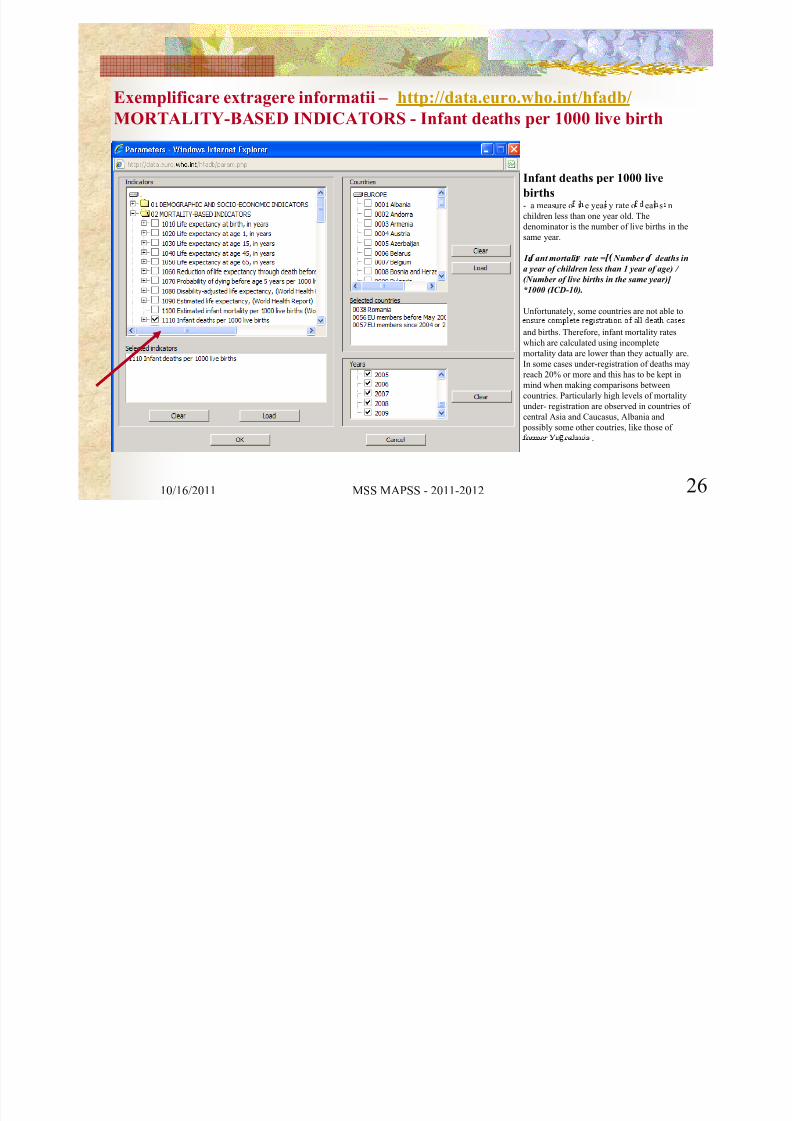
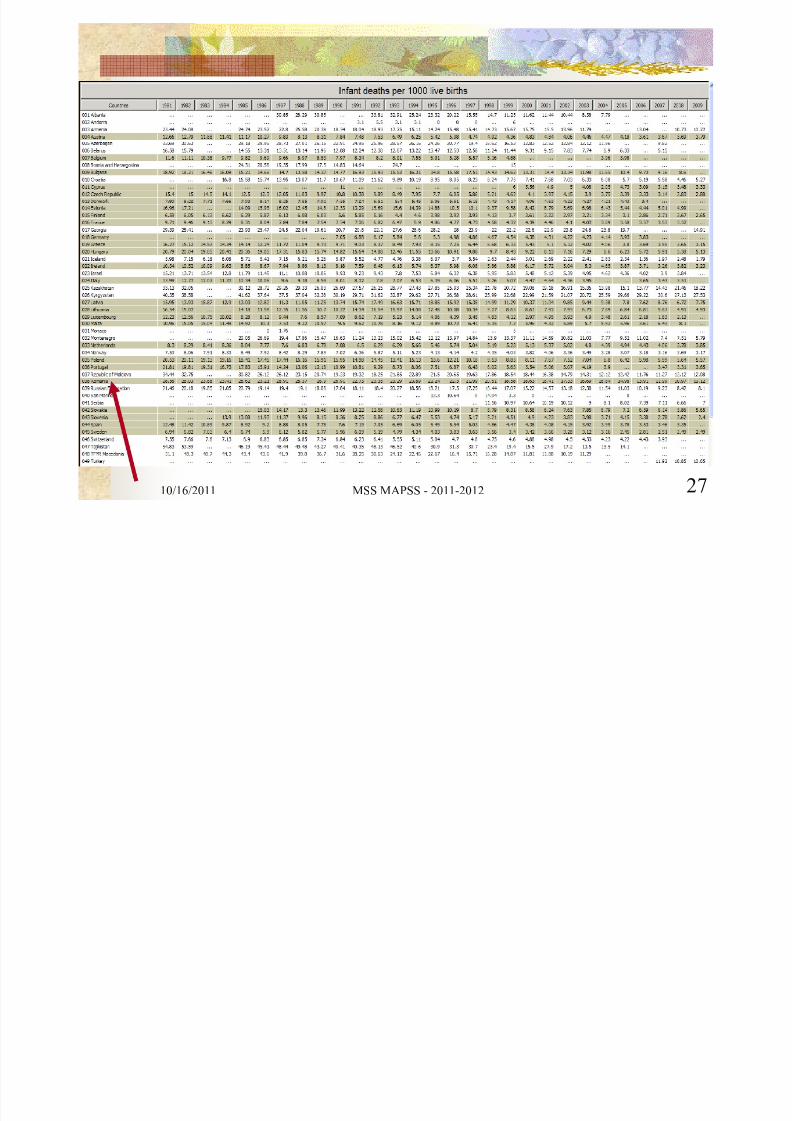
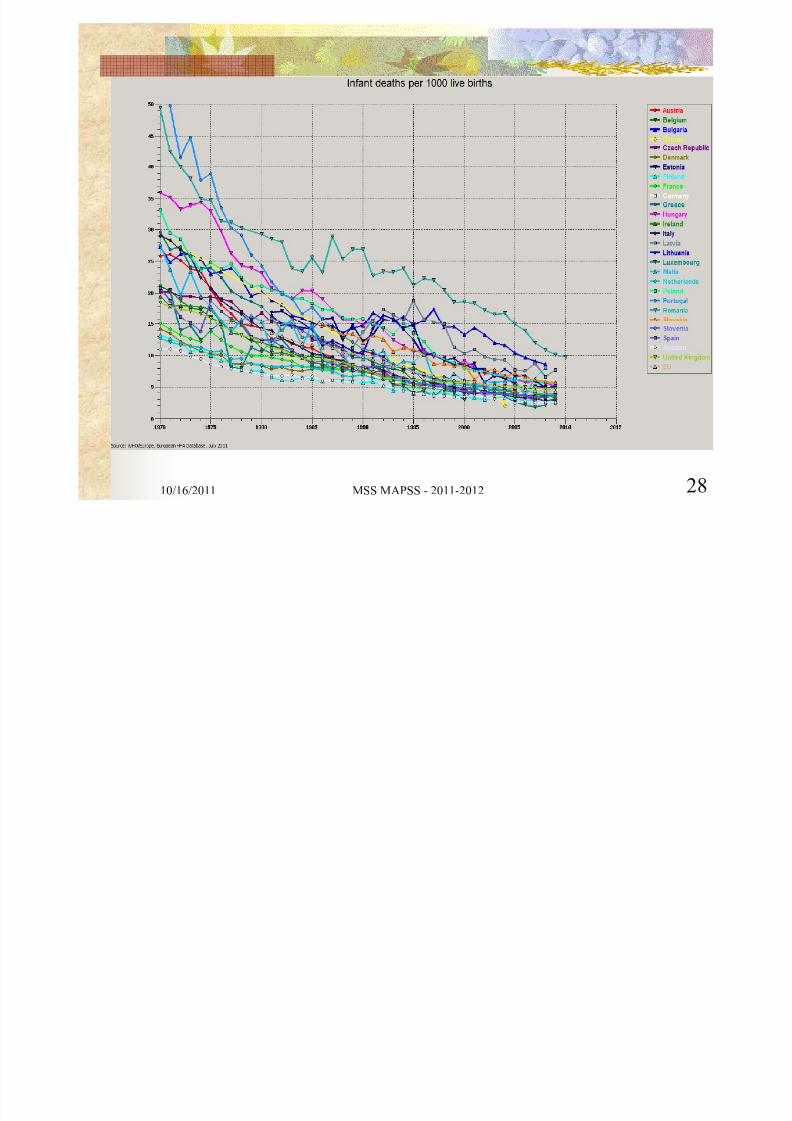
Exemplificare extragere informatii – http://data.euro.who.int/hfadb/MORTALITY-BASED INDICATORS - Infant deaths per 1000 live birth
Infant deaths per 1000 live
births- a measure o t e year y rate o eat s n
children less than one year old. The
denominator is the number of live births in the
same year.
In ant mortalit rate = Number o deaths in
a year of children less than 1 year of age) /
(Number of live births in the same year)] *1000 (ICD-10).
Unfortunately, some countries are not able to
and births. Therefore, infant mortality rates
which are calculated using incomplete
mortality data are lower than they actually are.
In some cases under-registration of deaths may
reach 20% or more and this has to be kept inmind when making comparisons between
countries. Particularly high levels of mortality
under- registration are observed in countries of
central Asia and Caucasus, Albania and
possibly some other coutries, like those of
former Yu oslavia .
10/16/2011 MSS MAPSS - 2011-2012 26
.
8/3/2019 11-12 CURS INTRODUCERE 061020111908
http://slidepdf.com/reader/full/11-12-curs-introducere-061020111908 27/80
10/16/2011 MSS MAPSS - 2011-2012 27
8/3/2019 11-12 CURS INTRODUCERE 061020111908
http://slidepdf.com/reader/full/11-12-curs-introducere-061020111908 28/80
10/16/2011 MSS MAPSS - 2011-2012 28

8/3/2019 11-12 CURS INTRODUCERE 061020111908
http://slidepdf.com/reader/full/11-12-curs-introducere-061020111908 29/80
10/16/2011 MSS MAPSS - 2011-2012 29

8/3/2019 11-12 CURS INTRODUCERE 061020111908
http://slidepdf.com/reader/full/11-12-curs-introducere-061020111908 30/80
10/16/2011 MSS MAPSS - 2011-2012 30
8/3/2019 11-12 CURS INTRODUCERE 061020111908
http://slidepdf.com/reader/full/11-12-curs-introducere-061020111908 31/80
- n an ea s per
live birth
10/16/2011 MSS MAPSS - 2011-2012 31
8/3/2019 11-12 CURS INTRODUCERE 061020111908
http://slidepdf.com/reader/full/11-12-curs-introducere-061020111908 32/80
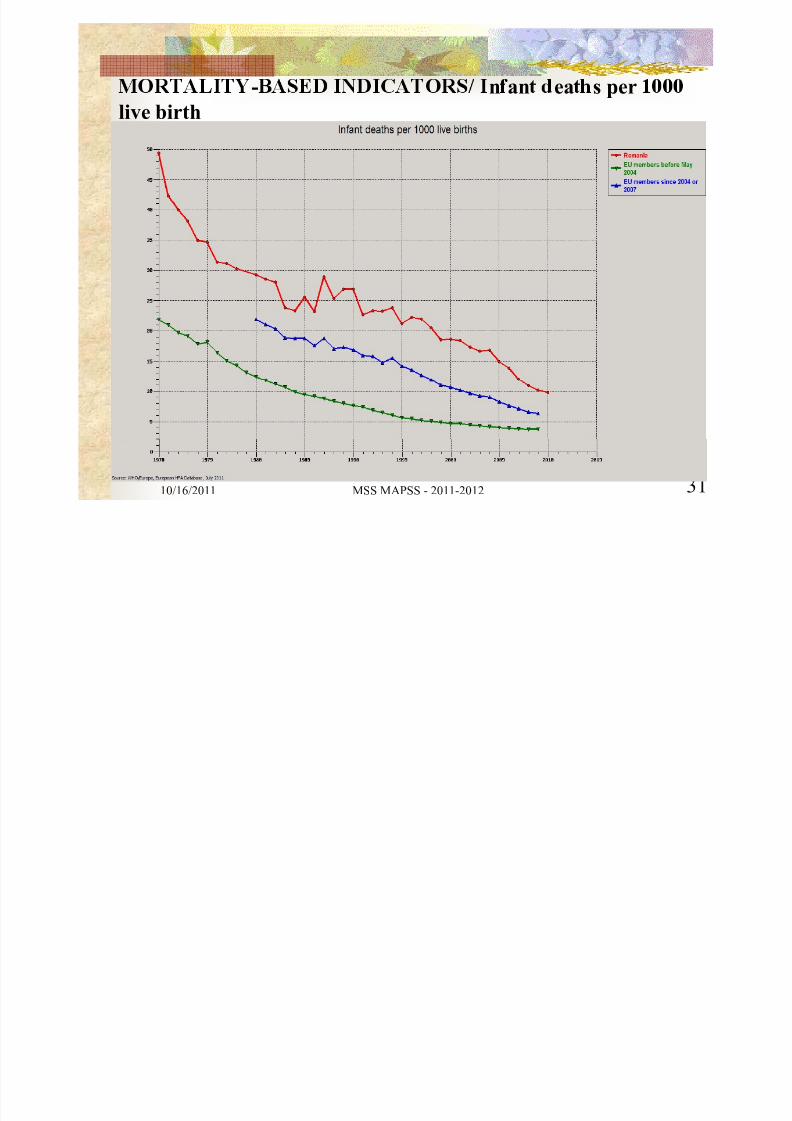
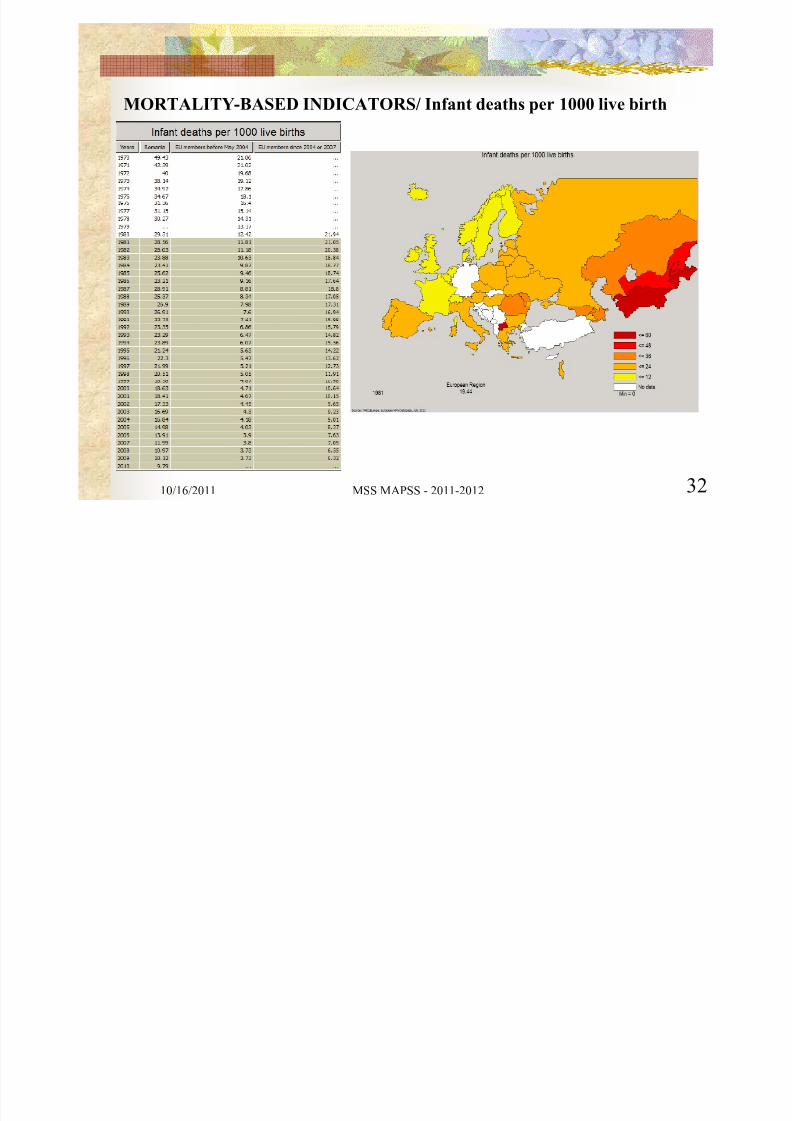
MORTALITY-BASED INDICATORS/ Infant deaths per 1000 live birth
10/16/2011 MSS MAPSS - 2011-2012 32

8/3/2019 11-12 CURS INTRODUCERE 061020111908
http://slidepdf.com/reader/full/11-12-curs-introducere-061020111908 33/80
Sursa de date (3) – raportari EUROSTAThttp://epp.eurostat.ec.europa.eu/portal/page/portal/statistics/themes
10/16/2011 MSS MAPSS - 2011-2012 3310/16/2011 MSS - MAPSS- 2010-2011 33

8/3/2019 11-12 CURS INTRODUCERE 061020111908
http://slidepdf.com/reader/full/11-12-curs-introducere-061020111908 34/80
Eurostat Population and social conditions HEALTH 2011Health is a high priority for Europeans, who expect to have a long and healthy life, to be protected against illnesses
and accidents and to receive appropriate health care. Accurate and detailed statistics on health have a key rolefor evidence based decisions by national and European authorities and are a major tool for monitoring health
policies. Health statistics include:
Public health issues such as health status, health problems and health determinants, health care provision and
resources, health care expenditures and causes of death
Strategy for Public Health
The European Commission's current strategy 'Together for Health: A Strategic Approach for the EU 2008-2013' aimsto improve citizens' prosperity, solidarity and security by:
Promotin health to im rove ros erit and olidarit
Improving citizens’ health security
Producing and distributing health knowledge
Competence for the organisation and delivery of health services and healthcare is largely held by the Member States,although the EU has the responsibility to give added value through launching actions such as those in relation tocross-border health threats and patient mobility, as well as reducing health inequalities and addressing keyhealth determinants.
Strategy for Health and safety at work. The European Commission's current strategy "Improving quality and productivity at work: the Community strategy 2007-2012 on health and safety at work " aims to achieve a
sustained reduction of occu ational accidents and diseases in the EU throu h various EU and national actions.Legal basis for the statistics on health. In December 2008 the European Parliament and the Council adopted a
framework Regulation for statistics concerning public health and health and safety at work . That regulation isaddressing five domains: Health care, health status and health determinants, accidents at work, occupationaldiseases and other work-related health problems and causes of death. Both the Community action Programme
-
10/16/2011 MSS MAPSS - 2011-2012 34
Community Statistical Programme 2008-12 foresee the implementation of that Regulation as a key statistical
element of a sustainable health monitoring system.

8/3/2019 11-12 CURS INTRODUCERE 061020111908
http://slidepdf.com/reader/full/11-12-curs-introducere-061020111908 35/80

8/3/2019 11-12 CURS INTRODUCERE 061020111908
http://slidepdf.com/reader/full/11-12-curs-introducere-061020111908 36/80
The collection ‘Public health’ has been divided into three domains:
ea care:health care expenditure:Health care expenditure data provide information on expenditure in the functionally defined
area of health distinct by provider category (e.g. hospitals, general practitioners), function. . ,company, household). The definitions and classifications of the System of Health Accounts(SHA) are followed.
health care non-expenditure: Non-ex enditure health care data cover 'health care human resources' h sicians dentists, nursing and caring professionals, etc) as well as hospital statistics (hospital
beds, surgical procedures in hospitals, high-tech equipment and patient related data,i.e.hospital discharges by disease).
health care indicators from surve s: tables on erceived unmet needs for medical or dentalcare, consultations of health care professionals, hospitalisation, cancer screening, etc.
health status indicators from surveys: tables on self-perceived health, life styles andrestrictions. Data on health conditions also play a role in the calculation of the "healthy life
years expectancy". This collection includes also tables on employment of disabled persons based on a 2002 ad hoc module of the Labour Force survey.
causes of death: Eurostat disseminates COD statistics according to a shortlist of 65 causes('Causes of death – European shortlist', based on the ICD – International StatisticalClassification of Diseases and Related Health Problems, WHO). Data are available at nationalan reg ona eve or o a num er, cru e ea ra es an s an ar se earates (SDR), broken down by age groups and by sex.

8/3/2019 11-12 CURS INTRODUCERE 061020111908
http://slidepdf.com/reader/full/11-12-curs-introducere-061020111908 37/80
http://epp.eurostat.ec.europa.eu/portal/page/portal/health/public_ health/data_public_health/main_tables

8/3/2019 11-12 CURS INTRODUCERE 061020111908
http://slidepdf.com/reader/full/11-12-curs-introducere-061020111908 38/80
http://epp.eurostat.ec.europa.eu/portal/page/portal/health/public_health/data_public_health/database
8/3/2019 11-12 CURS INTRODUCERE 061020111908
http://slidepdf.com/reader/full/11-12-curs-introducere-061020111908 39/80
Health and safety at work
The collection ‘Health and safety at work ’ is divided into four chapters (groups):
accidents at work (accidents at the workplace or in the course of an occupational activity);
occupational diseases (recognised cases from national authorities);
commu ng acc en s on e ourney o or rom wor ;
work-related health problems and accidental injuries (self-reported cases).
e a a presen e n e a es or e rs ree groups o e co ec on ea an sa e y a
work’ are based on national administrative sources, from declarations to the insurance (public
insurance, social security scheme, or private insurance scheme) or to another competent
authorit usuall the labour ins ectorate .The data for the last group of the collection ‘Health and safety at work’ (work-related health
problems and accidental injuries) were provided by an ad hoc module in the 1999 Community
labour force survey.
10/16/2011 MSS MAPSS - 2011-2012 3910/16/2011 MSS - MAPSS- 2010-2011 39

8/3/2019 11-12 CURS INTRODUCERE 061020111908
http://slidepdf.com/reader/full/11-12-curs-introducere-061020111908 40/80
http://epp.eurostat.ec.europa.eu/portal/page/portal/health/health_safety_work
8/3/2019 11-12 CURS INTRODUCERE 061020111908
http://slidepdf.com/reader/full/11-12-curs-introducere-061020111908 41/80
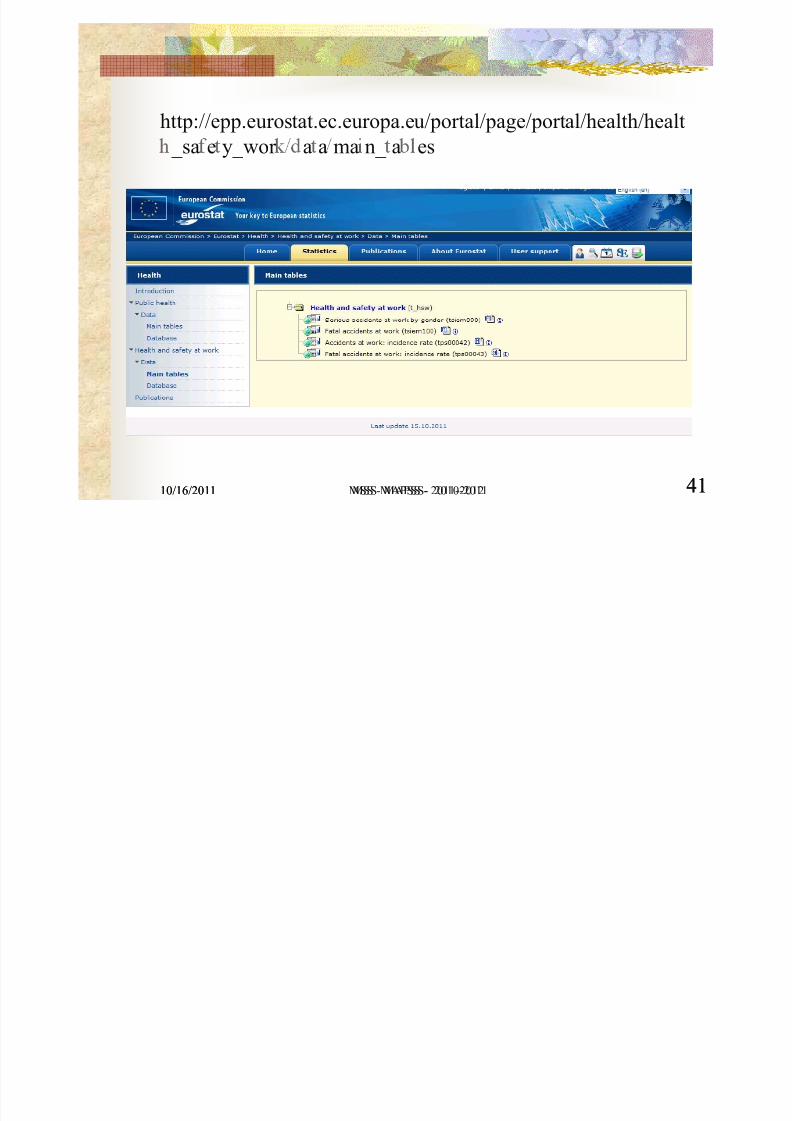
http://epp.eurostat.ec.europa.eu/portal/page/portal/health/healt
_sa e y_wor a a ma n_ a es
10/16/2011 MSS MAPSS - 2011-2012 4110/16/2011 MSS - MAPSS- 2010-2011 41
8/3/2019 11-12 CURS INTRODUCERE 061020111908
http://slidepdf.com/reader/full/11-12-curs-introducere-061020111908 42/80
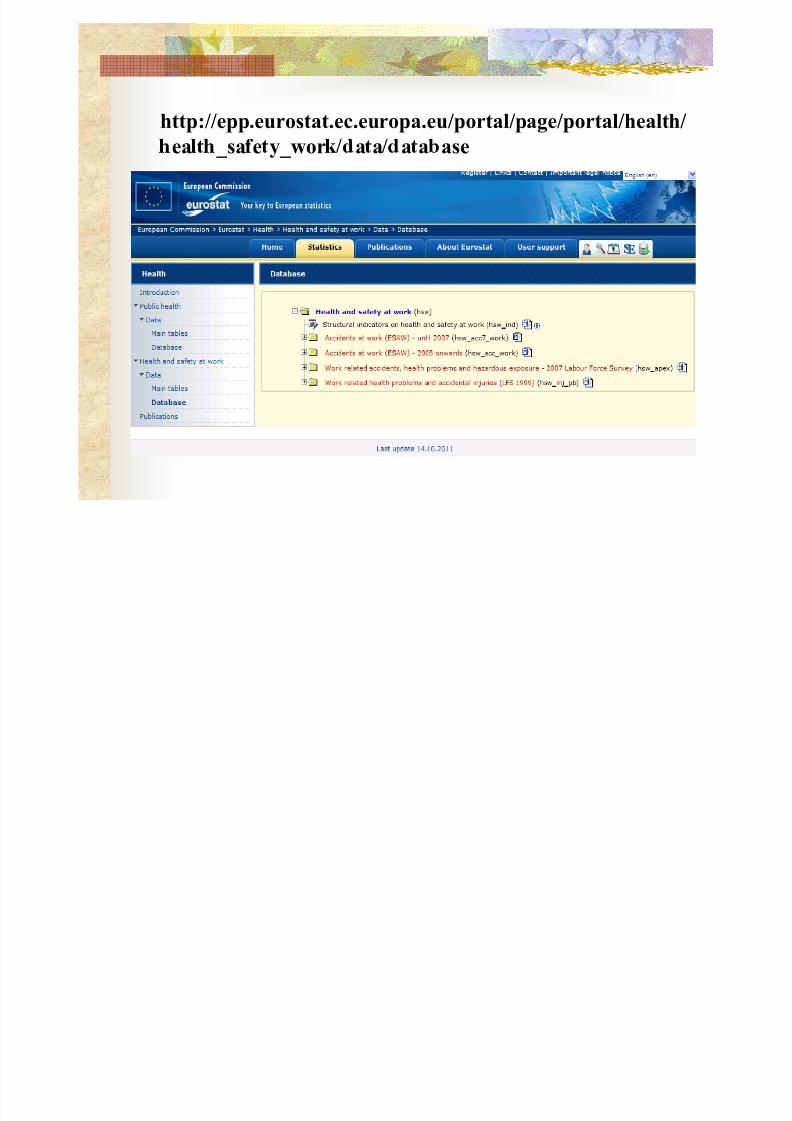
http://epp.eurostat.ec.europa.eu/portal/page/portal/health/
ea _sa e y_wor a a a a ase
8/3/2019 11-12 CURS INTRODUCERE 061020111908
http://slidepdf.com/reader/full/11-12-curs-introducere-061020111908 43/80
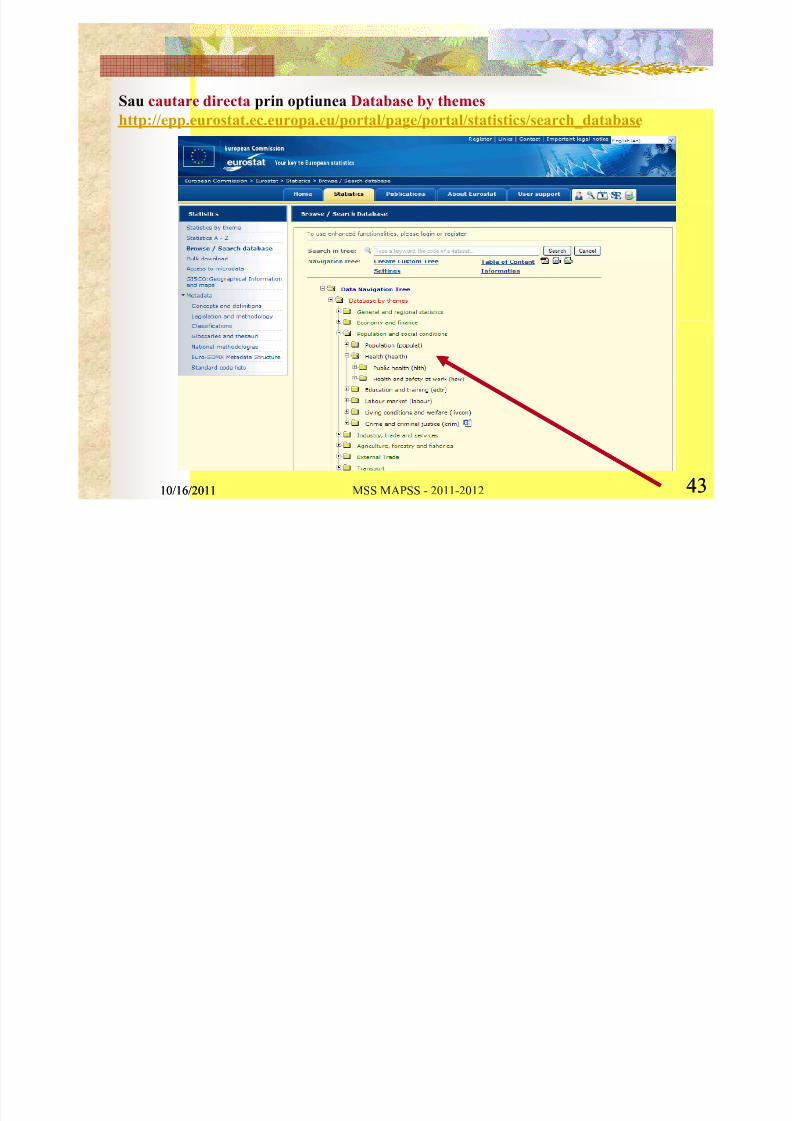
Sau cautare directa prin optiunea Database by themeshttp://epp.eurostat.ec.europa.eu/portal/page/portal/statistics/search_database
10/16/2011 MSS MAPSS - 2011-2012 4310/16/2011 43

8/3/2019 11-12 CURS INTRODUCERE 061020111908
http://slidepdf.com/reader/full/11-12-curs-introducere-061020111908 44/80
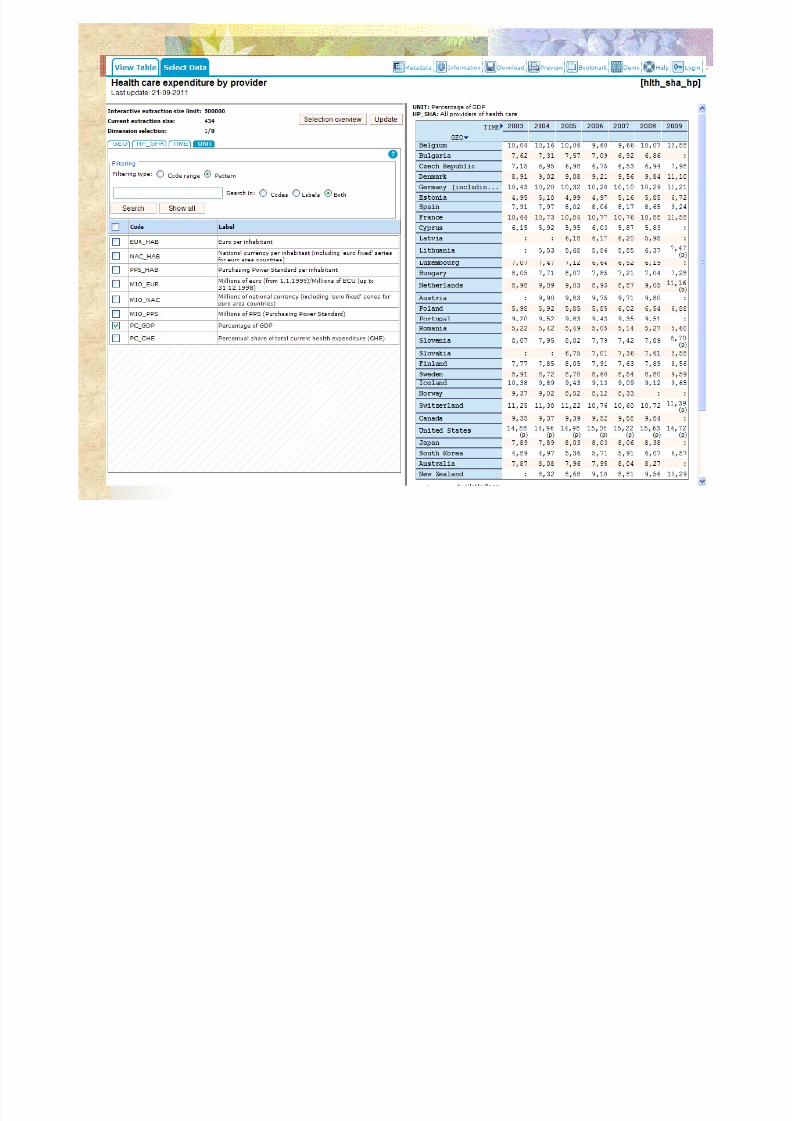
Exemplificare cautare de informatii - Database by themes …Publichealth (hlth) …Health care expenditure by provider (hlth_sha_hp)
8/3/2019 11-12 CURS INTRODUCERE 061020111908
http://slidepdf.com/reader/full/11-12-curs-introducere-061020111908 45/80
8/3/2019 11-12 CURS INTRODUCERE 061020111908
http://slidepdf.com/reader/full/11-12-curs-introducere-061020111908 46/80
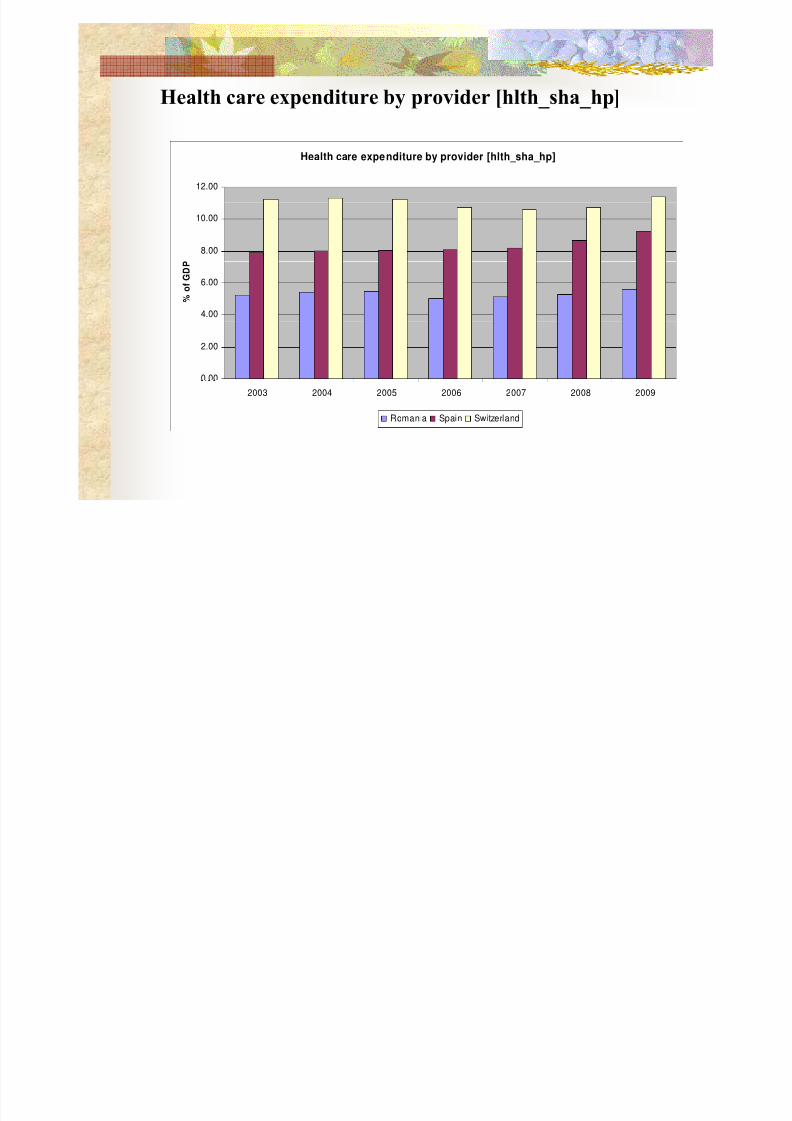
Health care expenditure by provider [hlth_sha_hp]
Health care expenditure by provider [hlth_sha_hp]
12.00
8.00
10.00
4.00
6.00 % o
f G D P
0.00
2.00
2003 2004 2005 2006 2007 2008 2009
Romania Spain Switzerland
8/3/2019 11-12 CURS INTRODUCERE 061020111908
http://slidepdf.com/reader/full/11-12-curs-introducere-061020111908 47/80
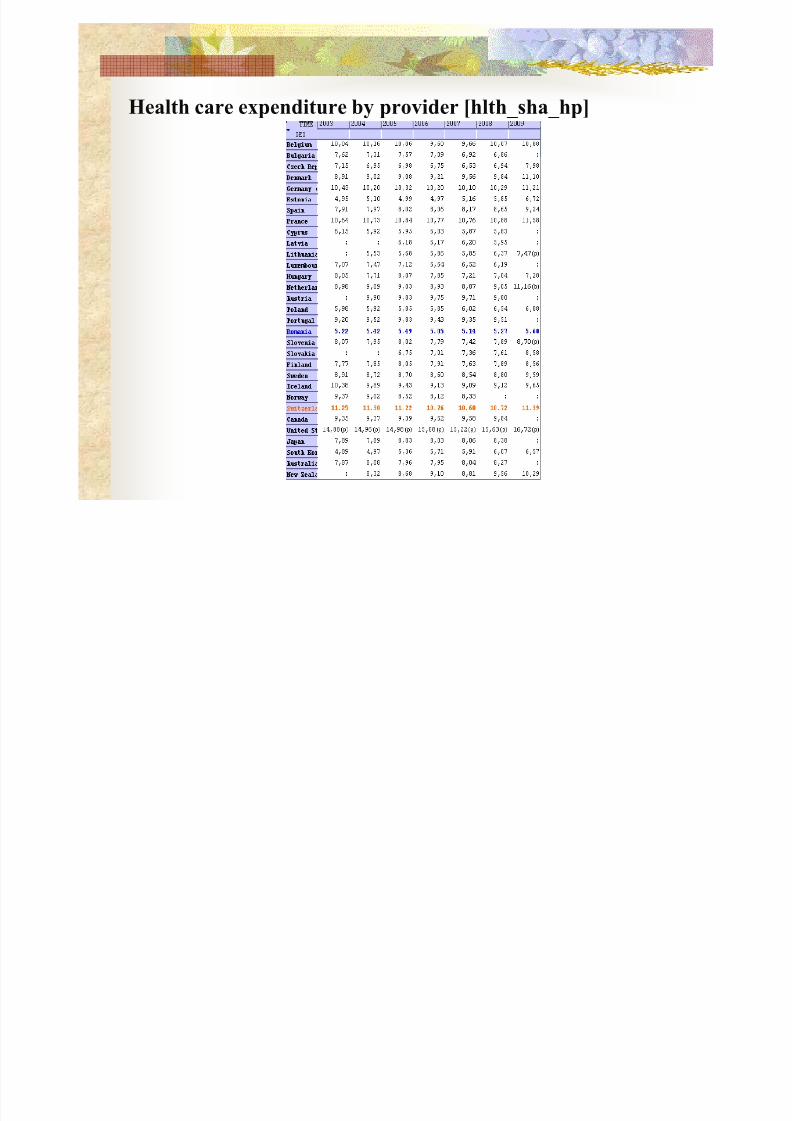
Health care expenditure by provider [hlth_sha_hp]
8/3/2019 11-12 CURS INTRODUCERE 061020111908
http://slidepdf.com/reader/full/11-12-curs-introducere-061020111908 48/80
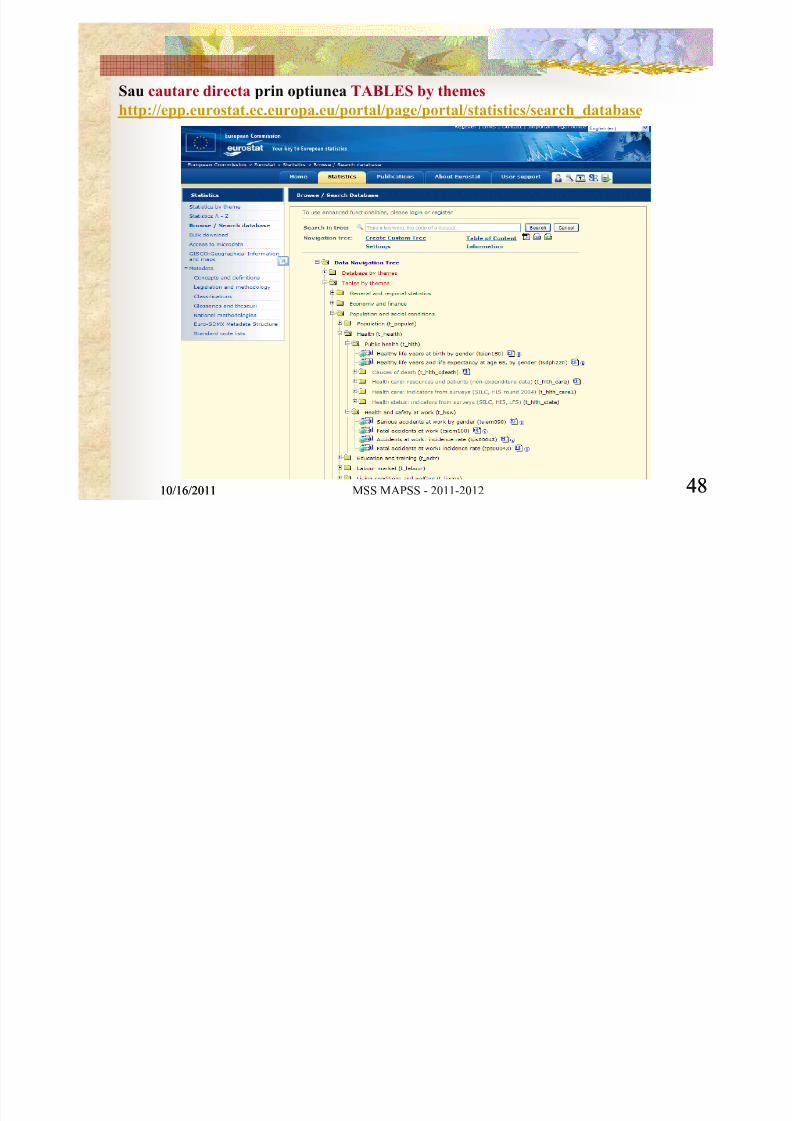
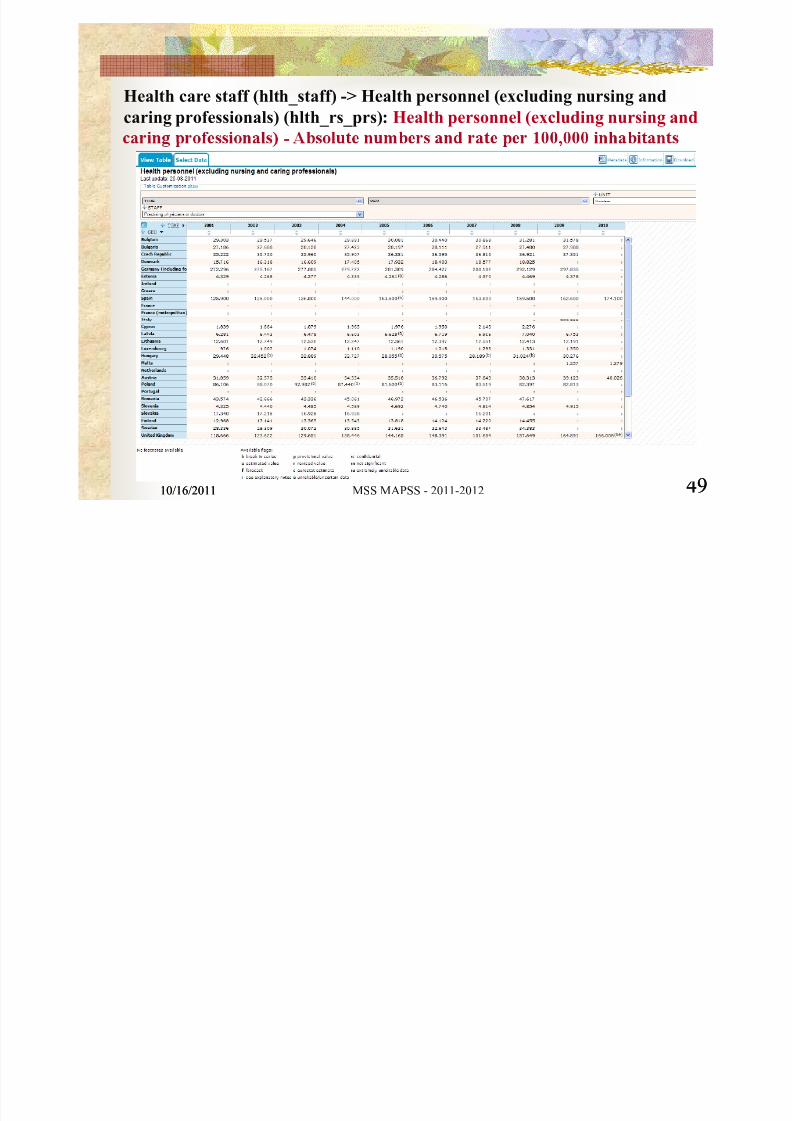
Sau cautare directa prin optiunea TABLES by themes
http://epp.eurostat.ec.europa.eu/portal/page/portal/statistics/search_database
10/16/2011 MSS MAPSS - 2011-2012 4810/16/2011 48
8/3/2019 11-12 CURS INTRODUCERE 061020111908
http://slidepdf.com/reader/full/11-12-curs-introducere-061020111908 49/80
Health care staff (hlth_staff) -> Health personnel (excluding nursing andcaring professionals) (hlth_rs_prs): Health personnel (excluding nursing and
-
10/16/2011 MSS MAPSS - 2011-2012 4910/16/2011 49
8/3/2019 11-12 CURS INTRODUCERE 061020111908
http://slidepdf.com/reader/full/11-12-curs-introducere-061020111908 50/80
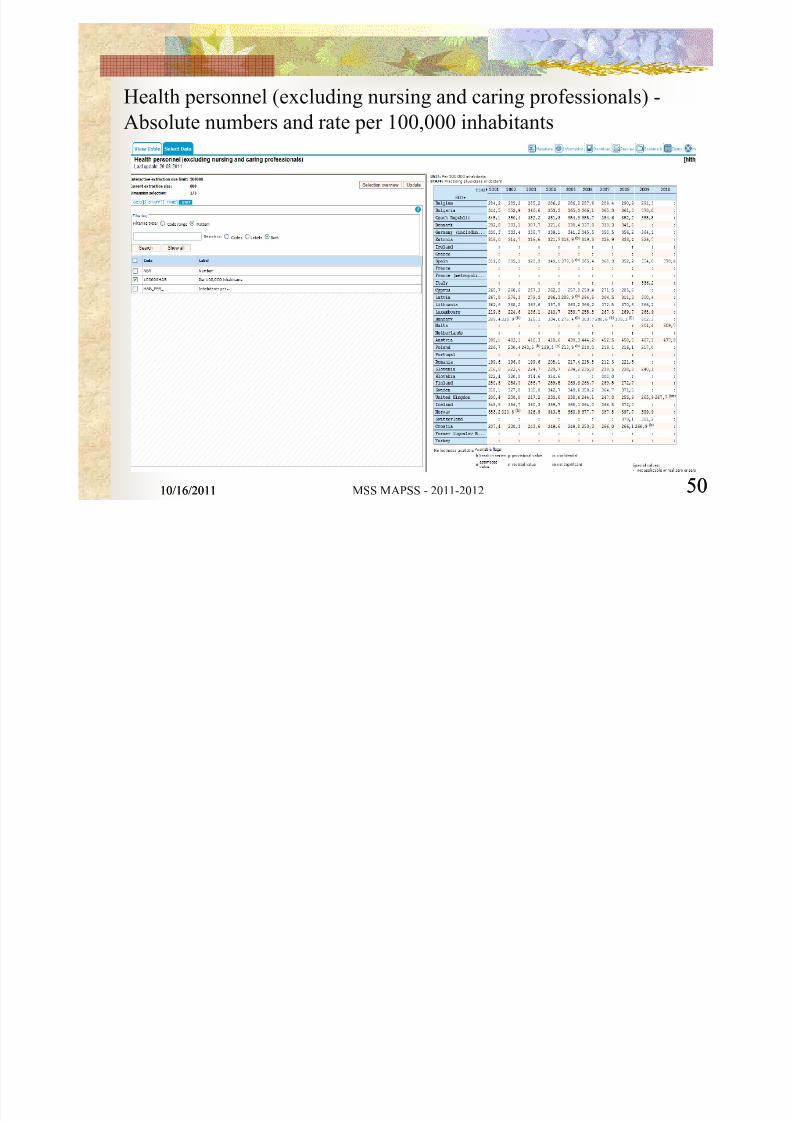
Health personnel (excluding nursing and caring professionals) -Absolute numbers and rate per 100,000 inhabitants
10/16/2011 MSS MAPSS - 2011-2012 5010/16/2011 50

8/3/2019 11-12 CURS INTRODUCERE 061020111908
http://slidepdf.com/reader/full/11-12-curs-introducere-061020111908 51/80
Health personnel (excluding nursing and caring professionals) -
so u e num ers an ra e per , n a an s

8/3/2019 11-12 CURS INTRODUCERE 061020111908
http://slidepdf.com/reader/full/11-12-curs-introducere-061020111908 52/80
Health personnel (exclud ing n ursin g and caring pro fessionals) [hlth_rs_prs]
400.0
290.9 293.5 287.3
308.5
331.8
311.0 305.1
328.3 340.1
.365.4 368.3
352.2 354.8
.
300.0
350.0
n t s
188.2 192.8 199.6 196.0 199.6 208.1
217.4 215.8 212.3 221.5
249.3
y = 3.5752x + 185.47 2
150.0
200.0
250.0
r 1 0 0 , 0
0 0
i n h a b i t
.
50.0
100.0
P e
0.0
1995 1996 1997 1998 1999 2000 2001 2002 2003 2004 2005 2006 2007 2008 2009 2010
Romania Spain Linear (Romania)
8/3/2019 11-12 CURS INTRODUCERE 061020111908
http://slidepdf.com/reader/full/11-12-curs-introducere-061020111908 53/80
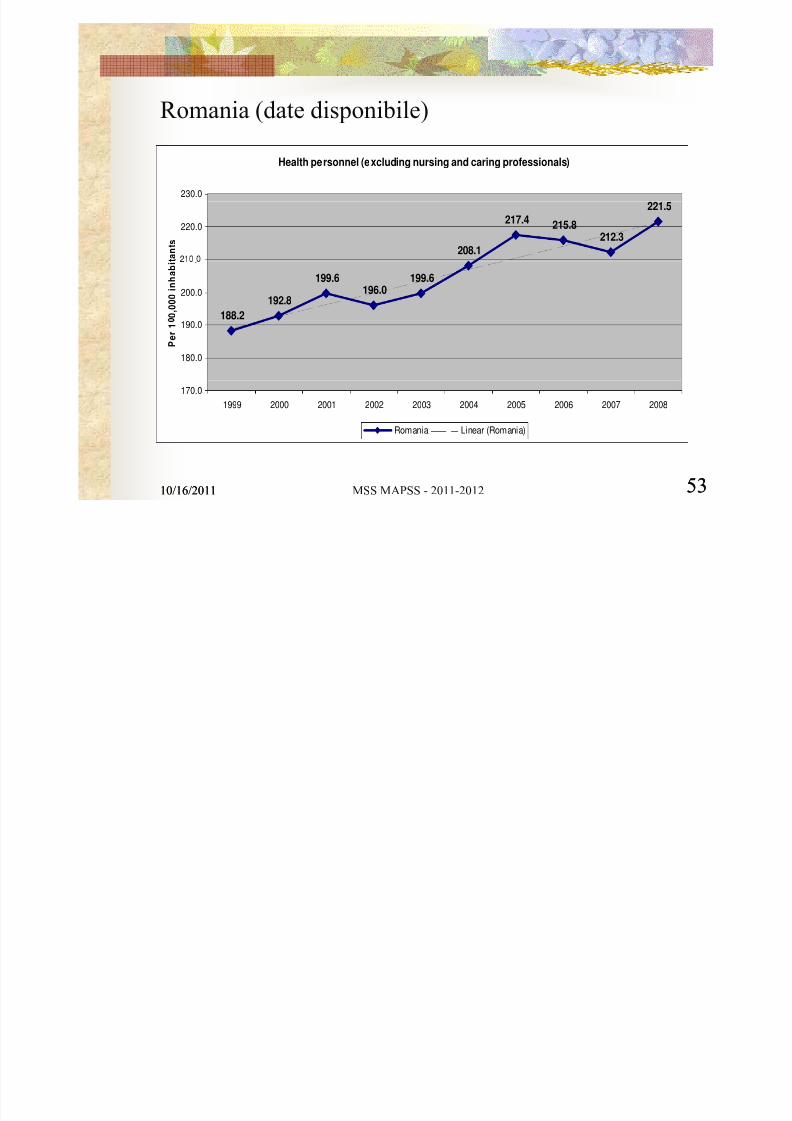
Romania (date disponibile)
Health personnel (excluding nursing and caring professionals)
230.0
208.1
217.4 215.8212.3
221.5
220.0
t a n t s
188.2
192.8
199.6
196.0
199.6
200.0
.
0 ,
0 0 0 i n h a b i
180.0
190.0
P e r 1
170.0
1999 2000 2001 2002 2003 2004 2005 2006 2007 2008
Romania Linear (Romania)
10/16/2011 MSS MAPSS - 2011-2012 5310/16/2011 53
8/3/2019 11-12 CURS INTRODUCERE 061020111908
http://slidepdf.com/reader/full/11-12-curs-introducere-061020111908 54/80
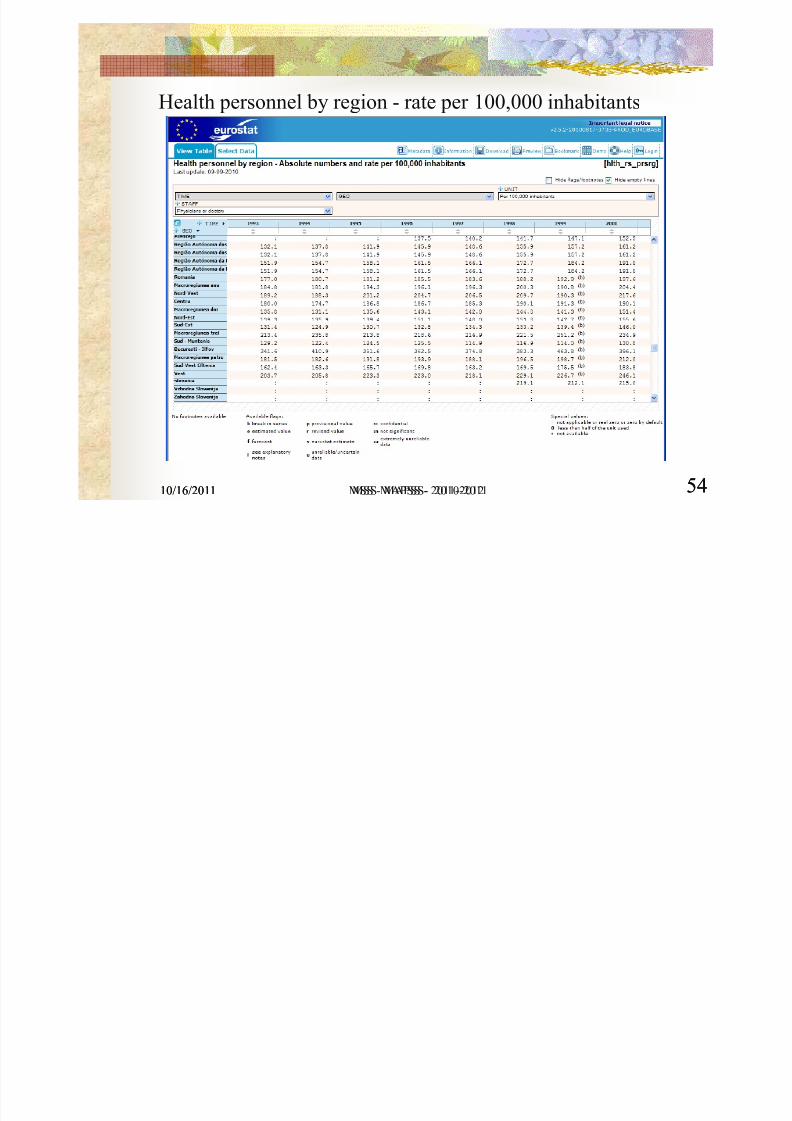
Health personnel by region - rate per 100,000 inhabitants
10/16/2011 MSS MAPSS - 2011-2012 5410/16/2011 MSS - MAPSS- 2010-2011 54

8/3/2019 11-12 CURS INTRODUCERE 061020111908
http://slidepdf.com/reader/full/11-12-curs-introducere-061020111908 55/80
European Community health
Health indicators are sets of data (tables, graphs, maps) on health status, determinants
and care in EU member countries. They allow for monitoring and comparison, and serveas a as s or po cyma ng.
Types of health indicator
Out of a complete list of 88 health indicators, there are over 40 core European Communityhealth indicators for which data is readily available and reasonably comparable. They aregroupe un er t e o ow ng ea ngs. W ere appropr ate, gures are g ven y gen er anage as well as by socio-economic status and regional level.
Heading and Examples
Demographic and socio-economic situation -- Population, birth rate, total unemployment
Health status -- Infant mortality, HIV/AIDS, road traffic injuries
Health determinants -- Regular smokers, consumption/availability of fruit
-- , ,expenditure
Health interventions: health promotion -- Policies on healthy nutrition

8/3/2019 11-12 CURS INTRODUCERE 061020111908
http://slidepdf.com/reader/full/11-12-curs-introducere-061020111908 56/80

8/3/2019 11-12 CURS INTRODUCERE 061020111908
http://slidepdf.com/reader/full/11-12-curs-introducere-061020111908 57/80
ECHI (European Community Health Indicators)Demographic and socio-economic factors
Population by gender/age - Data are provided by Eurostat and the US Bureau of the Census and arecalculated as the number of inhabitants of a given area on 1 January of the year in question (or, insome cases, on 31 December of the previous year). The population is based on data from the most
,based on population registers.
Age dependency ratio - Data are provided by Eurostat and defined as the ratio of the populationdefined as dependent (the population age 0-14 and 65 and over) divided by the population 15-64,
.The indicator 'Old-age-dependency ratio' is the ratio between the total number of elderly persons of
an age when they are generally economically inactive (aged 65 and over) and the number of personsof working age (from 15 to 64).
- population in that year. The value is expressed per 1000 inhabitants. Data are provided by Eurostat.When available, click on to show a graph of the indicator.
Mother's age distribution (teenage pregnancies, aged mothers) - Data are provided by Eurostat. Lifer s e comp e e expu s on or ex rac on rom s mo er o a pro uc o concep on, rrespec ve
of the duration of the pregnancy, which, after such separation, breathes or shows any other evidenceof life, such as beating of the heart, pulsation of the umbilical cord, or definite movement of voluntary muscles, whether or not the umbilical cord has been cut or the placenta is attached; eachproduct of such a birth is considered live born. The age of the mother is defined as the age reached in
10/16/2011 MSS MAPSS - 2011-2012 5710/16/2011 MSS - MAPSS- 2010-2011 57
e year e even oo p ace.

8/3/2019 11-12 CURS INTRODUCERE 061020111908
http://slidepdf.com/reader/full/11-12-curs-introducere-061020111908 58/80
Exemplu: ECHI (European Community Health Indicators)
Fertility rate Data are provided by Eurostat as the mean number of children that would be bornalive to a woman during her lifetime if she were to pass through her childbearing years conforming tothe fertility rates by age of a given year. It is therefore the completed fertility of a hypothetical
generation, computed by adding the fertility rates by age for women in a given year (the number of .replacement level fertility; in more developed countries, a rate of 2.1 is considered to be replacementlevel.Population projections - Data are provided by Eurostat. Population is divided into age groupscovering intervals of 1 year and a group of all ages. Forecasts beginning with 1995 2005 and then
. ,migration.
Total unemployment Data are provided by Eurostat as the unemployed persons comprise personsaged 15 to 74 who were: without work during the reference week; currently available for work, i.e.
-reference week; actively seeking work, i.e. had taken specific steps in the four weeks period endingwith the reference week to seek paid employment or self-employment or who found a job to startlater, i.e. within a period of at most three months. When available, click on to show a graph of theindicator.
equivalised disposable income below the risk-of-poverty threshold in the current year and in at leasttwo of the preceding three years. The
10/16/2011 MSS MAPSS - 2011-2012 5810/16/2011 58
8/3/2019 11-12 CURS INTRODUCERE 061020111908
http://slidepdf.com/reader/full/11-12-curs-introducere-061020111908 59/80
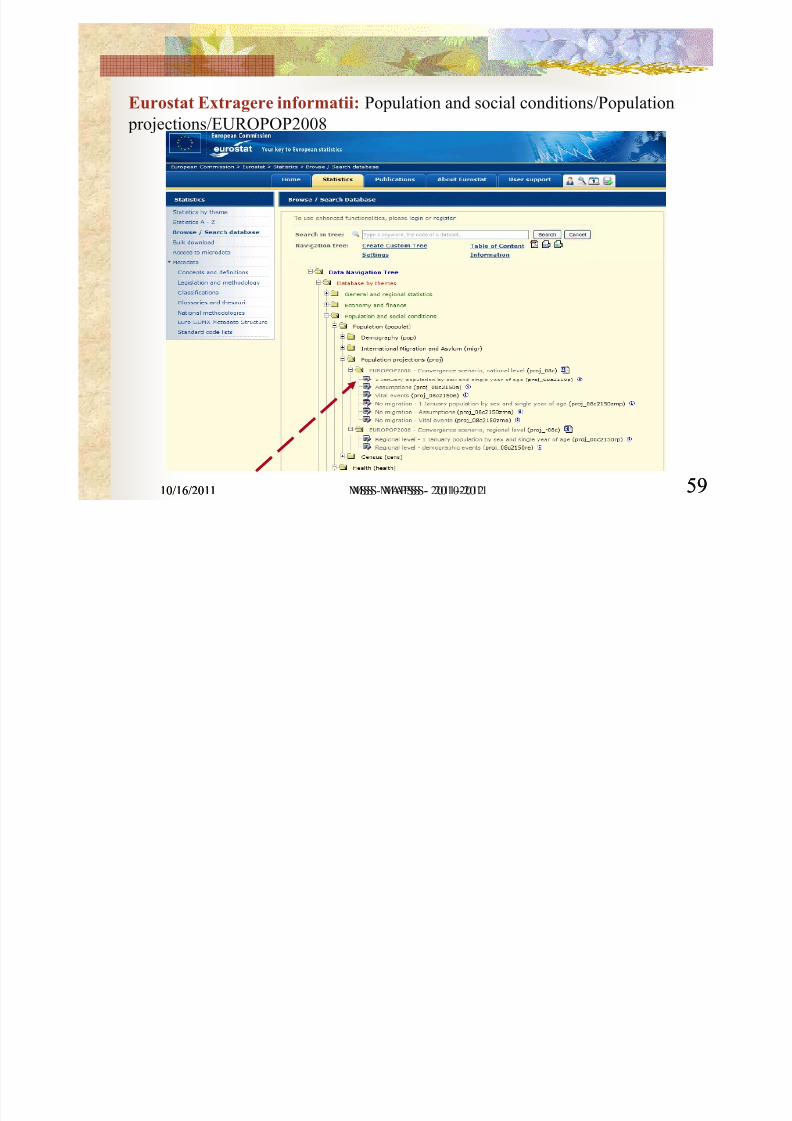
Eurostat Extragere informatii: Population and social conditions/Population projections/EUROPOP2008
10/16/2011 MSS MAPSS - 2011-2012 5910/16/2011 MSS - MAPSS- 2010-2011 59
8/3/2019 11-12 CURS INTRODUCERE 061020111908
http://slidepdf.com/reader/full/11-12-curs-introducere-061020111908 60/80
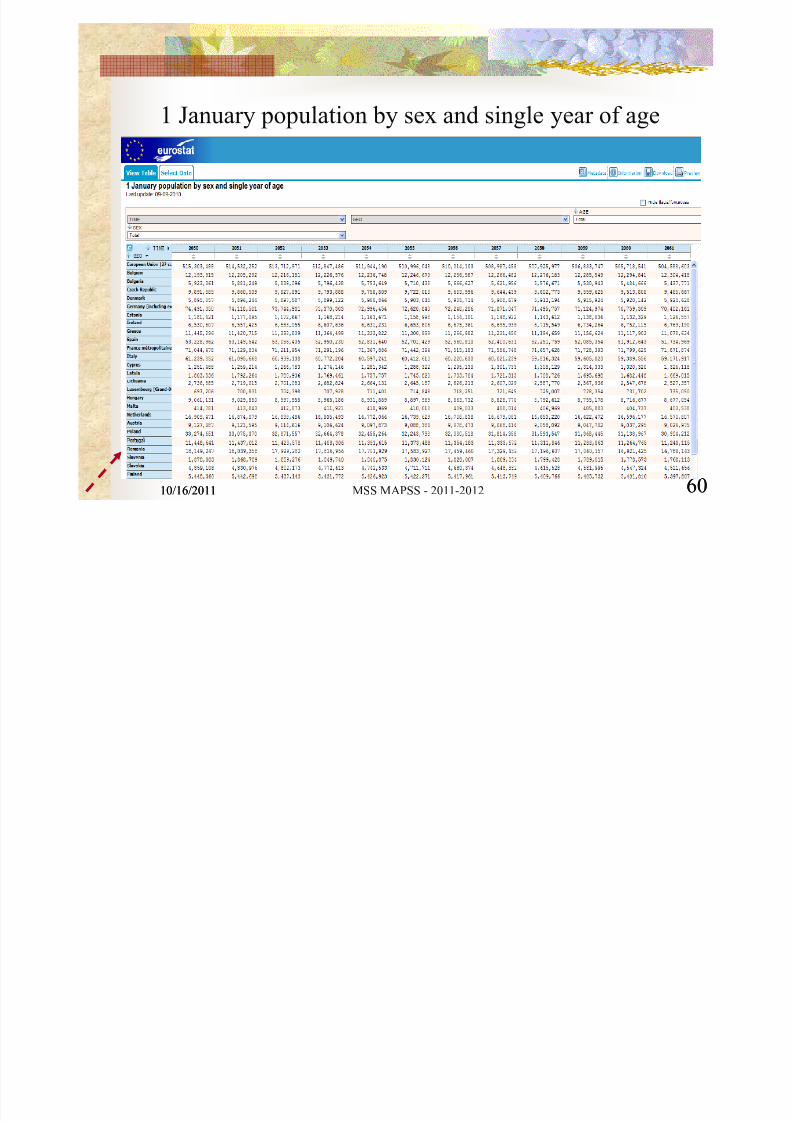
1 January population by sex and single year of age
10/16/2011 MSS MAPSS - 2011-2012 6010/16/2011 60
8/3/2019 11-12 CURS INTRODUCERE 061020111908
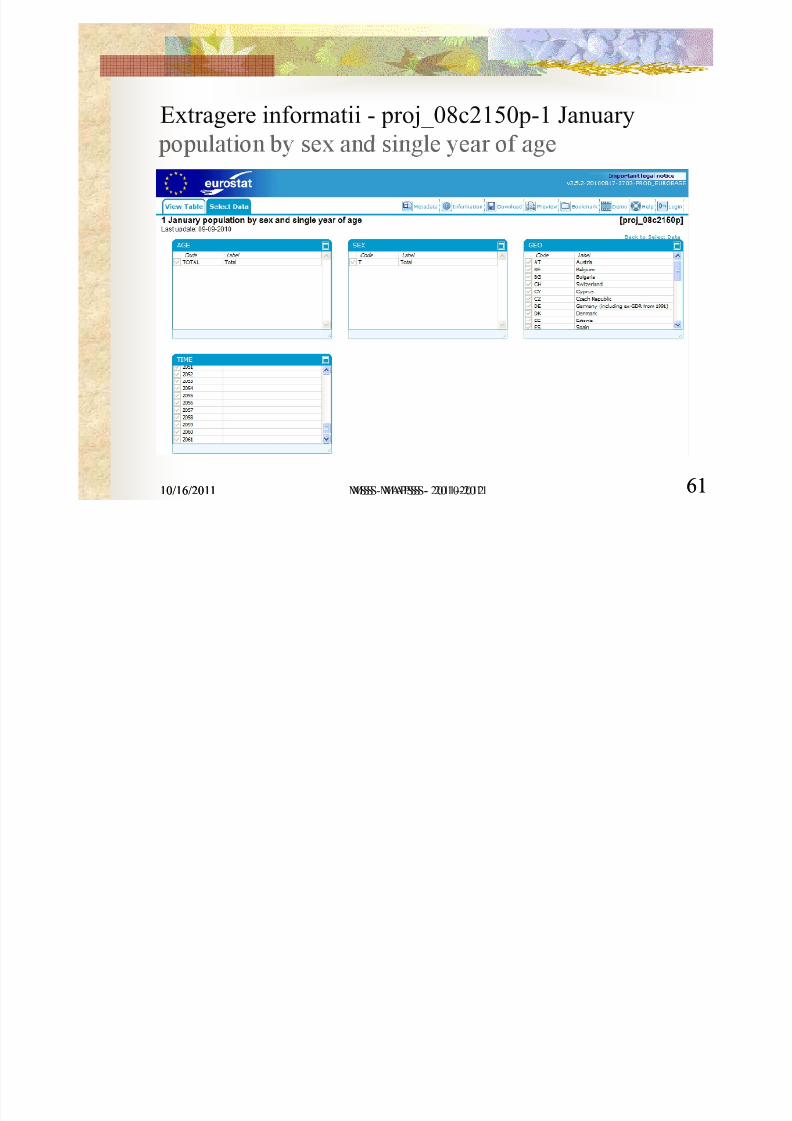
http://slidepdf.com/reader/full/11-12-curs-introducere-061020111908 61/80

8/3/2019 11-12 CURS INTRODUCERE 061020111908
http://slidepdf.com/reader/full/11-12-curs-introducere-061020111908 62/80
10/16/2011 MSS MAPSS - 2011-2012 6210/16/2011 MSS - MAPSS- 2010-2011 62
8/3/2019 11-12 CURS INTRODUCERE 061020111908
http://slidepdf.com/reader/full/11-12-curs-introducere-061020111908 63/80
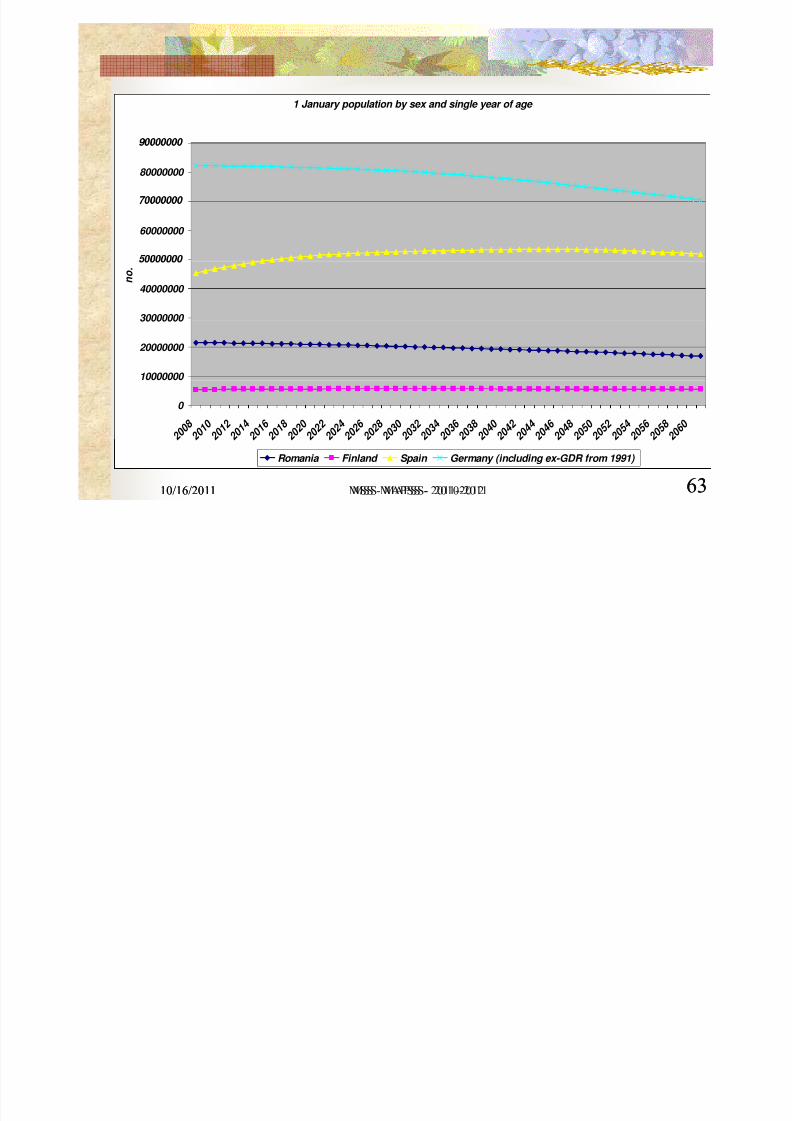
1 January population by sex and single year of age
80000000
60000000
30000000
40000000
n o .
10000000
20000000
0
2 0 0 8
2 0 1 0
2 0 1 2
2 0 1 4
2 0 1 6
2 0 1 8
2 0 2 0
2 0 2 2
2 0 2 4
2 0 2 6
2 0 2 8
2 0 3 0
2 0 3 2
2 0 3 4
2 0 3 6
2 0 3 8
2 0 4 0
2 0 4 2
2 0 4 4
2 0 4 6
2 0 4 8
2 0 5 0
2 0 5 2
2 0 5 4
2 0 5 6
2 0 5 8
2 0 6 0
10/16/2011 MSS MAPSS - 2011-2012 6310/16/2011 MSS - MAPSS- 2010-2011 63
year Romania Finland Spain Germany (including ex-GDR from 1991)

8/3/2019 11-12 CURS INTRODUCERE 061020111908
http://slidepdf.com/reader/full/11-12-curs-introducere-061020111908 64/80
Rata de dependenţă (contributori/pensionari)
sursa: RAPORT ANUAL DE PREVENIREA CRIZELOR , 2003
10/16/2011 MSS MAPSS - 2011-2012 64
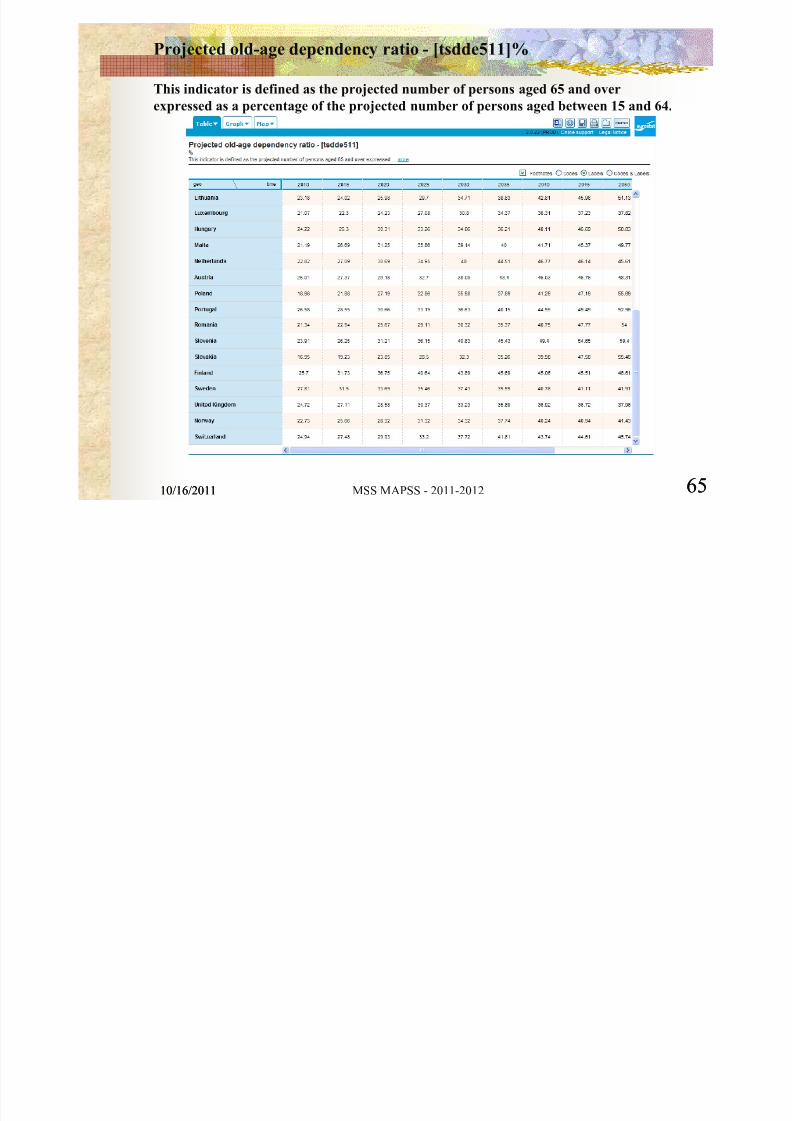
Projected old-age dependency ratio - [tsdde511]%
8/3/2019 11-12 CURS INTRODUCERE 061020111908
http://slidepdf.com/reader/full/11-12-curs-introducere-061020111908 65/80
This indicator is defined as the projected number of persons aged 65 and over
expressed as a percentage of the projected number of persons aged between 15 and 64.
10/16/2011 MSS MAPSS - 2011-2012 6510/16/2011 65

8/3/2019 11-12 CURS INTRODUCERE 061020111908
http://slidepdf.com/reader/full/11-12-curs-introducere-061020111908 66/80
Projected old-age dependency ratio - [tsdde511]%
10/16/2011 MSS MAPSS - 2011-2012 6610/16/2011 MSS - MAPSS- 2010-2011 66
8/3/2019 11-12 CURS INTRODUCERE 061020111908
http://slidepdf.com/reader/full/11-12-curs-introducere-061020111908 67/80
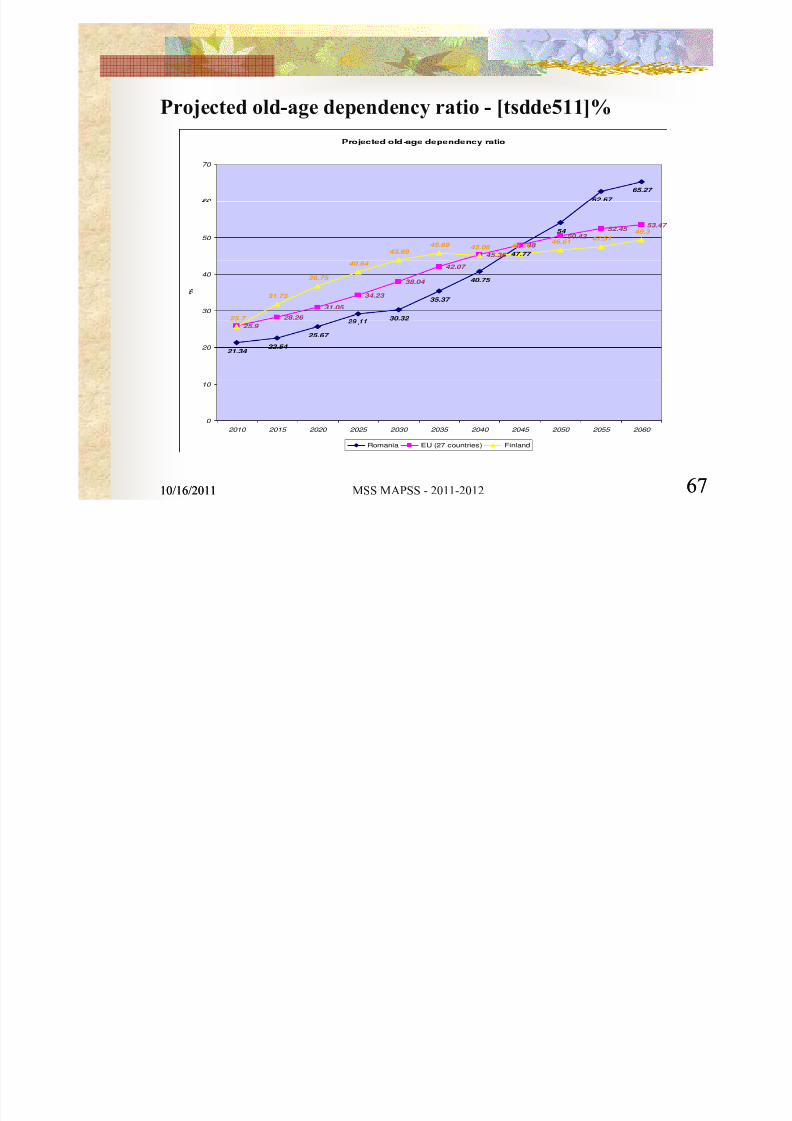
Projected old-age dependency ratio - [tsdde511]%-
62.67
65.27
60
70
47.77
54
45.36
48
50.42
52.45 53.47
43.89
45.69 45.06 45.51
46.6147.51
49.3
50
30.32
35.37
40.75
28.26
31.05
34.23
38.04
42.07
25.7
31.73
36.75
40.64
30
40
21.34 22.54
25.67
.25.9
20
0
10
2010 2015 2020 2025 2030 2035 2040 2045 2050 2055 2060
10/16/2011 MSS MAPSS - 2011-2012 6710/16/2011 67
Romania EU (27 countries) Finland
P l ti d i l
8/3/2019 11-12 CURS INTRODUCERE 061020111908
http://slidepdf.com/reader/full/11-12-curs-introducere-061020111908 68/80
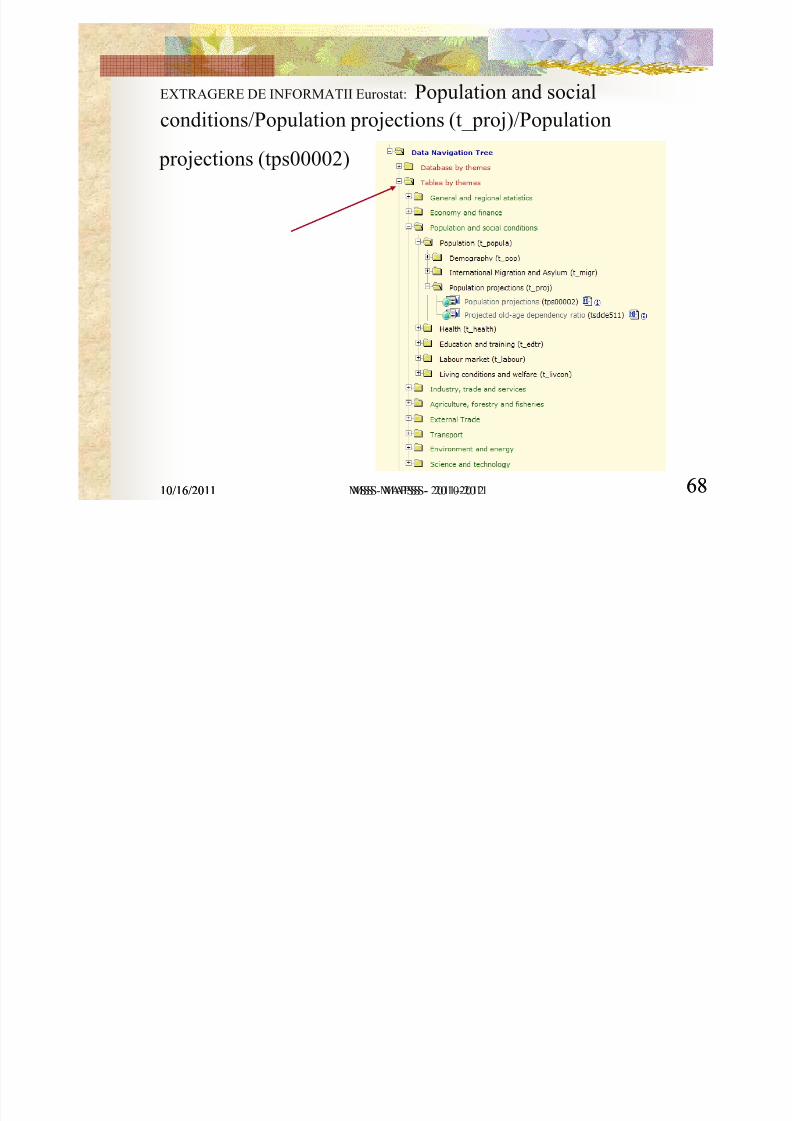
EXTRAGERE DE INFORMATII Eurostat: Population and social
conditions/Population projections (t_proj)/Population
projections (tps00002)
10/16/2011 MSS MAPSS - 2011-2012 6810/16/2011 MSS - MAPSS- 2010-2011 68
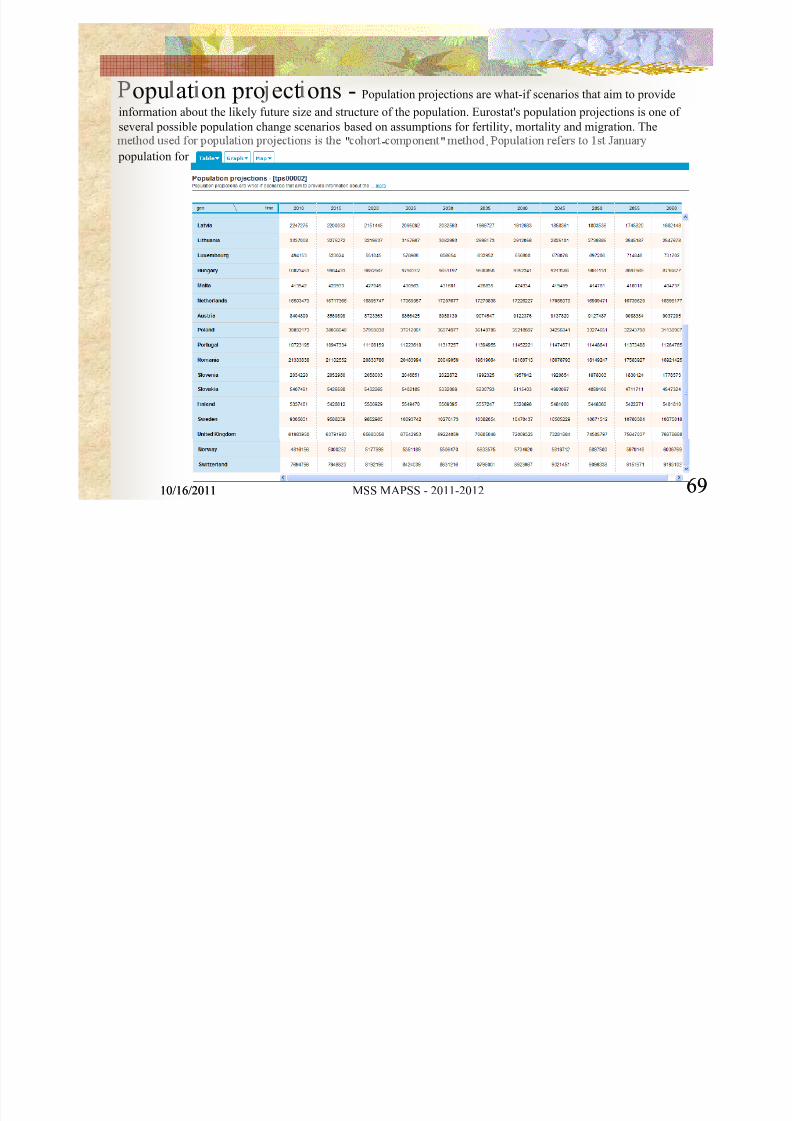
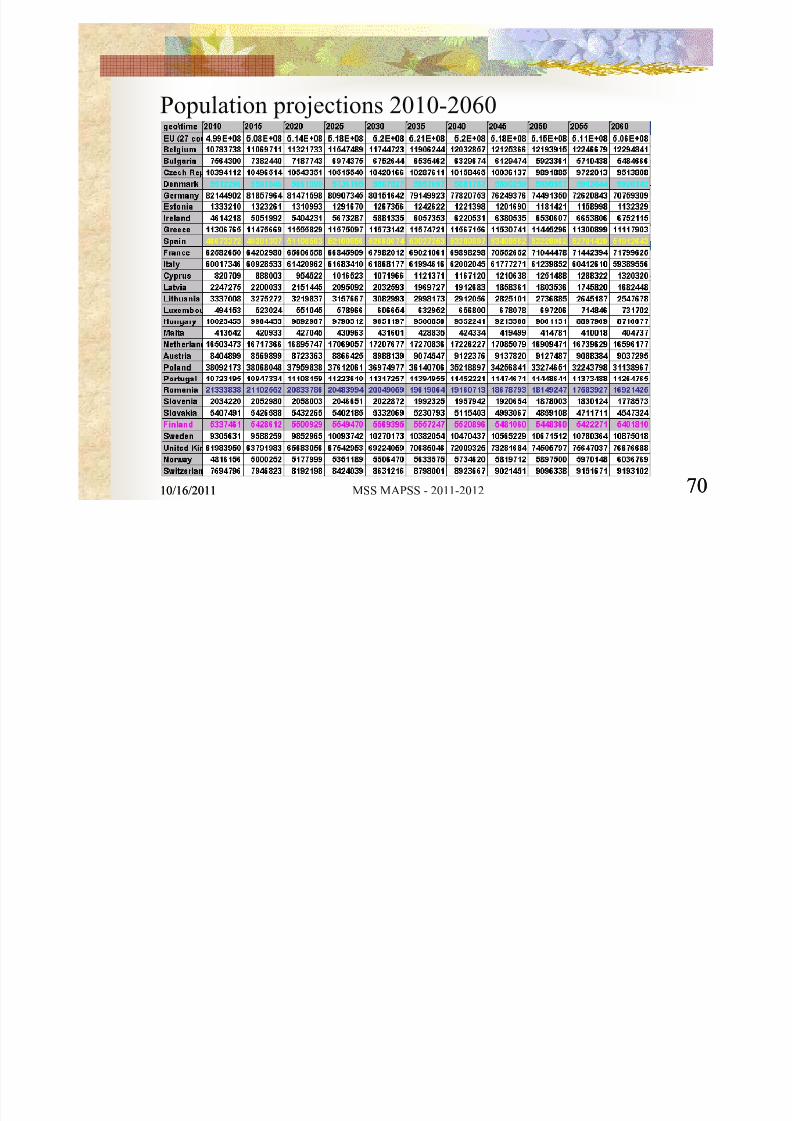
opu at on pro ect ons
8/3/2019 11-12 CURS INTRODUCERE 061020111908
http://slidepdf.com/reader/full/11-12-curs-introducere-061020111908 69/80
opu at on pro ect ons - Population projections are what-if scenarios that aim to provide
information about the likely future size and structure of the population. Eurostat's population projections is one of
several possible population change scenarios based on assumptions for fertility, mortality and migration. The
" - " .
population for the respective years.
10/16/2011 MSS MAPSS - 2011-2012 6910/16/2011 69
8/3/2019 11-12 CURS INTRODUCERE 061020111908
http://slidepdf.com/reader/full/11-12-curs-introducere-061020111908 70/80
Population projections 2010-2060
10/16/2011 MSS MAPSS - 2011-2012 7010/16/2011 70
8/3/2019 11-12 CURS INTRODUCERE 061020111908
http://slidepdf.com/reader/full/11-12-curs-introducere-061020111908 71/80
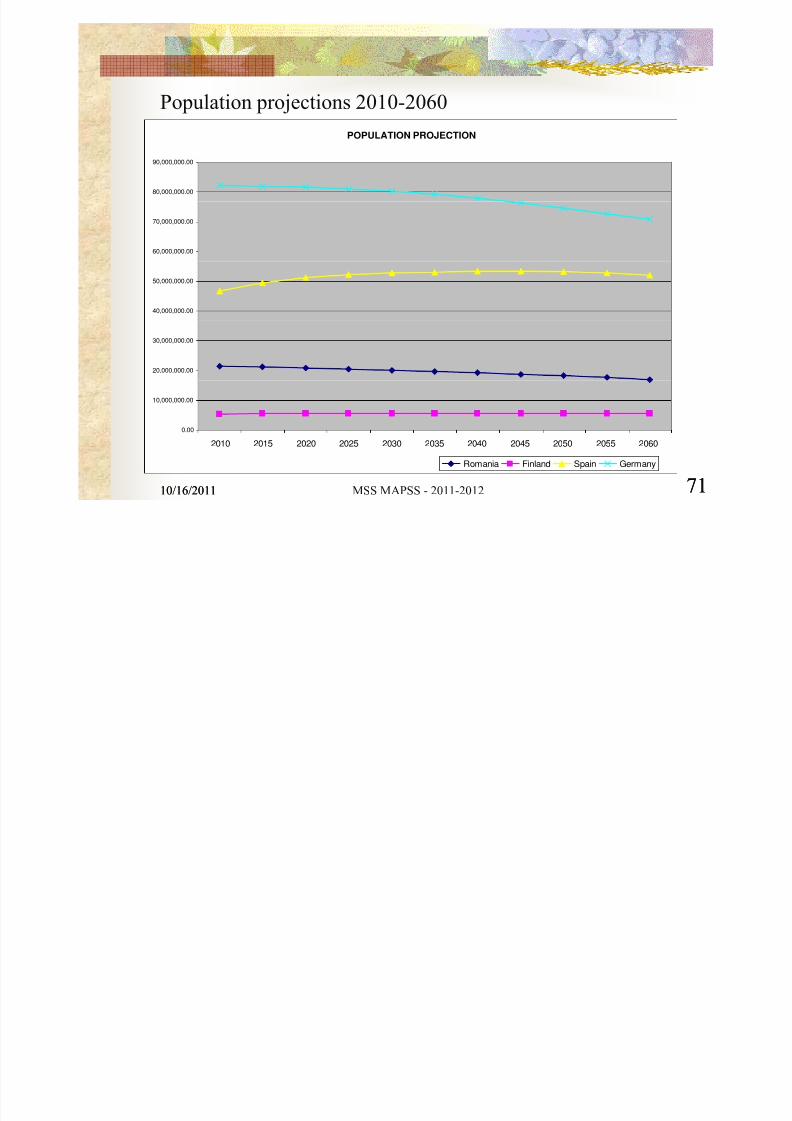
Population projections 2010-2060POPULATION PROJECTION
80,000,000.00
90,000,000.00
60,000,000.00
70,000,000.00
40,000,000.00
50,000,000.00
20,000,000.00
30,000,000.00
0.00
10,000,000.00
10/16/2011 MSS MAPSS - 2011-2012 7110/16/2011 71
2010 2015 2020 2025 2030 2035 2040 2045 2050 2055 2060
Romania Finland Spain Germany
8/3/2019 11-12 CURS INTRODUCERE 061020111908
http://slidepdf.com/reader/full/11-12-curs-introducere-061020111908 72/80
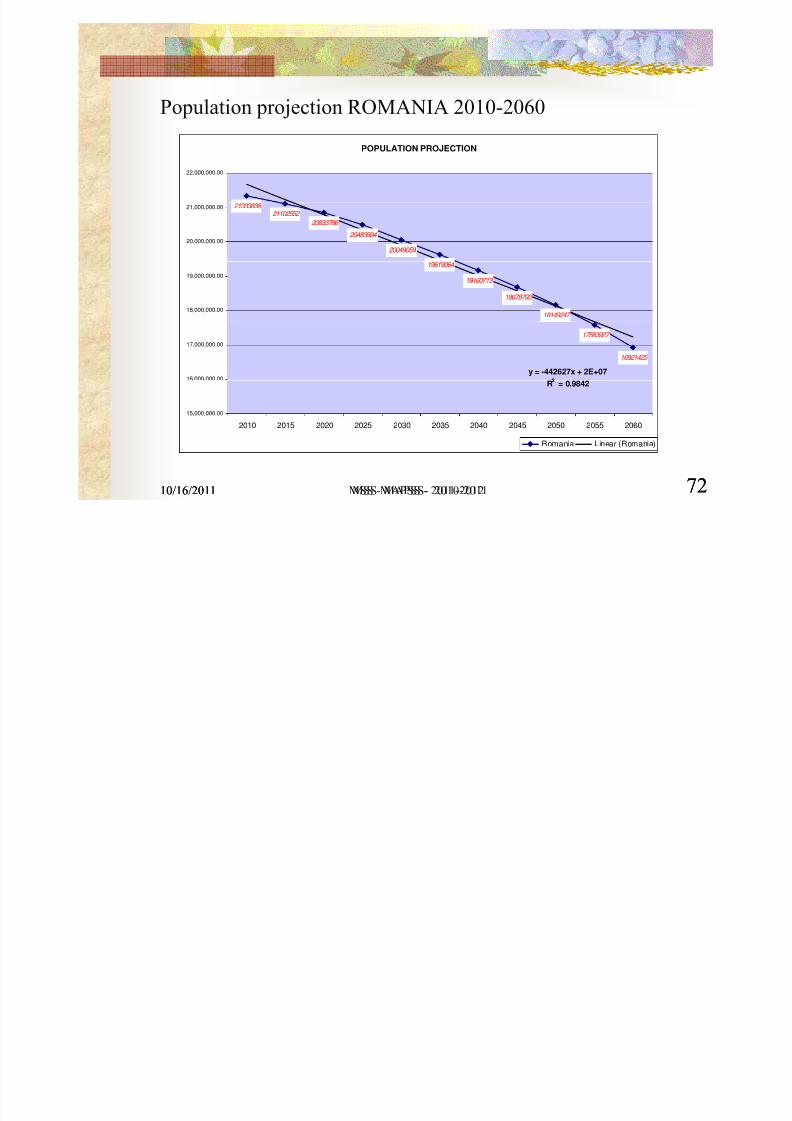
Population projection ROMANIA 2010-2060
POPULATION PROJECTION
22,000,000.00
21102552
20483994
20049059
20833786
21333838
20,000,000.00
21,000,000.00
19619064
19160713
18678793
18149247 18,000,000.00
19,000,000.00
17583927
16921425
y = -442627x + 2E+0716,000,000.00
17,000,000.00
R = 0.9842
15,000,000.00
2010 2015 2020 2025 2030 2035 2040 2045 2050 2055 2060
10/16/2011 MSS MAPSS - 2011-2012 7210/16/2011 MSS - MAPSS- 2010-2011 72
Romania Linear (Romania)
8/3/2019 11-12 CURS INTRODUCERE 061020111908
http://slidepdf.com/reader/full/11-12-curs-introducere-061020111908 73/80
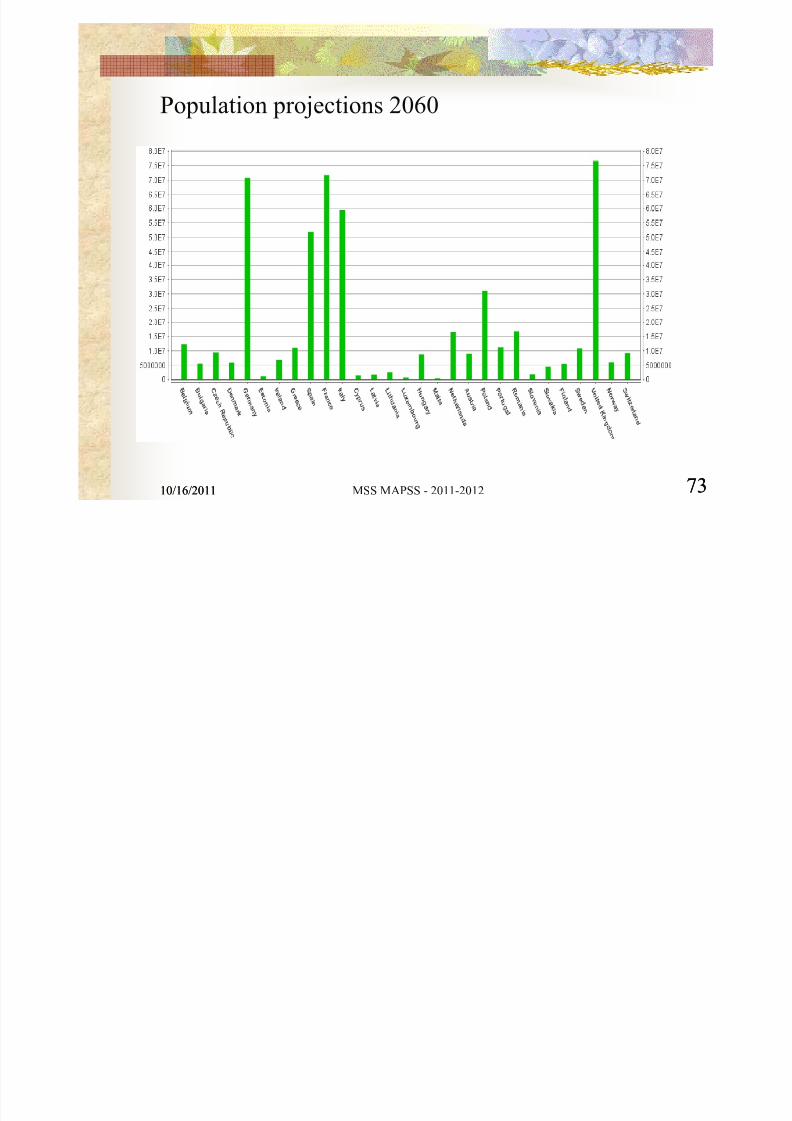
Population projections 2060
10/16/2011 MSS MAPSS - 2011-2012 7310/16/2011 73
8/3/2019 11-12 CURS INTRODUCERE 061020111908
http://slidepdf.com/reader/full/11-12-curs-introducere-061020111908 74/80
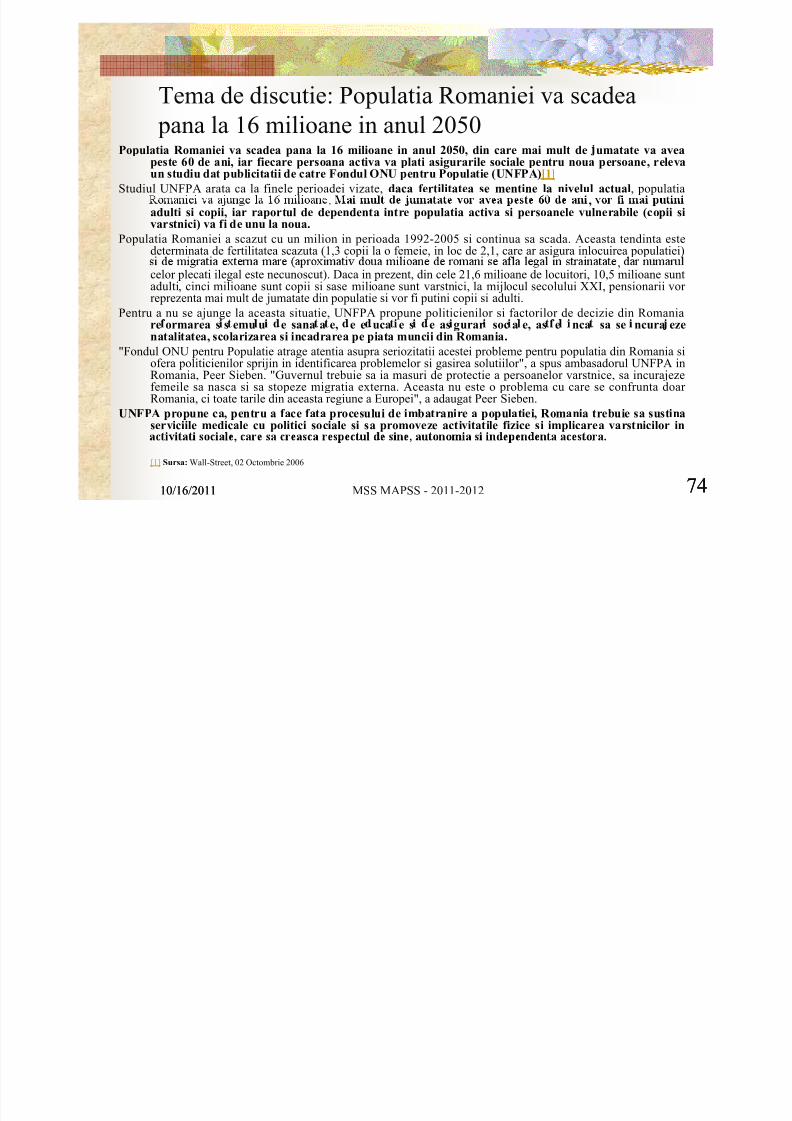
Tema de discutie: Populatia Romaniei va scadea pana la 16 milioane in anul 2050Populatia Romaniei va scadea pana la 16 milioane in anul 2050, din care mai mult de umatate va avea
peste 60 de ani, iar fiecare persoana activa va plati asigurarile sociale pentru noua persoane, relevaun studiu dat publicitatii de catre Fondul ONU pentru Populatie (UNFPA)[1]
Studiul UNFPA arata ca la finele perioadei vizate, daca fertilitatea se mentine la nivelul actual, populatia
. ,adulti si copii, iar raportul de dependenta intre populatia activa si persoanele vulnerabile (copii sivarstnici) va fi de unu la noua.
Populatia Romaniei a scazut cu un milion in perioada 1992-2005 si continua sa scada. Aceasta tendinta estedeterminata de fertilitatea scazuta (1,3 copii la o femeie, in loc de 2,1, care ar asigura inlocuirea populatiei)
,celor plecati ilegal este necunoscut). Daca in prezent, din cele 21,6 milioane de locuitori, 10,5 milioane sunt
adulti, cinci milioane sunt copii si sase milioane sunt varstnici, la mijlocul secolului XXI, pensionarii vor reprezenta mai mult de jumatate din populatie si vor fi putini copii si adulti.
Pentru a nu se ajunge la aceasta situatie, UNFPA propune politicienilor si factorilor de decizie din Romaniare ormarea s s emu u e sana a e, e e uca e s e as gurar soc a e, as e nca sa se ncura ezenatalitatea, scolarizarea si incadrarea pe piata muncii din Romania.
"Fondul ONU pentru Populatie atrage atentia asupra seriozitatii acestei probleme pentru populatia din Romania siofera politicienilor sprijin in identificarea problemelor si gasirea solutiilor", a spus ambasadorul UNFPA inRomania, Peer Sieben. "Guvernul trebuie sa ia masuri de protectie a persoanelor varstnice, sa incurajeze
femeile sa nasca si sa stopeze migratia externa. Aceasta nu este o problema cu care se confrunta doar Romania, ci toate tarile din aceasta regiune a Europei", a adaugat Peer Sieben.
UNFPA propune ca, pentru a face fata procesului de imbatranire a populatiei, Romania trebuie sa sustinaserviciile medicale cu politici sociale si sa promoveze activitatile fizice si implicarea varstnicilor in
10/16/2011 MSS MAPSS - 2011-2012 7410/16/2011 74
[1] Sursa: Wall-Street, 02 Octombrie 2006
8/3/2019 11-12 CURS INTRODUCERE 061020111908
http://slidepdf.com/reader/full/11-12-curs-introducere-061020111908 75/80
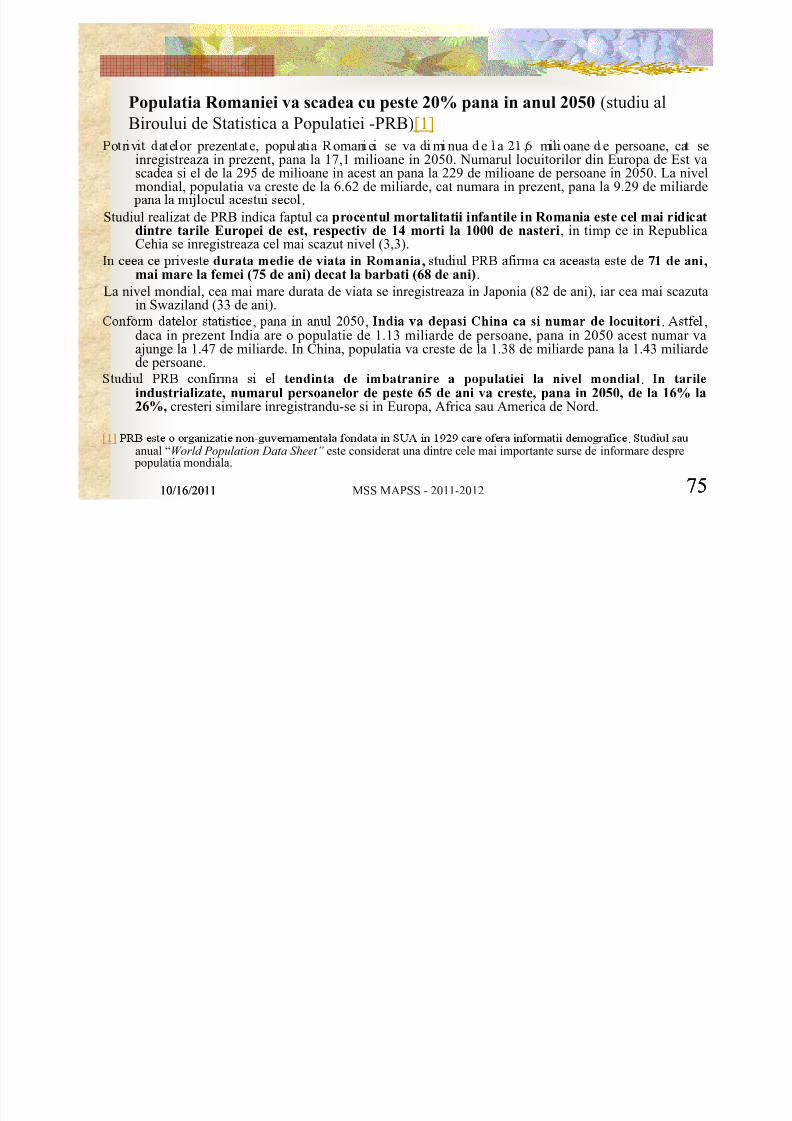
Populatia Romaniei va scadea cu peste 20% pana in anul 2050 (studiu alBiroului de Statistica a Populatiei -PRB)[1]
o r v a e or prezen a e, popu a a oman e se va m nua e a , m oane e persoane, ca seinregistreaza in prezent, pana la 17,1 milioane in 2050. Numarul locuitorilor din Europa de Est vascadea si el de la 295 de milioane in acest an pana la 229 de milioane de persoane in 2050. La nivelmondial, populatia va creste de la 6.62 de miliarde, cat numara in prezent, pana la 9.29 de miliarde
.Studiul realizat de PRB indica faptul ca procentul mortalitatii infantile in Romania este cel mai ridicat
dintre tarile Europei de est, respectiv de 14 morti la 1000 de nasteri, in timp ce in RepublicaCehia se inregistreaza cel mai scazut nivel (3,3).
, ,mai mare la femei (75 de ani) decat la barbati (68 de ani).
La nivel mondial, cea mai mare durata de viata se inregistreaza in Japonia (82 de ani), iar cea mai scazutain Swaziland (33 de ani).
, , . ,daca in prezent India are o populatie de 1.13 miliarde de persoane, pana in 2050 acest numar vaajunge la 1.47 de miliarde. In China, populatia va creste de la 1.38 de miliarde pana la 1.43 miliardede persoane.
.industrializate, numarul persoanelor de peste 65 de ani va creste, pana in 2050, de la 16% la26%, cresteri similare inregistrandu-se si in Europa, Africa sau America de Nord.
-
10/16/2011 MSS MAPSS - 2011-2012 7510/16/2011 75
.anual “World Population Data Sheet” este considerat una dintre cele mai importante surse de informare despre
populatia mondiala.
Tema de discutie - Previziune pe termen lung - Romania's
8/3/2019 11-12 CURS INTRODUCERE 061020111908
http://slidepdf.com/reader/full/11-12-curs-introducere-061020111908 76/80
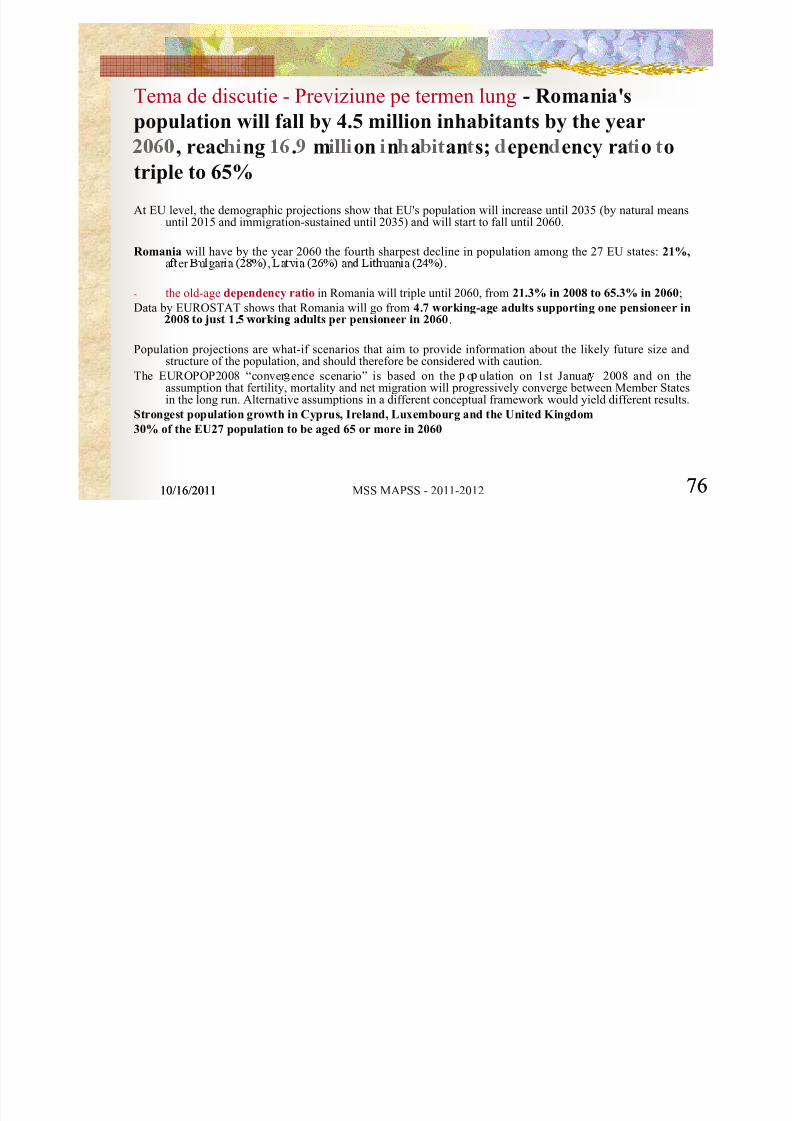
Tema de discutie - Previziune pe termen lung - Romania s
population will fall by 4.5 million inhabitants by the year
, reac ng . m on n a an s; epen ency ra o o
triple to 65%
At EU level, the demographic projections show that EU's population will increase until 2035 (by natural meansuntil 2015 and immigration-sustained until 2035) and will start to fall until 2060.
Romania will have by the year 2060 the fourth sharpest decline in population among the 27 EU states: 21%,a er u gar a , a v a an uan a .
- the old-age dependency ratio in Romania will triple until 2060, from 21.3% in 2008 to 65.3% in 2060;Data by EUROSTAT shows that Romania will go from 4.7 working-age adults supporting one pensioneer in
. .
Population projections are what-if scenarios that aim to provide information about the likely future size andstructure of the population, and should therefore be considered with caution.
The EUROPOP2008 “conver ence scenario” is based on the o ulation on 1st Januar 2008 and on theassumption that fertility, mortality and net migration will progressively converge between Member Statesin the long run. Alternative assumptions in a different conceptual framework would yield different results.
Strongest population growth in Cyprus, Ireland, Luxembourg and the United Kingdom
30% of the EU27 population to be aged 65 or more in 2060
10/16/2011 MSS MAPSS - 2011-2012 7610/16/2011 76
Romania's population to fall by 4.5 mln. until 2060 STAT/08/119, 26 August 2008
“Population projections 2008 2060; From 2015 deaths projected to outnumber births in the EU27; Almost three times as

8/3/2019 11-12 CURS INTRODUCERE 061020111908
http://slidepdf.com/reader/full/11-12-curs-introducere-061020111908 77/80
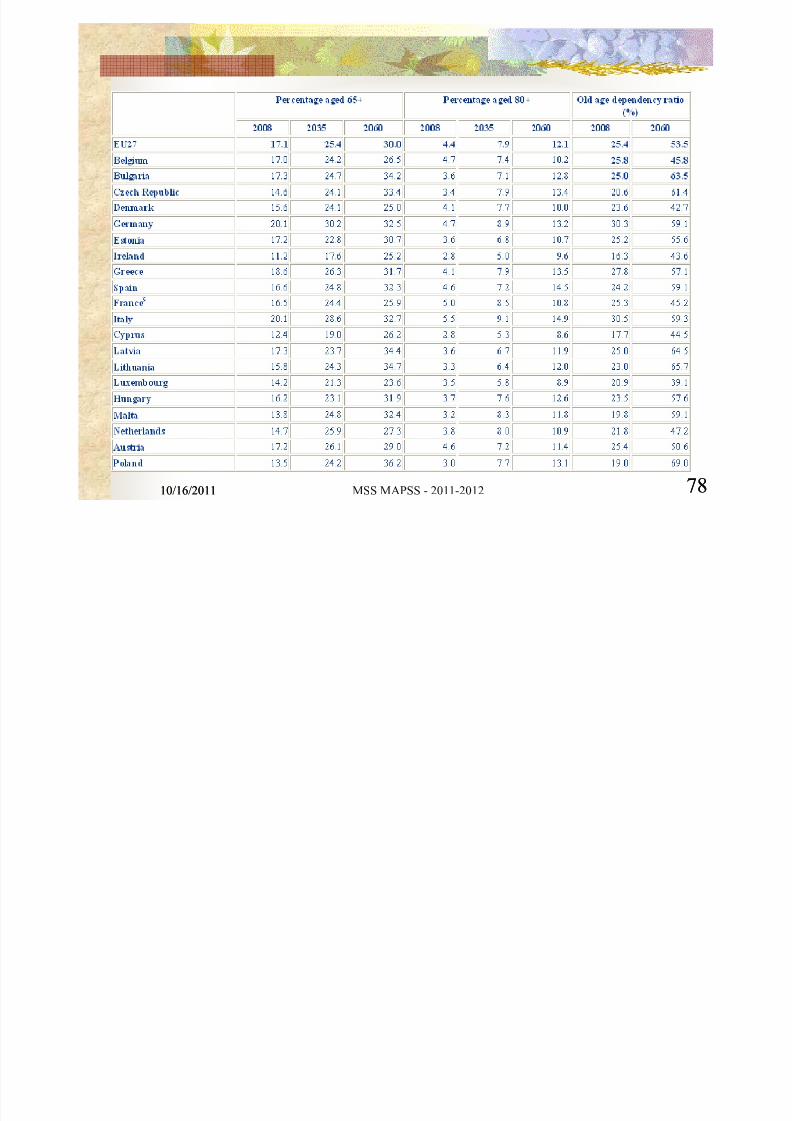
Population projections 2008-2060; From 2015, deaths projected to outnumber births in the EU27; Almost three times as
many people aged 80 or more in 2060”
10/16/2011 MSS MAPSS - 2011-2012 7710/16/2011 77
8/3/2019 11-12 CURS INTRODUCERE 061020111908
http://slidepdf.com/reader/full/11-12-curs-introducere-061020111908 78/80
10/16/2011 MSS MAPSS - 2011-2012 7810/16/2011 78
8/3/2019 11-12 CURS INTRODUCERE 061020111908
http://slidepdf.com/reader/full/11-12-curs-introducere-061020111908 79/80
Luare de pozitie - Valentin Lazea, noiembrie 2008-
studiu al Bancii Mondiale, care arata ca doar sapte state si-au mentinut cresterea economica peste 5% mai mult de 20 de ani, printre acestea numarandu-se China, Guineea Ecuatorialasi Irlanda.
Un sfert dintre romanii activi contribuie la PIB-ul altor tari In ultima prognoza publicata de Comisia Nationala de Prognoza (CNP), institutia
estimeaza o crestere aproape lineara a populatiei active - intre 15 si 64 de ani - dinRomania, de la 9,608 milioane persoane in 2008 la 9,754 milioane in 2010, 9,91milioane in 2015 si 10 007 milioane in 2020.
proiecţiile oficiului european de statistică vin să arate că viitorul “sună prost”:
mortalitatea si emigraţia vor face ca în 2060 românii să nu fie mai mulţi decât în 1955(17 milioane de locuitori).
Valentin Lazea admite că bunăstarea unei naţiuni depinde de cresterea populaţiei, dar respingecatastrofa demografică previzionată de Eurostat, dând exemplul Italiei, care a reusit săcompenseze sporul natural negativ cu ajutorul imigraţiei.
.
- „după 2030 riscăm să intr ăm într-o involuţie exponenţială, numărul asistaţilor sociali/ pensionarilor depăsindu-l cu mult pe cel al populaţiei active“.
- “cifrele avansate de Eurostat trebuie tratate cu circumspecţie, dat fiind că nici alte „catastrofe“ -
10/16/2011 MSS MAPSS - 2011-2012 7910/16/2011 79
Italiei, unde (datorită imigraţiei) scăderea populaţiei previzionate de Eurostat nu a avut loc”
Care sunt, concret, ipotezele pe care îsi bazează Eurostat prognozele pesimiste?

8/3/2019 11-12 CURS INTRODUCERE 061020111908
http://slidepdf.com/reader/full/11-12-curs-introducere-061020111908 80/80
, , p p p g p
Cel mai pesimist - grupul de ipoteze referitor la natalitate. Numărul nasterilor anuale din România ascăzut de la circa 315.000 în 1990 ână la 210.000 în 2002 du ă care a înce ut să crească usor s re230.000. Or, ipoteza Eurostat este că, în medie, vor exista circa 158.000 de nasteri pe an în intervalul2008-2060. Această cifr ă presupune cohorte tot mai mici de femei capabile si dispuse să nască si orată a fertilităţii chiar mai mică de 1,37 copii/femeie, care a fost media ratei fertilităţii în perioada1990-2005.
x s o us s un anum r sc care poa e ace ca aceas prognoz ne or s se n ep neasc , s anumefaptul că cea mai mare parte a emigraţiei românesti (peste 65% în anul 2007) o constituie femeile.Dacă la aceasta adăugăm că aproximativ 63% din totalul emigraţiei românesti e reprezentată din
persoane cu vârsta cuprinsă între 18 si 40 de ani (adică tocmai perioada de fertilitate), obţinemima inea unor nasteri care nu mai au loc sau au loc în str ăinătate, văduvind România de o sursăimportantă de crestere. De aceea, politicile de ocrotire a mamei si copilului trebuie să capete o mareimportanţă, precum si politicile firmelor faţă de salariatele aflate în situaţia să nască.
Grupul de ipoteze privitor la mortalitate mi se pare foarte realist. Astfel, faţă de o medie anuală de265.000 de decese în perioada 1990-2005, studiul prognozează o usoar ă scădere, la 251.000 de decese
- , .
Dar al treilea grup de ipoteze, cel referitor la imigraţie, mi se pare, din nou, excesiv de pesimist - Grecia,Portugalia si Spania au avut, fiecare, o rată de imigraţie netă nesemnificativă în primii 5-10 ani dupăaderarea lor la Uniunea Europeană. Odată trecută această perioadă însă, imigraţia netă în aceste ţări acrescut atât de mult încât a com ensat cu vârf si îndesat scăderea naturală a o ula iei autohtone.Astfel, cele trei ţări au acum populaţii în continuă crestere, în pofida unui spor natural negativ. Credcă acelasi lucru se va întâmpla si cu România, pe măsur ă ce îsi va consolida economia si statutul demembru UE. Or, prognoza Eurostat prevede pentru România, în perioada 2008-2060, o rată aimigraţiei nete de numai 18,4 la mia de locuitori (sau 1,84 la sută), adică de trei ori mai puţin,
10/16/2011 MSS MAPSS - 2011-2012 8010/16/2011
, .României un plus de peste un milion de persoane (imigranţi) faţă de prognoza Eurostat.
Recommended