March 1, 2011
Presentation of Results
4th Quarter of 2010
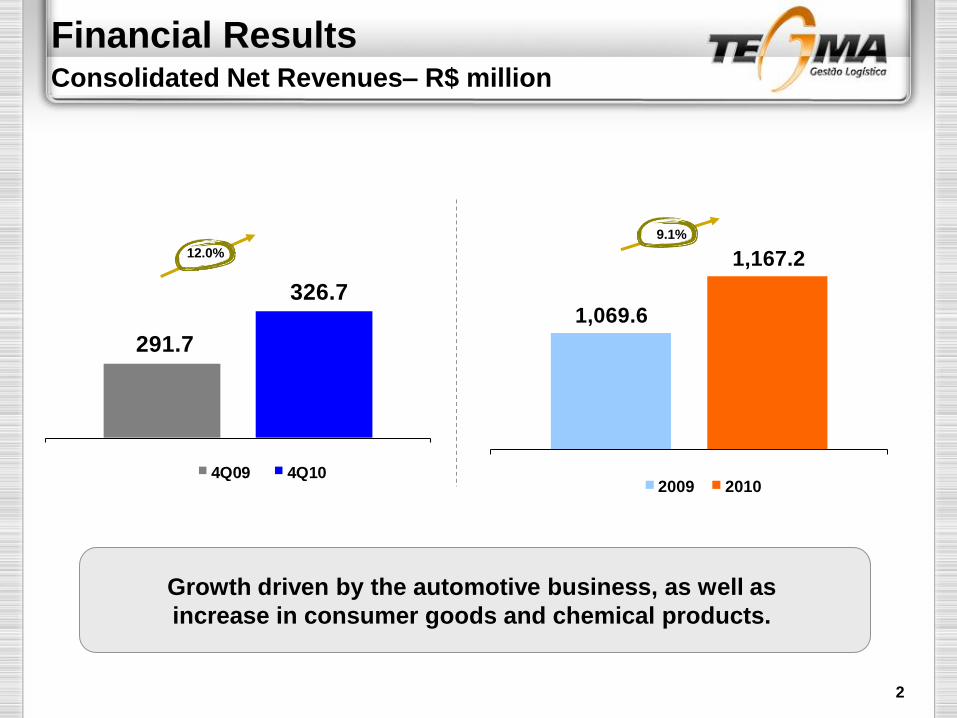
12.0%
9.1%
Growth driven by the automotive business, as well as
increase in consumer goods and chemical products.
2
Financial ResultsConsolidated Net Revenues– R$ million
1,069.6
1,167.2
2009 2010
291.7
326.7
4Q09 4Q10
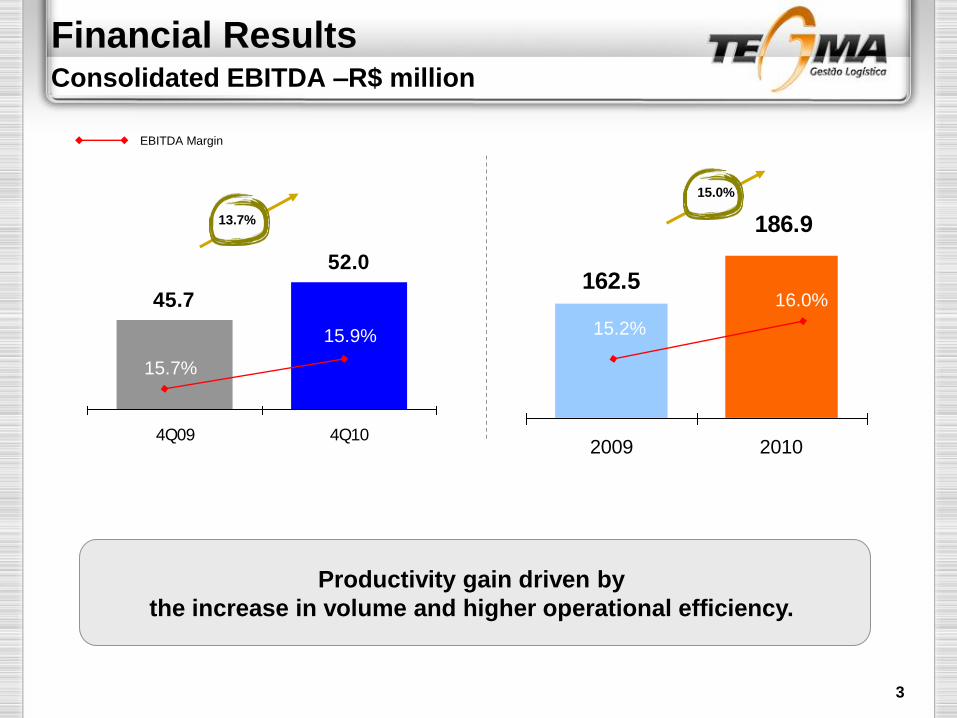
162.5
186.9
2009 2010
EBITDA Margin
Productivity gain driven by
the increase in volume and higher operational efficiency.
15.0%
13.7%
3
45.7
52.0
4Q09 4Q10
15.7%
15.9% 15.2%
16.0%
Financial ResultsConsolidated EBITDA –R$ million
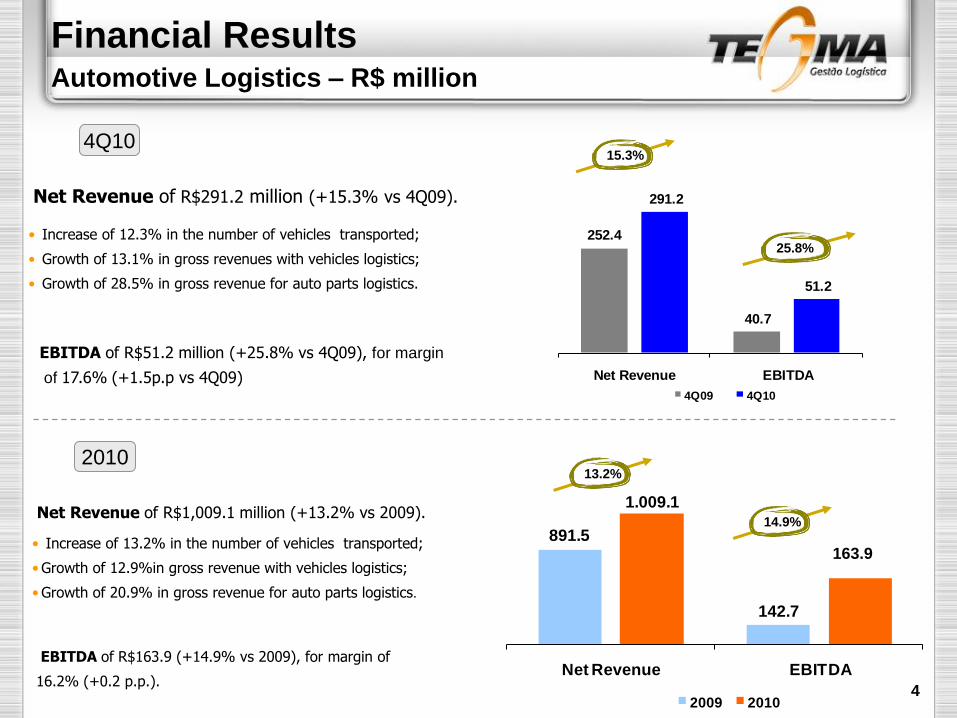
Net Revenue of R$291.2 million (+15.3% vs 4Q09).
• Increase of 12.3% in the number of vehicles transported;
• Growth of 13.1% in gross revenues with vehicles logistics;
• Growth of 28.5% in gross revenue for auto parts logistics.
EBITDA of R$163.9 (+14.9% vs 2009), for margin of
16.2% (+0.2 p.p.).
Net Revenue of R$1,009.1 million (+13.2% vs 2009).
• Increase of 13.2% in the number of vehicles transported;
•Growth of 12.9%in gross revenue with vehicles logistics;
•Growth of 20.9% in gross revenue for auto parts logistics.
EBITDA of R$51.2 million (+25.8% vs 4Q09), for margin
of 17.6% (+1.5p.p vs 4Q09)
15.3%
25.8%
13.2%
14.9%
4Q10
2010
4
163.9
Financial ResultsAutomotive Logistics – R$ million
252.4
40.7
291.2
51.2
Net Revenue EBITDA
4Q09 4Q10
891.5
142.7
1.009.1
Net Revenue EBITDA
2009 2010
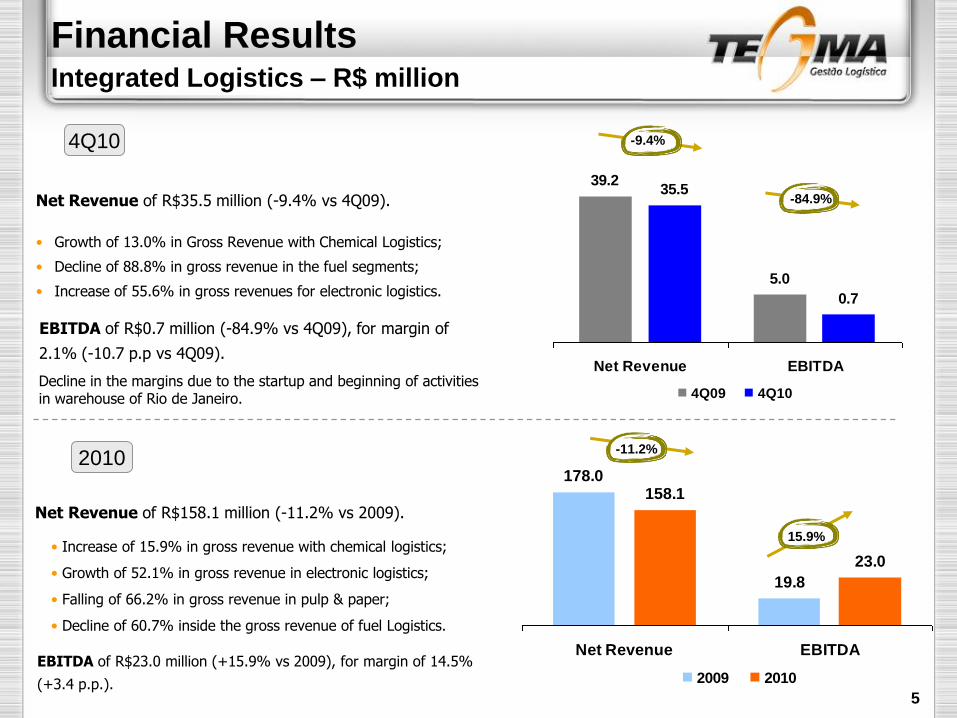
Net Revenue of R$158.1 million (-11.2% vs 2009).
EBITDA of R$23.0 million (+15.9% vs 2009), for margin of 14.5%
(+3.4 p.p.).
Net Revenue of R$35.5 million (-9.4% vs 4Q09).
• Growth of 13.0% in Gross Revenue with Chemical Logistics;
• Decline of 88.8% in gross revenue in the fuel segments;
• Increase of 55.6% in gross revenues for electronic logistics.
39.2
5.0
35.5
0.7
Net Revenue EBITDA
4Q09 4Q10
178.0
19.8
158.1
23.0
Net Revenue EBITDA
2009 2010
-84.9%
15.9%
4Q10
EBITDA of R$0.7 million (-84.9% vs 4Q09), for margin of
2.1% (-10.7 p.p vs 4Q09).
2010
5
-11.2%
-9.4%
Financial ResultsIntegrated Logistics – R$ million
Decline in the margins due to the startup and beginning of activitiesin warehouse of Rio de Janeiro.
• Increase of 15.9% in gross revenue with chemical logistics;
• Growth of 52.1% in gross revenue in electronic logistics;
• Falling of 66.2% in gross revenue in pulp & paper;
• Decline of 60.7% inside the gross revenue of fuel Logistics.
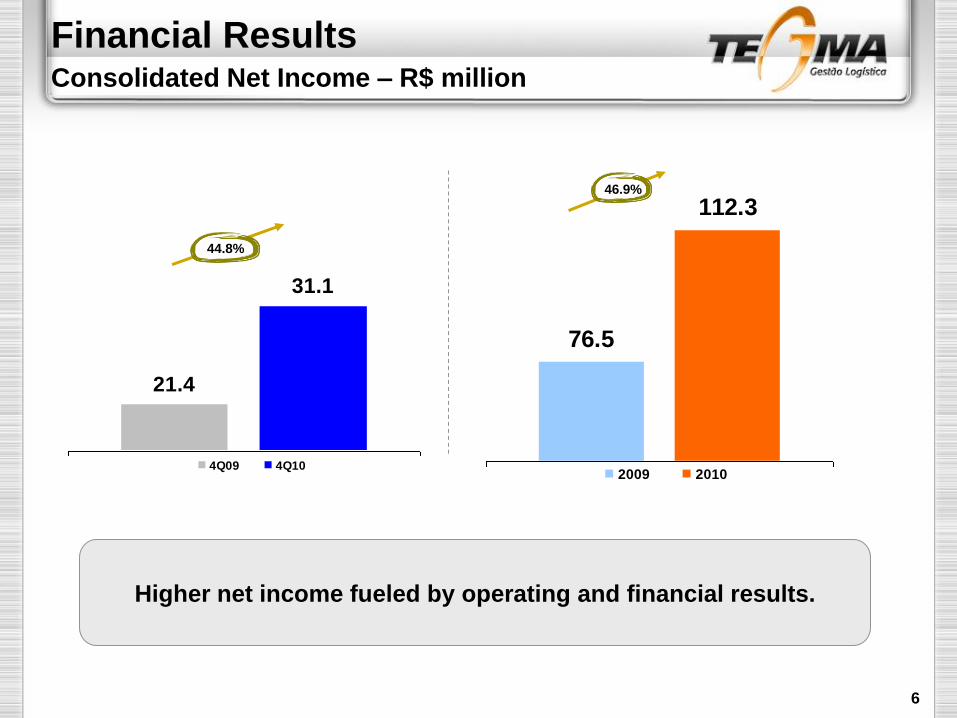
21.4
31.1
4Q09 4Q10
76.5
112.3
2009 2010
Higher net income fueled by operating and financial results.
6
46.9%
44.8%
Financial ResultsConsolidated Net Income – R$ million

Net Debt
40.3
-2.7
18.8
13.7 13.0
4Q09 1Q09 2Q10 3Q10
0.25x
x EBITDA 12 months
Debt Profile
36%
64%
ST LT
7
- 0.11x 0.08x
Financial ResultsCash Balance and Debt
0,07x
4T10
Alexandre Brandão
+55 (11) 4346-2532
Hugo Zierth
+55 (11) 4346-2532
IR Contact
The forward-looking statements contained in this presentation are subject to risks anduncertainties. These are based on beliefs and assumptions of our Management and informationcurrently available to the Company. Such statements include information about our currentintentions, beliefs or expectations, as well as those of our Board of Directors and Board ofExecutive Officers.
The reservations concerning forward-looking statements also apply to information aboutpossible or presumed operating results, as well as declarations preceded by, including orfollowed by such words as "believe", "may", "will", "continue", "expect", "foresee", "intend","plan", "estimate“ and other similar expressions.
Forward-looking statements do not constitute a guarantee of performance. Since they refer tothe future, they depend on circumstances that may or may not occur and are therefore subjectto risks, uncertainties and assumptions. Future results and creation of shareholder value maydiffer substantially from those expressed or suggested by the forward-looking statements. Manyfactors that may influence these results are beyond TEGMA’s control or expectations.
Recommended