ANALIZA PREKOGRANIČNOG ONEČIŠĆENJA LEBDEĆIM ČESTICAMA UZROKOVANOG ŠUMSKIM POŽARIMA
ANALYSIS OF TRANSBOUNDARY PM POLLUTION CAUSED BY FOREST FIRES
Amela Jeričević & Branko Grisogono1
Thanx to student Goran Gašparac on the preparation of emission data
2
FOREST FIRES-BIOMAS BURNING PRODUCTSEFIS system

3
FOREST FIRES Significant impacts on local air quality, visibility and human
health. Emissions from forest fires can travel large distances, affecting air
quality and human health far from the originating fires. particulate matter-second largest source of PM2.5 from wood smoke
(second to open-burning sources). The major products of biomass burning are CO2 and water vapour.
Large number of particulates and trace gases are produced, including the products of incomplete combustion (CO, NMVOCs) and nitrogen and sulphur species, which indirectly influence the tropospheric ozone (O3) budget (Koppmann et al., 2005). These arise partly from nitrogen and sulphur contained in the vegetation and organic matter in the surface soils.
Additionally, emissions can arise from the re-volatilisation of substances which have been deposited (Hegg et al., 1987, 1990).

4
FIRE EMISSIONS PROPERTIES
The relative contribution of (open and domestic) biomass burning emissions to the global annual emission CO is ~ 25 %, for NOx ~ 18 % and for non-methane volatile
organic compounds (NMVOC) and CH4 ~ 6 % (IPCC, 2001). Europe - the contribution to total emissions is much lower,
since the vast majority of fires occur in tropical regions Corinair90 inventory in Europe forest fires account for
0.2 % of NOx emissions, 0.5 % of NMVOC, 1.9 % of CO emissions and 0.1 % of NH3 emissions.
<< contribution to the total emissions BUT >> uncertainties
Since fires occur over short periods of time, emissions may significantly contribute to ground-level concentrations during these events.

5
EUROPEAN FOREST FIRE INFORMATION SYSTEM EFFIS HTTP://EFFIS.JRC.IT/
developed jointly by the EC services (Directorate General Environment and the Joint Research Centre) and the relevant fires services in the countries (forest fires and civil protection services) in response to the needs of European bodies such as the Monitoring and Information Centre of Civil Protection, the European Commission Services and the European Parliament
the CO2 emissions during recent catastrophic fires in Greece was in the range of 4.5 Mt until end of August 2007, representing ~ 4 % of the total annual CO2 emissions of this country.
For August 2003, the contribution of wildfire emissions in South Europe of observed PM2.5 appeared to be comparable to anthropogenic emissions, with significant impact on radiative properties in large areas of Europe (Hodzic et al. 2007).

6
FIRES IN EUROPE
The frequency and extent of fires in Europe is very variable from year to year, reflecting year-to-year climatological variability, with an average of about half a million hectares in the last 20 years, excluding the European part of Russia.
On average, during the period 2000 to 2005, about 100 000 fires occurred annually in European countries, burning almost 600 000 hectares of forest land every year. However, figures have reached values over 700 000 ha in 2003 or nearly one million ha in 2007 (EFFIS).

7
JRC REPORT ON FOREST FIRES 2012

8
JRC REPORT ON FOREST FIRES 2012
Expert Group on Forest Fires (EGFF).

9
CROATIA-2012
2012 -significant hectares of burned vegetation in the coastal (Mediterranean) and continental parts of the country
Climate analysis made by the MHSC temperatures in the summer of
2012 (June, July, August) on the coast and in the Adriatic were extremely hot in comparison with recent years.
Precipitation in the summer was mainly in categories of very dry and extremely dry
the 2012 summer ~significant increase in radiation regime compared with the 10-yr mean weather regime frequency in the Northern and Middle Adriatic.

10
CROATIA-NUMBER OF VEGETATION FIRES IN 2012.

11
BURNED AREA 2012
Bosnia-Herzegovina was particularly affected by fires in 2012, suffering a worse year in 2012 than the last five years combined. After 25 058 ha burnt in March (already more than last year’s total) a further 62 639 ha brought the annual total to 87 697 ha. 25 of these fires were more than 1000 ha in size.
Croatia suffered its worst fire season for several years, with almost twice as much burnt area recorded as in 2011, including 7 fires of more than 1000 ha in size. There were two peaks of fire activity: one in March, when around half the total burnt area of the season was recorded, and one in July/August.
12
AIR QUALITY MODELLINGFires parameterizations
13
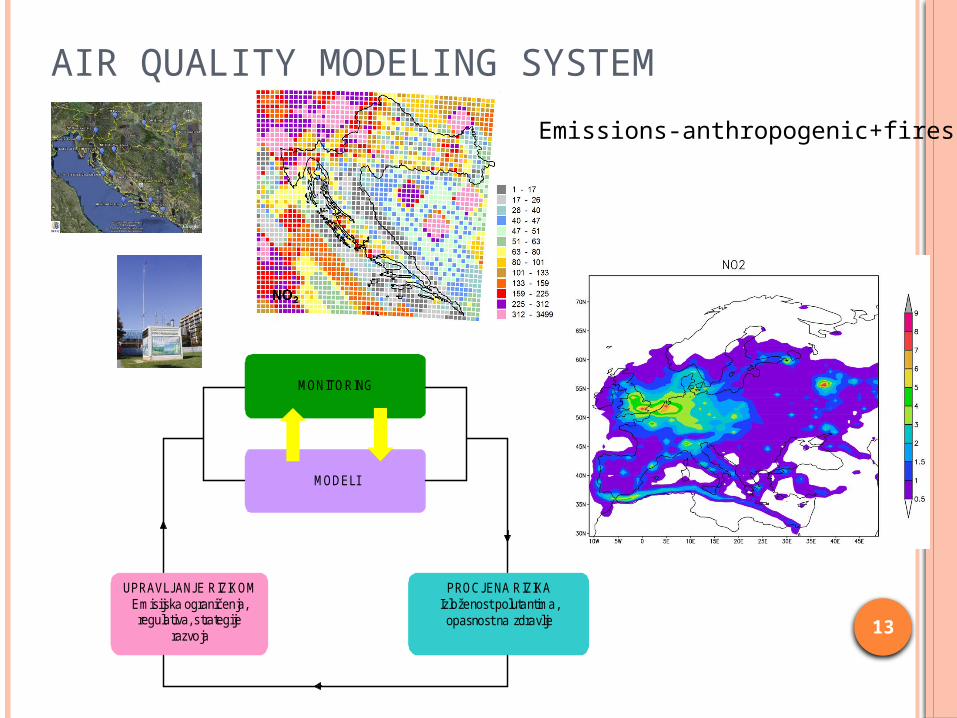
AIR QUALITY MODELING SYSTEM
MONITORING
MODELI
UPRAVLJANJE RIZIKOM Emisijska ograničenja, regulativa, strategije
razvoja
PROCJENA RIZIKA Izloženost polutantima,
opasnost na zdravlje
Emissions-anthropogenic+fires

14
FIRE EMISSIONS ESTIMATION
Emissions from forest fires depend on (1) the duration and intensity of the fire, (2) the total area burnt by the fire (fair level of accuracy), and (3) the type and amount of vegetation that is burnt ~ fuel load.
The state of the art in calculating emissions from open vegetation fires follows the work of Seiler and Crutzen (1980) and is formulated as:
Ex = A * B * C* EF, where
Ex = emission of compound x A = burnt area (m2) B = fuel load (g dry matter m-2) C = burning efficiency EF = emission factor (g g-1 dry matter burnt)

15
FIRE EMISSIONS ESTIMATION-RESULTS

16
IS4FIRES AN INTEGRATED MONITORING AND MODELLING SYSTEM FOR WILDLAND FIRES
The current emission dataset has been obtained by re-analysis of fire radiative power data obtained by MODIS instrument onboard of Aqua and Terra satellites. The period covered is from February 2000 onwards (extension of the period is planned on annual basis). For the period from Feb 2000 till July 2002, only MODIS-Terra data are available

17
INJECTION PROFILE HEIGHT Wild-fires release huge amounts of aerosol and hazardous trace
gases in the atmosphere. Residence time and the dispersion of fire pollutants range from
hours -> days, local -> continental scales. scenarios depend on the injection height of smoke plumes. The
altitude at which fire products are injected in the atmosphere is controlled by fire characteristics and meteorological conditions.
Calculation of characteristic injection profile is based on a recently suggested semi-empirical formula for the fire-plume top height (Sofiev et al., 2012). According to this methodology, the plume top Hp depends on the fire radiative power FRP, ABL height Habl, and buoyancy frequency in the free troposphere NFT:

18
PYRO CONVECTION
Spatial distribution of the 150μgm−3-isosurface of thesimulated aerosol mass distribution after 40 min of simulation time.The color coding represents the potential temperature.
J.Trentmann, 2006

19
FIRE CASE STUDY-MONITORING
20
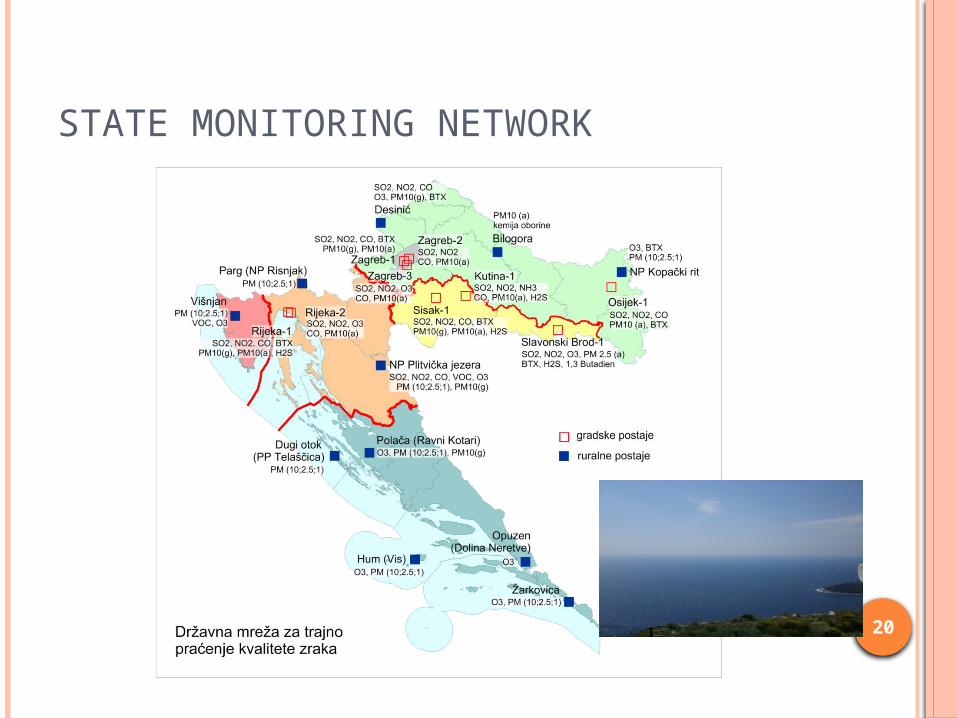
STATE MONITORING NETWORK

21
CASE STUDY 1 SPLIT 22.08.2010.
11
.08
.10
11
.08
.10
12
.08
.10
12
.08
.10
13
.8.2
01
01
3.8
.20
10
14
.8.2
01
01
4.8
.20
10
15
.8.2
01
01
5.8
.20
10
16
.8.2
01
01
6.8
.20
10
17
.8.2
01
01
8.8
.20
10
18
.8.2
01
01
9.8
.20
10
19
.8.2
01
02
0.8
.20
10
20
.8.2
01
02
1.8
.20
10
21
.8.2
01
02
2.8
.20
10
22
.8.2
01
02
3.8
.20
10
24
.8.2
01
0
0
50
100
150
200
250
300
PM10 Urban stations
Solin
Kastel Sucurac
Split

22
CASE STUDY 1-CONT.

23
CASE STUDY -2 DUBROVNIK 3.8.2013.

24
ŽARKOVICA –NEAR DUBROVNIK

25
CONCLUSIONS
Fires affect air quality on local and regional scales
Modeling is an effective tool to assess the transport and dispersion of air pollutants to forecast the distribution of pollutants and to calculate the effects on health and environment
Croatia and BiH are both experiencing high damage in human lives and costs due to forest fires.
Joint research projects that would assure building of competent systems contained of data basis, modeling tools and human resources should be the part of our efforts recognized by both states.
Recommended