Business Mobile RDC:Capturing Your Fair Share of the MarketJanuary 20, 2016

Today’s Presenters
� Jim Poteet, PrincipalTreasury Strategies, Inc.
� Bob Meara, Senior AnalystCelent
� Jason Olson, Solution ManagerWAUSAU Financial Systems
Agenda
Slides
� Market Dynamics 4–10
� Business mRDC – Something for Everyone 11–17
� Use-Cases 18–26
� Business Mobile RDC Value 27–29
� Wausau & Deluxe Solution 30–35
� Q&A

Question #1
� For those Banks offering a mobile RDC solution, did you leverage your consumer mobile RDC platform or did you establish a unique business mobile RDC platform?A. Leveraged consumer platform
B. Established a unique business platform
C. Still deciding our platform strategy
5
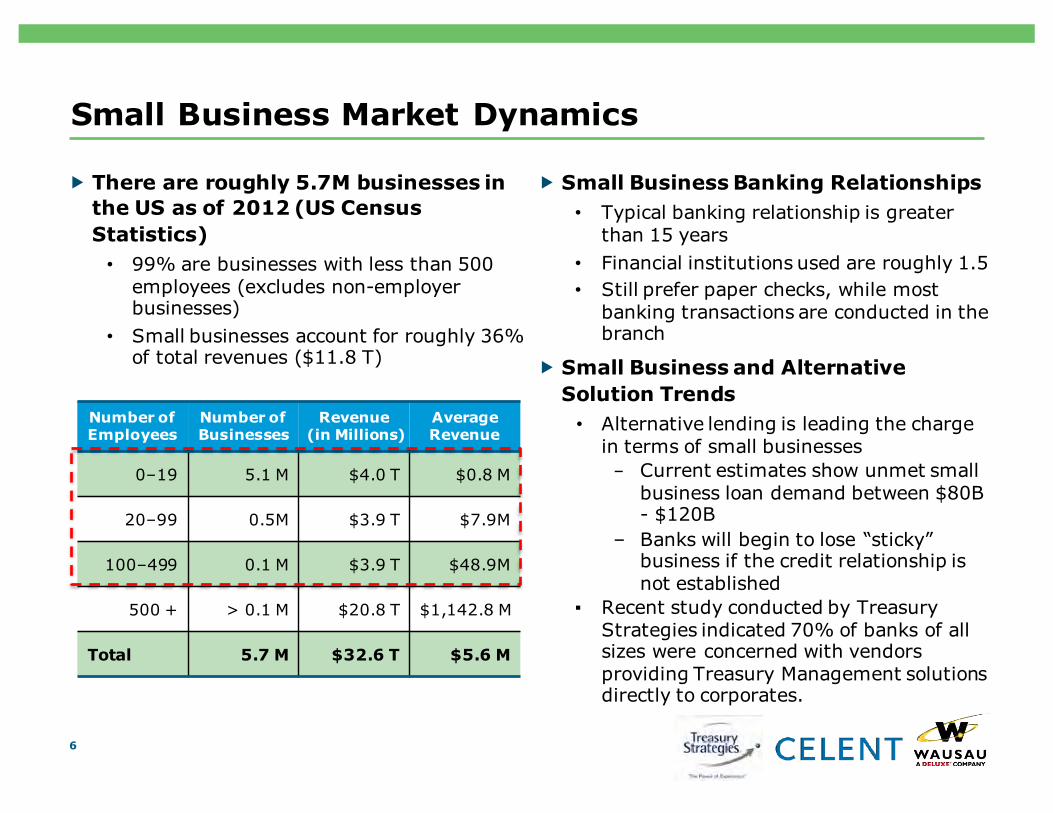
Small Business Market Dynamics
� There are roughly 5.7M businesses in the US as of 2012 (US Census Statistics)
• 99% are businesses with less than 500 employees (excludes non-employer businesses)
• Small businesses account for roughly 36% of total revenues ($11.8 T)
6
� Small Business Banking Relationships • Typical banking relationship is greater
than 15 years• Financial institutions used are roughly 1.5• Still prefer paper checks, while most
banking transactions are conducted in the branch
� Small Business and Alternative Solution Trends
• Alternative lending is leading the charge in terms of small businesses - Current estimates show unmet small
business loan demand between $80B - $120B
– Banks will begin to lose “sticky” business if the credit relationship is not established
▪ Recent study conducted by Treasury Strategies indicated 70% of banks of all sizes were concerned with vendors providing Treasury Management solutions directly to corporates.
Number of Employees
Number ofBusinesses
Revenue(in Millions)
Average Revenue
0–19 5.1 M $4.0 T $0.8 M
20–99 0.5M $3.9 T $7.9M
100–499 0.1 M $3.9 T $48.9M
500 + > 0.1 M $20.8 T $1,142.8 M
Total 5.7 M $32.6 T $5.6 M

Corporate Spend by ActivityNearly half of corporate spend on the financial value chain is spent on billing & AR, point-of-sale and reporting, although banks only access a portion of that spend.
7
Billing & AR
19%Point-of-Sale15%
Liquidity Mgmt. 14%
Reporting
13%
Risk Mgmt.13%
Corporate Financial Operations % Spend by
Activity
Procurement &AP26%
Corporate Spend Key Takeaways
Bank treasury management receivables solutions cover the billing & AR space –19% of financial operations’ spend.
Bank and non-bank merchant processors dominate the point-of-sale space.
These activities typically involve manual processes and a significant number of FTEs.
Banks provide the information to support reporting activities, but otherwise spend is focused on FTE and software.
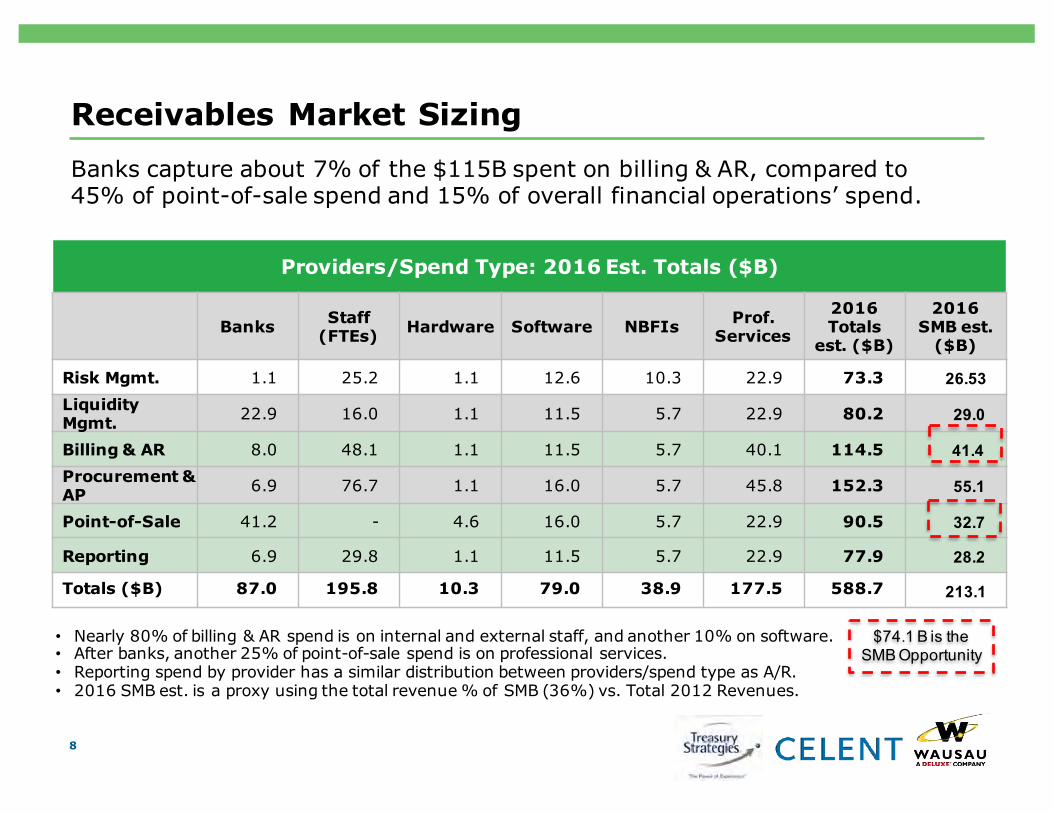
Receivables Market SizingBanks capture about 7% of the $115B spent on billing & AR, compared to 45% of point-of-sale spend and 15% of overall financial operations’ spend.
8
Providers/Spend Type: 2016 Est. Totals ($B)
Banks Staff (FTEs) Hardware Software NBFIs Prof.
Services
2016 Totals
est. ($B)
2016 SMB est.
($B)
Risk Mgmt. 1.1 25.2 1.1 12.6 10.3 22.9 73.3 26.53Liquidity Mgmt. 22.9 16.0 1.1 11.5 5.7 22.9 80.2 29.0
Billing & AR 8.0 48.1 1.1 11.5 5.7 40.1 114.5 41.4Procurement & AP 6.9 76.7 1.1 16.0 5.7 45.8 152.3 55.1
Point-of-Sale 41.2 - 4.6 16.0 5.7 22.9 90.5 32.7
Reporting 6.9 29.8 1.1 11.5 5.7 22.9 77.9 28.2
Totals ($B) 87.0 195.8 10.3 79.0 38.9 177.5 588.7 213.1
• Nearly 80% of billing & AR spend is on internal and external staff, and another 10% on software. • After banks, another 25% of point-of-sale spend is on professional services.• Reporting spend by provider has a similar distribution between providers/spend type as A/R.• 2016 SMB est. is a proxy using the total revenue % of SMB (36%) vs. Total 2012 Revenues.
$74.1 B is the SMB Opportunity
Payment Trends
9
48%
24%
12%16%
49%
27%
4%
21%
0%
10%
20%
30%
40%
50%
60%
Very Likely Somewhat Likely Not At All Likely Majority Already Electronic
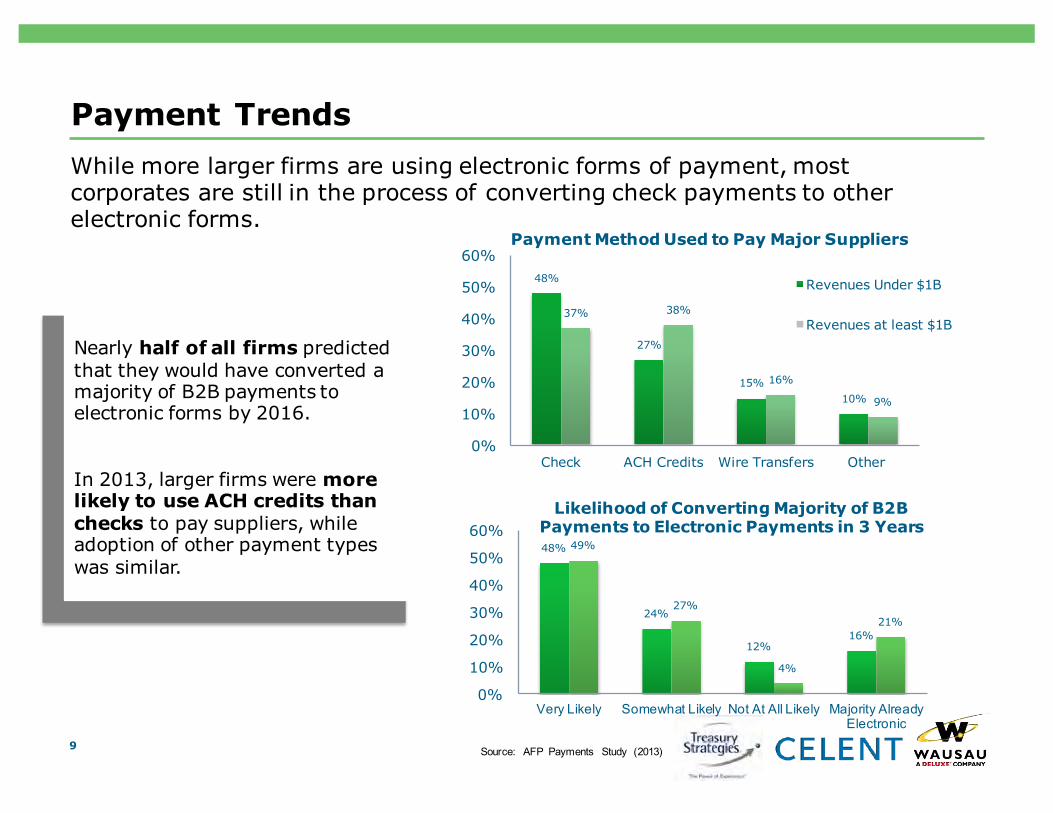
Likelihood of Converting Majority of B2B Payments to Electronic Payments in 3 Years
Source: AFP Payments Study (2013)
Nearly half of all firms predicted that they would have converted a majority of B2B payments to electronic forms by 2016.
In 2013, larger firms were more likely to use ACH credits than checks to pay suppliers, while adoption of other payment types was similar.
While more larger firms are using electronic forms of payment, most corporates are still in the process of converting check payments to other electronic forms.
48%
27%
15%10%
37% 38%
16%
9%
0%
10%
20%
30%
40%
50%
60%
Check ACH Credits Wire Transfers Other
Payment Method Used to Pay Major Suppliers
Revenues Under $1B
Revenues at least $1B
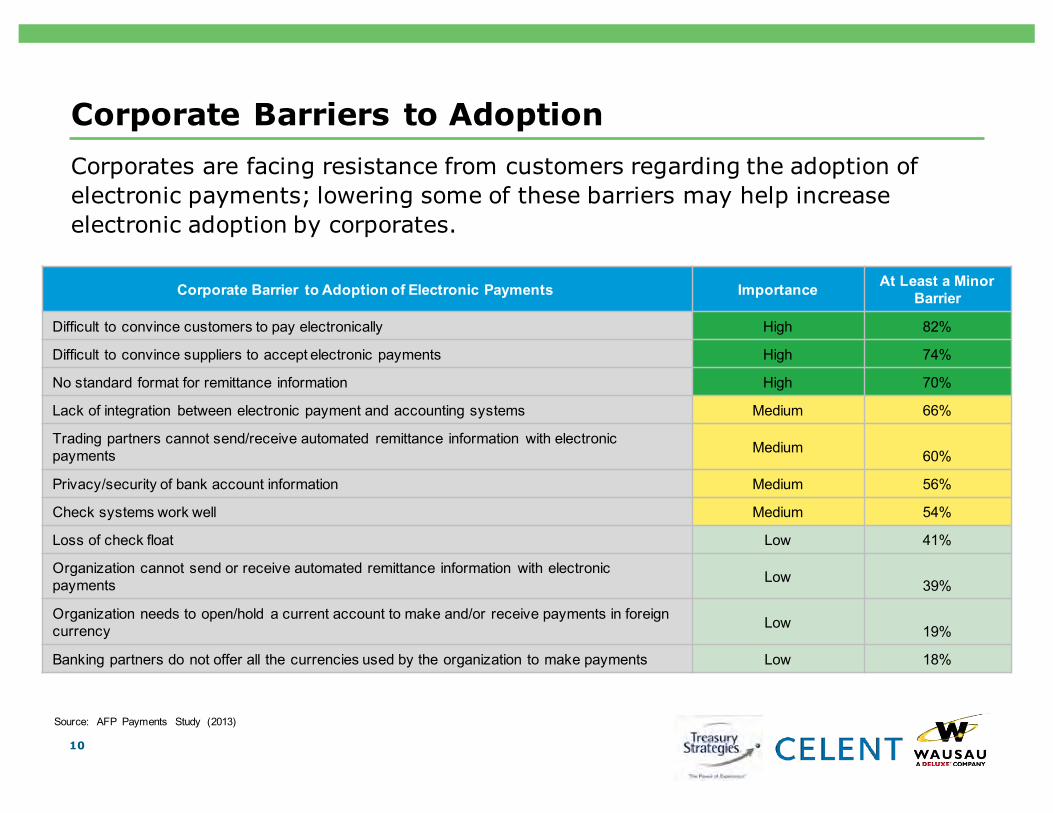
Corporate Barriers to AdoptionCorporates are facing resistance from customers regarding the adoption of electronic payments; lowering some of these barriers may help increase electronic adoption by corporates.
10
Corporate Barrier to Adoption of Electronic Payments Importance At Least a Minor Barrier
Difficult to convince customers to pay electronically High 82%
Difficult to convince suppliers to accept electronic payments High 74%
No standard format for remittance information High 70%
Lack of integration between electronic payment and accounting systems Medium 66%
Trading partners cannot send/receive automated remittance information with electronic payments Medium 60%
Privacy/security of bank account information Medium 56%
Check systems work well Medium 54%
Loss of check float Low 41%
Organization cannot send or receive automated remittance information with electronic payments Low 39%
Organization needs to open/hold a current account to make and/or receive payments in foreign currency Low 19%
Banking partners do not offer all the currencies used by the organization to make payments Low 18%
Source: AFP Payments Study (2013)

Business mRDCSomething for Everyone
Bob MearaSr. Analyst, [email protected] Twitter: @mearaman
FINANCIAL SERVICES© Oliver Wyman

Business desktop RDC is now a mature market
Banks raced to market with desktop RDC products beginning in 2005
12
• Led by the large cash management banks, desktop RDC has been a no-brainer for banks large and small
• Initial prospects were large dollar depositors, with a value proposition based on float savings
• But not wholesale lockbox clients, for fear of cannibalization
• With product improvements, came additional market segments:
- SMB – lower pricing, single-feed scanners
- Virtual lockbox – full page capture
Historic desktop RDC adoption
Source: Vendor surveys, Celent estimates
-
200,000
400,000
600,000
800,000
1,000,000
-
1,000
2,000
3,000
4,000
5,000
6,000
7,000
8,000
2005 2007 2009 2011 2013
# Fis # Scanners
# FI
s A
dopt
ing
# Scanners Deployed
© Oliver Wyman

Small business RDC was an afterthought – most banks approached with essentially same product
13
• Most banks, esp. smaller banks, have a single business RDC product
• Large banks are more likely to have a separate SMB RDC product– But, most simply bundle
hardware and software differently for small businesses
– And sell customers the scanners
• Most products were designed before the explosion in mobile device usage
• And cost more than many SMBswant to pay
• Attempts at using flatbed scanners and MFDs fell flat
Source: Celent survey of financial institutions, September 2013, n=266
Small business RDC solutions
Small business RDC scanner pricing
5%
30%
64%
4%
42%
50%
18%
29%
41%
0% 10% 20% 30% 40% 50% 60% 70%
Resp. (%)
>$50 BN $1–50 BN <$1 BN
26%
31%
39%
0% 20% 40% 60%Resp. (%)
Separate product (may be same vendor)
Same solution, but with different scanner choice(s) and/or pricing
Same solution as offered to commercial/corporate market
FI absorbs the cost of the scanner
FI bundles the cost of the scanner into the monthly
service fee
Customers must pay for scanner up front
© Oliver Wyman

21%
35%
38%
39%
0%
54%
0% 10% 20% 30% 40% 50% 60%
Growfeerevenue
Growdeposits
Migratebranchtransactionstoself-servicechannels
Resp.(%)
>$50b
<$50b
15%
17%
10%
34%
5%
10%
18%
36%
10%
13%
9%
61%
0% 10%20%30%40%50%60%70%
Improveregulatorycompliance(e.g.,FFIEC,AML)
Improveriskmanagement
Reducecost
Increaseclientadoption
Resp.(%MostImportant)
2015
2013
2012
When it comes to small business RDC, most banks still eye growth – but not for the same reasons
14
• Thirst for deposits varies by bank
• All banks seek revenue growth
• Small business RDC has been challenging for many banks, with considerable unmet opportunity
• As a result, the SMB segment remains under-served
Source: (Top) Celent Financial institution Survey 2012 – 2015 Q; What is your institution's top small business RDC priority for the coming year?Source: (Bottom) Celent survey of financial institutions, April 2015, n76 ; Q: What is your primary driver to increase SMB RDC client adoption?
Top small business RDC priority (2012 – 2015)
Primary driver for SMB RDC client growth (2015)
Banks increasingly seek transaction migration as a primary RDC objective
Doing so invites broad-based adoption
© Oliver Wyman

0.4 0.6 0.9 1.2 2.1 2.2 2.3 2.40.2 0.6 2.2 10.9 20 33 47 61
-
10
20
30
40
50
60
0
1,000
2,000
3,000
4,000
5,000
6,000
2009 2010 2011 2012 2013 2014 2015 2016
Desktop Mobile FIs Offering
Meanwhile, mobile RDC has been on a roll!And not because everyone has a mobile use case…
15
• Mobile RDC is on everyone’s mind now, with hundreds of FIs launching each quarter –limited by vendor implementation capacity
• Consumers have been the primary target for mRDC –and love it!
• Consumer desktop approaches (which preceded mRDC) fell flat
• Good news: business mRDC products are now available
Source: Vendor surveys, Celent estimates
Consumer RDC adoption
Mobile is the new scanner!
# FI
s of
ferin
g
# End Users (M
M)
© Oliver Wyman
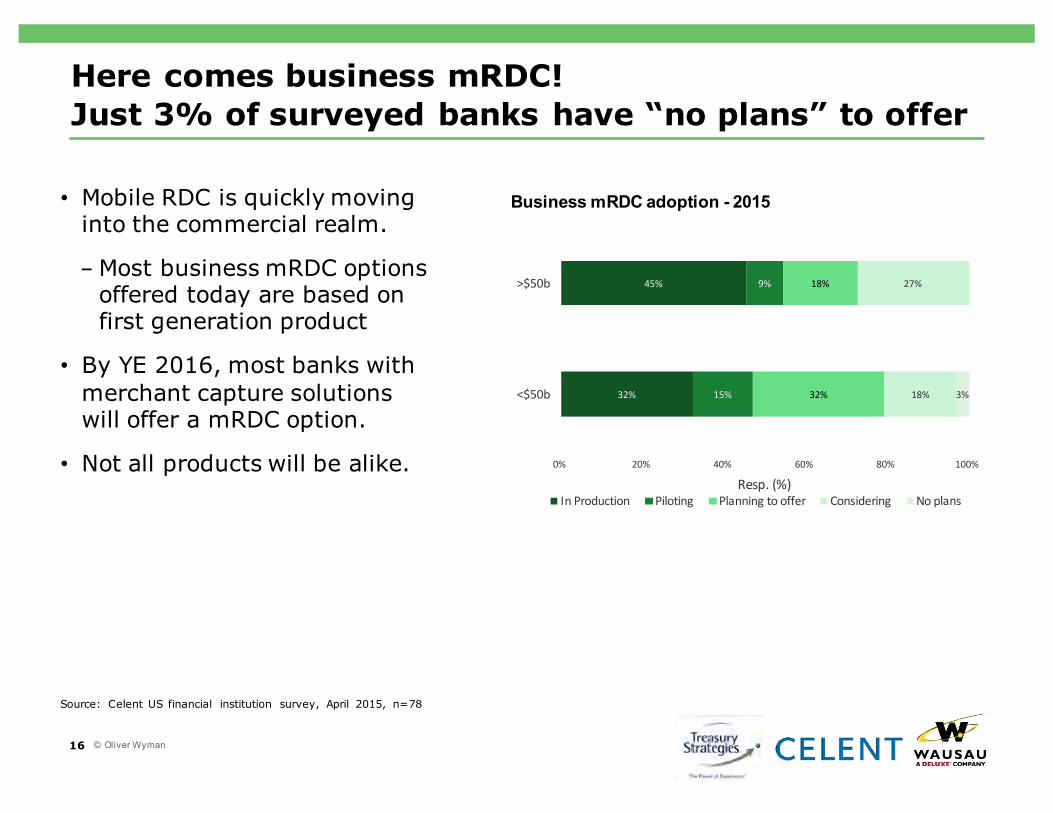
Here comes business mRDC!Just 3% of surveyed banks have “no plans” to offer
16
32%
45%
15%
9%
32%
18%
18%
27%
3%
0% 20% 40% 60% 80% 100%
<$50b
>$50b
Resp.(%)InProduction Piloting Planningtooffer Considering Noplans
Business mRDC adoption - 2015
© Oliver Wyman
• Mobile RDC is quickly moving into the commercial realm.
-Most business mRDC options offered today are based on first generation product
• By YE 2016, most banks with merchant capture solutions will offer a mRDC option.
• Not all products will be alike.
Source: Celent US financial institution survey, April 2015, n=78
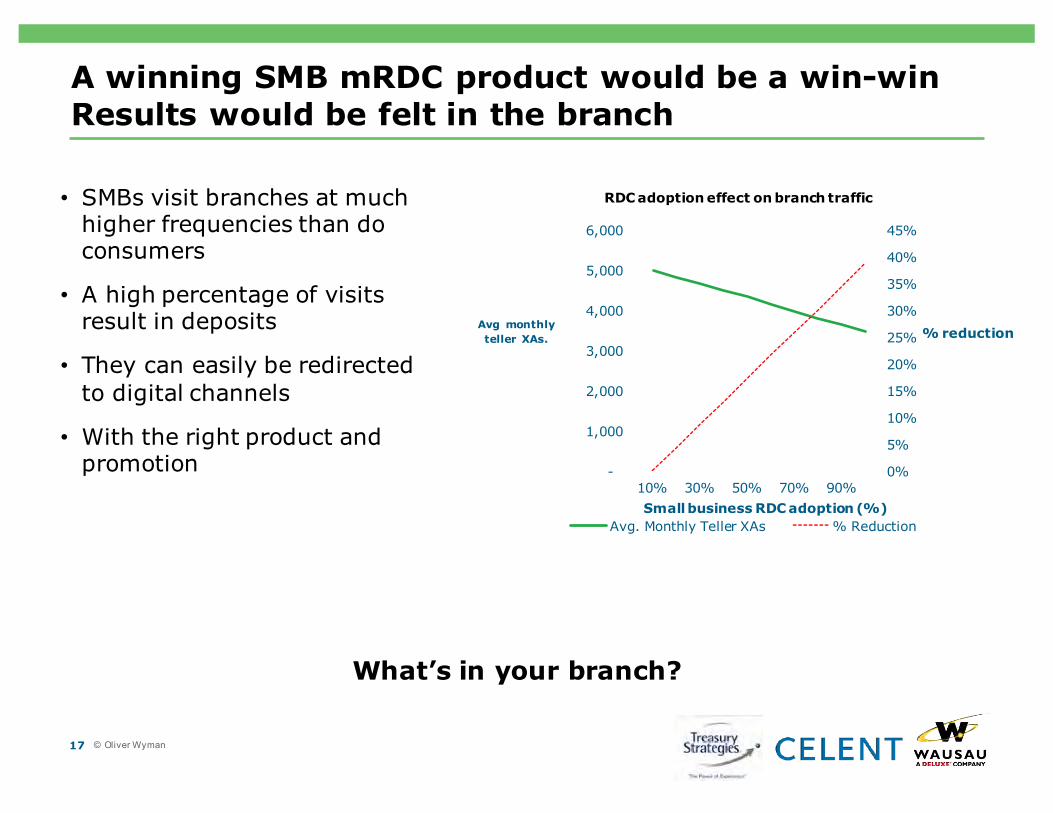
A winning SMB mRDC product would be a win-win Results would be felt in the branch
17
0%
5%
10%
15%
20%
25%
30%
35%
40%
45%
-
1,000
2,000
3,000
4,000
5,000
6,000
10% 30% 50% 70% 90%
% reduction Avg monthly teller XAs.
Small business RDC adoption (%)
RDC adoption effect on branch traffic
Avg. Monthly Teller XAs % Reduction
What’s in your branch?
• SMBs visit branches at much higher frequencies than do consumers
• A high percentage of visits result in deposits
• They can easily be redirected to digital channels
• With the right product and promotion
© Oliver Wyman
Three use-cases to solve for
and why they’re all important
18

Three use-cases are apparent
19
1Low check volume
2Mobile check acceptance
3Distributed check acceptance
Where this shows up
• Primarily SMB • SMB• Commercial and corporate• Stand-alone or with
desktop RDC
• Businesses of all sizes • Many are lockbox clients
Examples • Virtually all types of businesses
• Historically poor desktop RDC prospects
• Delivery• In-person service delivery,
e.g. HVAC, plumbers
• HVAC, receiving both mail-in and mobile check acceptance
• Lockbox clients receiving stranded payments in offices
Business benefit • Low-cost convenience • Lower cost• Accelerated funds avail.
• Faster cash application• Reduced exceptions
Strategic importance to banks
• Transaction migration• Branch channel right-
sizing
• Revenue growth • Revenue growth• Lockbox relevancy
Solution elements • Multi-item deposit• Payer/acct. info. Entry• Separation of duties
• Separation of duties• Payer/acct. info. entry• Desktop administration
• Full-page capture• WLBX workflow integration
As check usage continues to decline, mobile capture will be increasingly relevant to all three use-cases.
© Oliver Wyman
Inexorably declining check usage strengthens the case for mRDC.
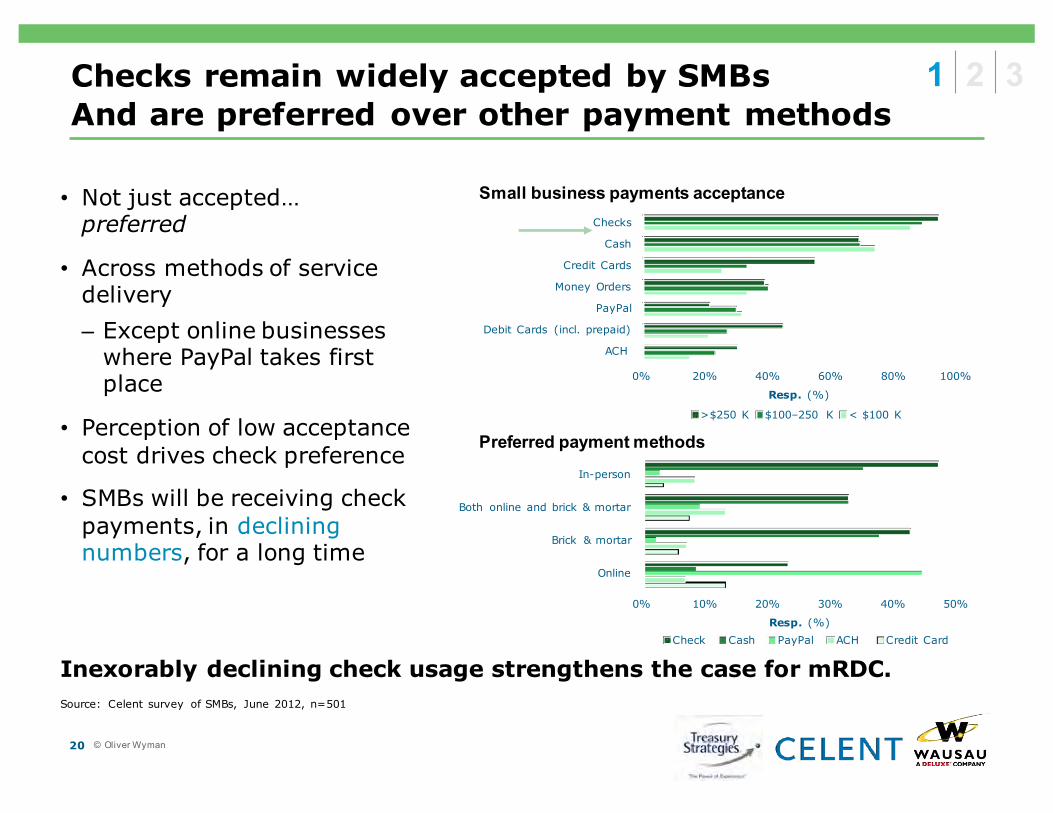
• Not just accepted… preferred
• Across methods of service delivery– Except online businesses
where PayPal takes first place
• Perception of low acceptance cost drives check preference
• SMBs will be receiving check payments, in declining numbers, for a long time
Checks remain widely accepted by SMBsAnd are preferred over other payment methods
20
Preferred payment methods
Small business payments acceptance
1 2 3
0% 20% 40% 60% 80% 100%
ACH
Debit Cards (incl. prepaid)
PayPal
Money Orders
Credit Cards
Cash
Checks
Resp. (%)
>$250 K $100–250 K < $100 K
0% 10% 20% 30% 40% 50%
Online
Brick & mortar
Both online and brick & mortar
In-person
Resp. (%)Check Cash PayPal ACH Credit Card
© Oliver Wyman
Source: Celent survey of SMBs, June 2012, n=501

Check deposits produce many branch visits –a growing number of banks seek to reduce
21
• Size of business correlates to deposit frequency– More revenue often, but not
always means more checks– And greater eagerness to
deposit, leading to more frequent branch visits
• Most small businesses deposit several times per week– Except the <$100 K segment
who, on avg. deposit once per week or less
Small business bank deposit frequency
2%
9%
16%
16%
38%
36%
34%
29%
29%
48%
25%
19%
0% 10% 20% 30% 40% 50% 60%
< $100 K
$100–250 K
>$250 K
Resp. (%)
Less than once per weekOnce per weekTwo to three times per weekDaily – Four or five working days per week
© Oliver Wyman
Source: Celent survey of SMBs, June 2012, n=501
1 2 3

Most SMB deposits contain just a few itemsDesktop RDC products simply aren’t a good fit
22
• Desktop RDC products are a good fit for many businesses, but– Are overkill for the rest– Cost too much– Viewed as complex by branch
staff• Business mRDC could ideally
serve the majority of SMBs, particularly if the product was:– Something easy and cost-
effective to deploy– Straightforward to
demonstrate in the branch– Yet, easily upgraded, when
desired, to accommodate higher check volumes
4%
10%
80%
10%
15%
69%
28%
20%
51%
0% 20% 40% 60% 80% 100%
More than 10
6 to 10
1 to 5
Resp. (%)
>$250 K $100–250 K < $100 K
Small business checks per deposit
© Oliver Wyman
Source: Celent survey of SMBs, June 2012, n=501
1 2 3
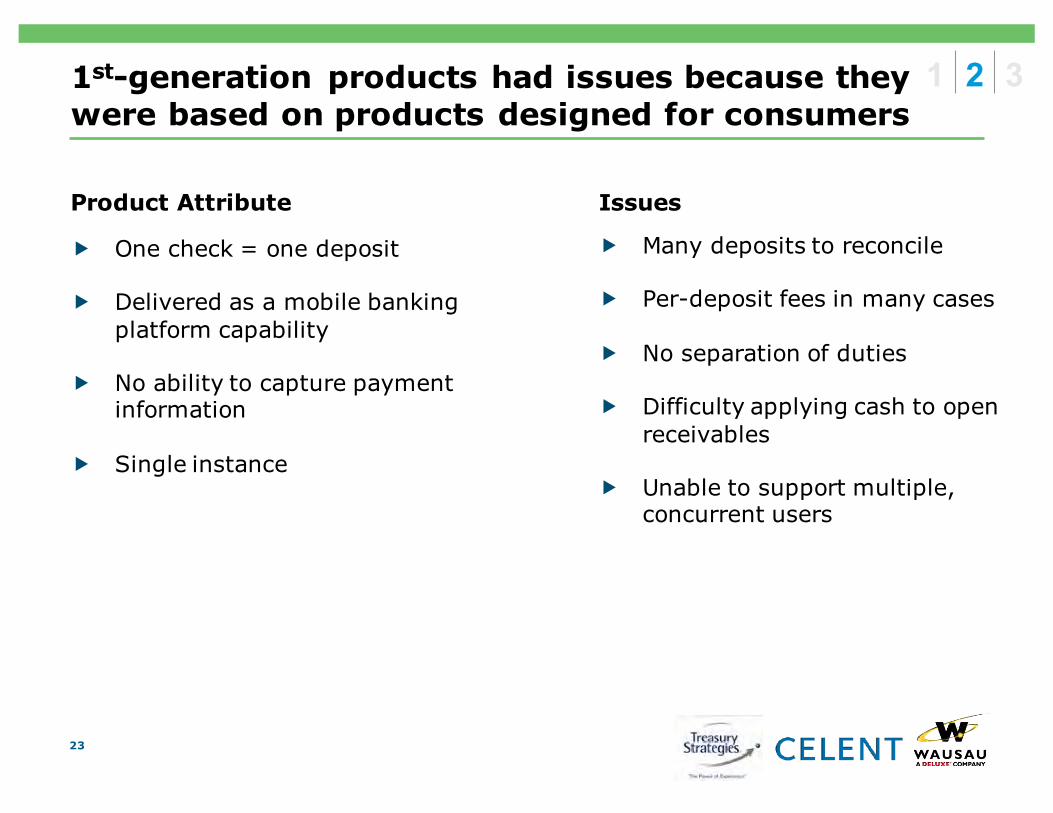
1st-generation products had issues because they were based on products designed for consumers
� One check = one deposit
� Delivered as a mobile banking platform capability
� No ability to capture payment information
� Single instance
23
Issues
� Many deposits to reconcile
� Per-deposit fees in many cases
� No separation of duties
� Difficulty applying cash to open receivables
� Unable to support multiple, concurrent users
Product Attribute
1 2 3

Remote lockbox capture is the next new thing –particularly for smaller banks
� Smaller banks are playing catch-up in offering remote lockbox capture
� Most do so with a separate RDC platform– One for “traditional”
desktop RDC
– WLBX platform vendor for remote lockbox capture
� At present, virtually all these solutions use desktop scanners
24
50%
83%
38%
8%
6%
8%
6%
0% 20% 40% 60% 80% 100%
Banks <$100b
Banks >$100b
In production Planning to offer Considering No plans
69%
19%
13%
27%
9%
55%
0% 20% 40% 60% 80%
We use a single RDC platform, offered separately from lockbox
We use a single RDC platform, with optional integration with lockbox
We use an RDC platform for desktop deposits and our lockbox platform for
remote lockbox capture
Resp. (%)
Banks >$100b Banks <$100b
Remote lockbox adoption
RDC architecture for remittance capture
1 2 3
Source: Celent survey of US banks, September 2014, n=43
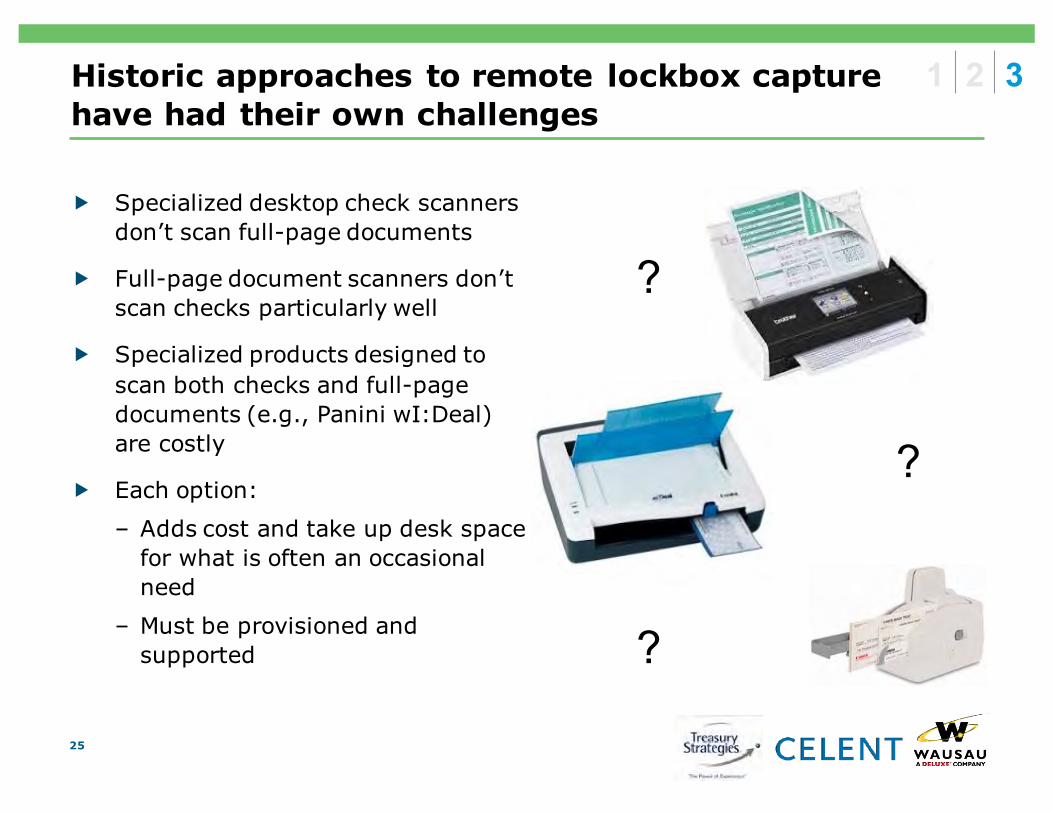
Historic approaches to remote lockbox capturehave had their own challenges
� Specialized desktop check scanners don’t scan full-page documents
� Full-page document scanners don’t scan checks particularly well
� Specialized products designed to scan both checks and full-page documents (e.g., Panini wI:Deal) are costly
� Each option:
– Adds cost and take up desk space for what is often an occasional need
– Must be provisioned and supported
25
?
?
?
1 2 3
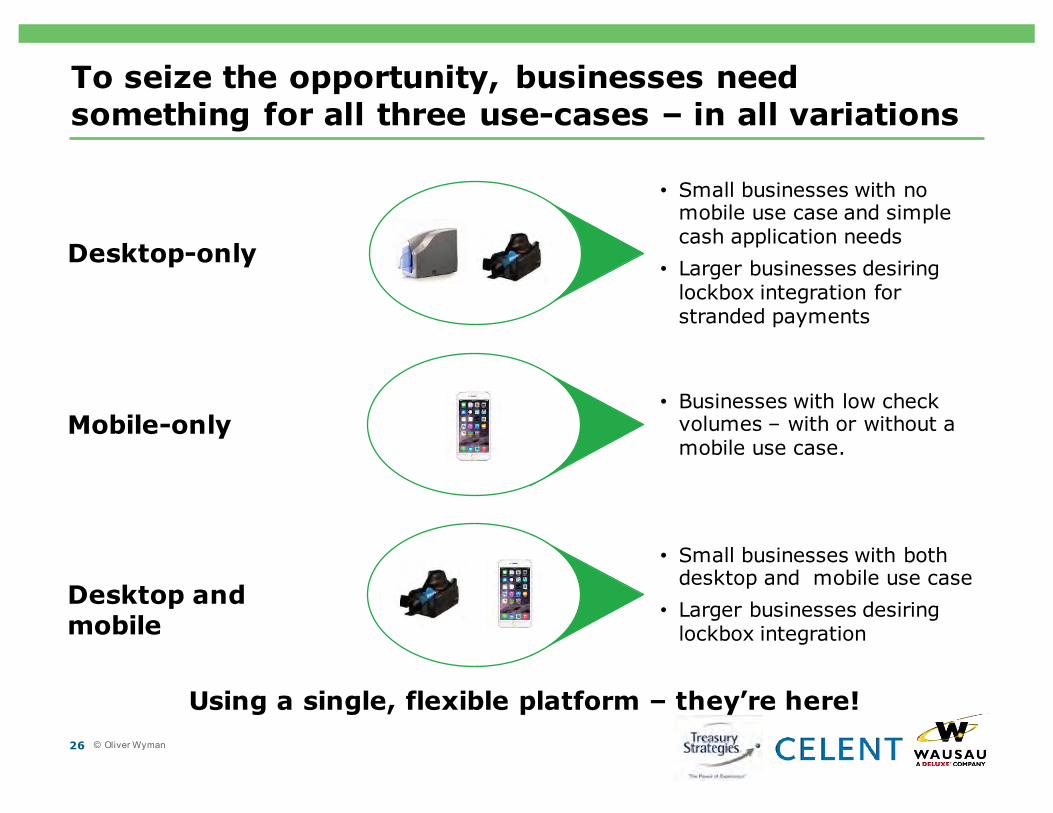
To seize the opportunity, businesses need something for all three use-cases – in all variations
26
Using a single, flexible platform – they’re here!
• Businesses with low check volumes – with or without a mobile use case.
Mobile-only
• Small businesses with both desktop and mobile use case
• Larger businesses desiring lockbox integration
Desktop and mobile
• Small businesses with no mobile use case and simple cash application needs
• Larger businesses desiring lockbox integration for stranded payments
Desktop-only
© Oliver Wyman
Business Mobile RDC: What’s the Value and for Who?
27
What’s the Value to a Financial Institution?
28
� Gain SB market share– Approximately 5.7 million businesses in U.S.
� Create “stickiness”– Increase the SB relationship term
� Create revenue– Mobile deposit and payment related fees
� Reduce costs– Branch processing, branch redesign
– Costs associated with managing reports, research, AR files, etc.
� Common administration, configuration and Risk Monitoring– The same tools for Business Mobile and Desktop RDC
– Highly configurable
What’s the Value to the Small Business?
29
� Costs– No check scanner required– Single deposit or payment with multiple items
� Caters to their needs– Many different use cases
� Faster deposits and payments processing– Alleviate time consuming trips to the branch– Later cutoff times
� Flexibility– On-demand reporting, research and AR files
WAUSAU’s Business Mobile Solution Values
� Highly configurable– Meet your specific customer or vertical market needs
� Combines the benefits of Desktop RDC with Mobile RDC– Common configurable hard and soft limits– Common reporting
– Common research– Common administration configuration, security and risk tools
� Capture checks and payment items
� Integrated with lockbox solutions
� Available as an both In-house or an ASP solution
30 Confidential - BBVA Compass / WAUSAU - Partnership Review - January 2016
Question #2
� What business verticals do you plan to offer business mobile RDC to?A. Distribution
B. Education
C. Financial Services
D. Food and Beverages
E. Government
F. Healthcare
G. Insurance
H. Property Management
I. Other
31

Mobile Distribution Payment & Invoice Capture
32
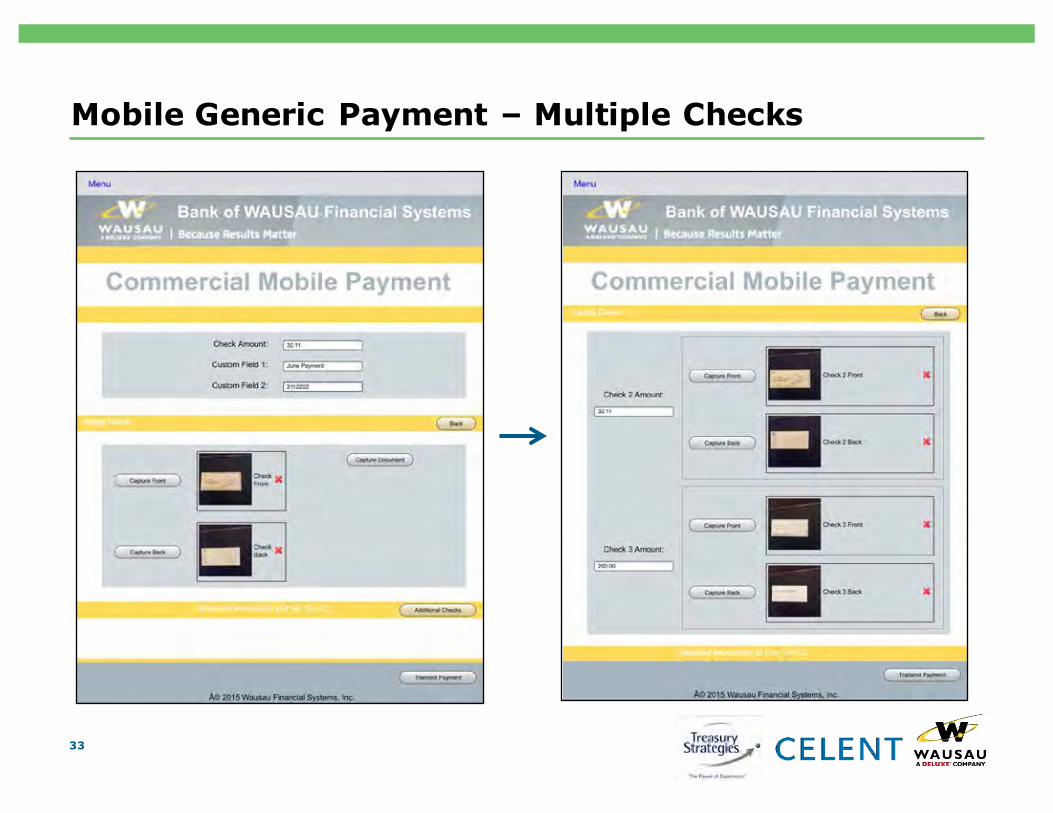
Mobile Generic Payment – Multiple Checks
33

Consumer vs. Business Mobile
34
Question #3
� Are you interested in more information on Business Mobile RDC from WAUSAU?A. Yes
B. No
35
Questions?
For more information on WAUSAU’s Business Mobile RDC solution or to schedule an appointment, please contact:
John [email protected](866) 280-1426
36
About Treasury Strategies
37
www.TreasuryStrategies.com/content/networking-communities
@TreasuryStrat
Accreditations
Connect with Us
LocationsChicago • London • New York
www.youtube.com/c/treasurystrategiesincconsulting
Who We AreTreasury Strategies, Inc. is the leading treasury consulting firm working with corporations and financial services providers. Our experience and thought leadership in treasury management, working capital management, liquidity and payments, combined with our comprehensive view of the market, rewards you with a unique perspective, unparalleled insights and actionable solutions.
What We DoCorporationsWe help you maximize worldwide treasury performance and navigate regulatory and payment system changes through a focus on best practices, technology, liquidity and controls.
Treasury TechnologyWe provide guidance through every step of the technology process – which includes creating a roadmap, selection, implementation and optimization. Our expert approach will uncover opportunities to optimize the value of your treasury through fully integrated technology solutions.
Financial ServicesOur experience, analytic approach and benchmarks provide unique consulting solutions to help you strengthen and grow your business.
About Celent
38
We Are
…the industry’s premier provider of…• Business and IT strategy research
• Ongoing research and advisory services
• Vertically-oriented consulting• Global, domain specific events and
leadership forums
…an experienced presence in financial services
• Staffed by financial services industry experts with over 500 years of combined experience
• 50+ full time analysts devoted to financial services
• Clients include 50 of global top 100 financial institutions
• Centres of excellence across Capital Markets, Finance & Risk, Wealth Management, Banking and Insurance
…also focused on cross practice themes
…a division of Oliver Wyman
• Global financial services consultancy
• 1,400 consultants, offices in 40 countries
• Domain experts throughout financial services, mirroring Celent’s coverage almost perfectly
…a truly global firm
• Offices in North America, Europe and Asia
• Reports in English, French, Japanese, Mandarin, and more
• Coverage that spans many geographies
Innovation and Emerging Technology
Legacy and Ecosystem
Transformation
Digital

About WAUSAU Financial Systems
39
Who We AreWAUSAU, a Deluxe Corporation company, is a catalyst for results. Partnering with industry-leading financial institutions and corporations to reduce cost and strengthen their competitive market position, WAUSAU is recognized for consistently delivering best-of-class financial technology, services and solutions that integrate receivables, accelerate deposits and payments, and eliminate paper. To meet clients’ needs, WAUSAU offers flexible delivery options– whether installed in-house, outsourced, co-sourced or in the cloud.
What We DoWAUSAU is recognized for consistently delivering best-of-breed financial technology, services and solutions. We are focused on being the very best at:
Integrating Receivables:to speed cash flow and support real-time business decisions
Eliminating Paper:by digitizing workflow to enhance the customer experience, reduce risks and cut costs
Accelerating deposits and payments:securely and across multiple channels, we improve retention, increase revenue and reduce costs.
WAUSAU’s Market Leadership
� #1 Retail and Wholesale Lockbox platforms
� 150,000+ RDC seats, largest non-core provider
� 400M+ yearly outsourced transactions
Thousands of organizations rely on WAUSAU solutions:
� 4 telecommunications companies serving 260M customers,
� 29 utilities serving more than 50M customers
� 20 government agencies serving 70M constituents
� 17 insurers serving more than 100M customers
� 20 of the top 25 U.S. Banks…
and more than a dozen alliance partners who resell WAUSAU
40
Recommended