AERODYNAMIC PRINCIPLES OF GOLF BALLS: AN ALTERNATIVE TO THE EXTERIOR
DESIGN OF HEAVY VEHICLES
Daniela Alejandra Plascencia Jiménez, Joel Carlos Huegel West, Armando Román Flores
Tecnológico de Monterrey Campus Guadalajara
Av. General Ramón Corona No.2514. Col. Nuevo México CP 45201. Zapopan, Jalisco, México.
Teléfono: 52 (33) 3669 3000
RESUMEN.
La ineficiencia en el consumo de combustible de
los vehículos pesados contribuye
significativamente al costo financiero y ambiental
al transportar bienes. El propósito de esta trabajo
fue investigar el efecto de la resistencia
aerodinámica de vehículos pesados con una
carrocería cubierta hoyuelos similares a los de
una pelota de golf, y analizar la mejora de la
aerodinámica al retrasar la separación de las
capas laminares del aire. La hipótesis evaluada
propone que la superficie con hoyuelos podría
disminuir la resistencia aerodinámica de los
vehículos pesados, y así, mejorar su rendimiento
de combustible. Para lograr los objetivos, la
carrocería del vehículo fue rediseñada
implementando la superficie con hoyuelos. El
proyecto fue desarrollado en tres fases: 1) Diseño
del prototipo usando la plataforma de diseño
SolidWorks 2) Probar las fuerzas aerodinámicas
que actúan en el prototipo, a través de
simulaciones por computadora y dentro de un
túnel de viento 3) Análisis de la información para
verificar la eficiencia del prototipo. Se encontró
que, al ser aplicados los hoyuelos, la carrocería
presenta una disminución en la resistencia
aerodinámica del 27.98%, y a su vez, en el
consumo de combustible, disminuyéndolo un
22.7%, siendo dichos resultados, un respaldo de
la hipótesis.
ABSTRACT.
The fuel inefficiency of heavy vehicles,
contributes significantly to the financial and
environmental cost of transporting goods. The
purpose of this research is to analyze the reduction
of the drag of heavy vehicles by applying the
dimpled surface design of golf balls over the
bodywork, which improves aerodynamics by
delaying separation of the air boundary layer. The
hypothesis was that the dimpled surface would
decrease drag on heavy vehicles and improve their
fuel performance. To achieve this, the heavy
vehicle bodywork was redesigned implementing
the dimpled surface of golf balls to improve the
performance of fuel used in a traveled distance.
The project was developed in three phases: 1)
Design of the prototype, which was performed
using the SolidWorks design platform 2) Test of
the prototype’s aerodynamics through both
computer simulations and wind tunnel tests, and
3) Analysis of data to verify the efficiency of the
prototype. It was found that the redesigned body
decreases aerodynamic drag by 27.98% and
improved fuel efficiency by 22.7% percent, thus
supporting the hypothesis.
INTRODUCTION
Oil consumption is growing faster than the
production. Currently, the world is crossing
through an era where the consumption of oil has
been bigger than the production since 1982, where
510 thousand barrels of oil were consumed over
the total production of that year, and by 2011 there
was an over demand of 4459 thousands more
barrels than what was produced. Price also has to
be considered since it is fluctuating in a range
from eighty dollars per barrel to over a hundred
dollars per barrel (British Petroleum, 2012). This
problem coupled to a low responsible
consumption and international adjustments,
directly affects the economy of motorists, carriers
and the transport industry; therefore, it is
necessary to pursuit the way to develop more
responsible vehicles that have a better fuel
economy.
Diverse industries use heavy vehicles for
transporting products to different regions,
covering both local distribution and exportation.
MEMORIAS DEL XIX CONGRESO INTERNACIONAL ANUAL DE LA SOMIM 25 al 27 DE SEPTIEMBRE, 2013 PACHUCA, HIDALGO, MÉXICO
ISBN 978-607-95309-9-0 Página | 1 Derechos Reservados © 2013, SOMIM
Being central part of the trade, the optimization in
the design of heavy vehicles has focused in
improving fuel economy. According to the Union
of Concerned Scientists (UCS), the improvement
of the aerodynamic properties of any heavy
vehicle could be the key in enhancing the fuel
efficiency of these vehicles. Several aerodynamic
technologies and add-on devices help to improve
the efficiency by changing the airflow in a useful
and less resistant current. These components
include side skirts, rear fairings, and parabolic-
shaped noses. As stated in the article “Fuel
efficiency: aerodynamic components” from the
Fleet Equipment Magazine, aerodynamic add-ons
could represent a 6% improvement in the fuel
consumption. (Skydell, 2009). To evaluate the
aerodynamic drag of the vehicle, one must know
the contribution of each designed component of
the truck (Izquierdo de Francisco, 2012).
70% frontal area
20% rear area
10% surface friction over the entire body
This work proposes working on changes at an
external level, working with the bodywork to
reduce the aerodynamic drag forces. It is proposed
to apply the exterior design of golf balls over the
bodywork of the vehicle and evaluate its impact in
the fuel economy of heavy vehicles.
To evaluate a golf balls’ drag, one must imagine
laminar layers of air near the surface of the ball as
it moves through the current. Before any contact
with an object, in this case the ball, air is flowing
in a streamed pattern (laminar flow). Only when
airs comes within a short distance from the object,
it starts to separate forming a disturbed pattern
known as turbulent flow. A turbulent flow must be
interpreted depending on the characteristics of the
body. A turbulent flow can be defined as a stream
of any fluid which particles move in different
directions regarding the main path of the fluid.
In most of the cases, a turbulent flow means a
separation of the air’s boundary layer, which
creates a low-pressure area. This area indicates
that the mass of air trailing the body is
experiencing a change. Despite being an opposite
reaction in almost every body, golf balls use this
principle as a benefit to move further than smooth
balls.
Dimples over golf balls’ surface modify the
airflow so that the air can travel around the ball.
The phenomenon that occurs within the dimples is
that they reduce drag forces by creating a rippling
effect as the air, when having contact with the
ball’s surface, tends to slow down the adjacent
boundary layer, which tends to slow down the
other ones. What rough surfaces in golf balls do is
to “decrease the amount of air having its
momentum changed, reducing the size of the low
pressure difference between the front and the back
of the ball.” (Zumerchik, 2002)
Aerodynamics
There are two aerodynamic forces that affect the
movement of a golf ball through the air: lift and
drag. The negative or retarding force, known as
drag, is opposite to the ball’s flight; on the other
hand, lift is perpendicular to drag and, in general,
is the force that elevates the ball. As an opposing
force, drag shortens the flight of the ball and
slows it down.
Aerodynamic is defined as “the branch of sciences
which studies air properties and other gases while
moving, as well as the interaction between gases
and objects moving through them” (OED Online,
2012). Aerodynamic is obtained depending on the
resistance force that an object experiences when
passing through a fluid, in this case, air. This
phenomena is called drag force (Benson, 2010),
and it is defined by
𝐹𝑑 =1
2𝐶𝑑𝜌𝐴𝑉2 [N] (1)
Where Fd represents the drag force [N], ρ the fluid
density [𝑘𝑔
𝑚3], V the fluid velocity [𝑚
𝑠], A the
reference area [m2], and Cd is the drag coefficient:
a dimensionless number that represents the
relation between complex variables like density,
velocity, fluid viscosity, air compressibility, and
size, shape and tilt of a body. These variables are
defined through wind tunnel trial or computer
simulations. Commercial trucks have drag
coefficients between 0.55 and 0.75 (Izquierdo de
Francisco, 2012)
To overcome aerodynamic forces, any vehicle
must use different quantities of power depending
on the drag forces generated over it. Power can be
defined as the rate or speed at which a work is
performed (Oxford, 2013). When a force is
exerted continuously over a body moving at a
constant velocity, power is equal to the force times
velocity.
MEMORIAS DEL XIX CONGRESO INTERNACIONAL ANUAL DE LA SOMIM 25 al 27 DE SEPTIEMBRE, 2013 PACHUCA, HIDALGO, MÉXICO
ISBN 978-607-95309-9-0 Página | 2 Derechos Reservados © 2013, SOMIM
𝑃𝐷 = 𝐹𝑑𝑉 ⇒ 𝑃𝐷 = 𝑁𝑚
𝑠= 𝑤𝑎𝑡𝑡𝑠 =
𝐶𝑣
735 (2)
Where PD is the power required to overcome drag,
V represents the velocity[𝑚
𝑠], and Cv the power
unity (the needed power to lift vertically 75 kg-
force at a velocity of 1 𝑚
𝑠). Its equivalences are the
HP (1 cv = 0.986 HP) and the Watt (1 cv = 735 W)
(Izquiero de Francisco, 2012).
Knowing both, aerodynamic forces and the power
needed to overcome drag, the next step is to
evaluate fuel consumption per each Cv, or in this
case, HP. Within the calculations of fuel
consumption per hour, one must consider power,
specific consumption (be) and the motor’s amount
of effort (Alvarado, 2004). In general, a diesel
motor has a specific fuel consumption of 0.33
l/HPh. Also, most of the trucks HP number is
around 420. Fuel consumption is defined by,
𝐶𝑜𝑛𝑠𝑢𝑚𝑝𝑡𝑖𝑜𝑛 = 𝑃𝐷 ∙ 𝑏𝑒 ∙ % 𝑜𝑓 𝑒𝑓𝑓𝑜𝑟𝑡[𝑙
ℎ𝑟] (3)
In addition to weight, a factor which affects the
fuel consumption is aerodynamics. As mentioned
before, reducing the aerodynamic drag of heavy
vehicles, fuel consumption will be more
effective(Marchese & Golato, 2011). The relation
between aerodynamics forces and fuel
consumption is defined by this equation:
𝐵 = 𝑃𝐷𝑏𝑒 [𝑘𝑔
ℎ] (4)
where B is the amount of fuel required per unit of
time covered expressed in 𝑘𝑔
ℎ, PD is the power
required to overcome the resistance forces in kW.
In this case there would be considered not only
aerodynamic drag (Fd), but also the road drag
(Rd) and the transmission friction (Tr). It is
determined by the equation,
𝑃𝐷 = (𝐹𝑑 + 𝑅𝑑 + 𝑇𝑟)(𝑉)(10−3) [𝑘𝑊]
be, is the specific fuel consumption to counter the
PD. This number is determined by each motor. In
general it goes from 0.38 to 0.25 [kg/kWh]
METHODS AND MATERIALS
During Stage 1, the project was in its very
beginning, so the first that was done was to design
the model of the truck where the experimental
process would be applied and results would be
obtained.
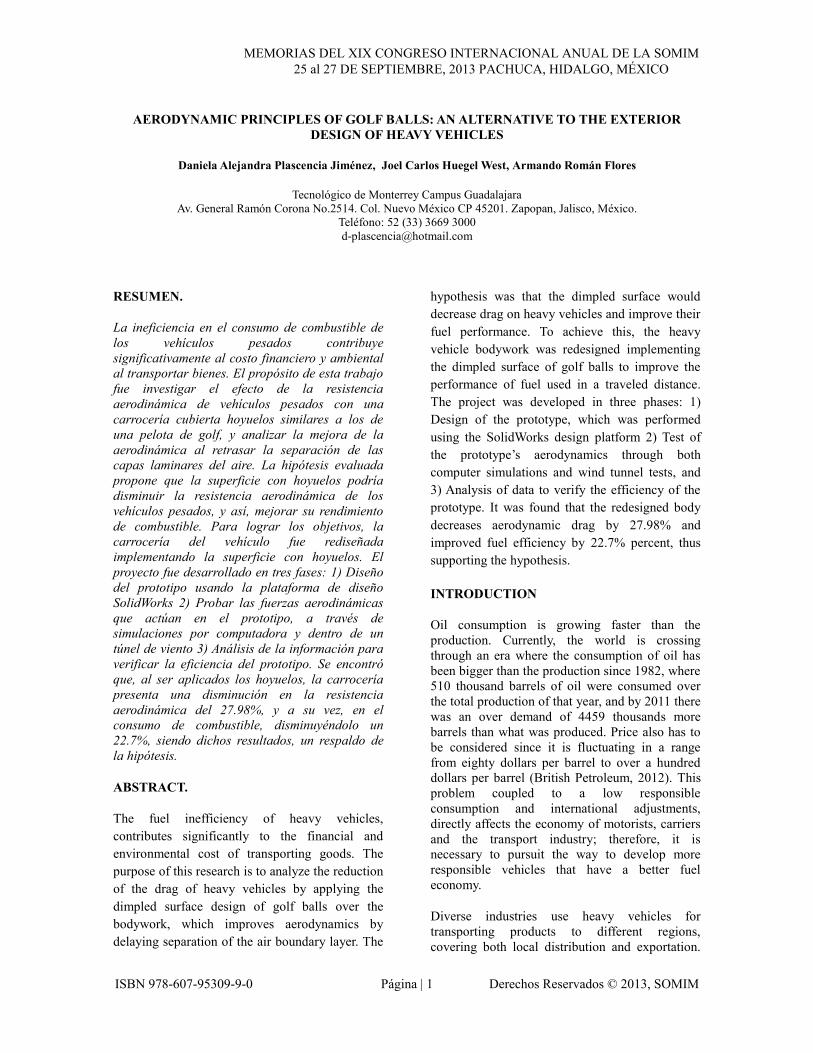
The model was built on SolidWorks which is a
software that allows the user to model different
bodies in a virtual environment, so that the
process of drawing and building could be easier
for designers. SolidWorks also includes a wide
variety of simulation complements, where tension,
materials, flow, etc., can be tested. In this case,
SolidWorks was used to design the truck and test
it into the SolidWorks Flow Simulation. The truck
was designed approximating the measures to a
real truck, as shown in Figure 1. Both dimpled and
non-dimpled trucks were based on this design, so
that the results could be more accurate. The only
difference between trucks was the dimples.
The conditions to make the dimples were
determined by trial and error using different sizes
and positions to put them, but when the project
had sufficient information, a mathematical model
was used in order to optimize the results finding
the best combination. There were 30 different
models that combined the variables in order to
obtain the lowest drag.
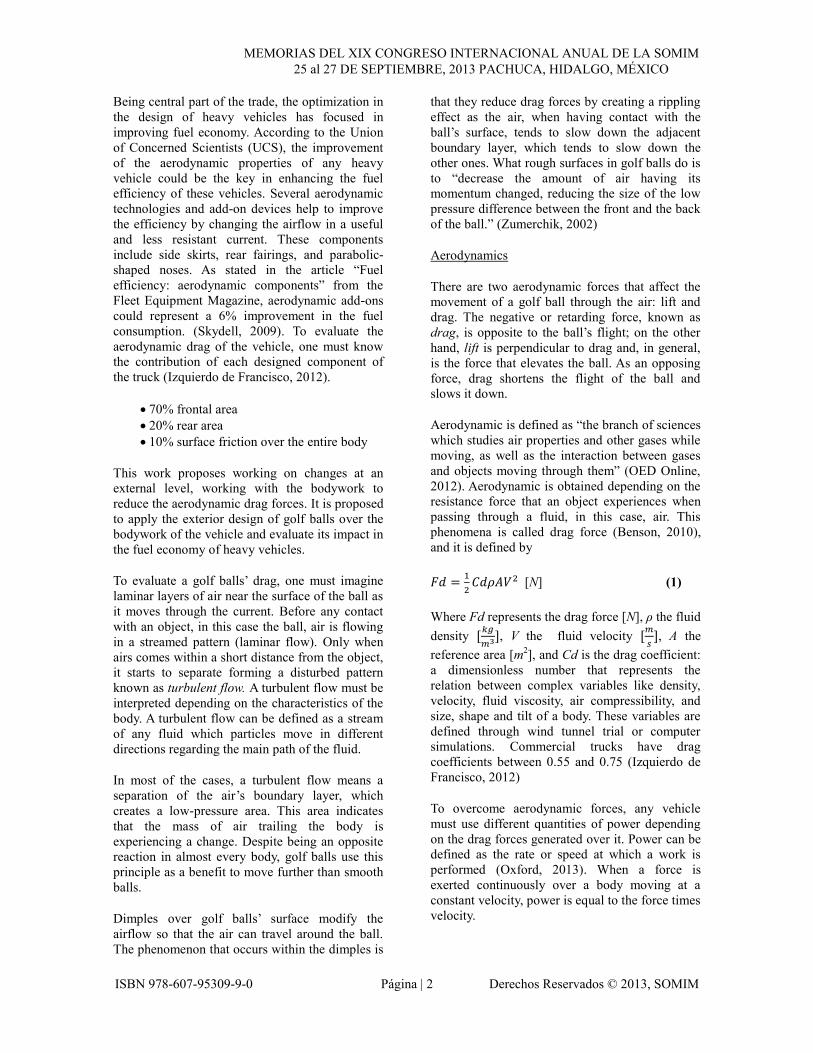
Table 1 shows how the experimental process was
and how the variables, like the radius of the
dimple and the area over which dimples were
placed, were used.
Figure 1. Basic design of the truck; base of all the
experimental process.
3152.20 mm
2595.17 mm 4086.56 mm
MEMORIAS DEL XIX CONGRESO INTERNACIONAL ANUAL DE LA SOMIM 25 al 27 DE SEPTIEMBRE, 2013 PACHUCA, HIDALGO, MÉXICO
ISBN 978-607-95309-9-0 Página | 3 Derechos Reservados © 2013, SOMIM
Table 1. Considered variables to build the model.
This table shows values that were applied over a
normal size truck, so they changed when the
model was scaled. The criteria to evaluate each
model was to put them into the SolidWorks Flow
Simulation, with an air velocity of 6.5m/s, and a
scale of 1:12 was applied since the printed model
would be that small. These properties were put in
the model in order to accurate the results to those
that could be obtained with the wind tunnel test.
Stage 2 comprehends all the flow simulations
using SolidWorks to obtain different values of
both drag force and drag coefficient. In order to
get the right model, each design of the truck was
tested to obtain its Fd and Cd. The value of Fd
from the non-dimpled truck was 21.76 N, in
comparison with the best model that had a drag
force of 21.55 N, so it was selected to be printed
since it has an improvement of 0.96%, making it
the best and optimized option using the
SolidWorks Flow Simulation.
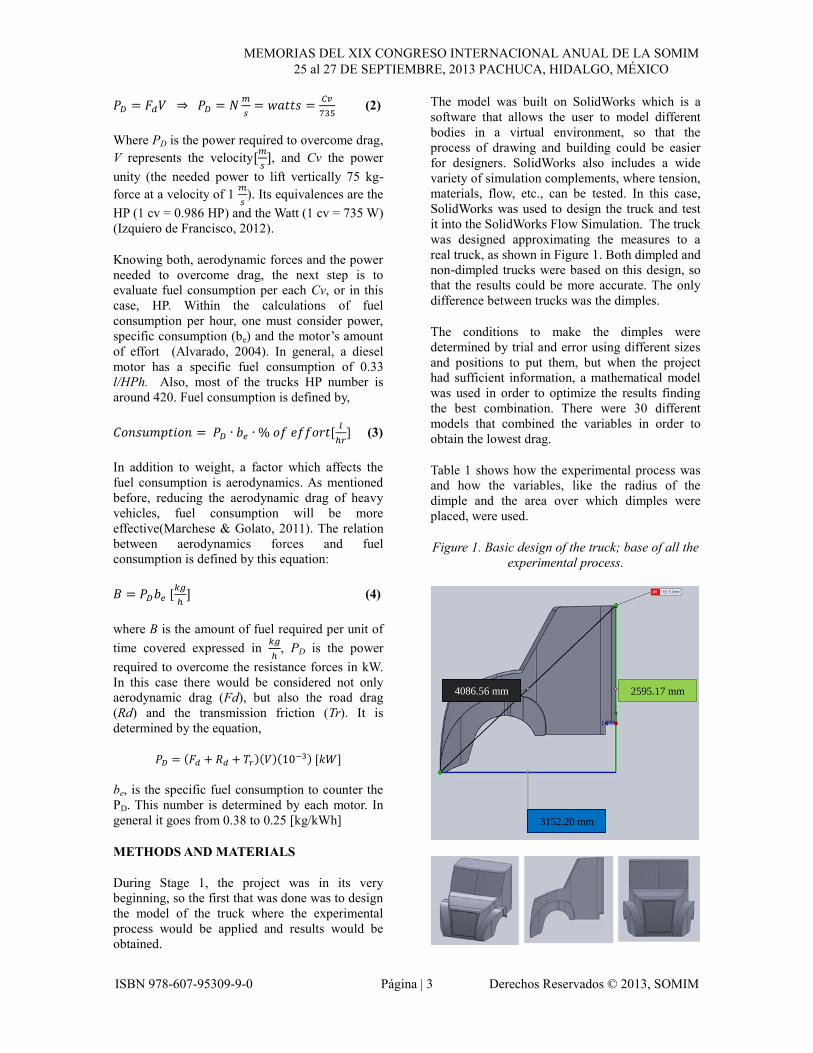
All thirty models were proved, and the best results
had a unique combination of variables. The
models with the lowest drag force were those who
had 4 cm diameter dimples over the fenders, so
the printed model was “CAB8”.
Figure 2. Model that has shown the minimum drag
force in SolidWorks Flow Simulation.
Stage 3 is the part of the experimental process
where the results of the SolidWorks Flow
Simulation would have a support in a test that
approaches results to a real life situation. The
wind tunnel test measures the angle of
displacement from a steady position of a certain
body when a controlled stream is flowing in a
perpendicular way towards the object. In order to
obtain the drag force and drag coefficient, it must
be considered the angle of displacement from a
vertical mark regarding the center of mass of the
body, so the equation of Fd and Cd has a little
change.
𝐹𝑑 = 𝑚𝑔𝑡𝑎𝑛(𝜃) [𝑁]
𝐶𝑑 =𝐹𝑑
𝜌𝐴𝑉2
Wind tunnel test results were wrote down and
analyzed using previous equations. Results of the
test are shown in the Figure 3.
CAB 0 NO - -
CAB1 YES CEILING 5
CAB2 YES CEILING 4
CAB3 YES CEILING 3
CAB4 YES CEILING 2
CAB5 YES CEILING 1
CAB6 YES CEILING 0.5
CAB7 YES FENDER 5
CAB8 YES FENDER 4
CAB9 YES FENDER 3
CAB10 YES FENDER 2
CAB11 YES FENDER 1
CAB12 YES FENDER 0.5
CAB13 YES FENDER AND CEILING 5
CAB14 YES FENDER AND CEILING 4
CAB15 YES FENDER AND CEILING 3
CAB16 YES FENDER AND CEILING 2
CAB17 YES FENDER AND CEILING 1
CAB18 YES FENDER AND CEILING 0.5
CAB19 YES HOOD 5
CAB20 YES HOOD 4
CAB21 YES HOOD 3
CAB22 YES HOOD 2
CAB23 YES HOOD 1
CAB24 YES HOOD 0.5
CAB25 YES HOOD AND FENDER 5
CAB26 YES HOOD AND FENDER 4
CAB27 YES HOOD AND FENDER 3
CAB28 YES HOOD AND FENDER 2
CAB29 YES HOOD AND FENDER 1
CAB30 YES HOOD AND FENDER 0.5
DIMPLED DIMPLED AREA RADIUS OF THE DIMPLE (cm)
Cab 8
MEMORIAS DEL XIX CONGRESO INTERNACIONAL ANUAL DE LA SOMIM 25 al 27 DE SEPTIEMBRE, 2013 PACHUCA, HIDALGO, MÉXICO
ISBN 978-607-95309-9-0 Página | 4 Derechos Reservados © 2013, SOMIM
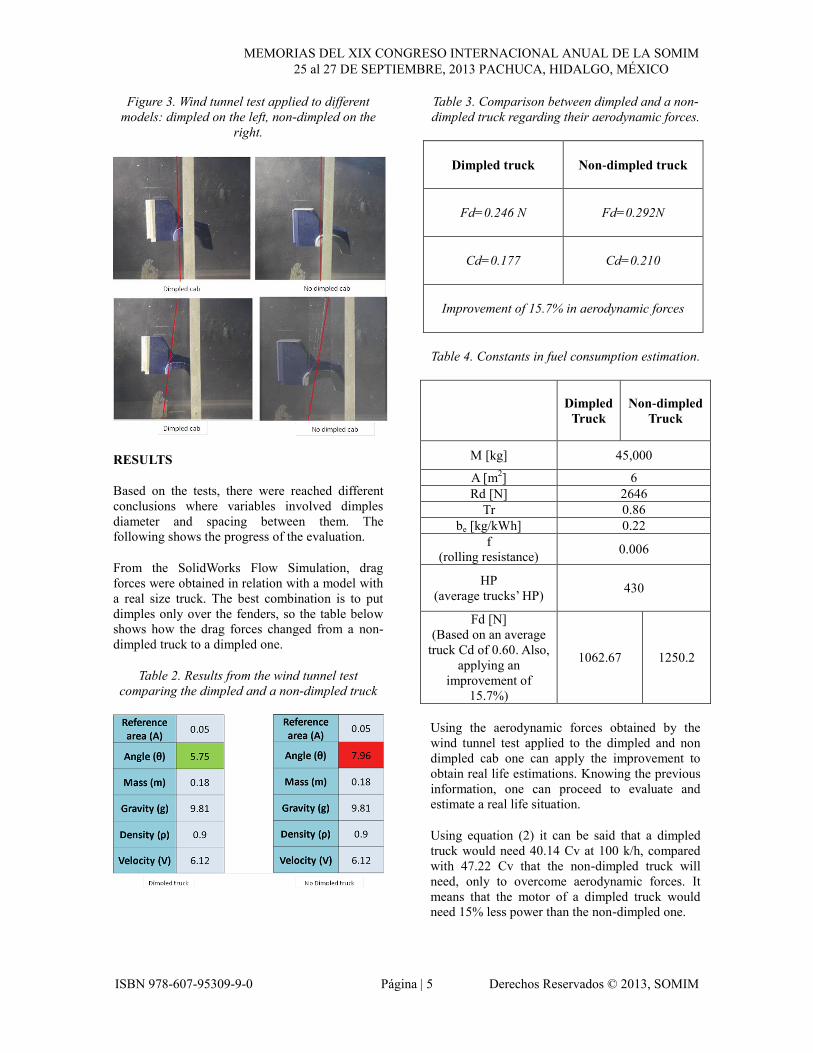
Figure 3. Wind tunnel test applied to different
models: dimpled on the left, non-dimpled on the
right.
RESULTS
Based on the tests, there were reached different
conclusions where variables involved dimples
diameter and spacing between them. The
following shows the progress of the evaluation.
From the SolidWorks Flow Simulation, drag
forces were obtained in relation with a model with
a real size truck. The best combination is to put
dimples only over the fenders, so the table below
shows how the drag forces changed from a non-
dimpled truck to a dimpled one.
Table 2. Results from the wind tunnel test
comparing the dimpled and a non-dimpled truck
Table 3. Comparison between dimpled and a non-
dimpled truck regarding their aerodynamic forces.
Dimpled truck Non-dimpled truck
Fd=0.246 N Fd=0.292N
Cd=0.177 Cd=0.210
Improvement of 15.7% in aerodynamic forces
Table 4. Constants in fuel consumption estimation.
Dimpled
Truck
Non-dimpled
Truck
M [kg] 45,000
A [m2] 6
Rd [N] 2646
Tr 0.86
be [kg/kWh] 0.22
f
(rolling resistance) 0.006
HP
(average trucks’ HP) 430
Fd [N]
(Based on an average
truck Cd of 0.60. Also,
applying an
improvement of
15.7%)
1062.67 1250.2
Using the aerodynamic forces obtained by the
wind tunnel test applied to the dimpled and non
dimpled cab one can apply the improvement to
obtain real life estimations. Knowing the previous
information, one can proceed to evaluate and
estimate a real life situation.
Using equation (2) it can be said that a dimpled
truck would need 40.14 Cv at 100 k/h, compared
with 47.22 Cv that the non-dimpled truck will
need, only to overcome aerodynamic forces. It
means that the motor of a dimpled truck would
need 15% less power than the non-dimpled one.
MEMORIAS DEL XIX CONGRESO INTERNACIONAL ANUAL DE LA SOMIM 25 al 27 DE SEPTIEMBRE, 2013 PACHUCA, HIDALGO, MÉXICO
ISBN 978-607-95309-9-0 Página | 5 Derechos Reservados © 2013, SOMIM
In terms of fuel consumption to overcome the
aerodynamic forces, a motor with maximum
power of 430 HP, and considering that it would
only use 9.2% of its HP to counter drag forces
(since it would only need to generate around 45
Cv), the fuel consumption per hour would be 0.80
l/h (non-dimpled) and 1.11 l/h (dimpled).
Now, the total fuel consumption, considering drag
forces, transmission friction, rolling resistance and
road drag, would be 7.64 kg/h or 9.21 l/h (non-
dimpled) and 6.49 kg/h or 7.82 l/h (dimpled).
When theory is applied, the consumption of each
truck (dimpled and not) can be measured knowing
previous data. The reduction of the consumption is
due to low drag forces since they are considered to
do the calculations.
CONCLUSIONS & DISCUSIONS
The results obtained confirmed that the
aerodynamics of heavy vehicles can be improved
by modifying front surfaces. Heavy vehicles with
dimpled surfaces have the least resistance forces,
and consequently, lower aerodynamic coefficients.
Based on the data obtained throughout the
experimental process, the resistance force can be
decreased by up to 15.7% if dimpled surface were
applied, which can also have a positive effects
directly on fuel consumption.
The tests also show that dimples work better when
applying them over curved surfaces. The
phenomenon that it is produced by the fenders
with dimples is similar to the one over the golf
balls, where a high-pressure area behind the
fenders when dimples are applied that result in
less drag in the back of this part.
Since the drag force equation only considers the
frontal area as the reference area, most of the
modifications within the ceiling and the hood do
not affect the results in a positive way or even
affect. This happens since the shape does not
permit the air to form a curve and makes it
dissipates. What this premise suggests is that the
aerodynamic principle could be optimized when
applying it over rounded surfaces, like fenders or
air deflectors.
One of the main objectives of the project was to
reduce fuel consumption. The tests conducted in a
controlled environment show that fuel efficiency
in dimpled heavy vehicles has a consumption of
22.7% less fuel than normal trucks. In general, a
normal truck consumes roughly 4.5 km/l. If the
fuel consumption can be decreased in 22.7% from
a normal truck, in theory a dimpled truck would
lead to a performance of 5.5 km/l.
This project lays out the foundation of future
research that should be conducted to confirm the
results. Tests on larger prototypes and higher
velocities can verify that the use of dimple
surfaces can reduce the drag forces and therefore
improve the aerodynamics of heavy vehicles.
REFERENCES
(1) Alvarado Chaves, Armando Eliécer. 2004.
Maquinaria y mecanización agrícola. San
José, C.R.: EUNED.
(2) Benson, Tom, NASA. 2010. Shape Effects on
Drag. NASA.
http://www.grc.nasa.gov/WWW/k-
12/airplane/shaped.html (May 29, 2012).
(3) Izquierdo de Francisco, Alejandro. University
of Valladolid. Feb 14, 2012. “Ingeniería de
fluidos y equipos térmicos”
https://www5.uva.es/guia_docente/uploads/20
12/389/51453/1/Documento5.pdf (Aug 1st,
2013)
(4) McCallen, Rose, et al. 2004. The
Aerodynamics of Heavy Vehicles: Trucks,
Buses, and Trains. Alemania: Springer. (May
29, 2012)
(5) OED Online. March 2012. “aerodynamics,
n.". Oxford University Press. http://0-
www.oed.com.millenium.itesm.mx/view/Entr
y/3159 (June 05, 2012).
(6) Oxford Online. 2013. “power, n.” Oxford
University Press.
http://oxforddictionaries.com/definition/englis
h/power (Aug 2nd, 2013)
(7) Skydel, Seth. 2009. Fuel efficiency:
aerodynamic components". Fleet Equipment,
Feb.. (Aug 1st, 2013)
(8) Zumerchik, John. 2002. Newton on the tee: a
good walk through the science of golf. New
York: Simon & Schuster. (Jun 15, 2012)
MEMORIAS DEL XIX CONGRESO INTERNACIONAL ANUAL DE LA SOMIM 25 al 27 DE SEPTIEMBRE, 2013 PACHUCA, HIDALGO, MÉXICO
ISBN 978-607-95309-9-0 Página | 6 Derechos Reservados © 2013, SOMIM
Recommended


![[Jorge Ramírez Plascencia] Durkheim y Las Represe(BookFi.org)](https://img.pdfslide.tips/doc/110x75/55cf9334550346f57b9cb1f4/jorge-ramirez-plascencia-durkheim-y-las-represebookfiorg.jpg)