Diabetes Research and Clinical Practice, 18 (1992) 99-105
0 1992 Elsevier Science Publishers B.V. All rights reserved 0168-8227/92/$05.00 99
DIABET 00685
Glucagon-glucose (GG) test for the estimation of the insulin reserve in diabetes *
Hiroyuki Miki **, Tatsuo Matsuyama, Shigeki Fujii, Ryoya Komatsu, Yasuko Nishioeda and Teruo Omae
Department of Medicine, National Cardiovascular Center Hospital, Osaka 565, Japan
(Received 12 February 1992) (Accepted 19 June 1992)
Summary
The residual B-cell function was examined by means of the plasma C-peptide response 6 min after a combined injection of glucagon and glucose (GG test) or conventional glucagon test (G test) in four insulin-dependent diabetic patients (IDDM group), in 18 diabetic patients treated with insulin (Insulin group), 3 1 treated with oral hypoglycemic agents (SU group) and 27 treated with diet only (Diet group) and in 22 borderline cases. By GG test, 6-min C-peptide values of the IDDM group were 0.27 k 0.05 nM (n = 4) and were significantly lower than those of the Insulin group (0.89 + 0.09 nM, IZ = 12), the SU group (1.42 k 0.10 nM, n = 13), the Diet group (2.47 + 0.22 nM, n = 11) and the borderline cases (3.38 + 0.22 nM, n = 11). Patients with a 6-min C-peptide concentration below 0.75 nM by GG test appeared to be insulin-requiring patients. In the G test, plasma C-peptide concentrations at 6 min were 0.35 + 0.08 nM in the IDDM group (n = 2), 0.72 k 0.20 nM in the Insulin group (n = 7), 1.08 + 0.09 nM in the SU group (n = 20), 1.40 k 0.19 nM in the Diet group (n = 17) and 2.05 + 0.21 nM in the borderline cases (n = 12). Some of the Diet group patients showed extremely low C-peptide responses. When comparing the GG test and G test in individual cases, a greater C-peptide response was seen with the GG test in all cases except for IDDM patients. Therefore, the GG test may be more accurate in assessing residual B-cell function than the G test.
Key words: Glucagon-glucose test; Glucagon test; Residual B-cell function; C-peptide
Correspondence to: Tatsuo Matsuyama, M.D., Department of Medicine, National Cardiovascular Center Hospital, 5-7-l Fujish- irodai, Suita, Osaka 565, Japan. * Parts of this work were reported in abstract from in Diabetes 38 (Suppl. 2) 175A, 1989. ** Present address: The Second Department of Internal Medicine, Osaka University Medical School, l-l-50 Fukushima, Fukushima-ku, Osaka 553, Japan.
100
Introduction
The residual B-cell function or insulin require- ment is preferably assessed by the plasma C-peptide response after glucagon injections [ 1,2]. However, the insulin secretion induced by glucagon is usually glucose-dependent and B-cell function may be underestimated when the blood glucose is low [ 3,4]. The C-peptide response may be more accurately induced by a combined injec- tion of glucagon and glucose as we employ in perfusion experiments in animals [ 51. The aim of the present study was to evaluate the C-peptide response to a combined injection of glucagon and glucose for the estimation of the residual B-cell function of diabetic patients.
Subjects and Methods
The subjects comprised 80 diabetic patients and 22 borderline cases who were selected at random. Diabetic patients and borderline cases were as- sessed according to the criteria of the Japan Di- abetes Society [ 61, which defines diabetes exactly the same as the WHO criteria but borderline con- sists of impaired glucose tolerance (IGT) by the WHO criteria and individuals with 6.7 mM glu- cose or more at 120 min after 75 g oral glucose. Insulin-dependent diabetic patients (IDDM) were defined clinically. Of the 80 diabetic patients, four were ketosis-prone and treated with insulin within 1 year after diagnosis despite neither obe- sity nor dietary errors. In addition, they were pos- itive for islet cell antibody. The other 76 diabetic patients did not have such signs and were defined as non-insulin-dependent diabetics (NIDDM). The final mode of treatment referred to in this study was established on clinical criteria after a follow-up period of 1 month or more. Diabetic patients treated with diet alone, whose fasting blood glucose was controlled below 8 mM and glucosuria was negative, were classified as the Diet group. If the patients did not fulfill the above criteria with diet alone, diet was supplemented with sulfonylurea. The patients treated with diet
and sulfonylurea, whose fasting blood glucose was controlled below 8 mM, constituted the SU- group. If still not well controlled with almost a
maximal dose of sulfonylurea, the patients were treated with insulin (Insulin group).
The GG test was performed on 40 diabetic pa- tients and 11 borderline cases. Borderline cases consisted of seven IGT and four normal subjects according to the WHO criteria. Of the 40 diabetic patients, four were IDDM patients (IDDM group), 12 were in the Insulin group, 13 in the SU group (five with glibenclamide and eight with gliclazide) and 11 in the Diet group. The G test was carried out on 46 diabetic patients and 12 borderline cases. Borderline cases consisted of eight IGT and four normal according to the WHO criteria. Of the 46 diabetic patients, two were in the IDDM group, seven in the Insulin group, 20 in the SU group (12 with glibenclamide, six with gliclazide, one with acetohexamide and one with chlorpropamide) and 17 in the Diet group. The GG test and the G test were performed on 11 subjects who gave consent for their residual B-cell function to be investigated by both tests. Of the 11 subjects, two were IDDM, seven were NIDDM, one was IGT and one was normal ac- cording to the WHO criteria. The sequence of the two tests was randomized. The interval of the two tests was within 2 weeks. The characteristics of the patients who underwent the GG or G test were comparable, as shown in Table 1. In all pa- tients, the serum creatinine was below 115 FM. All patients but one were investigated when their fasting blood glucose concentrations were below 11.1 mM. Informed consent was obtained from each patient.
Glucagon (1 mg) (NOVO A/S, Bagsvaerd, Denmark) was injected into the antecubital vein within 2 min with or without 20 ml of 2.8 M glu- cose after an overnight fast. Patients did not re- ceive any medication in the morning of the study. Blood samples were taken from the other arm before and 6 min after glucagon injection because the peak C-peptide response by GG test occurs 6 min after injection, as it does in the G test [ I]. Blood glucose concentration was measured by
101
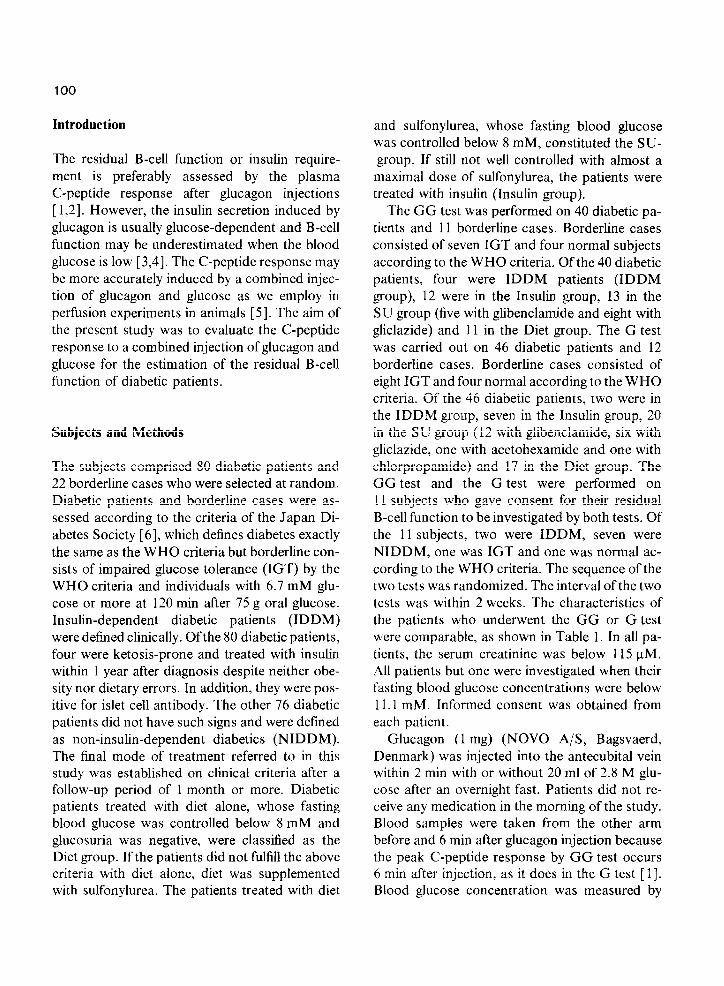
TABLE 1
Characteristics of the patients studied by glucagon-glucose test or conventional glucagon test (mean f SEM)
Glucagon-glucose test
11 Age (years) Duration of diabetes (years) BMI* (kg/m”) Fasting glucose (mM) HbA,, (“0) Fasting C-peptide (nM)
Glucagon test
IDDM
4 39.5 26.0 4.5 2 1.9
18.4 k 1.6 10.11 + 1.60 8.5 +0.8 0.13 20.11
Insulin
12 51.3 * 3.8 13.9 k3.4 21.4 +0.9
7.77 * 0.53” 8.0 kO.8 0.36 +0.05
SU Diet Borderline
13 11 11 61.9 t3.3 56.1 k3.2 56.1 k4.4 13.2 t2.1 2.4 & l.lb 22.6 t 1.0 24.9 f 1.0 24.5 kO.9
8.07 kO.56 6.56 kO.62 5.23 kO.11 1.2 kO.3 6.0 +0.5 4.8 kO.2’ 0.69 50.07 0.67 kO.08 0.68 kO.04
IDDM Insulin SU Diet Borderline
,2 2 1 20 17 13
Age (years) 38.5 +7.5 61.4 i3.3 57.1 k2.8 54.8 i 2.3 52.9 * 3.4
Duration of diabetes (years) 6.0 k4.0 14.3 k2.5 13.2 f 1.6 8.7 k 2.3
BMI’ (kg/m’) 21.2 kO.9 20.1 50.9 22.1 kO.6 22.9 50.6 26.1 k 1.9
Fasting glucose (mM) 7.08 kO.70 9.41 f 0.42 7.79 kO.41 7.63 kO.40 5.23 50.19
HbA,, (“0) 8.9 kO.3 8.1 fO.6 6.8 kO.2 6.2 20.3 4.3 kO.1
Fasting C-peptide (nM) 0.18 kO.03 0.30 kO.08 0.64 kO.08 0.62 k 0.09 0.80 +O.lO
* BMI, body mass index. I’ P< 0.05 compared with Insulin group in glucagon test; b P-co.05 compared with Diet group in glucagon test; ’ P-co.05 com- pared with borderline cases in glucagon test.
the glucose oxidase method and plasma C-peptide was measured by radioimmunoassay (C-peptide RIA, Shionogi, Osaka). Results are expressed as mean k SEM. The differences between the groups were estimated with Duncan’s multiple range tests or Student’s r-test. The level of statistical signif- icance was set at 0.05.
Results
As shown in Tables 1 and 2, the fasting and the 6 min blood glucose concentrations were 10.11 & 1.60 mM and 14.89 + 2.02 mM in the IDDM group, and 6.71 k 0.34 mM and 13.29 k 0.35 mM in the NIDDM patients by GG test. They were 7.08 + 0.70 mM and 8.31 k 0.47 mM in the ID- DM group and 7.11 k 0.27 mM and 8.25 k 0.29 mM in NIDDM patients by G test. In com-
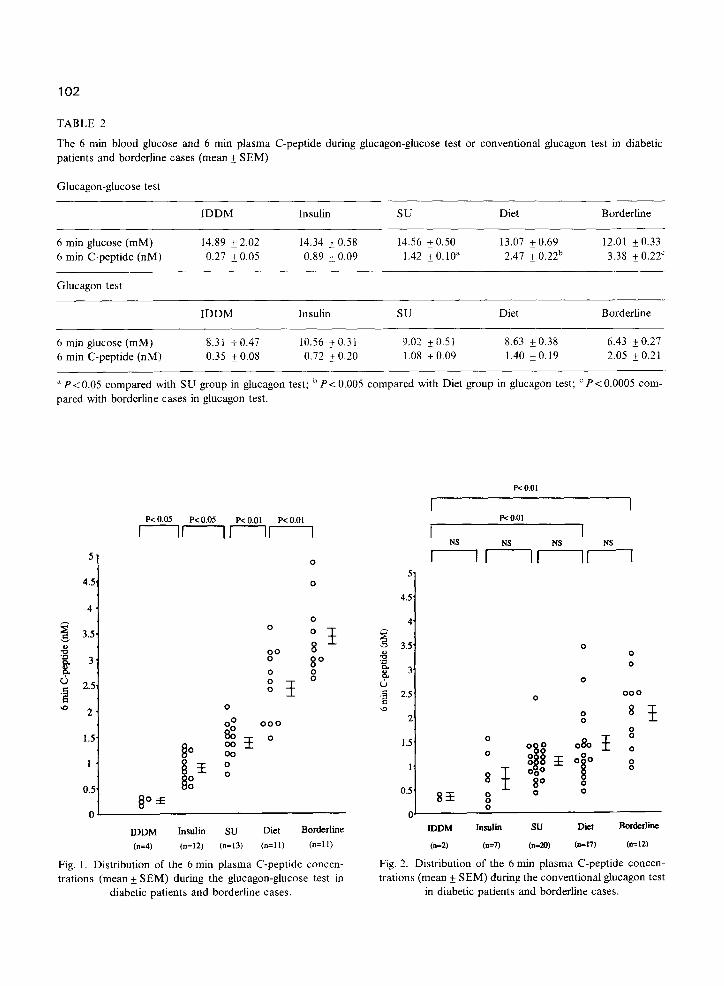
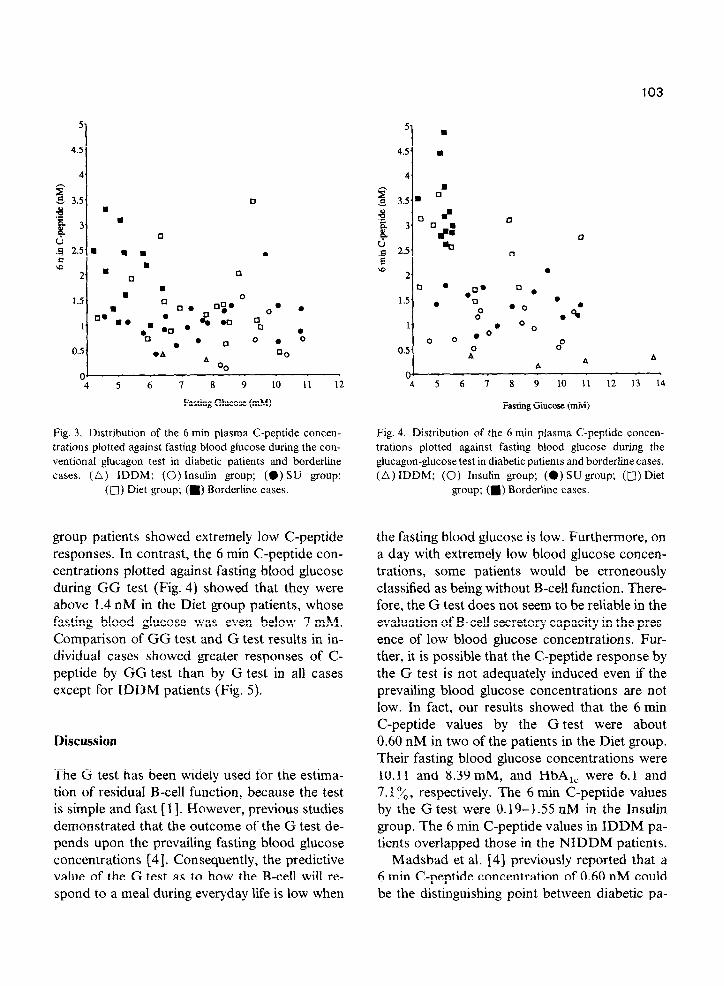
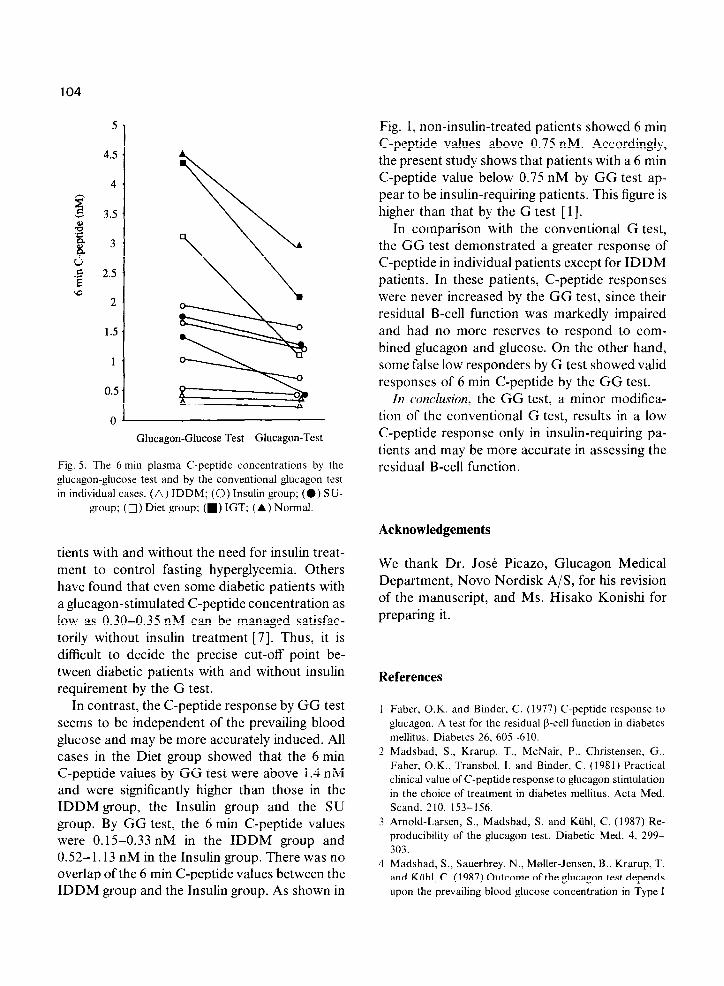
parison with the G test, the GG test showed sig- nificantly higher values of 6 min blood glucose in each group. The 6 min plasma C-peptide concen- trations after GG test were 0.27 & 0.05 nM in the IDDM group, 0.89 + 0.09 nM in the Insulin group, 1.42* 0.10 nM in the SU group, 2.47 k 0.22 nM in the Diet group and 3.38 k 0.22 nM in the borderline cases (Fig. 1). These were signifi- cantly different between the groups. On the other hand, the 6 min C-peptide concentrations by G test were 0.35 +_ 0.08 nM in the IDDM group, 0.72+ 0.20 nM in the Insulin group, 1.08 + 0.09 nM in the SU group, 1.40 t 0.19 nM in the Diet group and 2.05 +_ 0.21 nM in the borderline cases (Fig. 2). No significant differences between the IDDM group and the NIDDM patients were observed. As shown in Fig. 3 by the 6 min C- peptide concentrations plotted against fasting blood glucose during G test, some of the Diet
102
TABLE 2
The 6 mm blood glucose and 6 min plasma C-peptide during glucagon-glucose test or conventional glucagon test in diabetic patients and borderline cases (mean + SEM)
Glucagon-glucose test
IDDM Insulin SU Diet Borderline
6 min glucose (mM) 6 min C-peptide (nM)
Glucagon test
14.89 & 2.02 0.27 kO.05
IDDM
14.34 k 0.58 14.56 + 0.50 13.07 f 0.69 12.01 + 0.33 0.89 & 0.09 1.42 + 0.10” 2.41 f 0.22b 3.38 kO.22’
Insulin su Diet Borderline
6 min glucose (mM) 8.31 kO.47 10.56 2 0.3 1 9.02 f 0.5 1 8.63 +0.38 6.43 ~0.21 6 min C-peptide (nM) 0.35 kO.08 0.72 kO.20 1.08 kO.09 1.40 + 0.19 2.05 & 0.21
” Pt0.05 compared with SU group in glucagon test; b P< 0.005 compared with Diet group in glucagon test; ’ PC 0.0005 com-
pared with borderline cases in glucagon test.
P< 0.05 P< 0.05 P< 0.01 P< 0.01
rlflrr-l
0
m 2 1 0
0” 000
P< 0.01
P< 0.01
I
LDDM Jnsulin su Diet Borderline
(n=4) (n=lZ) (n=13) (II=1 1) (II=1 1)
Fig. 1. Distribution of the 6 min plasma C-peptide concen- trations (mean + SEM) during the glucagon-glucose test in
diabetic patients and borderline cases.
IDDM Jnsutii su Diet Bordertine
(n=Z) (n-7) (n=20) (n-17) (C12)
Fig. 2. Distribution of the 6 min plasma C-peptide concen- trations (mean f SEM) during the conventional glucagon test
in diabetic patients and borderline cases.
103
5
I m
0.5 *A - A 00 00
n+ “4 5 6 7 8 9 10 11 12
0 l q b
1.5, 8. l n .
0” 00 . G 1 0
0 0 ,o. O
0.5. 4 0”
A A A
0' 4 5 6 7 8 9 10 11 12 13 14
Fasting Glucose (RIM) Fasting Glucose (mM)
Fig. 3. Distribution of the 6 min plasma C-peptide concen- trations plotted against fasting blood glucose during the con- ventional glucagon test in diabetic patients and borderline cases. (A) IDDM; (0)Insulin group; (*)SU group;
(0) Diet group; (m) Borderline cases.
Fig. 4. Distribution of the 6 min plasma C-peptide concen- trations plotted against fasting blood glucose during the glucagon-glucose test in diabetic patients and borderline cases. (A)IDDM; (0) Insulin group; (0) SU group; ([51)Diet
group; (m) Borderline cases.
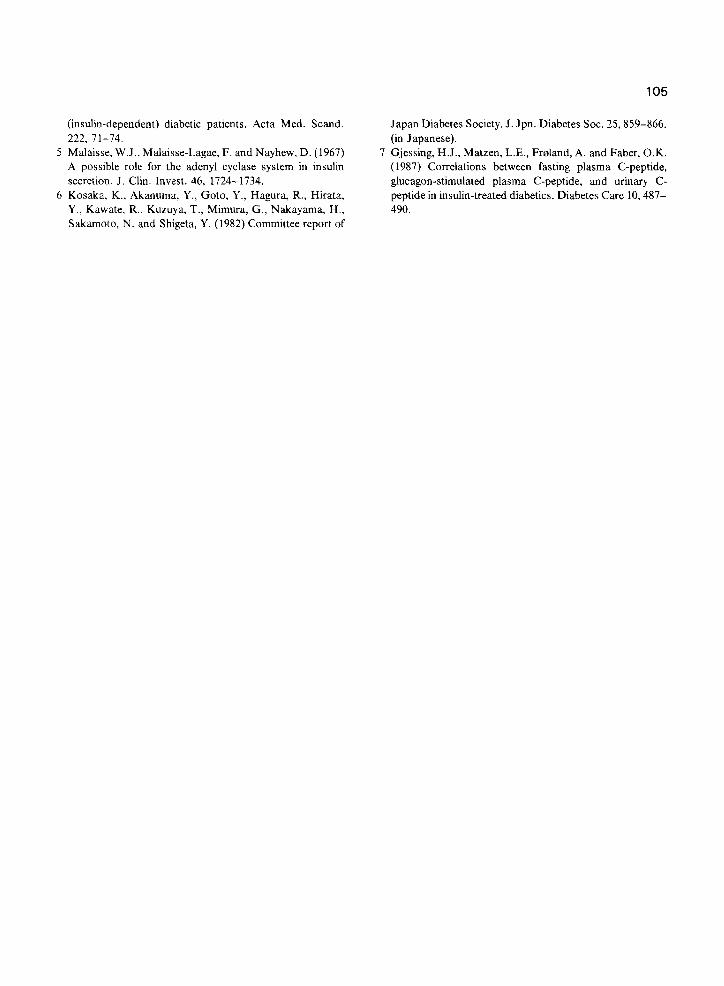
group patients showed extremely low C-peptide responses. In contrast, the 6 min C-peptide con- centrations plotted against fasting blood glucose during GG test (Fig. 4) showed that they were above 1.4 nM in the Diet group patients, whose fasting blood glucose was even below 7 mM. Comparison of GG test and G test results in in- dividual cases showed greater responses of C- peptide by GG test than by G test in all cases except for IDDM patients (Fig. 5).
Discussion
The G test has been widely used for the estima- tion of residual B-cell function, because the test is simple and fast [ I]. However, previous studies demonstrated that the outcome of the G test de- pends upon the prevailing fasting blood glucose concentrations [4]. Consequently, the predictive value of the G test as to how the B-cell will re- spond to a meal during everyday life is low when
the fasting blood glucose is low. Furthermore, on a day with extremely low blood glucose concen- trations, some patients would be erroneously classified as being without B-cell function. There- fore, the G test does not seem to be reliable in the evaluation of B-cell secretory capacity in the pres- ence of low blood glucose concentrations. Fur- ther, it is possible that the C-peptide response by the G test is not adequately induced even if the prevailing blood glucose concentrations are not low. In fact, our results showed that the 6 min C-peptide values by the G test were about 0.60 nM in two of the patients in the Diet group. Their fasting blood glucose concentrations were 10.11 and 8.39 mM, and HbA,, were 6.1 and 7.1%, respectively. The 6 min C-peptide values by the G test were 0.19-l 55 nM in the Insulin group, The 6 min C-peptide values in IDDM pa- tients overlapped those in the NIDDM patients.
Madsbad et al. [4] previously reported that a 6 min C-peptide concentration of 0.60 nM could be the distinguishing point between diabetic pa-
104
5
I 4.5
4
3.5 . 0
9 & & 3
d .z 2.5
rD 2
1.5
1
0.5 .
Glucagon-Glucose Test Glucagon-Test
Fig. 5. The 6 min plasma C-peptide concenlrations by the
glucagon-glucose test and by the conventional glucagon test
in individual cases. (A) IDDM; (0) Insulin group; (0) Sti-
group; (0) Diet group; (m) IGT; (A ) Normal.
tients with and without the need for insulin treat- ment to control fasting hyperglycemia. Others have found that even some diabetic patients with a glucagon-stimulated C-peptide concentration as low as 0.30-0.35 nM can be managed satisfac- torily without insulin treatment [7]. Thus, it is difficult to decide the precise cut-off point be- tween diabetic patients with and without insulin requirement by the G test.
In contrast, the C-peptide response by GG test seems to be independent of the prevailing blood glucose and may be more accurately induced. All cases in the Diet group showed that the 6 min C-peptide values by GG test were above 1.4 nM and were significantly higher than those in the IDDM group, the Insulin group and the SU group. By GG test, the 6 min C-peptide values were 0.15-0.33 nM in the IDDM group and 0.52-l. 13 nM in the Insulin group. There was no overlap of the 6 min C-peptide values between the IDDM group and the Insulin group. As shown in
Fig. 1, non-insulin-treated patients showed 6 min C-peptide values above 0.75 nM. Accordingly, the present study shows that patients with a 6 min C-peptide value below 0.75 nM by GG test ap- pear to be insulin-requiring patients. This figure is higher than that by the G test [ 11.
In comparison with the conventional G test, the GG test demonstrated a greater response of C-peptide in individual patients except for IDDM patients. In these patients, C-peptide responses were never increased by the GG test, since their residual B-cell function was markedly impaired and had no more reserves to respond to com- bined glucagon and glucose. On the other hand, some false low responders by G test showed valid responses of 6 min C-peptide by the GG test.
In conclusion, the GG test, a minor modifica- tion of the conventional G test, results in a low C-peptide response only in insulin-requiring pa- tients and may be more accurate in assessing the residual B-cell function.
Acknowledgements
We thank Dr. Jo& Picazo, Glucagon Medical Department, Novo Nordisk A/S, for his revision of the manuscript, and Ms. Hisako Konishi for preparing it.
References
1 Faber, O.K. and Binder. C. (1977) C-peptide response to
glucagon. A test for the residual P-cell function in diabetes
mellitus. Diabetes 26. 605-610.
2 Madsbad, S., Krarup, T.. McNair, P.. Christensen, G..
Faber, O.K., Transbol. I. and Binder, C. (1981) Practical
clinical value of C-peptide response to glucagon stimulation
in the choice of treatment in diabetes mellitus. Acta Med.
Stand. 210. 153-156.
3 Arnold-Larsen, S., Madsbad, S. and Kiihl, C. (1987) Re-
producibility of the glucagon test. Diabetic Med. 4, 299-
303.
4 Madsbad. S., Sauerbrey, N.. Moller-Jensen. B.. Krarup, T.
and KUhl, C. (1987) Outcome of the glucagon test depends
upon the prevailing blood glucose concentration in Type I
105
(insulin-dependent) diabetic patients. Acta Med. Stand. 222, I l-14.
5 Malaisse, W.J., Malaisse-Lagae, F. and Nayhew, D. (1967) A possible role for the adenyl cyclase system in insulin secretion. J. Clin. Invest. 46, 1724-1734.
6 Kosaka, K., Akanuma, Y., Goto, Y., Hagura, R., Hirata, Y., Kawate. R.. Kuzuya, T., Mimura, G., Nakayama, H., Sakamoto, N. and Shigeta, Y. (1982) Committee report of
Japan Diabetes Society. J. Jpn. Diabetes Sot. 25859-866. (in Japanese).
7 Gjessing, H.J., Matzen, L.E., Fraland, A. and Faber, O.K. (1987) Correlations between fasting plasma C-peptide, glucagon-stimulated plasma C-peptide, and urinary C- peptide in insulin-treated diabetics. Diabetes Care 10,487- 490.
Recommended