Investor PresentationJune 2019
NYSE: BCO
These materials contain forward-looking information. Words such as "anticipate," "assume," "estimate," "expect," “target” "project," "predict," "intend," "plan," "believe," "potential," "may," "should" and similar expressions may identify forward-looking information. Forward-looking information in these materials includes, but is not limited to information regarding: 2019 non-GAAP outlook, including revenue, operating profit, margin rate, earnings per share, adjusted EBITDA, impact of currency translation and expected drivers of 2019 results; 2021 target margin rate for the U.S.; 2019 and future years’ tax rates; projected contributions for legacy liabilities; capital expense outlook; 2019 target cash flow; net debt and leverage outlook; expected results from Strategy 1.0 and Strategy 1.5; planned Strategy 2.0 and IT investments; future results of acquisitions and the impact of devaluation of the Argentine peso.
Forward-looking information in this document is subject to known and unknown risks, uncertainties and contingencies, which are difficult to predict or quantify, and which could cause actual results, performance or achievements to differ materially from those that are anticipated. These risks, uncertainties and contingencies, many of which are beyond our control, include, but are not limited to: our ability to improve profitability and execute further cost and operational improvement and efficiencies in our core businesses; our ability to improve service levels and quality in our core businesses; market volatility and commodity price fluctuations; seasonality, pricing and other competitive industry factors; investment in information technology and its impact on revenue and profit growth; our ability to maintain an effective IT infrastructure and safeguard confidential information; our ability to effectively develop and implement solutions for our customers; risks associated with operating in foreign countries, including changing political, labor and economic conditions, regulatory issues (including the imposition of international sanctions, including by the U.S. government), currency restrictions and devaluations, restrictions on and cost of repatriating earnings and capital, impact on the Company’s financial results as a result of jurisdictions determined to be highly inflationary, and restrictive government actions, including nationalization; labor issues, including negotiations with organized labor and work stoppages; the strength of the U.S. dollar relative to foreign currencies and foreign currency exchange rates; our ability to identify, evaluate and complete acquisitions and other strategic transactions and to successfully integrate acquired companies; costs related to dispositions and market exits; our ability to obtain appropriate insurance coverage, positions taken by insurers relative to claims and the financial condition of insurers; safety and security performance and loss experience; employee, environmental and other liabilities in connection with former coal operations, including black lung claims; the impact of the Patient Protection and Affordable Care Act on legacy liabilities and ongoing operations; funding requirements, accounting treatment, and investment performance of our pension plans, the VEBA and other employee benefits; changes to estimated liabilities and assets in actuarial assumptions; the nature of hedging relationships and counterparty risk; access to the capital and credit markets; our ability to realize deferred tax assets; the outcome of pending and future claims, litigation, and administrative proceedings; public perception of our business, reputation and brand; changes in estimates and assumptions underlying critical accounting policies; the promulgation and adoption of new accounting standards, new government regulations and interpretation of existing standards and regulations.
This list of risks, uncertainties and contingencies is not intended to be exhaustive. Additional factors that could cause our results to differ materially from those described in the forward-looking statements can be found under "Risk Factors" in Item 1A of our Annual Report on Form 10-K for the period ended December 31, 2018, and in our other public filings with the Securities and Exchange Commission.
The forward-looking information discussed today and included in these materials is representative as of April 24, 2019, unless otherwise noted, and The Brink's Company undertakes no obligation to update any information contained in this document.
These materials are copyrighted and may not be used without written permission from Brink's. Today’s presentation is focused primarily on non-GAAP results. Detailed reconciliations of non-GAAP to GAAP results are included in the appendix.
Safe Harbor Statement and Non-GAAP Results
2
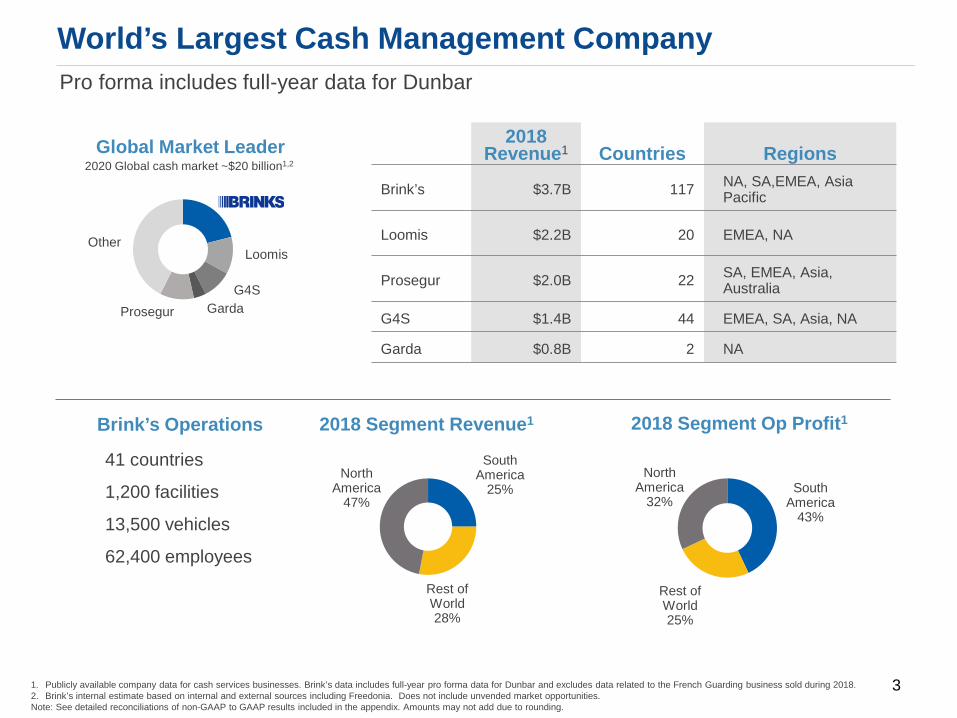
1. Publicly available company data for cash services businesses. Brink’s data includes full-year pro forma data for Dunbar and excludes data related to the French Guarding business sold during 2018.2. Brink’s internal estimate based on internal and external sources including Freedonia. Does not include unvended market opportunities.Note: See detailed reconciliations of non-GAAP to GAAP results included in the appendix. Amounts may not add due to rounding.
2020 Global cash market ~$20 billion1,2
Loomis
G4SGardaProsegur
Other
Global Market Leader 2018 Revenue1 Countries Regions
Brink’s $3.7B 117 NA, SA,EMEA, Asia Pacific
Loomis $2.2B 20 EMEA, NA
Prosegur $2.0B 22 SA, EMEA, Asia, Australia
G4S $1.4B 44 EMEA, SA, Asia, NA
Garda $0.8B 2 NA
Brink’s Operations
41 countries
1,200 facilities
13,500 vehicles
62,400 employees
South America
25%
Rest of World28%
North America
47%
2018 Segment Revenue1
South America
43%
Rest of World25%
North America
32%
2018 Segment Op Profit1
World’s Largest Cash Management CompanyPro forma includes full-year data for Dunbar
3
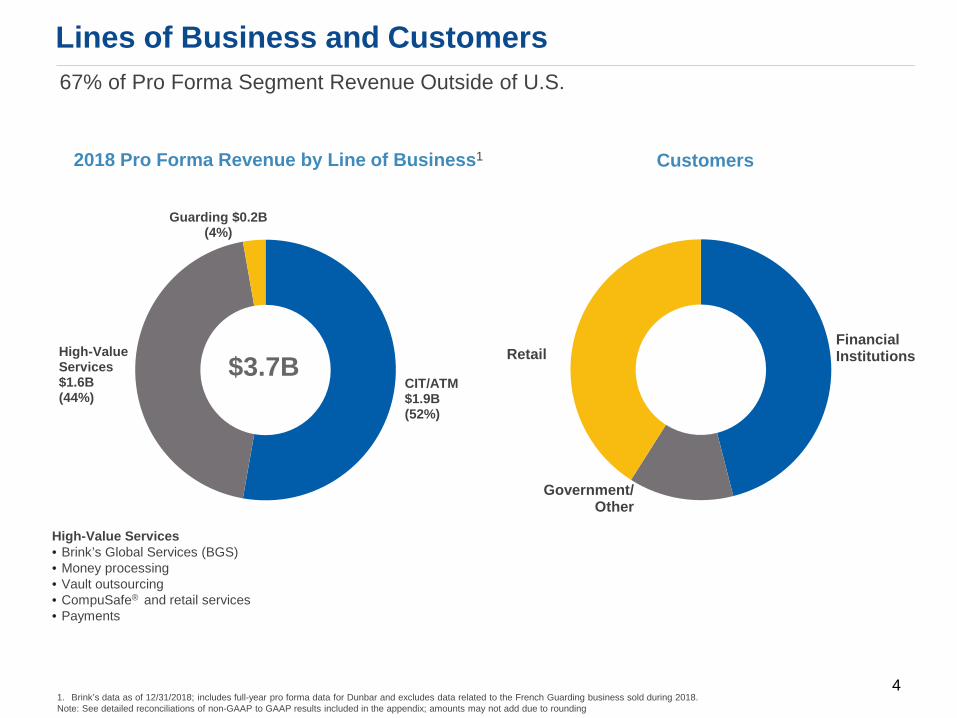
Lines of Business and Customers
CIT/ATM$1.9B(52%)
High-Value Services$1.6B(44%)
Guarding $0.2B(4%)
High-Value Services• Brink’s Global Services (BGS)• Money processing• Vault outsourcing • CompuSafe® and retail services• Payments
$3.7B
2018 Pro Forma Revenue by Line of Business1
FinancialInstitutions
Government/Other
Retail
Customers
1. Brink’s data as of 12/31/2018; includes full-year pro forma data for Dunbar and excludes data related to the French Guarding business sold during 2018.Note: See detailed reconciliations of non-GAAP to GAAP results included in the appendix; amounts may not add due to rounding
67% of Pro Forma Segment Revenue Outside of U.S.
4
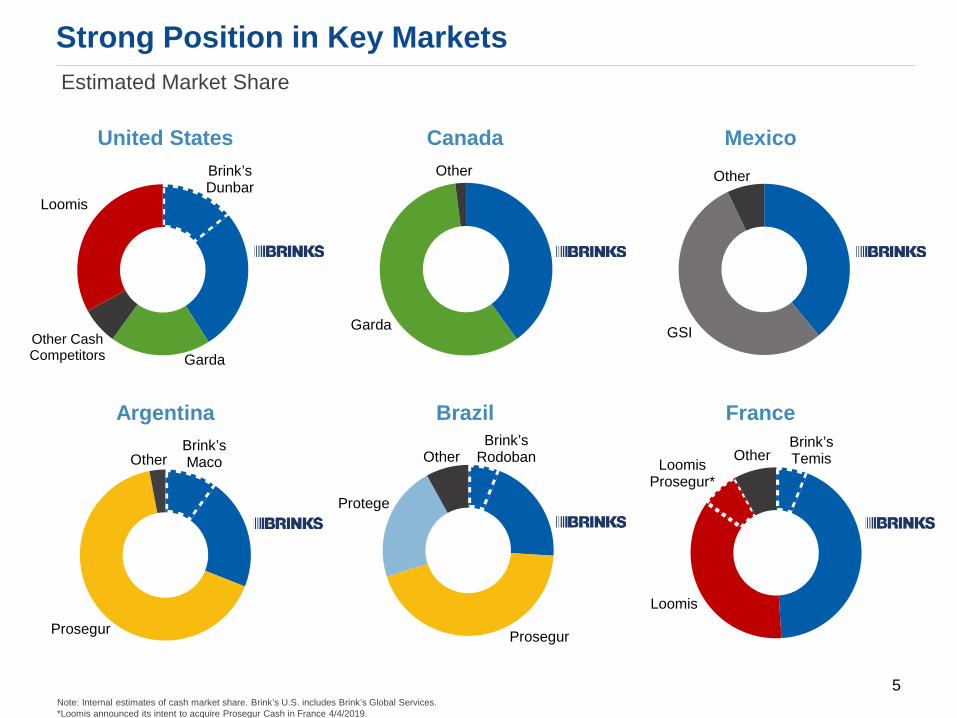
Brink’s Temis
Loomis
LoomisProsegur*
OtherBrink’s Maco
Prosegur
OtherBrink’s
Rodoban
Prosegur
Protege
Other
Garda
Other
Canada
Strong Position in Key Markets
France
Brink’s Dunbar
GardaOther Cash Competitors
Loomis
United States
GSI
Other
Mexico
Argentina
Estimated Market Share
Note: Internal estimates of cash market share. Brink’s U.S. includes Brink’s Global Services.*Loomis announced its intent to acquire Prosegur Cash in France 4/4/2019.
Brazil
5
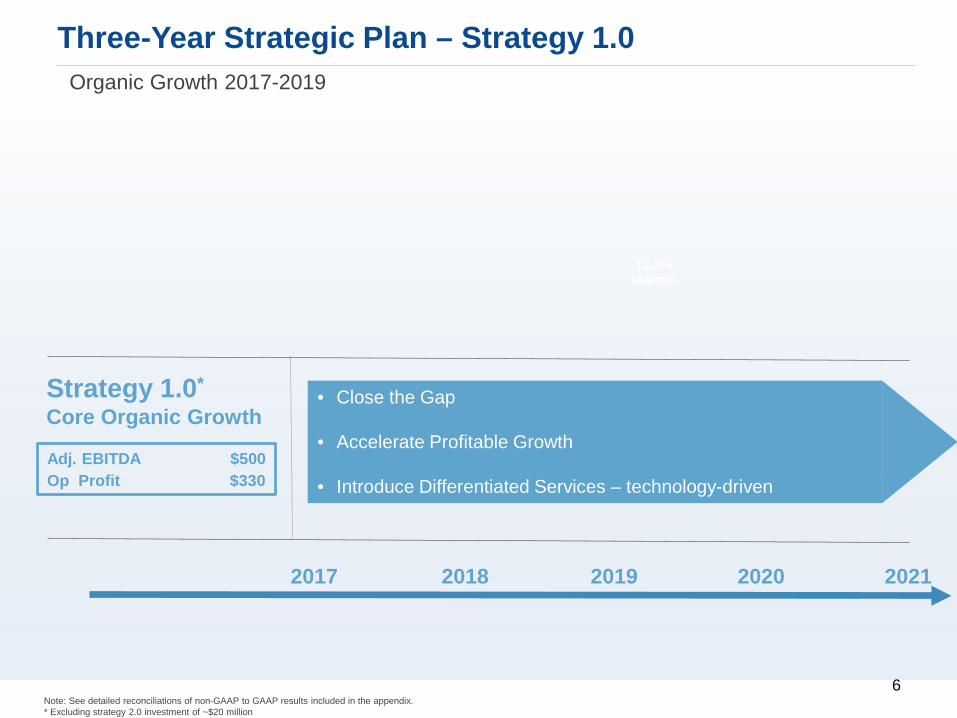
13.3%Margin
Strategy 1.0*
Core Organic Growth• Close the Gap
• Accelerate Profitable Growth
• Introduce Differentiated Services – technology-driven
Note: See detailed reconciliations of non-GAAP to GAAP results included in the appendix.* Excluding strategy 2.0 investment of ~$20 million
Adj. EBITDA $500Op Profit $330
Three-Year Strategic Plan – Strategy 1.0 Organic Growth 2017-2019
20182017 2019 2020 2021
6
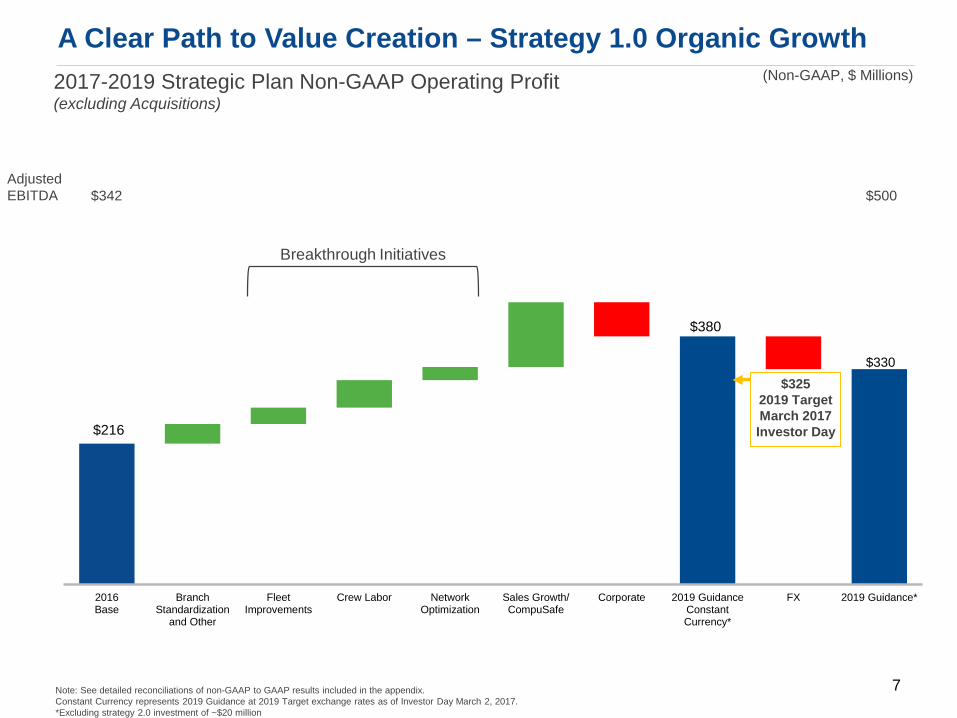
$330
$216
$380
2016Base
BranchStandardization
and Other
FleetImprovements
Crew Labor NetworkOptimization
Sales Growth/CompuSafe
Corporate 2019 GuidanceConstantCurrency*
FX 2019 Guidance*
Breakthrough Initiatives
A Clear Path to Value Creation – Strategy 1.0 Organic Growth2017-2019 Strategic Plan Non-GAAP Operating Profit (excluding Acquisitions)
Note: See detailed reconciliations of non-GAAP to GAAP results included in the appendix.Constant Currency represents 2019 Guidance at 2019 Target exchange rates as of Investor Day March 2, 2017.*Excluding strategy 2.0 investment of ~$20 million
(Non-GAAP, $ Millions)
Adjusted EBITDA $342 $500
$3252019 Target March 2017 Investor Day
7
13.3%Margin
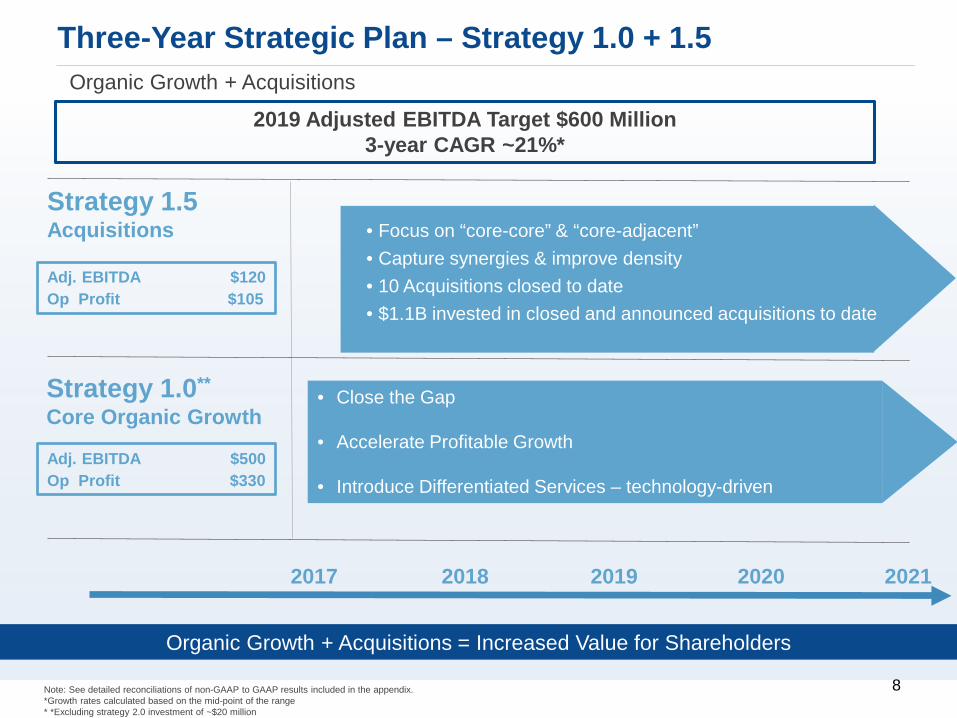
Organic Growth + Acquisitions = Increased Value for Shareholders
Strategy 1.0**
Core Organic Growth
Strategy 1.5Acquisitions
• Close the Gap
• Accelerate Profitable Growth
• Introduce Differentiated Services – technology-driven
Note: See detailed reconciliations of non-GAAP to GAAP results included in the appendix.*Growth rates calculated based on the mid-point of the range * *Excluding strategy 2.0 investment of ~$20 million
Adj. EBITDA $120Op Profit $105
Adj. EBITDA $500Op Profit $330
Three-Year Strategic Plan – Strategy 1.0 + 1.5Organic Growth + Acquisitions
20182017 2019 2020 2021
• Focus on “core-core” & “core-adjacent”• Capture synergies & improve density• 10 Acquisitions closed to date• $1.1B invested in closed and announced acquisitions to date
2019 Adjusted EBITDA Target $600 Million3-year CAGR ~21%*
8
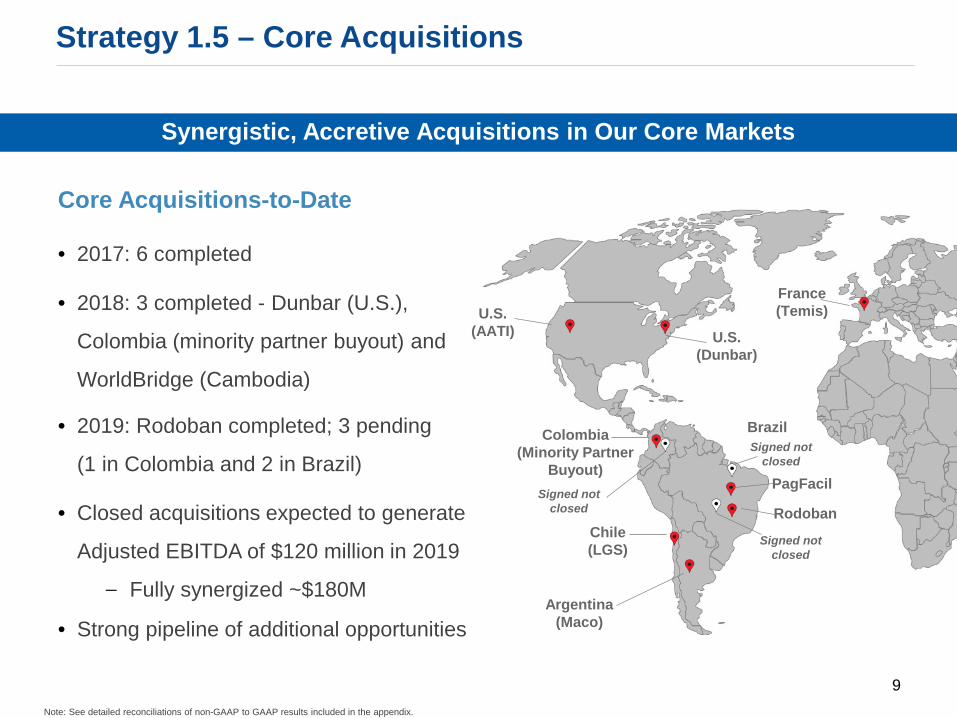
• 2017: 6 completed
• 2018: 3 completed - Dunbar (U.S.),
Colombia (minority partner buyout) and
WorldBridge (Cambodia)
• 2019: Rodoban completed; 3 pending
(1 in Colombia and 2 in Brazil)
• Closed acquisitions expected to generate
Adjusted EBITDA of $120 million in 2019
– Fully synergized ~$180M
• Strong pipeline of additional opportunities
Synergistic, Accretive Acquisitions in Our Core Markets
U.S.(AATI)
PagFacil
Argentina(Maco)
Chile(LGS)
France(Temis)
Rodoban
U.S.(Dunbar)
Core Acquisitions-to-Date
Colombia(Minority Partner
Buyout)Signed not
closed
Signed not closed
Signed not closed
Note: See detailed reconciliations of non-GAAP to GAAP results included in the appendix.
Brazil
Strategy 1.5 – Core Acquisitions
9
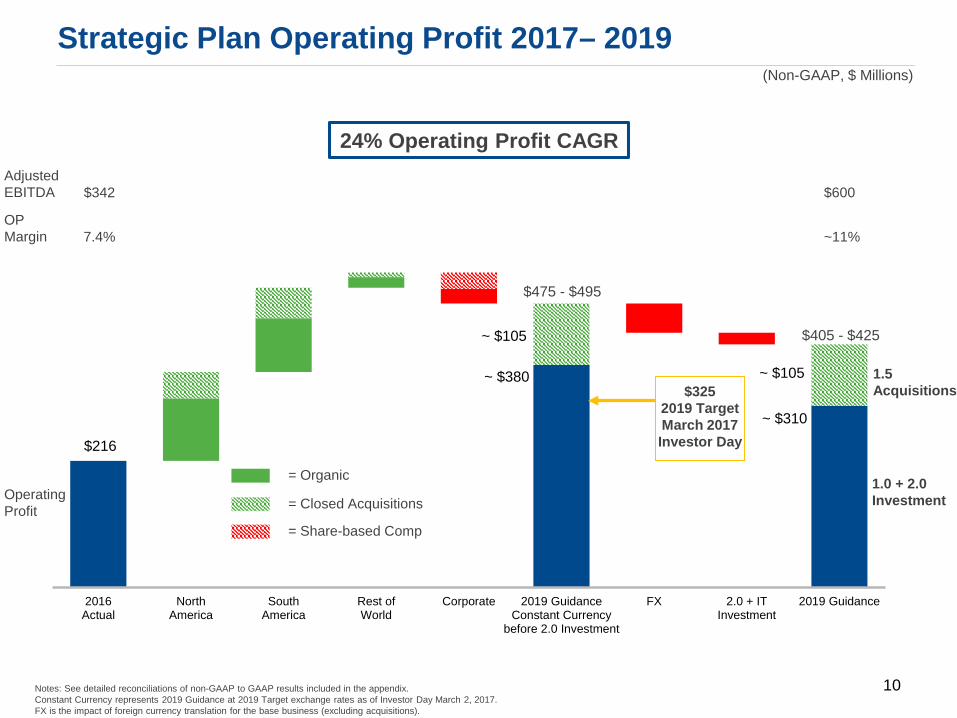
Strategic Plan Operating Profit 2017– 2019(Non-GAAP, $ Millions)
$216
~ $380
~ $310
~ $105
~ $105
2016Actual
NorthAmerica
SouthAmerica
Rest ofWorld
Corporate 2019 GuidanceConstant Currency
before 2.0 Investment
FX 2.0 + ITInvestment
2019 Guidance
= Closed AcquisitionsOperatingProfit
Notes: See detailed reconciliations of non-GAAP to GAAP results included in the appendix. Constant Currency represents 2019 Guidance at 2019 Target exchange rates as of Investor Day March 2, 2017.FX is the impact of foreign currency translation for the base business (excluding acquisitions).
OP Margin 7.4% ~11%
= Share-based Comp
$475 - $495
$405 - $425
1.5 Acquisitions
1.0 + 2.0 Investment
$3252019 Target March 2017 Investor Day
= Organic
Adjusted EBITDA $342 $600
24% Operating Profit CAGR
10
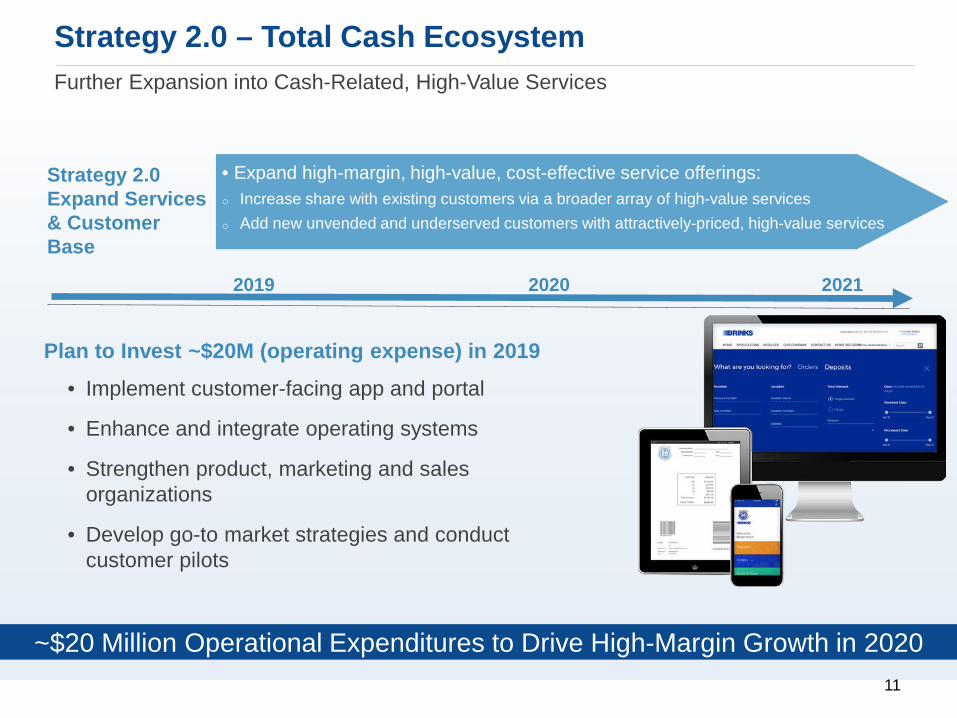
Plan to Invest ~$20M (operating expense) in 2019• Implement customer-facing app and portal
• Enhance and integrate operating systems
• Strengthen product, marketing and sales organizations
• Develop go-to market strategies and conduct customer pilots
~$20 Million Operational Expenditures to Drive High-Margin Growth in 2020
Further Expansion into Cash-Related, High-Value Services
13.3%Margin
Strategy 2.0Expand Services & Customer Base
• Expand high-margin, high-value, cost-effective service offerings:o Increase share with existing customers via a broader array of high-value serviceso Add new unvended and underserved customers with attractively-priced, high-value services
20202019 2021
Strategy 2.0 – Total Cash Ecosystem
11
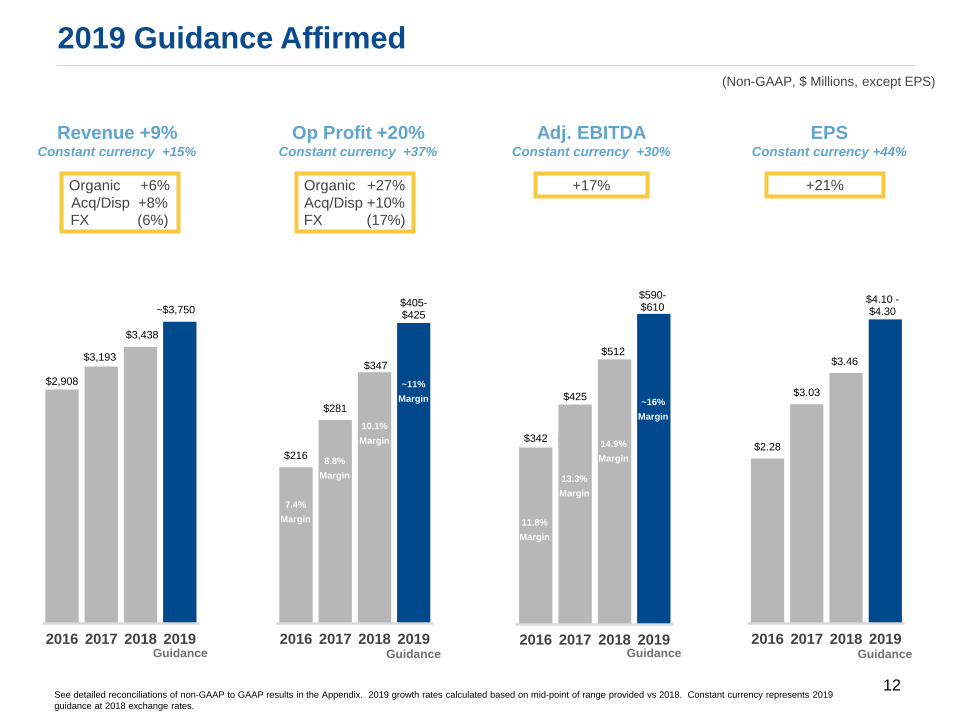
2019 Guidance Affirmed
See detailed reconciliations of non-GAAP to GAAP results in the Appendix. 2019 growth rates calculated based on mid-point of range provided vs 2018. Constant currency represents 2019 guidance at 2018 exchange rates.
13.5%Margin
15.9%Margin
12.7%Margin
xx%Margin
15.8% -
16.3%
Margin
13.3%
Margin
~14.5%
Margin
11.8%
Margin
11.2%-
11.7%
Margin
8.8%
Margin
9.9%-
10.4%
Margin
7.4%
Margin
Guidance Guidance GuidanceGuidance
Revenue +9%Constant currency +15%
$2,908
$3,193
$3,438
~$3,750
2016 2017 2018 2019
Organic +6%Acq/Disp +8%FX (6%)
8.8%Margin
10.1%Margin
7.4%Margin
~10.9%Margin
13.3%Margin
14.9%Margin
11.8%Margin
~15.7%Margin
Adj. EBITDAConstant currency +30%
$342
$425
$512
$590-$610
2016 2017 2018 2019
+17%
EPSConstant currency +44%
$2.28
$3.03
$3.46
$4.10 -$4.30
2016 2017 2018 2019
+21%
Op Profit +20%Constant currency +37%
$216
$281
$347
$405-$425
2016 2017 2018 2019
Organic +27%Acq/Disp +10%FX (17%)
~11%Margin
10.1%Margin
8.8%Margin
7.4%Margin
~16%Margin
14.9%Margin
13.3%Margin
11.8%Margin
(Non-GAAP, $ Millions, except EPS)
12
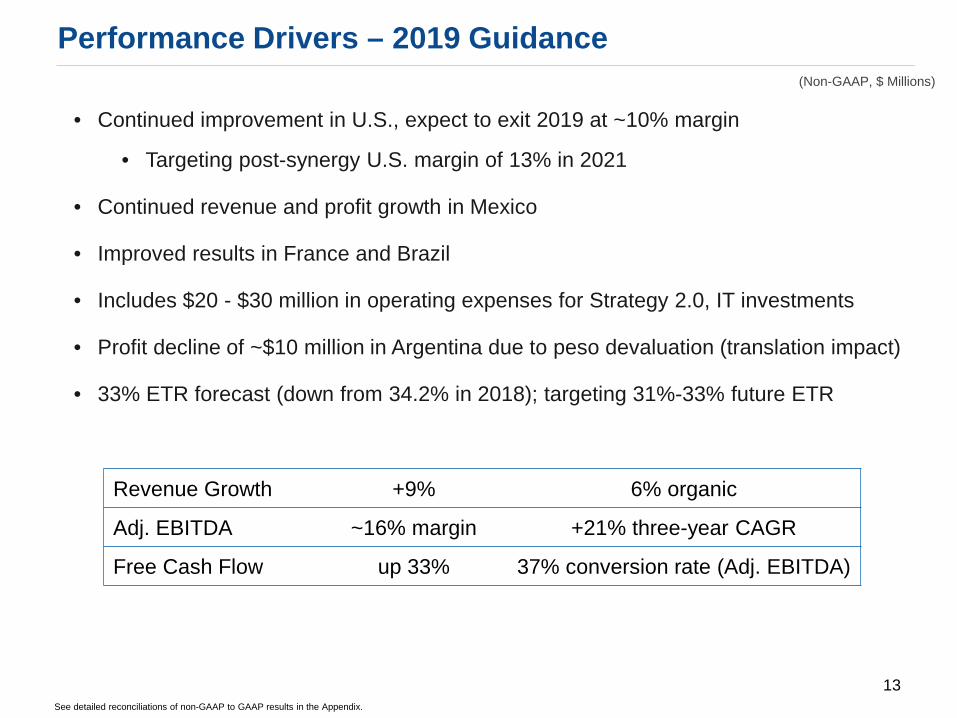
Performance Drivers – 2019 Guidance
• Continued improvement in U.S., expect to exit 2019 at ~10% margin
• Targeting post-synergy U.S. margin of 13% in 2021
• Continued revenue and profit growth in Mexico
• Improved results in France and Brazil
• Includes $20 - $30 million in operating expenses for Strategy 2.0, IT investments
• Profit decline of ~$10 million in Argentina due to peso devaluation (translation impact)
• 33% ETR forecast (down from 34.2% in 2018); targeting 31%-33% future ETR
Revenue Growth +9% 6% organic
Adj. EBITDA ~16% margin +21% three-year CAGR
Free Cash Flow up 33% 37% conversion rate (Adj. EBITDA)
13
(Non-GAAP, $ Millions)
See detailed reconciliations of non-GAAP to GAAP results in the Appendix.
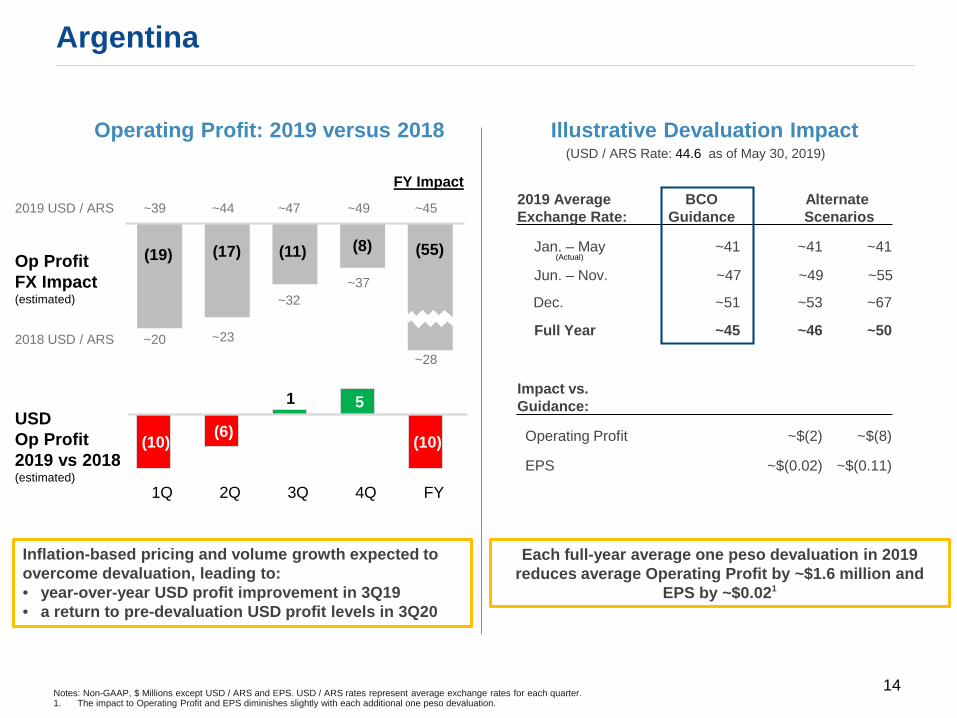
(10) (6)
1 5
(10)
1Q 2Q 3Q 4Q FY
~32
~47
2018 USD / ARS
2019 USD / ARS
Op ProfitFX Impact(estimated)
USD Op Profit2019 vs 2018(estimated)
~37
~49
(8)(11)
~23
~44
(17)
~20
~39
(19)
Notes: Non-GAAP, $ Millions except USD / ARS and EPS. USD / ARS rates represent average exchange rates for each quarter.1. The impact to Operating Profit and EPS diminishes slightly with each additional one peso devaluation.
2019 Average Exchange Rate:
BCOGuidance
AlternateScenarios
Jan. – May ~41 ~41 ~41
Jun. – Nov. ~47 ~49 ~55
Dec. ~51 ~53 ~67
Full Year ~45 ~46 ~50
Impact vs. Guidance:
Operating Profit ~$(2) ~$(8)
EPS ~$(0.02) ~$(0.11)
Inflation-based pricing and volume growth expected to overcome devaluation, leading to:• year-over-year USD profit improvement in 3Q19• a return to pre-devaluation USD profit levels in 3Q20
Each full-year average one peso devaluation in 2019 reduces average Operating Profit by ~$1.6 million and
EPS by ~$0.021
Operating Profit: 2019 versus 2018 Illustrative Devaluation Impact
(55)
~45
~28
(USD / ARS Rate: 44.6 as of May 30, 2019)
Argentina
FY Impact
14
(Actual)
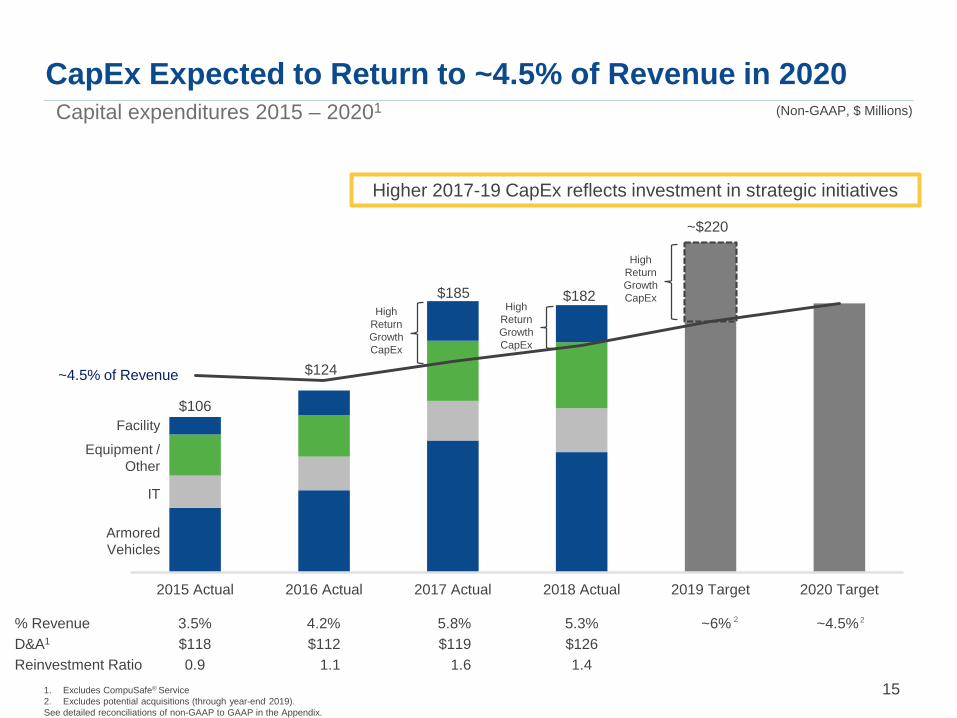
2015 Actual 2016 Actual 2017 Actual 2018 Actual 2019 Target 2020 Target
1. Excludes CompuSafe® Service2. Excludes potential acquisitions (through year-end 2019).See detailed reconciliations of non-GAAP to GAAP in the Appendix.
(Non-GAAP, $ Millions)
Facility
Equipment / Other
IT
ArmoredVehicles
% Revenue 3.5% 4.2% 5.8% 5.3% ~6% ~4.5%D&A1 $118 $112 $119 $126Reinvestment Ratio 0.9 1.1 1.6 1.4
$124
$106
$185
~$220
~4.5% of Revenue
Higher 2017-19 CapEx reflects investment in strategic initiatives
$182High
Return Growth CapEx
High Return Growth CapEx
High Return Growth CapEx
2 2
CapEx Expected to Return to ~4.5% of Revenue in 2020 Capital expenditures 2015 – 20201
15

Free Cash Flow (incl. completed acquisitions)
$58
$166$220
$170
$155
$190
$27
$64
$80
$84
$91
$65
$86
$36
$45
$425
$512
$600
2017Actual
2018Actual
2019Target
Working Capital: Targeting ~flatCash Restructuring: ~$45 million, primarily acquisition-related
Cash Taxes: Higher income offset by lower ETR, FTCs and refund timing
Adjusted EBITDA
Free Cash Flow before Dividends
Note: Amounts may not add due to rounding.Non-GAAP Free Cash Flow excludes the impact of Venezuela operations. See detailed reconciliations of cash flows in the Appendix.1. FCF Conversion – Income is defined as Free Cash Flow before Dividends divided by Non-GAAP Income (loss) from continuing operations attributable to Brink’s.2. FCF Conversion – Adjusted EBITDA is defined as Free Cash Flow before Dividends divided by Adjusted EBITDA.
1
Cash Capital Expenditures: (detail in appendix) Maintenance: ~4.5% of RevenueIncremental: Strategic initiatives and acquisitions
(Non-GAAP, $ Millions)
Cash Interest: Higher Net Debt (driven by acquisitions) offset by lower rates from 2019 credit agreement amendment
2019 Free Cash Flow Target –Almost Quadruples in Two Years
37% 92% ~100% FCF Conversion – Income1
14% 32% ~37% FCF Conversion – Adjusted EBITDA2
16
Note: See detailed reconciliations of non-GAAP to GAAP results in the appendix
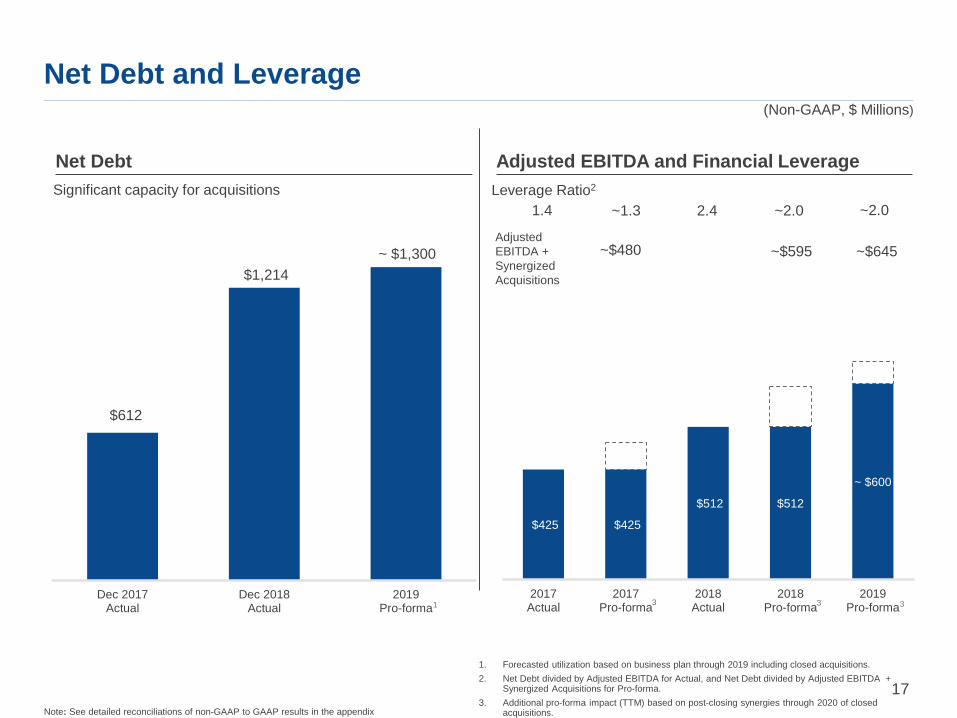
Net Debt and Leverage
1. Forecasted utilization based on business plan through 2019 including closed acquisitions. 2. Net Debt divided by Adjusted EBITDA for Actual, and Net Debt divided by Adjusted EBITDA +
Synergized Acquisitions for Pro-forma.3. Additional pro-forma impact (TTM) based on post-closing synergies through 2020 of closed
acquisitions.
$425 $425
$512 $512
~ $600
2017Actual
2017Pro-forma
2018Actual
2018Pro-forma
2019Pro-forma
$612
$1,214 ~ $1,300
Dec 2017Actual
Dec 2018Actual
2019Pro-forma
Net Debt Adjusted EBITDA and Financial LeverageLeverage Ratio2
1.4 ~1.3 2.4 ~2.0 ~2.0
3 3 31
Significant capacity for acquisitions
Adjusted EBITDA + Synergized Acquisitions
~$480 ~$595 ~$645
(Non-GAAP, $ Millions)
17
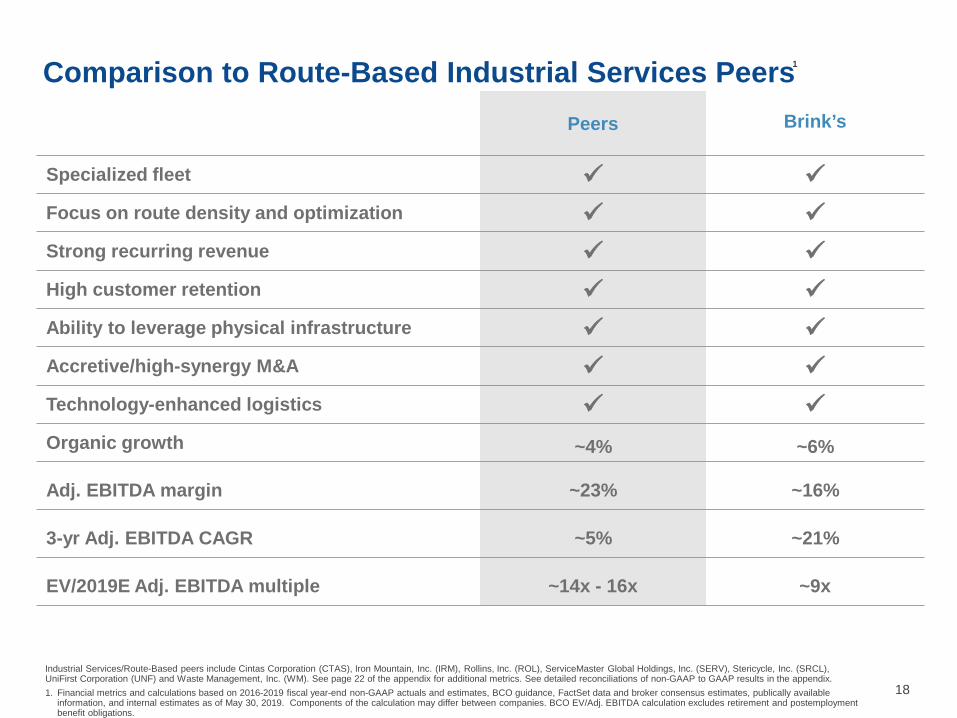
Comparison to Route-Based Industrial Services PeersPeers Brink’s
Specialized fleet Focus on route density and optimization Strong recurring revenue High customer retention Ability to leverage physical infrastructure Accretive/high-synergy M&A Technology-enhanced logistics Organic growth ~4% ~6%
Adj. EBITDA margin ~23% ~16%
3-yr Adj. EBITDA CAGR ~5% ~21%
EV/2019E Adj. EBITDA multiple ~14x - 16x ~9x
1
Industrial Services/Route-Based peers include Cintas Corporation (CTAS), Iron Mountain, Inc. (IRM), Rollins, Inc. (ROL), ServiceMaster Global Holdings, Inc. (SERV), Stericycle, Inc. (SRCL), UniFirst Corporation (UNF) and Waste Management, Inc. (WM). See page 22 of the appendix for additional metrics. See detailed reconciliations of non-GAAP to GAAP results in the appendix.1. Financial metrics and calculations based on 2016-2019 fiscal year-end non-GAAP actuals and estimates, BCO guidance, FactSet data and broker consensus estimates, publically available
information, and internal estimates as of May 30, 2019. Components of the calculation may differ between companies. BCO EV/Adj. EBITDA calculation excludes retirement and postemployment benefit obligations.
18
Notes: See detailed reconciliations of non-GAAP to GAAP results included in the Appendix.
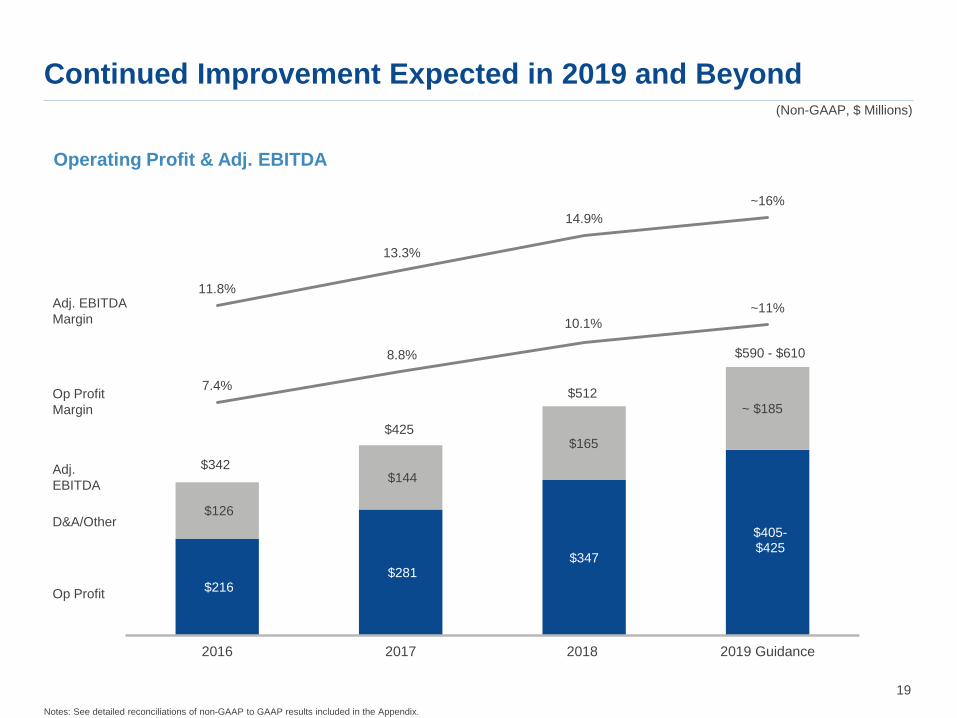
Continued Improvement Expected in 2019 and Beyond
$216 $281
$347
$405-$425
$126
$144
$165
~ $185
7.4%
8.8%
10.1%~11%
11.8%
13.3%
14.9%~16%
2016 2017 2018 2019 Guidance
Adj. EBITDAMargin
Op ProfitMargin
D&A/Other
Op Profit
Adj.EBITDA
Operating Profit & Adj. EBITDA
(Non-GAAP, $ Millions)
$342
$590 - $610
$512
$425
19

Questions?
Brink’s Investor Relations804-289-9709

Appendix
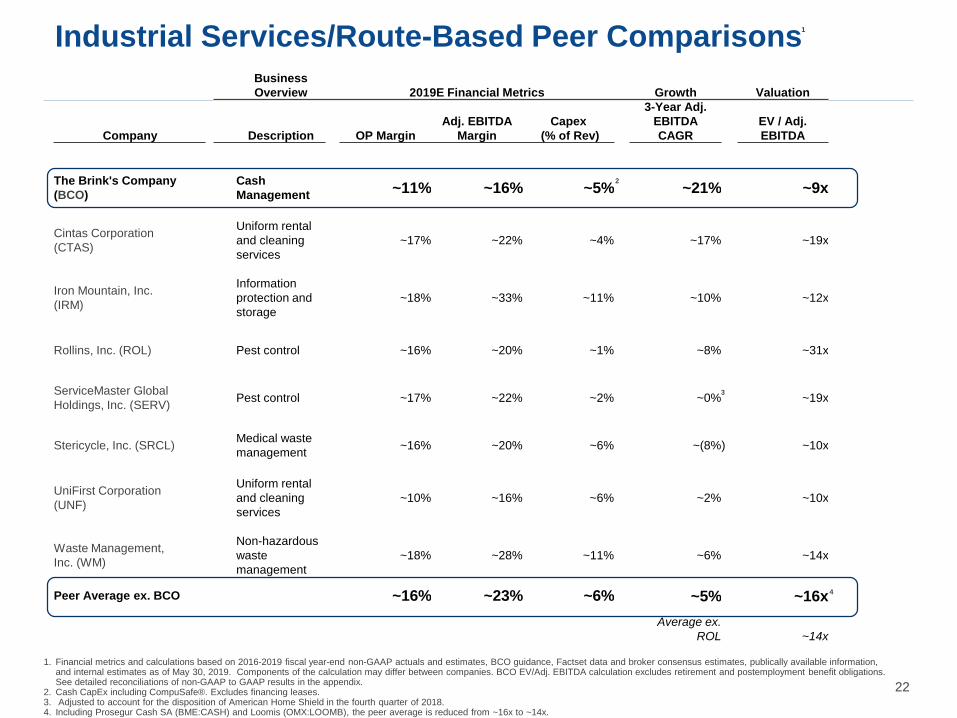
Business Overview 2019E Financial Metrics Growth Valuation
Company Description OP MarginAdj. EBITDA
MarginCapex
(% of Rev)
3-Year Adj. EBITDA CAGR
EV / Adj.EBITDA
The Brink's Company (BCO)
Cash Management ~11% ~16% ~5% ~21% ~9x
Cintas Corporation (CTAS)
Uniform rental and cleaning services
~17% ~22% ~4% ~17% ~19x
Iron Mountain, Inc. (IRM)
Information protection and storage
~18% ~33% ~11% ~10% ~12x
Rollins, Inc. (ROL) Pest control ~16% ~20% ~1% ~8% ~31x
ServiceMaster Global Holdings, Inc. (SERV) Pest control ~17% ~22% ~2% ~0% ~19x
Stericycle, Inc. (SRCL) Medical waste management ~16% ~20% ~6% ~(8%) ~10x
UniFirst Corporation (UNF)
Uniform rental and cleaning services
~10% ~16% ~6% ~2% ~10x
Waste Management, Inc. (WM)
Non-hazardous waste management
~18% ~28% ~11% ~6% ~14x
Peer Average ex. BCO ~16% ~23% ~6% ~5% ~16xAverage ex.
ROL ~14x
Industrial Services/Route-Based Peer Comparisons1
1. Financial metrics and calculations based on 2016-2019 fiscal year-end non-GAAP actuals and estimates, BCO guidance, Factset data and broker consensus estimates, publically available information, and internal estimates as of May 30, 2019. Components of the calculation may differ between companies. BCO EV/Adj. EBITDA calculation excludes retirement and postemployment benefit obligations.See detailed reconciliations of non-GAAP to GAAP results in the appendix.
2. Cash CapEx including CompuSafe®. Excludes financing leases.3. Adjusted to account for the disposition of American Home Shield in the fourth quarter of 2018. 4. Including Prosegur Cash SA (BME:CASH) and Loomis (OMX:LOOMB), the peer average is reduced from ~16x to ~14x.
4
22
2
3
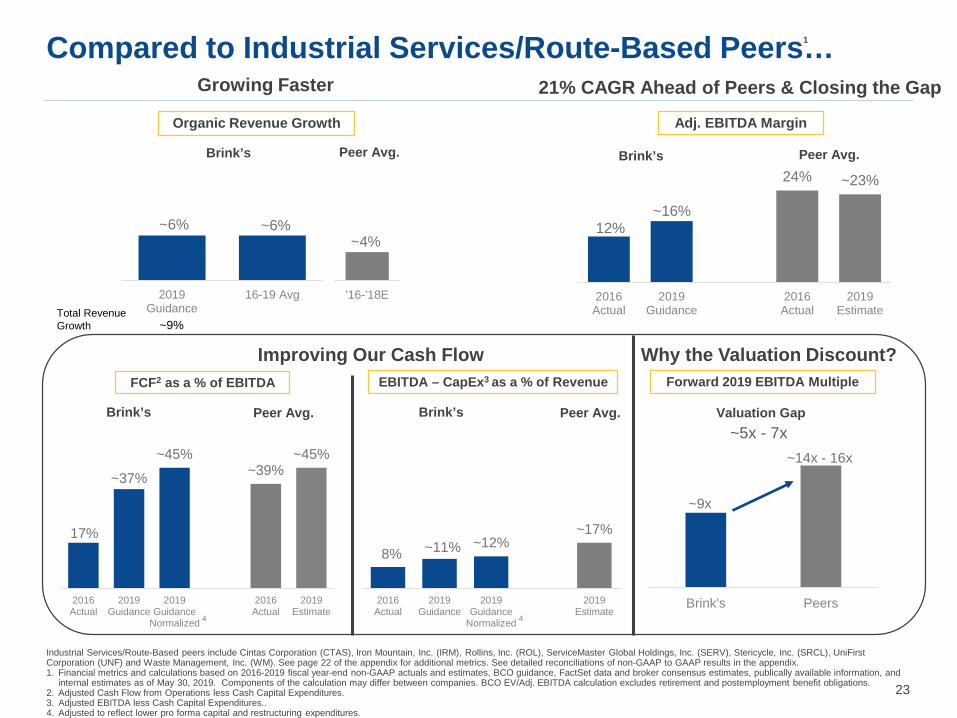
~6% ~6%
2019Guidance
16-19 Avg
Growing Faster
12%~16%
24% ~23%
2016Actual
2019Guidance
2016Actual
2019Estimate
~4%
'16-'18E
Organic Revenue Growth
~9x
~14x - 16x
Brink's Peers
Forward 2019 EBITDA Multiple
Adj. EBITDA Margin
Compared to Industrial Services/Route-Based Peers…
~5x - 7x
Industrial Services/Route-Based peers include Cintas Corporation (CTAS), Iron Mountain, Inc. (IRM), Rollins, Inc. (ROL), ServiceMaster Global Holdings, Inc. (SERV), Stericycle, Inc. (SRCL), UniFirstCorporation (UNF) and Waste Management, Inc. (WM). See page 22 of the appendix for additional metrics. See detailed reconciliations of non-GAAP to GAAP results in the appendix.1. Financial metrics and calculations based on 2016-2019 fiscal year-end non-GAAP actuals and estimates, BCO guidance, FactSet data and broker consensus estimates, publically available information, and
internal estimates as of May 30, 2019. Components of the calculation may differ between companies. BCO EV/Adj. EBITDA calculation excludes retirement and postemployment benefit obligations.2. Adjusted Cash Flow from Operations less Cash Capital Expenditures. 3. Adjusted EBITDA less Cash Capital Expenditures..4. Adjusted to reflect lower pro forma capital and restructuring expenditures.
1
Brink’s Peer Avg.
Valuation Gap
Brink’s Peer Avg.
~9%Total Revenue Growth
21% CAGR Ahead of Peers & Closing the Gap
17%
~37%
~45%~39%
~45%
2016Actual
2019Guidance
2019Guidance
Normalized
2016Actual
2019Estimate
8% ~11% ~12%~17%
2016Actual
2019Guidance
2019Guidance
Normalized
2019Estimate
FCF2 as a % of EBITDA EBITDA – CapEx3 as a % of Revenue
Brink’s Peer Avg. Brink’s Peer Avg.
4
Improving Our Cash Flow Why the Valuation Discount?
4
23
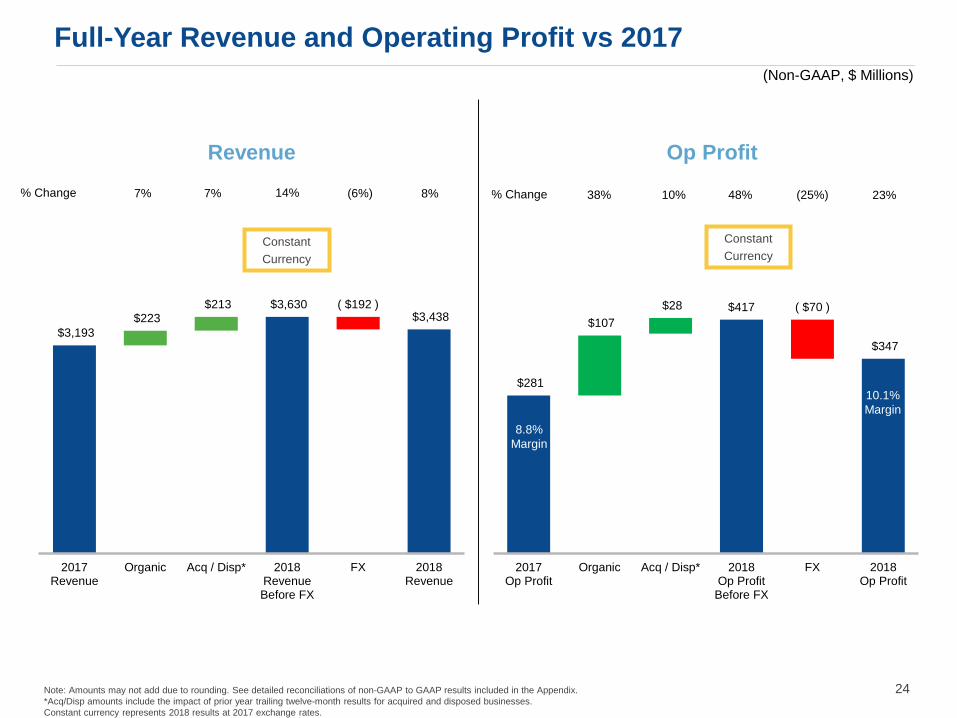
Full-Year Revenue and Operating Profit vs 2017
$281
$107 $28 $417 ( $70 )
$347
2017Op Profit
Organic Acq / Disp* 2018Op Profit
Before FX
FX 2018Op Profit
$3,193 $223
$213 $3,630 ( $192 )$3,438
2017Revenue
Organic Acq / Disp* 2018RevenueBefore FX
FX 2018Revenue
Note: Amounts may not add due to rounding. See detailed reconciliations of non-GAAP to GAAP results included in the Appendix. *Acq/Disp amounts include the impact of prior year trailing twelve-month results for acquired and disposed businesses. Constant currency represents 2018 results at 2017 exchange rates.
% Change (6%)7% 7% 8%14%
ConstantCurrency
ConstantCurrency
8.8%Margin
10.1%Margin
% Change (25%)38% 10% 23%48%
(Non-GAAP, $ Millions)
Revenue Op Profit
24
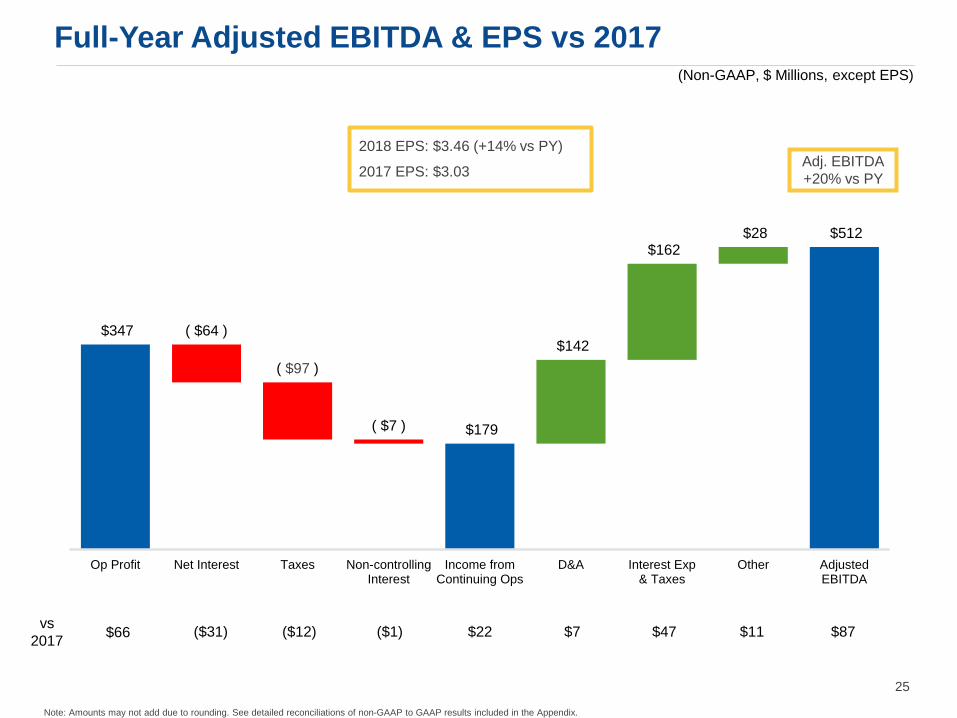
$347 ( $64 )
( $97 )
( $7 ) $179
$142
$162 $28 $512
Op Profit Net Interest Taxes Non-controllingInterest
Income fromContinuing Ops
D&A Interest Exp& Taxes
Other AdjustedEBITDA
$66vs2017 ($31) ($12) $22 $7 $47 $11 $87($1)
2018 EPS: $3.46 (+14% vs PY)
2017 EPS: $3.03
(Non-GAAP, $ Millions, except EPS)
Adj. EBITDA+20% vs PY
Note: Amounts may not add due to rounding. See detailed reconciliations of non-GAAP to GAAP results included in the Appendix.
Full-Year Adjusted EBITDA & EPS vs 2017
25
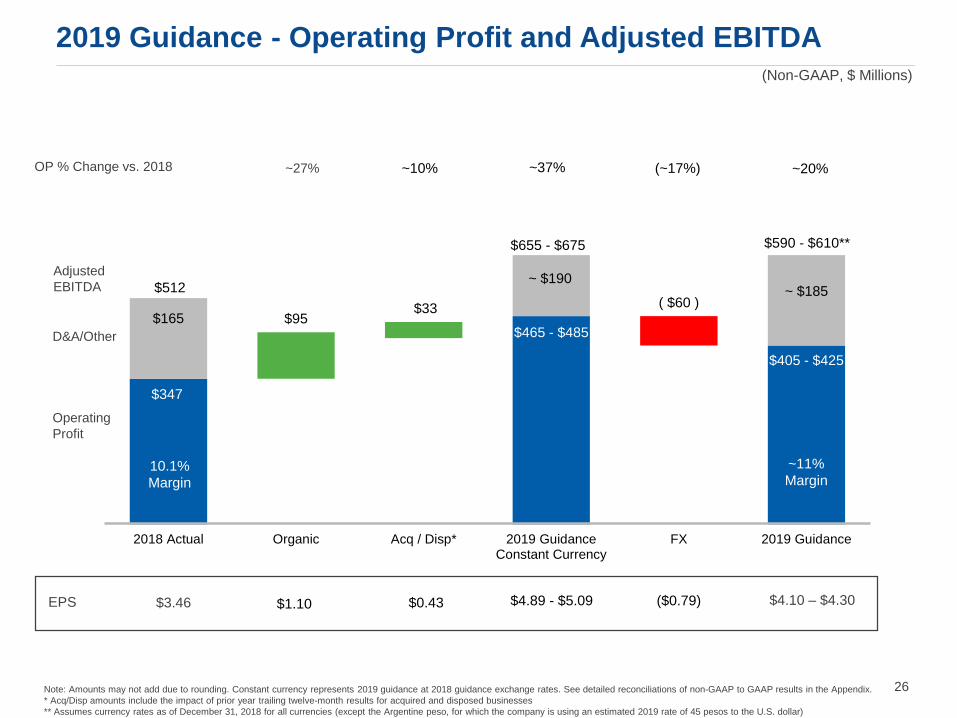
$347
$465 - $485
$405 - $425
$165 $95$33
~ $190
( $60 )~ $185
2018 Actual Organic Acq / Disp* 2019 GuidanceConstant Currency
FX 2019 Guidance
Note: Amounts may not add due to rounding. Constant currency represents 2019 guidance at 2018 guidance exchange rates. See detailed reconciliations of non-GAAP to GAAP results in the Appendix. * Acq/Disp amounts include the impact of prior year trailing twelve-month results for acquired and disposed businesses** Assumes currency rates as of December 31, 2018 for all currencies (except the Argentine peso, for which the company is using an estimated 2019 rate of 45 pesos to the U.S. dollar)
(Non-GAAP, $ Millions)
OP % Change vs. 2018 (~17%)~27% ~10% ~20%~37%
~11%Margin
10.1%Margin
$512
$655 - $675 $590 - $610**
OperatingProfit
AdjustedEBITDA
D&A/Other
EPS $4.10 – $4.30$3.46 $1.10 $0.43 $4.89 - $5.09 ($0.79)
2019 Guidance - Operating Profit and Adjusted EBITDA
26
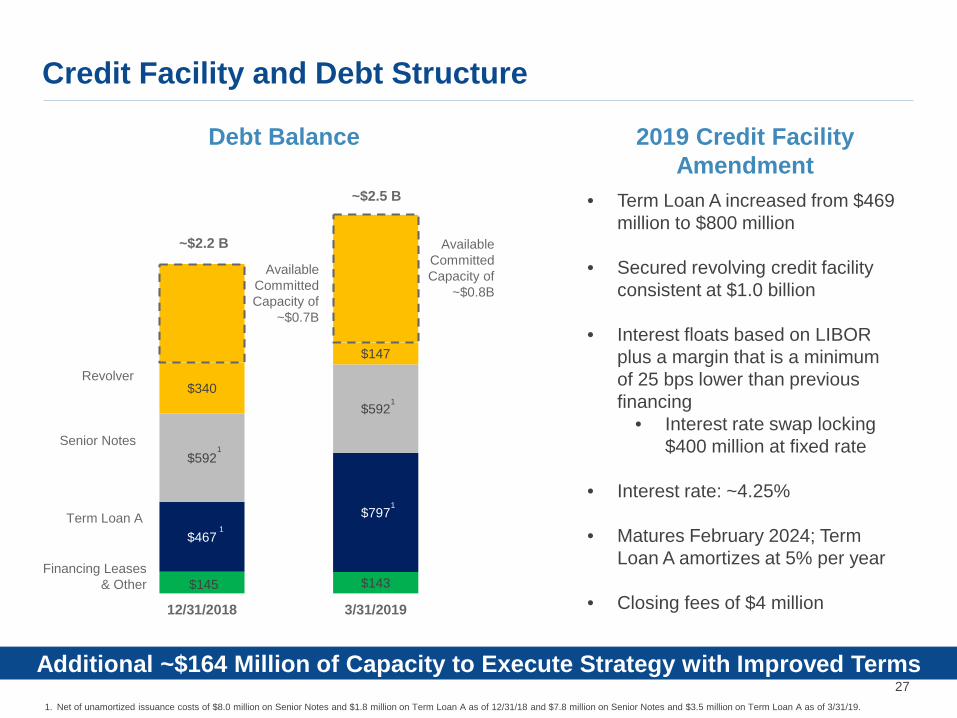
Credit Facility and Debt Structure
$145 $143
$467
$797
$592
$592$340
$147
12/31/2018 3/31/2019
Senior Notes
Term Loan A
Revolver
Financing Leases& Other
~$2.5 B
Available Committed Capacity of
~$0.8B
Available Committed Capacity of
~$0.7B
~$2.2 B
Debt Balance
Additional ~$164 Million of Capacity to Execute Strategy with Improved Terms
2019 Credit Facility Amendment
• Term Loan A increased from $469 million to $800 million
• Secured revolving credit facility consistent at $1.0 billion
• Interest floats based on LIBOR plus a margin that is a minimum of 25 bps lower than previous financing
• Interest rate swap locking $400 million at fixed rate
• Interest rate: ~4.25%
• Matures February 2024; Term Loan A amortizes at 5% per year
• Closing fees of $4 million
1. Net of unamortized issuance costs of $8.0 million on Senior Notes and $1.8 million on Term Loan A as of 12/31/18 and $7.8 million on Senior Notes and $3.5 million on Term Loan A as of 3/31/19.
1
1
1
1
27

Financing Capacity to Execute the Strategy
Ten-Year Senior Notes
• $600 million unsecured notes
• 4.625% interest rate
• Matures October 2027
Term Loan A
• $800 million secured Term Loan A
• Interest floats based on LIBOR plus a margin
• Current interest rate ~4.25%
• Amortizes at 5% per year with final maturity of February 2024
Revolver
• $1.0 billion secured revolving credit facility
• Interest floats based on LIBOR plus a margin
• Current interest rate ~4.25%
• Matures February 2024
Five-Year Credit Facility
Credit Facility & Senior Notes
28
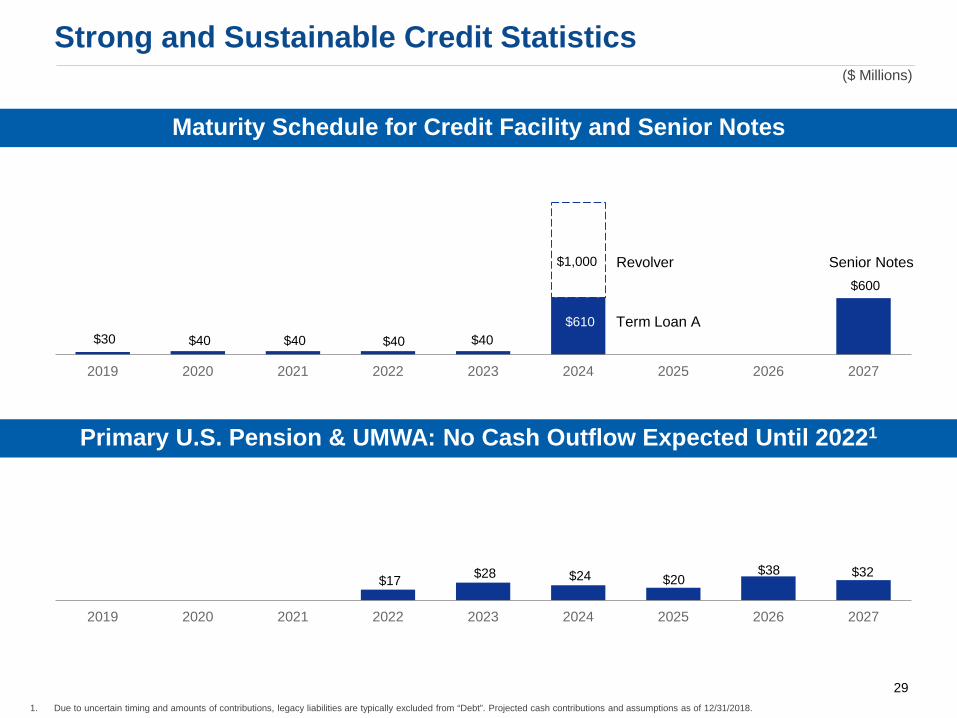
Strong and Sustainable Credit Statistics
$30 $40 $40 $40 $40 $610
$600
$1,000
2019 2020 2021 2022 2023 2024 2025 2026 2027
Term Loan A
Senior Notes
1. Due to uncertain timing and amounts of contributions, legacy liabilities are typically excluded from “Debt”. Projected cash contributions and assumptions as of 12/31/2018.
Revolver
Maturity Schedule for Credit Facility and Senior Notes
$17 $28 $24 $20 $38 $32
2019 2020 2021 2022 2023 2024 2025 2026 2027
Primary U.S. Pension & UMWA: No Cash Outflow Expected Until 20221
($ Millions)
29
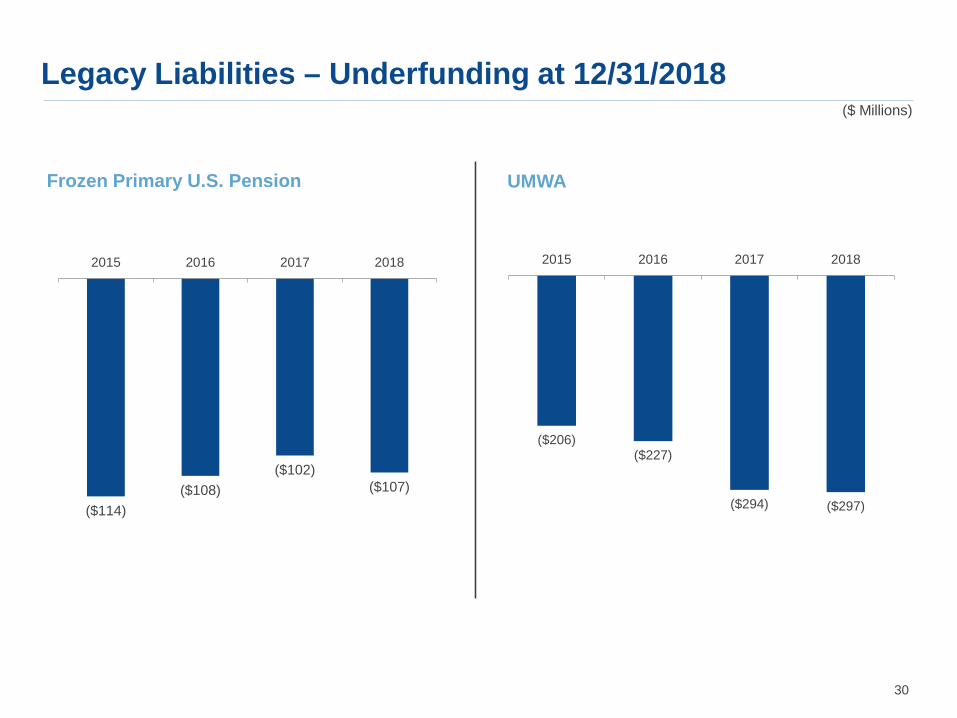
Legacy Liabilities – Underfunding at 12/31/2018
Frozen Primary U.S. Pension UMWA
($114)($108)
($102)($107)
2015 2016 2017 2018
Primary U.S. Pension
($206)($227)
($294) ($297)
2015 2016 2017 2018
UMWA
($ Millions)
30

• Prepaid pension payments in 2014 with an $87 million contribution − Accelerated de-risking of invested asset allocation
− Reduced PBGC premiums
− No cash payments expected for Primary U.S. Pension based on actuarial assumptions until 2022
− Remeasurement occurs every year-end with 10K filing
• No cash payments to UMWA expected until 2025 based on actuarial assumptions at 12/31/2018
Estimated Cash Payments to Frozen U.S. Pension Plan
Payments to Primary U.S. Pension Payments to UMWA
$17 $28 $24 $19 $6
2019 2020 2021 2022 2023 2024 2025 2026
$1 $32 $32
$504
2018 2025 2026 2027 After 2027
($ Millions)
31
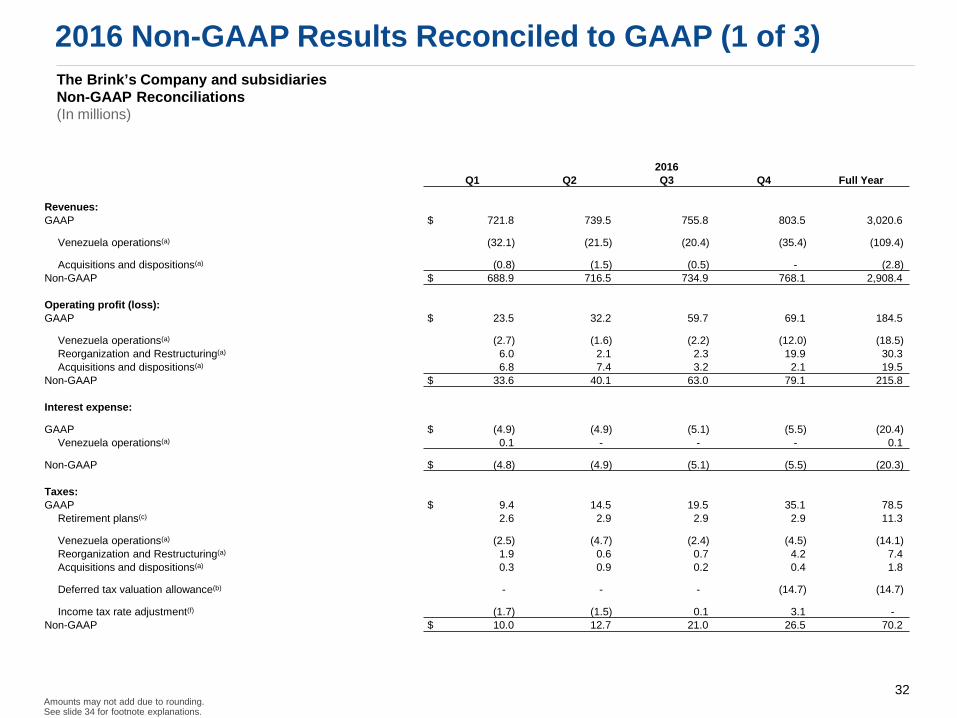
2016 Non-GAAP Results Reconciled to GAAP (1 of 3)The Brink’s Company and subsidiariesNon-GAAP Reconciliations (In millions)
Amounts may not add due to rounding.See slide 34 for footnote explanations.
2016Q1 Q2 Q3 Q4 Full Year
Revenues:GAAP $ 721.8 739.5 755.8 803.5 3,020.6
Venezuela operations(a) (32.1) (21.5) (20.4) (35.4) (109.4)
Acquisitions and dispositions(a) (0.8) (1.5) (0.5) - (2.8)Non-GAAP $ 688.9 716.5 734.9 768.1 2,908.4
Operating profit (loss):GAAP $ 23.5 32.2 59.7 69.1 184.5
Venezuela operations(a) (2.7) (1.6) (2.2) (12.0) (18.5)Reorganization and Restructuring(a) 6.0 2.1 2.3 19.9 30.3 Acquisitions and dispositions(a) 6.8 7.4 3.2 2.1 19.5
Non-GAAP $ 33.6 40.1 63.0 79.1 215.8
Interest expense:
GAAP $ (4.9) (4.9) (5.1) (5.5) (20.4)Venezuela operations(a) 0.1 - - - 0.1
Non-GAAP $ (4.8) (4.9) (5.1) (5.5) (20.3)
Taxes:GAAP $ 9.4 14.5 19.5 35.1 78.5
Retirement plans(c) 2.6 2.9 2.9 2.9 11.3
Venezuela operations(a) (2.5) (4.7) (2.4) (4.5) (14.1)Reorganization and Restructuring(a) 1.9 0.6 0.7 4.2 7.4 Acquisitions and dispositions(a) 0.3 0.9 0.2 0.4 1.8
Deferred tax valuation allowance(b) - - - (14.7) (14.7)
Income tax rate adjustment(f) (1.7) (1.5) 0.1 3.1 -Non-GAAP $ 10.0 12.7 21.0 26.5 70.2
32
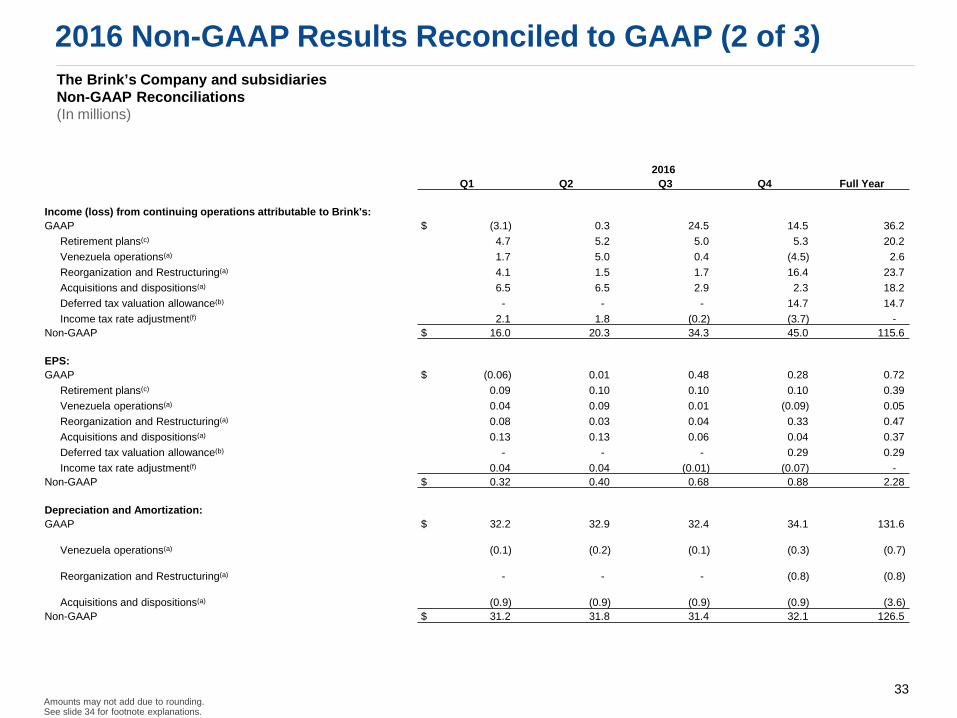
The Brink’s Company and subsidiariesNon-GAAP Reconciliations (In millions)
Amounts may not add due to rounding.See slide 34 for footnote explanations.
2016Q1 Q2 Q3 Q4 Full Year
Income (loss) from continuing operations attributable to Brink's:GAAP $ (3.1) 0.3 24.5 14.5 36.2
Retirement plans(c) 4.7 5.2 5.0 5.3 20.2 Venezuela operations(a) 1.7 5.0 0.4 (4.5) 2.6 Reorganization and Restructuring(a) 4.1 1.5 1.7 16.4 23.7 Acquisitions and dispositions(a) 6.5 6.5 2.9 2.3 18.2 Deferred tax valuation allowance(b) - - - 14.7 14.7 Income tax rate adjustment(f) 2.1 1.8 (0.2) (3.7) -
Non-GAAP $ 16.0 20.3 34.3 45.0 115.6
EPS:GAAP $ (0.06) 0.01 0.48 0.28 0.72
Retirement plans(c) 0.09 0.10 0.10 0.10 0.39 Venezuela operations(a) 0.04 0.09 0.01 (0.09) 0.05 Reorganization and Restructuring(a) 0.08 0.03 0.04 0.33 0.47 Acquisitions and dispositions(a) 0.13 0.13 0.06 0.04 0.37 Deferred tax valuation allowance(b) - - - 0.29 0.29 Income tax rate adjustment(f) 0.04 0.04 (0.01) (0.07) -
Non-GAAP $ 0.32 0.40 0.68 0.88 2.28
Depreciation and Amortization:GAAP $ 32.2 32.9 32.4 34.1 131.6
Venezuela operations(a) (0.1) (0.2) (0.1) (0.3) (0.7)
Reorganization and Restructuring(a) - - - (0.8) (0.8)
Acquisitions and dispositions(a) (0.9) (0.9) (0.9) (0.9) (3.6)Non-GAAP $ 31.2 31.8 31.4 32.1 126.5
2016 Non-GAAP Results Reconciled to GAAP (2 of 3)
33
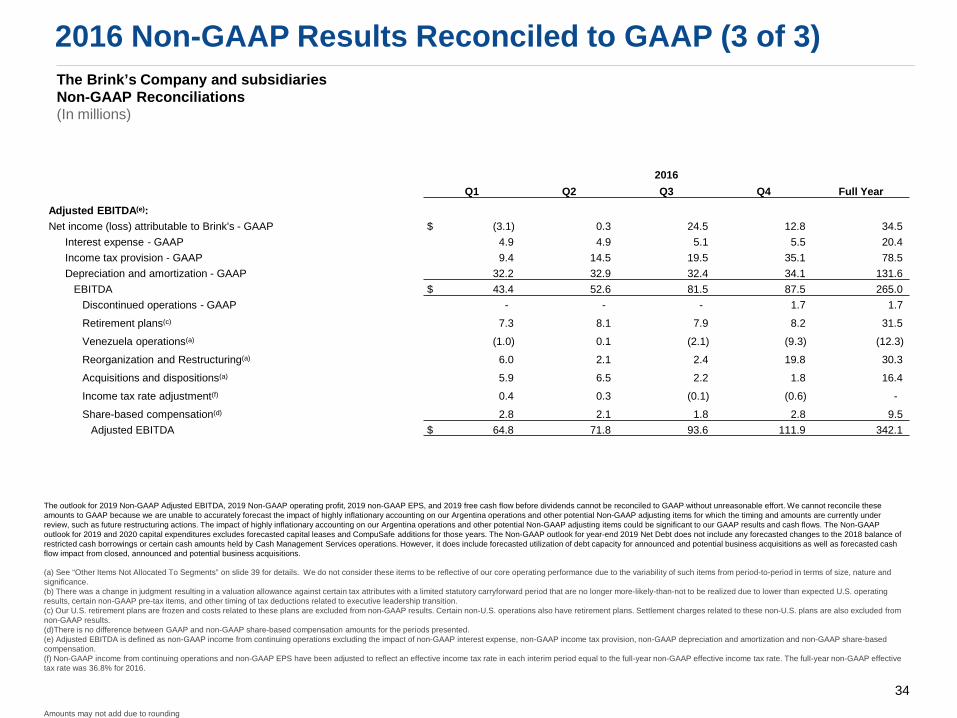
The Brink’s Company and subsidiariesNon-GAAP Reconciliations (In millions)
The outlook for 2019 Non-GAAP Adjusted EBITDA, 2019 Non-GAAP operating profit, 2019 non-GAAP EPS, and 2019 free cash flow before dividends cannot be reconciled to GAAP without unreasonable effort. We cannot reconcile these amounts to GAAP because we are unable to accurately forecast the impact of highly inflationary accounting on our Argentina operations and other potential Non-GAAP adjusting items for which the timing and amounts are currently under review, such as future restructuring actions. The impact of highly inflationary accounting on our Argentina operations and other potential Non-GAAP adjusting items could be significant to our GAAP results and cash flows. The Non-GAAP outlook for 2019 and 2020 capital expenditures excludes forecasted capital leases and CompuSafe additions for those years. The Non-GAAP outlook for year-end 2019 Net Debt does not include any forecasted changes to the 2018 balance of restricted cash borrowings or certain cash amounts held by Cash Management Services operations. However, it does include forecasted utilization of debt capacity for announced and potential business acquisitions as well as forecasted cash flow impact from closed, announced and potential business acquisitions.
Amounts may not add due to rounding
(a) See “Other Items Not Allocated To Segments” on slide 39 for details. We do not consider these items to be reflective of our core operating performance due to the variability of such items from period-to-period in terms of size, nature and significance. (b) There was a change in judgment resulting in a valuation allowance against certain tax attributes with a limited statutory carryforward period that are no longer more-likely-than-not to be realized due to lower than expected U.S. operating results, certain non-GAAP pre-tax items, and other timing of tax deductions related to executive leadership transition.(c) Our U.S. retirement plans are frozen and costs related to these plans are excluded from non-GAAP results. Certain non-U.S. operations also have retirement plans. Settlement charges related to these non-U.S. plans are also excluded from non-GAAP results.(d)There is no difference between GAAP and non-GAAP share-based compensation amounts for the periods presented.(e) Adjusted EBITDA is defined as non-GAAP income from continuing operations excluding the impact of non-GAAP interest expense, non-GAAP income tax provision, non-GAAP depreciation and amortization and non-GAAP share-based compensation. (f) Non-GAAP income from continuing operations and non-GAAP EPS have been adjusted to reflect an effective income tax rate in each interim period equal to the full-year non-GAAP effective income tax rate. The full-year non-GAAP effective tax rate was 36.8% for 2016.
2016Q1 Q2 Q3 Q4 Full Year
Adjusted EBITDA(e):Net income (loss) attributable to Brink's - GAAP $ (3.1) 0.3 24.5 12.8 34.5
Interest expense - GAAP 4.9 4.9 5.1 5.5 20.4 Income tax provision - GAAP 9.4 14.5 19.5 35.1 78.5 Depreciation and amortization - GAAP 32.2 32.9 32.4 34.1 131.6
EBITDA $ 43.4 52.6 81.5 87.5 265.0 Discontinued operations - GAAP - - - 1.7 1.7 Retirement plans(c) 7.3 8.1 7.9 8.2 31.5 Venezuela operations(a) (1.0) 0.1 (2.1) (9.3) (12.3)Reorganization and Restructuring(a) 6.0 2.1 2.4 19.8 30.3 Acquisitions and dispositions(a) 5.9 6.5 2.2 1.8 16.4 Income tax rate adjustment(f) 0.4 0.3 (0.1) (0.6) -Share-based compensation(d) 2.8 2.1 1.8 2.8 9.5
Adjusted EBITDA $ 64.8 71.8 93.6 111.9 342.1
2016 Non-GAAP Results Reconciled to GAAP (3 of 3)
34
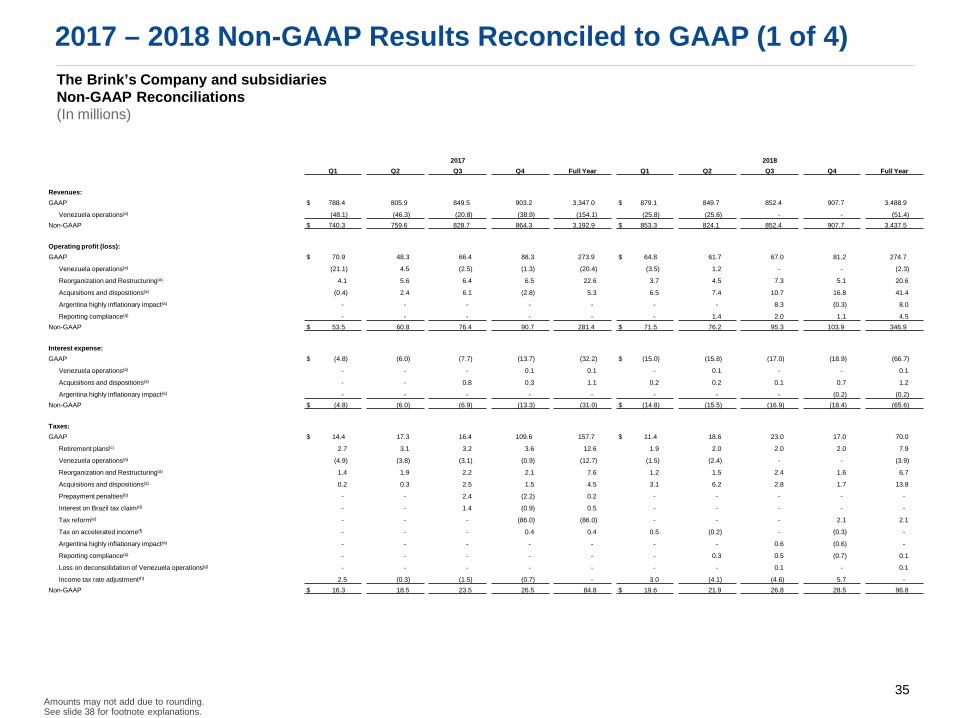
The Brink’s Company and subsidiariesNon-GAAP Reconciliations (In millions)
2017 – 2018 Non-GAAP Results Reconciled to GAAP (1 of 4)
2017 2018Q1 Q2 Q3 Q4 Full Year Q1 Q2 Q3 Q4 Full Year
Revenues:GAAP $ 788.4 805.9 849.5 903.2 3,347.0 $ 879.1 849.7 852.4 907.7 3,488.9
Venezuela operations(a) (48.1) (46.3) (20.8) (38.9) (154.1) (25.8) (25.6) - - (51.4)Non-GAAP $ 740.3 759.6 828.7 864.3 3,192.9 $ 853.3 824.1 852.4 907.7 3,437.5
Operating profit (loss):GAAP $ 70.9 48.3 66.4 88.3 273.9 $ 64.8 61.7 67.0 81.2 274.7
Venezuela operations(a) (21.1) 4.5 (2.5) (1.3) (20.4) (3.5) 1.2 - - (2.3)
Reorganization and Restructuring(a) 4.1 5.6 6.4 6.5 22.6 3.7 4.5 7.3 5.1 20.6
Acquisitions and dispositions(a) (0.4) 2.4 6.1 (2.8) 5.3 6.5 7.4 10.7 16.8 41.4
Argentina highly inflationary impact(a) - - - - - - - 8.3 (0.3) 8.0
Reporting compliance(a) - - - - - - 1.4 2.0 1.1 4.5 Non-GAAP $ 53.5 60.8 76.4 90.7 281.4 $ 71.5 76.2 95.3 103.9 346.9
Interest expense:GAAP $ (4.8) (6.0) (7.7) (13.7) (32.2) $ (15.0) (15.8) (17.0) (18.9) (66.7)
Venezuela operations(a) - - - 0.1 0.1 - 0.1 - - 0.1
Acquisitions and dispositions(a) - - 0.8 0.3 1.1 0.2 0.2 0.1 0.7 1.2
Argentina highly inflationary impact(a) - - - - - - - - (0.2) (0.2)Non-GAAP $ (4.8) (6.0) (6.9) (13.3) (31.0) $ (14.8) (15.5) (16.9) (18.4) (65.6)
Taxes:GAAP $ 14.4 17.3 16.4 109.6 157.7 $ 11.4 18.6 23.0 17.0 70.0
Retirement plans(c) 2.7 3.1 3.2 3.6 12.6 1.9 2.0 2.0 2.0 7.9
Venezuela operations(a) (4.9) (3.8) (3.1) (0.9) (12.7) (1.5) (2.4) - - (3.9)
Reorganization and Restructuring(a) 1.4 1.9 2.2 2.1 7.6 1.2 1.5 2.4 1.6 6.7
Acquisitions and dispositions(a) 0.2 0.3 2.5 1.5 4.5 3.1 6.2 2.8 1.7 13.8
Prepayment penalties(b) - - 2.4 (2.2) 0.2 - - - - -
Interest on Brazil tax claim(d) - - 1.4 (0.9) 0.5 - - - - -
Tax reform(e) - - - (86.0) (86.0) - - - 2.1 2.1
Tax on accelerated income(f) - - - 0.4 0.4 0.5 (0.2) - (0.3) -
Argentina highly inflationary impact(a) - - - - - - - 0.6 (0.6) -
Reporting compliance(a) - - - - - - 0.3 0.5 (0.7) 0.1
Loss on deconsolidation of Venezuela operations(g) - - - - - - - 0.1 - 0.1
Income tax rate adjustment(h) 2.5 (0.3) (1.5) (0.7) - 3.0 (4.1) (4.6) 5.7 -Non-GAAP $ 16.3 18.5 23.5 26.5 84.8 $ 19.6 21.9 26.8 28.5 96.8
Amounts may not add due to rounding.See slide 38 for footnote explanations.
35
The Brink’s Company and subsidiariesNon-GAAP Reconciliations (In millions)
2017 – 2018 Non-GAAP Results Reconciled to GAAP (2 of 4)
Amounts may not add due to rounding.See slide 38 for footnote explanations.
2017 2018Q1 Q2 Q3 Q4 Full Year Q1 Q2 Q3 Q4 Full Year
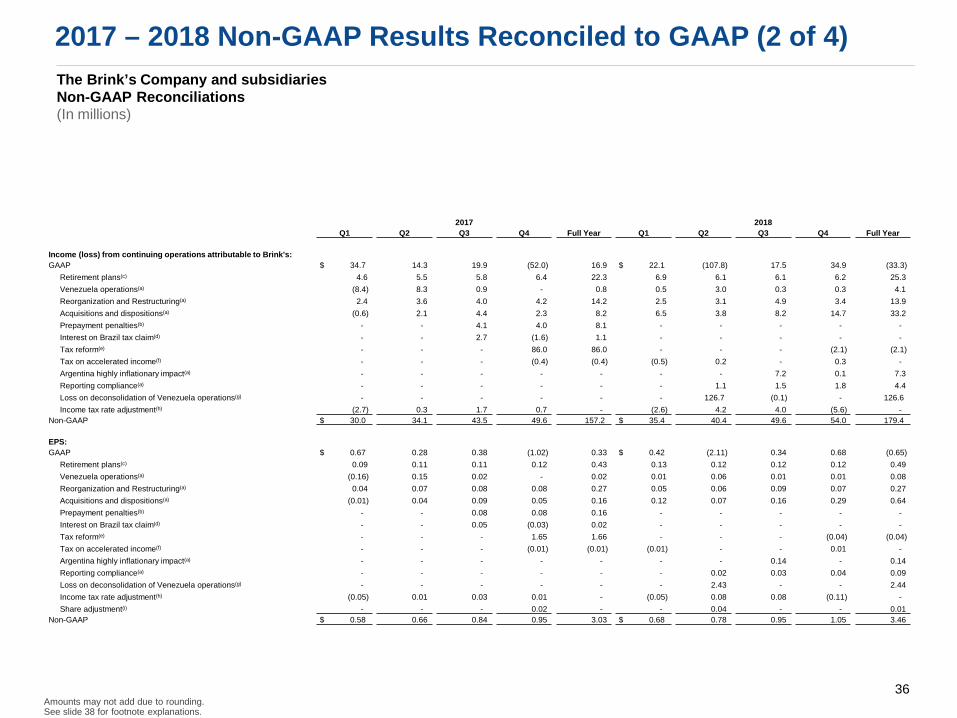
Income (loss) from continuing operations attributable to Brink's:GAAP $ 34.7 14.3 19.9 (52.0) 16.9 $ 22.1 (107.8) 17.5 34.9 (33.3)
Retirement plans(c) 4.6 5.5 5.8 6.4 22.3 6.9 6.1 6.1 6.2 25.3 Venezuela operations(a) (8.4) 8.3 0.9 - 0.8 0.5 3.0 0.3 0.3 4.1 Reorganization and Restructuring(a) 2.4 3.6 4.0 4.2 14.2 2.5 3.1 4.9 3.4 13.9 Acquisitions and dispositions(a) (0.6) 2.1 4.4 2.3 8.2 6.5 3.8 8.2 14.7 33.2 Prepayment penalties(b) - - 4.1 4.0 8.1 - - - - -Interest on Brazil tax claim(d) - - 2.7 (1.6) 1.1 - - - - -Tax reform(e) - - - 86.0 86.0 - - - (2.1) (2.1)Tax on accelerated income(f) - - - (0.4) (0.4) (0.5) 0.2 - 0.3 -Argentina highly inflationary impact(a) - - - - - - - 7.2 0.1 7.3 Reporting compliance(a) - - - - - - 1.1 1.5 1.8 4.4 Loss on deconsolidation of Venezuela operations(g) - - - - - - 126.7 (0.1) - 126.6 Income tax rate adjustment(h) (2.7) 0.3 1.7 0.7 - (2.6) 4.2 4.0 (5.6) -
Non-GAAP $ 30.0 34.1 43.5 49.6 157.2 $ 35.4 40.4 49.6 54.0 179.4
EPS:GAAP $ 0.67 0.28 0.38 (1.02) 0.33 $ 0.42 (2.11) 0.34 0.68 (0.65)
Retirement plans(c) 0.09 0.11 0.11 0.12 0.43 0.13 0.12 0.12 0.12 0.49 Venezuela operations(a) (0.16) 0.15 0.02 - 0.02 0.01 0.06 0.01 0.01 0.08 Reorganization and Restructuring(a) 0.04 0.07 0.08 0.08 0.27 0.05 0.06 0.09 0.07 0.27 Acquisitions and dispositions(a) (0.01) 0.04 0.09 0.05 0.16 0.12 0.07 0.16 0.29 0.64 Prepayment penalties(b) - - 0.08 0.08 0.16 - - - - -Interest on Brazil tax claim(d) - - 0.05 (0.03) 0.02 - - - - -Tax reform(e) - - - 1.65 1.66 - - - (0.04) (0.04)Tax on accelerated income(f) - - - (0.01) (0.01) (0.01) - - 0.01 -Argentina highly inflationary impact(a) - - - - - - - 0.14 - 0.14 Reporting compliance(a) - - - - - - 0.02 0.03 0.04 0.09 Loss on deconsolidation of Venezuela operations(g) - - - - - - 2.43 - - 2.44 Income tax rate adjustment(h) (0.05) 0.01 0.03 0.01 - (0.05) 0.08 0.08 (0.11) -Share adjustment(i) - - - 0.02 - - 0.04 - - 0.01
Non-GAAP $ 0.58 0.66 0.84 0.95 3.03 $ 0.68 0.78 0.95 1.05 3.46
36
The Brink’s Company and subsidiariesNon-GAAP Reconciliations (In millions)
2017 – 2018 Non-GAAP Results Reconciled to GAAP (3 of 4)
Amounts may not add due to rounding.See slide 38 for footnote explanations.
2017 2018Q1 Q2 Q3 Q4 Full Year Q1 Q2 Q3 Q4 Full Year
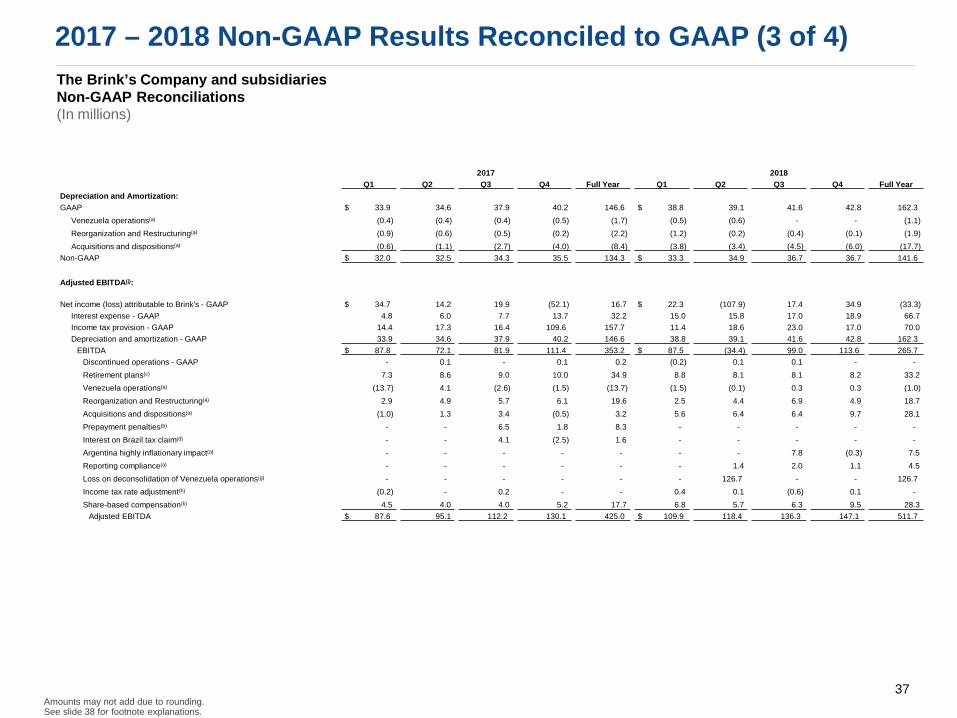
Depreciation and Amortization:GAAP $ 33.9 34.6 37.9 40.2 146.6 $ 38.8 39.1 41.6 42.8 162.3
Venezuela operations(a) (0.4) (0.4) (0.4) (0.5) (1.7) (0.5) (0.6) - - (1.1)Reorganization and Restructuring(a) (0.9) (0.6) (0.5) (0.2) (2.2) (1.2) (0.2) (0.4) (0.1) (1.9)Acquisitions and dispositions(a) (0.6) (1.1) (2.7) (4.0) (8.4) (3.8) (3.4) (4.5) (6.0) (17.7)
Non-GAAP $ 32.0 32.5 34.3 35.5 134.3 $ 33.3 34.9 36.7 36.7 141.6
Adjusted EBITDA(j):
Net income (loss) attributable to Brink's - GAAP $ 34.7 14.2 19.9 (52.1) 16.7 $ 22.3 (107.9) 17.4 34.9 (33.3)Interest expense - GAAP 4.8 6.0 7.7 13.7 32.2 15.0 15.8 17.0 18.9 66.7 Income tax provision - GAAP 14.4 17.3 16.4 109.6 157.7 11.4 18.6 23.0 17.0 70.0 Depreciation and amortization - GAAP 33.9 34.6 37.9 40.2 146.6 38.8 39.1 41.6 42.8 162.3
EBITDA $ 87.8 72.1 81.9 111.4 353.2 $ 87.5 (34.4) 99.0 113.6 265.7 Discontinued operations - GAAP - 0.1 - 0.1 0.2 (0.2) 0.1 0.1 - -Retirement plans(c) 7.3 8.6 9.0 10.0 34.9 8.8 8.1 8.1 8.2 33.2 Venezuela operations(a) (13.7) 4.1 (2.6) (1.5) (13.7) (1.5) (0.1) 0.3 0.3 (1.0)Reorganization and Restructuring(a) 2.9 4.9 5.7 6.1 19.6 2.5 4.4 6.9 4.9 18.7 Acquisitions and dispositions(a) (1.0) 1.3 3.4 (0.5) 3.2 5.6 6.4 6.4 9.7 28.1 Prepayment penalties(b) - - 6.5 1.8 8.3 - - - - -Interest on Brazil tax claim(d) - - 4.1 (2.5) 1.6 - - - - -Argentina highly inflationary impact(a) - - - - - - - 7.8 (0.3) 7.5 Reporting compliance(a) - - - - - - 1.4 2.0 1.1 4.5 Loss on deconsolidation of Venezuela operations(g) - - - - - - 126.7 - - 126.7 Income tax rate adjustment(h) (0.2) - 0.2 - - 0.4 0.1 (0.6) 0.1 -Share-based compensation(k) 4.5 4.0 4.0 5.2 17.7 6.8 5.7 6.3 9.5 28.3
Adjusted EBITDA $ 87.6 95.1 112.2 130.1 425.0 $ 109.9 118.4 136.3 147.1 511.7
37
2017 – 2018 Non-GAAP Results Reconciled to GAAP (4 of 4)
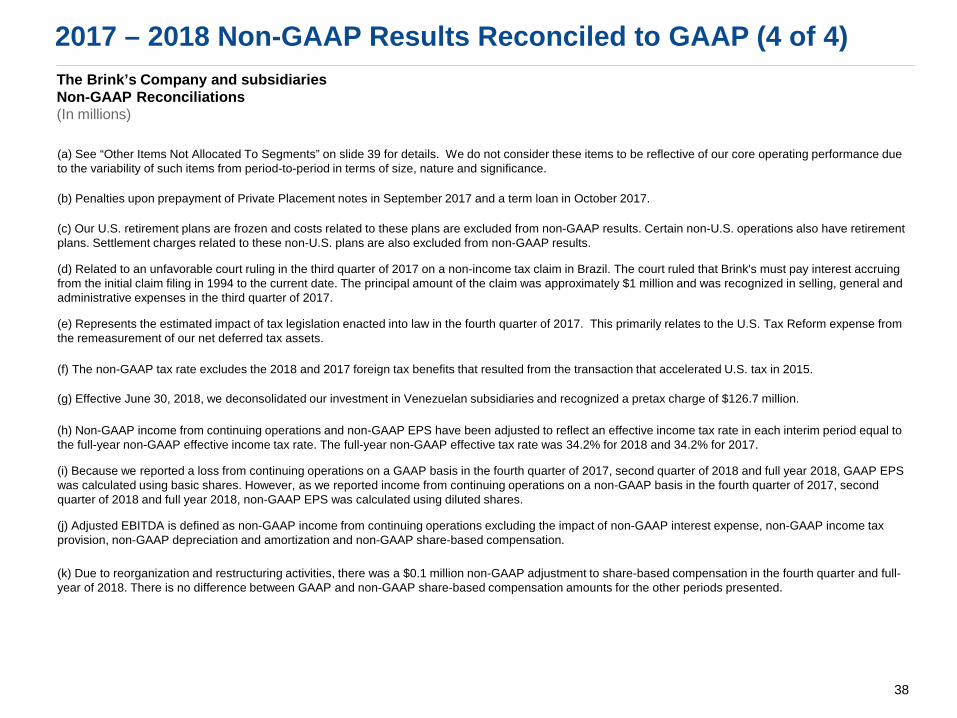
(a) See “Other Items Not Allocated To Segments” on slide 39 for details. We do not consider these items to be reflective of our core operating performance due to the variability of such items from period-to-period in terms of size, nature and significance.
(b) Penalties upon prepayment of Private Placement notes in September 2017 and a term loan in October 2017.
(c) Our U.S. retirement plans are frozen and costs related to these plans are excluded from non-GAAP results. Certain non-U.S. operations also have retirement plans. Settlement charges related to these non-U.S. plans are also excluded from non-GAAP results.
(d) Related to an unfavorable court ruling in the third quarter of 2017 on a non-income tax claim in Brazil. The court ruled that Brink's must pay interest accruing from the initial claim filing in 1994 to the current date. The principal amount of the claim was approximately $1 million and was recognized in selling, general and administrative expenses in the third quarter of 2017.
(e) Represents the estimated impact of tax legislation enacted into law in the fourth quarter of 2017. This primarily relates to the U.S. Tax Reform expense from the remeasurement of our net deferred tax assets.
(f) The non-GAAP tax rate excludes the 2018 and 2017 foreign tax benefits that resulted from the transaction that accelerated U.S. tax in 2015.
(g) Effective June 30, 2018, we deconsolidated our investment in Venezuelan subsidiaries and recognized a pretax charge of $126.7 million.
(h) Non-GAAP income from continuing operations and non-GAAP EPS have been adjusted to reflect an effective income tax rate in each interim period equal to the full-year non-GAAP effective income tax rate. The full-year non-GAAP effective tax rate was 34.2% for 2018 and 34.2% for 2017.
(i) Because we reported a loss from continuing operations on a GAAP basis in the fourth quarter of 2017, second quarter of 2018 and full year 2018, GAAP EPS was calculated using basic shares. However, as we reported income from continuing operations on a non-GAAP basis in the fourth quarter of 2017, second quarter of 2018 and full year 2018, non-GAAP EPS was calculated using diluted shares.
(j) Adjusted EBITDA is defined as non-GAAP income from continuing operations excluding the impact of non-GAAP interest expense, non-GAAP income tax provision, non-GAAP depreciation and amortization and non-GAAP share-based compensation.
(k) Due to reorganization and restructuring activities, there was a $0.1 million non-GAAP adjustment to share-based compensation in the fourth quarter and full-year of 2018. There is no difference between GAAP and non-GAAP share-based compensation amounts for the other periods presented.
The Brink’s Company and subsidiariesNon-GAAP Reconciliations (In millions)
38
The Brink’s Company and subsidiariesOther Items Not Allocated to Segments (Unaudited))
Non-GAAP Reconciliation - Other
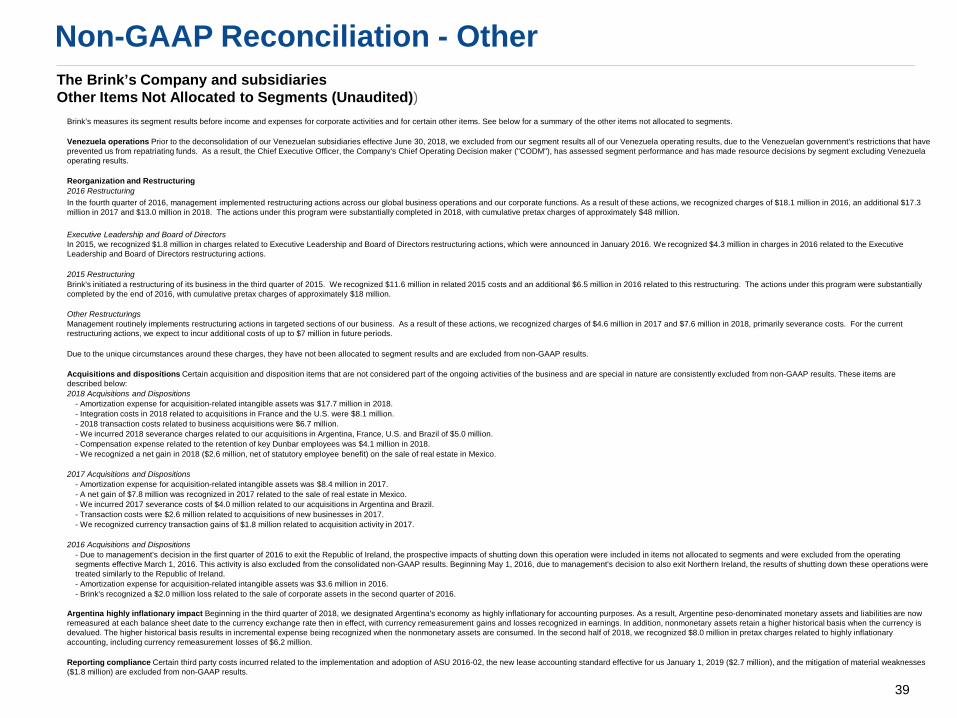
Brink’s measures its segment results before income and expenses for corporate activities and for certain other items. See below for a summary of the other items not allocated to segments.
Venezuela operations Prior to the deconsolidation of our Venezuelan subsidiaries effective June 30, 2018, we excluded from our segment results all of our Venezuela operating results, due to the Venezuelan government's restrictions that have prevented us from repatriating funds. As a result, the Chief Executive Officer, the Company's Chief Operating Decision maker ("CODM"), has assessed segment performance and has made resource decisions by segment excluding Venezuela operating results.
Reorganization and Restructuring 2016 RestructuringIn the fourth quarter of 2016, management implemented restructuring actions across our global business operations and our corporate functions. As a result of these actions, we recognized charges of $18.1 million in 2016, an additional $17.3 million in 2017 and $13.0 million in 2018. The actions under this program were substantially completed in 2018, with cumulative pretax charges of approximately $48 million.
Executive Leadership and Board of DirectorsIn 2015, we recognized $1.8 million in charges related to Executive Leadership and Board of Directors restructuring actions, which were announced in January 2016. We recognized $4.3 million in charges in 2016 related to the Executive Leadership and Board of Directors restructuring actions.
2015 RestructuringBrink's initiated a restructuring of its business in the third quarter of 2015. We recognized $11.6 million in related 2015 costs and an additional $6.5 million in 2016 related to this restructuring. The actions under this program were substantially completed by the end of 2016, with cumulative pretax charges of approximately $18 million.
Other Restructurings Management routinely implements restructuring actions in targeted sections of our business. As a result of these actions, we recognized charges of $4.6 million in 2017 and $7.6 million in 2018, primarily severance costs. For the current restructuring actions, we expect to incur additional costs of up to $7 million in future periods.
Due to the unique circumstances around these charges, they have not been allocated to segment results and are excluded from non-GAAP results.
Acquisitions and dispositions Certain acquisition and disposition items that are not considered part of the ongoing activities of the business and are special in nature are consistently excluded from non-GAAP results. These items are described below:2018 Acquisitions and Dispositions
- Amortization expense for acquisition-related intangible assets was $17.7 million in 2018.- Integration costs in 2018 related to acquisitions in France and the U.S. were $8.1 million.- 2018 transaction costs related to business acquisitions were $6.7 million.- We incurred 2018 severance charges related to our acquisitions in Argentina, France, U.S. and Brazil of $5.0 million. - Compensation expense related to the retention of key Dunbar employees was $4.1 million in 2018.- We recognized a net gain in 2018 ($2.6 million, net of statutory employee benefit) on the sale of real estate in Mexico.
2017 Acquisitions and Dispositions- Amortization expense for acquisition-related intangible assets was $8.4 million in 2017. - A net gain of $7.8 million was recognized in 2017 related to the sale of real estate in Mexico.- We incurred 2017 severance costs of $4.0 million related to our acquisitions in Argentina and Brazil. - Transaction costs were $2.6 million related to acquisitions of new businesses in 2017.- We recognized currency transaction gains of $1.8 million related to acquisition activity in 2017.
2016 Acquisitions and Dispositions- Due to management's decision in the first quarter of 2016 to exit the Republic of Ireland, the prospective impacts of shutting down this operation were included in items not allocated to segments and were excluded from the operating segments effective March 1, 2016. This activity is also excluded from the consolidated non-GAAP results. Beginning May 1, 2016, due to management's decision to also exit Northern Ireland, the results of shutting down these operations were treated similarly to the Republic of Ireland. - Amortization expense for acquisition-related intangible assets was $3.6 million in 2016.- Brink's recognized a $2.0 million loss related to the sale of corporate assets in the second quarter of 2016.
Argentina highly inflationary impact Beginning in the third quarter of 2018, we designated Argentina's economy as highly inflationary for accounting purposes. As a result, Argentine peso-denominated monetary assets and liabilities are now remeasured at each balance sheet date to the currency exchange rate then in effect, with currency remeasurement gains and losses recognized in earnings. In addition, nonmonetary assets retain a higher historical basis when the currency is devalued. The higher historical basis results in incremental expense being recognized when the nonmonetary assets are consumed. In the second half of 2018, we recognized $8.0 million in pretax charges related to highly inflationary accounting, including currency remeasurement losses of $6.2 million.
Reporting compliance Certain third party costs incurred related to the implementation and adoption of ASU 2016-02, the new lease accounting standard effective for us January 1, 2019 ($2.7 million), and the mitigation of material weaknesses ($1.8 million) are excluded from non-GAAP results.
39
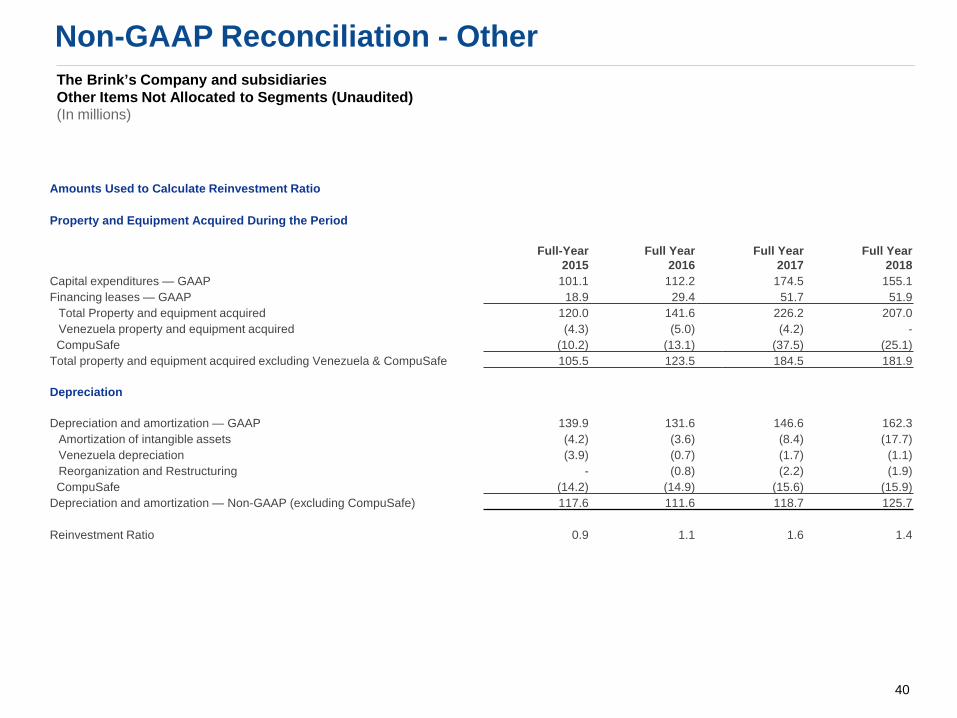
The Brink’s Company and subsidiariesOther Items Not Allocated to Segments (Unaudited)(In millions)
Non-GAAP Reconciliation - Other
40
Amounts Used to Calculate Reinvestment Ratio
Property and Equipment Acquired During the Period
Full-Year2015
Full Year2016
Full Year2017
Full Year2018
Capital expenditures — GAAP 101.1 112.2 174.5 155.1Financing leases — GAAP 18.9 29.4 51.7 51.9
Total Property and equipment acquired 120.0 141.6 226.2 207.0Venezuela property and equipment acquired (4.3) (5.0) (4.2) -CompuSafe (10.2) (13.1) (37.5) (25.1)
Total property and equipment acquired excluding Venezuela & CompuSafe 105.5 123.5 184.5 181.9
Depreciation
Depreciation and amortization — GAAP 139.9 131.6 146.6 162.3Amortization of intangible assets (4.2) (3.6) (8.4) (17.7)Venezuela depreciation (3.9) (0.7) (1.7) (1.1)Reorganization and Restructuring - (0.8) (2.2) (1.9)CompuSafe (14.2) (14.9) (15.6) (15.9)
Depreciation and amortization — Non-GAAP (excluding CompuSafe) 117.6 111.6 118.7 125.7
Reinvestment Ratio 0.9 1.1 1.6 1.4
The Brink’s Company and subsidiariesOther Items Not Allocated to Segments (Unaudited)(In millions)
Non-GAAP Reconciliation – Cash Flows
41
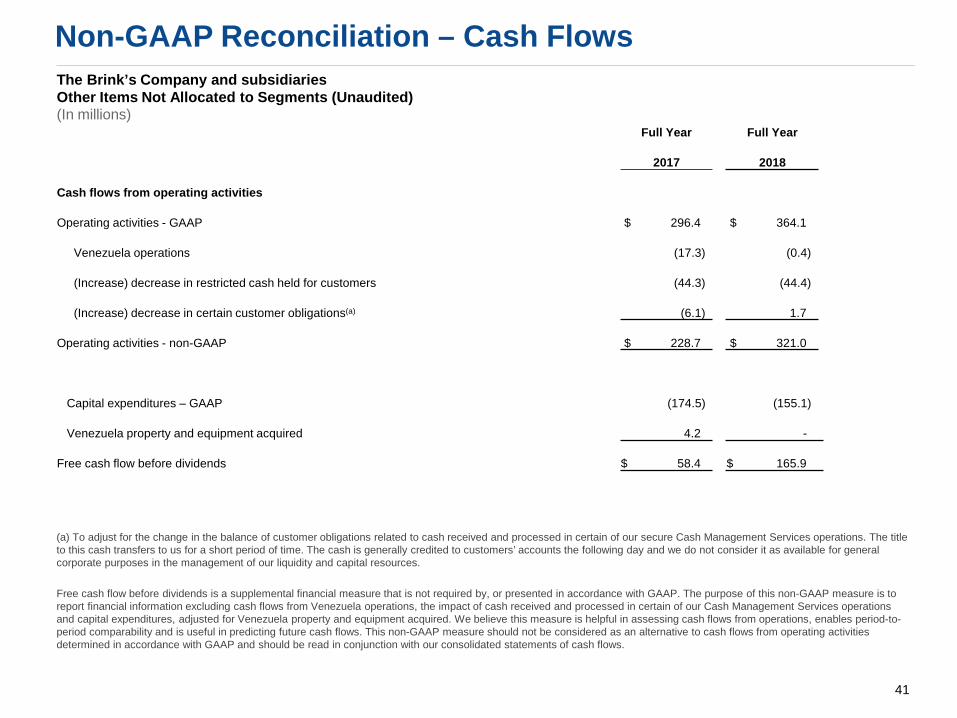
Full Year Full Year
2017 2018
Cash flows from operating activities
Operating activities - GAAP $ 296.4 $ 364.1
Venezuela operations (17.3) (0.4)
(Increase) decrease in restricted cash held for customers (44.3) (44.4)
(Increase) decrease in certain customer obligations(a) (6.1) 1.7
Operating activities - non-GAAP $ 228.7 $ 321.0
Capital expenditures – GAAP (174.5) (155.1)
Venezuela property and equipment acquired 4.2 -
Free cash flow before dividends $ 58.4 $ 165.9
(a) To adjust for the change in the balance of customer obligations related to cash received and processed in certain of our secure Cash Management Services operations. The title to this cash transfers to us for a short period of time. The cash is generally credited to customers’ accounts the following day and we do not consider it as available for general corporate purposes in the management of our liquidity and capital resources.
Free cash flow before dividends is a supplemental financial measure that is not required by, or presented in accordance with GAAP. The purpose of this non-GAAP measure is to report financial information excluding cash flows from Venezuela operations, the impact of cash received and processed in certain of our Cash Management Services operations and capital expenditures, adjusted for Venezuela property and equipment acquired. We believe this measure is helpful in assessing cash flows from operations, enables period-to-period comparability and is useful in predicting future cash flows. This non-GAAP measure should not be considered as an alternative to cash flows from operating activities determined in accordance with GAAP and should be read in conjunction with our consolidated statements of cash flows.
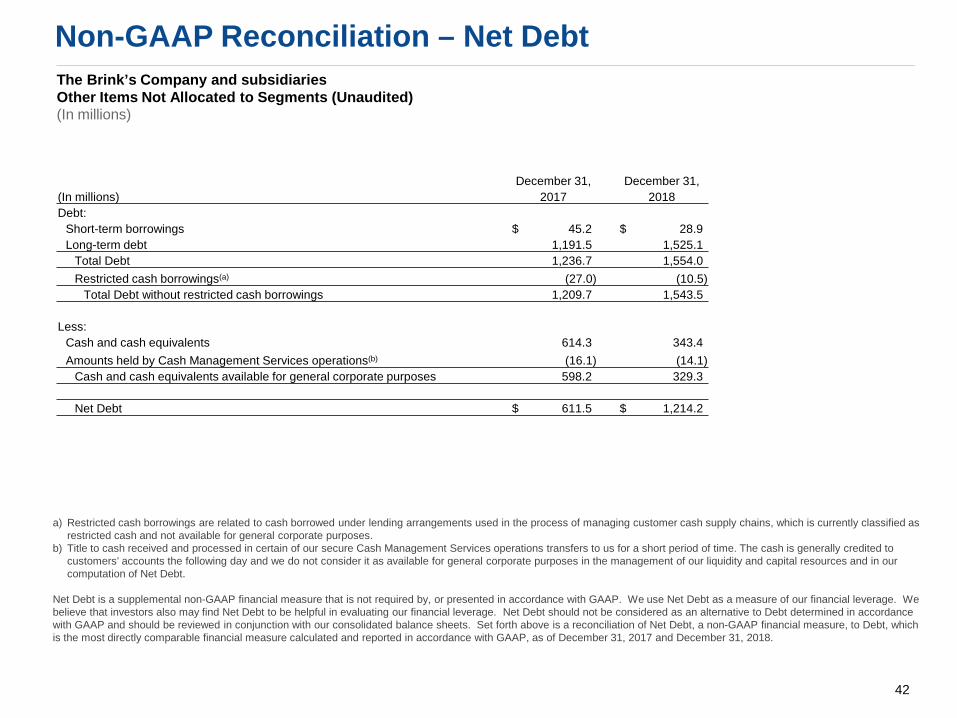
The Brink’s Company and subsidiariesOther Items Not Allocated to Segments (Unaudited)(In millions)
Non-GAAP Reconciliation – Net Debt
42
a) Restricted cash borrowings are related to cash borrowed under lending arrangements used in the process of managing customer cash supply chains, which is currently classified as restricted cash and not available for general corporate purposes.
b) Title to cash received and processed in certain of our secure Cash Management Services operations transfers to us for a short period of time. The cash is generally credited to customers’ accounts the following day and we do not consider it as available for general corporate purposes in the management of our liquidity and capital resources and in our computation of Net Debt.
Net Debt is a supplemental non-GAAP financial measure that is not required by, or presented in accordance with GAAP. We use Net Debt as a measure of our financial leverage. We believe that investors also may find Net Debt to be helpful in evaluating our financial leverage. Net Debt should not be considered as an alternative to Debt determined in accordance with GAAP and should be reviewed in conjunction with our consolidated balance sheets. Set forth above is a reconciliation of Net Debt, a non-GAAP financial measure, to Debt, which is the most directly comparable financial measure calculated and reported in accordance with GAAP, as of December 31, 2017 and December 31, 2018.
December 31, December 31,(In millions) 2017 2018Debt:
Short-term borrowings $ 45.2 $ 28.9 Long-term debt 1,191.5 1,525.1
Total Debt 1,236.7 1,554.0 Restricted cash borrowings(a) (27.0) (10.5)
Total Debt without restricted cash borrowings 1,209.7 1,543.5
Less:Cash and cash equivalents 614.3 343.4 Amounts held by Cash Management Services operations(b) (16.1) (14.1)
Cash and cash equivalents available for general corporate purposes 598.2 329.3
Net Debt $ 611.5 $ 1,214.2
Recommended