Learning on User Learning on User Behavior for Novel Behavior for Novel
Worm DetectionWorm Detection

Steve Martin, Anil Sewani, Blaine Nelson, Karl Chen, and
Anthony Joseph
{steve0, anil, nelsonb, quarl, adj}@cs.berkeley.edu
University of California at Berkeley

The Problem: Email Worms
(source: http://www.sophos.com)
• Email worms cause billions of dollars of damage yearly.– Nearly all of the most virulent worms of 2004 spread
by email:

Current Solutions• Signature-based methods are effective against
known worms only.– 25 new Windows viruses a day released during
2004!
• Human element slows reaction times.– Signature generation can take hours to days.– Signature acquisition and application can take hours
to never.
• Signature methods are mired in an arms race.– MyDoom.m and Netsky.b got through EECS mail
scanners
Statistical Approaches• Unsupervised learning on network behavior.
– Leverage behavioral invariant: a worm seeks to propagate itself over a network.
• Previous work: novelty detection by itself is not enough.– Many false negatives = worm attack will succeed.– Many false positives = irritated network admins.
• Common solution: make the novelty detector model very sensitive.– Tradeoff: Introduces additional false positives.– Can render a detection system useless.
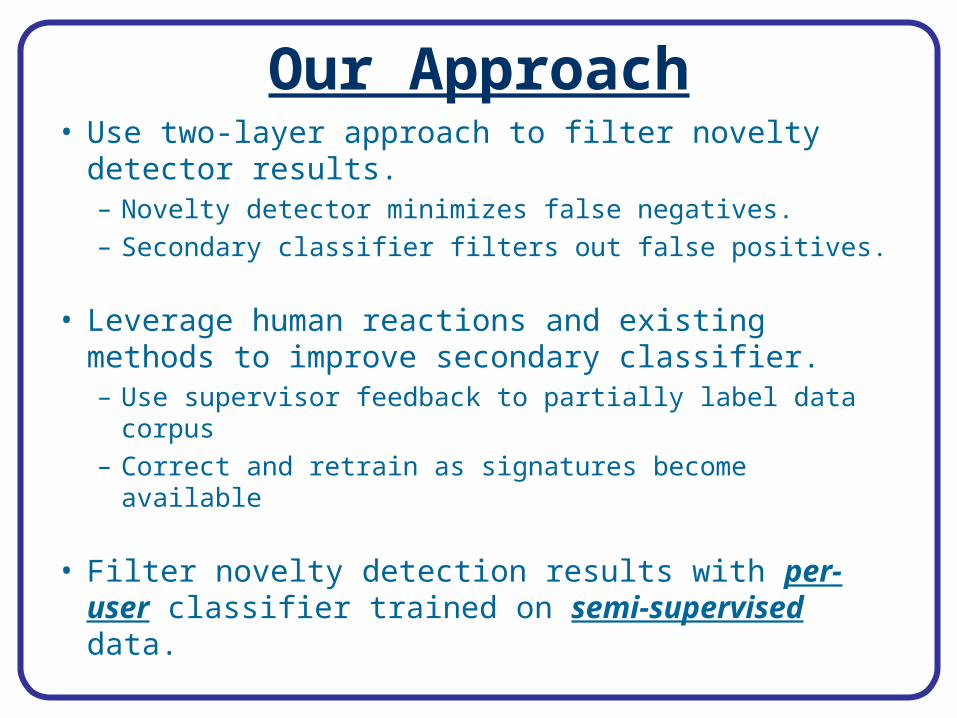
Our Approach• Use two-layer approach to filter novelty detector
results.– Novelty detector minimizes false negatives.– Secondary classifier filters out false positives.
• Leverage human reactions and existing methods to improve secondary classifier.– Use supervisor feedback to partially label data corpus– Correct and retrain as signatures become available
• Filter novelty detection results with per-user classifier trained on semi-supervised data.
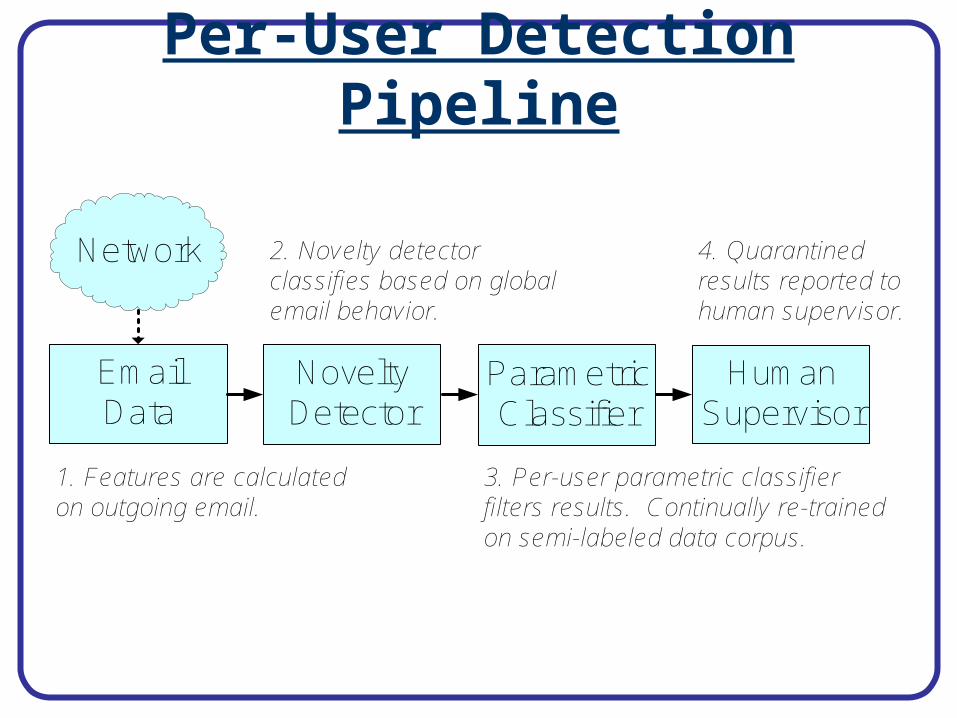
Per-User Detection Pipeline
EmailData
Human Supervisor
Novelty Detector
Parametric Classifier
Network
1. Features are calculated on outgoing email.
2. Novelty detector classifies based on global email behavior.
3. Per-user parametric classifier filters results. Continually re-trained on semi-labeled data corpus.
4. Quarantined results reported to human supervisor.
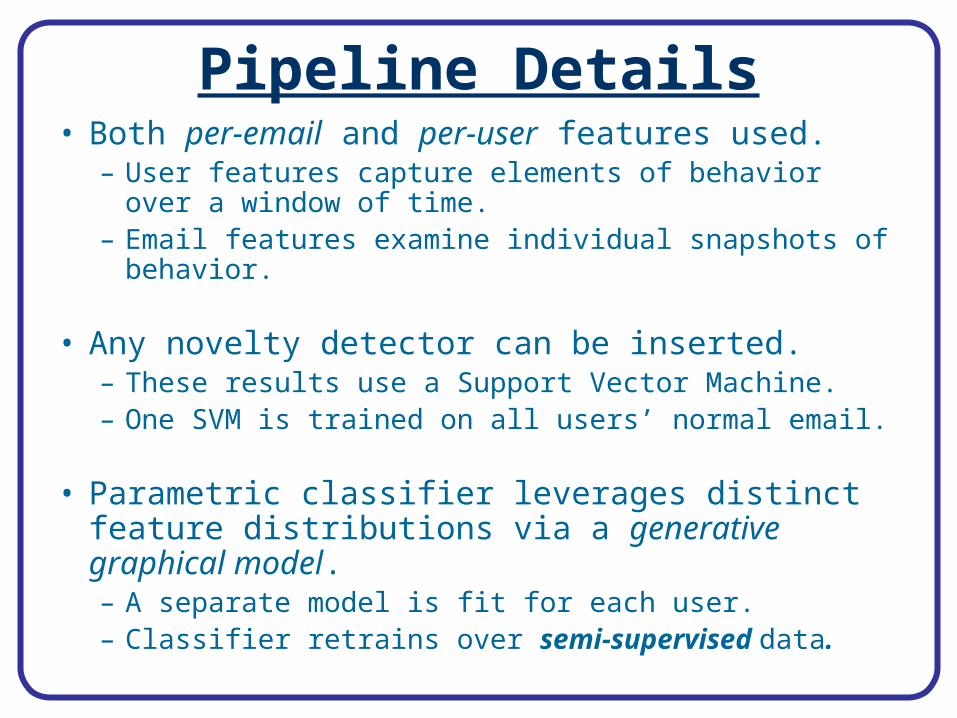
Pipeline Details• Both per-email and per-user features used.
– User features capture elements of behavior over a window of time.
– Email features examine individual snapshots of behavior.
• Any novelty detector can be inserted.– These results use a Support Vector Machine.– One SVM is trained on all users’ normal email.
• Parametric classifier leverages distinct feature distributions via a generative graphical model.– A separate model is fit for each user.– Classifier retrains over semi-supervised data.
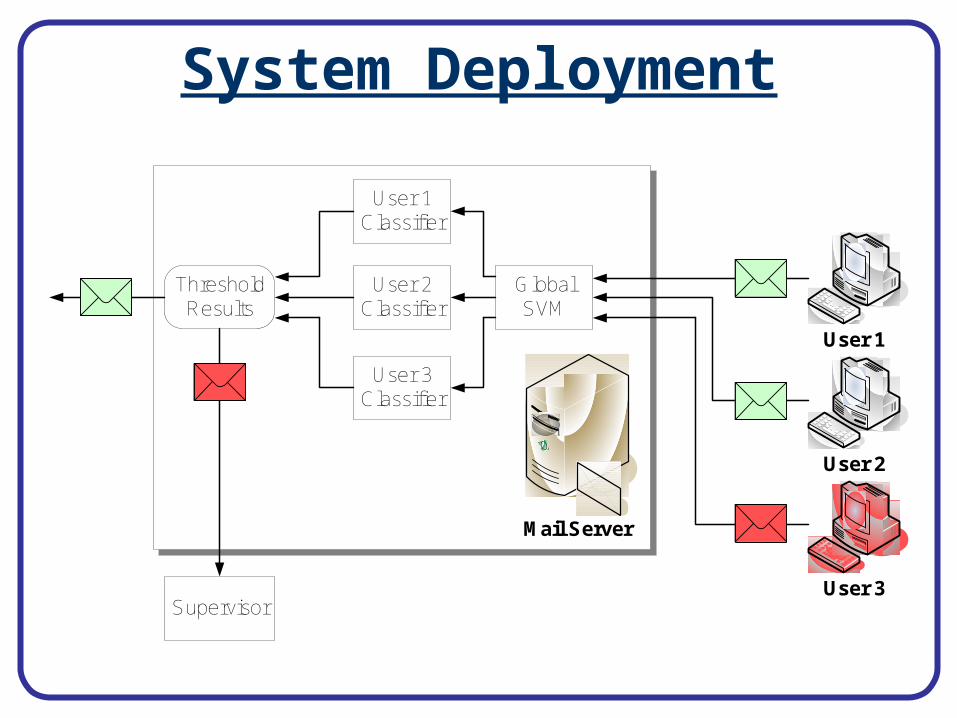
System Deployment
User 3
Mail Server
User 2
User 1
User 2Classifier
GlobalSVM
User 1Classifier
User 3Classifier
Supervisor
ThresholdResults
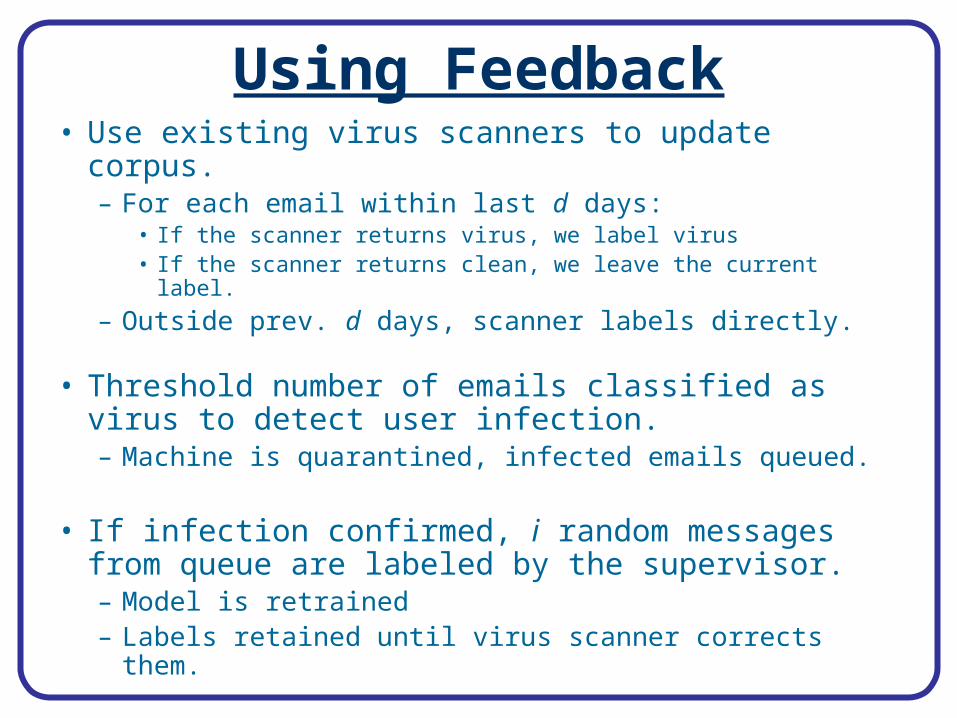
Using Feedback• Use existing virus scanners to update corpus.
– For each email within last d days:• If the scanner returns virus, we label virus• If the scanner returns clean, we leave the current label.
– Outside prev. d days, scanner labels directly.
• Threshold number of emails classified as virus to detect user infection.– Machine is quarantined, infected emails queued.
• If infection confirmed, i random messages from queue are labeled by the supervisor.– Model is retrained – Labels retained until virus scanner corrects them.
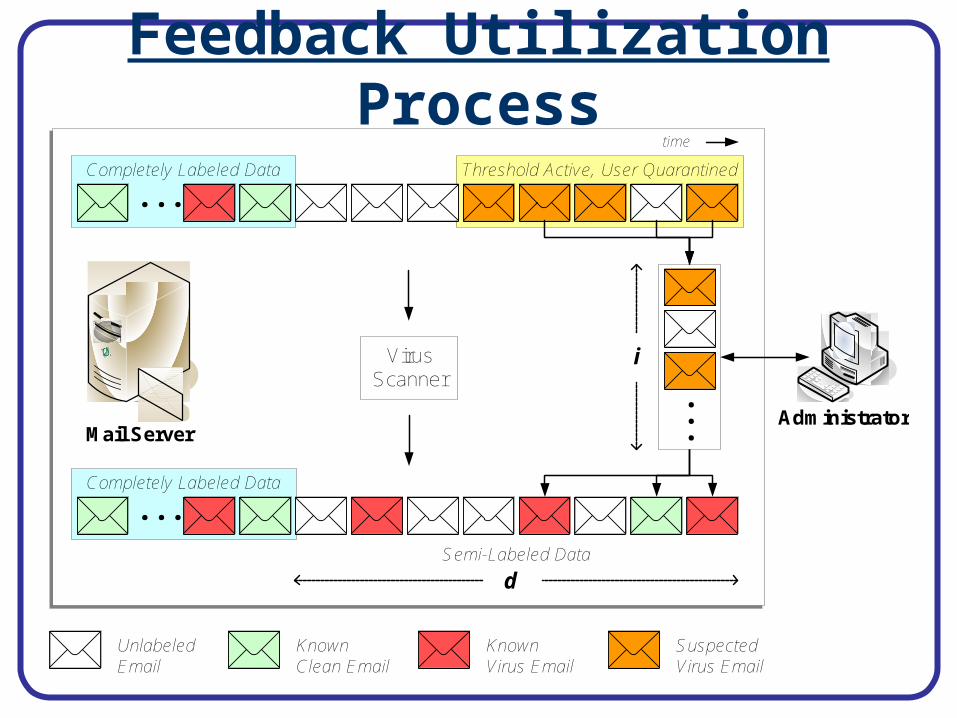
Feedback Utilization Process
Completely Labeled Data
Completely Labeled Data Threshold Active, User Quarantined
. . .
d
Administrator
. . .Semi-Labeled Data
Mail Server
time
VirusScanner . . .
i
Unlabeled Email
Known Clean Email
Known Virus Email
Suspected Virus Email
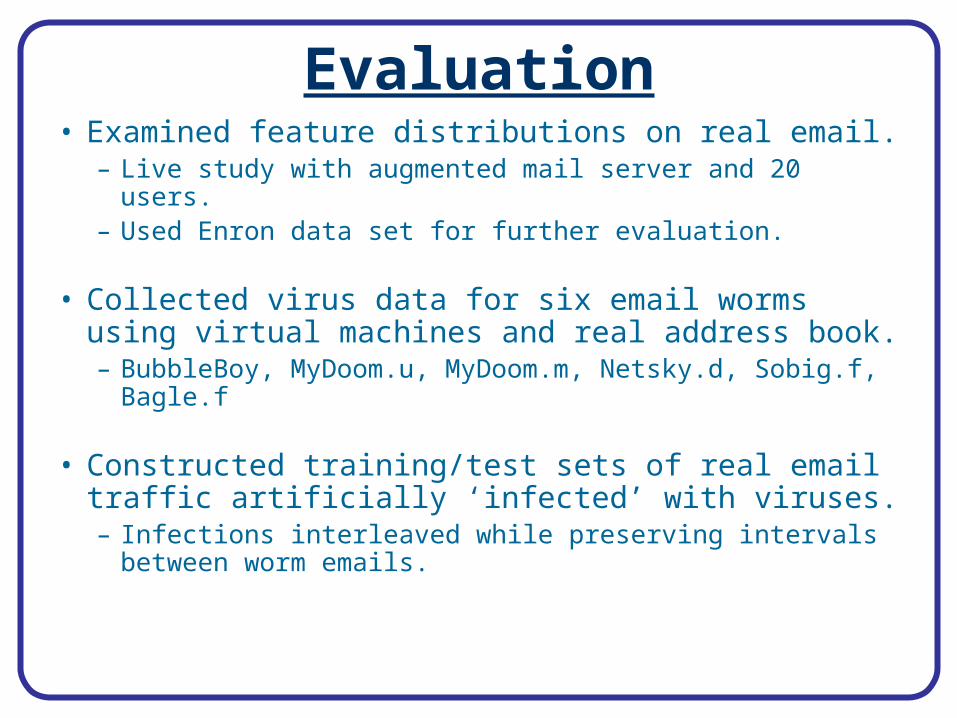
Evaluation• Examined feature distributions on real email.
– Live study with augmented mail server and 20 users.– Used Enron data set for further evaluation.
• Collected virus data for six email worms using virtual machines and real address book.– BubbleBoy, MyDoom.u, MyDoom.m, Netsky.d,
Sobig.f, Bagle.f
• Constructed training/test sets of real email traffic artificially ‘infected’ with viruses. – Infections interleaved while preserving intervals
between worm emails.
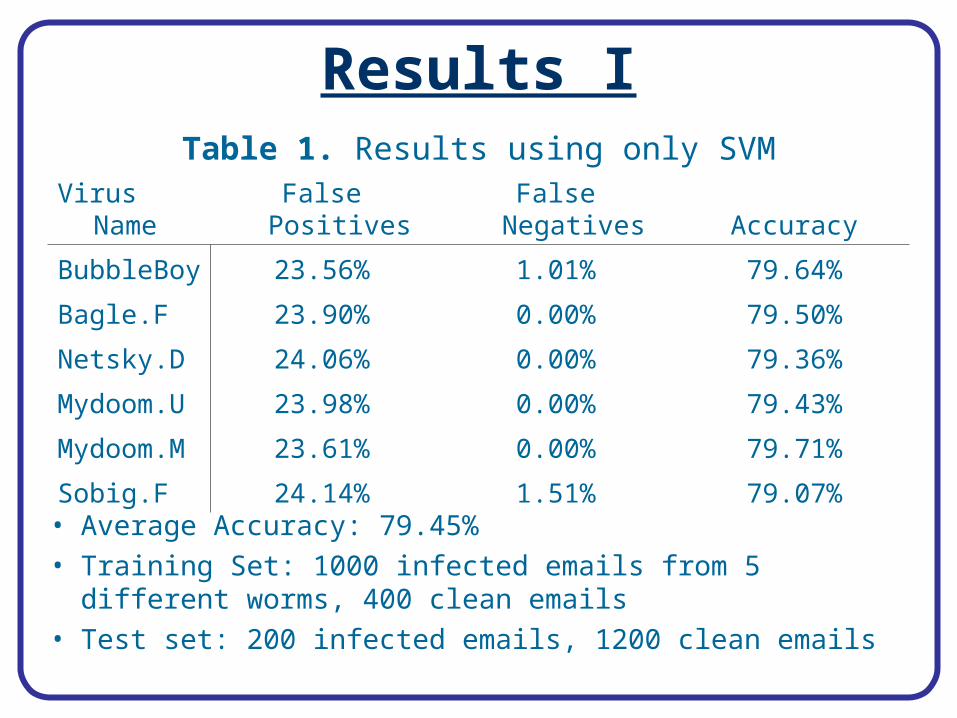
Results I
• Average Accuracy: 79.45%• Training Set: 1000 infected emails from 5 different
worms, 400 clean emails• Test set: 200 infected emails, 1200 clean emails
Table 1. Results using only SVM
Virus Name False Positives False Negatives Accuracy
BubbleBoy 23.56% 1.01% 79.64%
Bagle.F 23.90% 0.00% 79.50%
Netsky.D 24.06% 0.00% 79.36%
Mydoom.U 23.98% 0.00% 79.43%
Mydoom.M 23.61% 0.00% 79.71%
Sobig.F 24.14% 1.51% 79.07%
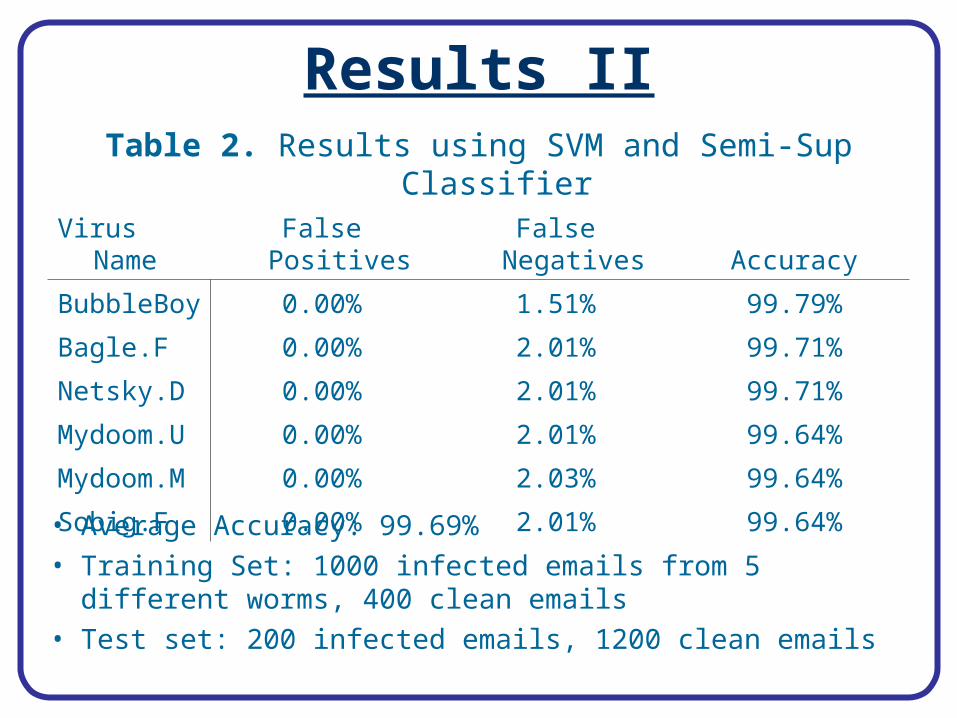
Results II
• Average Accuracy: 99.69%• Training Set: 1000 infected emails from 5 different worms,
400 clean emails• Test set: 200 infected emails, 1200 clean emails
Table 2. Results using SVM and Semi-Sup Classifier
Virus Name False Positives False Negatives Accuracy
BubbleBoy 0.00% 1.51% 99.79%
Bagle.F 0.00% 2.01% 99.71%
Netsky.D 0.00% 2.01% 99.71%
Mydoom.U 0.00% 2.01% 99.64%
Mydoom.M 0.00% 2.03% 99.64%
Sobig.F 0.00% 2.01% 99.64%
Recommended